Article

An Optimization Model for Waste Load Allocation under Water Carrying Capacity Improvement Management, A Case Study of the Yitong River, Northeast China

MOE Key Laboratory of Regional Energy Systems Optimization, North China Electric Power University, Beijing 102206, China
*
Author to whom correspondence should be addressed.
Water 2017, 9(8), 573; https://doi.org/10.3390/w9080573
Submission received: 27 June 2017 / Revised: 27 July 2017 / Accepted: 27 July 2017 / Published: 1 August 2017
(This article belongs to the Special Issue Modeling of Water Systems)

Abstract

:
In this study, a two-stage stochastic programming (TSP) model was developed for supporting regional waste load(chemical oxygen demand (COD) and NH3-N) allocation in four main pollution departments (industry, municipal, livestock breeding, and agriculture), constrained by the water carrying capacity, which can be improved by ecological restoration engineering, in the nine function zones of the Yitong River. A number of scenarios corresponding to different stream flow levels were examined. The results revealed that the carrying capacity of COD and NH3-N has a similar tendency with a positive correlation to stream flow levels. The allocation amount of each pollutant for the four departments was obtained differently in each zone, and ecological restoration engineering solutions were obtained for different zones to improve the carrying capacity of the pollutants in order to meet the permitted emission allocation and water qualities. The results are helpful in establishing a rational discharge permit system of each pollution unit under water quality targets, and provide a basis for production plans of these pollution units.

1. Introduction

Water bodies (e.g., rivers and lakes), as significant carriers, not only supply various water resources, but also provide the corresponding environmental carrying capacity for supporting human survival and development [1,2,3]. However, with rapid population growth and economic development, more wastewater is generated and discharged into water bodies, which leads to environmental quality deterioration of water bodies and function loss, especially in China. For example, as documents show, in 2016, 15.6% of the river monitoring sections attained a grade V national quality standard or worse, and the majority of rivers and lakes could not meet the water quality targets, causing water security problems with respect to watersheds, agriculture, fisheries, industries, and eco-development [4,5,6,7]. This indicated that pollutant emissions not only generate a significant number of environmental problems, but they also reduce water environmental capacity and affect environmental safety, which hinders regional sustainable development. Therefore, it is desirable to create an effective measure for controlling pollutant emissions and improve water environmental quality in order to balance the conflict between regional socioeconomic development and environment protection.
Previously, in order to improve water environmental quality, the main studies were focused in two directions: (i) controlling the total pollutant emission amount related to water carrying capacity [8,9,10]; and (ii) studies of technologies for water quality improvement according to ecological restoration engineering, such as wetlands, ecological floating beds, and artificial aeration [11,12,13]. In general, these two aspects were scarcely combined as an integrated water environmental management system, and led to many complexities, such as the tradeoff between treatment technology optimization, waste load allocation, and system cost in water quality management.
Faced with those complexities, a number of optimization techniques were developed for water economic-environmentally sustainable development management [14,15,16,17,18,19,20,21,22,23]. Among the above approaches, two-stage stochastic programming (TSP) is an effective method for addressing problems where an analysis of policy scenarios is desired periodically over time, where uncertain parameters are expressed as probability distribution functions, and are widely applied to many water quality management problems. For example, Fan [24] developed an inexact two-stage stochastic partial programming method for tackling uncertainties presented as intervals and partial probability distributions; Li [25] proposed an inexact two-stage stochastic credibility-constrained programming method and applied it to the water quality management system. Xie [26] developed an inexact two-stage stochastic downside risk-aversion programming model for supporting regional water resource allocation and water quality management problems under uncertainties. From the above analysis TSP is common and effective, suitable for water quality management, corresponding to a greater focus on water resource allocation, and few studies have focused on developing an optimization model for integrated engineering technologies and waste load allocation management by employing the TSP approach.
Therefore, as an extension of the previous studies, the objective of this study is to develop a TSP programming model for integrated engineering technologies and waste load allocation management in the Yitong River basin. The modeling results could help allocate total pollutant amounts to different pollution departments, and generate cost-effective ecological restoration engineering schemes, which are valuable for supporting local decision-makers in generating regional water pollution control schemes that conform to the idea of economic-environmentally sustainable development.

2. Case Description

The Yitong River is located in Jilin province, China, and originates from Yitong County, flowing through Changchun City, Dehui City, and Nongan County. It covers a total length of 342.5 km, and an area of more than 9600 km2. The river is an important water source of Changchun City, and the annual runoff is usually from 3.5 × 10⁸ to 6 × 10⁸ m3 [27].
However, as the main water body for receiving pollutant discharge from municipal and agricultural sectors, the Yitong River suffers growing environment problems, such as serious water pollution and ecological function loss, and the main pollutants are chemical oxygen demand (COD) and ammonia nitrogen (NH3-N). In order to specify the various function and protection targets for water environmental management, the Yitong River was divided into nine function zones. Table 1 shows the detailed description of the functions’ division and the corresponding quality targets. Zones 1–5 are marked as the upstream, 6 and 7 as the midstream, and 8 and 9 are labeled as the downstream areas. Figure 1 shows the geographical position and details of function zones of the Yitong River. From the view of pollutant emission, the amounts of COD discharged into the river were 1838 tons upstream, 742 tons midstream, and 9070 tons downstream in 2014, in which the emission amounts from non-point sources were 1347, 740, and 3590 tons in the upstream, midstream, and downstream, respectively; for NH3-N, the total discharge amounts in the upstream, midstream, and downstream were 263, 95, and 984 tons, and the emission amounts from non-point sources were 57, 19, and 109 tons in the upstream, midstream, and downstream, respectively, which were far beyond the carrying capacity. In recent years, measures, such as control of the total emission amount, wastewater treatment improvement, and sewage interception have been implemented.
However, water quality has not been significantly improved in the Yitong River. The main reasons include the following: (1) due to economic development requirements, the available total emission amount still exceeds the carrying capacity, and the amount could not be fairly and effectively allocated to each polluter in different water zones; (2) the implemented measures could reduce pollutants discharged into the river. Nevertheless, these do little for improving the contaminated status. In the Yitong River basin, engineering projects, such as wetlands, ecological floating beds, and artificial aeration technology, have been found to effectively reduce pollutants in the river and improve the carrying capacity through ecological restoration, all of which affect water quality significantly, but are never taken into account with the total amount control.
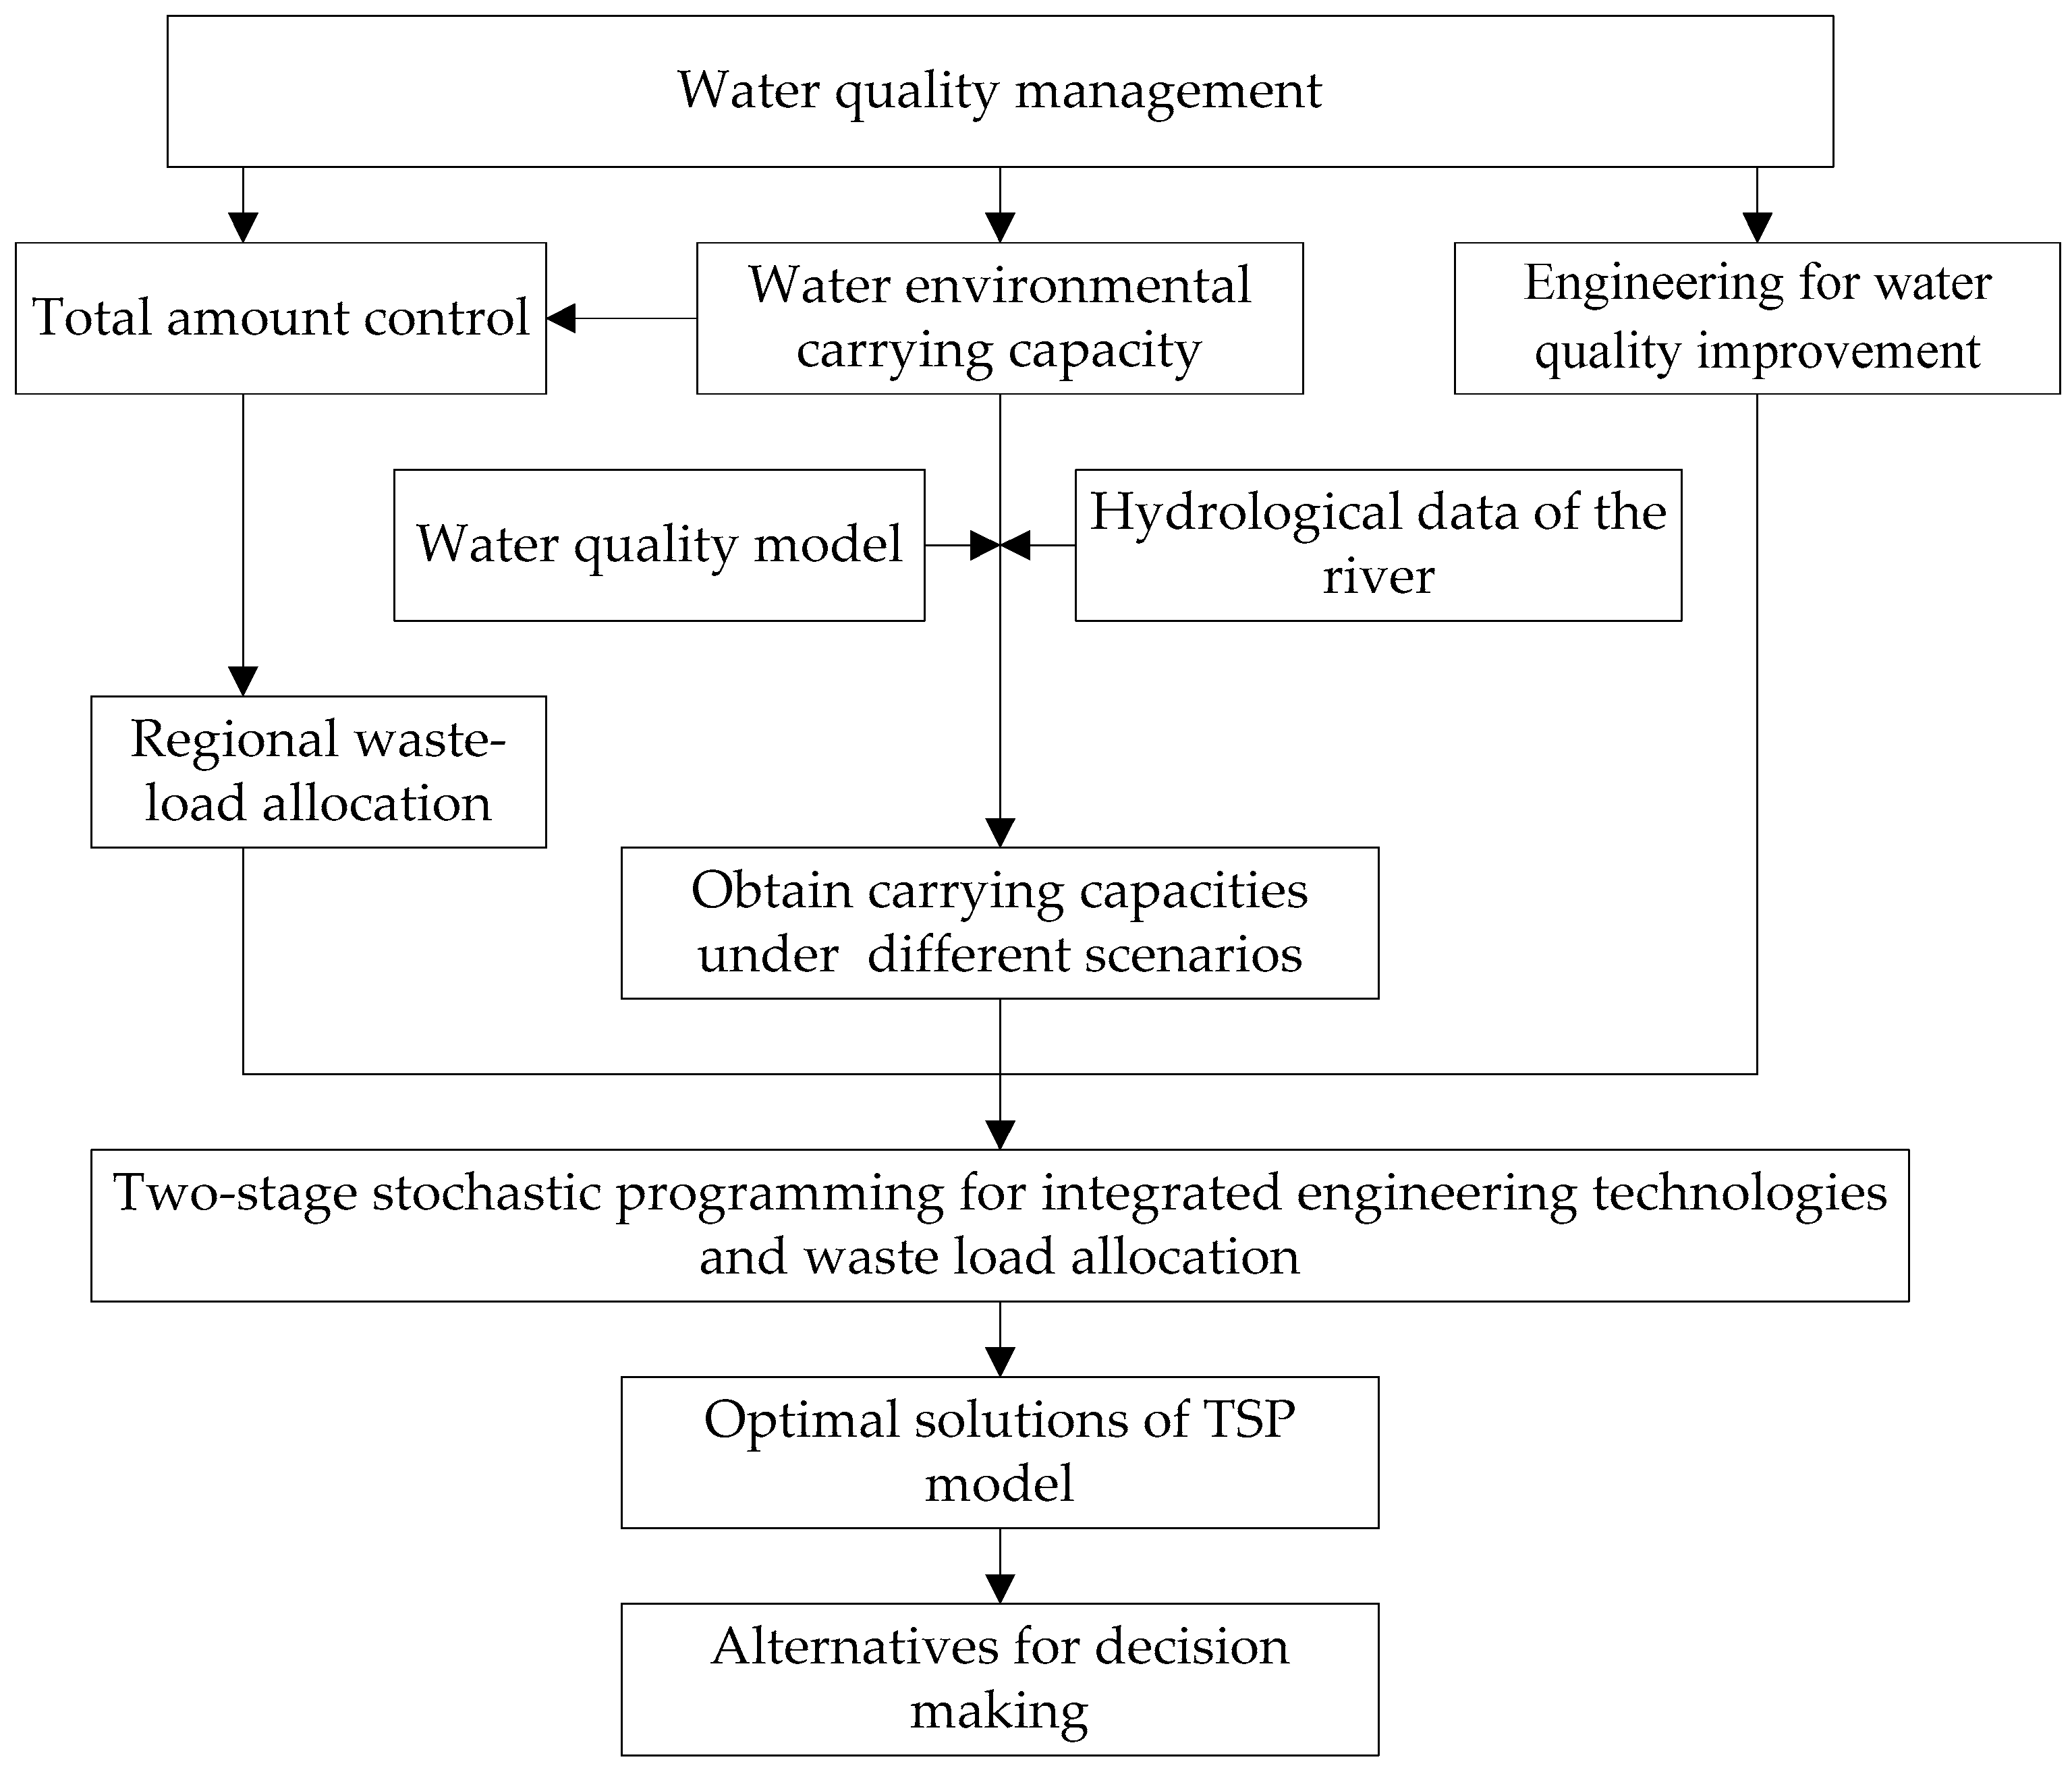
Therefore, this study attempts to formulate an optimization model in order to deal with these questions: (1) how do were flect the carrying capacity improvements together in the total amount controlled in the Yitong River basin; and (2) how do we allocate the total amount to various polluters under the improved carrying capacity of the water function zones. Figure 2 presents the general framework of the TSP model for integrated engineering technologies and waste load allocation management in the Yitong River basin.

3. Model Formulation

In this study, we consider a one-year programming horizon, with three periods: the wet season (June, July, August, and September), the normal season (October, November, April, and May), and the dry season (December, January, February, and March), with three different flow levels (low, medium, and high). The carrying capacity changes in each season, and the engineering improvements have different applicability in different water function zones, and cause a necessary adjustment of the initial allocation of pollutants. The proposed TSP method is considered suitable for such a problem, and the two-stage stochastic programming model for integrated engineering technologies and waste load allocation management in the Yitong River can be formulated as follows:
max f = i = 1 9 j = 1 3 r = 1 2 t = 1 3 N B j r W i j r t i = 1 9 j = 1 3 r = 1 2 t = 1 3 h = 1 3 p t h C D j r Q i j r t h i = 1 9 l = 1 7 E C i l E Q i l Y i l
subject to:
(1)
Constraints of water carrying capacity:
j = 1 4 l r j ( W i j r t Q i j r t h ) M i r t h + l = 1 7 ( E E i l r t E Q i l Y i l ) , r , t , h
(2)
Constraints for pollutant concentrations:
C 1 r = j = 1 3 l r j ( W 1 j r t Q 1 j r t h ) exp ( k x 1 v 1 ) Q R 1 t h + Q D 1 t C S 1 r , r , t , h
C 2 r = i = 1 2 { j = 1 3 l r j ( W i j r t Q i j r t h ) exp ( i 2 k x i v i ) } Q R 2 t h + Q D 2 t C S 2 r , r , t , h
C 3 r = i = 1 3 { j = 1 3 l r j ( W i j r t Q i j r t h ) exp ( i 3 k x i v i ) } Q R 3 t h + Q D 3 t C S 3 r , r , t , h
C 4 r = i = 1 4 { j = 1 3 l r j ( W i j r t Q i j r t h ) exp ( i 4 k x i v i ) } Q R 4 t h + Q D 4 t C S 4 r , r , t , h
C 5 r = i = 1 5 { j = 1 3 l r j ( W i j r t Q i j r t h ) exp ( i 5 k x i v i ) } Q R 5 t h + Q D 5 t C S 5 r , r , t , h
C 6 r = i = 1 6 { j = 1 3 l r j ( W i j r t Q i j r t h ) exp ( i 6 k x i v i ) } Q R 6 t h + Q D 6 t C S 6 r , r , t , h
C 7 r = i = 1 7 { j = 1 3 l r j ( W i j r t Q i j r t h ) exp ( i 7 k x i v i ) } Q R 7 t h + Q D 7 t C S 7 r , r , t , h
C 8 r = i = 1 8 { j = 1 3 l r j ( W i j r t Q i j r t h ) exp ( i 8 k x i v i ) } Q R 8 t h + Q D 8 t C S 8 r , r , t , h
C 9 r = i = 1 9 { j = 1 3 l r j ( W i j r t Q i j r t h ) exp ( i 9 k x i v i ) } Q R 9 t h + Q D 9 t C S 9 r , r , t , h
(3)
Constraints for water resource projects:
E Q i l M S i l Y i l
Y i l = { 0 ,   o t h e r w i s e 1 ,   i f   t e c h n o l o g y   l   i s   u n d e r t a k e n   i n   z o n e   i ; i , l
(4)
Constraints for regional industry development:
N B j 1 W i j 1 t = N B j 2 W i j 2 t , i , j , t ;
W N i j ( W i j r t Q i j r t h ) W max , r , t
(5)
River ecological development requirements:
i 9 E Q i l Y i l P E Q l ;   l = 1 , 2 , 3 , 4 , 5
(6)
Technology constraints:
W i j r t , Q i j r t h , E Q i l 0 , i , j , r , t , h , l
where f is the total expected system benefit over the planning year (RMB); h denotes various runoff levels in every period (h = 1, 2, 3 for low, medium, and high levels, respectively); i is the water function zone, j denotes the production departments (j = 1 for industry, j = 2 for municipal industry, j = 3 for livestock breeding, and j = 4 for agriculture, respectively); l is the engineering for carrying capacity improvement (Engineering 1–7 are wetland, ecological floating bed, conservation forest, pre-tank construction, ecological corridor, artificial aeration, and dredging engineering, respectively); r is the water pollutant (r = 1 for COD, r = 2 for NH3-N); t denotes different periods in the planning horizon (t = 1 for the wet season, t = 2 for the normal season and t = 3 for the dry season). The detailed nomenclatures for the variables and parameters of are described as follows: C i r = section concentration of pollutant r in zone i (mg/L); C D j r = reduction of net benefit to department j per unit of pollutant r not delivered (104 RMB/kg); C S i r = standard concentration of pollutant r in zone i (mg/L); E C i l = cost of engineering l in zone i (104 RMB/unit); E E i l r t = improving amount of carrying capacity for pollutant r by engineering l in zone i during period t (tons); E Q i l = quantities of engineering l in zone i; k r = fall coefficient of pollutant r (d−1); l r j r = river load ratio of pollutant r from department j; M i r t h = carrying capacity of pollutant r in zone i during period t under scenario h; N B j r = emissions benefit of pollutant r from department j (104 RMB/kg); p t h = occurrence probability of scenario h in period t; Q i j r t h = allocation reduction of pollutant r for department j during period t in zone i under scenario h (tons); Q D i t = sewage flows in zone i during period t (m3/s); Q R i t h = runoff in zone i during period t under scenario h (m3/s); v i = flow velocity in zone i (m/s); W i j r t = pre-allocation of pollutant r for department j during period t in zone i (tons); x i = length of function zone i (km).
The objective is to maximize the total system benefit in the river basin, which includes the related benefit from various production departments under the planned permitted pollutant emission, the penalties when the permitted allocation is not delivered, and the cost of improvement engineering. The constraints are for the relationships between decision values and water quality requirements, including the regional total amount controlled, water carrying capacity, ecological engineering, and so on. Table 2 shows the stream flow levels of water zones in different periods, which were obtained from the latest 20 years of hydrological data of the river. The fall coefficients of each pollutant (COD and NH3-N) are 0.165 d−1 and 0.065 d−1, respectively.

4. Results Analysis and Discussion

4.1. Carrying Capacity Analysis

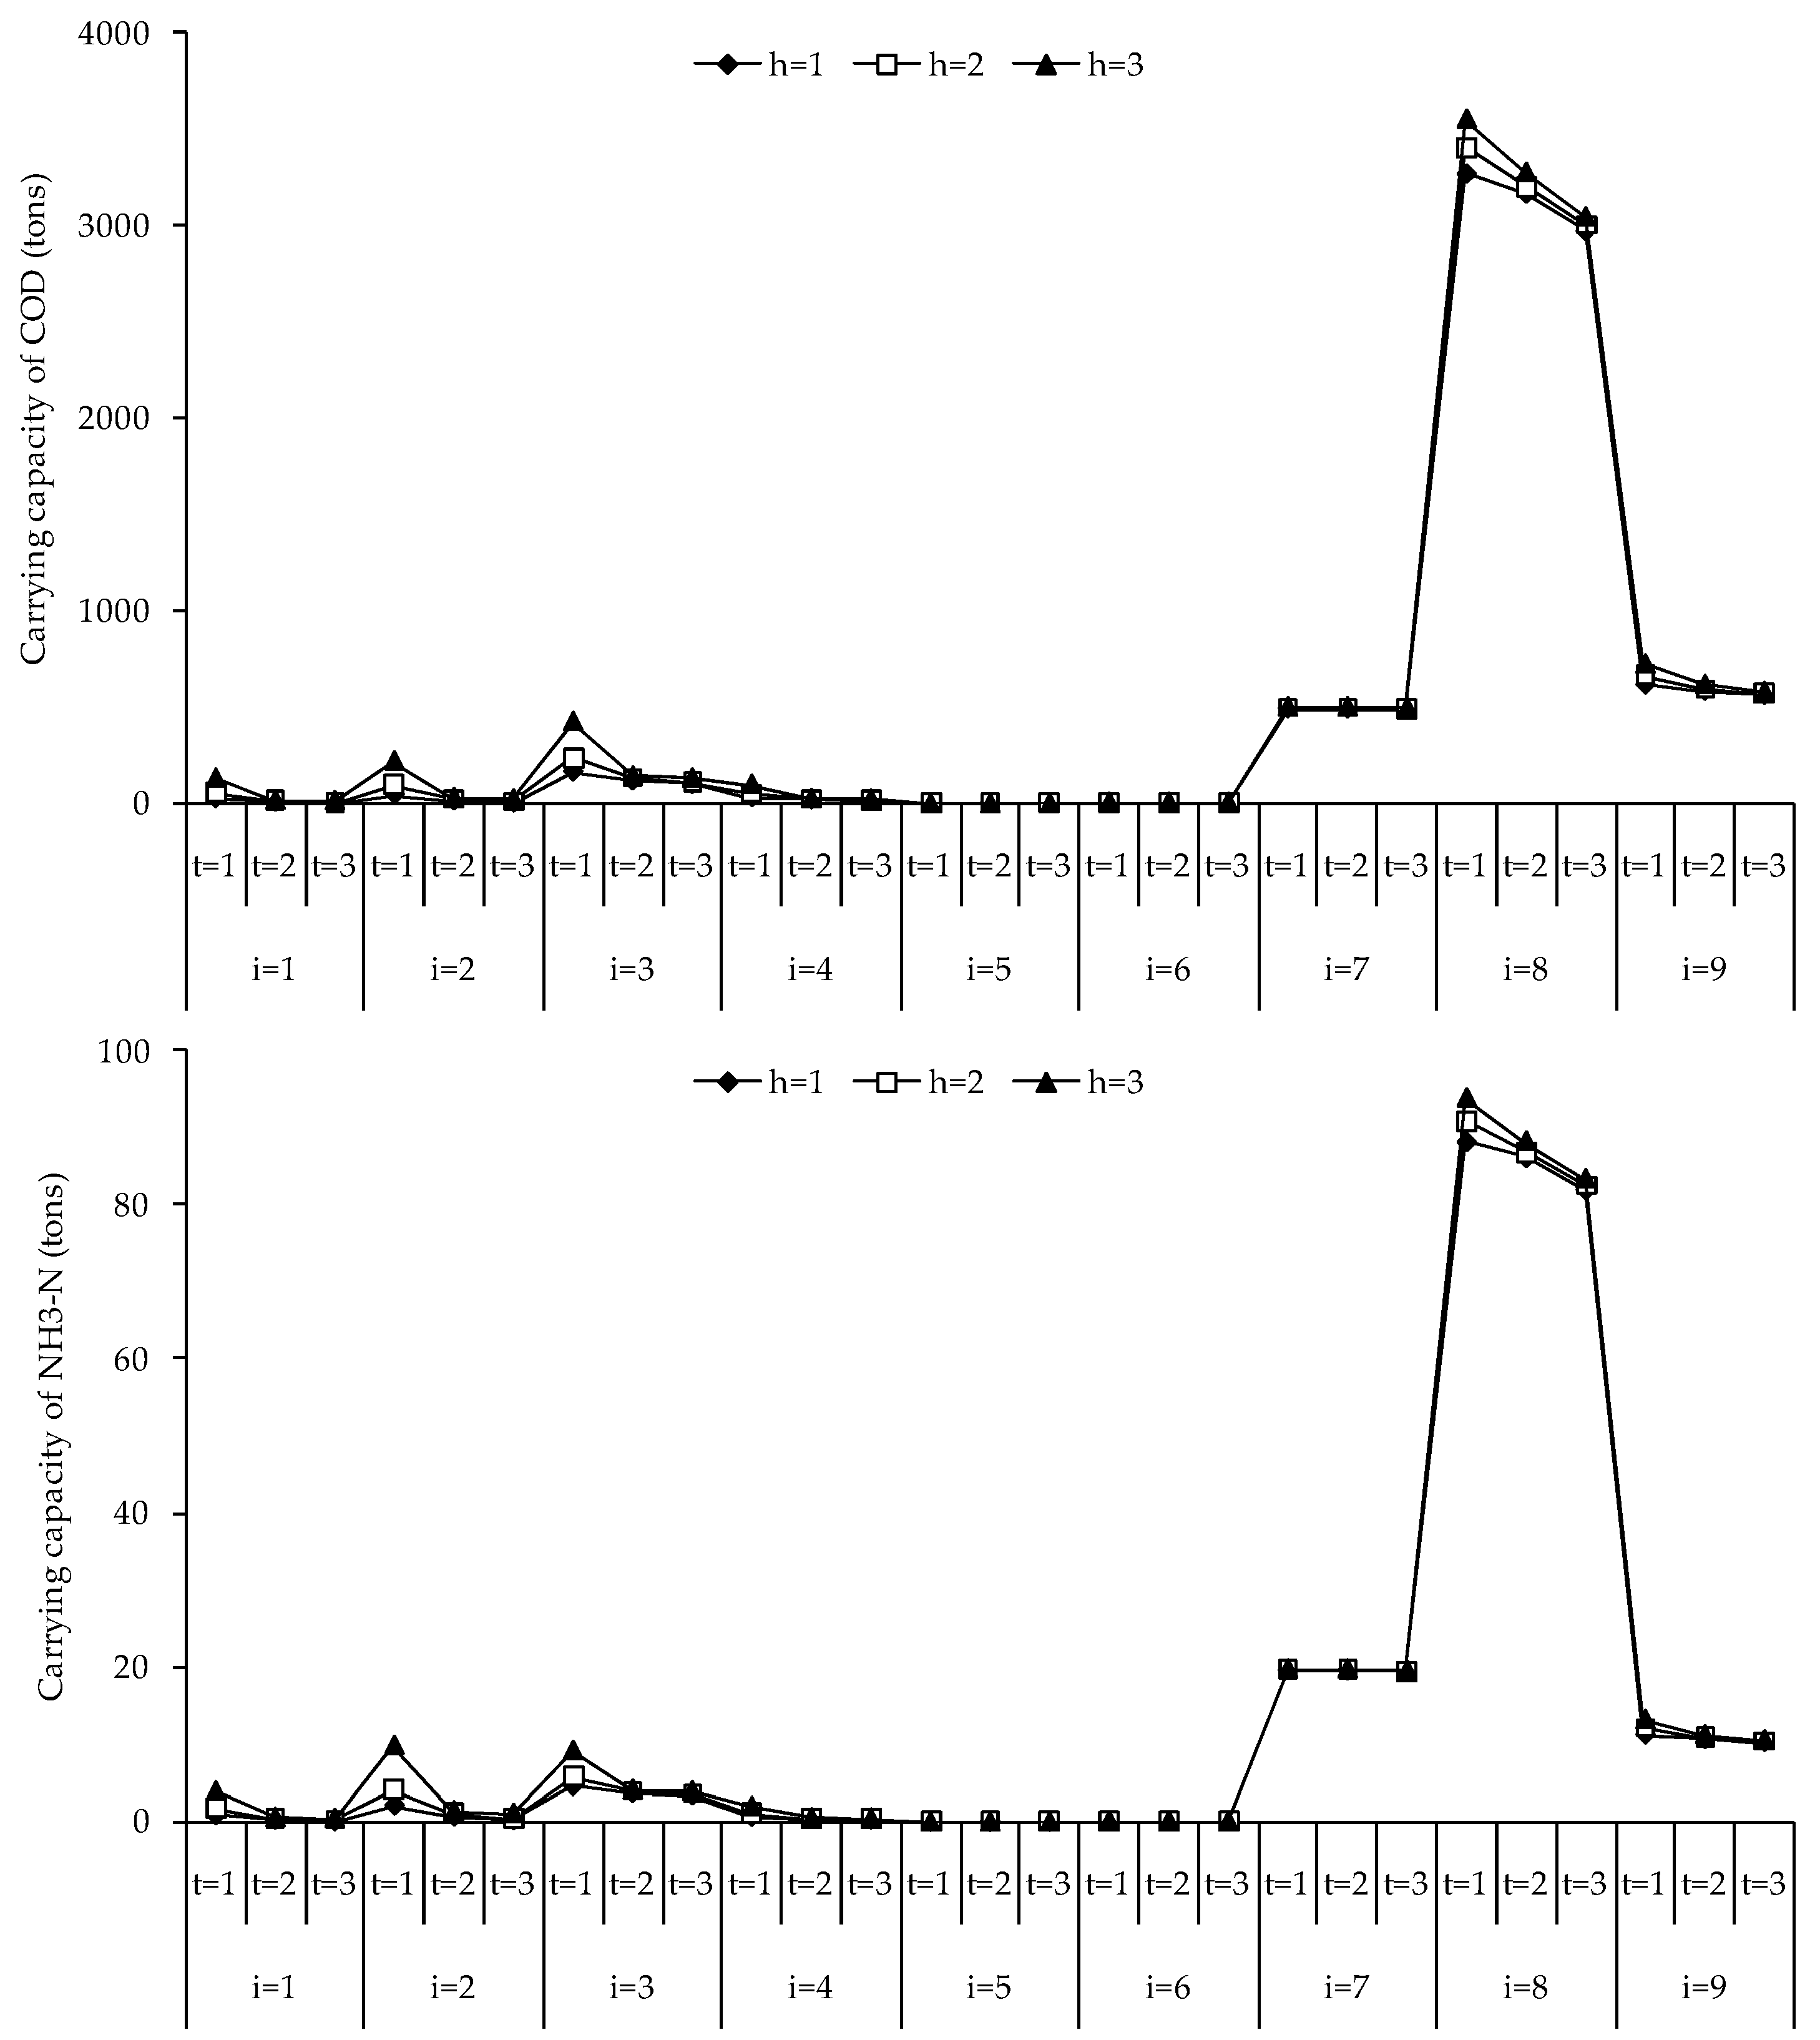
Figure 3 shows the carrying capacities of COD and NH3-N in the Yitong River. This indicates that the carrying capacity of each pollutant is obviously different in the nine function zones. For example, in the wet season under the high flow level, the available capacities for COD in the upstream increase gradually from Zone 1 to 3, with values of 132.76, 221.49, and 421.06 tons, respectively, whereas it suddenly decreases to 99.98 tons in Zone 4. The main reason is that, from Zone 1 to 2, COD capacity is mainly influenced by the river length with a positive correlation relationship; in Zone 3, it is affected by runoff, which is apparently increased by discharging municipal sewage; and in Zone 4, the shorter flowing distance leads to a lower capacity. In the midstream, there is nearly no natural runoff caused by the upper reservoir closure and lower retaining dam. Thus, the COD capacity in Zone 6 is only 6.92 tons, and the difference is that there is a larger amount supplemented from the water plant for the landscape system in Zone 7, and the capacity significantly increases to 502.20 tons. It is obvious that the COD carrying capacity is mainly concentrated in the downstream, accounting for more than 72% of the total available amount, especially in Zone 8; the amount is about 63% of the total capacity. The main reasons include high natural runoff, a lower quality target, and vast water drainage of tributaries and sewage plants in Zone 8. In addition, due to a higher quality target than the transition area, the capacity in Zone 9 decreases to 725.13 from 3549.38 tons. With a similar trend, the carrying capacities of NH3-N of the river are 3.98, 9.84, 9.22, 1.96, 0.01, 0.14, 19.76, 93.80, and 13.20 tons in Zone 1 to 9, respectively, in the wet season under the high flow level. The concentration standards from Zone 1 to 2 increase from 0.5 to 1.0 mg/L, and that leads to an obvious increase of carrying capacity in Zone 2.
In different periods, the carrying capacities of the pollutants decrease gradually from Period 1 to 3. For example, the total capacities of COD are 166.80, 119.48, and 102.07 tons, and the available NH3-Namounts are 4.60, 3.76, and 3.43 tons in Zone 3 from Period 1 to 3, respectively. Moreover, as the inflow level increases, the pollutant capacity increases. For example, in Zone 3 during Period 1, the total capacities of COD are 166.80, 237.78, and 427.06 tons, under low, medium, and high levels, respectively. The available NH3-Namounts are 4.60, 5.86, and 9.22 tons under low, medium, and high levels, respectively. However, due to significantly more drainage water than the runoff in Zone 7, the COD capacities are 493.85, 493.85, and 489.80 tons from Period 1 to 3, under the low level, respectively; and in Period 1, the amounts are 493.85, 496.63, and 502.20 tons, under low, medium, and high levels, respectively, showing slight changes with different periods and flow levels. These demonstrate that the stream flow is of great significance for pollutant carrying capacity.

4.2. Pollutant Allocation

Table 3 shows the pre-allocation of pollutants for different departments during the planning period, which were derived from the regional pollution census in 2015 and the emission reduction requirement from the latest development plan. This reveals that sustainable development for the long-run should be on the basis of water environmental carrying capacity. For example, in Period 1, the pre-allocated emissions of COD into the river are 26.11, 783.42, 1522.30, 1149.90, 0, 960.57, 467.09, 5633.33, and 3468.13 tons in Zones 1 to 9, respectively. For different pollution departments, obviously in Zone 5 there are no pollutant emissions allowed due to its significant function as a municipal drinking water reservoir. In Zone 1, as the springhead of the river, with only a few villages, there were no pollutants discharged from industry and the municipality. Pollutants from industry and the municipality were mainly allocated in Zones 3, 7, 8, and 9, in which areas there were municipal sewage drains. The main reason is that in the Yitong River basin, industrial wastewater is not allowed to be discharged directly into the river, and after pretreatments it should be discharged into the municipal sewage plant for further treatment.
In addition, pollutant allocation amounts are decreased gradually from Period 1 to 3.For example, in Zone 3, the COD allocations to industry are 187.23, 163.82, and 117.02 tons from Period 1 to 3, respectively, and NH3-N amounts are 22.39, 19.59, and 13.99 tons; for the municipality, the COD amounts are 683.10, 609.25, and 553.86 tons, and NH3-N amounts are 77.78, 69.37, and 63.06 tons. For livestock breeding, the COD amounts are146.34, 130.08, and 0.00 tons, and NH3-N amounts are 5.05, 4.49, and 0.00 tons, whereas, due to the fact that agricultural irrigation and fertilization mainly appears in Period 2, the COD allocations to agriculture are505.63 tons, 632.04 tons, and 0.00 tons, and NH3-N amounts are 18.50, 23.12, and 0.00 tons, showing the maximum pollutant allocation in Period 2.
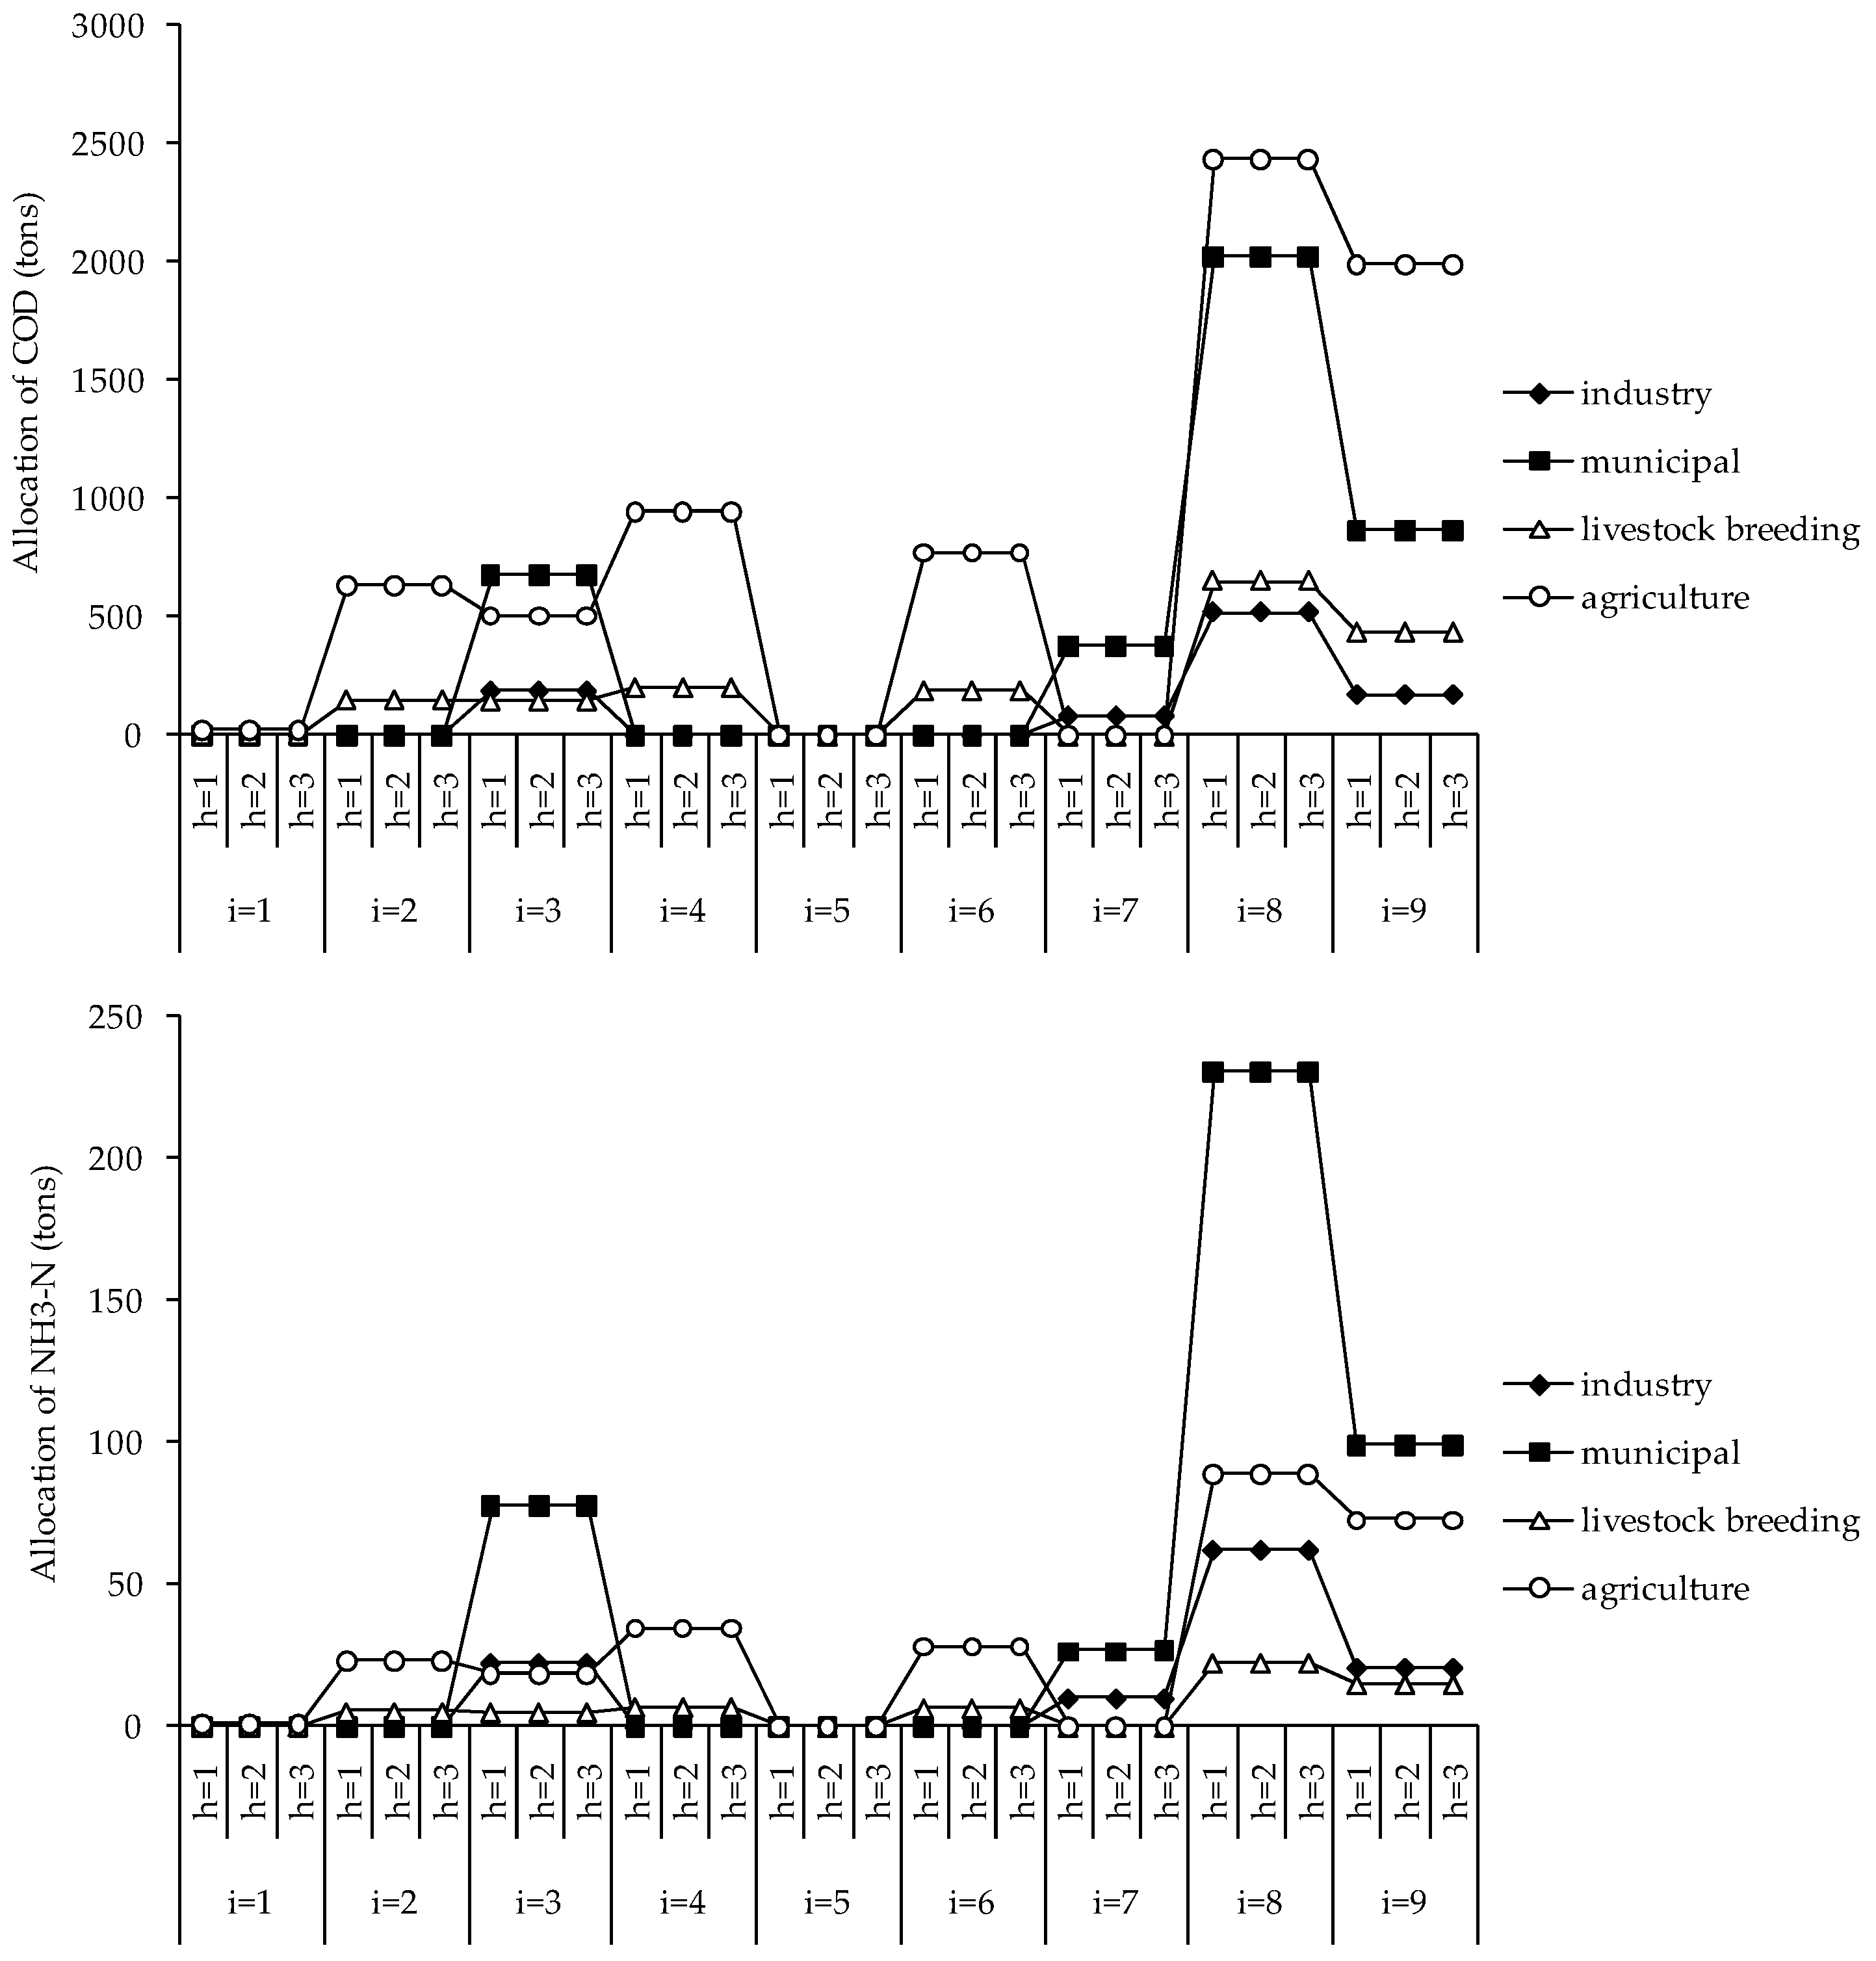
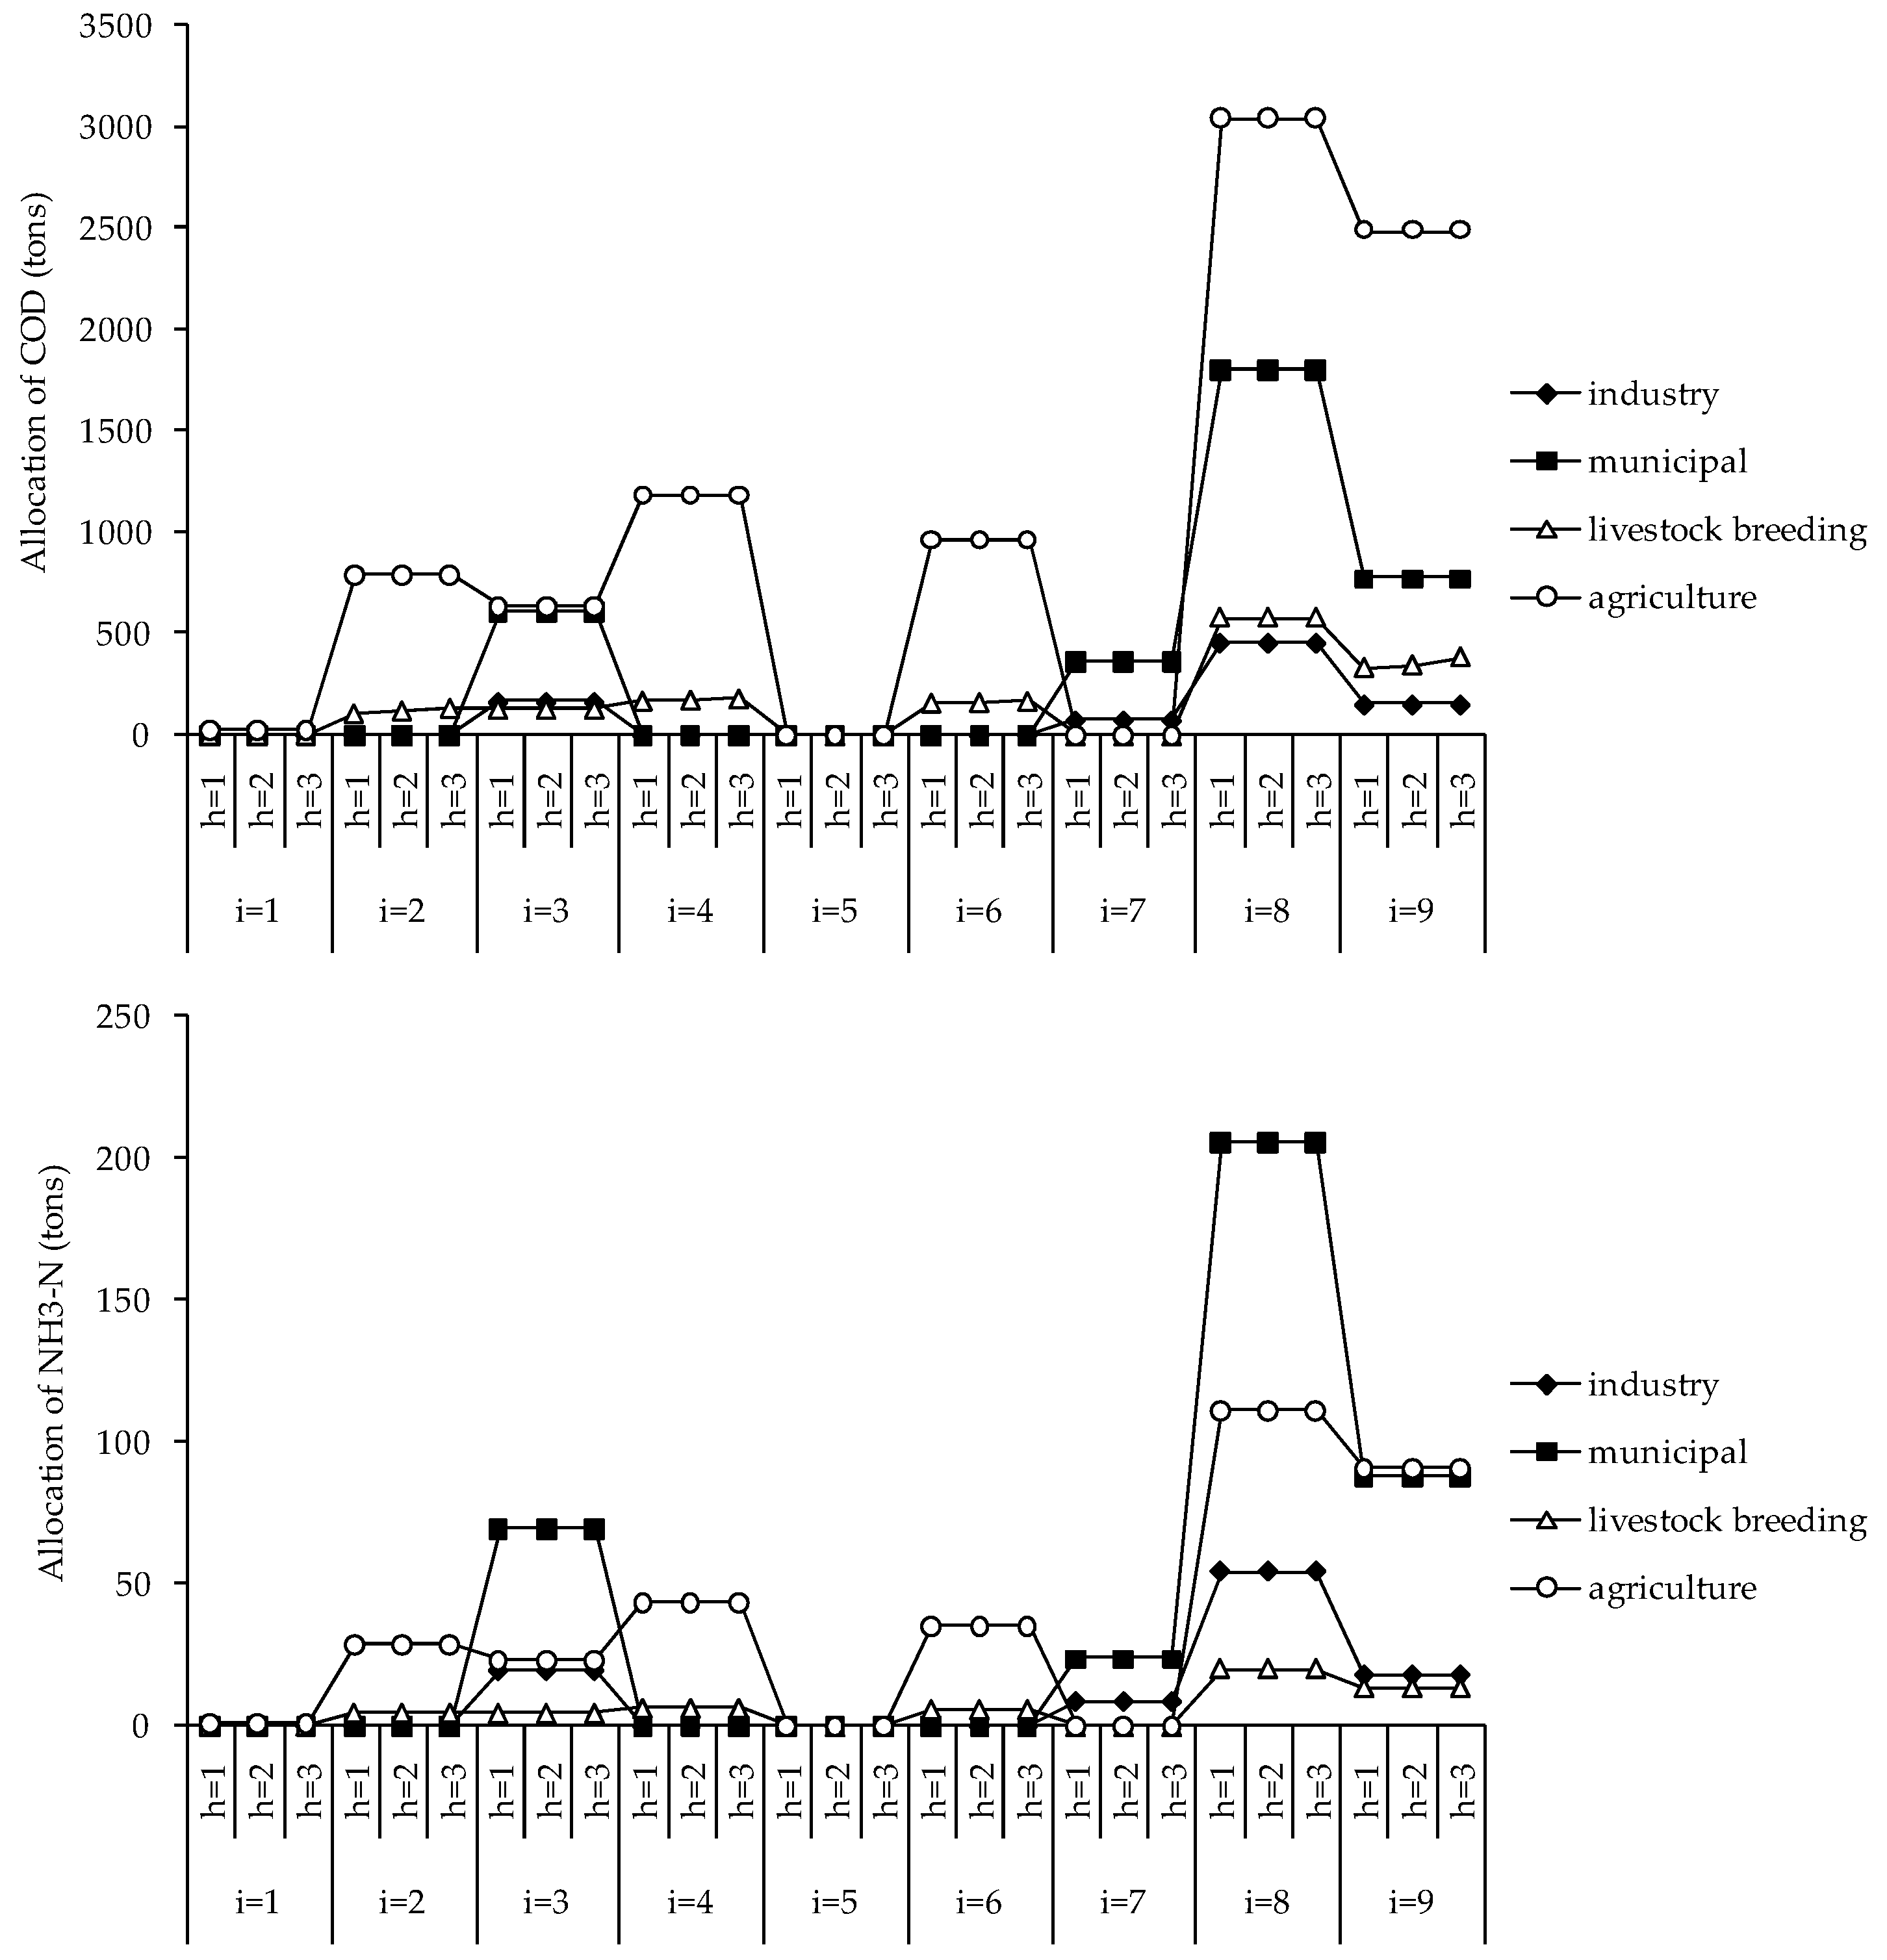
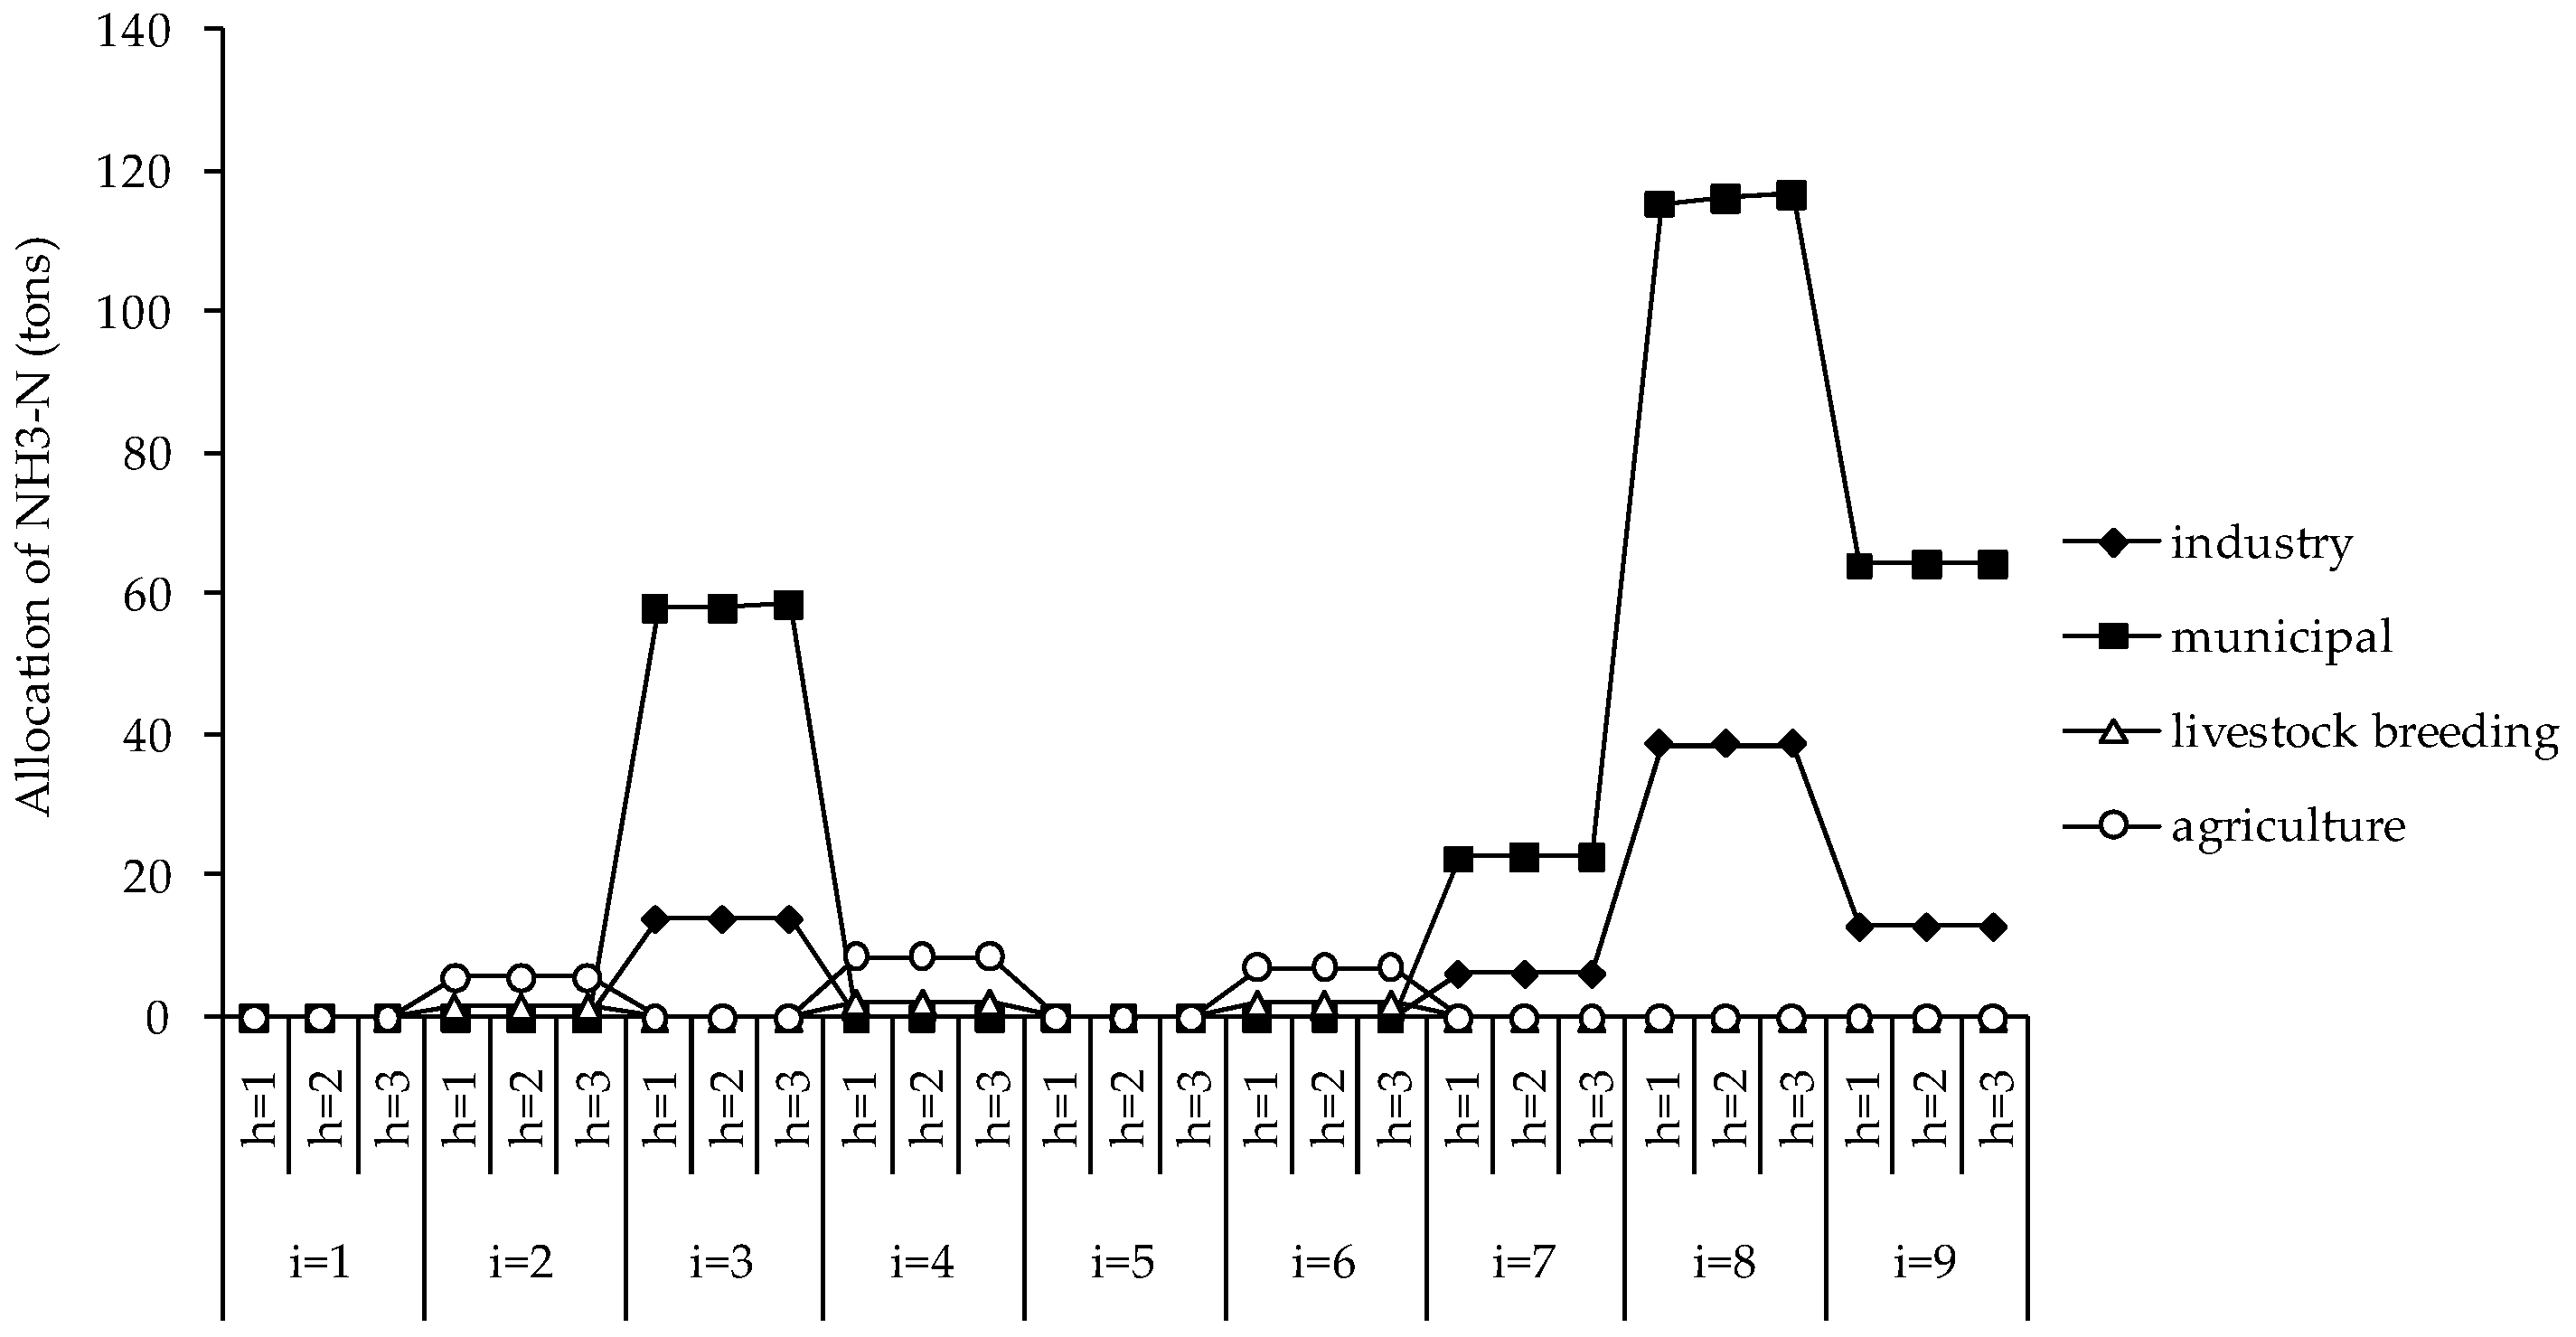
Figure 4, Figure 5 and Figure 6 show the two-stage allocation amounts of COD and NH3-N in different periods. These indicate that contributions of pollution departments for the two pollutants in each function zone are different. For example, in Zone 8, the contribution order for COD is agriculture, municipal, livestock breeding, and industry, whereas, for NH3-N, it is municipal, agriculture, industry, and livestock breeding, and due to different regional industrial structures, in Zone 3, the orders are municipal, agriculture, industry, and livestock breeding for COD, and municipal, industry, agriculture, and livestock breeding for NH3-N.
Additionally, these figures show a two-stage reduction compared to the pre-allocations. Reductions mainly appear in periods with low stream flow or under the lower flow level, and the reduction amounts increase as the flow levels decline. For example, in Period 1, only in Zone 7 are there reductions of NH3-N for the municipal department, with amounts of 17.01, 16.96, and 16.85 tons under low, medium, and high levels, respectively; in Period 2, reductions appear in more areas, such as in Zones 7 and 9. In Zone 7, the amounts are18.39, 18.34, and18.23 tons of NH3-N for the municipal department under low, medium, and high levels, and in Zone 9, the amounts are 52.46, 39.61, and 10.34 tons of COD for livestock breeding under low, medium, and high levels. In Period 3, reductions appear in more zones and pollution departments, such as in Zone 3, the reductions are 170.46, 161.07, and 139.95 tons of COD, and 5.05, 4.89, and 4.51 tons of NH3-N for the municipal department under low, medium, and high levels, respectively. In Zone 8, there are reductions of 71.91, 71.22, and 70.53 tons of NH3-N for the municipal department under different levels, and for livestock breeding and agriculture, the amounts are 7.49 and 22.26 tons, respectively. The main reason is that lower stream flows may mean there is not sufficient carrying capacity for discharged pollutants, and pre-allocation amounts also affect the two-stage reductions. For example, because pre-allocations of COD from livestock breeding in Period 3 are much less than in Period 1 and 2, the reduction of COD mainly appears for livestock breeding in Period 2, under low and medium levels. For example, in Zones 2, 4, and 6, the amounts are 26.27 and 13.09 tons, 10.09, and 5.05 tons, and 8.15 and 5.27 tons, respectively. Moreover, improvement of the environmental carrying capacity is another significant factor influencing the pollution allocation.

4.3. Carrying Capacity Improvement

Table 4 shows the selections of ecological technology for improving the water environmental carrying capacity, in which the value “1” means the technology is undertaken, otherwise it is valued “0”. In Zone 1, since there is no conservancy construction admitted in the springhead protection area, and with few pollutant sources in this area, only conservation forest is selected for the purpose of water conservation; in Zone 2, wetlands are preferentially selected and sufficient for improving the carrying capacity; in Zone 3, as a severely contaminated river zone with a large amount of discharged industrial and municipal wastewater, more applicable technologies should be undertaken, such as wetlands, ecological floating beds, ecological corridors, and artificial aeration; in Zone 4, wetlands and dredging engineering are selected to meet the higher-quality target of the lower reservoir. As a drinking water source, water quality in Zone 5 is mainly influenced by upland water, conservation forests, and pre-tank construction is selected in Zone 5.
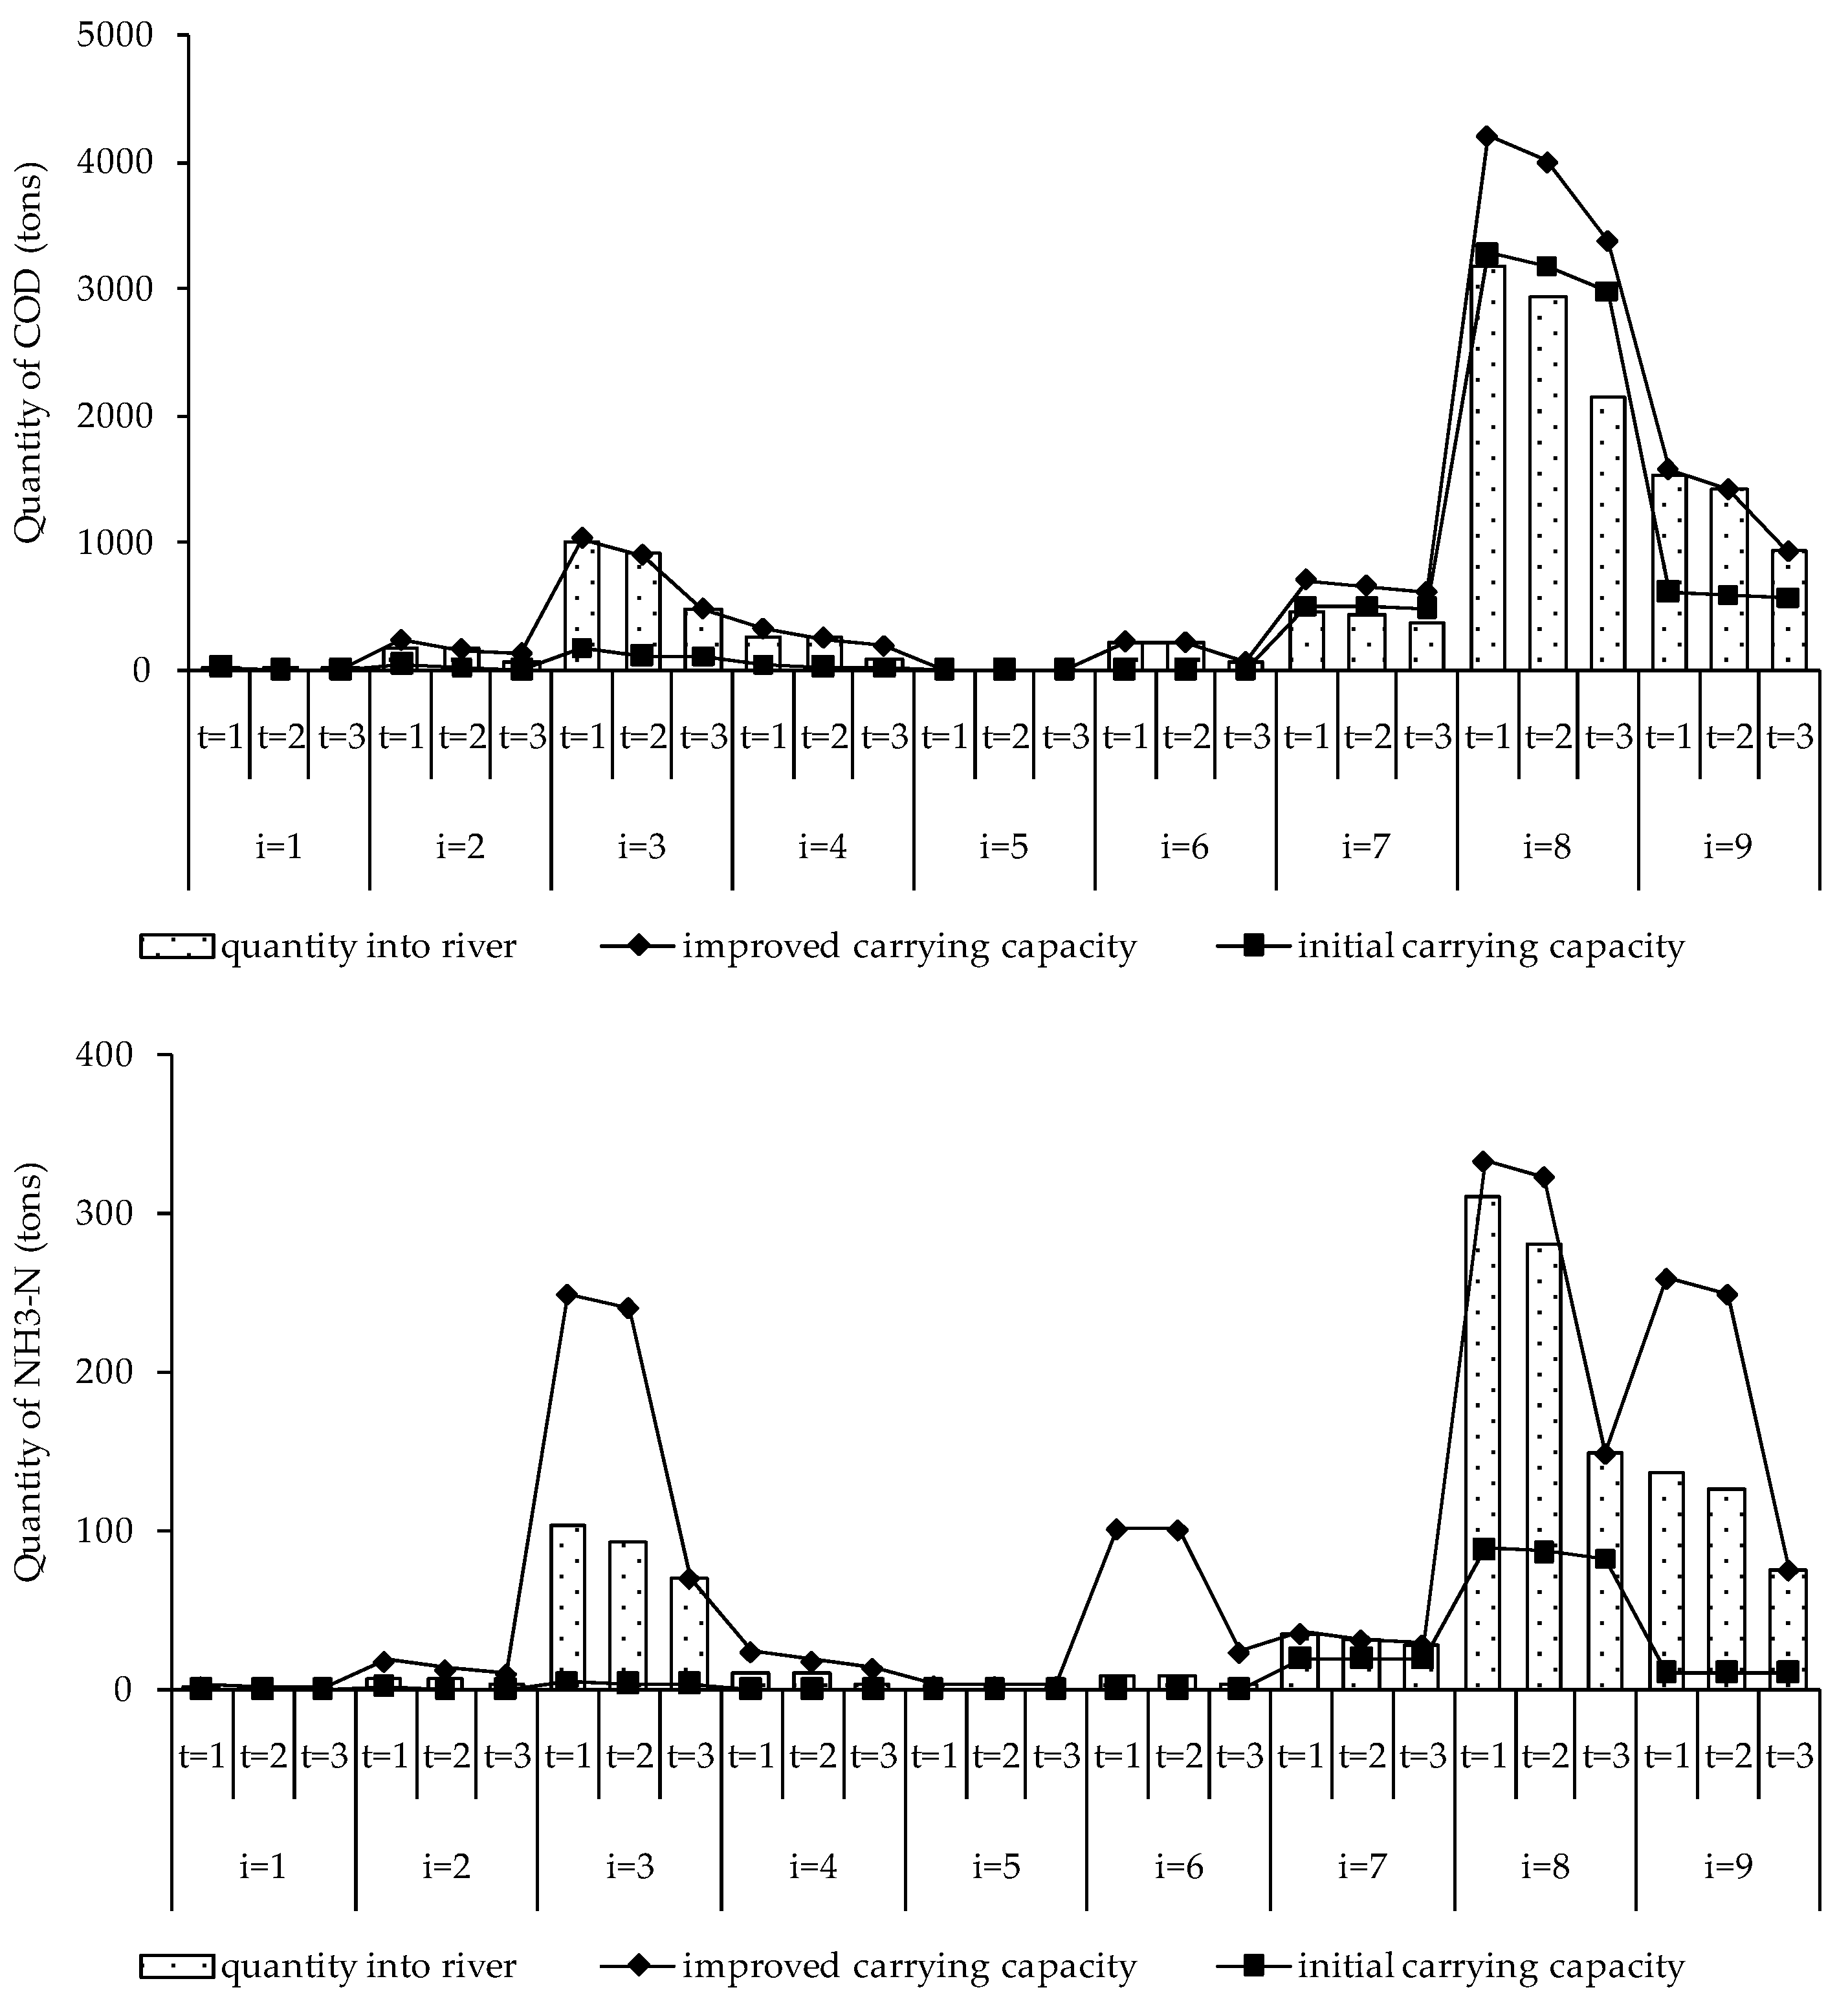
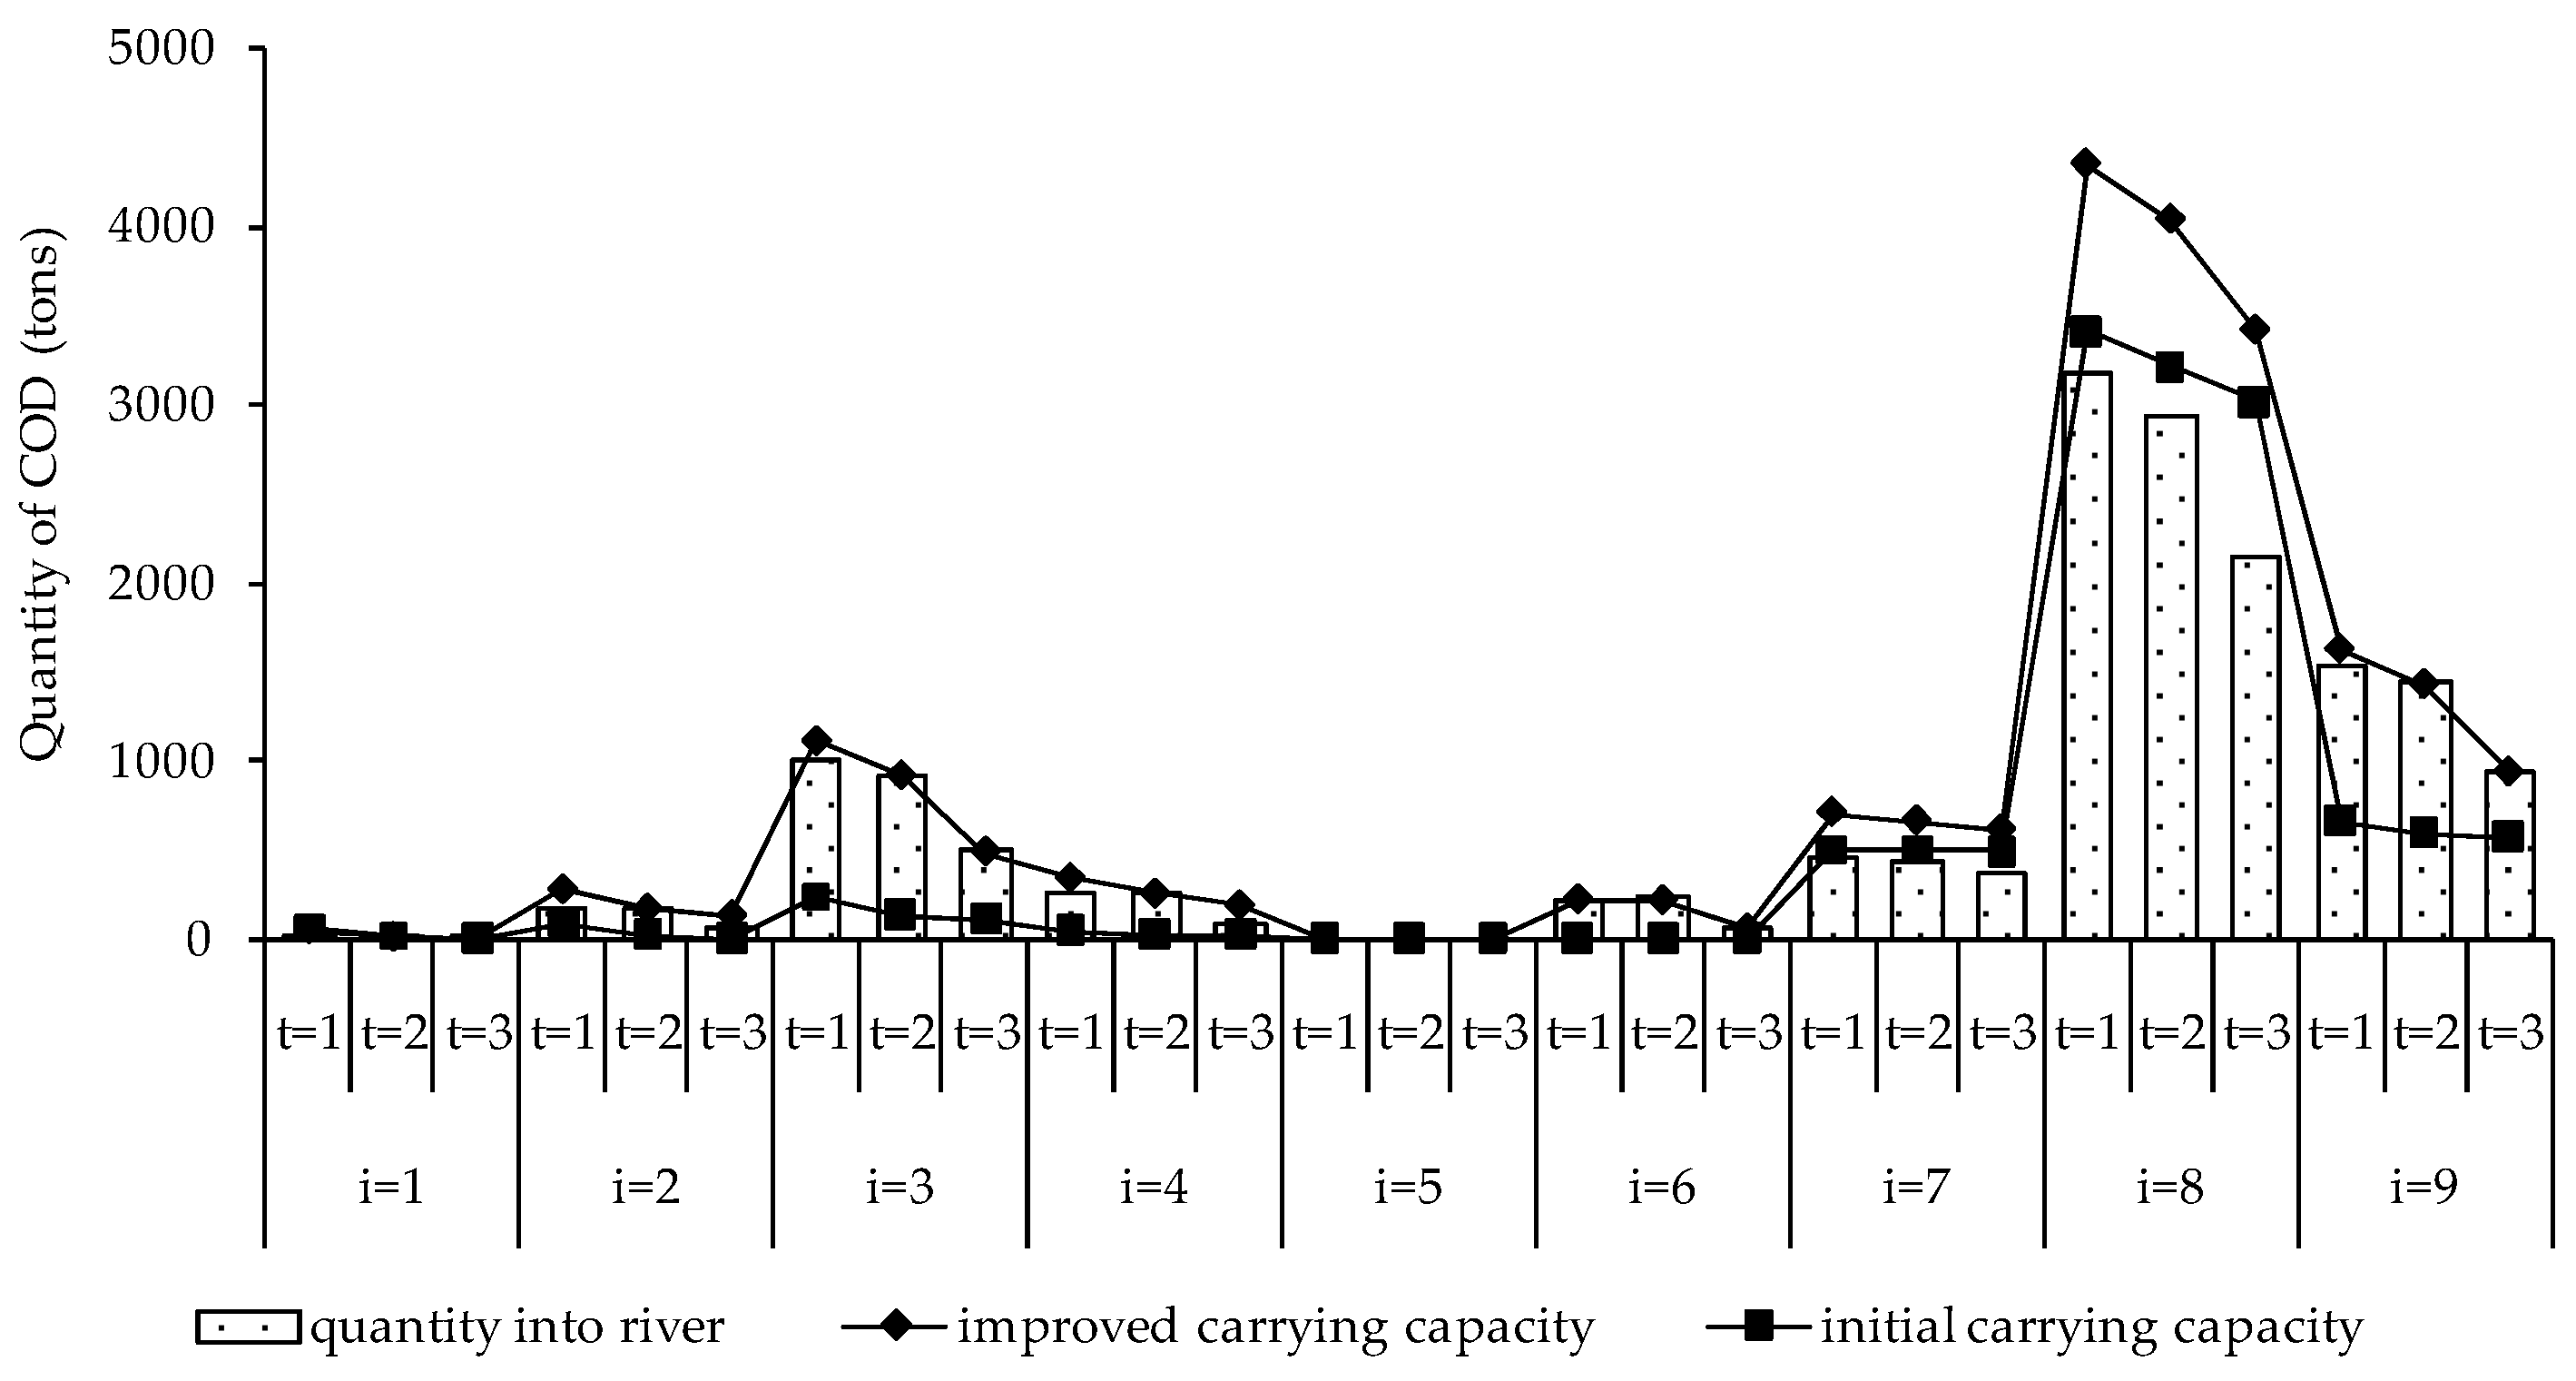
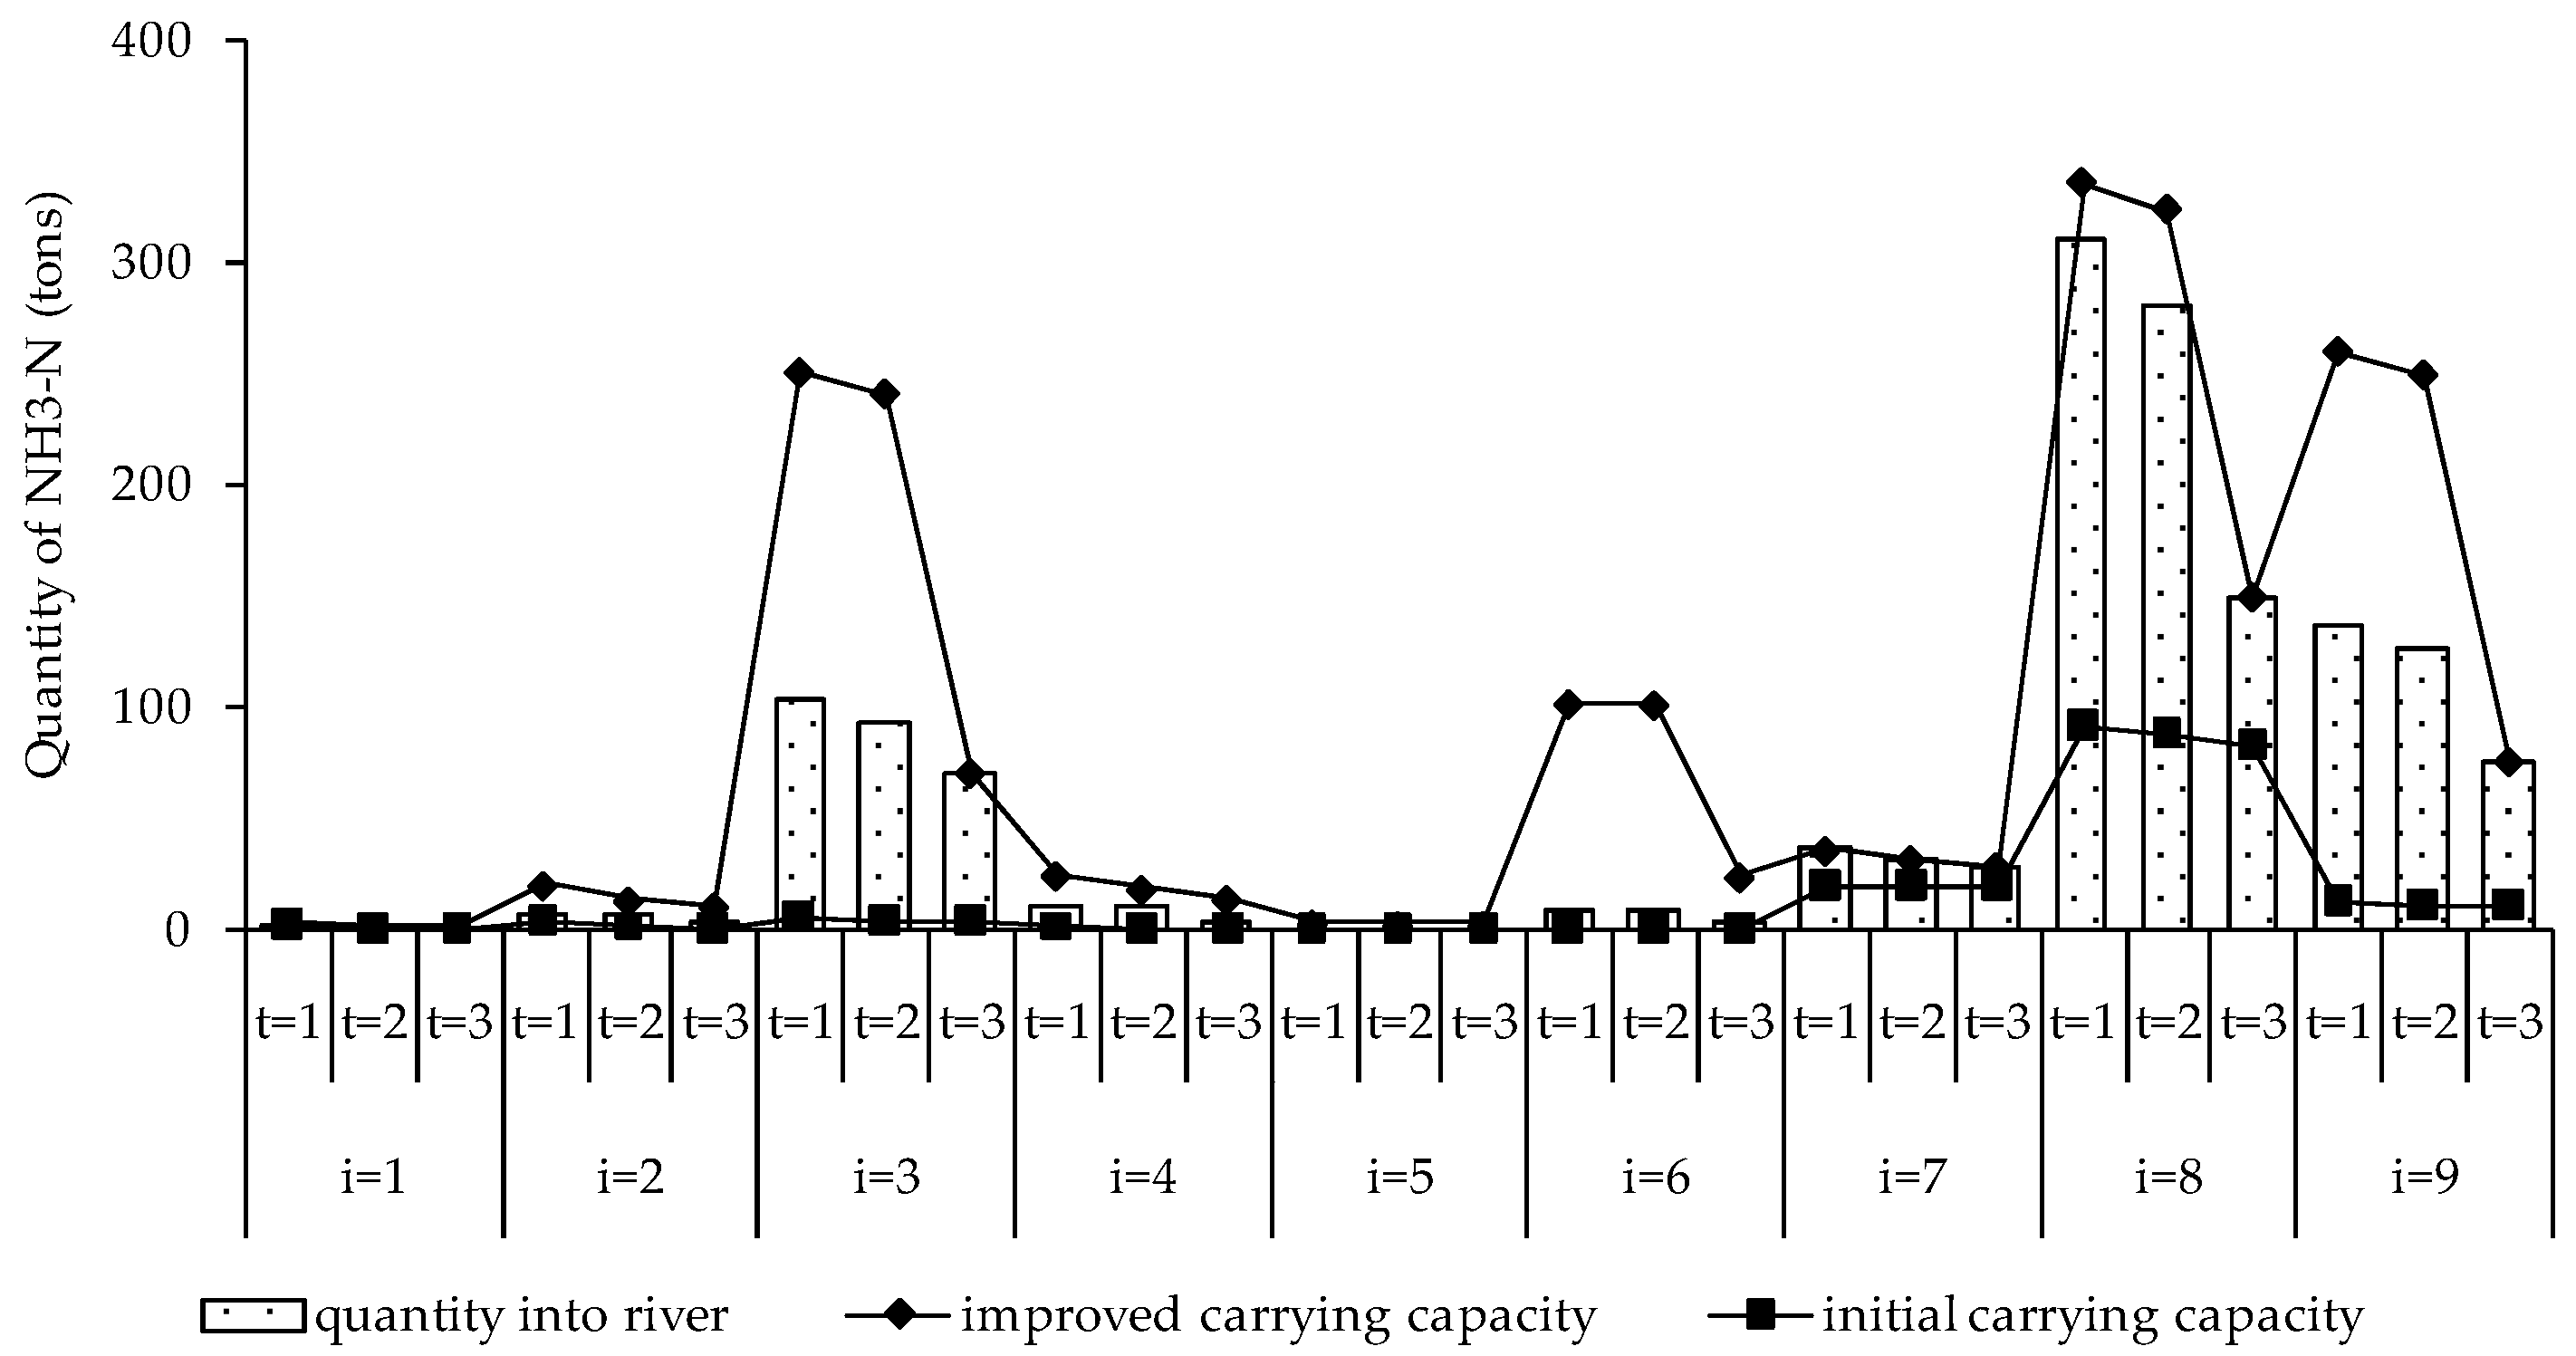
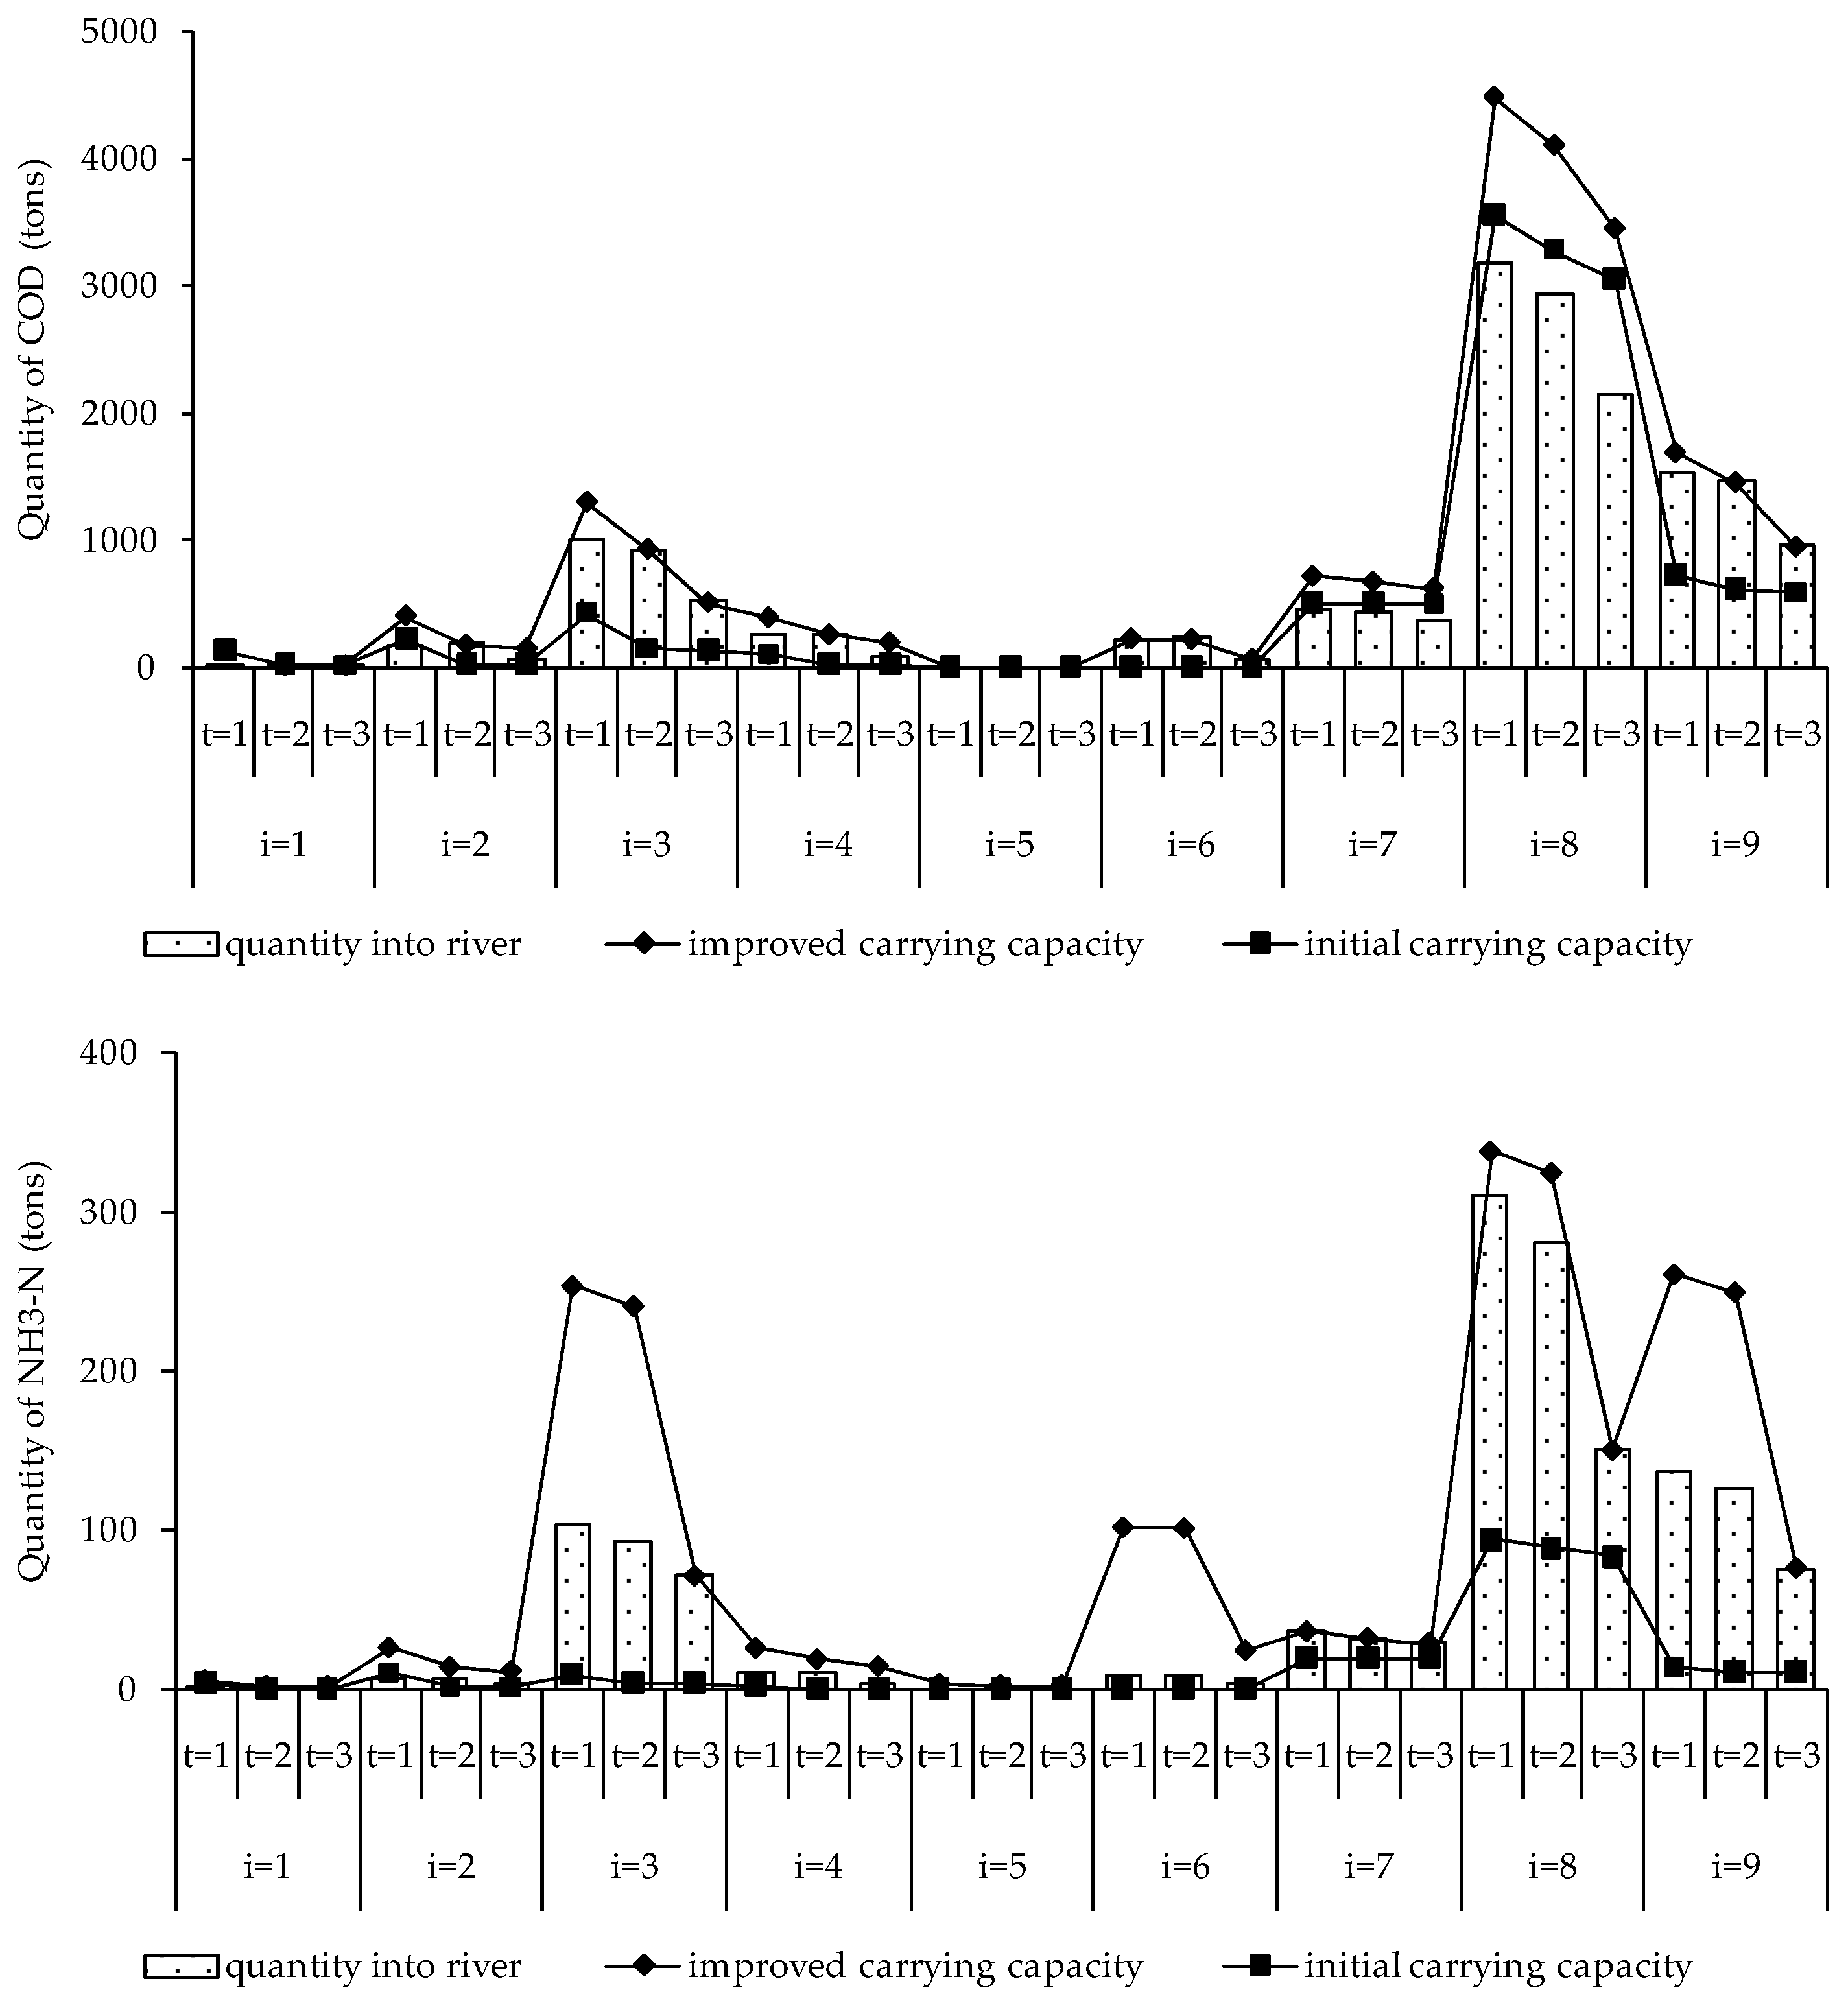
Figure 7, Figure 8 and Figure 9 show the quantity correlations between initial and improved water environmental carrying capacities and the total amount of pollutants discharged into the river. These indicate that improvements of carrying capacity play a significant role in water protection. For example, Figure 8 shows that, in Zone 3 under the high level, initial carrying capacities of COD are 427.06, 143.14, and 132.58 tons in Period 1 to 3, and the amounts of NH3-N are 9.22, 4.18, and 3.97 tons, whereas the total amounts discharged into the river were 994.77, 907.45, and 513.38 tons of COD and 102.54, 92.09, 70.44 tons of NH3-N, which are far beyond the initial capacities. Taking no account of the improvement of carrying capacity, there is a large amount of reduction needed, which is unrealistic for the regional development and technology levels at present. Implementation of ecological technologies could cause a significant improvement of the carrying capacity for discharged pollutants, as shown in Figure 9, with an improved capacity of COD and NH3-N attaining 1300.16, 930.66, and 513.38 tons and 253.26, 240.60, and 70.44 tons, respectively, with a surplus in Periods 1 and 2. The main reasons are: (1) the quantity of improvement is influenced by various factors, such as technology, period, and pollutant; and (2) in each zone, improvements needed are different for each period and pollutant; for example, Figure 8 shows that in Zone 8, there were only improvements for NH3-N needed with amounts of 216.47, 192.24, and 66.44 tons in Period 1 to 3, respectively.

5. Conclusions

In this study, a TSP model was developed for supporting waste load allocations of COD and NH3-N, for different pollution departments, which have to be constrained by the regional total amount controlled and improved water carrying capacity. In the Yitong River, with different probabilities of stream flow levels in each period, carrying capacity shows an obvious positive correlation with stream flows. A water quality simulation model was provided for reflecting the relationship between the waste load allocation, carrying capacity, and implementation of ecological restoration engineering. Allocation amounts depend on the type of pollutant, pollution departments, and carrying capacity improvement through ecological restoration engineering. With different applicability and efficiency, engineering selections are different in each of the function zones of the Yitong River for the purpose of meeting different improvement requirements of COD and NH3-N simultaneously. The results of the waste load allocation could be used for guiding and providing a basis for regional development and a discharge permit system for different departments.
This study is an attempt to plan a waste load allocation system through the TSP approach, firstly considering the total reduction amount together with improvements of the water environmental carrying capacity, and the results suggest this idea is applicable to water environmental quality management. However, compared with other studies, there is still much room for improvement in the proposed model. This model does not consider the uncertainties in practical water management, such as hydrodynamic conditions, coefficients of producing and emitting pollutants, and improving efficiency, which would unavoidably bring errors to the system. In addition, the selection of ecological restoration engineering is of significant complexity under such uncertainties. Further studies are desired to mitigate these limitations.

Acknowledgments

This study was sponsored by the Ministry of Water Resources of China; financial support was supplied by a special fund from the Finance Department of Jilin Province (2013-931). The authors are grateful to the anonymous reviewers and editors for their valuable comments and suggestions.

Author Contributions

Chong Meng designed the manuscript, developed the models and wrote the manuscript; Xiaolei Wang collected the data and revised the manuscript; Yu Li checked the content and revised the manuscript. All authors made contributions to the study and the writing of the manuscript.

Conflicts of Interest

The authors declare no conflict of interest.

References

  1. Liu, B.C.; Ma, J.; Yu, H.Y.; Huang, S.H. Study on the status of exploitation and utilization of water resources in Harbin and the sustainable development strategy. J. Hydraul. Eng. 2007, 26, 724–730. [Google Scholar]
  2. Ran, L.; Lu, X.X. Redressing China’s strategy of water resource exploitation. Environ. Manag. 2013, 51, 503–510. [Google Scholar] [CrossRef] [PubMed]
  3. Song, X.M.; Kong, F.Z.; Zhan, C.S. Assessment of water resources carrying capacity in Tianjin city of China. Water Resour. Manag. 2011, 25, 857–873. [Google Scholar] [CrossRef]
  4. Schindler, D.W.; Donahue, W.F. An impending water crisis in Canada’s western prairie provinces. Proc. Natl. Acad. Sci. USA 2006, 103, 7210–7216. [Google Scholar] [CrossRef] [PubMed]
  5. Qin, B.; Zhu, G.; Gao, G.; Zhang, Y.; Li, W.; Paerl, H.W.; Carmichael, W.W. A drinking water crisis in Lake Taihu, China: Linkage to climatic variability and lake management. Environ. Manag. 2010, 45, 105–112. [Google Scholar] [CrossRef] [PubMed]
  6. Dana, K. Privatizing water: Governance failure and the world’s urban water crisis. Environ. Plan. C Gov. Policy 2011, 20, 951–952. [Google Scholar]
  7. Sun, J.; Chen, Y.; Zhang, Z.; Wang, P.; Song, X.; Wei, X.; Feng, B. The spatio-temporal variations of surface water quality in China during the “Eleventh Five-Year Plan”. Environ. Monit. Assess. 2015, 187, 1–12. [Google Scholar] [CrossRef] [PubMed]
  8. Hu, F.P.; Hou, J.; Luo, J.W.; Hu, W.R. Analysis of pollution loading and water environmental capacity of Gan River in Nanchang. Environ. Sci. Technol. 2010, 7, 213–234. [Google Scholar]
  9. Yang, J.; Lei, K.; Khu, S.; Meng, W.; Qiao, F. Assessment of water environmental carrying capacity for sustainable development using a coupled system dynamics approach applied to the Tieling of the Liao River Basin, China. Environ. Earth. Sci. 2015, 73, 1–11. [Google Scholar] [CrossRef]
  10. Meng, W.; Zhang, N.; Zhang, Y.; Zheng, B.H. The Study on Technique of Basin Water Quality Target Management I: Pollutant Total Amount Control Technique in Control Unit. Res. Environ. Sci. 2007, 20, 1–8. [Google Scholar]
  11. Gregoire, C.; Elsaesser, D.; Huguenot, D.; Lange, J.; Lebeau, T.; Merli, A.; Mose, R.; Passeport, E.; Payraudeau, S.; Schütz, T.; et al. Mitigation of agricultural nonpoint-source pesticide pollution in artificial wetland ecosystems. Environ. Chem. Lett. 2009, 7, 205–231. [Google Scholar] [CrossRef]
  12. Li, X.N.; Song, H.L.; Li, W.; Lu, X.W.; Nishimura, O. An integrated ecological floating-bed employing plant, freshwater clam and biofilm carrier for purification of eutrophic water. Ecol. Eng. 2010, 36, 382–390. [Google Scholar] [CrossRef]
  13. Ouellet-Plamondon, C.; Chazarenc, F.; Comeau, Y.; Brisson, J. Artificial aeration to increase pollutant removal efficiency of constructed wetlands in cold climate. Ecol. Eng. 2006, 27, 258–264. [Google Scholar] [CrossRef]
  14. Cho, J.H.; Sung, K.S.; Ha, S.R. A river water quality management model for optimising regional wastewater treatment using a genetic algorithm. J. Environ. Manag. 2004, 73, 229–242. [Google Scholar] [CrossRef] [PubMed]
  15. Karmakar, S.; Mujumdar, P.P. A two-phase grey fuzzy optimization approach for water quality management of a river system. Adv. Water Resour. 2007, 30, 1218–1235. [Google Scholar] [CrossRef]
  16. Qin, X.S.; Huang, G.H. An Inexact Chance-constrained Quadratic Programming Model for Stream Water Quality Management. Water Resour. Manag. 2009, 23, 661–695. [Google Scholar] [CrossRef]
  17. Hu, M.; Huang, G.H.; Sun, W.; Li, Y.P. Inexact quadratic joint-probabilistic programming for water quality management under uncertainty in the Xiangxi River, China. Stoch. Environ. Res. Risk Assess. 2013, 27, 1115–1132. [Google Scholar] [CrossRef]
  18. Vemula, V.R.S.; Mujumdar, P.P.; Ghosh, S. Risk Evaluation in Water Quality Management of a River System. J. Water Resour. Plan. Manag. 2004, 130, 411–423. [Google Scholar] [CrossRef]
  19. Kerachian, R.; Karamouz, M.A. Stochastic conflict resolution model for water quality management in reservoir–river systems. Adv. Water. Resour. 2007, 30, 866–882. [Google Scholar] [CrossRef]
  20. Xu, J.; Li, Y.; Huang, G. A Hybrid Interval-Robust Optimization Model for Water Quality Management. Environ. Eng. Sci. 2013, 30, 248–263. [Google Scholar] [CrossRef] [PubMed]
  21. Kneis, D. A water quality model for shallow river-lake systems and its application in river basin management. NMR Biomed. 2007, 23. Available online: https://publishup.uni-potsdam.de/opus4-ubp/files/1345/kneis_diss.pdf(accessed on 27 July 2017).
  22. Cools, J.; Broekx, S.; Vandenberghe, V.; Sels, H.; Meynaerts, E.; Vercaemst, P.; Seuntjens, P.; Van Hulle, S.; Wustenberghs, H.; Bauwens, W.; et al. Coupling a hydrological water quality model and an economic optimization model to set up a cost-effective emission reduction scenario for nitrogen. Environ. Model. Softw. 2011, 26, 44–51. [Google Scholar] [CrossRef]
  23. Xie, Y.L.; Li, Y.P.; Huang, G.H.; Li, Y.F.; Chen, L.R. An inexact chance-constrained programming model for water quality management in Binhai New Area of Tianjin, China. Sci. Total. Environ. 2011, 409, 1757–1773. [Google Scholar] [CrossRef] [PubMed]
  24. Fan, Y.R.; Huang, G.H.; Guo, P.; Yang, A.L. Inexact two-stage stochastic partial programming: Application to water resources management under uncertainty. Stoch. Environ. Res. Risk Assess. 2012, 26, 281–293. [Google Scholar] [CrossRef]
  25. Li, Z.; Huang, G.; Zhang, Y.; Li, Y. Inexact two-stage stochastic credibility constrained programming for water quality management. Resour. Conserv. Recycl. 2013, 73, 122–132. [Google Scholar] [CrossRef]
  26. Xie, Y.L.; Huang, G.H. Development of an inexact two-stage stochastic model with downside risk control for water quality management and decision analysis under uncertainty. Stoch. Environ. Res. Risk Assess. 2014, 28, 1555–1575. [Google Scholar] [CrossRef]
  27. Men, B.; Yu, T.; Kong, F.; Hua, Y. Study on the minimum and appropriate instream ecological flow in Yitong River based on Tennant method. Nat. Environ. Pollut. Technol. 2014, 13, 541–546. [Google Scholar]
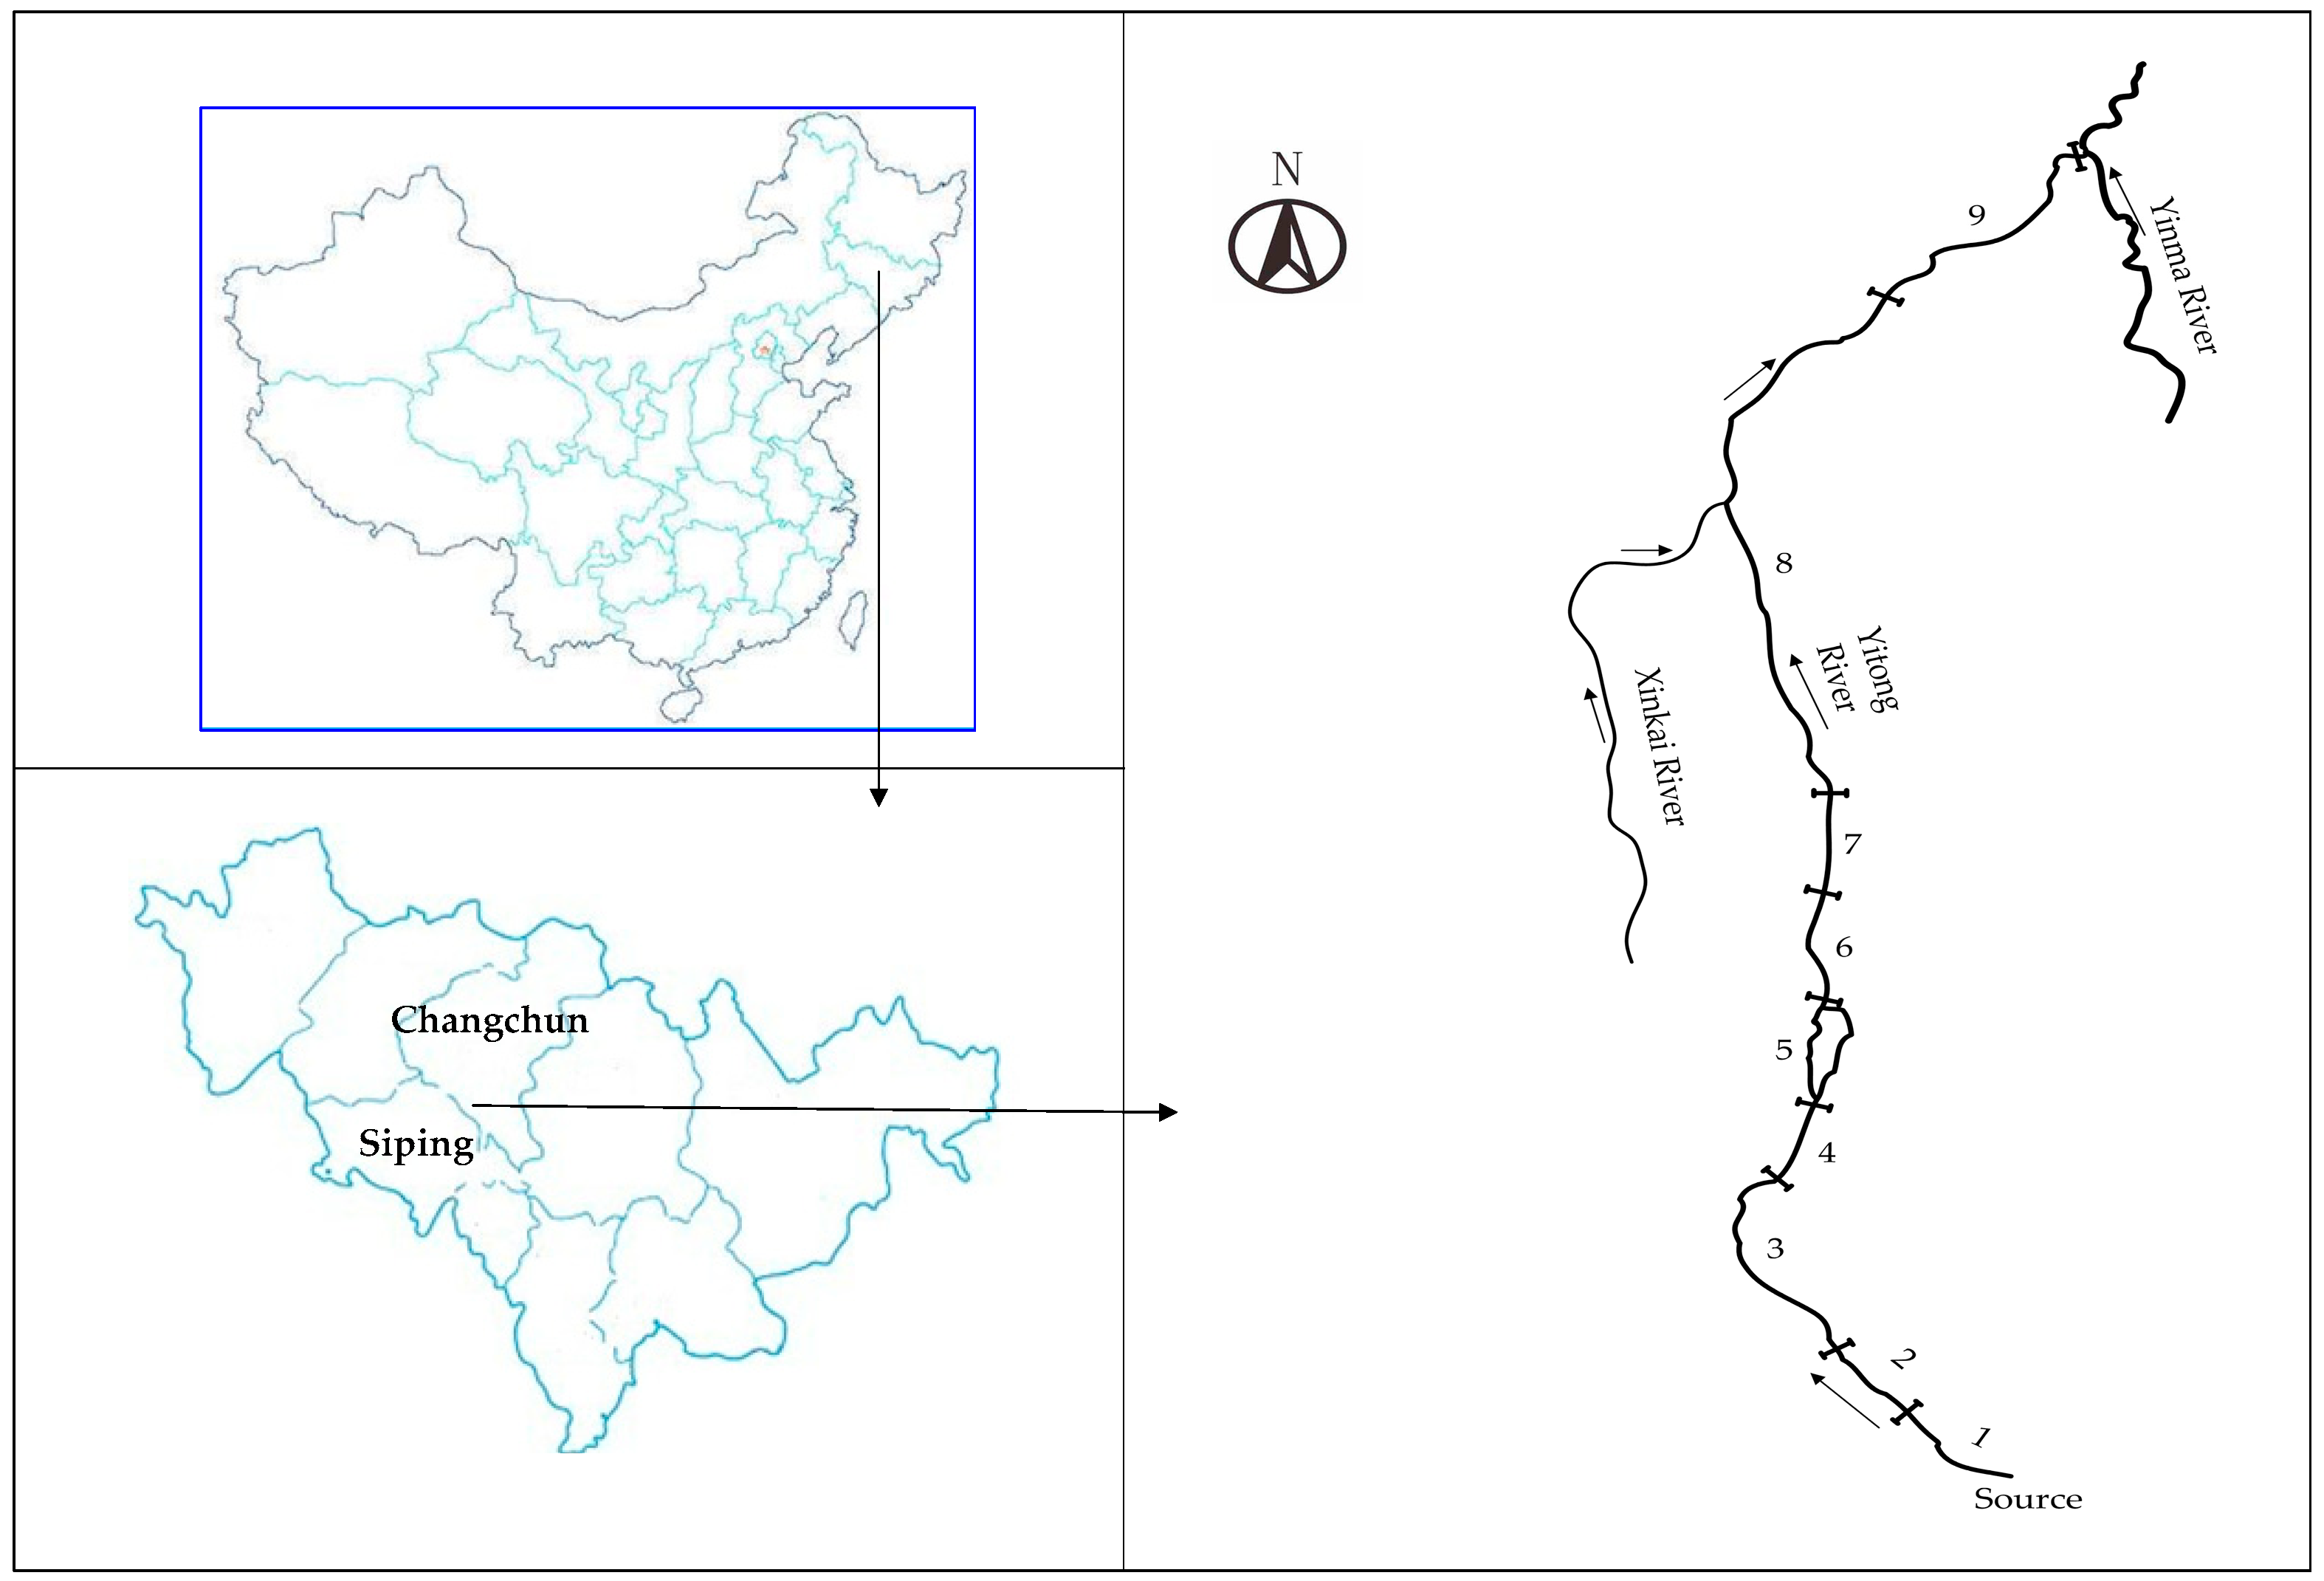
Figure 1. The geographical position and function zones of the Yitong River.
Water 09 00573 g001
Figure 2. Framework of the two-stage stochastic programming model.
Water 09 00573 g002
Figure 3. Environmental carrying capacities of chemical oxygen demand (COD) and NH3-N in the Yitong River.
Water 09 00573 g003
Figure 4. Allocation amounts of the controlled pollutants in Period 1.
Water 09 00573 g004
Figure 5. Allocation amounts of the controlled pollutants in Period 2.
Water 09 00573 g005
Figure 6. Allocation amounts of the controlled pollutants in Period 3.
Water 09 00573 g006aWater 09 00573 g006b
Figure 7. Environmental carrying capacities and pollutants into the Yitong River under the low flow level.
Water 09 00573 g007
Figure 8. Environmental carrying capacities and pollutants into the Yitong River under the medium flow level.
Water 09 00573 g008aWater 09 00573 g008b
Figure 9. Environmental carrying capacities and pollutants into the Yitong River under the high flow level.
Water 09 00573 g009
Table 1. Water functional zones in the Yitong River. (COD = chemical oxygen demand, NH3-N = ammonia nitrogen).
ZonesFunctionsLength(km)Quality Targets (mg/L)
CODNH3-N
1Springhead protection area22.8015.000.50
2Agricultural water area29.0020.001.00
3National nature protection area50.3020.001.00
4Agriculture and fishery water area15.0020.001.00
5Drinking and fishery water area11.4020.001.00
6Agriculture and fishery water area12.8020.001.00
7Landscape and recreation water area19.0020.001.00
8Agricultural water area137.2040.002.00
9Agricultural water, transition area45.0030.001.50
Table 2. Stream flows of the Yitong River in the three periods.
PeriodsLevels
h = 1 (L)h = 2 (M)h = 3 (H)
Probability
t = 10.250.500.25
t = 20.250.250.50
t = 30.500.250.25
Steam flows (m3/s)
i = 1t = 10.300.601.40
t = 20.100.150.20
t = 30.030.070.16
i = 2t = 10.300.601.40
t = 20.100.150.20
t = 30.030.070.16
i = 3t = 10.300.601.40
t = 20.100.150.20
t = 30.030.070.16
i = 4t = 10.550.851.65
t = 20.350.400.45
t = 30.280.320.41
i = 5t = 10.0010.0010.001
t = 20.0010.0010.001
t = 30.0010.0010.001
i = 6t = 10.020.040.08
t = 20.020.040.08
t = 30.020.040.08
i = 7t = 10.020.040.08
t = 20.020.040.08
t = 30.020.040.08
i = 8t = 10.500.700.90
t = 20.350.400.50
t = 30.100.150.20
i = 9t = 14.004.304.70
t = 23.803.854.00
t = 33.703.753.80
Table 3. Pre-allocation of the pollutants for different departments.
ZonesPeriodsPre-Allocation of the Pollutants (tons)
IndustryMunicipalLivestock BreedingAgriculture
CODNH3-NCODNH3-NCODNH3-NCODNH3-N
i = 1t = 10.000.000.000.005.050.1721.070.77
t = 20.000.000.000.004.490.1526.330.96
t = 30.000.000.000.001.680.065.270.19
i = 2t = 10.000.000.000.00151.395.22632.0423.12
t = 20.000.000.000.00134.574.64790.0528.90
t = 30.000.000.000.0050.461.74158.015.78
i = 3t = 1187.2322.39683.1077.78146.345.05505.6318.50
t = 2163.8219.59609.2569.37130.084.49632.0423.12
t = 3117.0213.99553.8663.060.000.000.000.00
i = 4t = 10.000.000.000.00201.856.96948.0634.68
t = 20.000.000.000.00179.426.191185.0743.36
t = 30.000.000.000.0067.282.32237.018.67
i = 5t = 10.000.000.000.000.000.000.000.00
t = 20.000.000.000.000.000.000.000.00
t = 30.000.000.000.000.000.000.000.00
i = 6t = 10.000.000.000.00189.226.52771.3528.22
t = 20.000.000.000.00168.195.80964.1935.28
t = 30.000.000.000.0063.072.17192.847.06
i = 7t = 183.9310.04383.1643.630.000.000.000.00
t = 273.448.78369.9542.120.000.000.000.00
t = 352.466.27310.6735.370.000.000.000.00
i = 8t = 1519.4362.112028.78231.00651.3022.462433.8289.04
t = 2454.5054.341809.45206.03578.9419.963042.27111.30
t = 3324.6438.821644.96187.30217.107.49608.4522.26
i = 9t = 1173.1420.70869.4899.00434.2014.971991.3172.85
t = 2151.5018.11775.4888.30385.9613.312489.1391.07
t = 3108.2112.94704.9880.27144.734.99497.8318.21
Table 4. Ecological technologies for carrying capacity improvement in the Yitong River.
ZonesTechnologies
l = 1l = 2l = 3l = 4l = 5l = 6l = 7
i = 10010000
i = 21000000
i = 31100110
i = 41000001
i = 50011000
i = 61000010
i = 71100101
i = 81100110
i = 91100111