Temporal and Spatial Variations of Hydrological Processes on the Landscape Zone Scale in an Alpine Cold Region (Mafengou River Basin, China): An Update


1
Institute of Loess Plateau, Shanxi University, Taiyuan 030006, Shanxi, China
2
College of Environmental and Resource Sciences, Shanxi University, Taiyuan 030006, Shanxi, China
*
Author to whom correspondence should be addressed.
Water 2017, 9(8), 574; https://doi.org/10.3390/w9080574
Submission received: 7 June 2017
/
Revised: 25 July 2017
/
Accepted: 26 July 2017
/
Published: 12 August 2017
(This article belongs to the Special Issue Isotopes in Hydrology and Hydrogeology)
Abstract
:This study investigates precipitation, snow, groundwater, glaciers and frozen soil in different landscape zones using isotopic and hydrogeochemical tracers. The aim of this study is to identify temporal and spatial variations, as well as hydrological processes in the alpine cold region. The results show that there was no significant difference in water chemical characteristics of various waterbodies, and no obvious temporal variation, but exhibited spatial variation. In the wet season, various waterbodies are enriched in oxygen δ18O and deuterium δD due to a temperature effect. Precipitation and the temperature decrease during the dry season, which cannot easily be affected by secondary evaporation. The d-excess (deuterium excess) of various waterbodies was greater than 10‰. There are no altitude effects during wet and dry seasons because the recharged water resources are different in the wet and dry seasons. It is influenced by the freezing-thawing process of glacier snow and frozen soil. The river water is recharged by thawed frozen soil water and precipitation in the wet season, but glacier snow meltwater with negative δ18O and δD is less (14–18%). In the dry season, glacier snow meltwater and groundwater are the dominant source of the river water, and thawed frozen soil water is less (10–15%).
1. Introduction
The combined study of environmental isotopes and hydrogeochemical tracers in water has become a powerful and promising tool for conducting hydrological research in recent years. Isotopic tracers can provide data and information on the origin of runoff processes and components [1,2,3,4,5,6,7]. It can be used to study the water cycle and origin of atmospheric condensates [8,9,10,11,12,13]. In addition, stable isotopes have been used to identify runoff pathways, contribution of runoff component and residence times [14,15,16,17,18].
Numerous investigators have studied the variable of deuterium D and oxygen 18O in atmospheric moisture to determine short- and long-term climatic variations in different geographic areas [19,20,21,22,23]. Harvey and Welker (2000) found isotopic differences between summer and winter precipitation. An important issue that can be addressed by the isotopic analysis of precipitation involves the primary and secondary processes that control the evaporation-condensation. [24,25,26,27,28]. Yoshimura et al. (2003) used a isotope model to quantitatively analyze short-term δ18O and δD variability. It is important to study isotope monitoring, to understand the hydrology of different landscape zones, to identify human impacts on rivers, to identify impacts of climate change on runoff, and to structure hydrological models [29,30,31,32,33,34,35,36,37].
There is a diversity of vertical vegetation zones in the Mafengou River basin [38]. However, there is less research on spatial and temporal variation in isotopic composition of various waterbodies on the different landscape zones in the alpine cold region. This study investigated precipitation, snow, surface water, groundwater, frozen soil water and glaciers on the different landscape zones, using both isotopic and hydrogeochemical tracers. The objectives of this paper are as follows: (1) to characterize spatial and temporal variations of the isotopic composition of various waterbodies in each of the landscape zones; (2) to investigate the recharged water sources and proportions of river water, and; (3) to identify spatial and temporal variations and reasons of hydrological processes on the landscape zone scale in the alpine cold region.
2. Area Description
2.1. Site Description
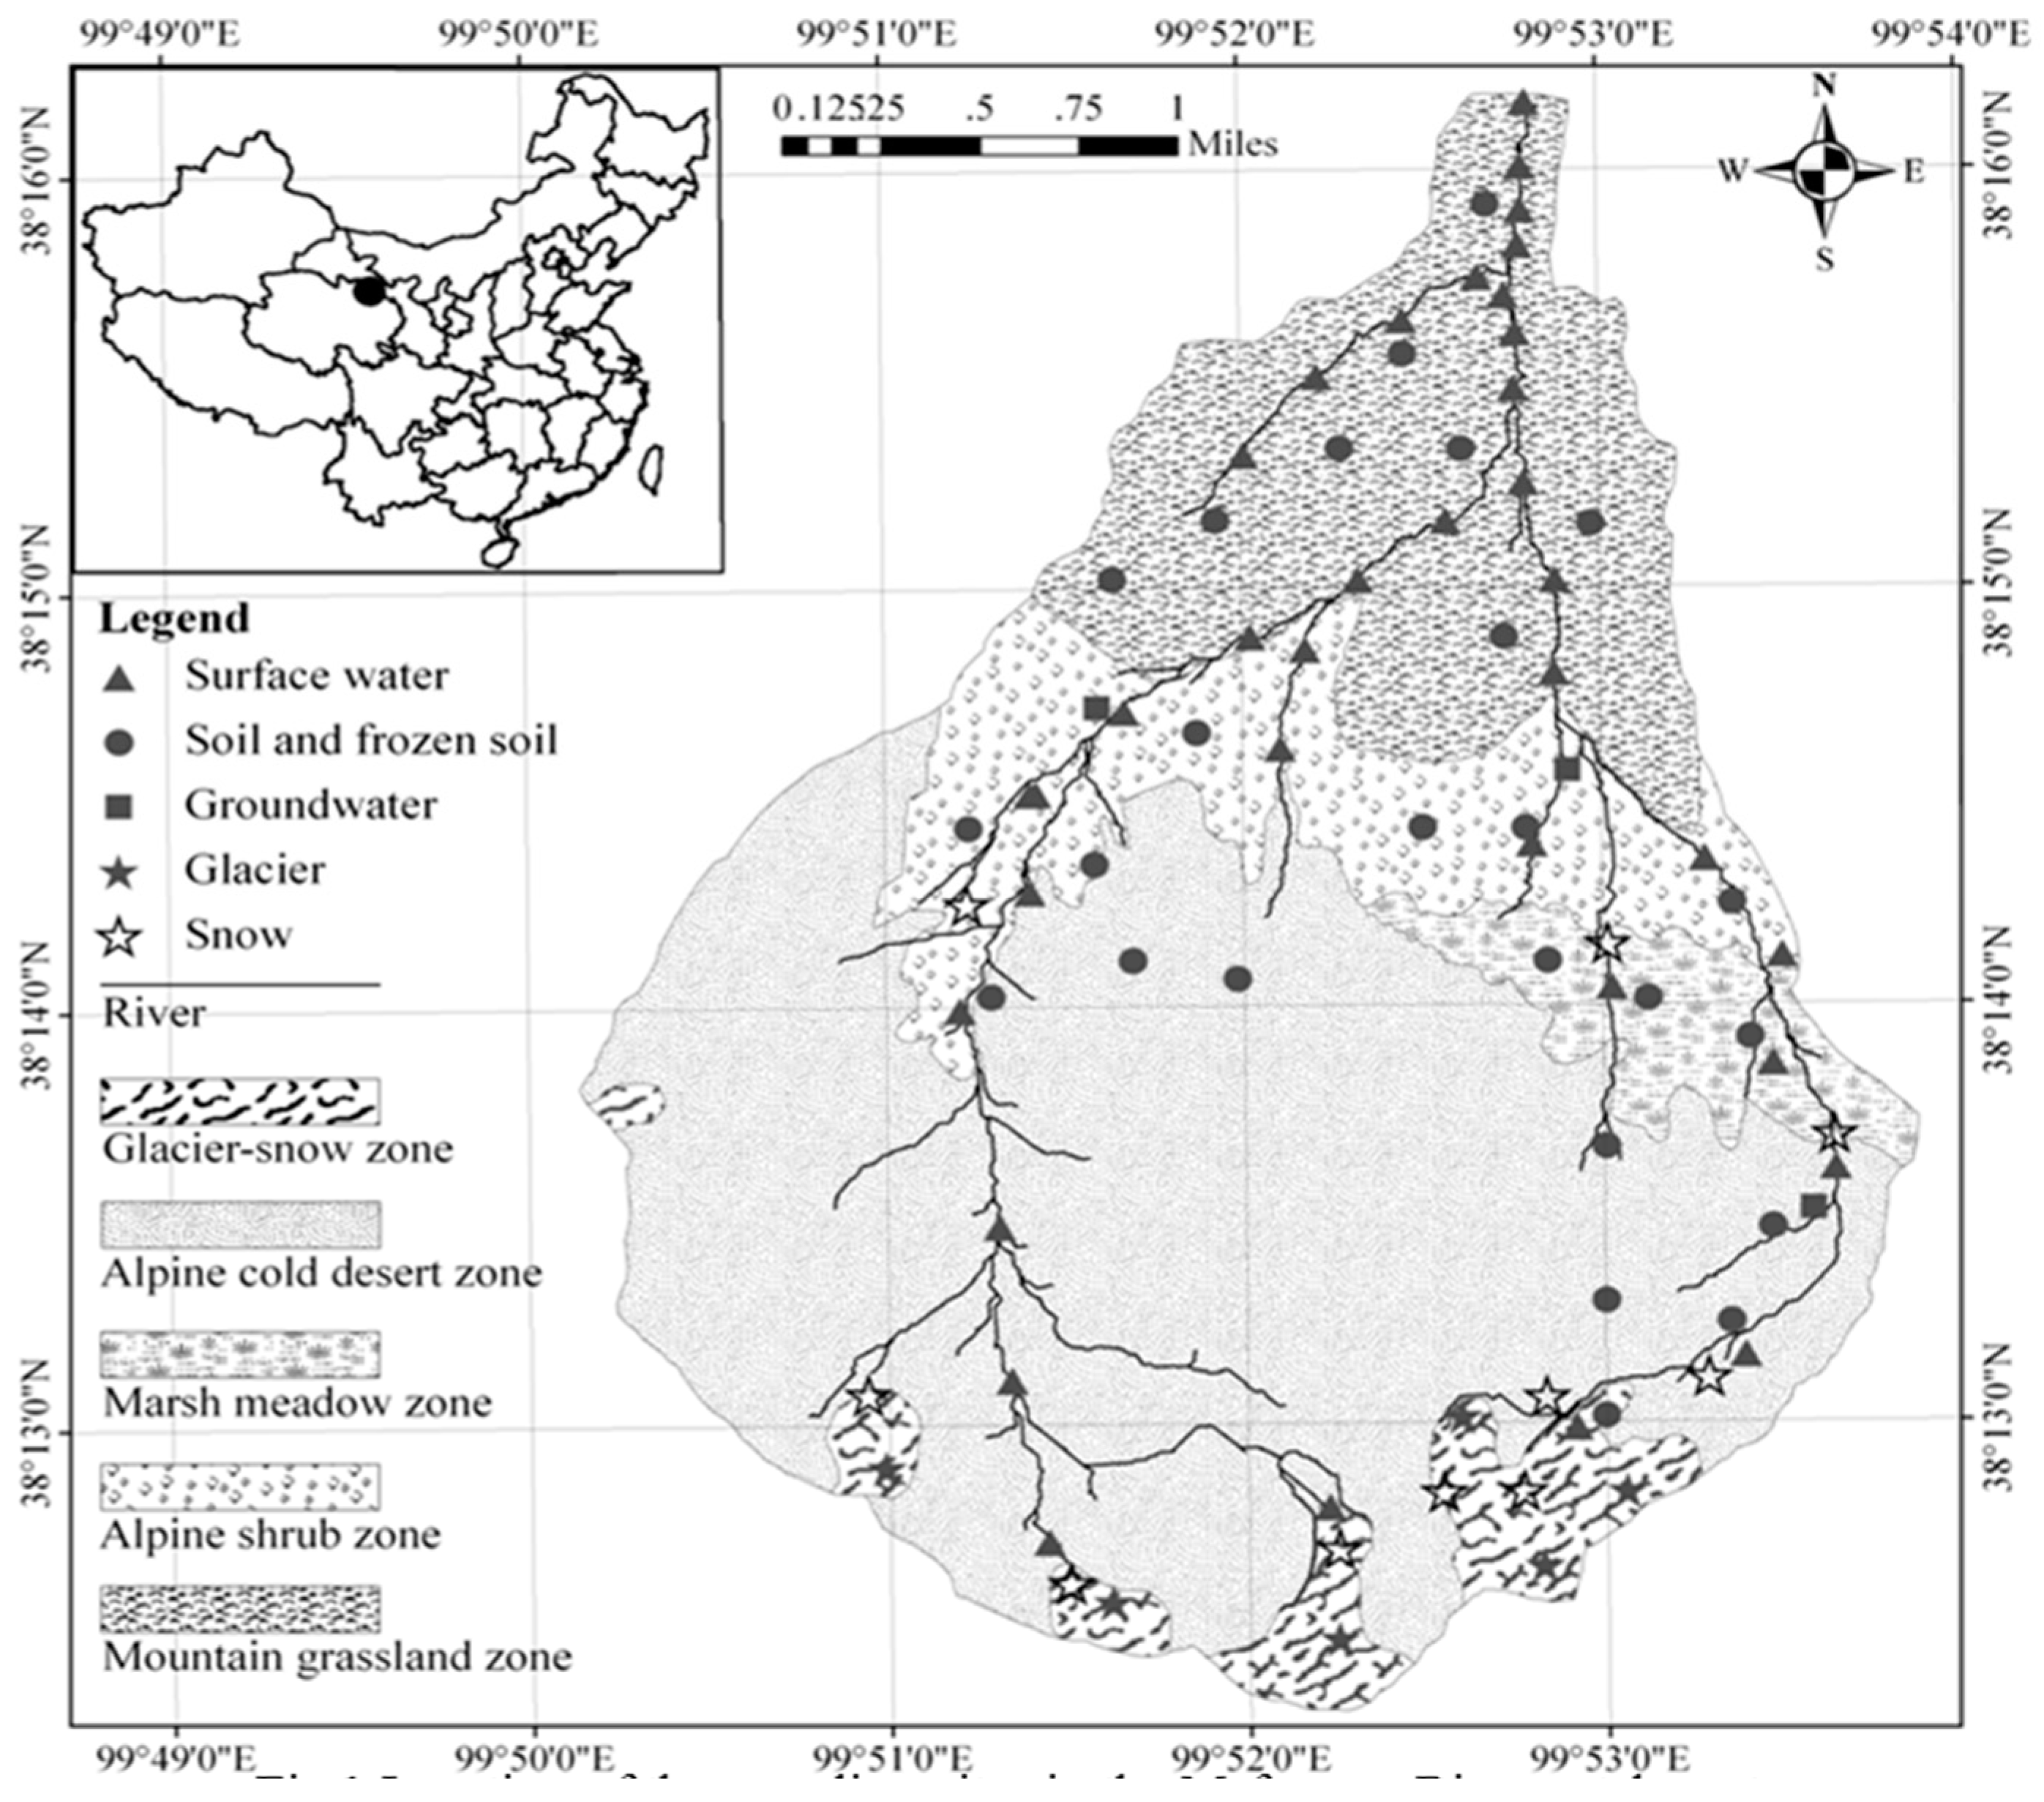
The Mafengou River basin is located in the alpine cold region of the Qilian mountainous area in China, with latitudes 38°12′14″~38°16′23″ N, and longitudes 99°50′37″~99°53′54″ E. The catchment area is 23 km2. The altitude ranges from 2960 m to 4820 m, spanning 1860 m. The mean annual precipitation ranges from 400 to 700 mm. Flood season is late in the Mafengou River Basin, and precipitation mainly occurs during the summer season. Spring flood and summer flood seasons are in succession.
In March and April, the surface soil melting process water is weak. Surface soils refreeze due to freezing temperatures at night. In May, melting water from snow and glaciers were the dominant source of runoff. After June, frozen soil, glaciers and snow gradually melt as the temperature increases. In July and August, precipitation achieves a maximum, although the melting of seasonal glaciers and snow decreases, the frozen soil melting increases. After mid-September, melting water gradually decreases. Precipitation shifts gradually to a solid state, and the river drops quickly. From October to February of the next year, the temperature decreases rapidly, precipitation is in the form of snow. Surface water and frozen soil freeze.
2.2. Hydrogeological Background
The study site is an area with strong tectonic structures. The lithology is dominated by Paleozoic-Mesozoic and Cenozoic sandstone, conglomerate, shale, limestone and slate, which have degenerated to different degrees [3,9,39]. There is abundant bedrock fissure water, which is characterized by metamorphic and clastic rock dating from the Paleozoic to the Cenozoic [3,9,40]. Pore-fissure water occurs mainly in the Late Paleozoic to Cenozoic strata. Permian-Jurassic pore-fissure water is mainly found in high mountainous areas [41]. Glacial meltwater, seasonal snowmelt, precipitation and bedrock fissure water contribute to this runoff throughout the mountainous area.
3. Material and Methods
3.1. Sample Collection
Samples of precipitation (N = 48), surface water (N = 176), snow (N = 20), frozen soil (N = 144), glacier (N = 20) and groundwater (N = 60) were collected and sealed from 2008 to 2013 in the Mafengou River basin. Temperature, EC (conductivity) and pH of groundwater and surface water were measured with YSI-63 conductivity meter in the field. The samples were preserved at 4 °C. Frozen soil, glacier and snow were refrigerated at −20 °C. The sampling sites are shown in Figure 1.
3.2. Laboratory Analyses
Soil water was extracted by cryogenic vacuum distillation. Water samples were filtered through 0.45 μm Millipore membrane for major element analyses. Water samples were filtered through 0.2 μm Millipore membrane for analyses of δ18O and δD. δ18O was analyzed by a Euro-PyrOH elemental analyzer at a temperature of 1300 °C, and δD was analyzed at a temperature of 1030 °C in the Chinese Academy of Sciences. The analytical precision of δ18O determinations was ±0.2‰, and that of δD ± 1‰. Isotopic elements were expressed as δ-per million (‰) relative to the Vienna Standard Mean Ocean Water, according to the follow equation:
Ca2+, K+, Na+ and Mg2+ were analyzed by atomic absorption spectrometry (PE-2380), water samples were acidified by HCl before Ca2+ and Mg2+ were analyzed. SO42−, NO3−, Cl−and F− were analyzed by ion chromatography (Dionex-100). HCO3− concentrations were determined by titration on site or within 24 h after collection, which were acidified by HCl. The analytical precision was less than ±3%.
4. Results and Discussion
4.1. Temporal and Spatial Variations of Chemical Characteristics
The water migration path can be roughly inferred by the spatial distribution trend of EC. There was not a significant difference in the water chemical characteristics of various waterbodies, without obvious seasonal variation, but an obvious hydration credits zone existed. The pH value of most water samples ranges from 8.26 to 9.37. The values of EC of water samples range from 29.1 to 2448 μS/cm. The highest EC values are recorded in the alpine meadow grassland zone (2448 μS/cm) and alpine cold desert zone (2005 μS/cm), which are affected by water-rock interactions. The lowest EC values (29.1 μS/cm) are measured in precipitation. The EC values of glacier snow ranges from 196 to 204 μS/cm. The EC values of runoff in the alpine cold desert zone are close to that of glacier snow, which exist as the hydraulic relationship of recharge and discharge. The EC values of the marsh meadow zone is 483.6 μS/cm. The EC value of spring water in the alpine shrub zone was 190.3 μS/cm. The EC of river water in the upper reaches is 421–444 μS/cm, 452–463 μS/cm in the middle reaches, and 465.5–493.2 μS/cm in the lower reaches. From the catchment area to the lower reaches, the EC values of river water are increasing, which showed that it is recharged by different mixture water along the path, besides spring water.
The PHREEQC interactive model is used to simulate the chemical reaction and transferring process [42,43]. Data are entered through a series of keyword data blocks. The most important results of speciation calculations are saturation indices for minerals, which indicate whether a mineral should dissolve or precipitate. The saturation index is calculated, and the results are showed in Table1. The result show that spring water in the alpine shrub zone (S-09-1) is SI(aragonite) > 0, SI(calcite) > 0, SI(dolomite) > 0, suggesting that aragonite, calcite and dolomite are supersaturated, they are precipitation. SI(anhydrite) < 0, SI(gypsum) < 0, SI(fluorite) < 0, SI(salt) < 0, suggesting that they are low saturation. Anhydrite, gypsum, fluorite and salt are dissolved, and they are rich in carbonate and their PH is alkaline. The saturated index of spring in the lower reaches (SP-09-6) is similar to that of the alpine shrub zone, indicating that it is affected by the mixture of different waterbodies. The saturation index of the other groundwater is SI(anhydrite) < 0, SI(gypsum) < 0, SI(aragonite) < 0, SI(calcite) < 0, SI(dolomite) < 0, SI(fluorite) < 0, SI(salt) < 0, indicating anhydrite, gypsum, aragonite, dolomite, fluorite and salt are low saturation, they are solution.
Inverse modeling calculates the geochemical reactions that account for the change in chemical composition of water along a flow path. PHREEQC can accord the water chemistry deduction of the water flow path. The water-rock reaction of groundwater flow can be determined. Which water-rock reaction has occurred for a water chemistry system, the quantity of mixed aqueous solution for each component, and the transfer amount of gases and minerals in the evolution process can be calculated. The PHREEQC model was used to inverse simulate the hydrogeochemical system in the study area. The saturation index of CaCO3 gradually decreased from the alpine cold desert zone to the alpine shrub zone. Calcite and aragonite are precipitation. The saturation index of gypsum and anhydrite gradually increased with lixiviation action. CaMg(CO3)2 did not obviously exist, and the salt showed lixiviation action. The hydrogeochemical process of the path (G-09-06→S-09-1) includes dissolved dolomite, calcite, aragonite and rock salt, runoff from the glacier snow zone flow to the alpine shrub zone. The path (G-09-06→C-09-1) is from the glacier snow zone to the alpine cold desert zone, indicating dissolved anhydrite, dolomite, gypsum and salt, but calcite is precipitation. The hydrological path (C-09-1→S-09-1) refers to the runoff from the alpine cold desert zone to the alpine shrub zone, indicating that calcite and fluorite and rock salt are dissolved, which is the main hydrogeochemical process. From the mass balance simulation results, it was shown that calcite precipitation was the main process (Table 2).
4.2. Altitude Variations of Hydrological Processes in the Study Area
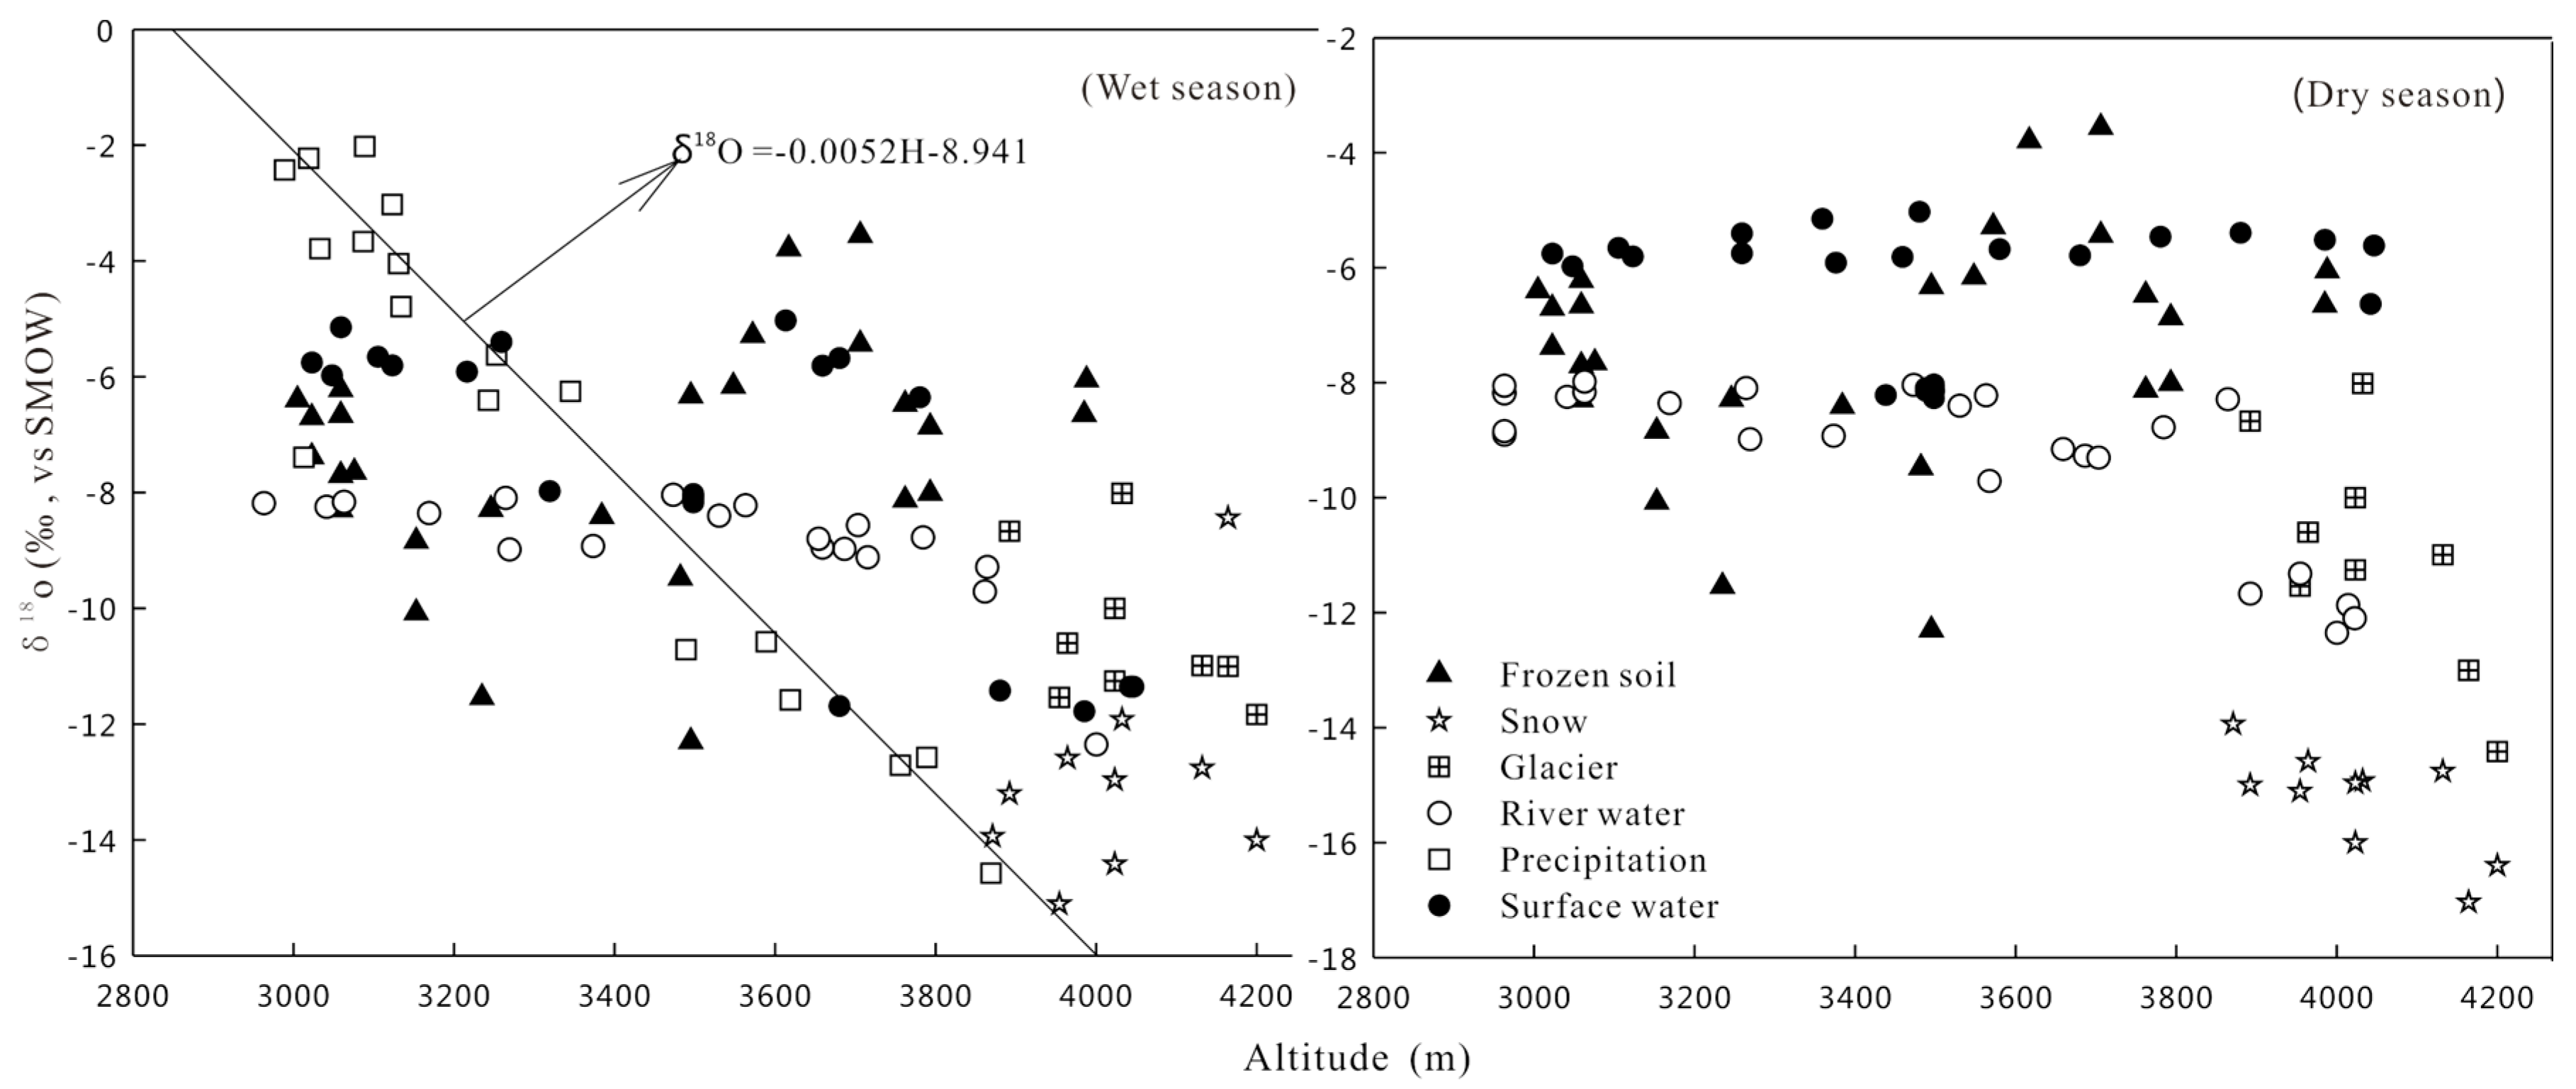
During the wet season, there are no obvious altitude effects for surface water in different landscape zones and different altitude. Surface water in alpine cold desert zone is mainly recharged by thawed frozen soil water, glacier snow meltwater and precipitation, but surface water in the alpine shrub zone is recharged by the spring, precipitation and thawed frozen soil water. The isotopic composition of surface water in the marsh meadow zone and mountain grassland zone are enriched due to the repeated freeze-thaw cycle of frozen soil. Therefore the differences in the isotopic composition of surface water in various landscape zones were large, and there are no altitude effects. As Figure 2 shows, there are no obvious altitude effects among various frozen soils during the wet season. The isotopic composition of frozen soil is controlled only by temperature, but not altitude. River water mix the glacier snow meltwater with lower isotopic levels, leading to an isotopic composition that is relatively negative.
Compared with wet season, some differences appeared in the isotopic components of various waterbodies, but do not show a good correlation with elevation in the dry season. There are no obvious altitude effects among the various landscape zones. This is because the river water is recharged by thawed frozen soil water and glacier snow meltwater, and thawed frozen soil water and glacier snow melts water infiltrated and turned into groundwater [3,9,38]. Therefore, the altitude effect cannot be applied to determine the recharged level of groundwater or river water in the Mafengou River Basin.
4.3. Temporal and Spatial Variations of Runoff Process
During the wet season, δ18O of river water in the lower reaches ranges from −8.15‰ to −8.04‰, and δD range from −46.67‰ to −45.24‰, respectively. As the Figure 3 shown [9,38], the isotopic composition of river water is low compared with that of precipitation, and ranges between precipitation and meltwater, which indicated that river water is recharged by precipitation and meltwater. The isotopic composition of river water was low due to recharge by glacier snow meltwater and thawed frozen soil. It is revealed that river water is recharged by thawed frozen soil, glacier snow meltwater and precipitation in the wet season [3,9,38]. During the dry season, in river water in the lower reaches, δ18O ranges from −8.91‰ to −8.84‰, and δD ranges from −52.46‰ to −51.72‰, respectively, between groundwater and meltwater, which indicates that river water is recharged by groundwater and meltwater. Precipitation and various waterbodies exhibit seasonal effects.
Temporal variations in δD and δ18O of various waterbodies has significant temperature effect (Figure 3, Table 3). There are several reasons for this seasonal variation: (1) in the wet season, precipitation mainly occurs from July to September, during which high temperatures occur. Higher temperatures lead to isotope fractionation effects caused by evaporation during the precipitation process. Therefore, various waterbodies are enriched in δ18O and δD even though rainfall is heavy during the wet season. (2) In the dry season, water vapor comes from the evaporation of local waterbodies and the temperature is low. Therefore, less secondary evaporation and water vapor exchange occur during the precipitation process, leading to negative in δ18O and δD. As the seasons move into autumn and winter, precipitation and temperature decrease, and precipitation is in the solid state in the cold season and evaporation is weak, leading to negative in δ18O and δD.
Deuterium excess (d = δD − 8δ18O) is a valuable indicator of isotope hydrology and hydrological geology, which can be used as an indicator in the research on hydrological processes, water-rock interaction, and the dynamics of groundwater. It can be applied to study different waterbodies, besides precipitation [44,45,46].
The d-excess value of precipitation ranges from 12‰ to 23‰ (Figure 4 and Figure 5). The difference is due to the climate and the complexity of moisture sources in the alpine cold mountainous region (Figure 4). The d-excess value of surface water is high due to re-evaporation. The d-excess value of underground runoff in the alpine cold desert zone are similar to those of glacier and snow, which is recharged by glacier snow meltwater. The d-excess of groundwater varies from 18.9‰ to 19.6‰, and are close to those of frozen soil, which suggests that groundwater mainly is recharged by thawed frozen soil water zone.
In the wet season, the d-excess value of surface runoff in the mountain grassland zone and marsh meadow zone are significantly different from that of various waterbodies in other landscape zones, and also greatly different from that of glacier and snow, indicating that they have differently recharged water resources (Figure 4). The d-excess value of surface runoff in the marsh meadow zone varies from 6.98‰ to 8.9‰, which is close to those of frozen soil. It reveals the characteristics of recharged by thawed frozen soil water. The d-excess value of outlet river water in the wet season is obviously different from that of in dry season, which indicates that the recharge water source is different in different periods.
In the dry season, Figure 4 shows that underground runoff in the alpine cold desert zone, glacier and snow have a very close hydraulic connection. The d-excess value of groundwater in the alpine shrub zone varied from 19.8‰ to 21.5‰, and are close to those of frozen soil in the freezing layer, which suggests that groundwater in the alpine shrub zone is recharged by thawed frozen soil water, snow and glacier.
During the dry season, the d-excess value of surface water in the mountain grassland zone and marsh meadow zone are significantly different from various waterbodies in other landscape zones, indicating that they have differently recharged water resource (Figure 4). The d-excess values of various waterbodies in the wet season and dry season are generally higher than the global average value (10‰), which suggests that various waterbodies are not directly recharged by precipitation. The d-excess value gradually decreases from the recharged region to the drainage region, with the infiltration and migration of the water.
4.4. Variations of the Contributions of Runoff
There is a significant difference in the value of δ18O and d between glacier, snow, frozen soil, surface water and groundwater in the different landscape zones (Table 3). As shown in Figure 5, various waterbodies in each landscape zone are located within the triangle that spanned the three end-members of glacier snow meltwater, thawed frozen soil and precipitation, which suggests that the runoff is a mixture of the three end-members in the wet season [9,38]. They are close to the line of precipitation and thawed frozen soils, indicating that thawed frozen soil water and precipitation are the main water source. Figure 5 explains the three end-members are groundwater, glacier snow meltwater and thawed frozen soil water in the dry season. Various waterbodies in each landscape zone are also located within the triangle that spanned the three end-members, which indicates that the runoff was a mixture of water. However, it is close to the line of groundwater and glacier snow meltwater, which is recharged by glacier snow meltwater and groundwater.
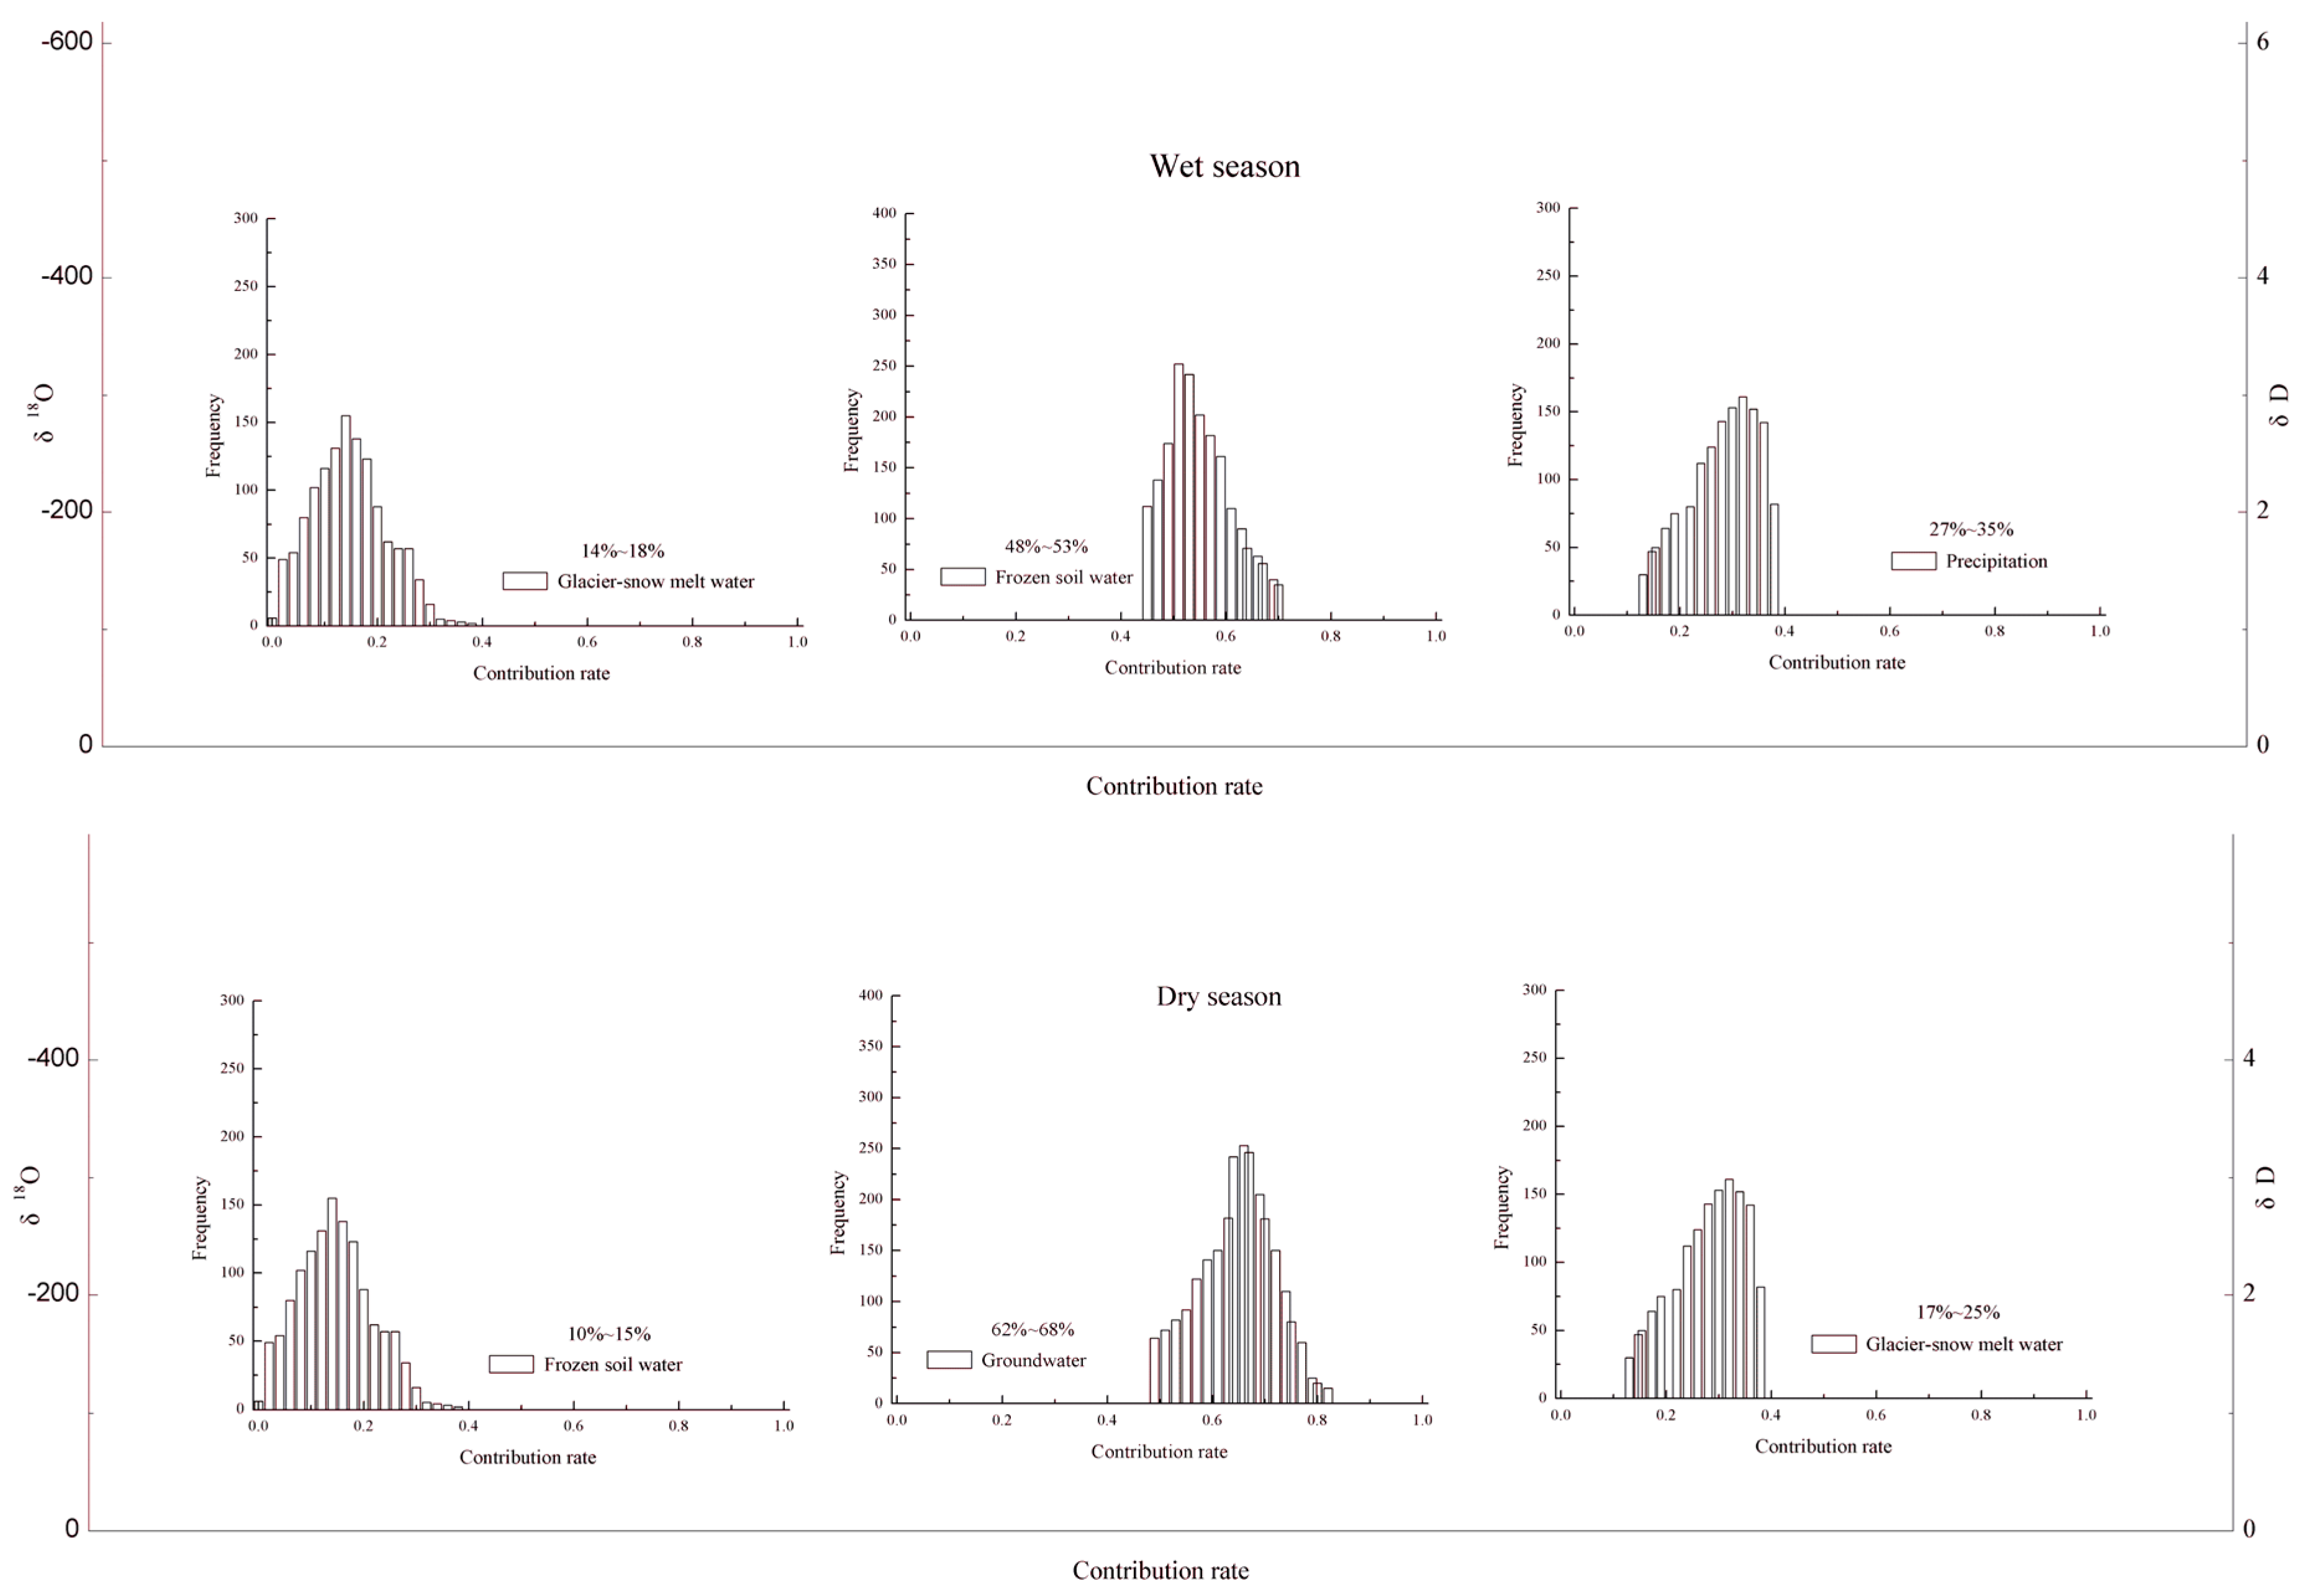
The conservative elements Cl− and 18O tend to act conservatively, which do not participate in chemical reactions, which are frequently used as a tracer along flow paths due to their lack of reactivity and input sources in the subsurface environment (Figure 6). The results show that runoff is recharged by thawed frozen soil water, glacier snow meltwater and precipitation during the wet seasons in the Mafengou River basin. The contribution of precipitation is 27–35%, glacier snow meltwater is 14–18%, and thawed frozen soil water is about 48–53% of total stream runoff. In the dry seasons, runoff is recharged by thawed frozen soil water about 10–15%, glacier snow meltwater about 17–25%, and groundwater about 62–68%. The largest component of total stream runoff is groundwater [9,38]. The runoff is mainly recharged by groundwater. The freezing-thawing process of seasonally frozen soil is an important process of hydrological processes.
5. Conclusions
The following conclusions can be drawn from this study:
- i.
- There is not a significant difference in the water chemical characteristics of various waterbodies. There is no obvious seasonal variation, but obvious hydration credits zone existed. Various waterbodies are relatively negative in δ18O and δD in the dry season, but enriched in δ18O and δD in wet season, which exhibits seasonal variation. In the wet season, higher temperatures lead to isotope fractionation effects caused by evaporation, and secondary evaporation easily occurs during the wet season, leading to enrichment in δ18O and δD. In the dry season, the temperature is low, and water vapor comes from the evaporation of local waterbodies. Precipitation is in the solid state in the cold season and evaporation is weak. Therefore, the isotope value is low, leading to negative in δ18O and δD.
- ii.
- The difference of d-excess value in the alpine cold mountainous region reflects the complexity of moisture sources and the extreme climate. The d-excess values of various waterbodies in the each of the landscape zones are higher than the global average value (10‰) due to the high altitude, strong solar radiation and strong evaporation in the Mafengou River basin. It is strongly affected by the local climate and environment, and leads to high d-excess.
- iii.
- The isotopic components of precipitation exhibits altitude effects. The δ18O and δD values are decreased with increased altitude. However, there are no obvious altitude effects among surface water during the wet and dry season. This is because it is not only recharged by precipitation, but also by meltwater of glacier, snow and frozen soil. The transformations of groundwater and surface water lead to the change of isotopic composition. Therefore, homogenization effects are the controlling factor of the change of isotopic components of various waterbodies. Therefore elevation effects cannot be applied to determine the recharged level of groundwater or river water in the Mafengou River Basin.
- iv.
- The river water is mainly recharged by thawed frozen soil water and precipitation in the wet season, but glacier snow meltwater with negative in δ18O and δD is relatively less (14~18%). In the dry season, glacier snow meltwater and groundwater are the dominant source of the outlet river water, but thawed frozen soil water is relatively less (10~15%).
Acknowledgments
This study is supported by National Natural Science Foundation of China (41201043, 41271143) and China Postdoctoral Science Foundation Funded Project (2014M550095). The authors are grateful to all participants in the field for their contributions to the progress of this study.
Author Contributions
Yonggang Yang contributed to the conception and design, data analysis and interpretation, draft, and the revision of the manuscript. Bin Li contributed to data analysis and draft of the manuscript.
Conflicts of Interest
The authors declare no conflict of interest.
References
- Van Geldern, R.; Hayashi, T.; Böttcher, M.E.; Mottl, M.J.; Barth, J.A.C.; Stadler, S. Stable isotope geochemistry of pore waters and marine sediments from the New Jersey shelf: Methane formation and fluid origin. Geosphere 2013, 9, 96–112. [Google Scholar] [CrossRef]
- Steen-Larsen, H.C.; Sveinbjörnsdottir, A.E.; Jonsson, T.H.; Johnsen, S.J. Monitoring the water vapor isotopic composition in the temperate North Atlantic. Geophys. Res. Abstr. 2012, 14, 1562. [Google Scholar]
- Yang, Y.G.; Xiao, H.L.; Zou, S.B.; Zhao, L.J.; Hou, L.G.; Wang, F. Hydrochemical and hydrological processes in the different landscape zones of alpine cold region in China. Environ. Earth Sci. 2012, 65, 609–620. [Google Scholar] [CrossRef]
- Chagué-Goff, C.; Mark, A.F.; Dickinson, K.J.M. Hydrological processes and chemical characteristics of low-alpine patterned wetlands, south-central New Zealand. J. Hydrol. 2010, 385, 105–119. [Google Scholar] [CrossRef]
- Stumpp, C.; Maloszewski, P.; Stichler, W.; Fank, J. Environmental isotope (δ18O) and hydrological data to assess water flow in unsaturated soils planted with different crops: Case study lysimeter station “Wagna” (Austria). J. Hydrol. 2009, 369, 198–208. [Google Scholar] [CrossRef]
- Mul, M.L.; Mutiibwa, R.K.; Uhlenbrook, S.; Savenije, H.H.G. Hydrograph separation using hydrochemical tracers in the Makanya catchment, Tanzania. Phys. Chem. Earth 2008, 33, 151–156. [Google Scholar] [CrossRef]
- Malinovsky, D.; Hammarlund, D.; Ilyashuk, B.; Martinsson, O.; Gelting, J. Variations in the isotopic composition of molybdenum in freshwater lake systems. Chem. Geol. 2007, 236, 181–198. [Google Scholar] [CrossRef]
- Zeng, H.A.; Wu, J.L. Water isotopic and hydrochemical characteristics and causality in Tajikistan. Adv. Water Sci. 2013, 24, 272–279. [Google Scholar]
- Yang, Y.G.; Xiao, H.L.; Wei, Y.P.; Zou, S.B.; Yang, Q.; Yin, Z.L. Hydrological processes in the different landscape zones of alpine cold regions in the wet season, combining isotopic and hydrochemical tracers. Hydrol. Process. 2012, 26, 1457–1466. [Google Scholar] [CrossRef]
- McInerney, F.A.; Helliker, B.R.; Freeman, K.H. Hydrogen isotope ratios of leaf wax n-alkanes in grasses are insensitive to transpiration. Geochim. Cosmochim. Acta 2011, 75, 541–554. [Google Scholar] [CrossRef]
- Han, D.M.; Liang, X.; Jin, M.G.; Currell, M.J.; Song, X.F.; Liu, C.M. Evaluation of groundwater hydrochemical characteristics and mixing behavior in the Daying and Qicun geothermal systems, Xinzhou Basin. J. Volcanol. Geotherm. Res. 2010, 189, 92–104. [Google Scholar] [CrossRef]
- Wu, P.; Tang, C.Y.; Zhu, L.J.; Liu, C.Q.; Cha, X.F.; Tao, X.Z. Hydrogeochemical characteristics of surface water and groundwater in the karst basin, southwest China. Hydrol. Process. 2009, 23, 2012–2022. [Google Scholar] [CrossRef]
- Liu, F.; Parmenter, R.; Brooks, P.D.; Conklin, M.H.; Bales, R.C. Seasonal and interannual variation of streamflow pathways and biogeochemical implications in semi-arid, forested catchments in Valles Caldera, New Mexico. Ecohydrology 2008, 1, 239–252. [Google Scholar] [CrossRef]
- Ohlanders, N.; Rodriguez, M.; McPhee, J. Stable water isotope variation in a Central Andean watershed dominated by glacier and snowmelt. Hydrol. Earth Syst. Sci. 2013, 17, 1035–1050. [Google Scholar] [CrossRef]
- Turner, K.W.; Wolfe, B.B.; Edwards, T.W.D. Characterizing the role of hydrological processes on lake water balances in the old Crow Flats, Yukon Territory, Canada, using water isotope tracers. J. Hydrol. 2010, 386, 103–117. [Google Scholar] [CrossRef]
- Long, A.J. Hydrograph separation for karst watersheds using a two-domain rainfall-discharge model. J. Hydrol. 2009, 364, 249–256. [Google Scholar] [CrossRef]
- Longinelli, A.; Stenni, B.; Genoni, L.; Flora, O.; Defrancesco, C.; Pellegrini, G. A stable isotope study of the Garda Lake, northern Italy: Its hydrological balance. J. Hydrol. 2008, 360, 103–116. [Google Scholar] [CrossRef]
- Dutton, A.; Wilkinson, B.H.; Welker, J.M.; Bowen, G.J.; Lohmann, K.C. Spatial distribution and seasonal variation in 18O/16O of modern precipitation and river water across the conterminous USA. Hydrol. Process. 2005, 19, 4121–4146. [Google Scholar] [CrossRef]
- Caley, T.; Roche, D.M. δ18O water isotope in the iLOVECLIM model (version 1.0)—Part 3: A paleo-perspective based on present-day data-model comparison for oxygen stable isotopes in carbonates. Geosci. Model Dev. 2013, 6, 1505–1516. [Google Scholar] [CrossRef]
- Barbieri, M.; Battistel, M.; Boschetti, T. Chemical and isotope monitoring at Lake Albano (central Italy): Water-rock interaction and climate change effects. Procedia Earth Planet. Sci. 2013, 7, 53–56. [Google Scholar] [CrossRef]
- MacKinnon, G.; MacKenzie, A.B.; Cook, G.T.; Pulford, I.D.; Duncan, H.J.; Scott, E.M. Spatial and temporal variations in Pb concentrations and isotopic composition in road dust, farmland soil and vegetation in proximity to roads since cessation of use of leaded petrol in the UK. Sci. Total Environ. 2011, 409, 5010–5019. [Google Scholar] [CrossRef] [PubMed]
- Mul, M.L.; Savenije, H.H.G.; Uhlenbrook, S. Spatial rainfall variability and runoff response during an extreme event in a semi-arid catchment in the South Pare Mountains, Tanzania. Hydrol. Earth Syst. Sci. Discuss. 2009, 13, 1659–1670. [Google Scholar] [CrossRef]
- Liu, Y.H.; Fan, N.J.; Yang, H.B.; An, S.Q.; Wang, Z.S.; Wu, C.; Zhan, J.H.; Liu, S.R.; Cheng, W.L. Spatial and temporal variation of runoff and contributions of different water sources in the alpine valley. J. Nanjing For. Univ. 2007, 31, 23–26. [Google Scholar]
- Harvey, F.E.; Welker, J.M. Stable isotopic composition of precipitation in the semi-arid north-central portion of the US Great Plains. J. Hydrol. 2000, 238, 90–109. [Google Scholar] [CrossRef]
- Singh, B.P. Isotopic composition of water in precipitation in a region or place. Appl. Radiat. Isot. 2013, 75, 22–25. [Google Scholar] [CrossRef] [PubMed]
- Carucci, V.; Petitta, M.; Aravena, R. Interaction between shallow and deep aquifers in the Tivoli Plain (Central Italy) enhanced by groundwater extraction: A multi-isotope approach and geochemical modeling. Appl. Geochem. 2012, 27, 266–280. [Google Scholar] [CrossRef]
- Engström, E.; Rodushkin, I.; Ingri, J.; Baxter, D.C.; Ecke, F.; Österlund, H.; Öhlander, B. Temporal isotopic variations of dissolved silicon in a pristine boreal river. Chem. Geol. 2010, 271, 142–152. [Google Scholar] [CrossRef]
- Iqbal, M.Z. Short-term variability in isotopic composition of precipitation: A case study from the Midwestern United States. Hydrol. Process. 2008, 22, 4609–4619. [Google Scholar] [CrossRef]
- Yoshimura, K.; Oki, T.; Ohte, N.; Kanae, S. A quantitative analysis of short-term 18O variability with a Rayleigh-type isotope circulation model. J. Geophys. Res. 2003, 108. [Google Scholar] [CrossRef]
- Takao, O.; Kunihiko, S.; Kazuki, U. Oxygen and hydrogen isotopic preference in hydration spheres of Magnesium and Calcium Ions. Z. Naturforsch. 2013, 68, 362–370. [Google Scholar]
- Kurita, N.; Noone, D.; Risi, C.; Schmidt, G.A.; Yamada, H.; Yoneyama, K. Intraseasonal isotopic variation associated with the Madden-Julian Oscillation. J. Geophys. Res. 2011, 116. [Google Scholar] [CrossRef]
- Rashid, U.; Ahmed, I.; Alam, F.; Mohammad, M.K. Hydrochemical characteristics and seasonal variations in groundwater quality of an alluvial aquifer in parts of Central Ganga Plain, Western Uttar Pradesh, India. Environ. Geol. 2009, 58, 1295–1300. [Google Scholar]
- Yao, Z.J.; Liu, J.; Huang, H.Q.; Song, X.F.; Dong, X.H.; Liu, X. Characteristics of isotope in precipitation, river water and lake water in the Manasarovar basin of Qinghai–Tibet Plateau. Environ. Geol. 2009, 57, 551–556. [Google Scholar] [CrossRef]
- Ogrinc, N.; Kanduc, T.; Stichler, W.; Vreca, P. Spatial and seasonal variations in δ18O and δD values in the River Sava in Slovenia. J. Hydrol. 2008, 359, 303–312. [Google Scholar] [CrossRef]
- Yamanaka, T.; Tsujimura, M.; Oyunbaatar, D.; Davaa, G. Isotopic variation of precipitation over eastern Mongolia and its implication for the atmospheric water cycle. J. Hydrol. 2007, 333, 21–34. [Google Scholar] [CrossRef]
- Weyhenmeyer, C.E.; Burns, S.J.; Waber, H.N. Isotope study of moisture sources, recharge areas, and groundwater flow paths within the eastern Batinah coastal plain, Sultanate of Oman. Water Resour. Res. 2002, 38, 1184–1206. [Google Scholar] [CrossRef]
- Lee, K.S.; Wenner, D.B.; Lee, I. Using H-and O-isotopic data for estimating the relative contributions of rainy and dry season precipitation to groundwater: Example from Cheju Island, Korea. J. Hydrol. 1999, 222, 65–74. [Google Scholar] [CrossRef]
- Yang, Y.G.; Xiao, H.L.; Wei, Y.P.; Zhao, L.J.; Zou, S.B.; Yin, Z.L.; Yang, Q. Hydrologic processes in the different landscape zones of Mafengou River basin in the alpine cold region during the melting period. J. Hydrol. 2011, 409, 149–156. [Google Scholar] [CrossRef]
- Nie, Z.L. Ental isotopes as tracers of hydrologic cycle in the recharge of the Heihe River. Geogr. Inf. Sci. 2005, 21, 104–108. [Google Scholar]
- Zhu, G.F.; Su, Y.H.; Feng, Q. The hydrochemical characteristics and evolution of groundwater and surface water in the Heihe River Basin, northwest China. Hydrol. J. 2008, 16, 167–182. [Google Scholar] [CrossRef]
- Feng, Q.; Liu, W.; Su, Y.H.; Zhang, Y.W.; Si, J.H. Distribution and evolution of water chemistry in Heihe River basin. Environ. Geol. 2004, 45, 947–956. [Google Scholar] [CrossRef]
- Appelo, C.A.J. Geochemical experimentation and modeling are tools for understanding the origin of as in groundwater in Bangladesh and elsewhere. In Arsenic in Groundwater—A World Problem; NNC-IAH Pub.: Utrecht, The Netherlands, 2008; Volume 5, pp. 33–50. [Google Scholar]
- Appelo, C.A.J.; Van Loon, L.R.; Wersin, P. Multicomponent diffusion of a suite of tracers (HTO, Cl, Br, I, Na, Sr, Cs) in a single sample of Opalinus Clay. Geochim. Cosmochim. Acta 2010, 74, 1201–1219. [Google Scholar] [CrossRef]
- Etzel, T.M.; Bowman, J.R.; McCulloch, J.M.; Moore, J.N.; Spicuzza, M.J.; Valley, J.W. Oxygen isotopic evidence of water-rock interactions in the Coso geothermal system. In Proceedings of the 38th Workshop on Geothermal Reservoir Engineering, Stanford University, Stanford, CA, USA, 11–13 February 2013. [Google Scholar]
- Merlivat, L.; Jouzel, J. Global climatic interpretation of the deuterium-oxygen 18 relationship for precipitation. Geophys. Res. 1979, 84, 5029–5033. [Google Scholar] [CrossRef]
- Gat, J.R. Oxygen and hydrogen isotopes in the hydrologic cycle. Annu. Rev. Earth Planet. Sci. 1996, 24, 225–262. [Google Scholar] [CrossRef]
Figure 1.
Location of the sampling sites in the study area.

Figure 2.
Altitude effects of oxygen δ18O for various waterbodies in different landscape zones in the wet and dry season.
Figure 2.
Altitude effects of oxygen δ18O for various waterbodies in different landscape zones in the wet and dry season.

Figure 3.
Plot of deuterium δD versus δ18O for the various samples in the wet and dry season.
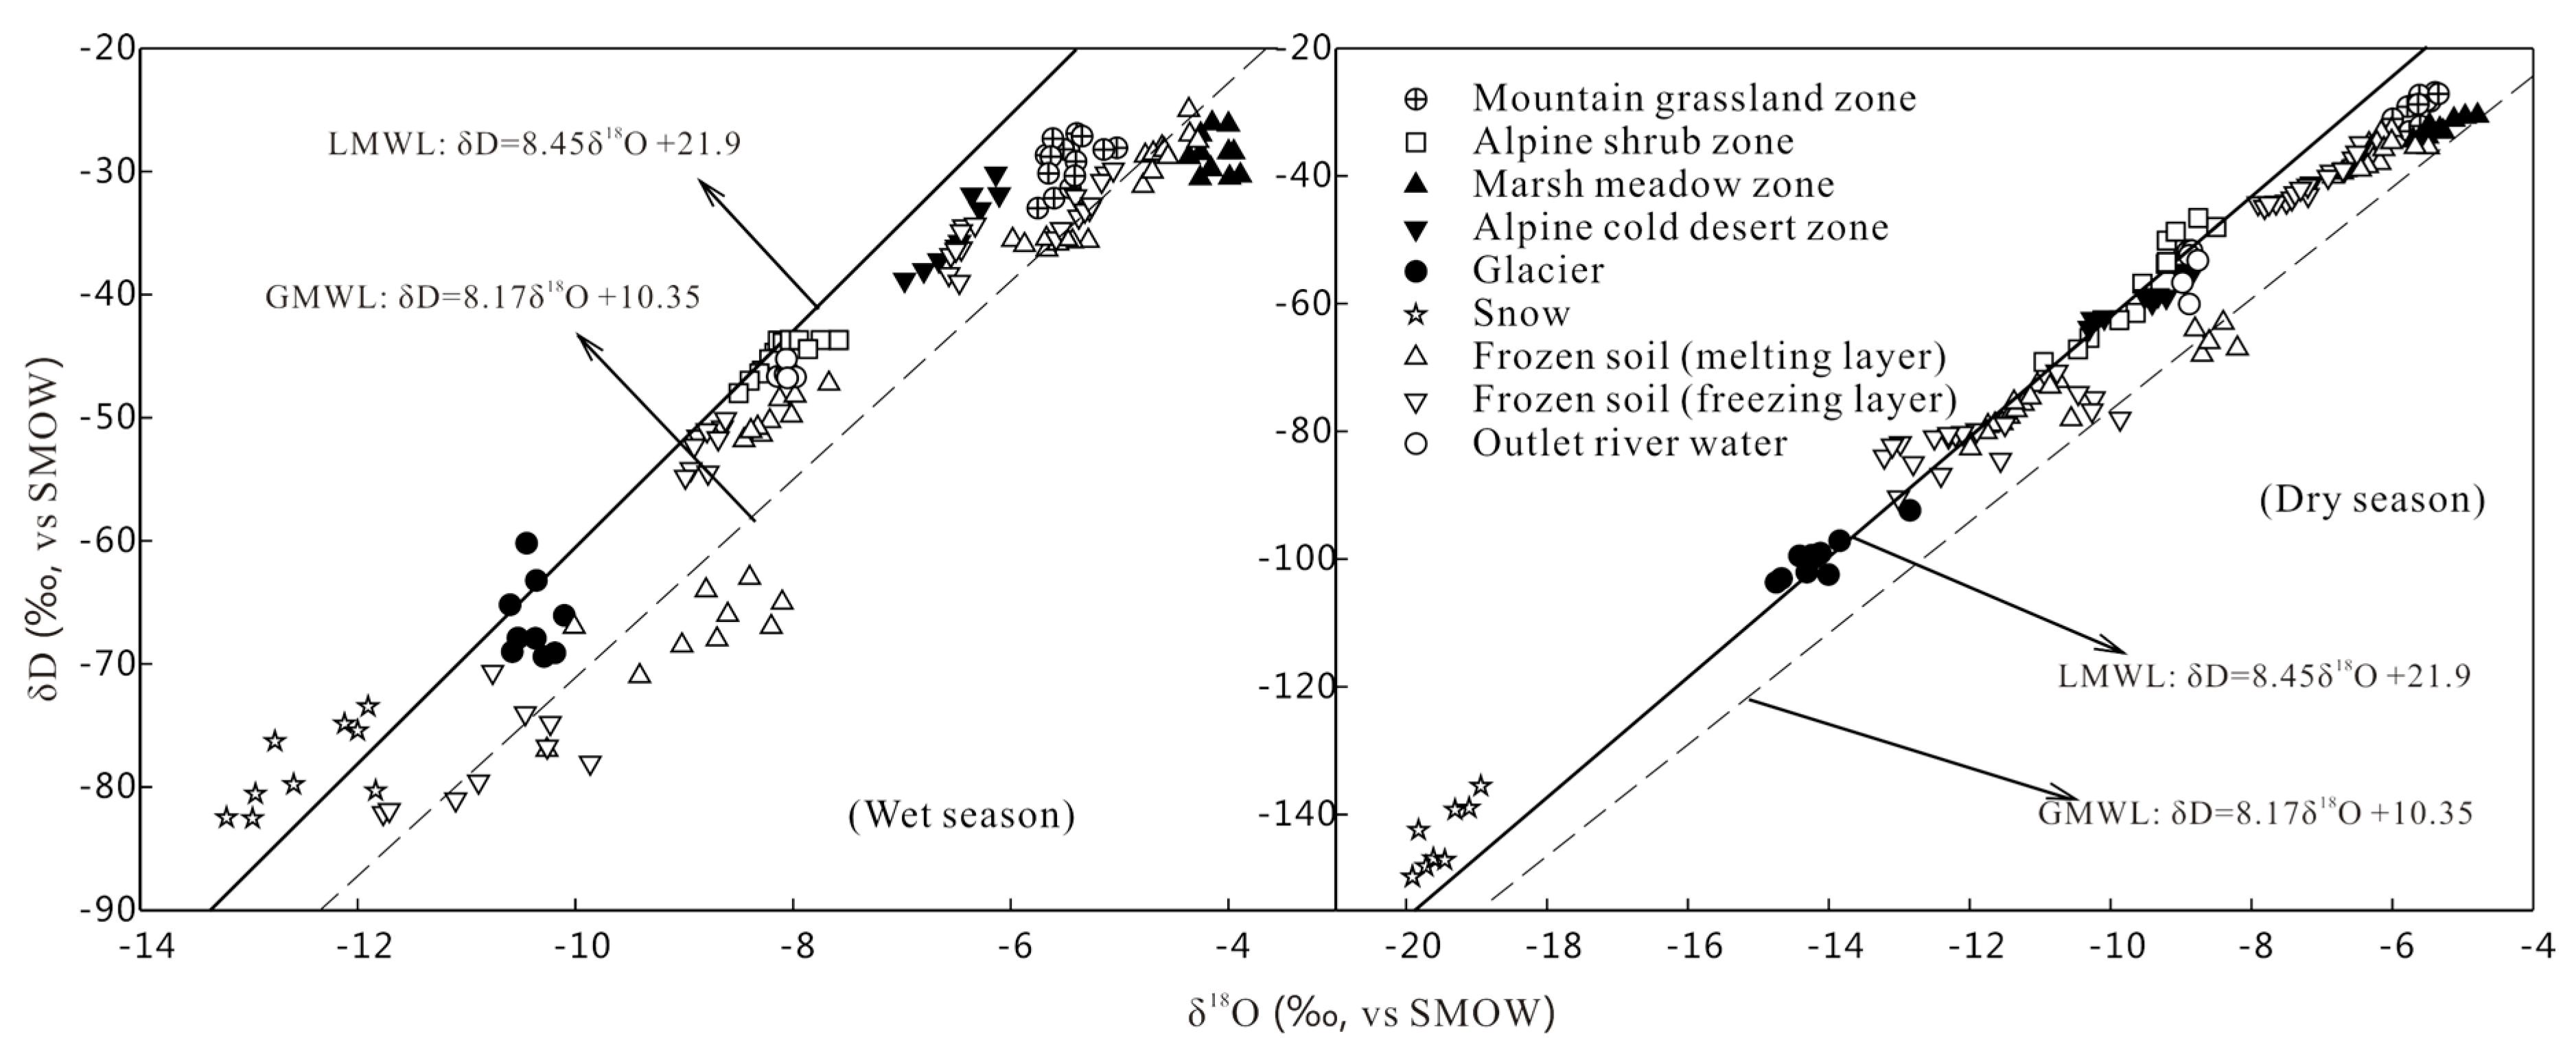
Figure 4.
Spatial variation in d-excess (deuterium excess) of various samples in the different landscape zones.
Figure 4.
Spatial variation in d-excess (deuterium excess) of various samples in the different landscape zones.
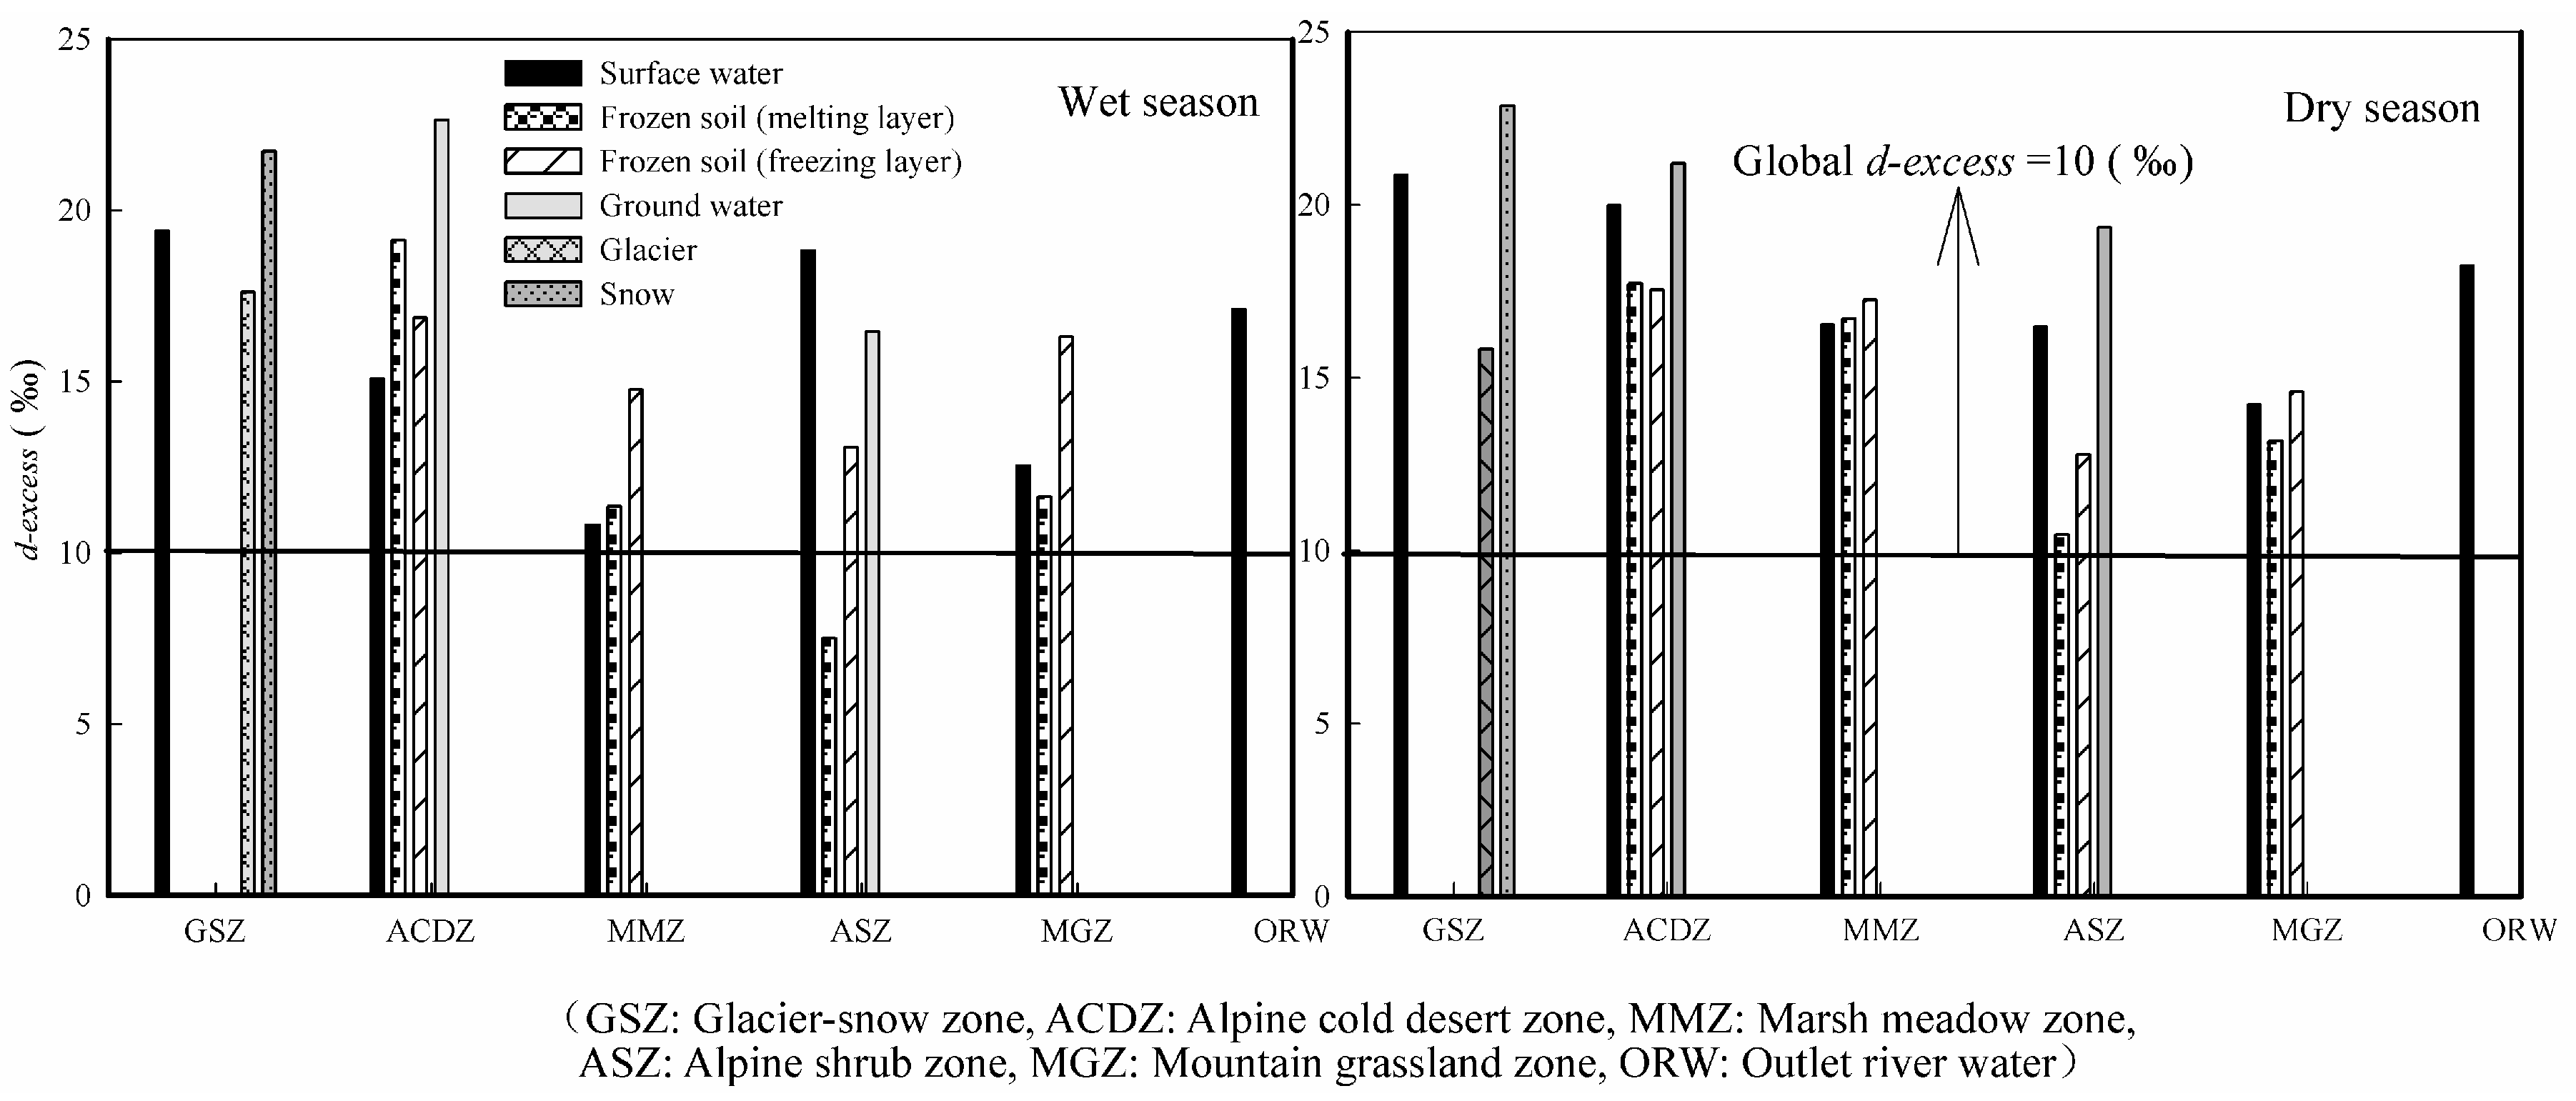
Figure 5.
Mixing diagram using 18O and d in the wet and dry season.
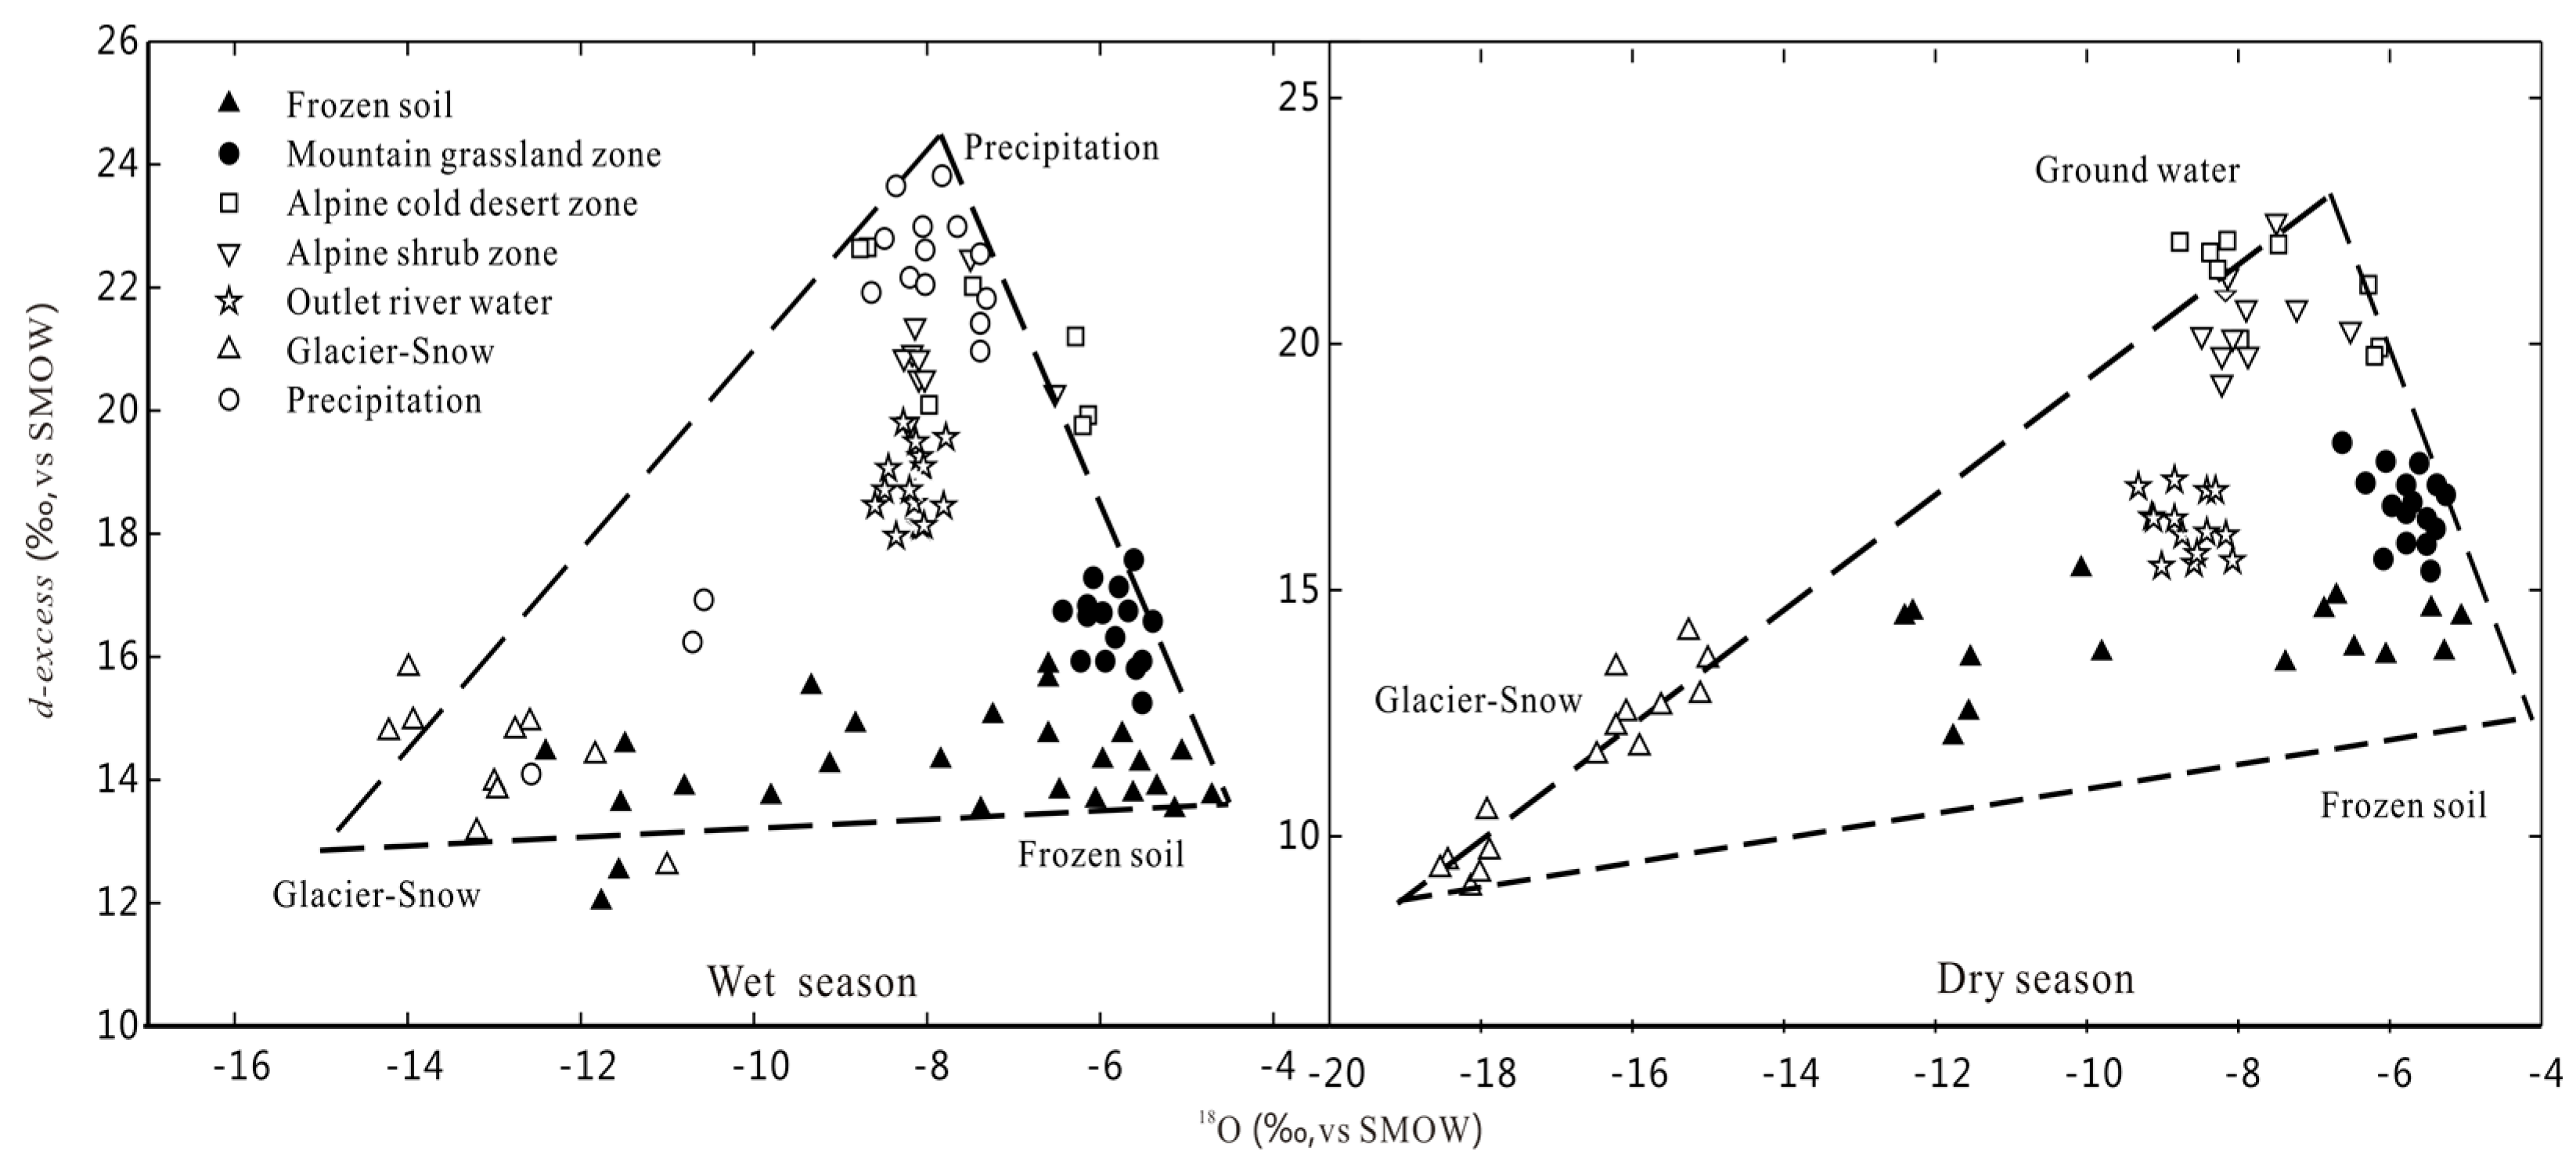
Figure 6.
The contributions of each end member to the runoff in the wet and dry season.


Table 1.
Saturation indices on water samples from the aquifers in the study area.
| Sampling Site | Location Area | SI(anhydrite) | SI(aragonite) | SI(calcite) | CO2(g) | SI(dolomite) | SI(fluorite) | SI(gypsum) | SI(salt) |
|---|---|---|---|---|---|---|---|---|---|
| G-09-06 | Glacier snow | −3.57 | −0.81 | −0.66 | −1.82 | −1.89 | −3.84 | −3.35 | −11.00 |
| C-09-1 | Alpine cold desert | −2.96 | −1.11 | −0.97 | −1.92 | −1.95 | −3.90 | −2.74 | −10.47 |
| S-09-1 | Alpine shrub | −2.96 | 0.31 | 0.47 | −3.93 | 0.55 | −3.56 | −2.70 | −10.48 |
| SP-09-6 | Spring lower | −1.94 | 0.70 | 0.86 | −3.42 | 1.47 | −3.08 | −1.69 | −9.07 |
Table 2.
Calculated results of mass transfer along different flow paths in the study area.
| Flow Path | Anhydrite | Aragonite | Calcite | Dolomite | Fluorite | Gypsum | Salt |
|---|---|---|---|---|---|---|---|
| G-09-06→S-09-1 | 2.281 × 10⁻⁵ | 2.165 × 10⁻⁴ | 3.646 × 10⁻⁵ | 1.375 × 10⁻⁵ | |||
| G-09-06→C-09-1 | 8.116 × 10⁻⁵ | −3.574 × 10⁻⁴ | 3.506 × 10⁻⁴ | 9.243 × 10⁻⁵ | 7.936 × 10⁻⁶ | ||
| C-09-1→S-09-1 | 3.297 × 10⁻⁴ | 6.359 × 10⁻⁷ | 9.089 × 10⁻⁶ |
Table 3.
Result of the isotopic analysis for various samples in the wet and dry season in the study area.
Table 3.
Result of the isotopic analysis for various samples in the wet and dry season in the study area.
| Landscape Zones | Samples Type | NO (420) | Wet Season | Dry Season | ||
|---|---|---|---|---|---|---|
| δ18O (‰) | δD (‰) | δ18O (‰) | δD (‰) | |||
| Glacier snow | Surface water | 36 | −9.69 ± 0.73 | −67.03 ± 4.6 | −16.03 ± 0.8 | −78.14 ± 1.11 |
| Glacier | 20 | −12.82 ± 0.51 | −82.34 ± 3.1 | −17.30 ± 1.02 | −99.34 ± 3.3 | |
| Snow | 20 | −17.13 ± 1.21 | −107.3 ± 2.86 | −19.60 ± 1.62 | −113.42 ± 8.5 | |
| Alpine cold desert | Surface water | 36 | −7.20 ± 1.2 | −39.86 ± 5.2 | −9.47 ± 1.8 | −57.56 ± 3.7 |
| Groundwater | 24 | −11.95 ± 0.18 | −80.23 ± 2.8 | −12.15 ± 0.23 | −81.64 ± 1.9 | |
| Frozen soil (surface) | 24 | −10.45 ± 2.2 | −72.82 ± 2.1 | −11.36 ± 1.74 | −76.12 ± 1.2 | |
| Frozen soil (deep) | 24 | −11.64 ± 0.42 | −80.71 ± 2.3 | −11.43 ± 0.74 | −80.19 ± 2.4 | |
| Marsh meadow | Surface water | 36 | −4.75 ± 0.21 | −30.37 ± 1.4 | −6.82 ± 0.21 | −32.44 ± 2.16 |
| Frozen soil (surface) | 24 | −4.96 ± 0.41 | −31.56 ± 1.3 | −6.71 ± 0.34 | −36.71 ± 0.21 | |
| Frozen soil (deep) | 24 | −5.38 ± 1.2 | −33.68 ± 0.4 | −7.49 ± 0.67 | −43.07 ± 1.3 | |
| Alpine shrub | Surface water | 32 | −6.84 ± 0.32 | −35.62 ± 0.8 | −7.83 ± 0.24 | −37.89 ± 2.46 |
| Groundwater | 36 | −8.19 ± 0.56 | −44.23 ± 1.3 | −9.47 ± 0.47 | 60.58 ± 1.12 | |
| Alpine grassland | Surface water | 36 | −5.54 ± 0.11 | −27.33 ± 0.7 | −6.39 ± 0.21 | −30.17 ± 1.82 |
| Frozen soil (surface) | 24 | −6.02 ± 0.81 | −34.53 ± 2.2 | −6.47 ± 0.23 | −37.67 ± 1.11 | |
| Frozen soil (deep) | 24 | −7.80 ± 0.84 | −44.43 ± 0.9 | −7.91 ± 0.11 | −39.25 ± 1.73 | |
© 2017 by the authors. Licensee MDPI, Basel, Switzerland. This article is an open access article distributed under the terms and conditions of the Creative Commons Attribution (CC BY) license (http://creativecommons.org/licenses/by/4.0/).
Share and Cite
MDPI and ACS Style
Yang, Y.; Li, B. Temporal and Spatial Variations of Hydrological Processes on the Landscape Zone Scale in an Alpine Cold Region (Mafengou River Basin, China): An Update. Water 2017, 9, 574. https://doi.org/10.3390/w9080574
AMA Style
Yang Y, Li B. Temporal and Spatial Variations of Hydrological Processes on the Landscape Zone Scale in an Alpine Cold Region (Mafengou River Basin, China): An Update. Water. 2017; 9(8):574. https://doi.org/10.3390/w9080574
Chicago/Turabian StyleYang, Yonggang, and Bin Li. 2017. "Temporal and Spatial Variations of Hydrological Processes on the Landscape Zone Scale in an Alpine Cold Region (Mafengou River Basin, China): An Update" Water 9, no. 8: 574. https://doi.org/10.3390/w9080574
Note that from the first issue of 2016, this journal uses article numbers instead of page numbers. See further details here.