Carbon Dioxide Reduction Targets of Hot Water Showers for People in Hong Kong


Department of Building Services Engineering, The Hong Kong Polytechnic University, Hong Kong, China
*
Author to whom correspondence should be addressed.
Water 2017, 9(8), 576; https://doi.org/10.3390/w9080576
Submission received: 19 June 2017
/
Revised: 24 July 2017
/
Accepted: 31 July 2017
/
Published: 2 August 2017
(This article belongs to the Special Issue Water Supply and Drainage for Sustainable Built Environment)
Abstract
:Improving water and energy efficiency in buildings is one of the best ways to reduce greenhouse gas emissions. This study examines various energy-related carbon dioxide (CO2) reduction measures, including the use of water efficient showerheads and shower drain water heat recovery, in order to distinguish the significance of user influence on the water usage of a shower. The probability of taking a hot shower and the number of showers taken by an occupant per day, which can be evaluated from open literature data, are used as the parameters of user responses to water conservation measures in this study. A Monte Carlo model of water consumption and CO2 reduction for showering is adopted to determine the contributions of user responses. The results demonstrate that the influence of users on CO2 reduction is significant and compatible to the influence of water efficient showerheads. This study can be used as a reference to enhance water and energy incentives and to facilitate continuous improvement in building water systems.
1. Introduction
Scientific understanding of global warming is increasing [1]. Climate model projections indicated that, during the 21st century, the global surface temperature is likely to rise further by 0.3 to 1.7 °C in the best case scenario and 2.6 to 4.8 °C in the worst case scenario [1]. The Paris Agreement adopted under the United Nations Framework Convention on Climate Change (UNFCCC) established a global framework for reducing carbon dioxide (CO2) emissions and noted that global warming should be limited to 1.5 °C [2]. Studies have quantified the carbon reduction potential due to a reduction of potable water usage [3]. In the U.S., the CO2 embedded in the nation’s water represents 5% of all U.S. carbon emissions [4]. In Japan, residential water supply systems account for 5% of total CO2 emissions and about 60% of those emissions are from hot water bathing [5]. In Australia, a study showed that the average energy consumption from hot showers ranged between 2.9 and 4.5 GJ ps−1 yr−1, corresponding to CO2 emissions ranging between 160 and 245 kg CO2 ps−1 yr−1 [6]. In Hong Kong, over 40% of domestic water consumption is used for showers for bathing [7], while about 19% of residential energy consumption in 2013 was used to provide hot water for showers and baths [8].
The urban water cycle can reduce its carbon footprint in various ways; three key initiatives are: (1) better water delivery system designs, (2) water efficiency improvements, and (3) water conservation programmes [9].
Better water delivery system designs, such as employing energy efficient pumps and adopting effective maintenance and replacement schedules, are proven to reduce energy use and thus CO2 emissions [10,11]. A study reported that energy consumed by many existing high-rise water supply systems could be reduced by up to 50% via water storage tank relocations [12].
Some water appliances (e.g., low flow showerheads) consume lower amounts of water and hence require less energy for water pumping and end-use heating [3,5,13,14]. Reportedly, the total CO2 emissions in Japan could be reduced by 1% due to the use of water saving equipment [15]. In Vietnam, the reduction potential was estimated to be 8% of total CO2 emissions. The reduction potential is more significant in developing areas, as a water supply system is a major energy consumer. In Hong Kong, it was reported that the full implementation of Water Efficiency Labelling Scheme (WELS) rated showerheads could reduce 26% of CO2 emissions from showers and baths [16]. Moreover, as waste heat from hot water bathing can be recovered from the drainage pipes, efficient drain water heat recovery can achieve energy savings of up to 15% for apartment washrooms [17,18].
Shower usage patterns play a significant role in water and energy conservation [19]. A monitoring project performed in a hot climate found that hot water consumption increased by 15–20% from summer to winter due to human uses [20]. This study identifies the significance of user influence on the water usage of a shower in order that water and energy incentives can be enhanced and public education on water conservation can be facilitated.
2. Methodology
2.1. Quantification for User Influence
The probability of taking a hot shower Psh and the number of showers taken by an occupant per day Ns,j are the parameters of user responses to water conservation measures in this study. It is noted that the reduction of Psh resulted in a decrease in energy for water heating, while the reduction of Ns,j resulted in a decrease in energy for both water heating and water supply and treatment.
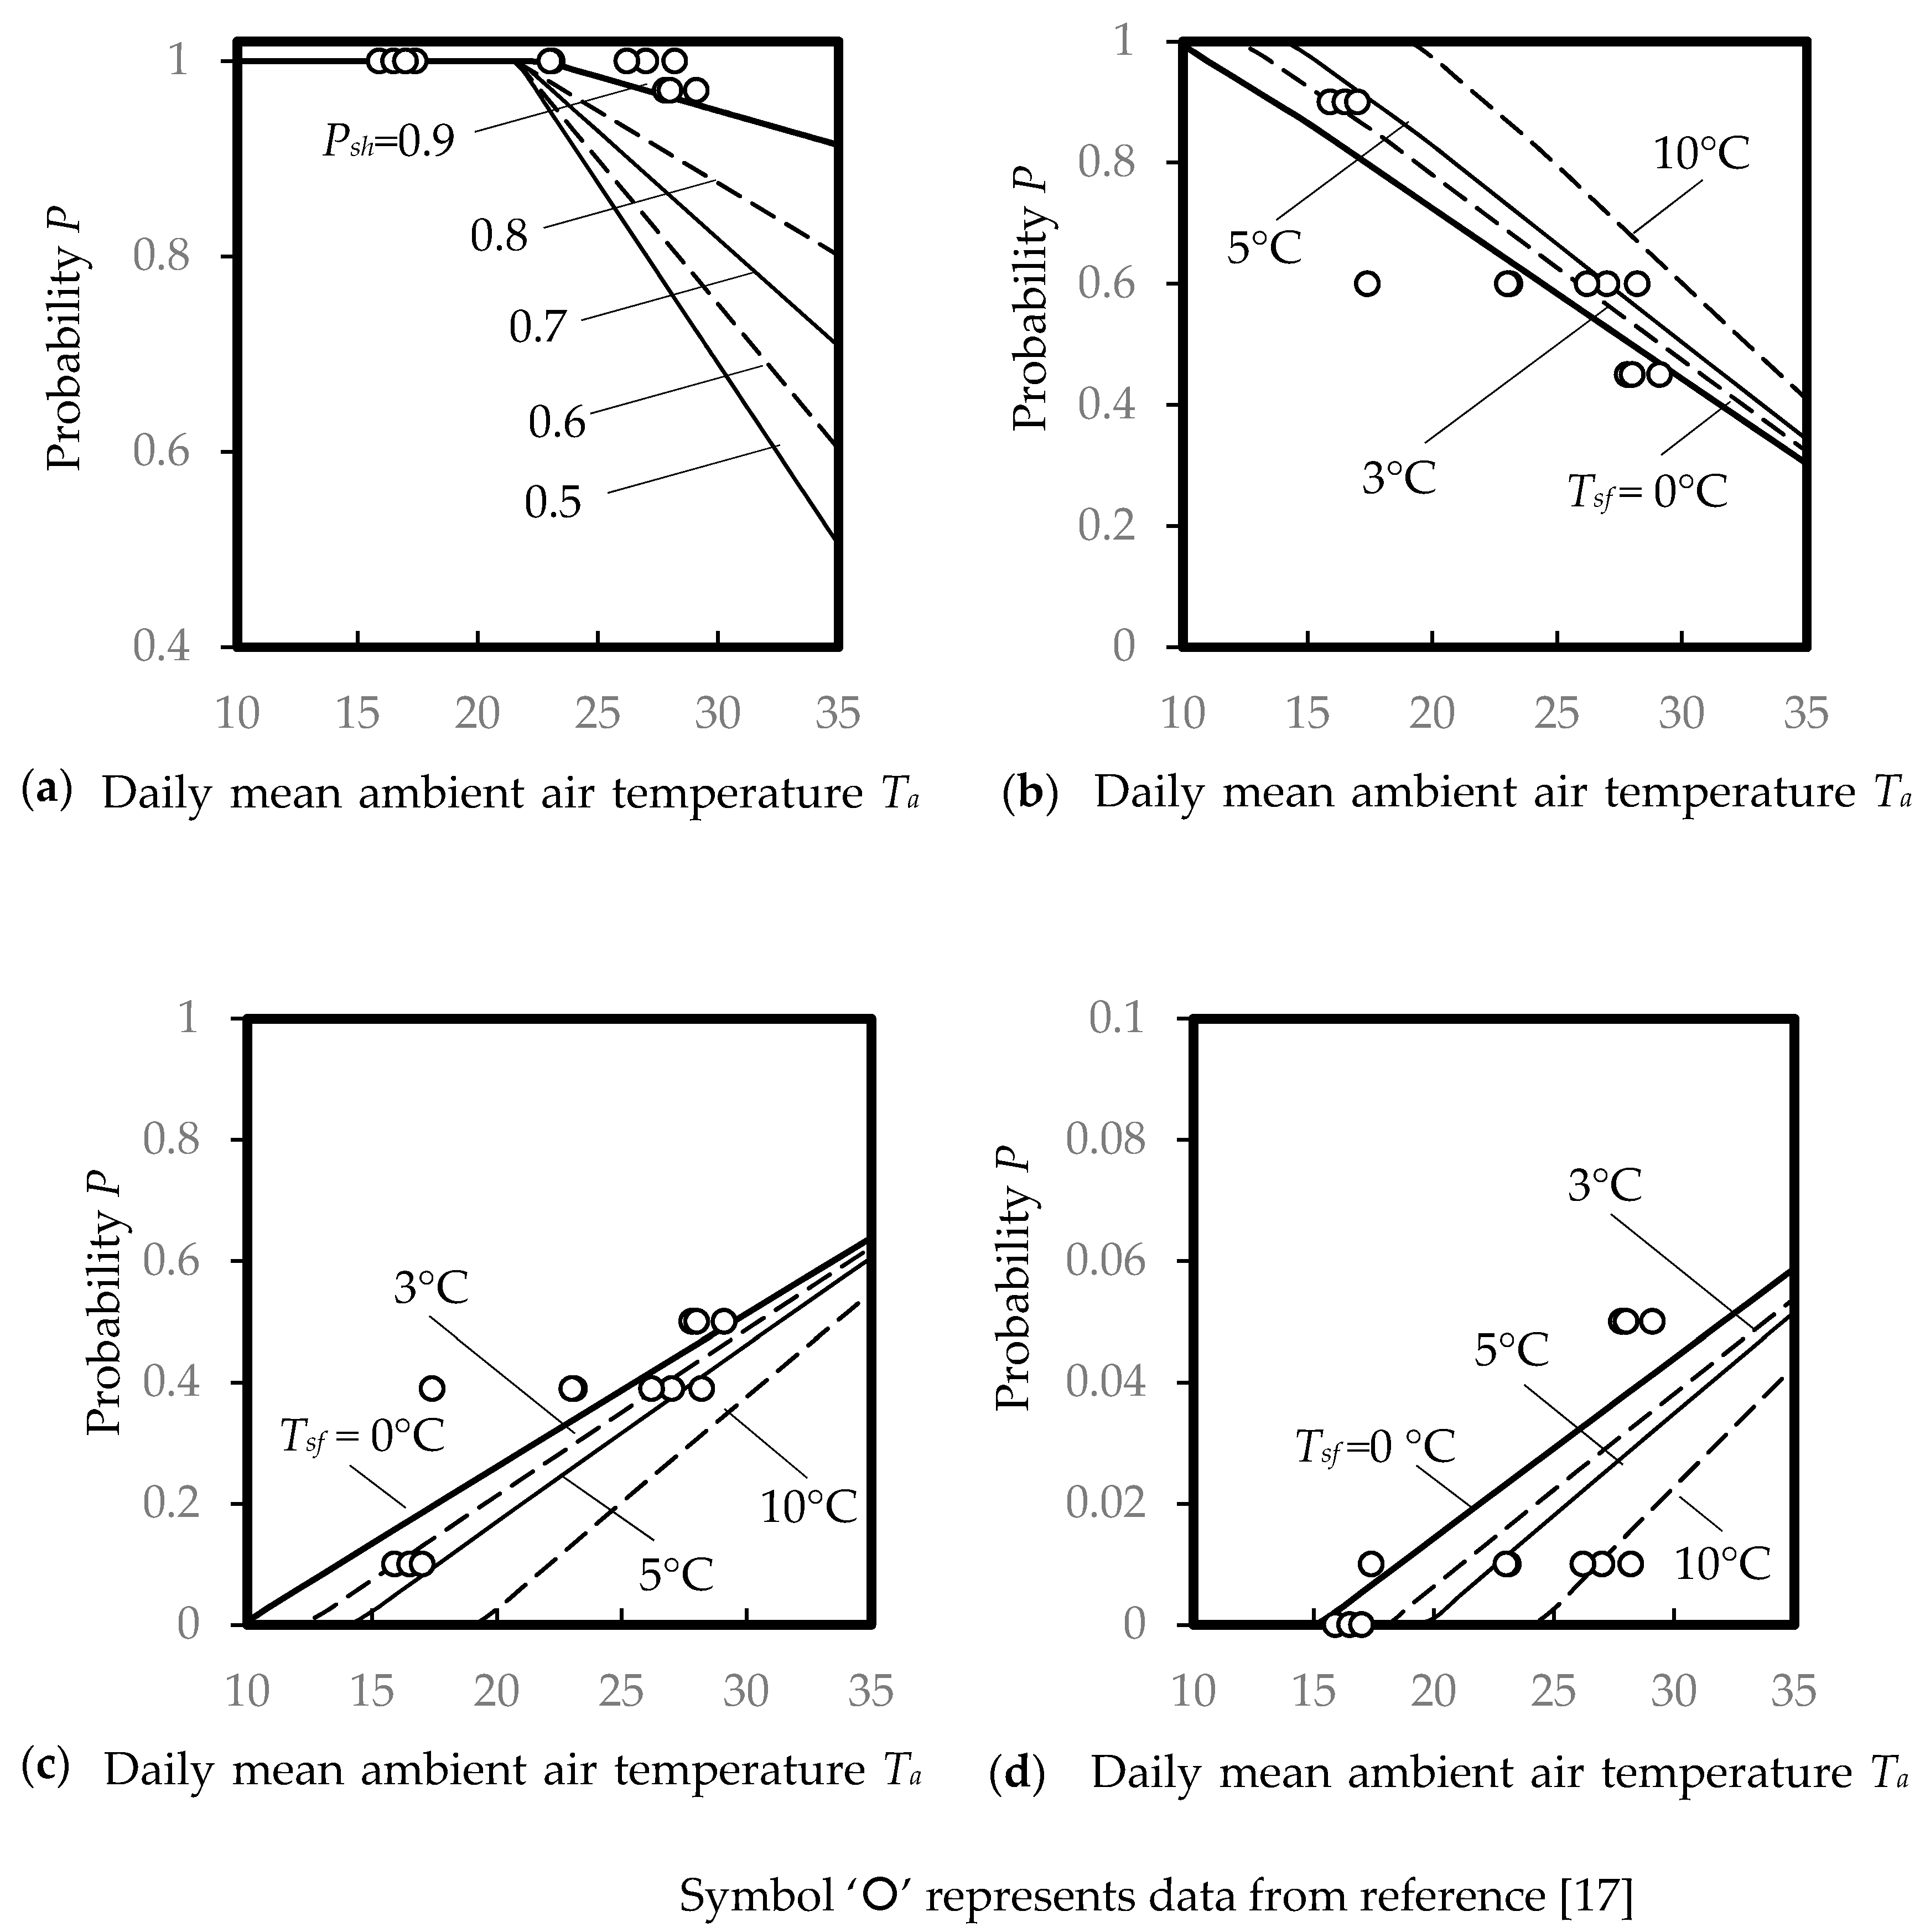
A survey reported that all winter showers and over 90% of summer showers were hot showers [18]. Figure 1a shows the survey ratios Psh of having hot showers against the ambient temperature Ta ≤ 21.5 °C. A linear relationship for fractional Psh,Ta at hypothetical Ta = 35 °C with constants and (Table 1) was assumed.
The energy conserved by an occupant taking fewer hot showers without changing the frequency of showers can be mathematically expressed by Psh (=0.5–0.9) as shown in Figure 1a. All survey data was not less than Psh = 0.9.
According to the survey, all occupants would take at least one shower per day [17]. A total of 597 occupants were interviewed; 269, 289, 37, and 2 of them would take one, two, three, and four showers in the summer while 537, 57, 3, and none of them would take one, two, three, and four showers in the winter respectively. Figure 1b–d illustrate the ratios of an occupant having one to three showers per day (i.e., Ps1 to Ps3) against the mean ambient air temperature Ta (°C). The case averages are also shown (i.e., Tsf = 0 °C). As the correlations of the case averages were insignificant (p > 0.05, t-test), a probabilistic approach was adopted. It was found that more showers were taken in summer than in winter (p < 0.01, t-test). On average, an occupant would take Ns,j = 1.6 (standard deviation (SD) = 0.6) showers on a summer day (June–August) and 1.1 (SD = 0.3) showers on a winter day (December–February), giving an overall average of 1.4 (SD = 0.6) showers per day.
A behavioural response to water conservation is to have fewer daily hot showers. In this study, it is expressed by a temperature shift Tsf (i.e., at an ambient air temperature Ta + Tsf) as shown in Figure 1b–d and determined by Equation (2), where Ta (°C) is the ambient air temperature, i is the number of showers per capita per day, U is a utility function, and and are the constants as presented in Table 1.
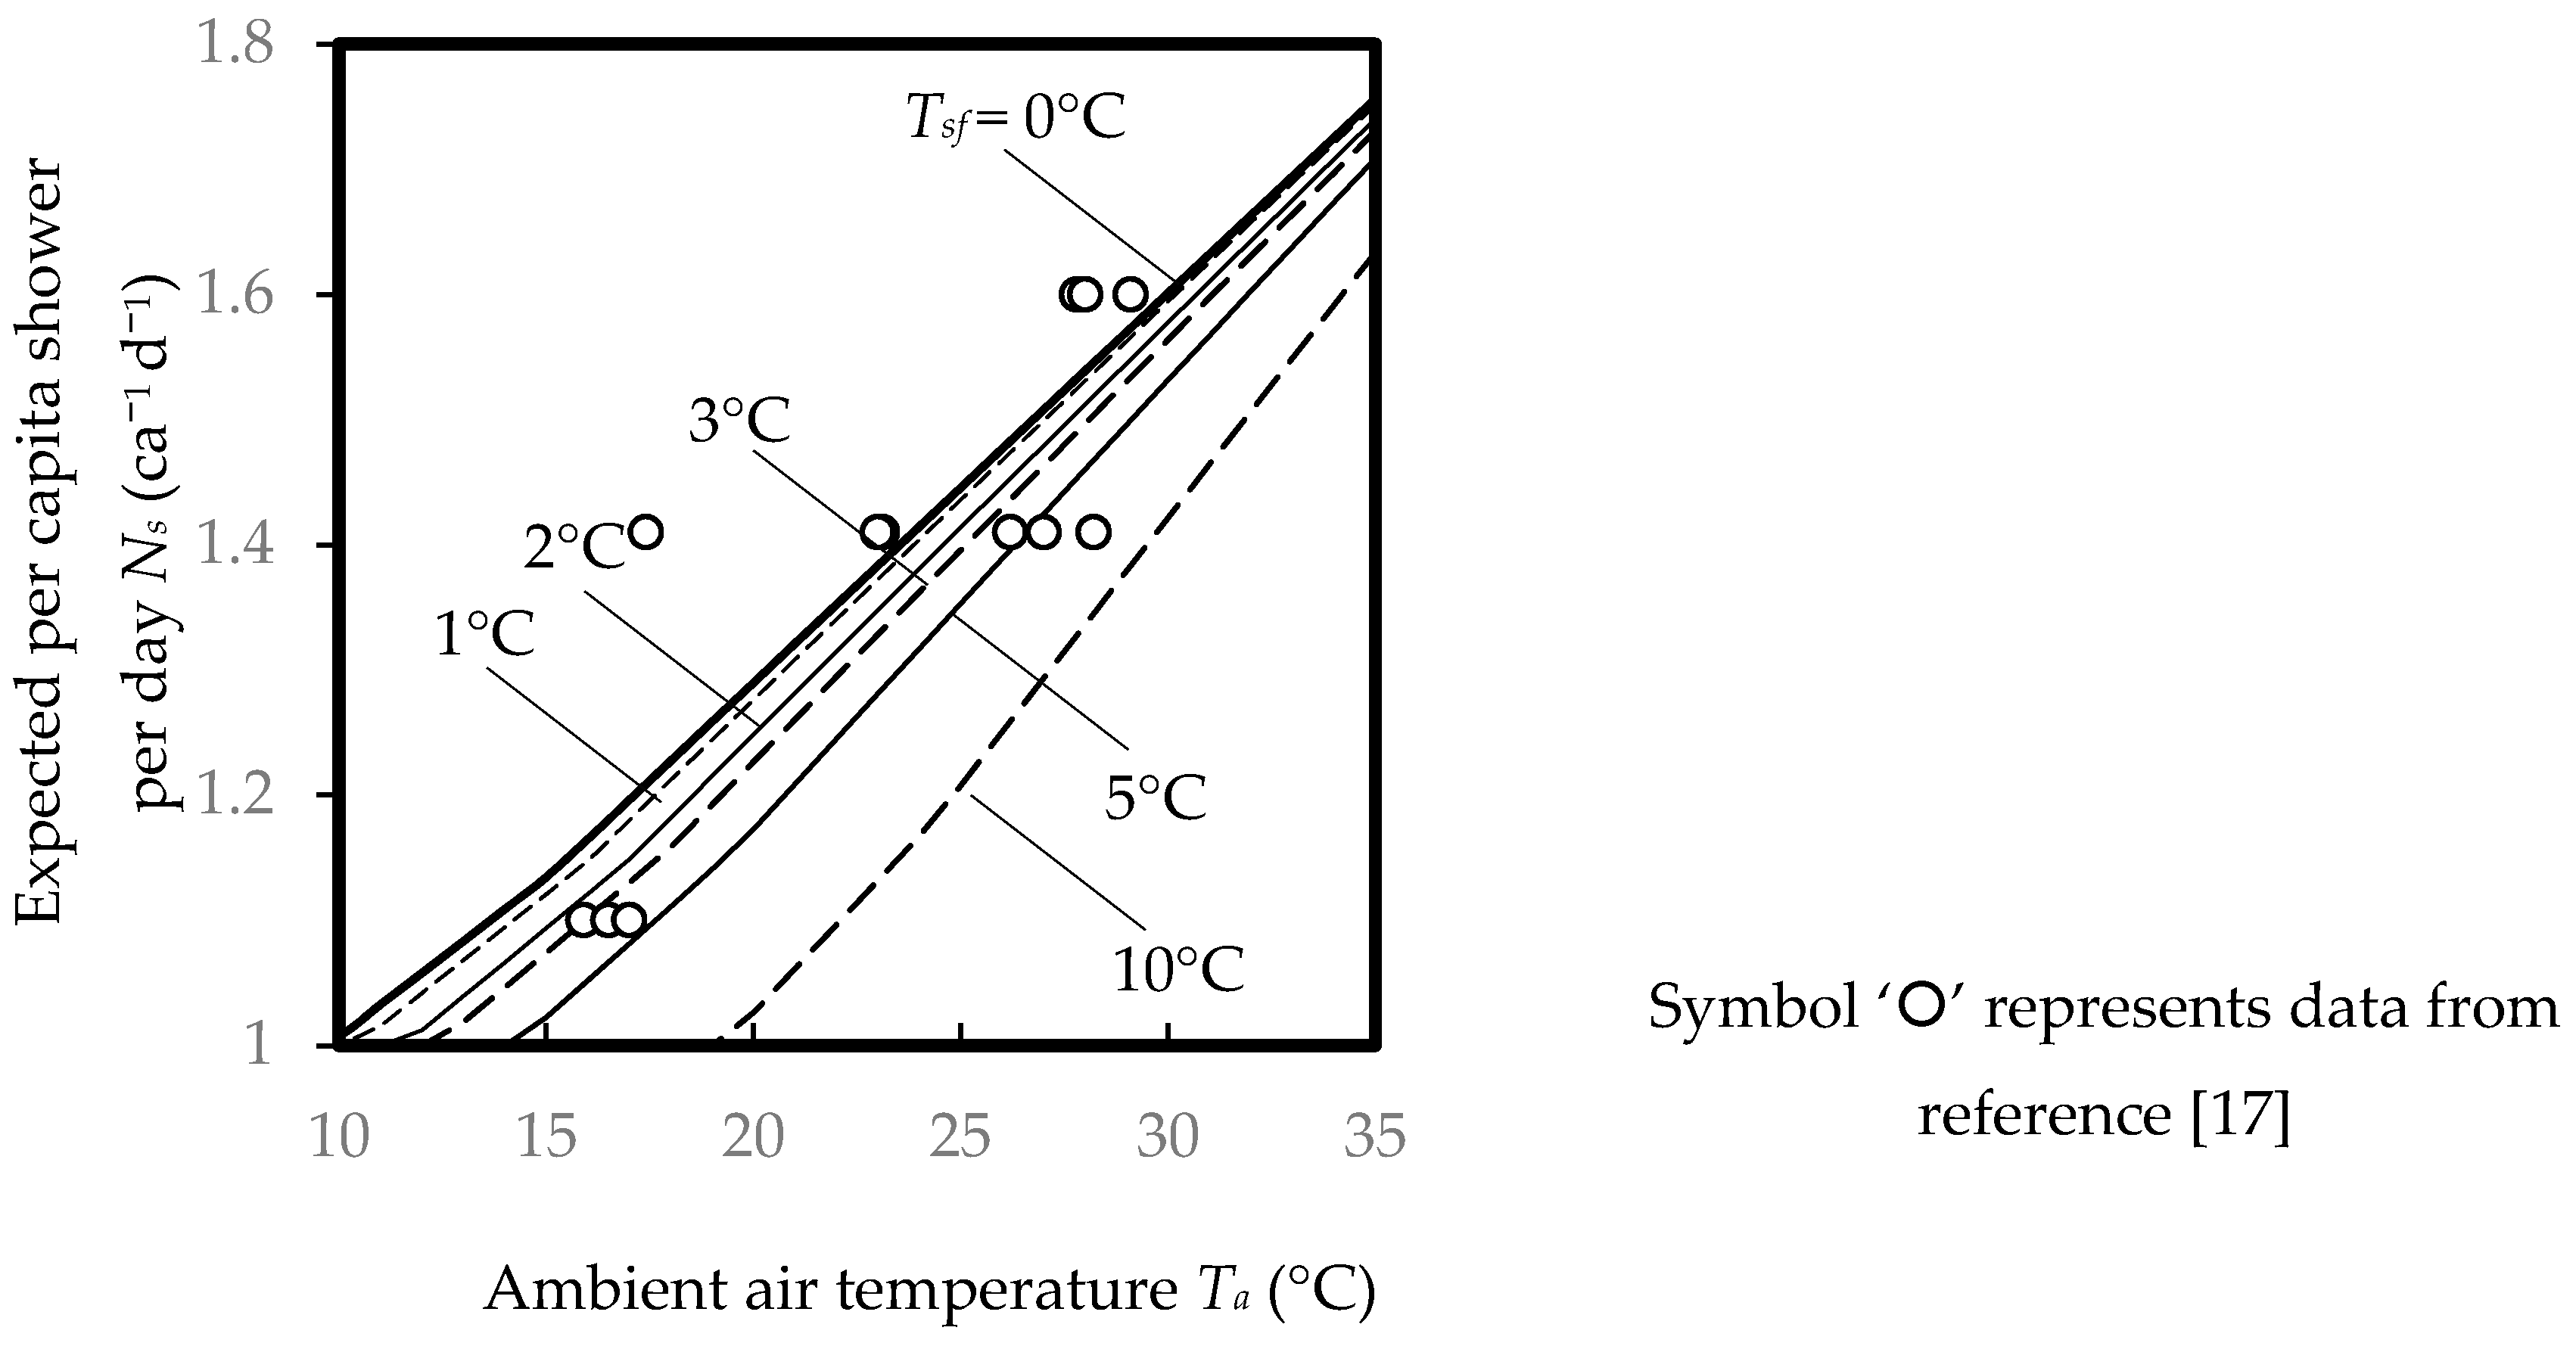
Figure 2 graphs the expected number of showers per occupant per day determined by Equation (3). Averages (i.e., Tsf = 0 °C) from a previous study are also shown for comparison. The figure shows that there is approximately a 1% reduction in the number of showers per day for each 1 °C increment in Tsf.
2.2. Simulations
In this study, simulations were performed to obtain the confidence intervals for water and energy consumption and to determine the CO2 emissions associated with the consumption. Moreover, a Monte Carlo model of water consumption and CO2 reduction for showering was adopted to investigate the influence of a century-scale rise in the average temperature of the Earth’s climate system and its related effects on water consumption and CO2 emissions from showers for bathing [16,19].
Higher ambient air temperatures as a result of climate change have a great impact on shower usage patterns, and thus a significant influence on subsequent energy used and CO2 produced. The ambient air temperatures of Hong Kong in the years 1986–2005 and the projected temperature changes up to year 2100 were used in this study to simulate the scenarios of average ambient air temperature change from +1 to +4 °C [21]. As compared with the average air temperature of 1986–2005, the temperature projection suggested that the ambient air temperature increase by 2100 would be 1.4 to 3.2 °C and 3.1 to 5.5 °C for the Representative Concentration Pathways (RCP) 4.5 and 8.5, respectively.
In the simulations, a uniformly distributed random number x ∈ [0,1] was taken from a random number set generated by the prime modulus multiplicative linear congruential generator, and the input parameters described below (i.e., ζi = {ts,To,Ta,k,Ps,PL,Le}) were sampled from the defined distribution functions. The input value ζi,x of a parameter ζi was then determined from the descriptive distribution function at percentile x.
Per capita annual CO2 emissions Mp (kg-CO2 ps−1 yr−1) from hot showers are linked with water consumption Vp (m3 ps−1 yr−1) and energy consumption Ep (GJ ps−1 yr−1),
where j is a day of a year, ρ (=1000 kg m−3) is the density of water, cp (=4.2 × 10⁻⁶ GJ kg−1 K) is the specific heat capacity of water, α (=0.94 kg-CO2 m−3) and β (200 kg-CO2 GJ−1) are emission factors per unit water consumed and per unit energy consumed respectively, To (°C) is the expected shower water temperature, ts is the expected showerhead operating time, and Ns is the expected number of showers per occupant per day.
The showerhead flow rate v (L min−1), which is subject to user adjustments and limited by the maximum water supply flow rate, is described by:
The user preferred showerhead flow rate v* (L min−1) is given by a cumulative distribution function , and is expressed by a probabilistic user acceptance φ as given in Equation (7), where a probabilistic occupant acceptance range of 0.03–0.97 is within a showerhead flow rate range of 3–18 L min−1 [16]:
The maximum showerhead flow rate vp (L min−1) available from the water supply system is determined by the showerhead water pressure P (kPa) and the showerhead resistance factor k (kPa min2 L−2):
The showerhead water pressure P (kPa) is given by the difference between the static pressure at the showerhead Ps (kPa) (in the design range of 150–350 kPa for typical high-rise water supply systems) and the pressure drop along the water supply pipe PL (kPa),
P = Ps − PL.
It is noted that for WELS rated showerheads with a standard deviation SD = 1.74 kPa min2 L−2 in a resistance factor range of 0.81–9.04 kPa min2 L−2, the average resistance factor k is 3.8 kPa min2 L−2 [16].
In a typical high-rise water supply system, a pipe pressure drop from PL,0 to PL,1 corresponding to a flow rate from v0 to v1 due to the number of showerheads connected can be approximated by Equation (10), where PL/Le = 0.1–0.5 kPa m−1 with an equivalent pipe length range Le = 100–300 m [22,23].
The expected showerhead operating time ts (s) is given by Equation (11), with the assumption of 99% confidence intervals CI99% = 185–1093 s for a lognormal distribution [24],
ts = 496 − 13k.
The cold water temperature Tj (°C) is given by the following expression, where Ta (°C) is the ambient air temperature:
3. Results and Discussion
Based on the 1986–2005 ambient temperature data and the existing shower usage patterns, the simulation results for water consumption, energy consumption, and CO2 emissions are 35.6 m3 ps−1 yr−1, 2.16 GJ ps−1 yr−1, and 465 kg-CO2 ps−1 yr−1, respectively.
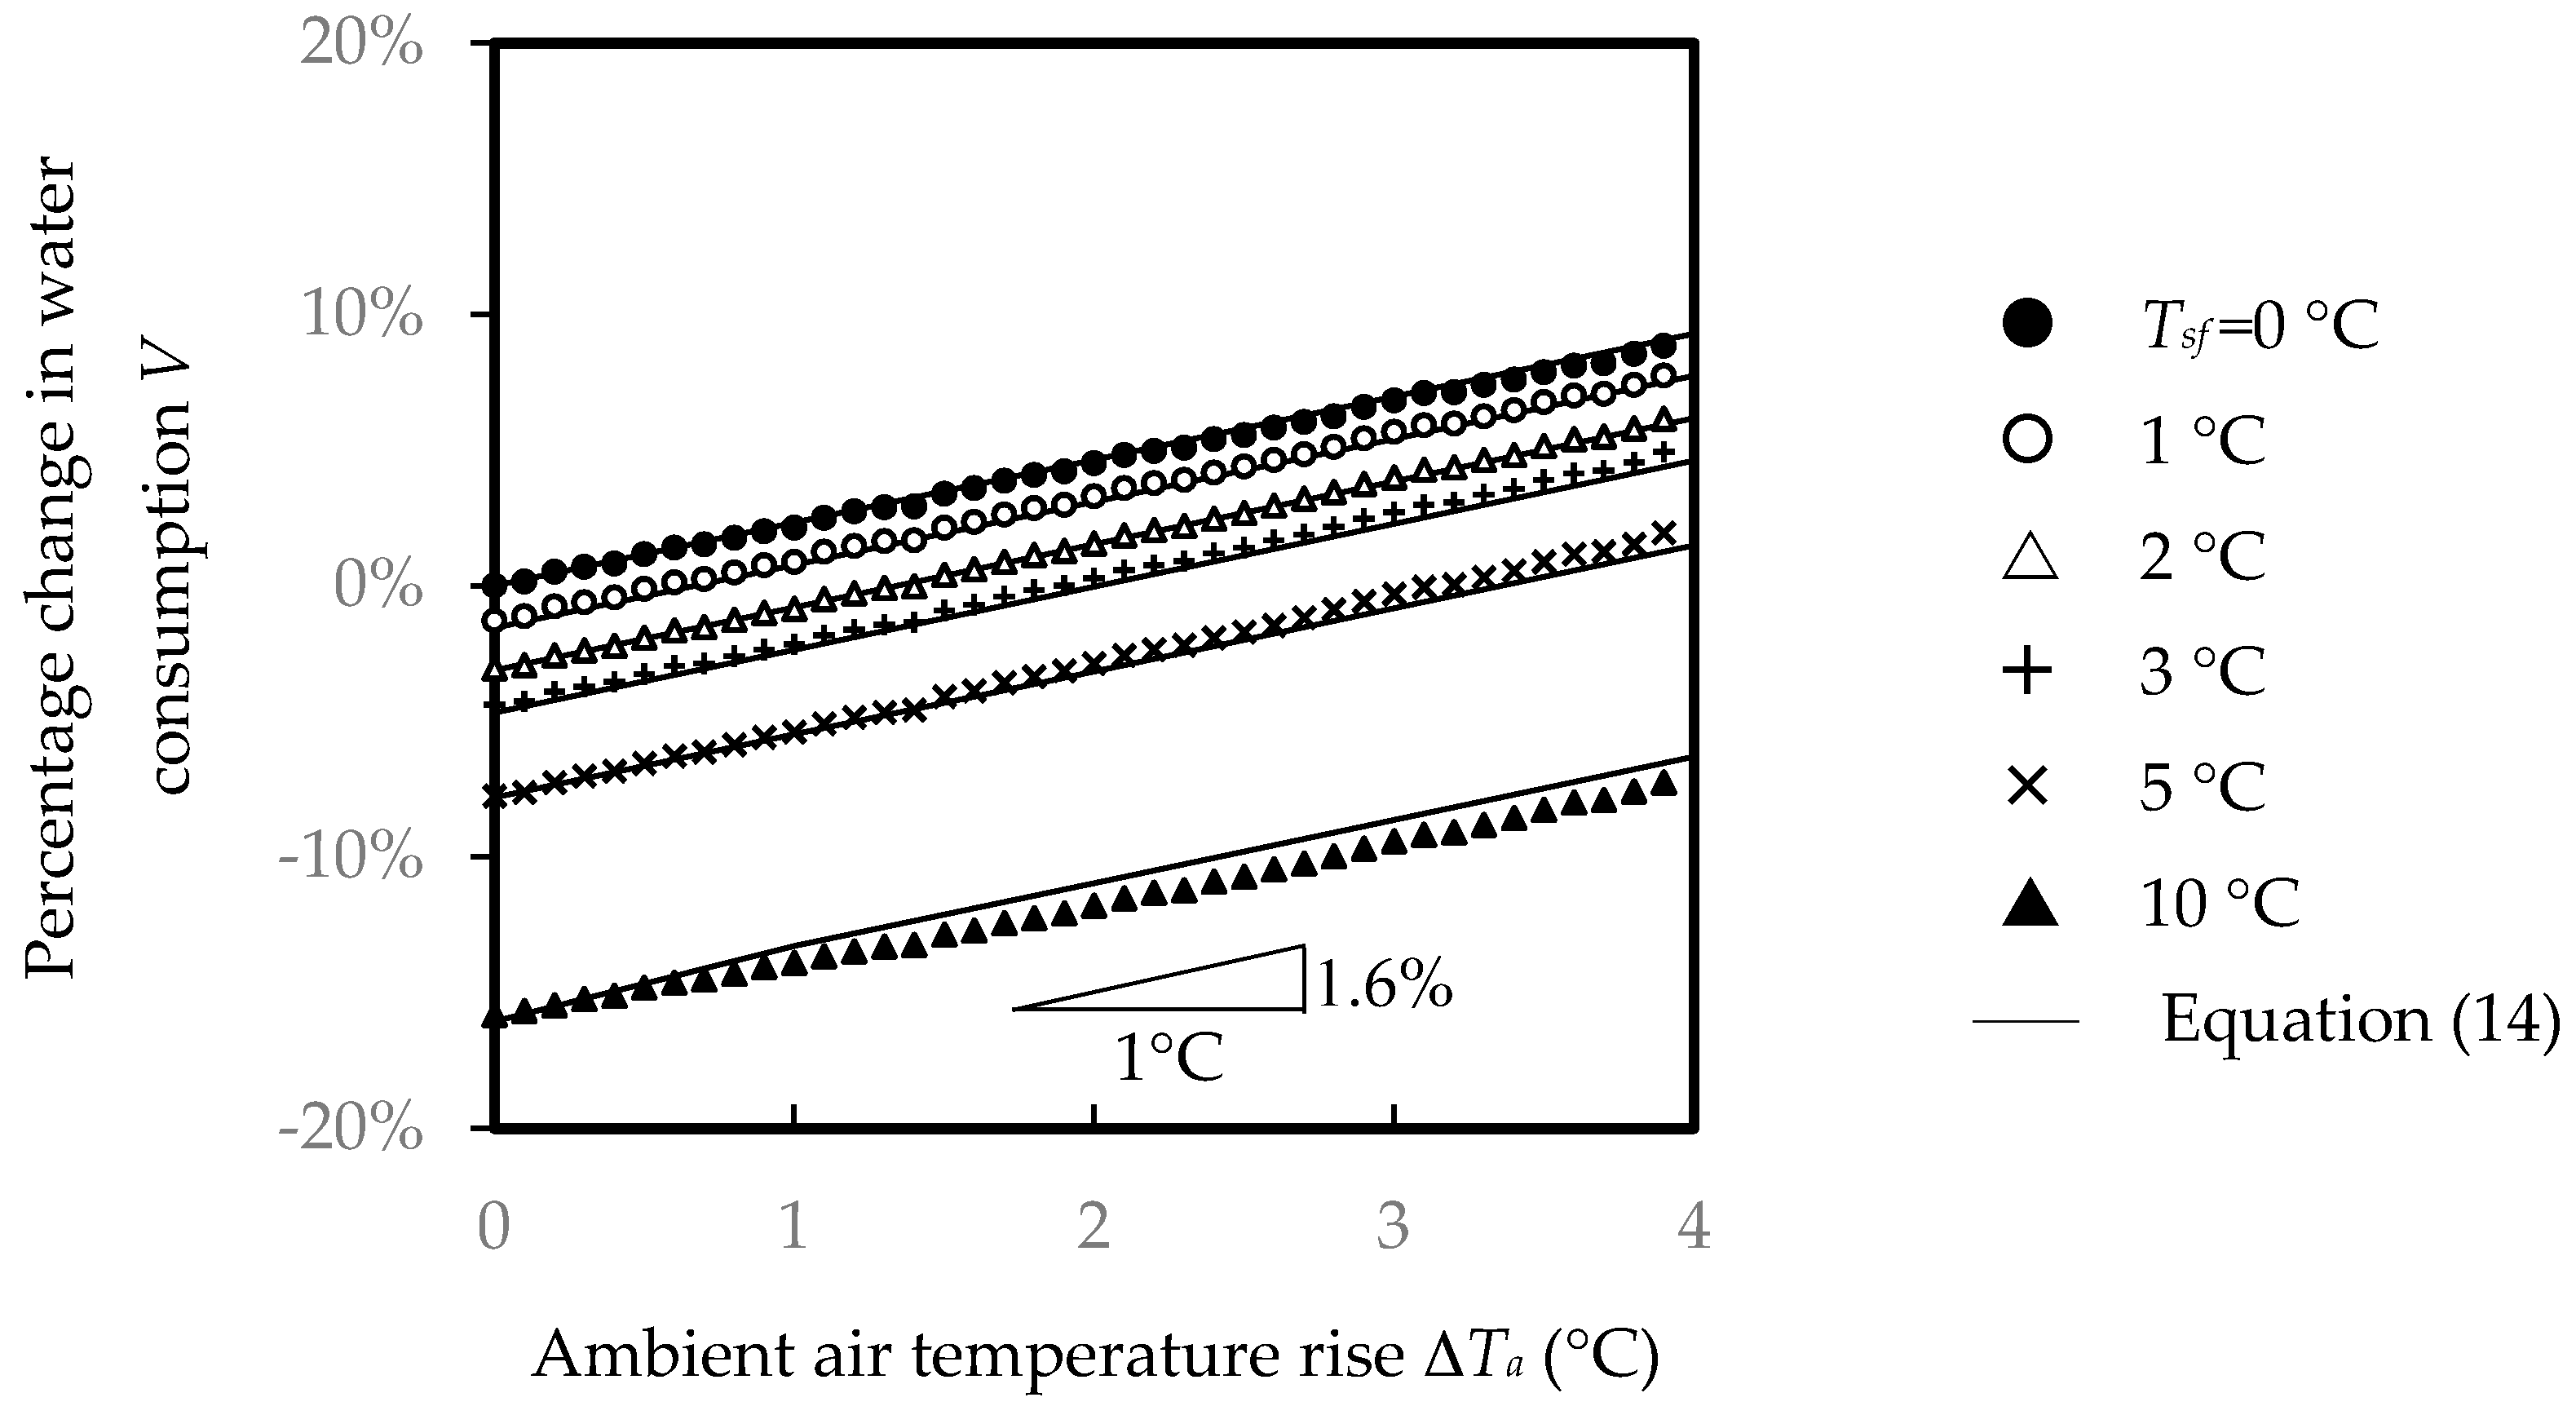
Figure 3, which illustrates the plotted results of V calculated from Equation (14) with a temperature shift Tsf, shows the linear trend of the percentage change in water consumption %V against the change in ambient air temperature ∆Ta for an average increment of 2.3% °C−1. The outcome shows a linear upward trend of −1.6% °C−1 in warmer environments.
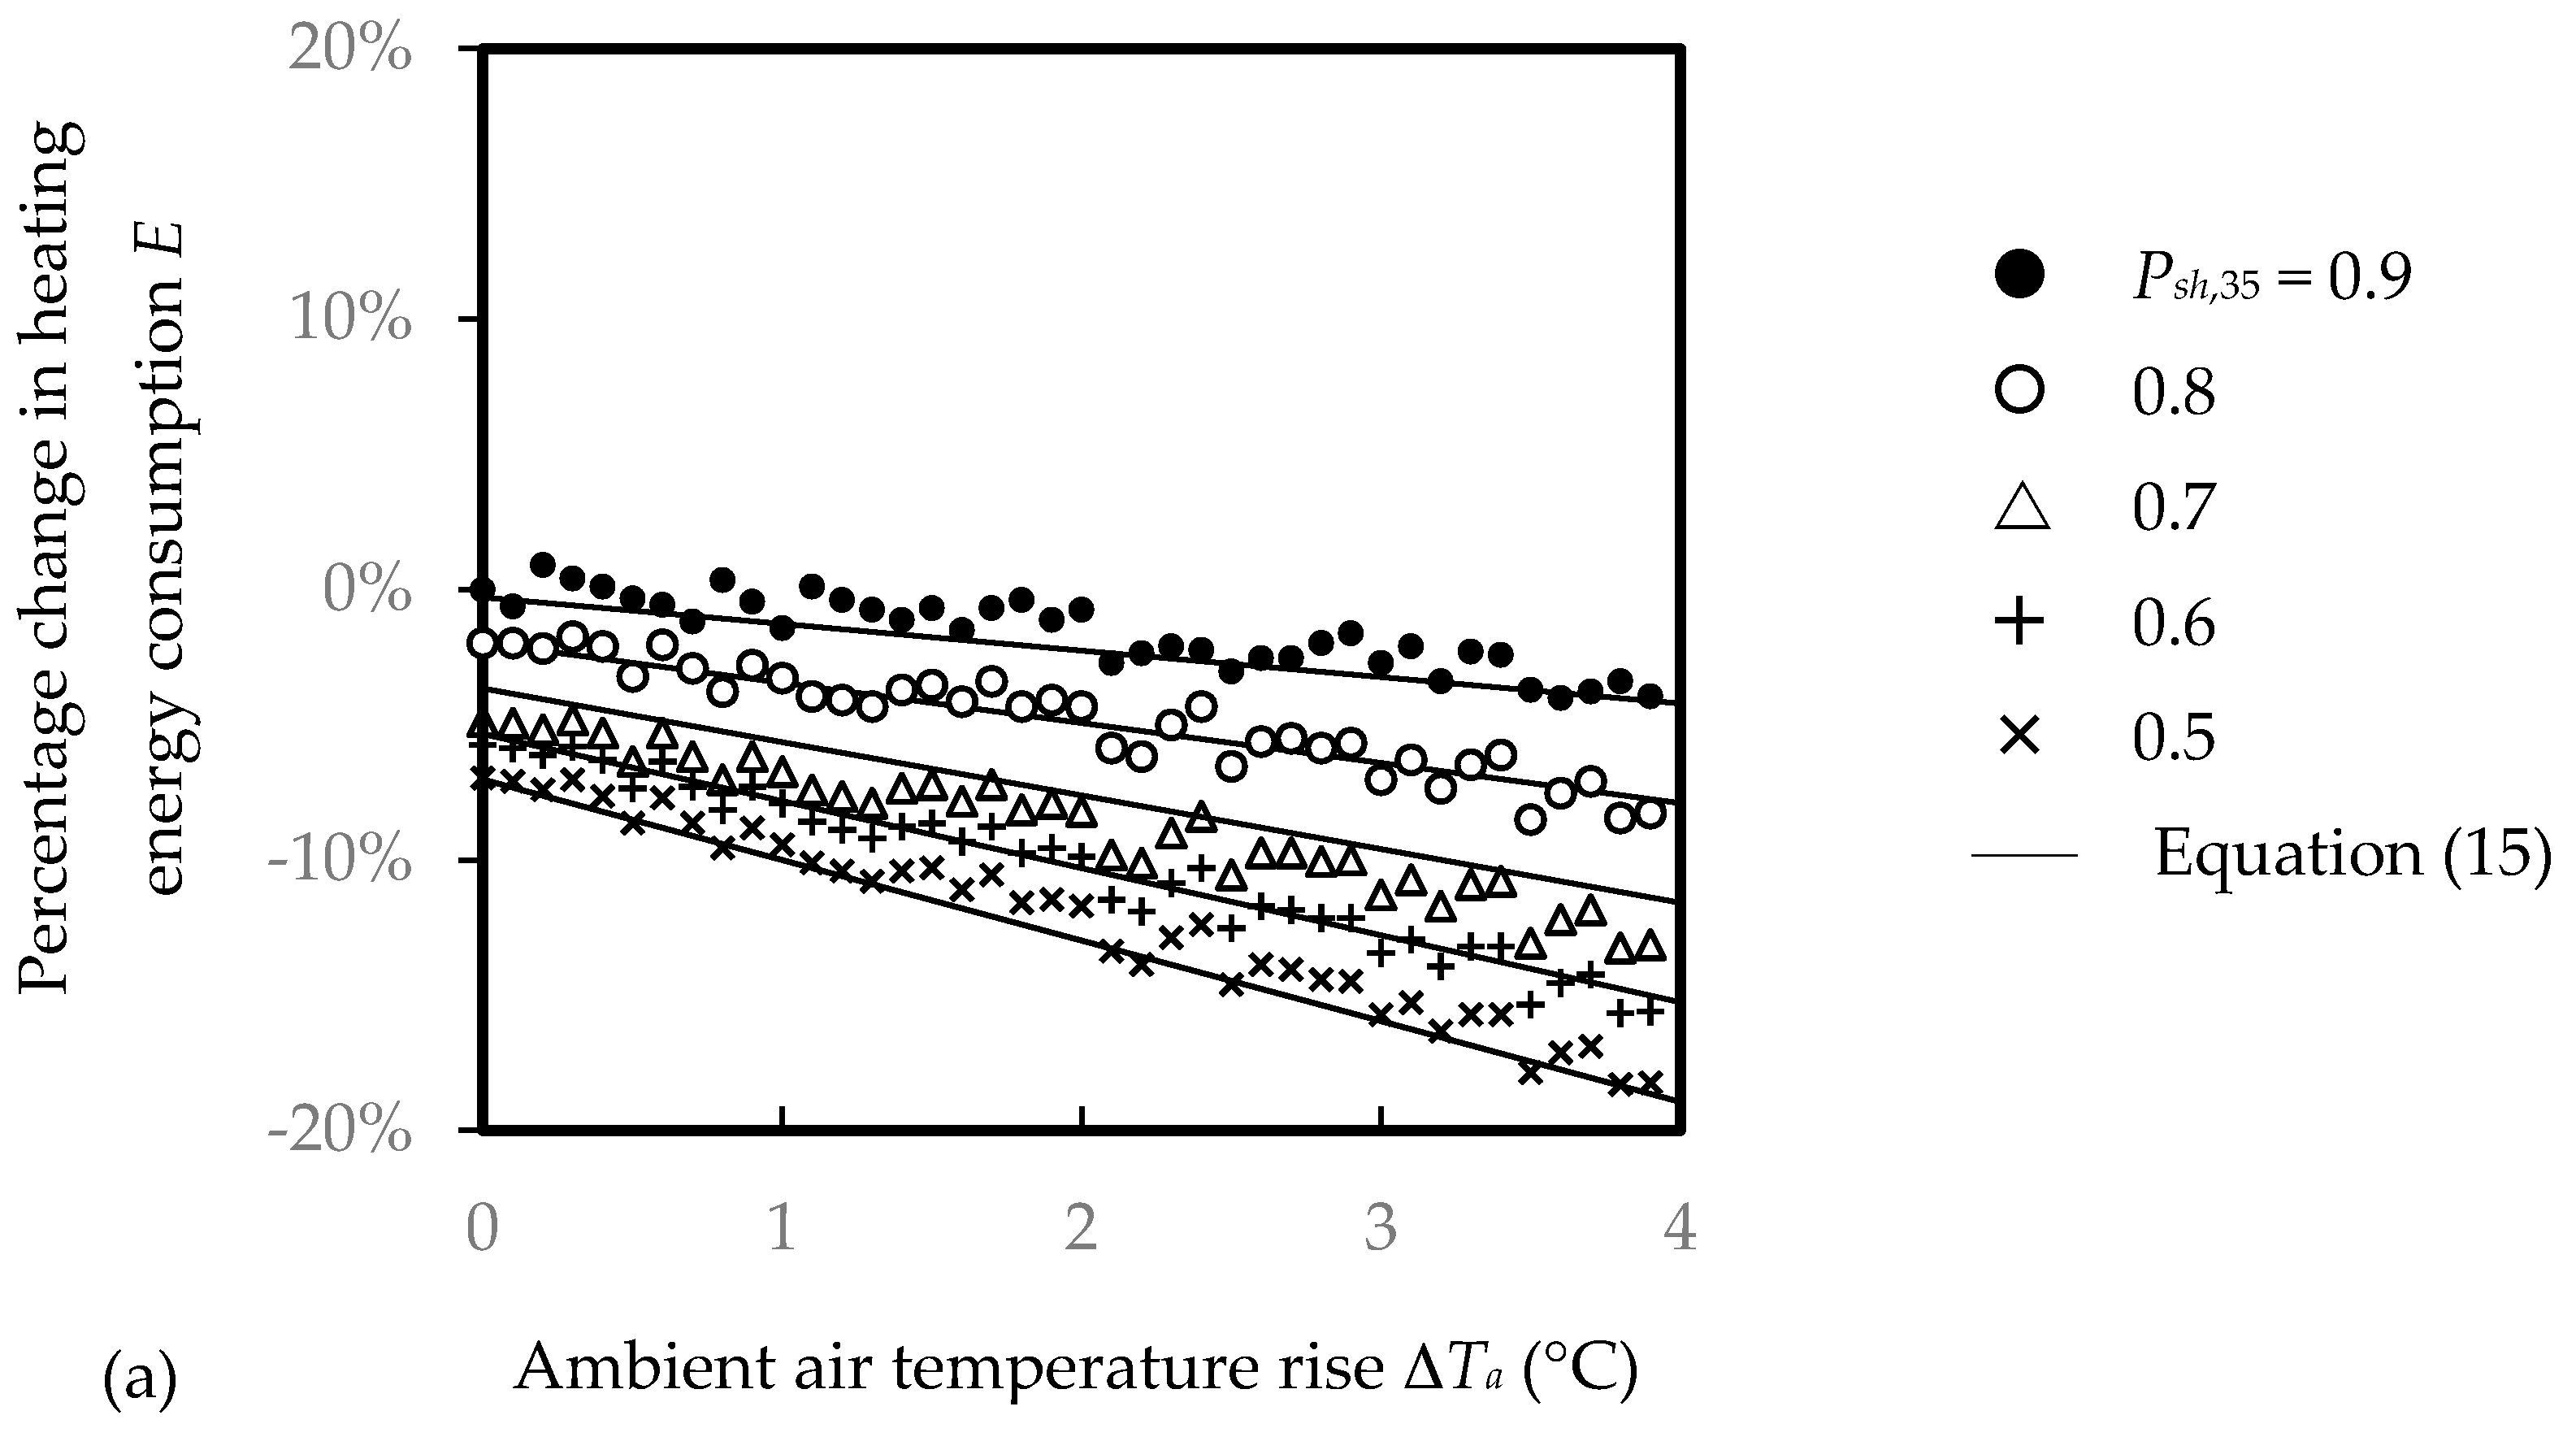
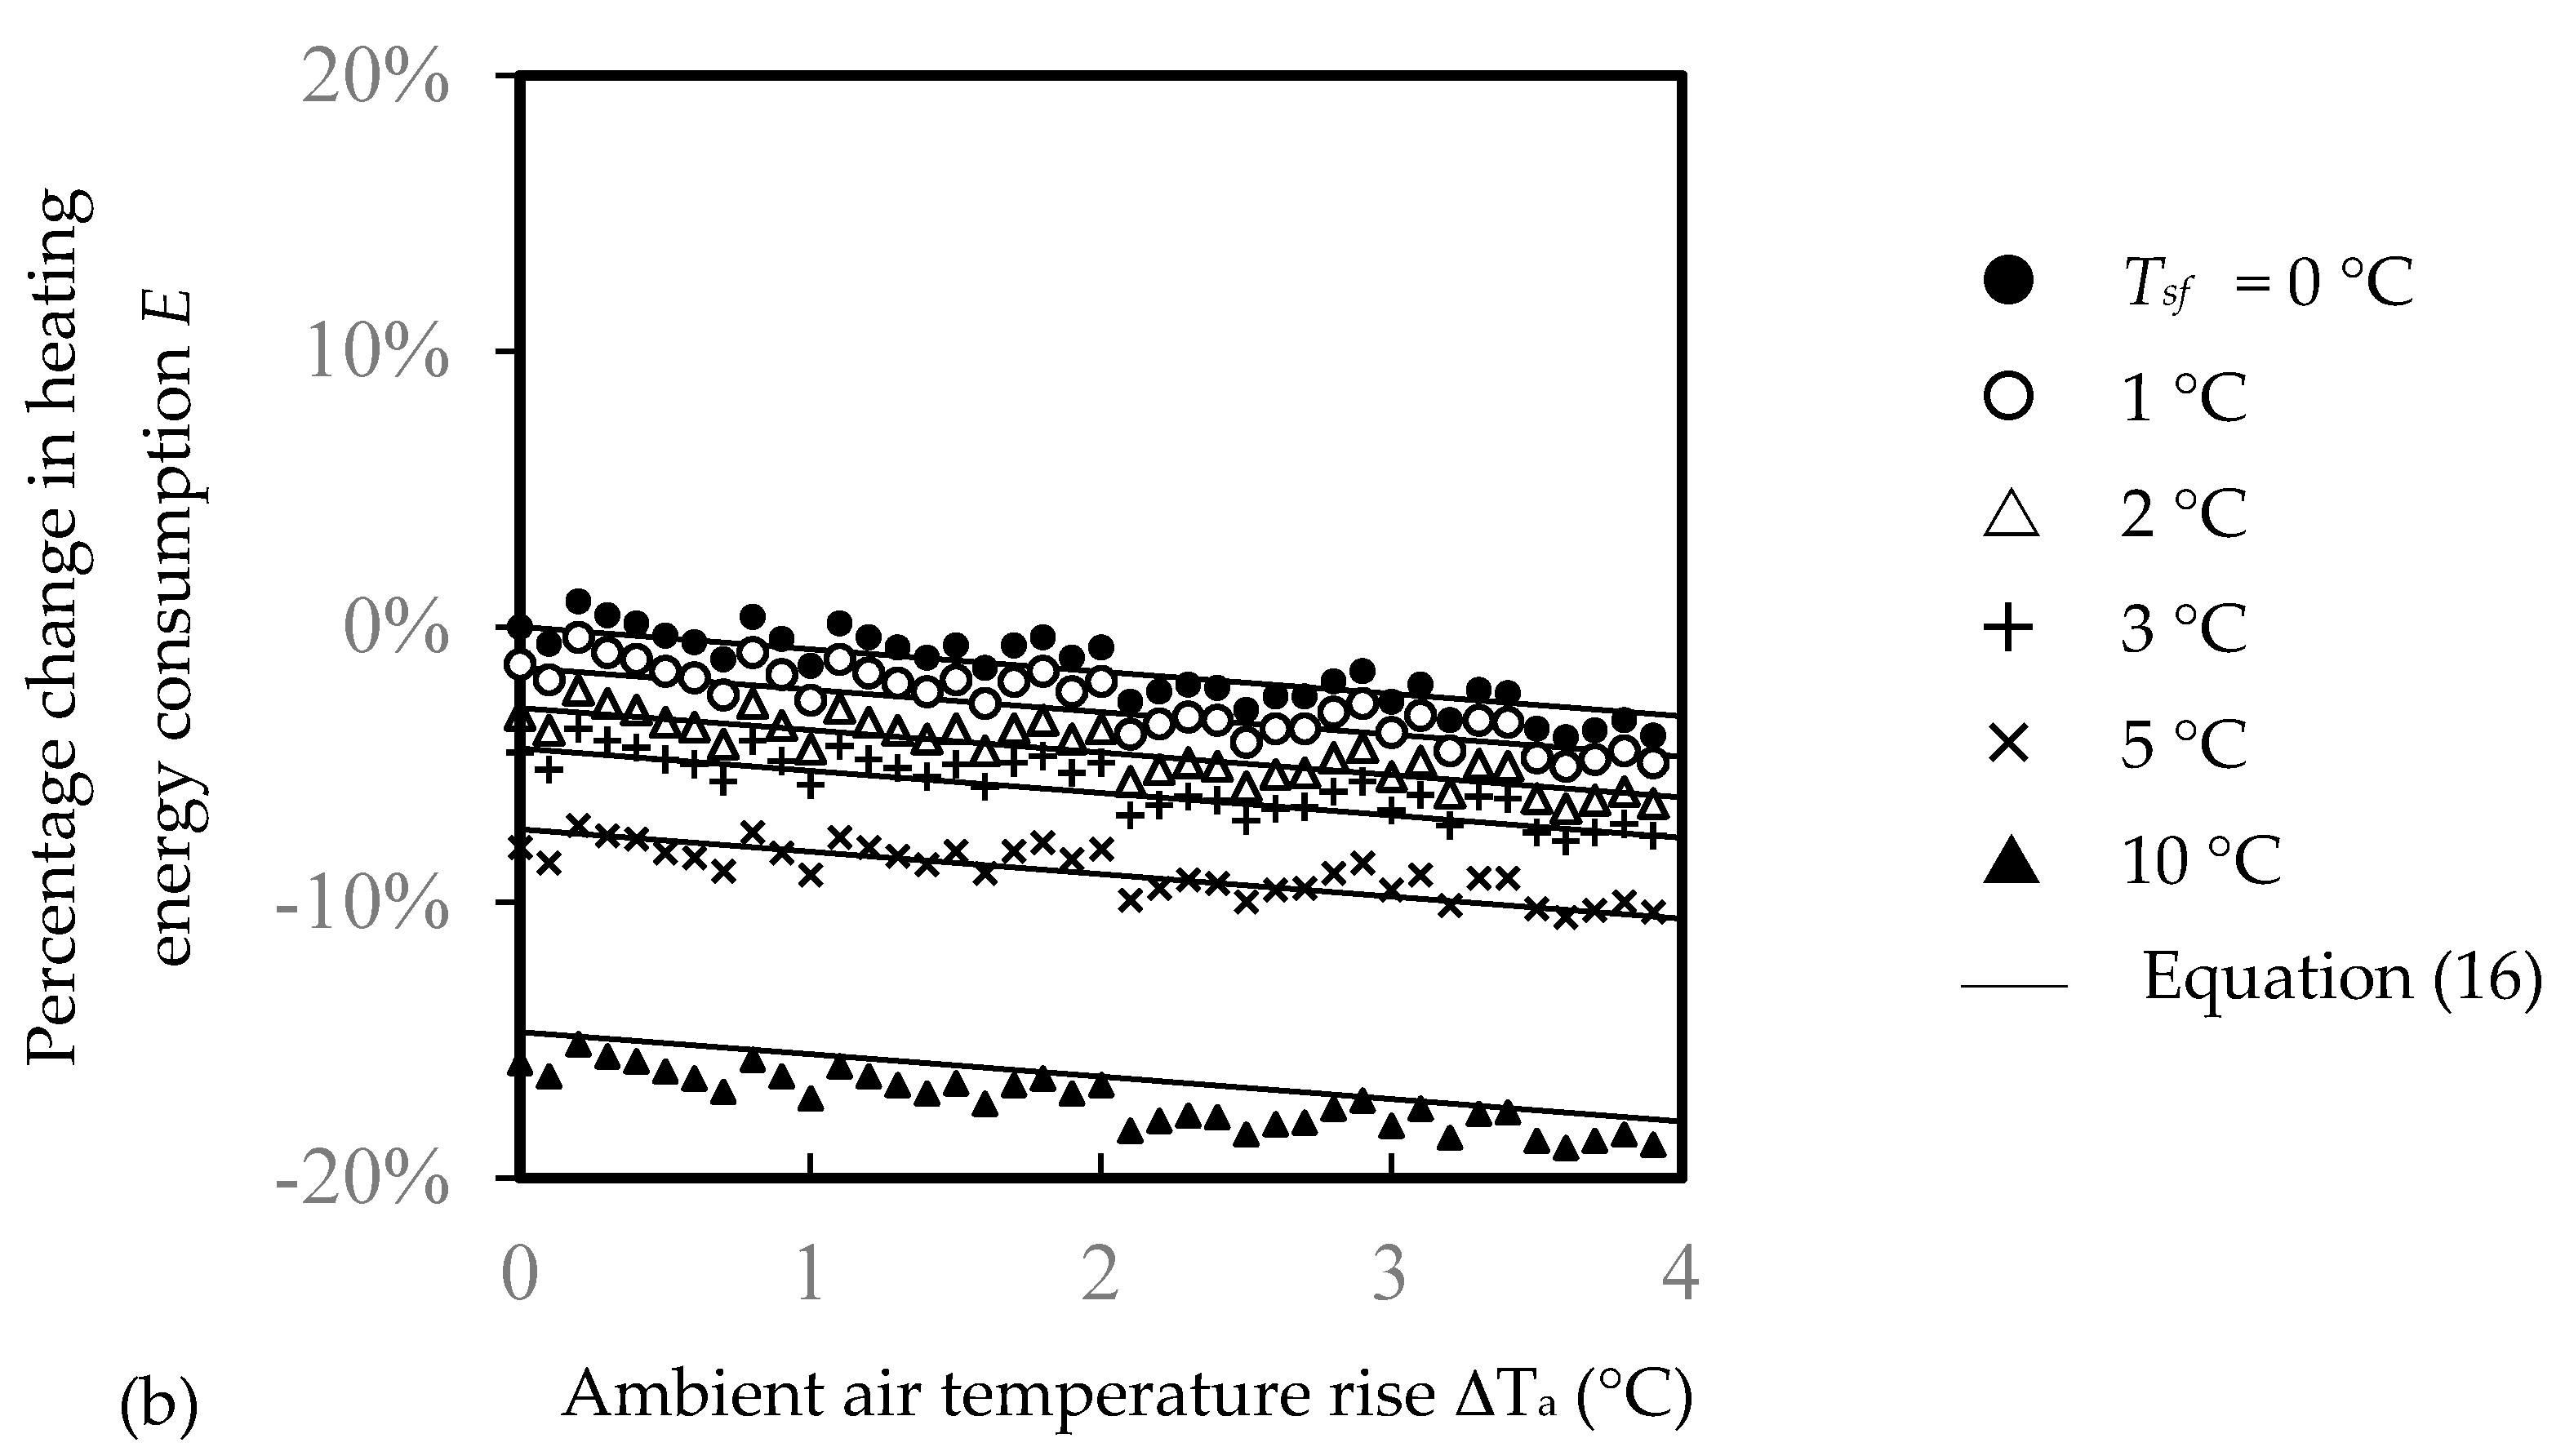
Figure 4 exhibits the percentage change in heating energy consumption E against the change in ambient air temperature ∆Ta. The results reveal that the heating energy required for additional water consumption is less dominating than the heating energy reduced in a warmer environment. Although there are variations of E in the simulations, a general downward trend against warmer environments is observed. As shown in Figure 4a,b, energy credits can be achieved, respectively, by taking fewer hot showers and by taking one more shower in a warmer period while adopting a positive temperature shift.
The results also show that using 10% less hot shower water can save 1.7% energy, with additional savings of 0.5% °C−1 in warmer environments. An expression given by Equation (15) is shown in Figure 4a to illustrate the change in energy used E.
By measuring the temperature shift, the gradients in Figure 4a indicate user behavioural changes. With a lessened energy burden, an average energy credit of 1.5% °C−1 is expected. Reportedly, there is a linear downward trend of 0.8% °C−1 in warmer environments. An expression given by Equation (16) is shown in Figure 4b to illustrate the change in energy used E.
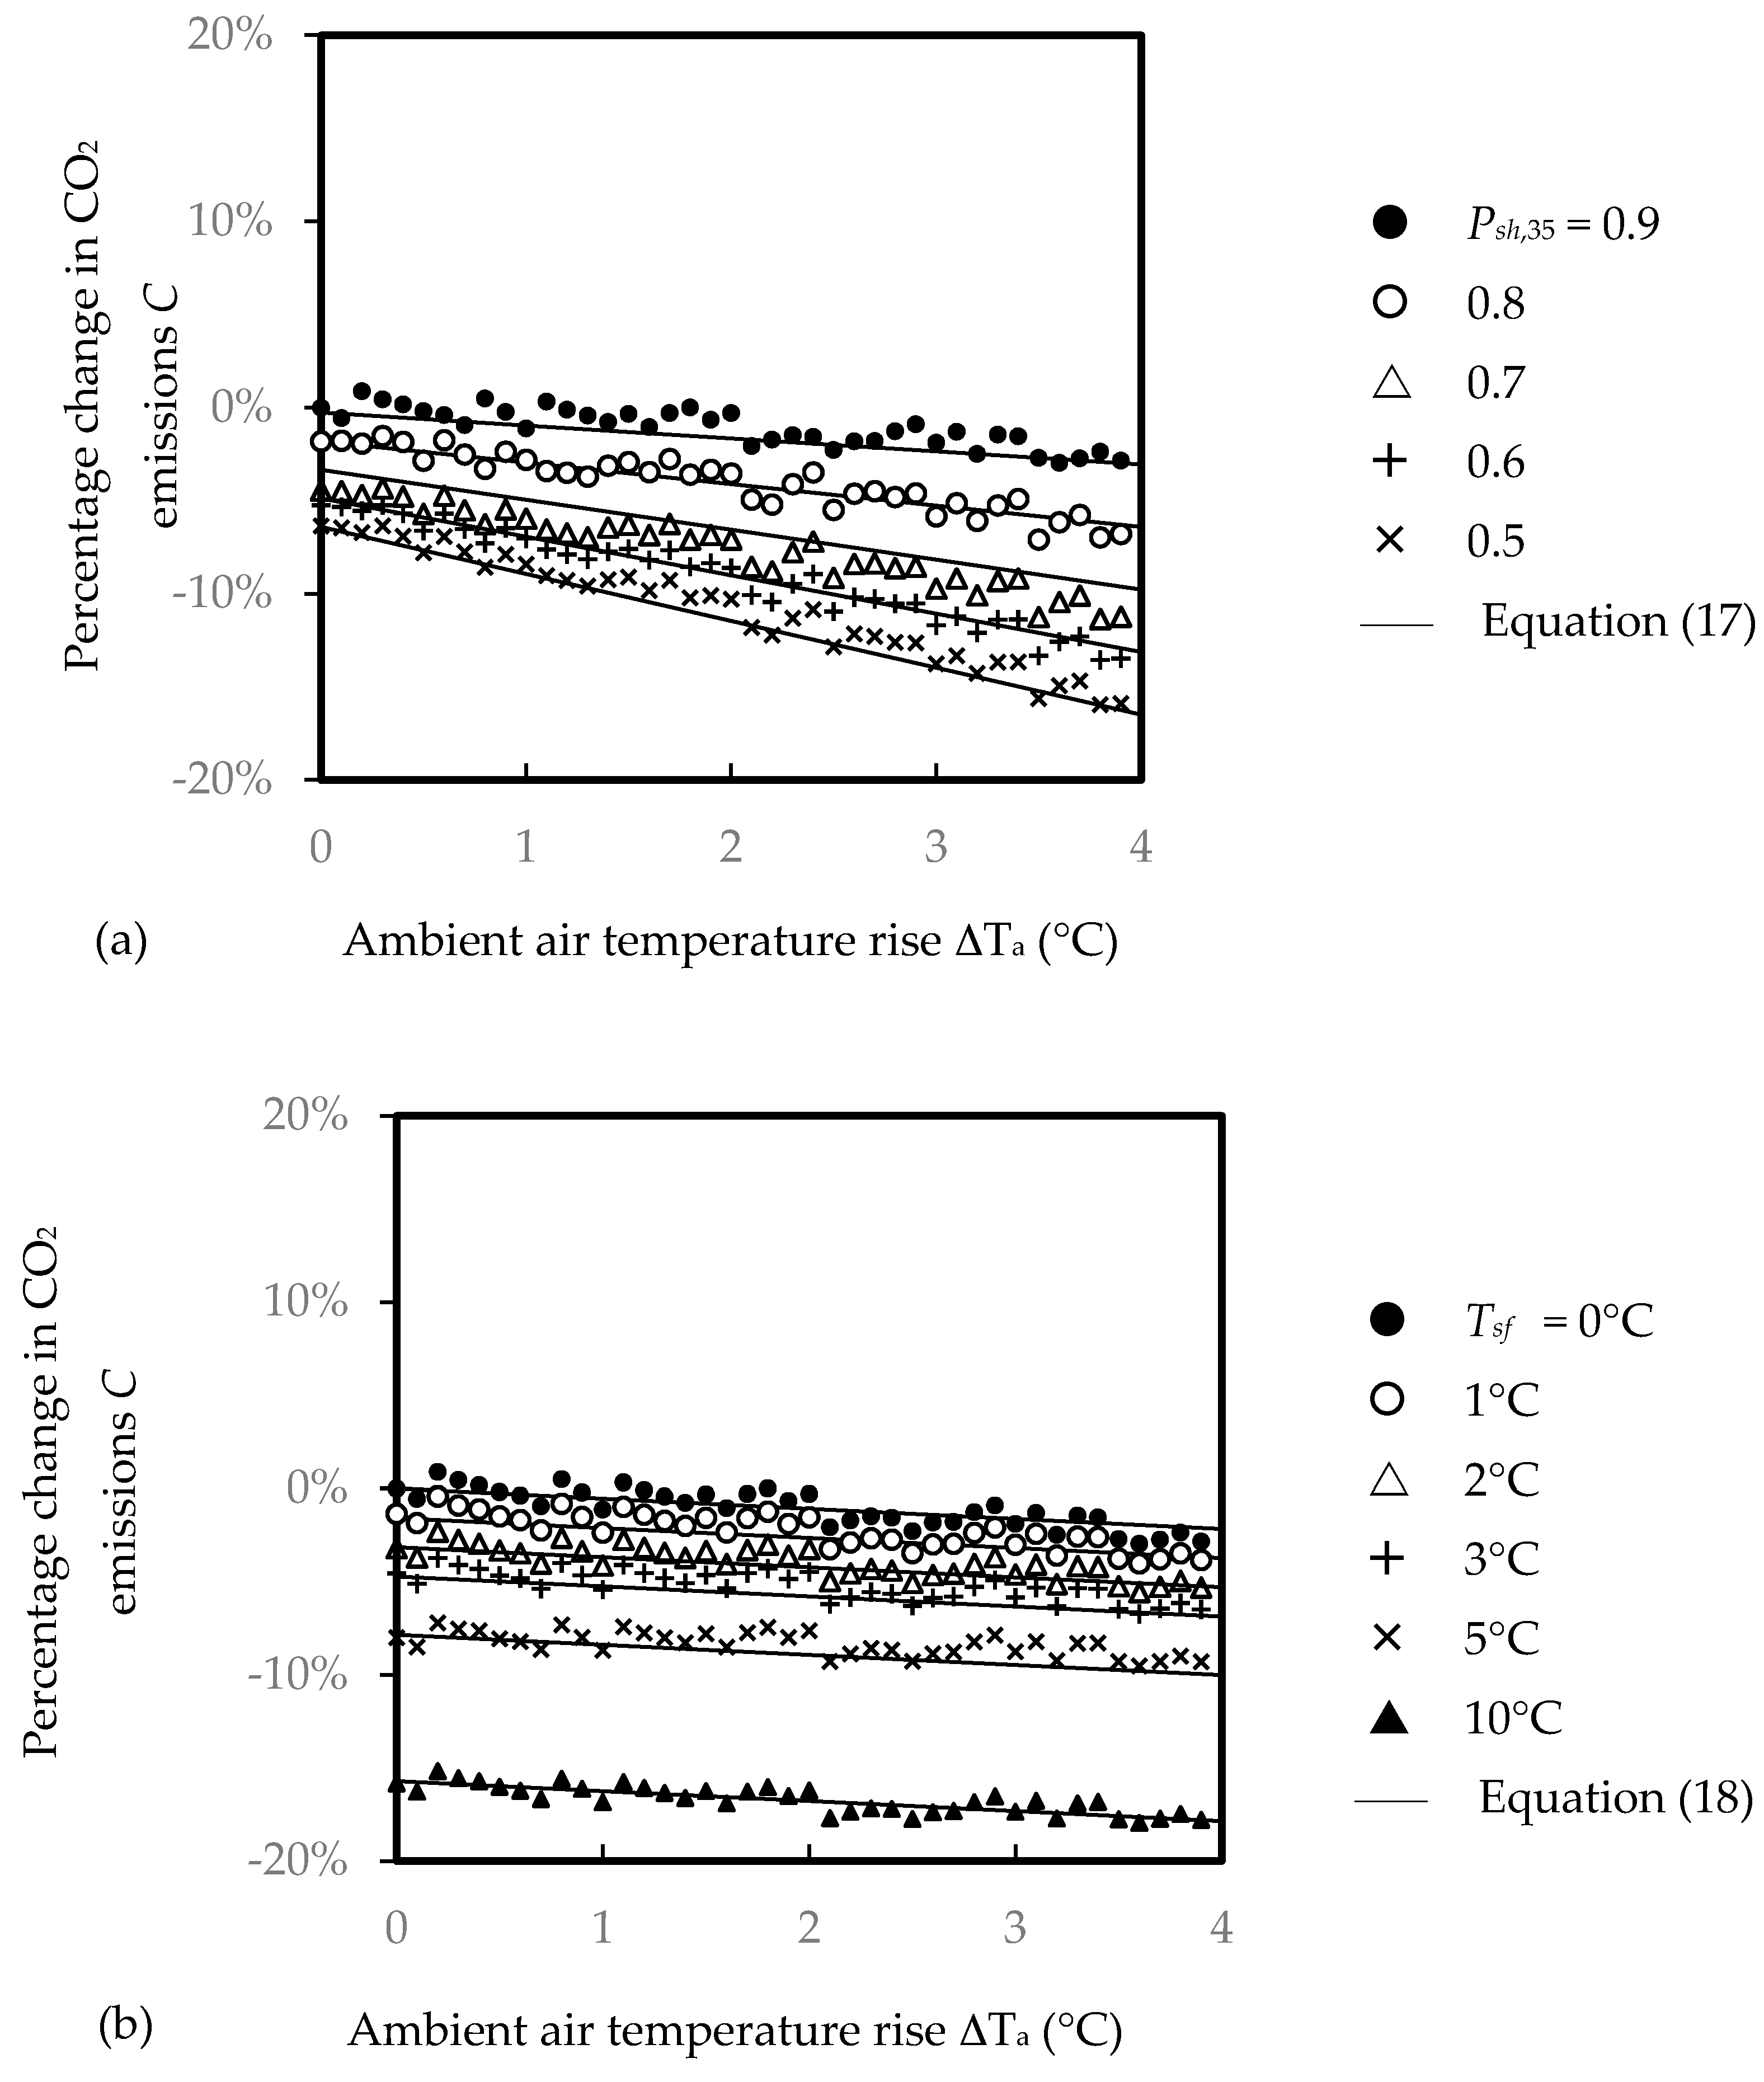
Figure 5 presents the percentage changes in CO2 emissions for showering in warmer environments. It can be observed that the energy consumed for water heating is more significant than that for water supply and treatment. Despite variations in the simulation results, there is an overall downward trend. However, less energy savings can be seen in the figure as compared with Figure 4, because energy is required for more showers in warmer environments.
For every 10% reduction in the number of hot showers, it is expected to save 1.5% energy, with additional savings of 0.46% °C−1 in warmer environments. As shown in Figure 5a, the maximum CO2 emissions reductions are 14% and 20% at ∆Ta = 3 °C and 4 °C, respectively.
Regarding the temperature shift, a carbon credit of 1.5% °C−1 is expected. A linear downward trend of 0.8% °C−1 for hot showers is observed in warmer environments. As shown in Figure 5b, the maximum CO2 changes are 9.5% and 10% at ∆Ta = 3 °C and 4 °C, respectively.
The changes in CO2 emissions C as expressed by Equations (17) and (18) are shown in Figure 5a,b, respectively, for illustration.
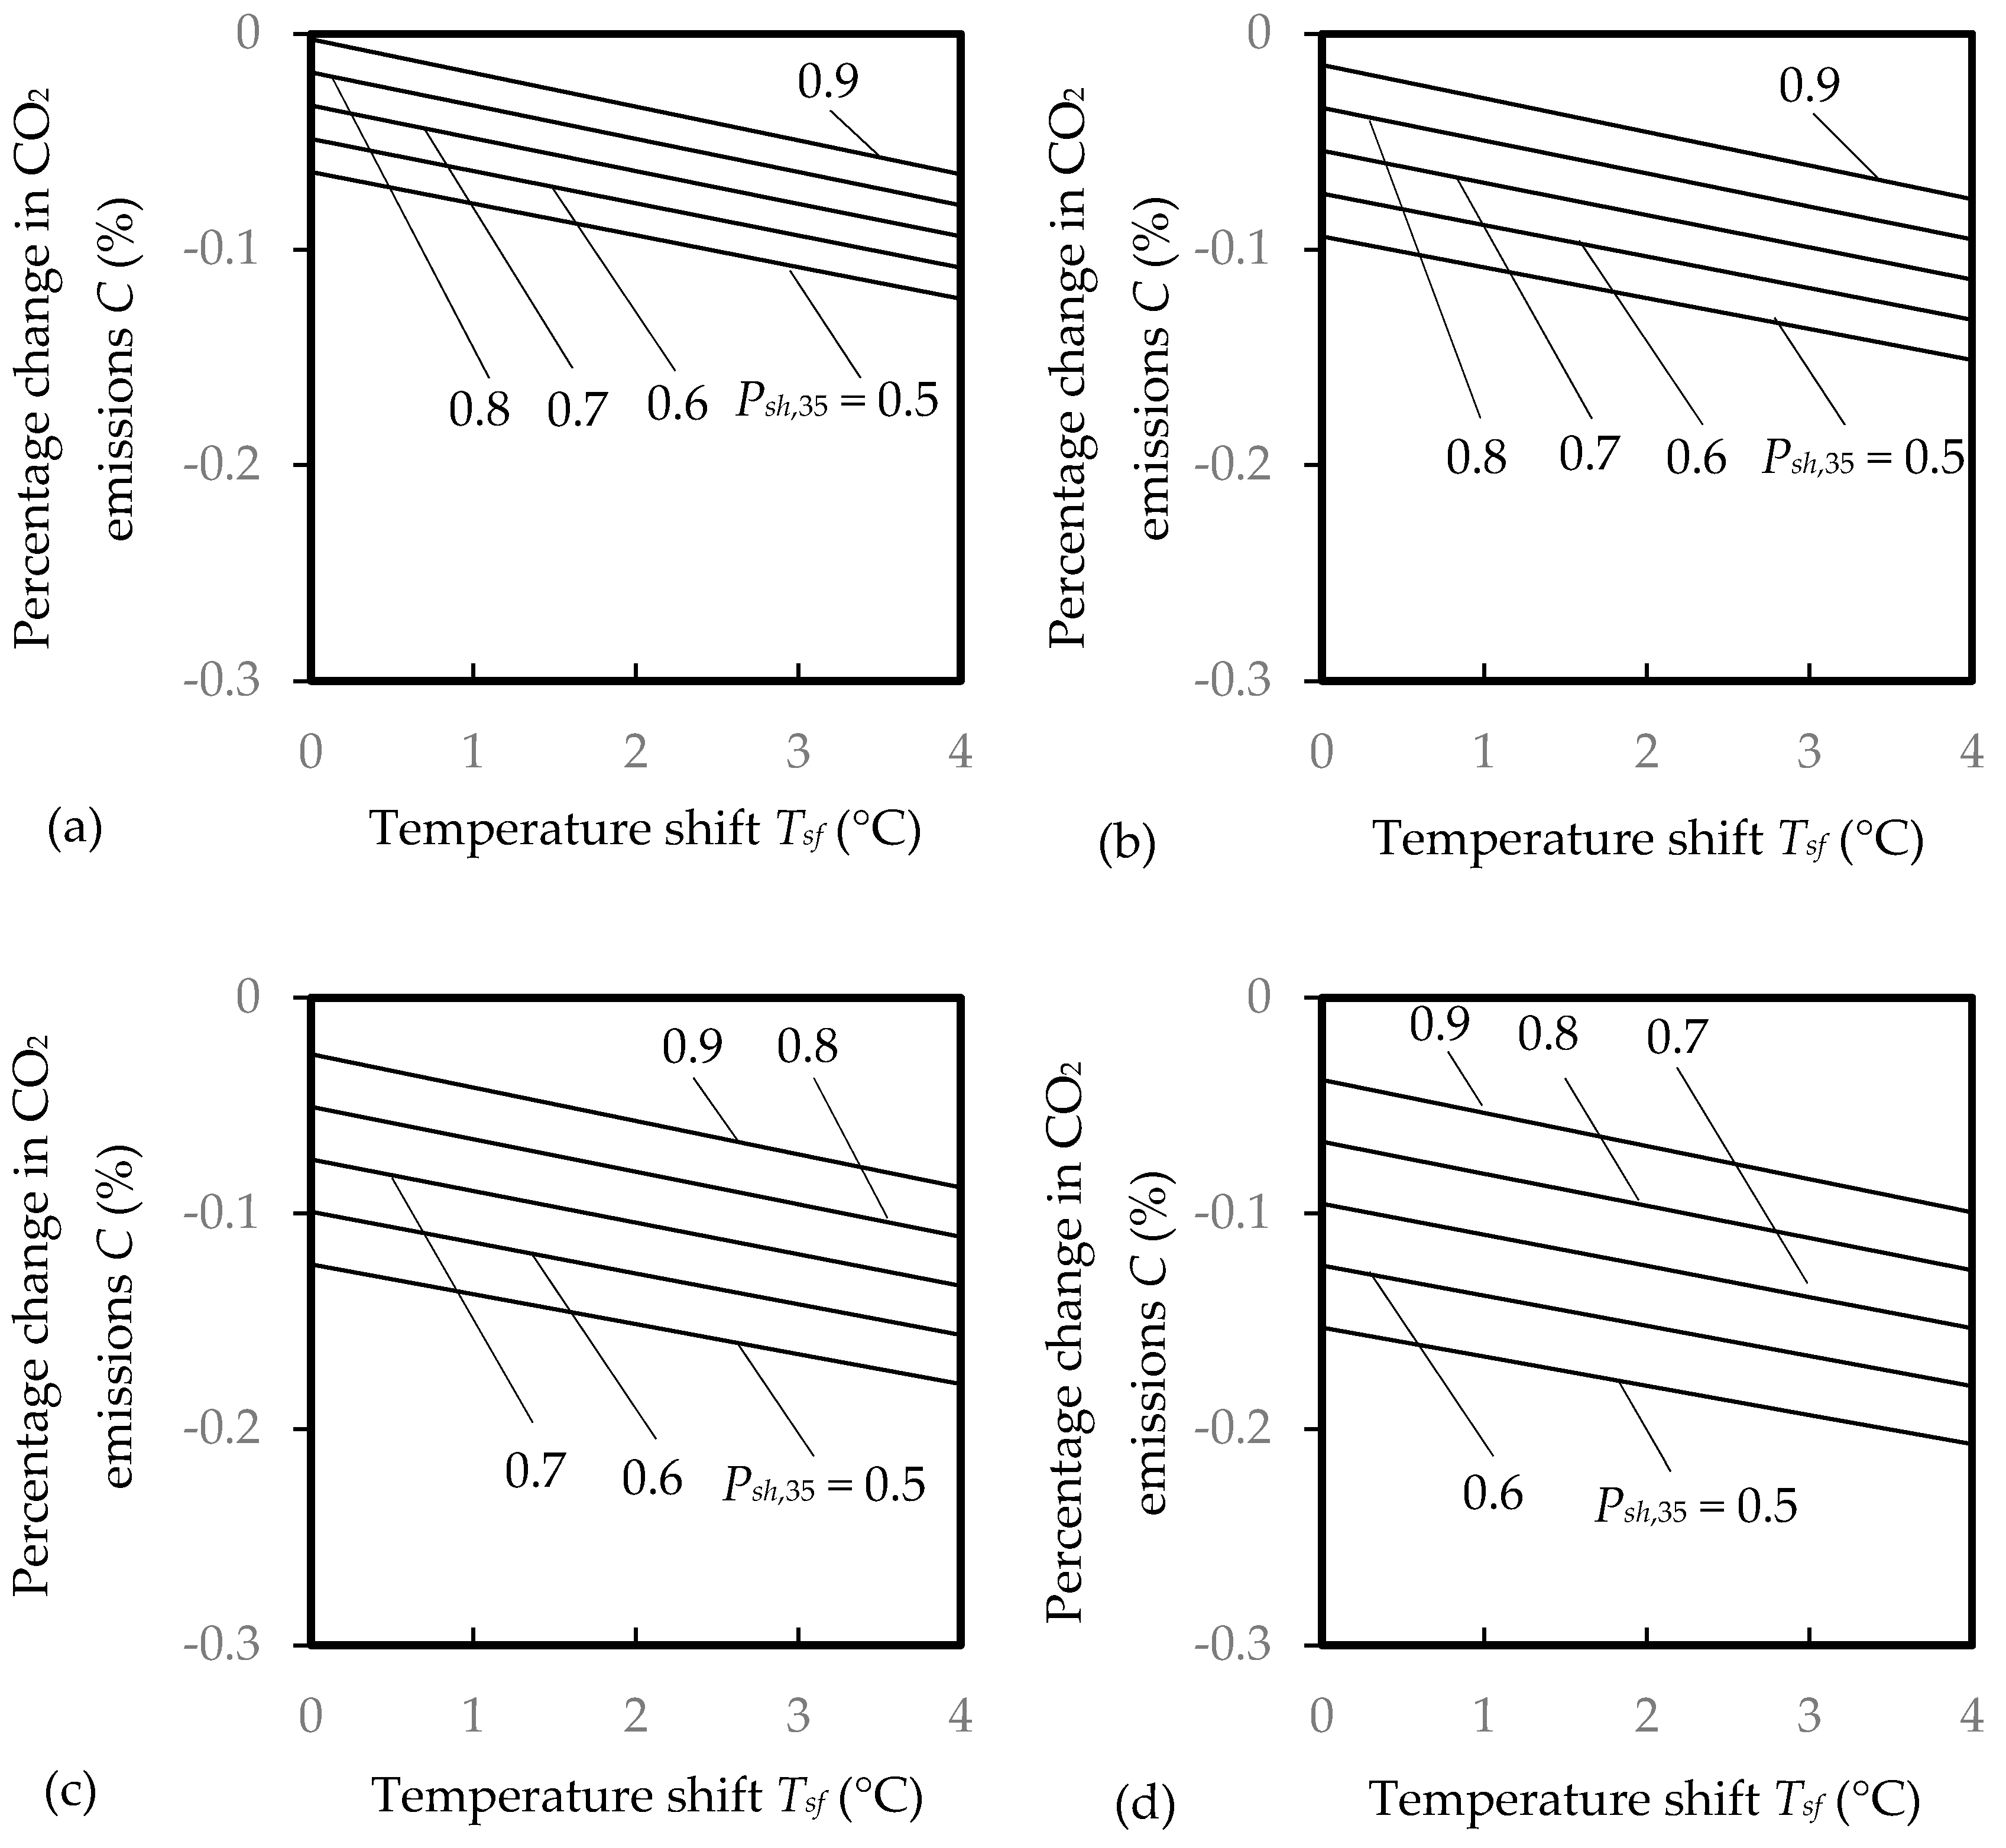
The CO2 emissions from the water supply system and water heater according to user influences can be determined by Equation (19), where Cα and Cβ are the changes in CO2 emissions due to the water supply system and water heater, respectively, while kα (=0.06) and kβ (=0.94) are the constants for CO2 emission fractions for water supply and treatment and water heating (approximately 1:15), respectively [16]. Figure 6 exhibits various target CO2 reductions based on user behavioural changes for Psh,35 ≥ 0.5 and Tsf ≤ 5 °C. The maximum CO2 reduction shown in the figure is 22% for ΔTa ≤ 3 °C, where Cα and Cβ are −9.5% and −24.3%, respectively.
Table 2 summarizes the maximum CO2 reduction estimates from various measures, including water conservation programmes that target Psh,35 ≥ 0.5 and Tsf ≤ 5 °C, water efficient products, shower drain water heat recovery, and energy efficiency improvements for water supply systems [11,12,16,17]. The influence of users on CO2 reduction is found to be significant and compatible to that of water efficient showerheads. The contributions from heat recovery systems can also be significant. The maximum CO2 reduction calculated from all of the measures listed in Table 2 using Equation (19) is estimated to be 52%.
4. Conclusions
Improving water and energy efficiency in buildings is one of the best ways to reduce greenhouse gas emissions. It is necessary to identify the most significant measures to achieve the target. This study examined various energy-related CO2 reduction measures, including the use of water efficient showerheads and shower drain water heat recovery, in order to distinguish the significance of user influence on the water usage of a shower. The results demonstrated that the influence of users on CO2 reduction is significant (up to 22%) and compatible to the influence of water efficient showerheads (up to 26%). In contrast, the CO2 reduction is less significant for heat recovery from hot showers in cities of hot climates (such as Hong Kong) (up to 14%) and water supply efficiency improvement in buildings (up to 2%). This study can be used as a reference to enhance water and energy incentives, and to facilitate continuous improvement in building water systems.
Acknowledgments
The work described in this paper was partially supported by a grant from the Research Grants Council of the Hong Kong Special Administrative Region (HKSAR), China (PolyU 5272/13E), and by three other grants from The Hong Kong Polytechnic University (GYBA6, GYM64, GYBFN).
Author Contributions
Ling-tim Wong and Kwok-wai Mui planned for the study; Ling-tim Wong and Yang Zhou executed the simulations. All authors contributed to data analysis and preparing the manuscript.
Conflicts of Interest
The authors declare no conflict of interest.
References
- IPCC. Climate Change 2013: The Physical Science Basis; Contribution of Working Group I to the Fifth Assessment Report of the Intergovernmental Panel on Climate Change; Stocker, T.F.D., Qin, G.K., Plattner, M., Tignor, S.K., Allen, J., Boschung, A., Nauels, Y., Xia, V., Bex, V., Midgley, P.M., Eds.; Cambridge University Press: Cambridge, UK; New York, NY, USA, 2013; 1535p. [Google Scholar]
- Sutter, J.D.; Berlinger, J. Final Draft of Climate Deal Formally Accepted in Paris; CNN. Cable News Network; Turner Broadcasting System, Inc.: Atlanta, GA, USA, 2015. [Google Scholar]
- Zhou, Y.; Zhang, B.; Wang, H.; Bi, J. Drops of Energy: Conserving Urban Water to Reduce Greenhouse Gas Emission. Environ. Sci. Technol. 2013, 47, 10753–10761. [Google Scholar] [CrossRef] [PubMed]
- Griffiths, S.B.; Wilson, W. The Carbon Foot Print of Water; River Network: Portland, OR, USA, 2009. [Google Scholar]
- Okamoto, M.; Yaita, R.; Sato, M.; Kamijo, M.; Toyosada, K.; Shimizu, Y.; Sakaue, K.; Liao, W.J.; Lee, M.C.; Cheng, C.L. Comparison of the Physical Properties of Showers that the Satisfaction of Shower Feeling among Users in Three Asian Countries. Water 2015, 7, 4161–4174. [Google Scholar] [CrossRef]
- Beal, C.D.; Bertone, E.; Stewart, R.A. Evaluating the energy and carbon reductions resulting from resource-efficient household stock. Energy Build. 2012, 55, 422–432. [Google Scholar] [CrossRef]
- HKWSD (Hong Kong Water Supplies Department). Domestic Water Consumption Survey—Key Survey Findings—Fact Sheet; HKSAR: Hong Kong, China, 2011.
- HKEMSD (Hong Kong Electrical and Mechanical Services Department). Hong Kong Energy End-Use Data 2015; HKSAR: Hong Kong, China, 2015.
- HKWSD (Hong Kong Water Supplies Department). Total Water Management in Hong Kong—Toward Sustainable Use of Water Resources; HKSAR: Hong Kong, China, 2008.
- Kaya, D.; Yagmur, E.A.; Yigit, K.S.; Kilic, F.C.; Eren, A.S.; Celik, C. Energy efficiency in pumps. Energy Convers. Manag. 2008, 49, 1662–1673. [Google Scholar] [CrossRef]
- Wong, L.T.; Zhou, Y.; Mui, K.W.; Lau, C.P. Optimizing water supply pump replacement in buildings of Hong Kong. Build. Serv. Eng. Res. Technol. 2016, 37, 489–498. [Google Scholar] [CrossRef]
- Cheung, C.T.; Mui, K.W.; Wong, L.T. Energy efficiency of elevated water supply tanks for high-rise buildings. Appl. Energy 2013, 103, 685–691. [Google Scholar] [CrossRef]
- Shimizu, Y.; Toyosada, K.; Yoshitaka, M.; Sakaue, K. Creation of Carbon Credits by Water Saving. Water 2012, 4, 533–544. [Google Scholar] [CrossRef]
- Cheng, C.L. Study of the inter-relationship between water use and energy conservation for a building. Energy Build. 2002, 34, 261–266. [Google Scholar] [CrossRef]
- Otani, T.; Toyosada, K.; Shimizu, Y. CO2 Reduction Potential of Water Saving in Vietnam. Water 2015, 7, 2516–2526. [Google Scholar] [CrossRef]
- Wong, L.T.; Mui, K.W.; Zhou, Y. Impact Evaluation of Low Flow Showerheads for Hong Kong Residents. Water 2016, 8, 305. [Google Scholar] [CrossRef]
- Wong, L.T.; Mui, K.W.; Guan, Y. Shower water heat recovery in high-rise residential buildings of Hong Kong. Appl. Energy 2010, 87, 703–709. [Google Scholar] [CrossRef]
- McNabola, A.; Shields, K. Efficient drain water heat recovery in horizontal domestic shower drains. Energy Build. 2013, 59, 44–49. [Google Scholar] [CrossRef]
- Wong, L.T.; Mui, K.W.; Zhou, Y. Water efficiency vs climate change: An estimation of carbon generation in 2100 from showers for bathing in Hong Kong. In Proceedings of the 3rd Asian Plumbing System Symposium, Tokyo, Japan, 21 November 2016; pp. 33–38. [Google Scholar]
- Parker, D.S. Research highlights from a large scale residential monitoring study in a hot climate. Eng. Build. 2003, 35, 863–876. [Google Scholar] [CrossRef]
- Chan, H.S.; Tong, H.W. Temperature Projection for Hong Kong in the 21st Century using CMIP5 Models. In Proceedings of the 28th Guangdong-Hong Kong-Macao Seminar on Meteorological Science and Technology, Hong Kong, 13–15 January 2014. [Google Scholar]
- Institution of Plumbing. Plumbing Engineering Services Design Guide; Institution of Plumbing: Hornchurc, UK, 2002. [Google Scholar]
- Wong, L.T. A cost model for plumbing and drainage systems. Facilities 2002, 20, 386–393. [Google Scholar] [CrossRef]
- Cheung, W.Y.; Wong, L.T.; Mui, K.W.; Zhou, Y. Performance evaluation of showerheads for Hong Kong residents. In Proceedings of the 41st International Symposium of CIBW062 Water Supply and Drainage for Buildings, Beijing, China, 18–20 August 2015; pp. 491–500. [Google Scholar]
- Nishina, D.; Murakawa, S. Evaluation of shower heads based on the subject’s feeling for taking a shower. In Proceedings of the CIBW062 International Symposium on Water Supply and Drainage for Buildings, Yokohama, Japan, 10–12 November 1997. [Google Scholar]
Figure 1.
Probability of daily per capita shower usage: (a) Hot water used Psh; (b) Once per day Ps1; (c) Twice per day Ps2; (d) Thrice per day Ps3.
Figure 1.
Probability of daily per capita shower usage: (a) Hot water used Psh; (b) Once per day Ps1; (c) Twice per day Ps2; (d) Thrice per day Ps3.

Figure 2.
Expected number of showers per occupant per day Ns.

Figure 3.
Percentage change in shower water consumption against ambient air temperature rise.

Figure 4.
Percentage change in heating energy consumption against ambient air temperature rise: (a) Behavioural responses related to taking fewer hot showers; (b) Behavioural responses to a positive temperature shift.
Figure 4.
Percentage change in heating energy consumption against ambient air temperature rise: (a) Behavioural responses related to taking fewer hot showers; (b) Behavioural responses to a positive temperature shift.


Figure 5.
Percentage change in CO2 emissions against ambient air temperature rise: (a) Behavioural responses related to taking fewer hot showers; (b) Behavioural responses to a positive temperature shift.
Figure 5.
Percentage change in CO2 emissions against ambient air temperature rise: (a) Behavioural responses related to taking fewer hot showers; (b) Behavioural responses to a positive temperature shift.

Figure 6.
User influence on the percentage change in CO2 emissions: (a) ∆Ta = 0 °C; (b) ∆Ta = 1 °C; (c) ∆Ta = 2 °C; (d) ∆Ta = 3 °C.
Figure 6.
User influence on the percentage change in CO2 emissions: (a) ∆Ta = 0 °C; (b) ∆Ta = 1 °C; (c) ∆Ta = 2 °C; (d) ∆Ta = 3 °C.

Table 1.
Constants for per capita showering characteristics.
| Parameter i | ||
| 0 | 1.15 | −0.007 |
| 1 | 1.29 | −0.028 |
| 2 | −0.25 | 0.026 |
| 3 | −0.05 | 0.003 |
Table 2.
Maximum CO2 reductions (Cmax) estimated for showering in Hong Kong.
| Description | Cmax | References |
|---|---|---|
| Water conservation programmes | 22% | This study |
| Water efficient showerheads | 26% | [16] |
| Shower drain heat recovery | 14% | [17] |
| Water supply efficiency improvement in buildings | 2% | [11,12] |
| Expected overall maximum CO2 reduction | 52% |
© 2017 by the authors. Licensee MDPI, Basel, Switzerland. This article is an open access article distributed under the terms and conditions of the Creative Commons Attribution (CC BY) license (http://creativecommons.org/licenses/by/4.0/).
Share and Cite
MDPI and ACS Style
Wong, L.-t.; Mui, K.-w.; Zhou, Y. Carbon Dioxide Reduction Targets of Hot Water Showers for People in Hong Kong. Water 2017, 9, 576. https://doi.org/10.3390/w9080576
AMA Style
Wong L-t, Mui K-w, Zhou Y. Carbon Dioxide Reduction Targets of Hot Water Showers for People in Hong Kong. Water. 2017; 9(8):576. https://doi.org/10.3390/w9080576
Chicago/Turabian StyleWong, Ling-tim, Kwok-wai Mui, and Yang Zhou. 2017. "Carbon Dioxide Reduction Targets of Hot Water Showers for People in Hong Kong" Water 9, no. 8: 576. https://doi.org/10.3390/w9080576
Note that from the first issue of 2016, this journal uses article numbers instead of page numbers. See further details here.