Article

Assessment of the Impact of Climate Change on Drought Characteristics in the Hwanghae Plain, North Korea Using Time Series SPI and SPEI: 1981–2100

1
Department of Biological and Agricultural Engineering, Texas A&M University, College Station, TX 77843, USA
2
Department of Rural and Bio-systems Engineering, Chonnam National University, Gwangju 61186, Korea
3
Department of Rural Systems Engineering and Research Institute for Agriculture & Life Sciences, Seoul National University, Seoul 08826, Korea
4
Institute of Green Bio Science Technology, Seoul National University, Pyeongchang 25354, Korea
*
Author to whom correspondence should be addressed.
Water 2017, 9(8), 579; https://doi.org/10.3390/w9080579
Submission received: 28 April 2017 / Revised: 8 June 2017 / Accepted: 1 August 2017 / Published: 3 August 2017
(This article belongs to the Special Issue Adaptation Strategies to Climate Change Impacts on Water Resources)

Abstract

:
North Korea is a food-deficit nation in which climate change could have a significant impact on drought. We analyzed drought characteristics in the Hwanghae Plain, North Korea using both the multiple timescales of the standardized precipitation index (SPI) and the standardized precipitation evapotranspiration index (SPEI) from 1981 to 2100. The probability of non-exceedance for a one-month SPEI below −1.0 was only 1.1% in the spring season of 1995 but increased to 24.4% in 2085. The SPEI for a ten-year return period varied from −0.6 to −0.9 in 1995 and decreased to −1.18 in 2025. The results indicate that severe drought is more likely to occur in future as a result of climate change. The seasonal drought conditions were also significantly influenced by climate change. The largest decrease in the SPEI occurred in late spring and early summer, both of which are important for rice growth. Drought characteristics include severity, duration, and intensity. Therefore, we applied the time series of SPIs and SPEIs to the runs theory and found that the drought intensity identified by one-month SPEIs in 1995 was at a level of 1.21, which reached 1.39 in 2085, implying that climate change will intensify drought in the future.

1. Introduction

North Korea is vulnerable to drought and famine [1]; severe droughts in 1999 and 2001 caused serious food shortages [2]. Recently, North Korea experienced the worst spring drought in more than three decades, with some areas experiencing the lowest rainfall levels in over 50 years. In addition, water scarcity due to drought is often accompanied by catastrophic impacts on food security and economic prosperity [3]. Climate change could have a significant impact on drought characteristics, exacerbating food deficiency in North Korea. International aid plays a major role in sustaining the population and alleviating food scarcity caused by severe drought in North Korea; while drought in North Korea is certainly a local issue, it is also regarded as a global problem.
Few studies have been carried out on the impact of climate change on North Korea’s droughts because of the lack of available data for North Korea. A few studies have analyzed historical drought conditions in North Korea with limited data; for example, remote sensing images were used to evaluate spring drought [4], and several drought indices were used to analyze historical characteristics by quantifying the duration and magnitude of drought [5]. In addition, the temporal and spatial distribution of the severity of meteorological drought was analyzed, and a cluster analysis with drought indicators has been used to classify the drought development types in North Korea [6].
The aim of this study is to use both SPI and SPEI for the period from 2011 to 2100 to evaluate the impact of future climate change on short and medium-term droughts in the Hwanghae Plain, which is a primary source of staple foods in North Korea. Multiple timescale (one, three, and six-month) SPI and SPEI were calculated using downscaled climate data under the representative concentration pathway (RCP) 4.5 scenario. The statistical value and spatial distribution of SPI and SPEI were also analyzed. In addition, the relationship between SPI and SPEI was analyzed using conditional probability. To evaluate the impacts of climate change on drought, we analyzed the severity, duration, and intensity of the time series SPI and SPEI using runs theory. Finally, the frequency of severe drought was analyzed from the non-exceedance probability with the cumulative SPI and SPEI curves.

2. Materials and Methods

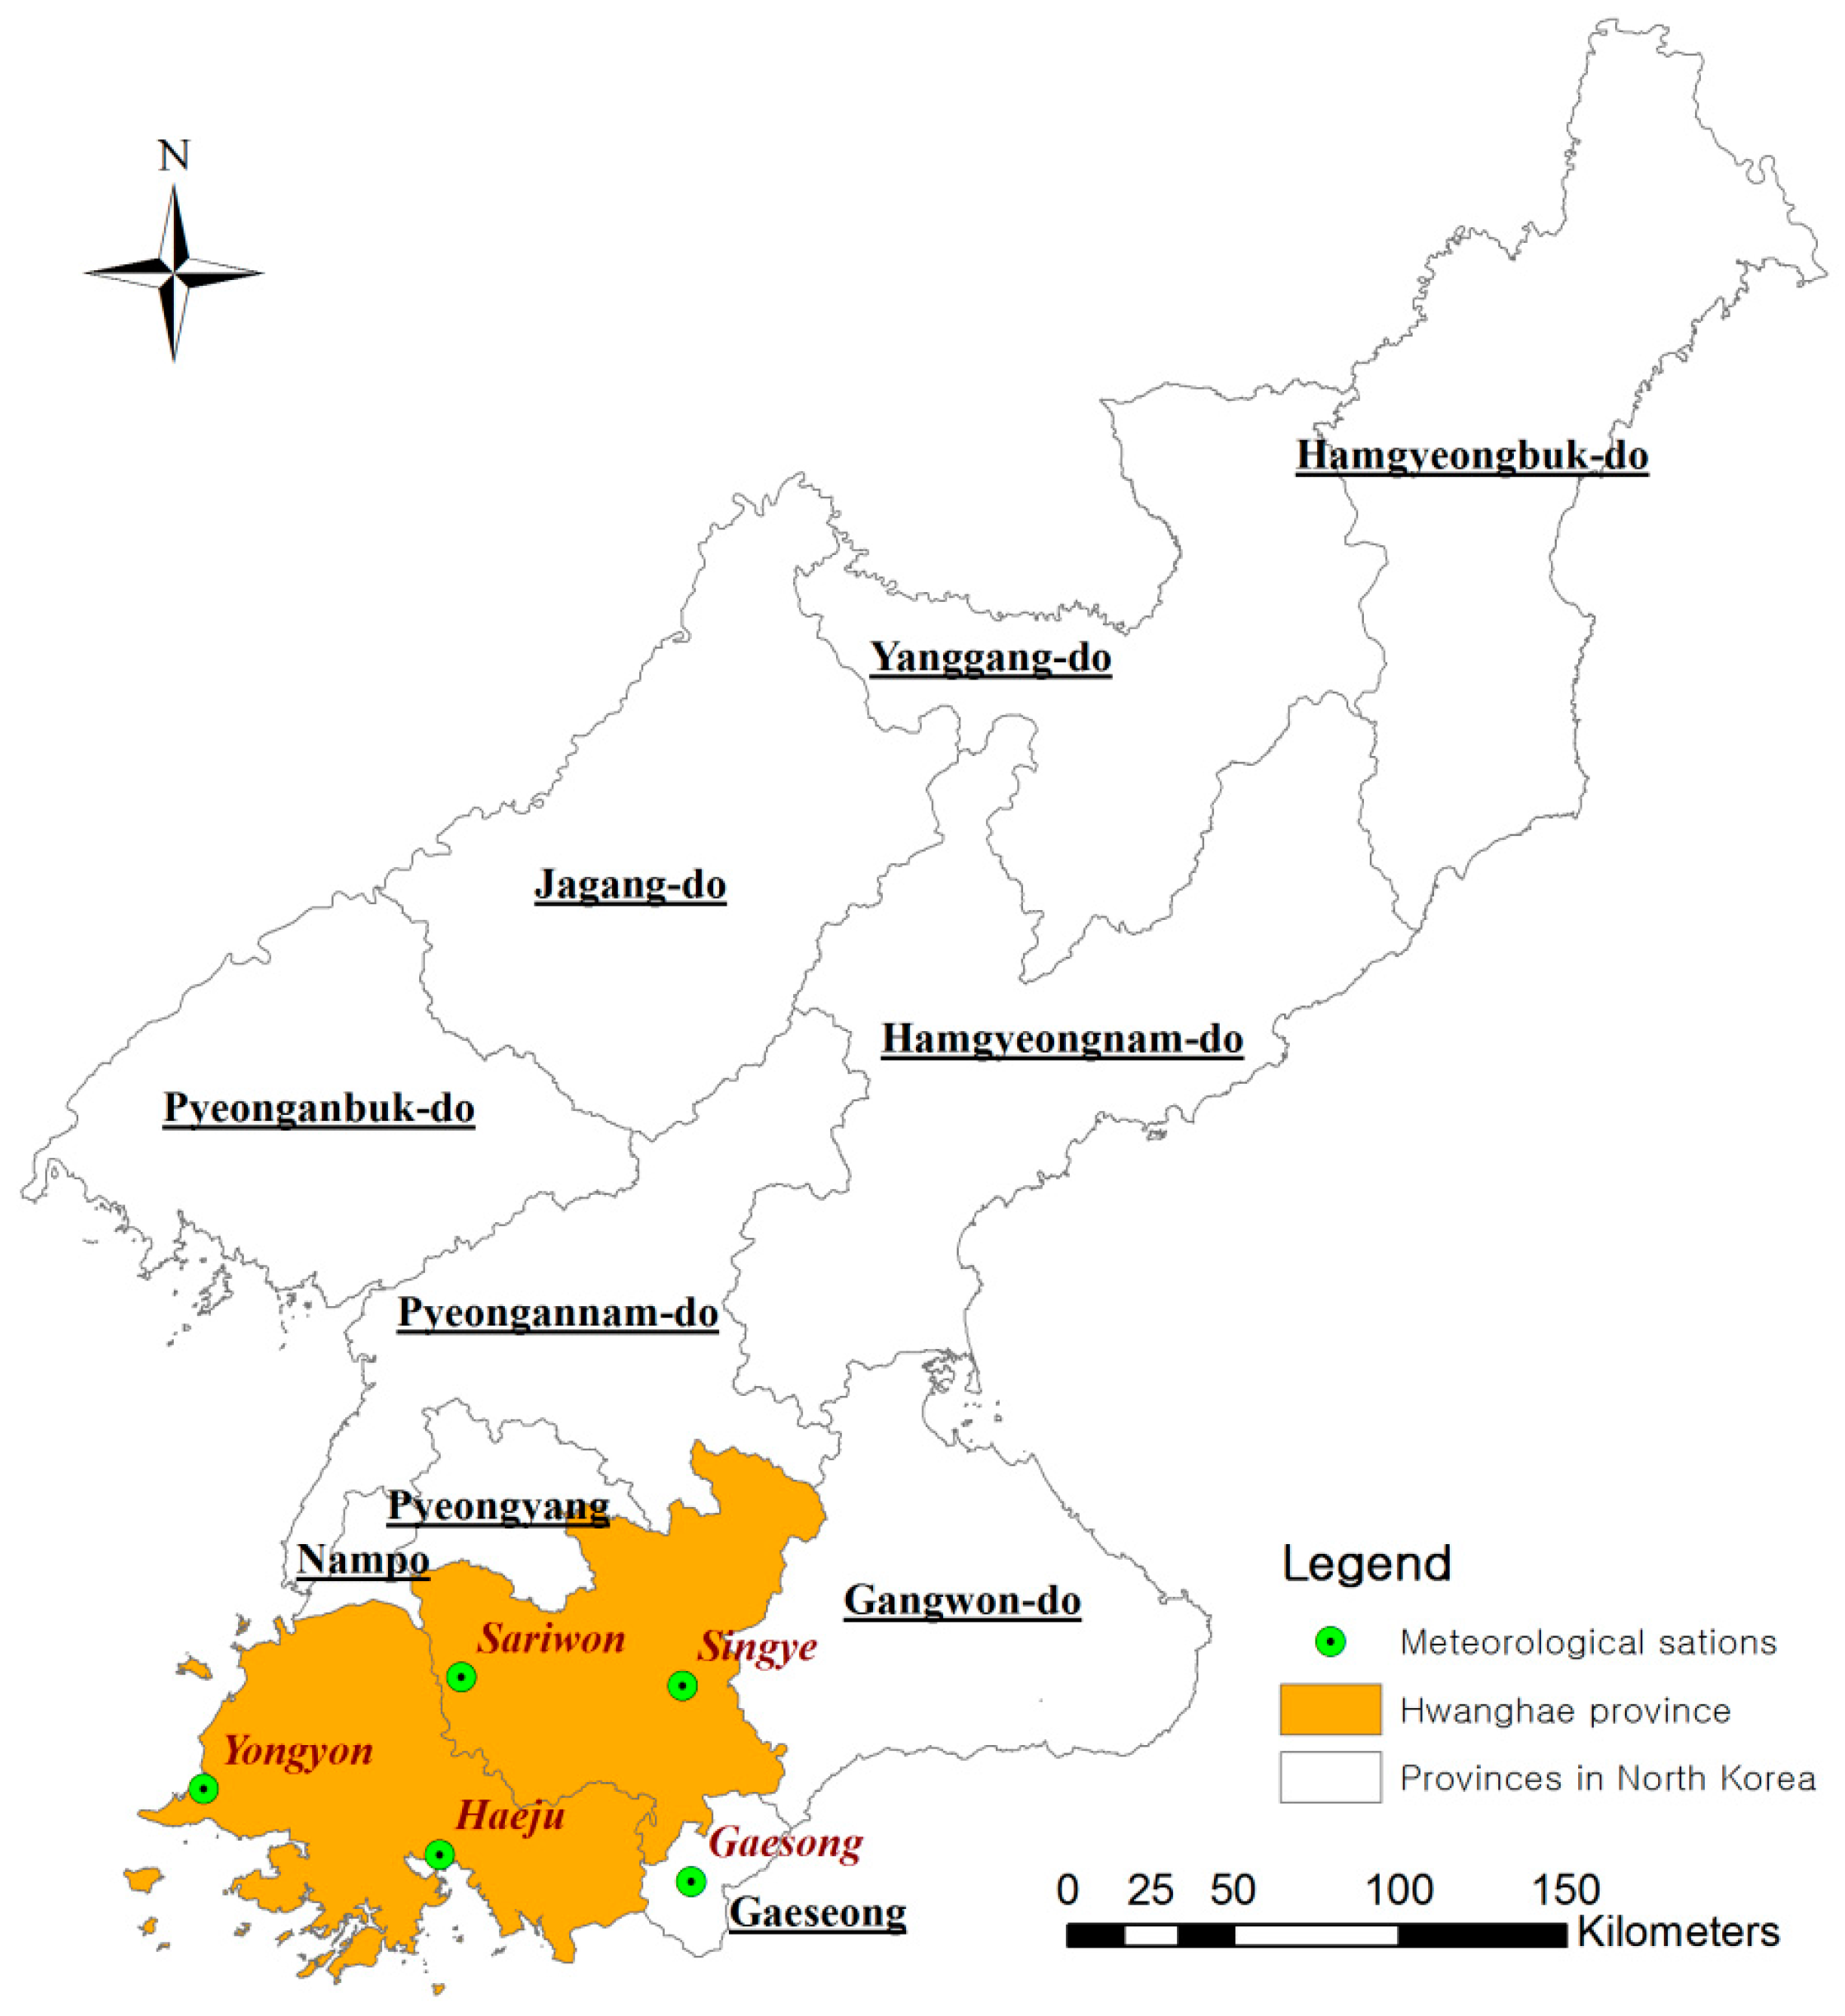
2.1. Downscaled Climate Data in Study Area

The Hwanghae Plain is broadly representative of the cultivation areas of North Korea. It has an area of 16,700 km2, occupying about 14% of the total area of North Korea. Rice is the most important food crop, and the Jaeryeong Plain, which contains the nation’s largest paddy fields, is located within the Hwanghae Plain. Therefore, climate change in this region could result in a collapse of the entire crop supply and consequently cause a severe famine in North Korea. Accordingly, the Hwanghae Plain is the most important area in North Korea for food security. It is located geographically close to the northern part of South Korea with similar climatic conditions; consequently, similar farming methods are applied [4].
Future climate data was simulated using a general circulation model (GCM) considering representative concentration pathways (RCPs) scenarios, which recently became available to the public. These provide the latest climate change scenarios adopted by the Intergovernmental Panel on Climate Change (IPCC) for its fifth assessment report (AR5) [7]. RCPs consist of four independent pathways: RCP 8.5 (high emissions, equivalent to SRES A1F1 or A2), RCP 6.0 (intermediate emissions, B2), RCP 4.5 (intermediate emissions, B1), and RCP 2.6 (low emissions); the numbers represent the possible range of radiative forcing values (W/m2) in the year 2100 [8]. In particular, RCP 4.5 was developed by the Pacific Northwest National Laboratory in the US. Radiative forcing was stabilized shortly after 2100 in the US, consistent with a future with relatively ambitious reductions in emission. This future is consistent with a lower energy intensity, strong reforestation programs, a decreasing use of croplands and grasslands (due to yield increases and dietary changes), stringent climate policies, stable methane emissions, and a slight increase of CO2 emissions prior to an expected emission decline around 2040.
To apply a GCM based on global scale data to a regional scale area, a downscaling process is required, because a bias occurs between the two scales. The representative downscaling method is statistical downscaling, which uses different statistical approaches, such as the theoretical probability functions widely used in hydrology or climatology. These include normal, gamma, Weibull, lognormal, and generalized extreme value (GEV) probability functions [9,10]. However, in this study, we used the downscaled climate data from dynamical downscaling conducted by the National Institute of Meteorological Research (NIMR) at the Korea Meteorological Administration (KMA). Dynamical downscaling uses regional circulation models (RCMs) which transform the output from GCMs into outputs with a finer spatial and temporal resolution. The NIMR at the KMA is jointly participating in the Coupled Model Intercomparison Project phase 5 (CMIP5) [11] with the Met Office Hadley Centre using the Hadley Centre Global Environmental Model version 2 coupled with an atmosphere–ocean configuration (HadGEM2-AO). This GCM processes regional climate models (RCMs) and has a resolution of 12.5 km [12]. Climate change observations using HadGEM2-AO within the CMIP5 framework have played an important role in assessing the influence of future climate changes at the national standard level on the Korean Peninsula, including both South and North Korea.
However, RCMs are known to exhibit systematic biases and only provide rainfall averages for the grid box of a given size [13]. These biases cannot be resolved within the model, and bias corrections are therefore required to obtain reliable results for local scale climates. To process the RCMs from NIMR–KMA, we applied a bias correction, which is a simple method based on removing systematic errors in both the mean and variance of precipitation [14]. It has been used in several hydrological applications for GCM hydrological output, taking into account statistical aspects of the precipitation intensity distribution at a given location [15]. The key advantages of the monthly bias correction approach are the ease and speed of application and direct scaling of the scenario corresponding to changes suggested by the GCM or RCM [16]. In the bias correction process, we used an empirical distribution, because these climate data were already downscaled using the dynamic method; we tried to maintain their characteristics using an empirical distribution rather than theoretical probability functions.
In this study, we estimated a hybrid semi-parametric approach using the empirical distributions of the variables, after adjusting for changes between the location (e.g., mean), scale (e.g., variance), and shape (e.g., skewness) parameters of such distributions. The location parameters can be estimated using the mean or median of the data samples. The corresponding scale parameters can be estimated using the standard deviation or the interquartile range of the data samples [8] using Equation (1),
Χ 0 ^ =   μ 0 + σ 0 σ m ( Χ m     μ m )
where X is the variable, μ is the mean (i.e., location parameter), σ is the standard deviation (i.e., scale parameter), 0 is the present-day observed data, m is the modeled data, and is the future-day projected data.
The observed climate data for the Hwanghae Plain was obtained from the Korea Meteorological Administration (KMA), who have operated five meteorological stations across the region from 1981 to 2010 as shown on Figure 1 and Table 1 [17].

2.2. Assessment of Drought Condition Using the SPI and SPEI

Drought conditions can be aggravated by climate change accompanied by water scarcity [18], and changes in precipitation and other climatic variables due to climate change can lead to significant changes in water security worldwide [19,20,21,22]. However, the occurrence of a drought event depends on the spatial and temporal situation, and drought severity is therefore difficult to quantify. Therefore, several studies have developed various drought indices [23,24,25,26] to quantitatively evaluate the severity of drought due to the considerable decrease in water availability from a precipitation deficit [27,28,29].
The standardized precipitation index (SPI) is a representative drought index related to precipitation [24]. SPI fits and transforms medium-term precipitation records into a normal distribution. It can be computed for different timescales, is symmetric for both dry and wet spells, and is related to probability [30]. Therefore, SPIs over multiple timescales can be used to evaluate the impacts of climate change individually on short and medium-term droughts by measuring the cumulative precipitation running over one, three, and six-month periods using a standardized normal distribution [24]. SPI has been used in several studies to evaluate the severity of meteorological drought [18,31,32,33,34,35,36].
Climate change is related to variables such as temperature, evapotranspiration, wind speed, and soil water holding capacity. The standardized precipitation evapotranspiration index (SPEI) was therefore proposed as an improved drought index, suited to the analysis of the impacts of global warming on drought severity [23,26]. While SPEI considers the effect of reference evapotranspiration on drought severity, multiple timescales of SPEI can be identified for different drought types. Although SPEI was only recently developed, it has been applied in various studies for analyzing drought variability, severity, and the impacts of climate change on drought condition [23,37,38,39,40].
A one-month SPI (or SPEI) is related to the percentage of normal precipitation for a 30-day period, and the SPIs (or SPEIs) are comparable across time and space because the distribution has been normalized. Therefore, its application can be closely related to types of meteorological drought, along with short-term soil moisture and crop stress, especially during the growing season, because the one-month SPI reflects short-term conditions [41]. The one-month SPI (or SPEI) might approximate conditions represented by the crop moisture index, which is part of the Palmer drought severity index (PDSI) suite of indices [41]. The three or six-month SPI (or SPEI) provides a comparison of precipitation over a specific three or six-month period with the precipitation totals from the same three or six-month period for all studied years. A three-month SPI (or SPEI) reflects medium-term moisture conditions and provides a seasonal estimation of precipitation. The six-month SPI indicates seasonal to medium-term trends in precipitation, and is still considered more sensitive to conditions at this scale than the Palmer index [41].

2.2.1. Calculation of the Standardized Precipitation Index (SPI)

SPI was developed for the purpose of defining and monitoring droughts [24]. It is a simple multi-scale index that is computed as a standardized transform of cumulative precipitation over a given period [42]. It has increasingly been used over the last two decades, due to its solid theoretical development, robustness, and versatility for drought analysis [43]. SPI is based on the conversion of precipitation data into probabilities based on medium-term precipitation records. These medium-term records are fitted to a probability distribution, which is transformed into a normal distribution with an average of 0 and standard deviation of 1 [24,44].
The fundamental benefit of using SPI is that it can be calculated over multiple timescales; this is very important because the timescale over which precipitation deficits functionally accumulate divides the types of drought into categories [24]. This versatility in timescale allows SPI to monitor short-term water supplies, such as soil moisture, which is important for agricultural production, and medium-term water resources, such as groundwater supplies, streamflow, and lake and reservoir levels [45,46,47]. The National Drought Mitigation Center (NDMC) computes the SPI for multiple timescales (1, 3, 6, 9, and 12 months), but the index is flexible with respect to the selected period [32].
However, the limitation of SPI is that its calculation is based only on precipitation data. Accordingly, the drought effects from warming predicted in global climate models can be clearly seen in the PDSI, whereas the SPI does not reflect the expected changes in drought conditions [18]. However, the PDSI lacks the multi-scalar characteristics essential for both assessing drought in relation to different hydrological systems and differentiating between different drought types [26].

2.2.2. Calculation of Standardized Precipitation Evapotranspiration Index (SPEI)

The main criticism of SPI is that it is calculated using only precipitation data, and droughts are assumed to be primarily controlled by the temporal variability in precipitation [26,45]. Therefore, SPI relies on the assumption that the variability in precipitation is much greater than that of other variables. SPEI is based on the original procedure used to calculate SPI, and it uses the monthly (or weekly) difference (D) between precipitation (P) and potential evapotranspiration (PET). This difference (D) is also the water surplus or deficit for a given month (i), and is calculated using:
D i = P i     PET i
SPEI can be obtained as standardized values of the probability distribution function of the monthly difference (D) series. The log-logistic distribution can be applied over multiple timescales, such as at one, three, and six months. Therefore, it is possible to analyze both short and medium-term droughts.
Recently, PET has been calculated using both simple and complex methods [33], both of which provide similar results when a drought index, such as the PDSI, is calculated [26]. To calculate PET (mm) in this study, a simple approach was applied, which has the advantage of only requiring data on monthly-mean temperature, and is expressed as:
PET = 16 K ( 10 T I ) m
I = i = 1 12 ( T i 5 ) 1.514
K = ( N 12 ) ( NDM 30 )
m = 6.75   ×   10 7 I 3     7.71   ×   10 5 I 2 + 1.79   ×   10 2 I + 0.492
where PET is the potential evapotranspiration, T is the monthly-mean temperature (°C), and I is the heat index, which is calculated as the sum of 12 monthly index values (i), and i is derived from the mean monthly temperature. K is a correction coefficient, computed as a function of the latitude and month, and m is a coefficient based on the heat index I. NDM is the number of days of the month and N is the maximum number of sun hours.
Wet and drought conditions can be classified using the SPI. Table 2 shows the dryness/wetness grade categorized according to SPI; this standardization is a mechanism for applying SPI to determine the rarity of a current drought [24,26,48]. An index of (+2) indicates an extremely wet condition; (1.5) to (1.99), severely wet; (1.0) to (1.49), moderately wet; (0.99) to (0.0), near normal; (0.0) to (−1.0), mildly dry; (−1.0) to (−1.49), moderately dry; (−1.5) to (−1.99), severely dry; and (−2.0) or less, extremely dry.

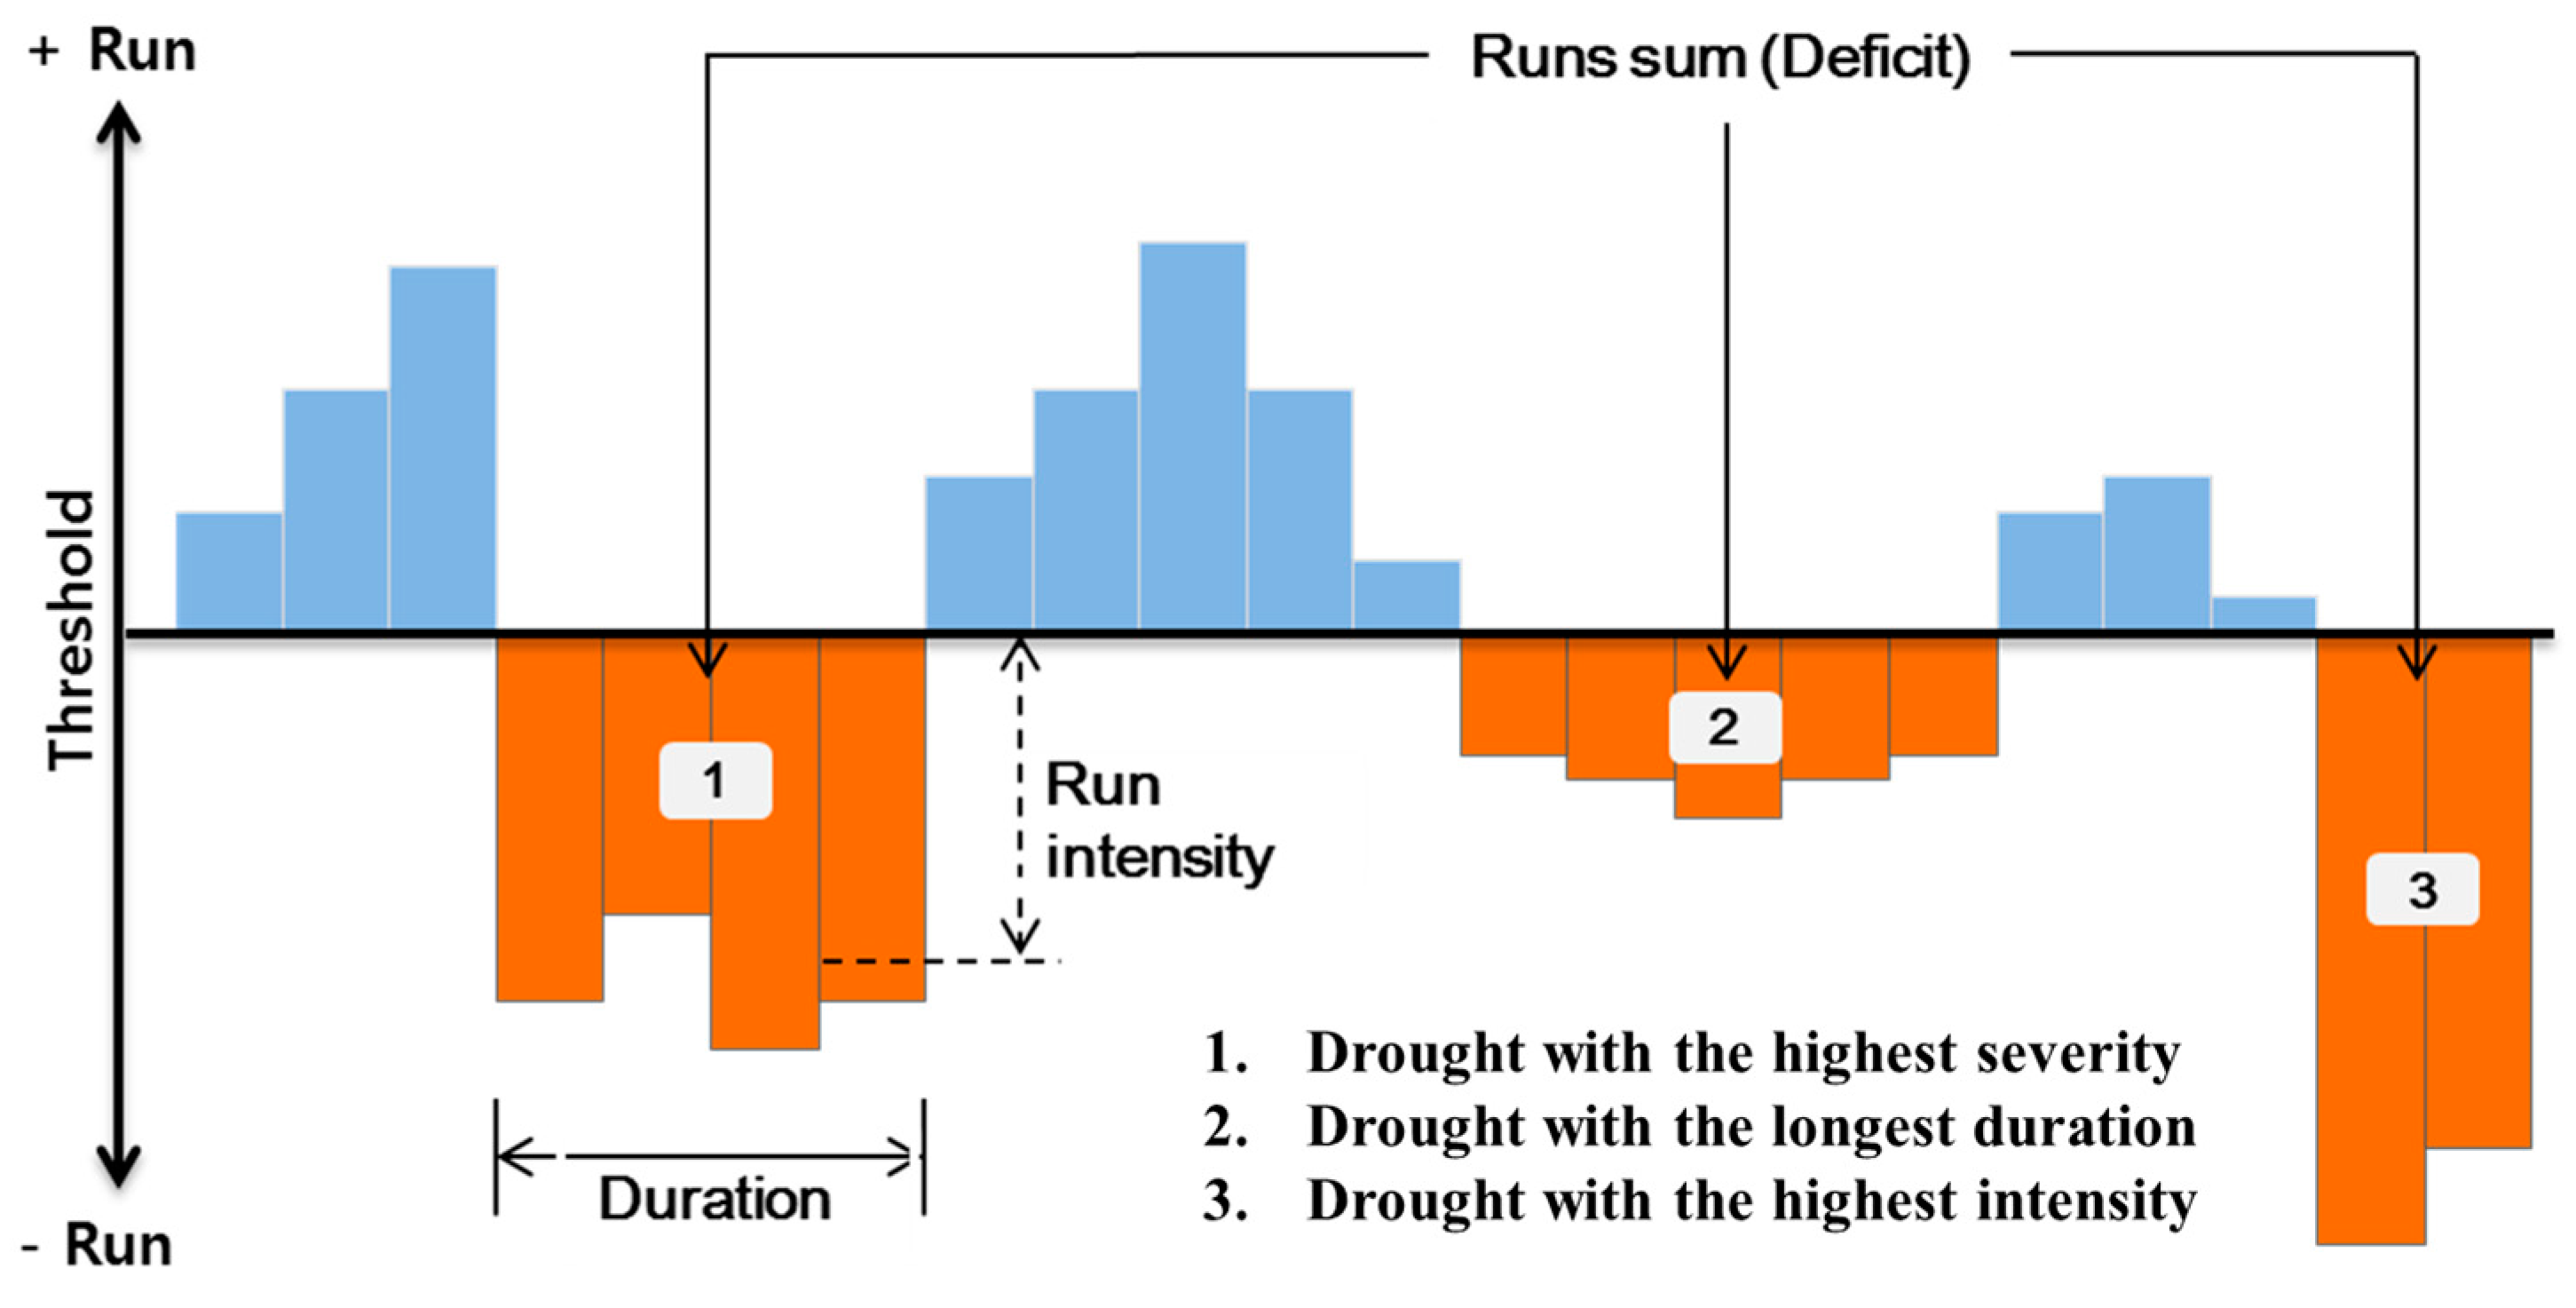
2.3. Analysis of Severity, Duration, and Intensity of Time Series SPI and SPEI Using Runs Theory

Drought characteristics include various drought conditions, such as duration, severity, and intensity [49]. A probabilistic methodology widely-used in drought characterization is the theory of runs proposed in Yevjevich [50], which estimates the return periods of extreme events [51]. We applied the runs theory to analyze drought characteristics based on the SPI and SPEI.
Figure 2 shows drought characteristics using the runs theory for a given threshold level. A run is defined as a portion of time series of a drought variable, in which all values are either below or above the selected truncation level; accordingly, it is called either a negative or positive run [45]. Various statistical parameters concerning drought duration, severity, and intensity at different truncation levels are particularly useful for drought characterization. In runs theory, drought duration is expressed in years, months, weeks, or any other time period, during which a drought parameter is continuously below the critical level. Drought severity indicates a cumulative deficiency of a drought parameter below the critical level. Drought intensity is the average value of a drought parameter below the threshold level, which is measured as the drought severity divided by the duration. In this study, we estimated drought duration, severity, and intensity using runs theory and time series SPI and SPEI from 1981 to 2100.

3. Results

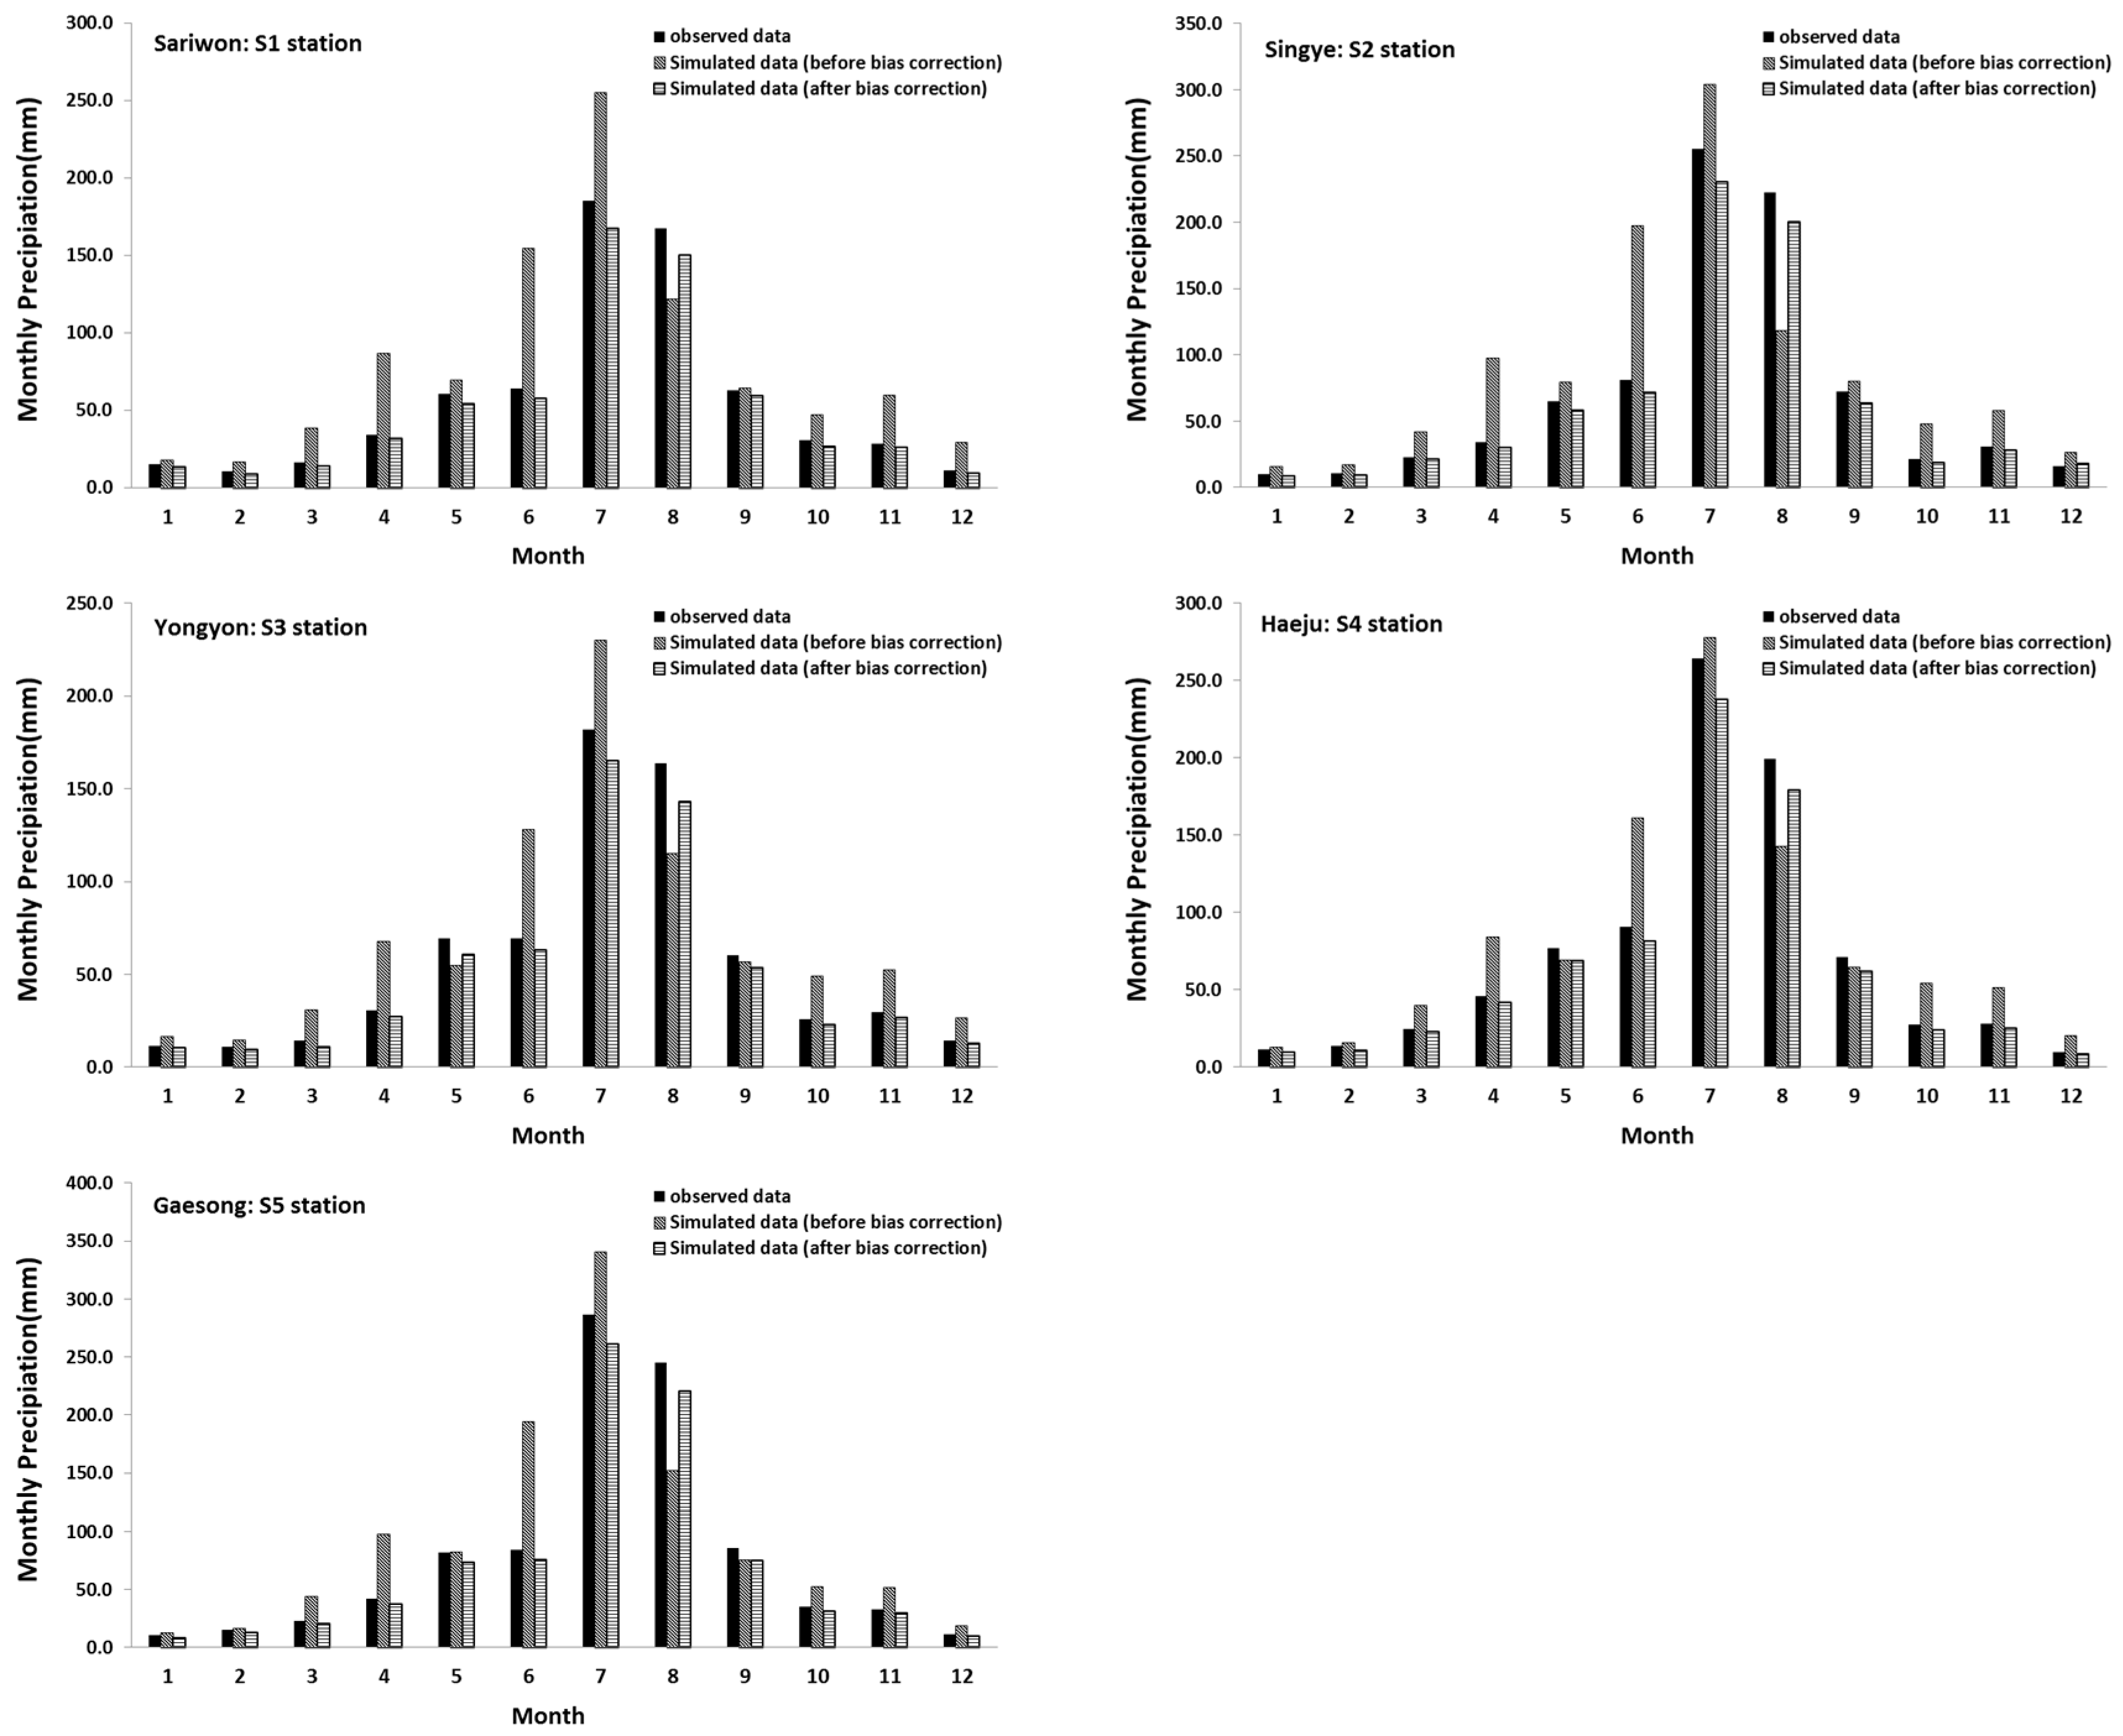
3.1. Downscaled Climate Data under RCP 4.5 Scenario Using the Monthly Bias Correction

We conducted bias correction using local climate data, and generated downscaled climate data for the five meteorological stations for the period from 1981 to 2005. Figure 3 shows the observed monthly precipitation and simulated data before and after applying monthly bias corrections at each station. The downscaled monthly precipitation after bias correction better matched the observed data, even though the latter indicated a slightly lower value. The simulated monthly precipitation from GCM showed larger values than the observed data, and the downscaled process with monthly bias corrections rendered a simulated monthly precipitation similar to the observed monthly precipitation at all stations. The drought season typically falls during April in North Korea, and the precipitation in April shows a significant correction with the monthly bias correction. These results indicated that the monthly bias correction was suitable for the downscaling of the climate data from the GCM. We applied the monthly bias correction to the future climate data from the GCM and generated reasonable climate data for future seasons.

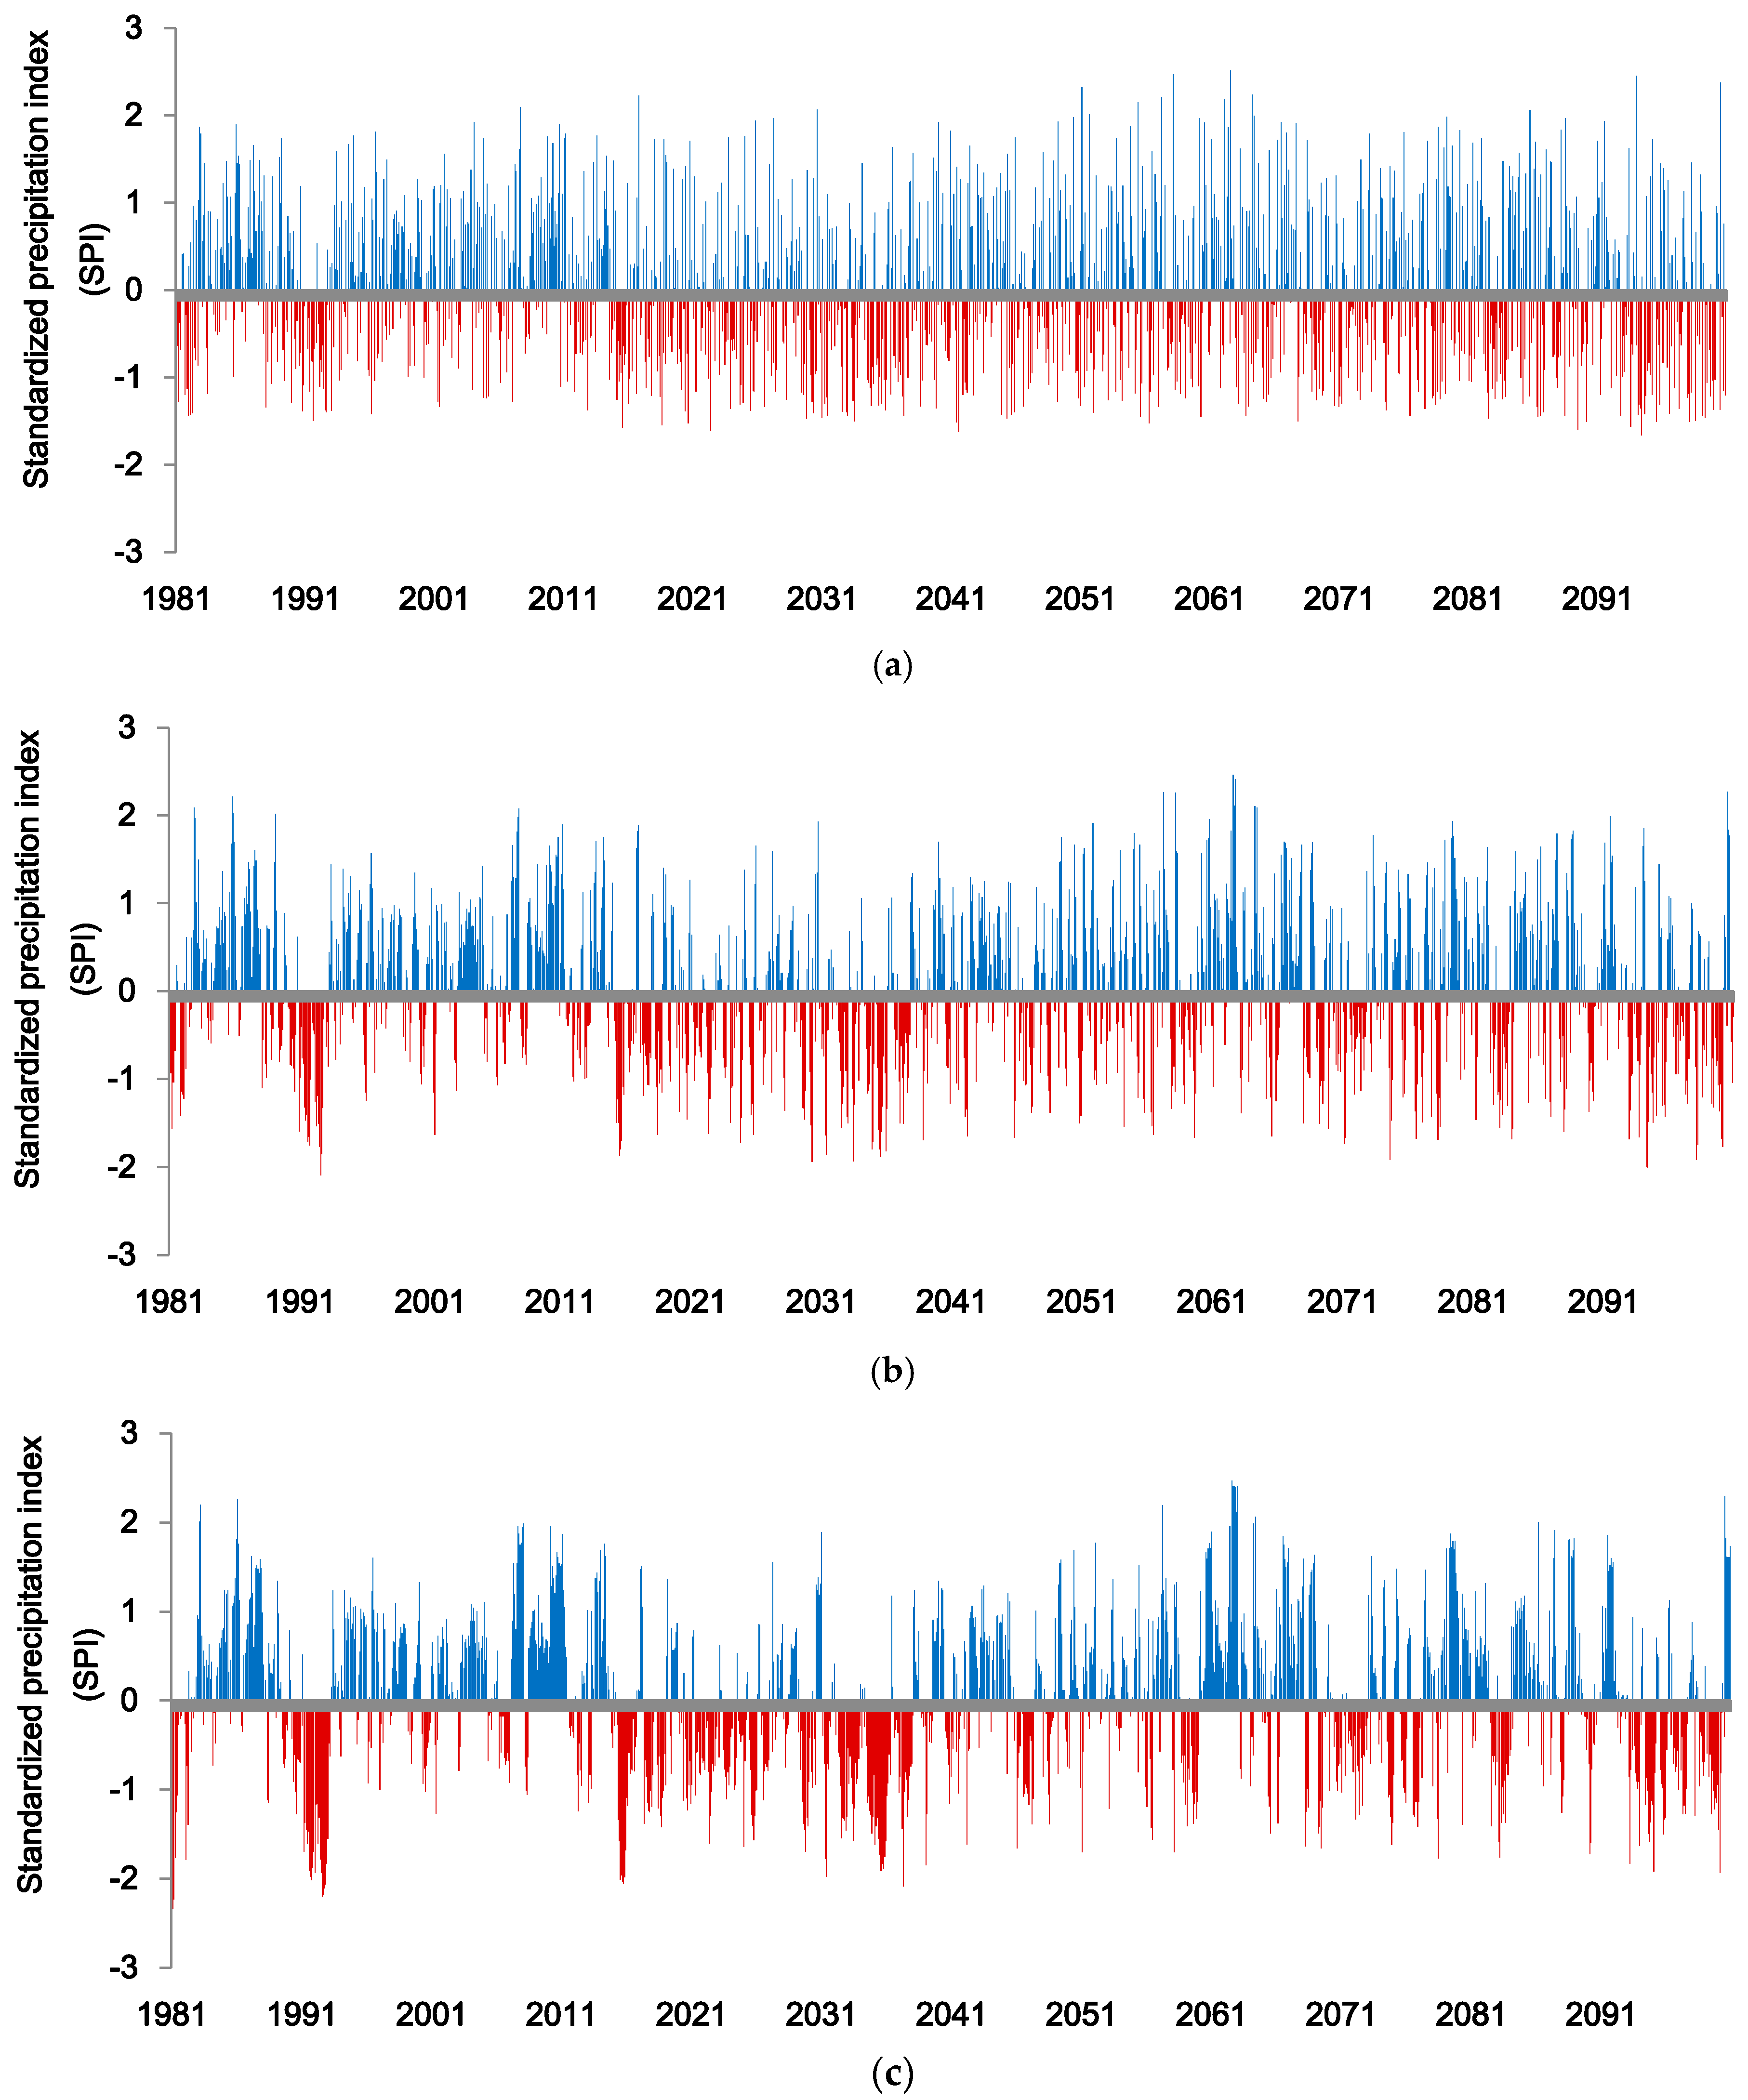
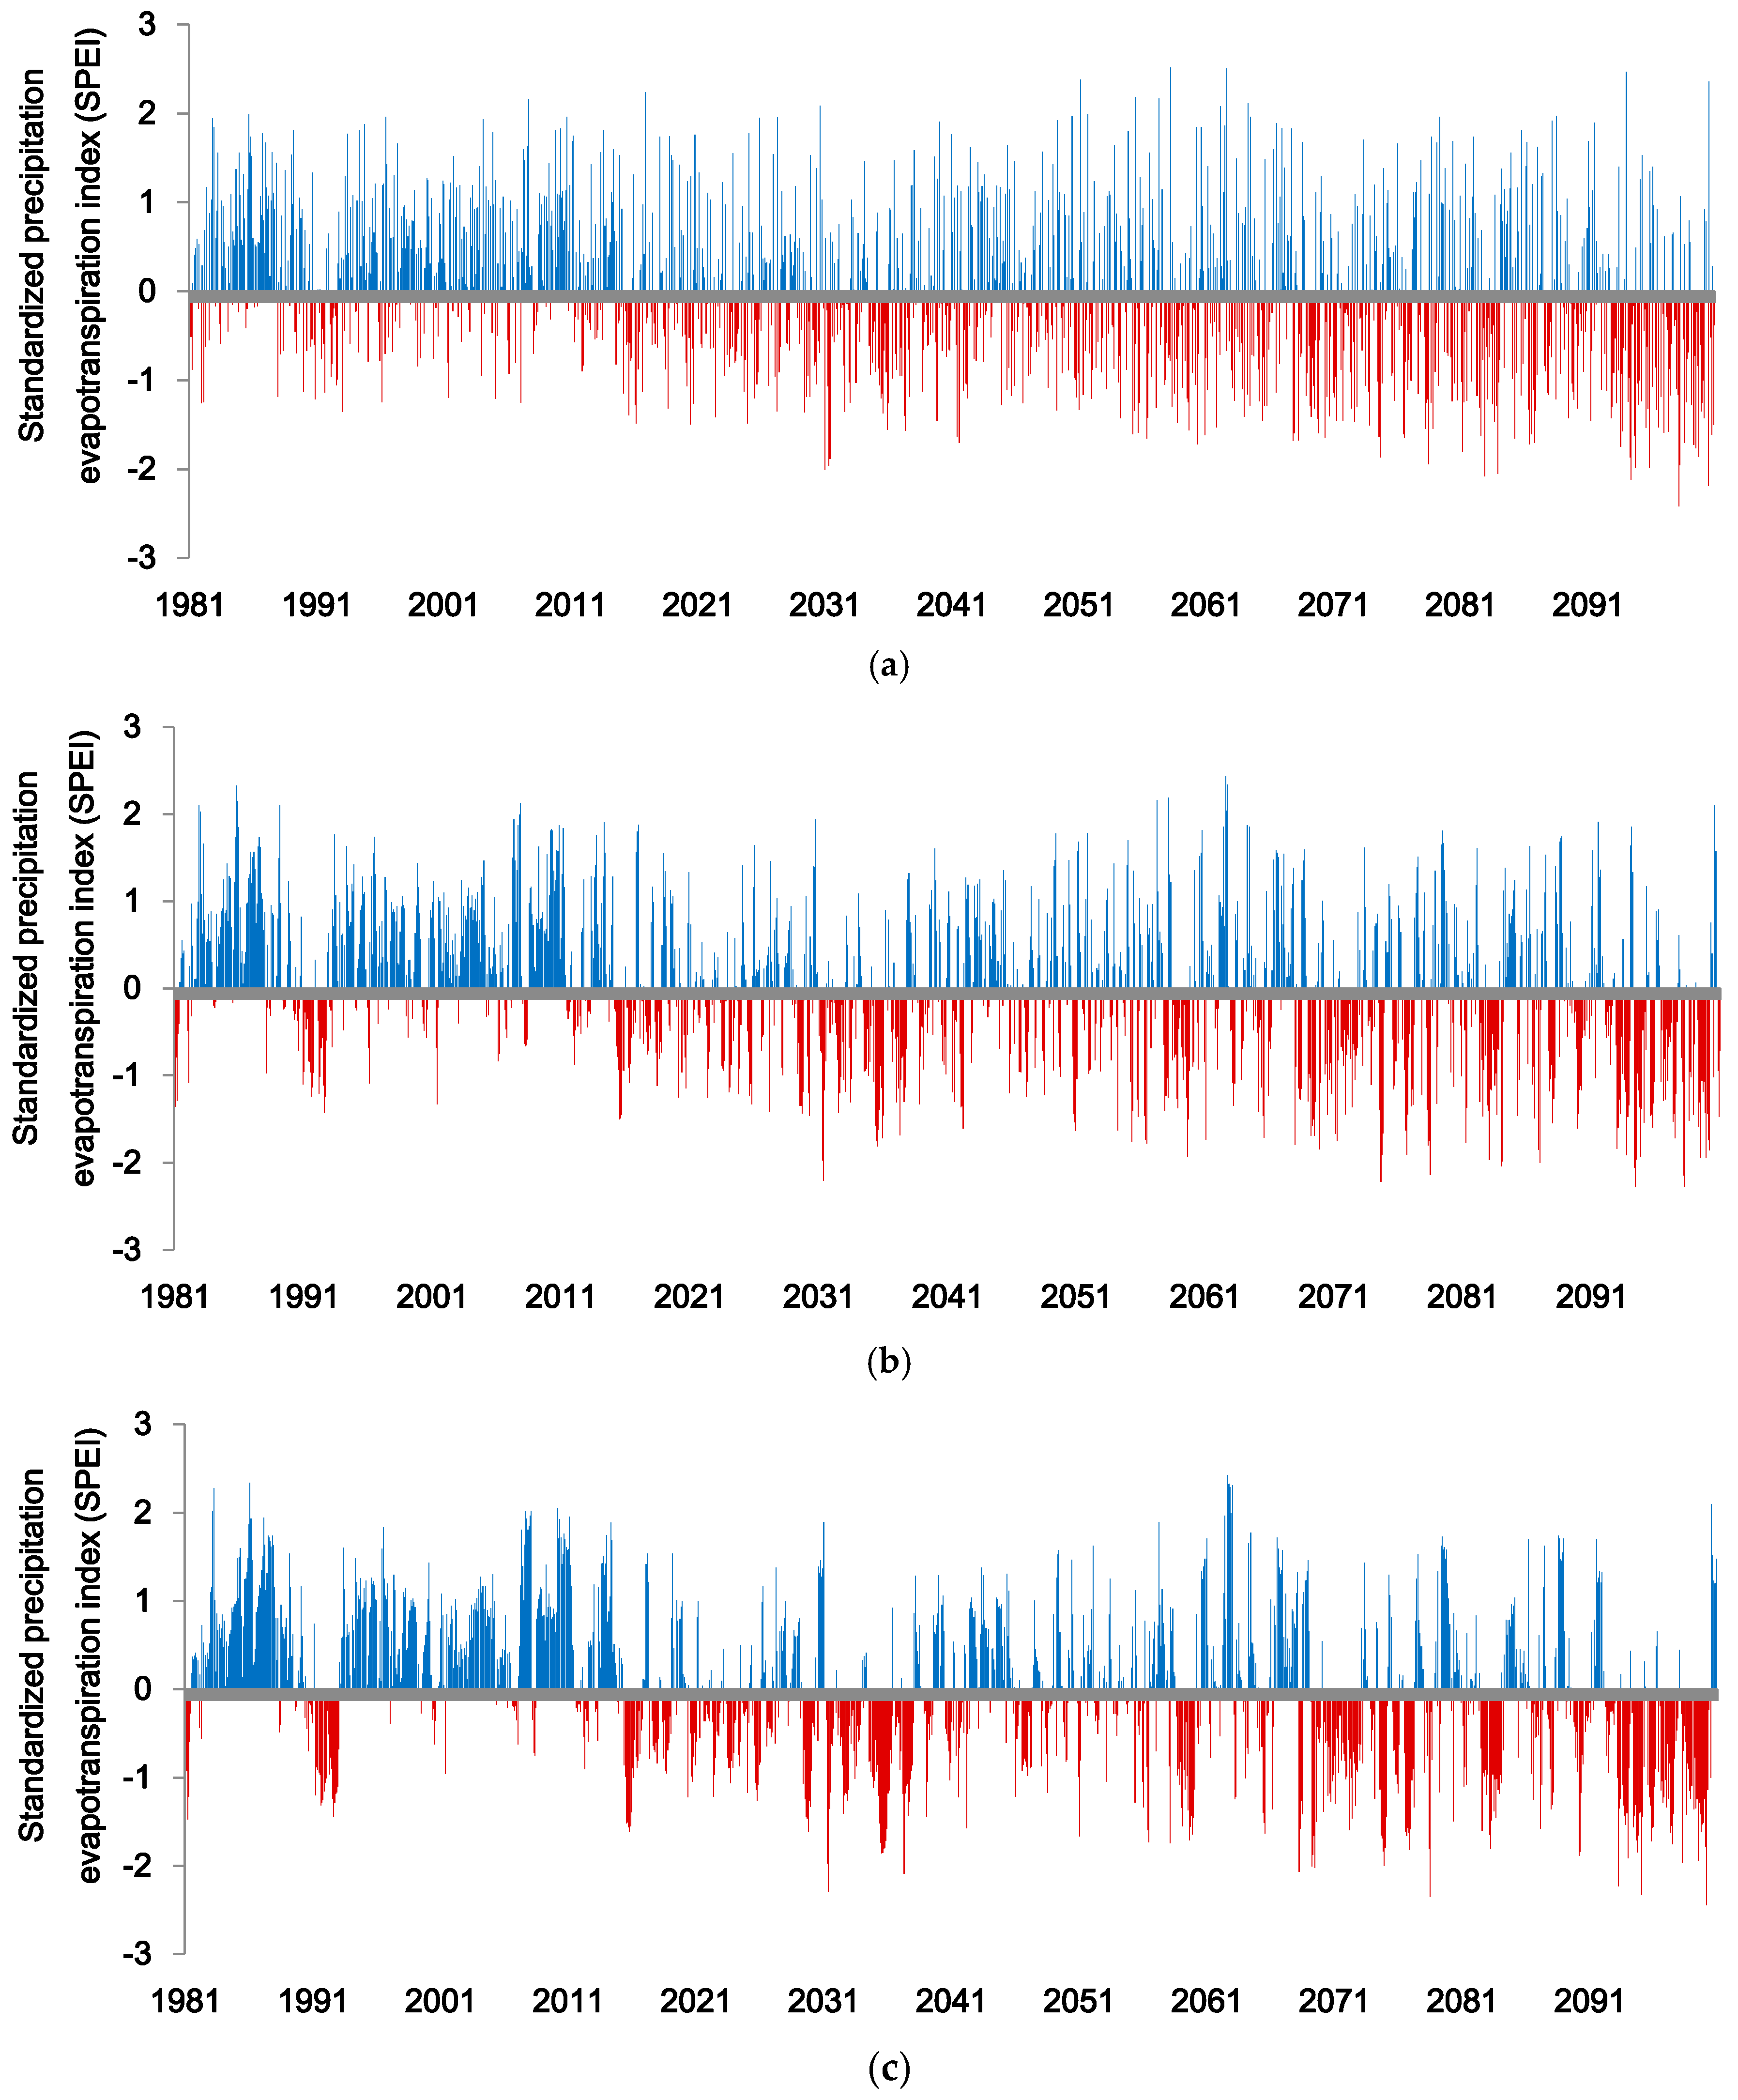
3.2. Estimation of Multiple Timescale SPI and SPEI for 1981–2100

Multiple timescale SPI and SPEI were computed using both observed climate data from 1981 to 2010 and simulated climate data based on the RCP 4.5 scenario from 2011 to 2100 simultaneously (Figure 4 and Figure 5). The SPIs decreased in the near future compared to other periods; however, SPEI was at its lowest in the distant future. More explicitly, given the same climate situation, a difference between SPI and SPEI was generated, thus we need to analyze this difference to understand and cope with future drought. In this study, we estimated conditional probabilities of SPI and SPEI, which were used to measure the probability of a given event when another particular event has occurred. Given two events, A and B, from the sigma-field of a probability space with P(B) > 0, the conditional probability of A given B is defined as the quotient of the probability of both events A and B and the probability of B.
The conditional probability of the one, three, and six-month SPI (or SPEI) given an SPEI (or SPI) was measured from 1995 to 2085, as shown in Table 3. We set −1.0 for SPI and SPEI as the threshold value for the drought condition; therefore, drought events (A and B) were assumed from the probability of SPI (<−1.0) and SPEI (<−1.0). We also calculated the conditional probability of SPI (<−1.0) (or SPEI) given by SPEI (<−1.0) (or SPI) to analyze the impact of climate change on the relationship between SPI and SPEI.
The condition where, in 1995, the one-month SPEI was below −1.0 and the probability of 1-month SPI was below −1.0 resulted in a P(A|B) of 0.99. This indicates that all droughts identified using the SPEI were also identified as droughts with the SPI. In contrast, the P(B|A) for 1-month SPI and SPEI was 0.47 in 1995. These results indicate that SPI could also detect a drought condition that was identified with SPEI within the same historical period; however, climate change could reverse the relationship between SPI and SPEI in the future. The P(A|B) of one-month SPI and SPEI dropped to 0.72 in 2085s, and dropped more significantly to 0.54 for medium-term drought. In contrast, the P(B|A) increased in future seasons; for the one-month SPI and SPEI, it increased to 0.95 in 2085.
The variation and frequency of SPI could also be a primary factor in evaluating drought conditions; therefore, we created a box graph to identify the statistical variation in SPI. Figure 6 shows the boxplot of the multiple timescale SPIs and SPEIs in each period, indicating that climate change could increase the fluctuation in the interquartile range (IQR) for multiple timescale SPIs in 2085. In particular, the six-month SPI showed a significant change in IQR from 1995 to 2085. In addition, the lowest datum within 1.5 of the lower quartile decreased, indicating that the probability of occurrence of severe drought increases with climate change. The boxplot of SPEI indicates that climate change has an impact on drought. The IQR of one-month SPEI broadened for future seasons, with a decrease in the median value of SPEI. In addition, the lowest datum of the one-month SPEI decreases in the future, which means a more severe drought condition. However, the lowest datum of one-month SPEI will not change dramatically. In contrast, the six-month IQR fluctuated between time periods, and the lowest datum significantly decreased in 2085. The boxplot for SPEI indicated that the seasonal drought condition could be more influenced by climate change in both short and medium-term droughts.

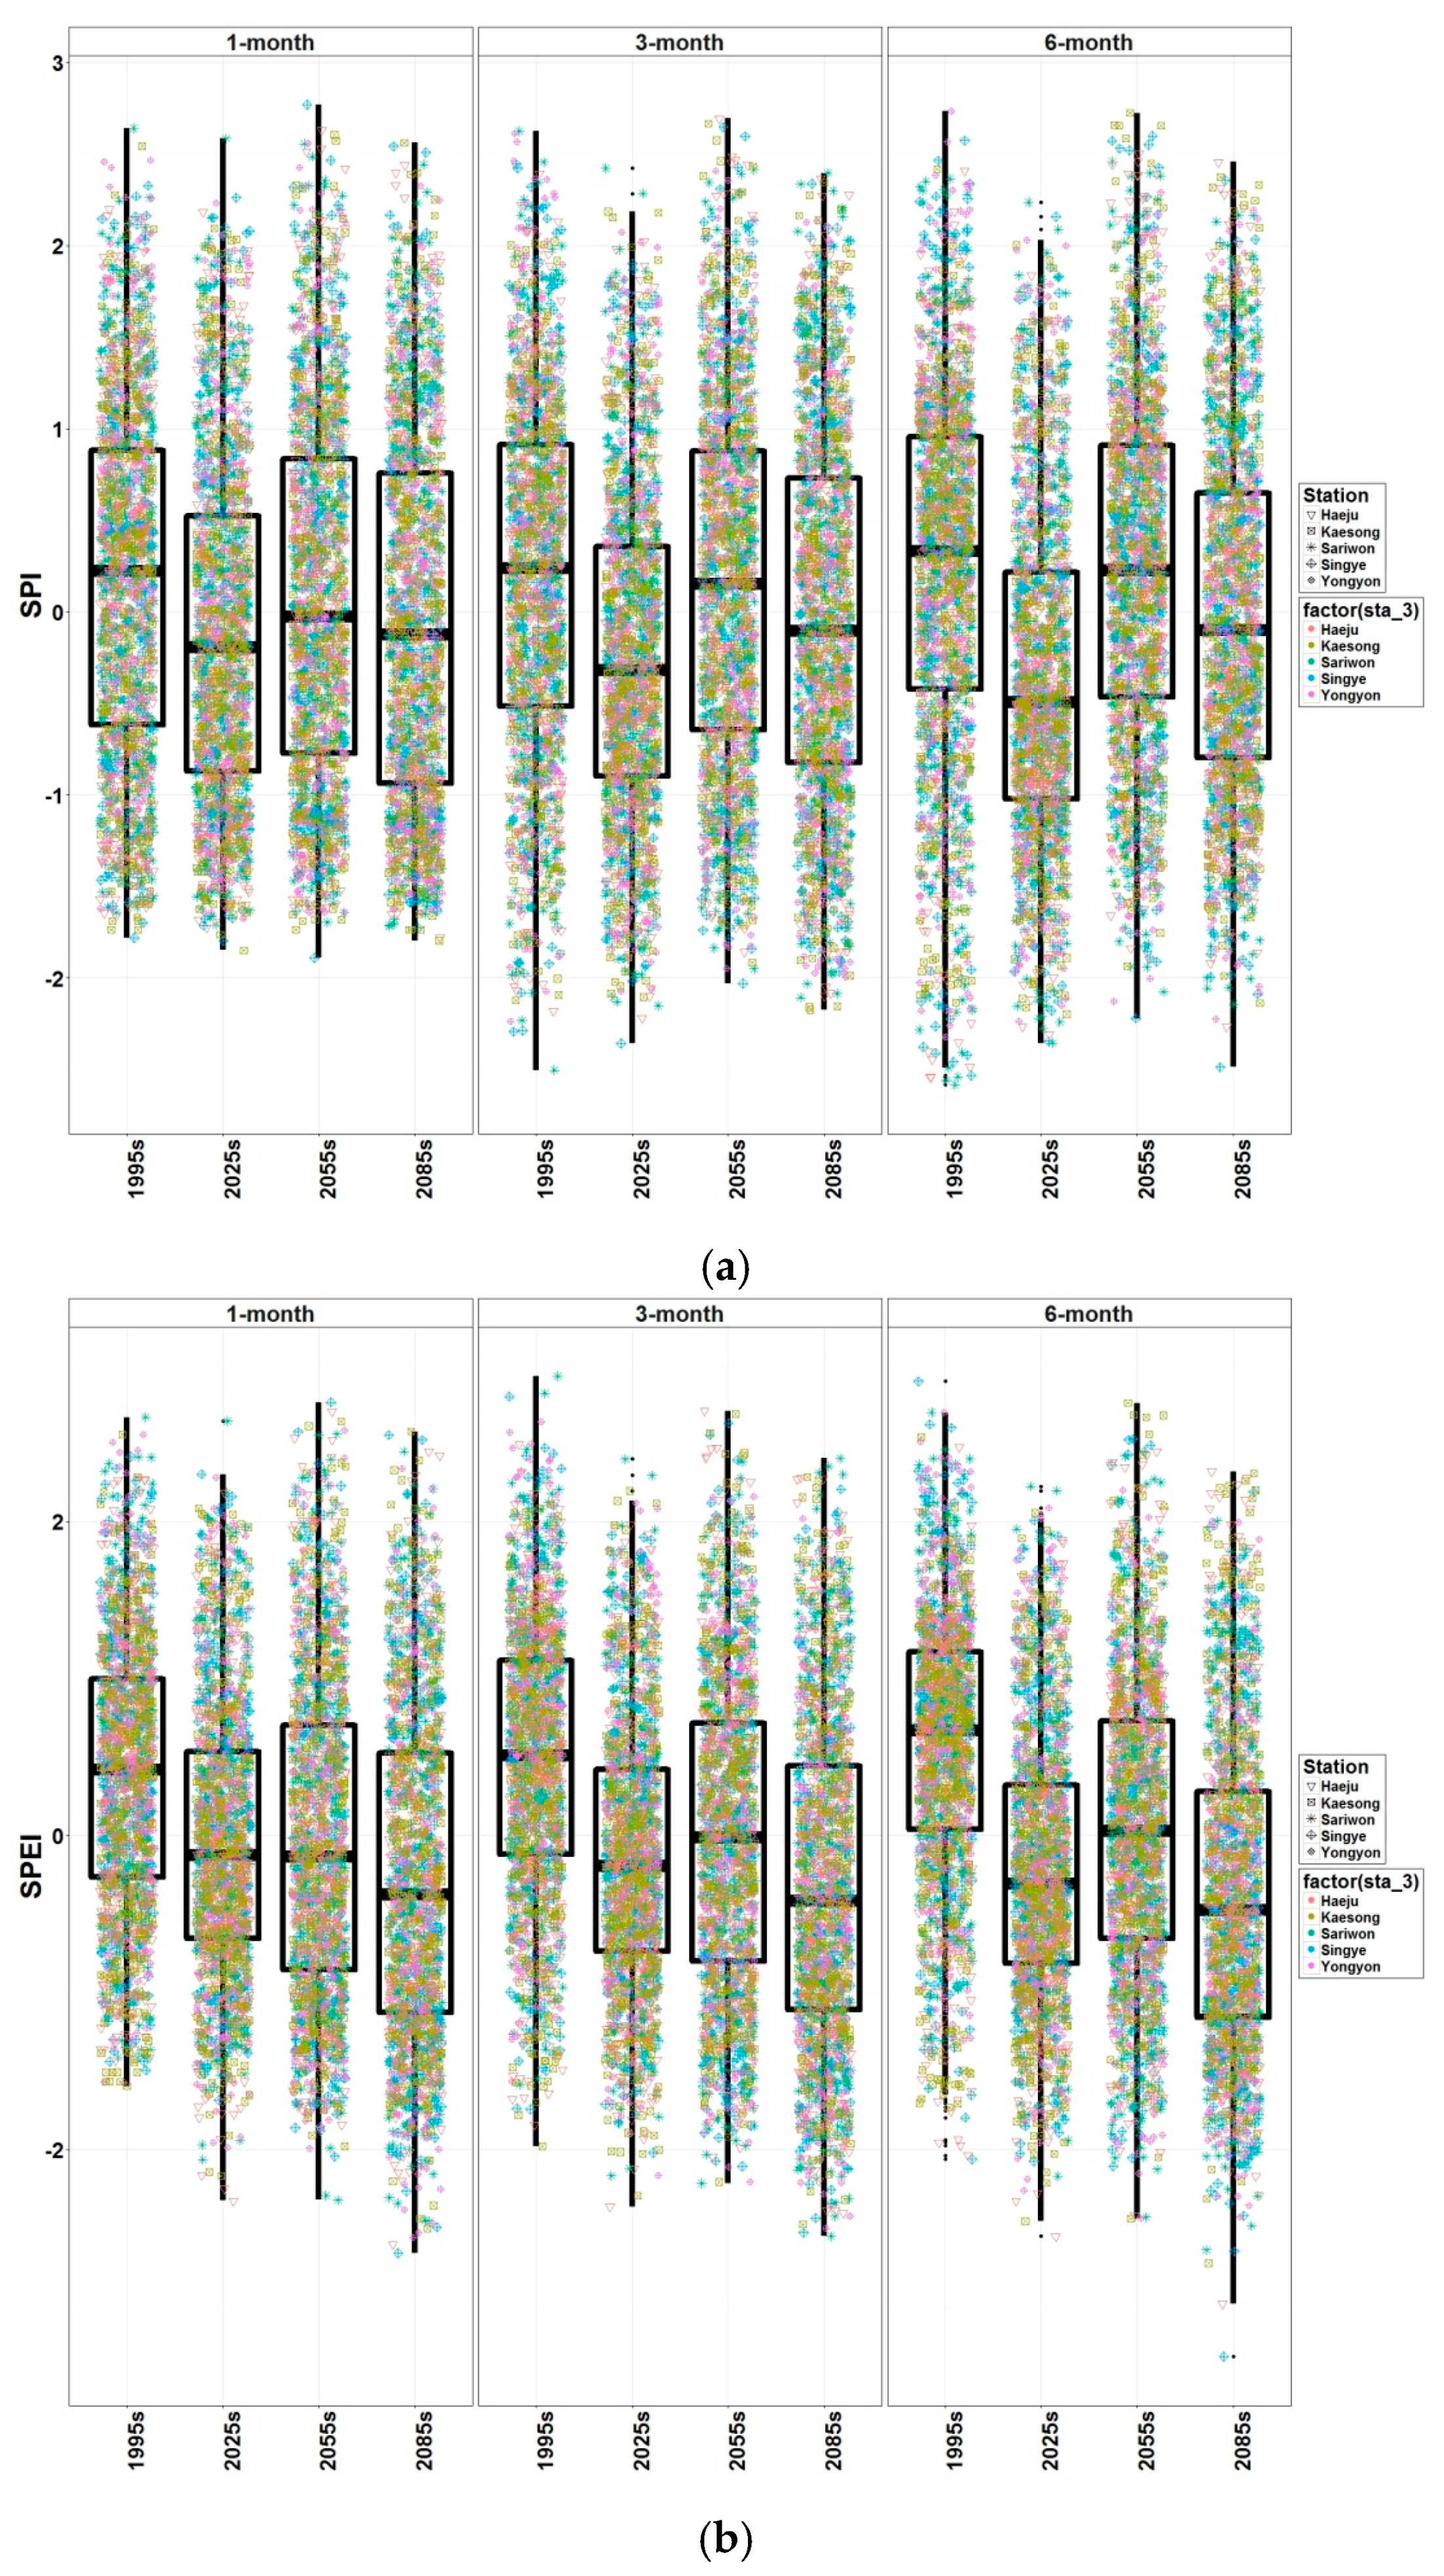
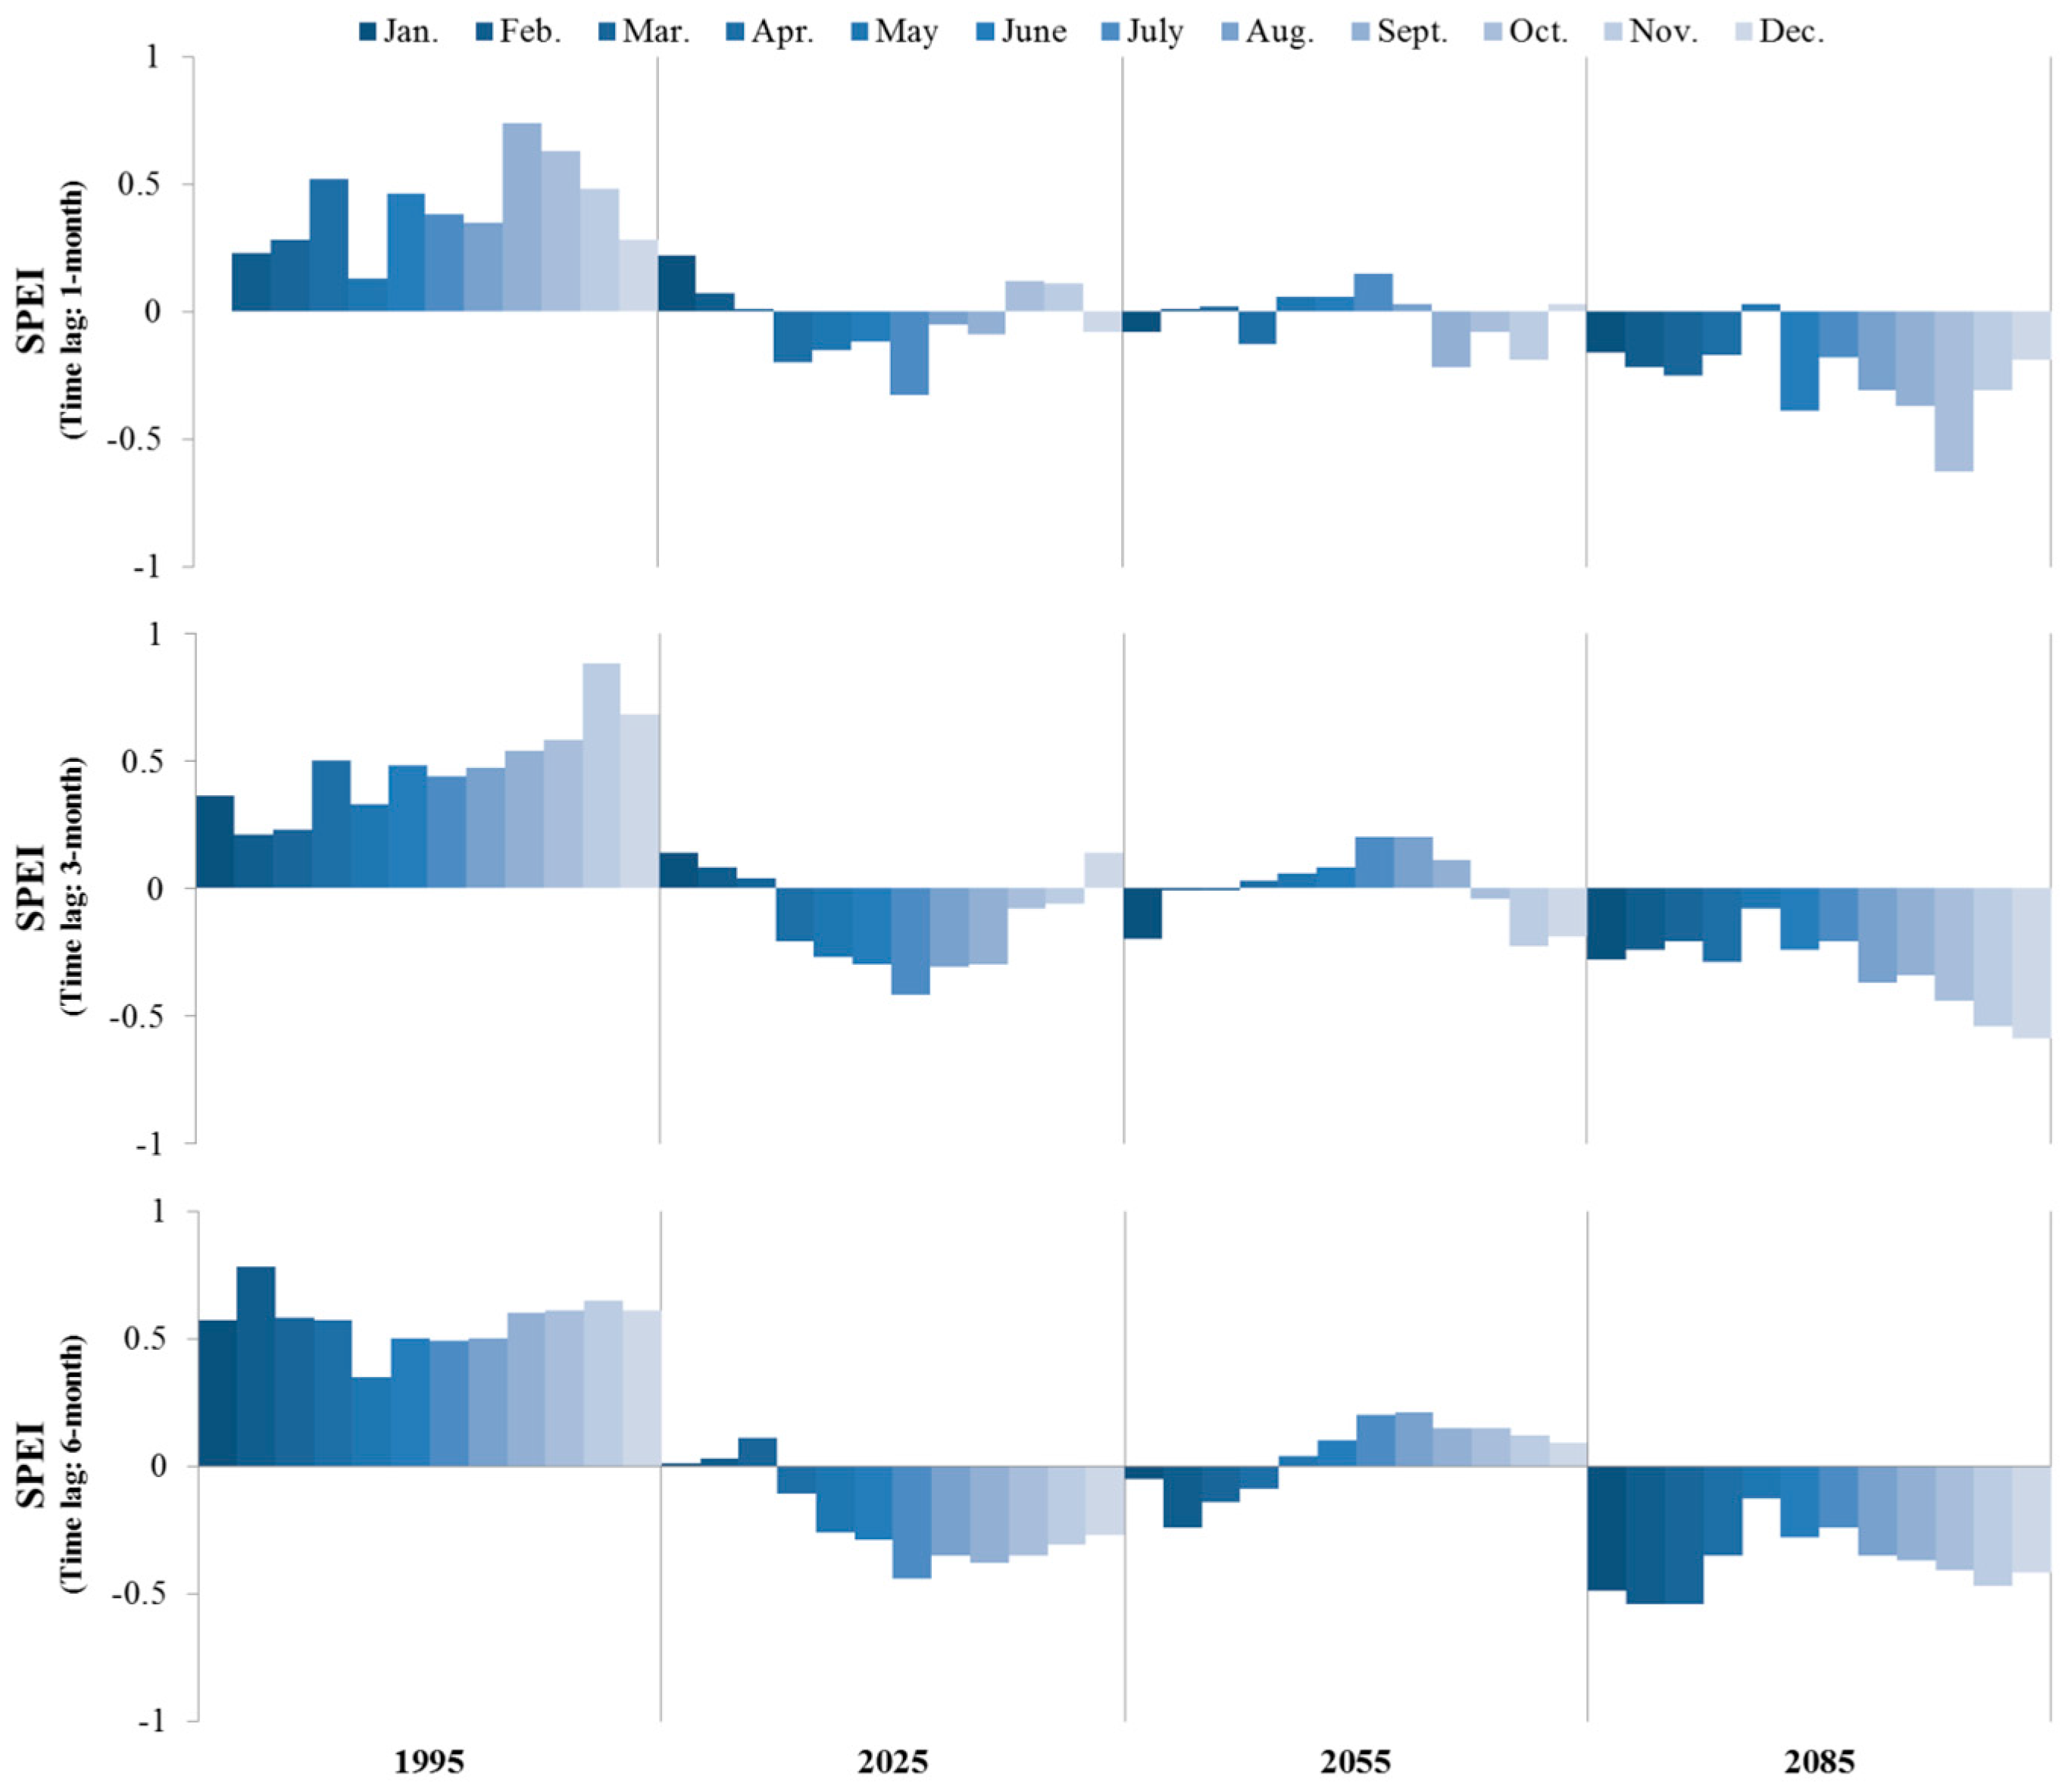
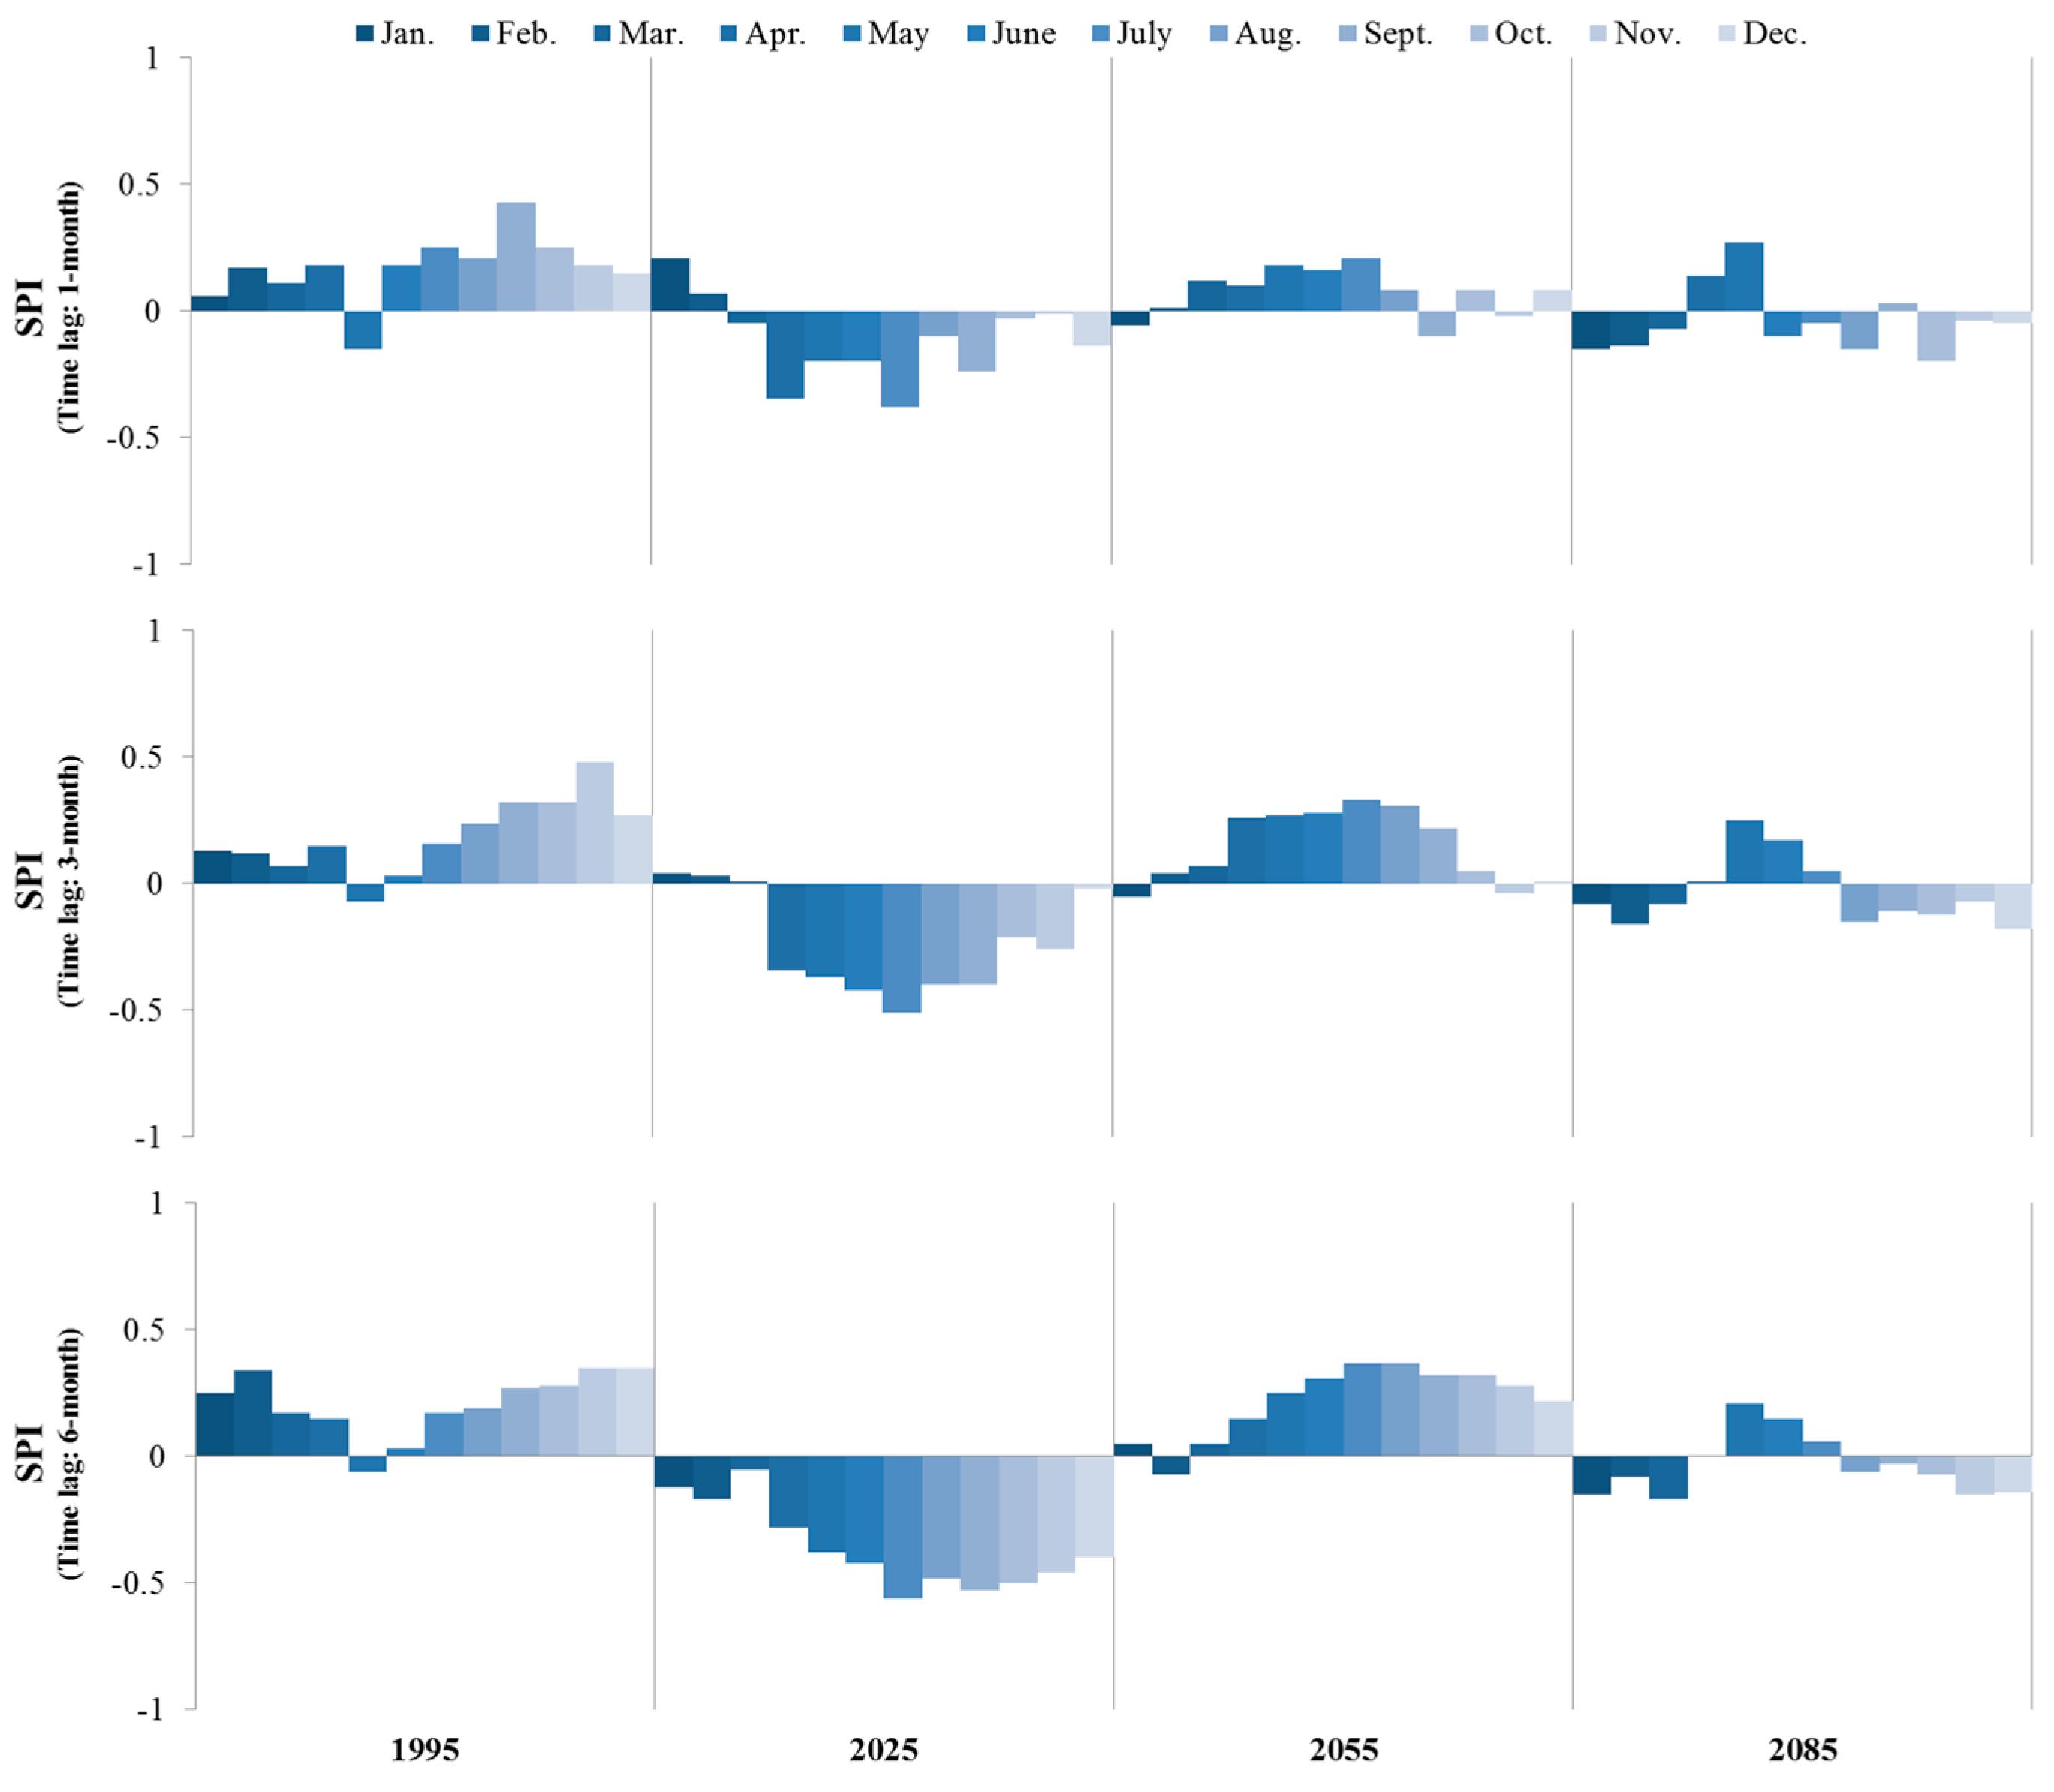
3.3. Analysis of Seasonal SPI and SPEI

Based on SPI and SPEI for the total period (1981–2100), the mean seasonal SPI and SPEI were analyzed for 1995 (1981–2010), 2025 (2011–2040), 2055 (2041–2070), and 2085 (2071–2100), as shown in Figure 7 and Figure 8. The average one-month SPI in 1995 was higher than 0, except for May, but a significant decrease in the one-month SPI was identified from April to September in 2025. This result indicates that the monthly precipitation decreased in 2025 due to climate change, and a drought condition might be severe in any season from April to September. However, the one-month SPI in 2055 increased when compared to 1995; for example, only January, September, and November showed a negative one-month SPI. In 2085, low precipitation occurred fairly often in comparison to 2055, and the annual one-month SPI reached −0.04. For 2025, the medium-term drought could be worse than the short-term drought, according to the three and six-month SPIs. In 2025, the annual three-month SPI was −0.24, and the lowest three-month SPI was observed in July (−0.51) during the general crop growth season. In addition, the six-month SPI decreased to −0.36 in 2025, with a negative SPI each month. These results could indicate that climate change has a more significant effect on medium-term drought than on short-term drought.
The SPEIs showed slightly different values than the SPIs. The annual one-month SPEI decreased significantly from 1995 to 2025, except for January; for example, the mean SPEI in July was 0.38 in 1995 and dropped to −0.33 in 2025. The largest decrease in the SPEI occurred in late spring and early summer. These seasons are important for rice growth, thus climate change might result in a decrease in crop products due to droughts in the spring and summer. In addition, a large decrease was shown in the one-month SPEI from September to November in 2085, which indicates a decrease in the fall season, and thus the fall drought could worsen in the future. The three and six-month SPEIs, which are related to the medium-term drought, exhibited a decrease in the mean SPEI that is more significant than that for the one-month SPEI. For example, the annual one-month SPEI in 2025 was calculated as −0.04, but the annual three and six-month SPEIs were −0.13 and −0.22, respectively, in 2025. The annual six-month SPEI dropped to −0.38 in 2085 and was the smallest SPEI for all timescales. The smallest SPI was found in the summer season in 2025, but the smallest SPEI was found in the summer and fall seasons in 2085. However, both indices indicated that the medium-term drought conditions would be worse than the short-term drought conditions in the future.

3.4. Analysis of Non-Exceedance Probability and Return Period of Seasonal SPI and SPEI

In the Korean peninsula, the meteorological characteristics are classified into four three-month seasons: winter (December-February: DJF), spring (March-May: MAM), summer (June-August: JJA), and fall (September-November: SON). Therefore, each season has different drought conditions, and the impacts of climate change on drought frequency and severity are related to the probability of drought events. In this study, we calculated the SPIs and SPEIs of each season from the SPI and SPEI for all periods, and computed the cumulative curves of the one, three, and six-month SPI and SPEI. In addition, the non-exceedance probability for drought indices below −1.0 was calculated in each season (Table 4).
The non-exceedance probability was 8.9% for the DJF season in 2025 for the one-month SPI below −1.0, but it increased to 20.0% for the six-month SPI below −1.0. In addition, for the JJA season with intensive rain, the non-exceedance probabilities of the six-month SPI below −1.0 in 1995, 2025, and 2055 were greater than those of the one-month SPI, except for 2085. The non-exceedance probability of the three-month SPI below −1.0 was 7.8% for the JJA season in 1995, increasing to 15.6% in 2085. The non-exceedance probability was 6.7% for the six-month SPI below −1.0 for the SON season in 1995, which increased to 31.1% in 2025. These results might indicate that the medium-term drought for DJF, JJA, and SON due to climate change will be more severe than the short-term drought. However, for the MAM season, the non-exceedance probability for the six-month SPI below −1.0 was smaller than that for the one-month SPI. This indicates that, during the MAM season, climate change could affect short-term drought more than medium-term drought.
The non-exceedance probability for the six-month SPEI in the DJF season below −1.0 significantly increased to 33.3% in the 1995–2085 periods, unlike for SPI (16.7%). In the MAM season, the non-exceedance probability for the one-month SPEI below −1.0 was only 1.1% in 1995 but increased to 14.4% in 2025, then increased further in 2085 with a 24.4% non-exceedance probability. For the JJA season, the non-exceedance probability for the one-month SPEI below −1.0 increased from 2.2% to 31.1% in the 1995 and 2085 periods. The one-month and six-month SPEIs differed from those for SPIs, showing a small non-exceedance probability in the JJA season. The largest non-exceedance probability for an SPEI below −1.0 was in the SON season in 2085, 38.9% and 32.2% in the one-month and six-month SPEI, respectively. Climate change might result in severe droughts during the JJA and SON seasons from 1995 to 2085. Furthermore, the medium-term severe drought could be worse for DJF in all periods and for the SON season in 2025.
In the Korean peninsula, agricultural reservoirs are regarded as the main water resources for irrigation, and are constructed to cope with a drought for a ten-year return period [52]. In addition, the one-month SPI and SPEI can be closely related to meteorological drought types, short-term soil moisture, and crop stress, especially during the growing season. Therefore, the one-month SPI and SPEI for a ten-year return period were calculated using frequency analysis to analyze changes in severe drought due to climate change.
Figure 9 shows the contour lines of the one-month SPI for a ten-year return period and indicates that the drought with a ten-year return period might worsen in the future. In 1995, the SPI for a ten-year return period ranged from −1.1 to −1.24; the southern area showed smaller values, which indicates a more serious drought. However, the spatial distribution of the SPI for a ten-year return period in 2025 was similar for the western and eastern areas, and the drought of the ten-year return period in the western area (−1.20) was more severe than in the eastern area (−1.29) in 2025. In 2055, the SPI for a ten-year return period was distributed vertically, and the contour line was similar to that in 1995. The minimum value of the SPI for a ten-year return period was in the southern area (−1.25), which was smaller than in the northern area (−1.17). These results indicate that the southern area is at a higher risk of drought than the northern area. However, the contour line of the SPI for a ten-year return period in 2085 had a horizontal distribution, with the lowest value in the western area (−1.32) and southeastern area (−1.32).
Figure 10 shows the contour lines of a one-month SPEI for a ten-year return period. In 1995, the SPEI for a ten-year return period varied from −0.6 to −0.9, and the drought was more severe in the southern area than the northern area according to the SPEI contour lines for a ten-year return period. In addition, the SPEI for a ten-year return period decreased to −1.18 in 2025 and the southern and western areas showed the lowest SPEI. The distribution in the southern area remained similar from 1995 to 2025, but the drought conditions became more severe. However, the spatial distribution of SPEI for a ten-year return period changed in 2055. In the previous time period, the drought severity based on the SPEI for a ten-year return period was distributed horizontally from north to south but showed a vertical distribution in 2055. For example, the SPEI for a ten-year return period in the eastern area was −1.24 and decreased to −1.34 in the western area, while there was little change between the north and south. In 2085, the SPEI for a ten-year return period reached the lowest value and varied horizontally from the southern to northwestern area. Figure 10 shows that SPEI for a ten-year return period dropped to −1.62 in the northwestern area. In addition, the SPEI for a ten-year return period in the entire study area was distributed from −1.43 to −1.62 in 2085, indicating that severe drought could occur more frequently in 2085 than in the previous seasons.

3.5. Assessment of Drought Severity, Duration, and Intensity through Applying Time Series SPI and SPEI

Drought characteristics include severity, duration, and intensity. Therefore, we applied multiple timescale SPIs and SPEIs to runs theory, and analyzed the changes in drought severity, duration, and intensity under climate change. Table 5 shows these characteristics using the threshold value (SPI and SPEI = −1). Drought severity increases due to climate change from 1995 to 2085. The SPIs indicated that the severity of one-month drought in a future season could be greater than that of the six-month drought; however, SPEI showed the opposite results. In particular, drought severity identified with the one-month SPEI in 2085 was nine times greater than in 1995. Therefore, climate change could cause more severe and frequent droughts in the future. In addition, the duration of drought could increase in the future. In 1995, the number of months when the one-month SPI was below −1.0 was 33, which increased to 74 in 2085. SPEI also showed a similar trend in drought duration from 1995 to 2085.
Based on severity and duration, the intensity of drought was analyzed. The droughts identified with SPIs in 1995 were less intense than that in 2085, implying that climate change will intensify drought in the future; in particular, short-term drought will be more influenced by climate change. A comparison of the drought intensities identified with the six-month SPI in 1995 and 2085 showed a difference of 0.01. The drought intensity identified using SPEIs showed that the intensity of both short and medium-term drought would be strongly affected by climate change. For example, the drought intensities identified with the one and six-month SPEIs in 1995 were 1.21 and 1.24, respectively, reaching 1.39 and 1.37 in 2085, respectively.

4. Conclusions

Climate change is regarded as a future threat that is expected to influence severe drought. North Korea is suffering from famine and is vulnerable to the effects of drought; therefore, changes in drought characteristics could be catastrophic. In this study, the impact of climate change on drought characteristics in the Hwanghae province, which is a significant food source in North Korea, was evaluated using two drought indices, SPI and SPEI. These indices were applied with one, three, and six-month lag times; short and medium-term drought conditions were thus evaluated using multiple timescales. Future climate data were based on the RCP 4.5 scenario and downscaled using a monthly bias correction. Both SPI and SPEI indicated that the medium-term drought conditions will be more severe than the short-term drought conditions in the future.
In addition, we focused on the frequency of seasonal drought, thus the non-exceedance probability for SPIs and SPEIs below −1.0 was calculated in the four seasons from spring to winter. According to the non-exceedance probability for SPIs below −1.0, the medium-term drought in DJF, JJA, and SON will be more severe than the short-term drought due to climate change. However, the medium-term drought during the MAM seasons will be affected less by climate change than the short-term drought. According to the non-exceedance probability for SPEIs below −1.0, climate change might result in severe droughts during the JJA and SON seasons from 1995 to 2085. The medium-term severe drought might be worse for the DJF season in all periods and for the SON season in 2025.
Based on the SPI and SPEI time series, the drought severity, duration, and intensity were analyzed using runs theory. Drought severity increased due to climate change from 1995 to 2085. SPIs showed that the severity of one-month droughts in future seasons will be greater than that of six-month droughts; however, SPEI showed opposite results. In particular, drought severity identified for one-month SPEI in 2085 will be nine times greater than that in 1995. Therefore, in addition to causing more severe and frequent drought, climate change will also bring longer durations of droughts. The intensity of drought was analyzed based on severity and duration. The drought identified by SPIs in 1995 was less intensive than that predicted for 2085, implying that climate change will intensify drought in the future; in particular, short-term drought will be more influenced by climate change. The drought intensity identified using SPEIs showed that the intensity of both short- and medium-term drought will be strongly affected by climate change.
These results are strongly dependent on simulations from only one set of climate change data; there are therefore limitations due to the uncertainty in various climate change scenarios. However, this study shows that North Korea will be exposed to significant drought due to climate change. Therefore, global nations, including South Korea, should pay close attention to the severe problems of food deficiency due to drought in the future.

Acknowledgments

This research was supported by Korea Institute of Planning and Evaluation for Technology in Food, Agriculture, Forestry and Fisheries(iPET) through Advanced Production Technology Development Program funded by Ministry of Agriculture, Food and Rural Affairs(MAFRA)(116051-3).

Author Contributions

Sang-Hyun Lee and Seung-Hwan Yoo conceived of the presented idea and verified the analytical methods. Jin-Yong Choi and Seungjong Bae supervised the findings of this work. All authors discussed the results and contributed to the final manuscript.

Conflicts of Interest

The authors declare no conflict of interest.

References

  1. United Nation Development Programme (UNDP). Reducing Disaster Risk: A Challenge for Development; United Nation Development Programme: Geneva, Switzerland, 2004. [Google Scholar]
  2. Food and Agriculture Organization/World Food Programme (FAO/WFP). Special Report, FAO/WFP Crop and Food Supply Assessment Mission to the Democratic People’s Republic of Korea; Food and Agriculture Organization/World Food Programme: Rome, Italy, 2001. [Google Scholar]
  3. Schewe, J.; Heinke, J.; Gerten, D.; Haddeland, I.; Arnell, N.W.; Clark, D.B.; Dankers, R.; Eisner, S.; Fekete, B.M.; Colón-González, F.J.; et al. Multimodel assessment of water scarcity under climate change. Proc. Natl. Acad. Sci. USA 2014, 111, 3245–3250. [Google Scholar] [CrossRef] [PubMed] [Green Version]
  4. Jang, M.W.; Yoo, S.H.; Choi, J.Y. Analysis of Spring Drought Using NOAA/AVHRR NDVI for North Korea. J. Korean Soc. Agric. Eng. 2007, 49, 21–33. (In Korean) [Google Scholar] [CrossRef]
  5. Nam, W.H.; Yoo, S.H.; Jang, M.W.; Choi, J.Y. Application of meteorological drought indices for North Korea. J. Korean Soc. Agric. Eng. 2008, 50, 3–15. (In Korean) [Google Scholar] [CrossRef]
  6. Yoo, S.H.; Nam, W.H.; Jang, M.W.; Choi, J.Y. Assessment and Classification of Meteorological Drought Severity in North Korea. J. Korean Soc. Agric. Eng. 2008, 50, 3–15. [Google Scholar] [CrossRef]
  7. Intergovernmental Panel on Climate Change (IPCC). Climate Change 2013: The Physical Basis. Contributions of Working Group I to the Fifth Assessment Report of the Intergovernmental Panel on Climate Change; Cambridge University Press: Cambridge, UK, 2013. [Google Scholar]
  8. Ho, C.K.; Stephenson, D.B.; Collins, M.; Ferro, C.A.T.; Brown, S.J. A source of additional uncertainty in climate change projections. Bull. Am. Meteorol. Soc. 2012, 93, 21–26. [Google Scholar] [CrossRef]
  9. Liu, Z.; Törnros, T.; Menzel, L. A probabilistic prediction network for hydrological drought identification and environmental flow assessment. Water Resour. Res. 2016, 52, 6243–6262. [Google Scholar] [CrossRef]
  10. Madadgar, S.; Moradkhani, H. A Bayesian framework for probabilistic seasonal drought forecasting. J. Hydrometeorol. 2013, 14, 1685–1705. [Google Scholar] [CrossRef]
  11. Taylor, K.E.; Stouffer, R.J.; Meehl, G.A. An overview of CMIP5 and the experiment design. Bull. Am. Meteorol. Soc. 2012, 93, 485–498. [Google Scholar] [CrossRef]
  12. Baek, H.J.; Lee, J.; Lee, H.S.; Hyun, Y.K.; Cho, C.; Kwon, W.-T.; Marzin, C.; Gan, S.-Y.; Kim, M.-J.; Choi, D.-H.; et al. Climate change in the 21st century simulated by HadGEM2-AO under Representative Concentration Pathways. Asia-Pac. J. Atmos. Sci. 2013, 49, 603–618. [Google Scholar] [CrossRef]
  13. Benestad, R.E. Downscaling precipitation extremes. Theor. Appl. Climatol. 2010, 100, 1–21. [Google Scholar] [CrossRef]
  14. Sunyer Pinya, M.A.; Hundecha, Y.; Lawrence, D.; Madsen, H.; Willems, P.; Martinkova, M.; Vormoor, K.; Bürger, G.; Hanel, M.; Kriauiuniene, J.; et al. Inter-comparison of statistical downscaling methods for projection of extreme precipitation in Europe. Hydrol. Earth Syst. Sci. 2015, 19, 1827–1847. [Google Scholar] [CrossRef] [Green Version]
  15. Andrew, W.R.; Ines, A.V.M.; Hansen, J.W. Downscaling of seasonal precipitation for crop simulation. J. Appl. Meteorol. Climatol. 2007, 46, 677–693. [Google Scholar]
  16. Diaz-Nieto, J.; Wilby, R.L. A comparison of statistical downscaling and climate change factor methods: Impacts on low flows in the River Thames, United Kingdom. Clim. Chang. 2005, 69, 245–268. [Google Scholar] [CrossRef]
  17. Korea Meteorological Administration (KMA). Understanding of Climate Change and Application of Climate Change Scenarios; National Institute of Meteorological Research: Seoul, South Korea, 2010. (In Korean) [Google Scholar]
  18. Dubrovsky, M.; Svoboda, M.D.; Trnka, M.; Hayes, M.J.; Wilhite, D.A.; Zalud, Z.; Hlavinka, P. Application of relative drought indices in assessing climate change impacts on drought conditions in Czechia. Theor. Appl. Climatol. 2009, 96, 117–155. [Google Scholar] [CrossRef]
  19. Arnell, N.W. Climate change and global water resources: SRES emissions and socio-economic scenarios. Glob. Environ. Chang. 2004, 14, 31–52. [Google Scholar] [CrossRef]
  20. Fung, F.; Lopez, A.; New, M. Water availability in +2C and +4C worlds. Philos. Trans. Ser. A 2011, 369, 99–116. [Google Scholar] [CrossRef] [PubMed]
  21. Milly, P.C.D.; Dunne, K.A.; Vecchia, A.V. Global pattern of trends in streamflow and water availability in a changing climate. Nature 2005, 438, 347–350. [Google Scholar] [CrossRef] [PubMed]
  22. Vörösmarty, C.J.; Green, P.; Salisbury, J.; Lammers, R.B. Global water resources: Vulnerability from climate change and population growth. Science 2000, 289, 284–288. [Google Scholar] [CrossRef] [PubMed]
  23. Beguería, S.; Vicente-Serrano, S.M.; Reig, F.; Latorre, B. Standardized precipitation evapotranspiration index (SPEI) revisited: Parameter fitting, evapotranspiration models, tools, datasets and drought monitoring. Int. J. Climatol. 2014, 34, 3001–3023. [Google Scholar] [CrossRef]
  24. McKee, T.B.; Doesken, N.J.; Kleist, J. The relationship of drought frequency and duration to time scales. In Proceedings of the Eighth Conference on Applied Climatology, Anahei, CA, USA, 17–22 January 1993; American Meteorological Society: Anaheim, CA, USA, 1993; pp. 179–184. [Google Scholar]
  25. Palmer, W.C. Meteorological Drought; US Department of Commerce, Weather Bureau: Washington, DC, USA, 1965; Volume 30.
  26. Vicente-Serrano, S.M.; Beguería, S.; López-Moreno, J.I. A multiscalar drought index sensitive to global warming: The standardized precipitation evapotranspiration index. J. Clim. 2010, 23, 1696–1718. [Google Scholar] [CrossRef]
  27. Koutroulis, A.G.; Vrochidou, A.E.K.; Tsanis, I.K. Spatiotemporal characteristics of meteorological drought for the island of Crete. J. Hydrometeorol. 2011, 12, 206–226. [Google Scholar] [CrossRef]
  28. Rossi, G. Drought mitigation measures: A comprehensive framework. In Drought and Drought Mitigation in Europe; Voght, J., Somma, F., Eds.; Kluwer Academic Publishers: Dordrecht, The Netherlands, 2000; pp. 233–246. [Google Scholar]
  29. Wilhite, D.A.; Svoboda, M.D.; Hayes, M.J. Understanding the complex impacts of drought: A key to enhancing drought mitigation and preparedness. Water Resour. Manag. 2007, 21, 763–774. [Google Scholar] [CrossRef]
  30. Dai, A. Drought under global warming: A review. Wiley Interdiscip. Rev. Clim. Chang. 2011, 2, 45–65. [Google Scholar] [CrossRef]
  31. Kwak, J.W.; Lee, S.D.; Kim, Y.S.; Kim, H.S. Return period estimation of droughts using drought variables from standardized precipitation index. J. Korean Water Resour. Assoc. 2013, 46, 795–805. (In Korean) [Google Scholar] [CrossRef]
  32. Loukas, A.; Vasiliades, L.; Tzabiras, J. Climate change effects on drought severity. Adv. Geosci. 2008, 17, 23–29. [Google Scholar] [CrossRef]
  33. Mavromatis, T. Drought index evaluation for assessing future wheat production in Greece. Int. J. Climatol. 2007, 27, 911–924. [Google Scholar] [CrossRef]
  34. So, J.M.; Sohn, K.H.; Bae, D.H. Estimation and assessment of bivariate joint drought index based copula functions. J. Korean Water Resour. Assoc. 2014, 47, 171–182. (In Korean) [Google Scholar] [CrossRef]
  35. Yoo, J.Y.; Choi, M.H.; Kim, T.W. Spatial analysis of drought characteristics in Korea using cluster analysis. J. Korean Water Resour. Assoc. 2010, 43, 15–24. (In Korean) [Google Scholar] [CrossRef]
  36. Yoo, J.Y.; Song, H.Y.; Kim, T.W.; Ahn, J.H. Evaluation of short-term drought using daily standardized precipitation index and ROC analysis. J. Korean Soc. Civ. Eng. 2013, 33, 1851–1860. (In Korean) [Google Scholar] [CrossRef]
  37. Paulo, A.A.; Rosa, R.D.; Pereira, L.S. Climate trends and behaviour of drought indices based on precipitation and evapotranspiration in Portugal. Nat. Hazards Earth Syst. Sci. 2012, 12, 1481–1491. [Google Scholar] [CrossRef] [Green Version]
  38. Potop, V. Evolution of drought severity and its impact on corn in the Republic of Moldova. Theor. Appl. Climatol. 2011, 105, 469–483. [Google Scholar] [CrossRef]
  39. Sohn, S.J.; Joong-Bae, A.; Chi-Yung, T. Six month–lead downscaling prediction of winter to spring drought in South Korea based on a multimodel ensemble. Geophys. Res. Lett. 2013, 40, 579–583. [Google Scholar] [CrossRef]
  40. Wolf, J.F.; Abatzoglou, J. The suitability of drought metrics historically and under climate change scenarios. In Proceedings of the 47th Annual Water Resources Conference, Albuquerque, NM, USA, 7–10 November 2011; pp. 7–10. [Google Scholar]
  41. Svoboda, M.; Hayes, M.; Wood, D. Standardized Precipitation Index User Guide; World Meteorological Organization: Geneva, Switzerland, 2012. [Google Scholar]
  42. Joetzjer, E.; Douville, H.; Delire, C.; Ciais, P.; Decharme, B.; Tyteca, S. Evaluation of drought indices at interannual to climate change timescales: A case study over the Amazon and Mississippi river basins. Hydrol. Earth Syst. Sci. Discuss. 2012, 9, 13231–13249. [Google Scholar] [CrossRef]
  43. Redmond, K.T. Integrated climate monitoring for drought detection. In Drought: A Global Assessment; Wilhite, D.A., Ed.; Routledge: Abingdon, UK, 2000; Volume 1, pp. 245–255. [Google Scholar]
  44. Edwards, D.C.; McKee, T.B. Characteristics of 20th Century Drought in the United States at Multiple Time Scales; Climatology Report 97-2; Colorado State University: Fort Collins, CO, USA, 1997. [Google Scholar]
  45. Mishra, A.K.; Singh, V.P. A review of drought concepts. J. Hydrol. 2010, 391, 202–216. [Google Scholar] [CrossRef]
  46. Quiring, S.M.; Ganesh, S. Evaluating the utility of the Vegetation Condition Index (VCI) for monitoring meteorological drought in Texas. Agric. For. Meteorol. 2010, 150, 330–339. [Google Scholar] [CrossRef]
  47. Vicente-Serrano, S.M. Differences in spatial patterns of drought on different time scales: An analysis of the Iberian Peninsula. Water Resour. Manag. 2006, 20, 37–60. [Google Scholar] [CrossRef]
  48. Hayes, M.J.; Svoboda, M.D.; Wilhite, D.A.; Vanyarkho, O.V. Monitoring the 1996 drought using the standardized precipitation index. Bull. Am. Meteorol. Soc. 1999, 80, 429–438. [Google Scholar] [CrossRef]
  49. Dracup, J.A.; Lee, K.S.; Paulson, E.G. On the statistical characteristics of drought events. Water Resour. Res. 1980, 16, 289–296. [Google Scholar] [CrossRef]
  50. Yevjevich, V. An Objective Approach to Definitions and Investigations of Continental Hydrologic Drought; Hydrology Paper No. 23; Colorado State University: Fort Collins, CO, USA, 1967. [Google Scholar]
  51. González, J.; Valdés, J.B. New drought frequency index: Definition and comparative performance analysis. Water Resour. Res. 2006, 42. [Google Scholar] [CrossRef]
  52. Ministry of Agriculture and Forestry (MAF). Design Criteria of Land and Water Development Plan for Agriculture (Irrigation); Ministry of Agriculture and Forestry: Wellington, New Zealand, 1998.
Figure 1. Meteorological stations in the Hwanghae Plain, North Korea.
Water 09 00579 g001
Figure 2. Drought characteristics using runs theory for a given threshold level.
Water 09 00579 g002
Figure 3. Observed and simulated monthly precipitation in each meteorological station from 1981 to 2005.
Water 09 00579 g003
Figure 4. SPI on different timescales (one, three, and six-month) from 1981 to 2100: (a) one-month SPI; (b) three-month SPI; (c) six-month SPI.
Water 09 00579 g004
Figure 5. SPEI on different timescales (one, three, and six-month) from 1981 to 2100: (a) one-month SPEI; (b) three-month SPEI; (c) six-month SPEI.
Water 09 00579 g005
Figure 6. Boxplots of the SPI and SPEI on different timescales (one, three, and six-month) from 1981 to 2100: (a) SPI; (b) SPEI.
Water 09 00579 g006
Figure 7. Mean SPI on multiple seasonal timescales.
Water 09 00579 g007
Figure 8. Mean SPEI on multiple seasonal timescales.
Water 09 00579 g008
Figure 9. Contour lines of the one-month SPI for a ten-year return period: (a) 1995 (1981–2010); (b) 2025 (2011–2040); (c) 2055 (2041–2070); (d) 2085 (2071–2100).
Water 09 00579 g009
Figure 10. Contour lines of the one-month SPEI for a ten-year return period: (a) 1995s; (b) 2025s; (c) 2055s; (d) 2085s.
Water 09 00579 g010aWater 09 00579 g010b
Table 1. Descriptions of meteorological stations in the Hwanghae Plain.
NameIDLongitudeLatitude
SariwonS1125°45′49.60′′ E38°31′0.00′′ N
SingyeS2126°31′49.60′′ E38°30′0.00′′ N
YongyonS3124°52′49.59′′ E38°12′0.00′′ N
HaejuS4125°41′49.60′′ E38°2′0.00′′ N
GaesongS5126°33′49.60′′ E37°58′0.00′′ N
Table 2. Drought categories from standardized precipitation index (SPI) and standardized precipitation evapotranspiration index (SPEI) values.
SPICategoryProbability of Drought Recurrence
Number of Times in 100 YearsSeverity of Drought Event
More than 2.00Extremely wet--
1.50 to 1.99Severely wet--
1.00 to 1.49Moderately wet--
0.00 to 0.99Near normal--
−0.99 to 0.00Mildly dry331 in 3 years
−1.49 to −1.00Moderately dry101 in 10 years
−1.99 to −1.50Severely dry501 in 20 years
Less than −2.00Extremely dry2.51 in 50 years
Table 3. Conditional probability of multiple timescale SPI (A) and SPEI (B).
Conditional ProbabilityP(A|B) *P(B|A) *
Lag Time1-Month3-Month6-Month1-Month3-Month6-Month
Periods1995 (1981–2010)0.990.991.000.470.410.36
2025 (2011–2040)0.950.890.910.640.660.64
2055 (2041–2070)0.780.720.670.870.920.88
2085 (2071–2100)0.720.670.540.950.981.00
Note: * The drought events (A and B) are the probability of SPI (<−1.0) and SPEI (<−1.0).
Table 4. Non-exceedance probability of multiple timescale SPI and SPEI below −1.0.
SeasonsPeriodsProbability of Non-Exceedance (%)
SPI < −1.0SPEI < −1.0
1-Month3-Month6-Month1-Month3-Month6-Month
1995 (1981–2010)DJF13.310.08.910.04.43.3
MAM10.012.215.61.14.43.3
JJA6.77.812.22.23.33.3
SON6.76.76.71.12.26.7
2025 (2011–2040)DJF8.913.3207.88.912.2
MAM23.317.816.714.413.311.1
JJA18.923.325.616.716.717.8
SON18.922.231.15.614.423.3
2055 (2041–2070)DJF16.712.212.216.716.714.4
MAM16.712.211.122.221.114.4
JJA12.212.214.415.613.313.3
SON16.718.95.617.815.66.7
2085 (2071–2100)DJF2023.316.721.128.933.3
MAM21.116.712.224.426.724.4
JJA24.415.614.431.127.830.0
SON16.718.916.738.933.332.2
Table 5. Drought severity, duration, and intensity using the one, three, and six-month SPI and SPEI.
Drought IndexPeriodsSeverity *Duration *Intensity *
1-Month3-Month6-Month1-Month3-Month6-Month1-Month3-Month6-Month
SPI1995 (1981–2010)41.045.361.63333391.231.291.33
2025 (2011–2040)78.895.5117.36369841.261.331.31
2055 (2041–2070)69.564.050.15650391.251.251.30
2085 (2071–2100)93.792.372.37467541.271.351.35
SPEI1995 (1981–2010)15.715.718.41313151.211.201.24
2025 (2011–2040)51.964.078.44048581.291.281.22
2055 (2041–2070)85.081.862.96560441.301.341.36
2085 (2071–2100)145.9153.4155.11041051081.391.391.37
Note: * Threshold value for identifying a drought is −1 for both SPI and SPEI.

