Article

Reconciling Drought Vulnerability Assessment Using a Convergent Approach: Application to Water Security in the Elqui River Basin, North-Central Chile

1
Departamento Ingeniería de Minas, Universidad de La Serena, Benavente 980, La Serena, Chile
2
Centro del Agua para Zonas Áridas y Semiáridas de América Latina y el Caribe, Benavente 980, La Serena, Chile
3
Institute of Hydrology and Meteorology, Dresden University of Technology, 01069 Dresden, Germany
4
Junta de Vigilancia del Río Elqui, Embalse Puclaro Ruta 41 s/n, Casilla 183, Vicuña, Chile
*
Author to whom correspondence should be addressed.
Water 2017, 9(8), 589; https://doi.org/10.3390/w9080589
Submission received: 30 May 2017 / Revised: 31 July 2017 / Accepted: 2 August 2017 / Published: 8 August 2017
(This article belongs to the Special Issue Drought Monitoring, Forecasting, and Risk Assessment)

Abstract

:
Drought has been, is and most likely will remain one of the most significant socio-natural disasters affecting society and the environment worldwide. One priority objective in the adoption of national drought policies is to promote standardized approaches to vulnerability assessment. To reach this objective, however, there is a need to address the noticeable lack of reconciliation between the two major epistemic frameworks that have been used to determine who is vulnerable and why: the so-called outcome and contextual frameworks. This study presents a novel procedure called the convergent approach to assess drought vulnerability under an integral framework. The procedure has been applied to the study of the vulnerability of water security to drought in water-use sectors in a basin located in north-central Chile. The study is justified by the role that drought plays as the major threat to water security in a context of global water crisis. The results show that the convergent approach outperforms traditional procedures such as those based on composite indicators, showing sound robustness and reaching sufficient levels of reliability and validity. The potential expansion of this approach to other applications, such as those related to global estimations of vulnerability to drought, is also discussed.

Graphical Abstract

1. Introduction

Drought has been, is, and most likely will continue to be one of the most significant socio-natural disasters affecting society and the environment worldwide.
Although there has been ongoing discussion regarding the occurrence, trends and uncertainty in the frequency of droughts globally [1,2,3,4], an objective fact is that this phenomenon caused more than half of the deaths associated with natural disasters worldwide during the 20th century and, after floods, was the natural disaster with the second-greatest human impact [5,6]. In fact, according to the United Nations Office for Disaster Risk Reduction [7], 50.5 million people were affected by drought worldwide in 2015 alone. A similar figure was indicated by Stanke et al. [8] for 2011.
International concern about the global impact of drought motivated the organization, in 2013, of a High-Level Meeting on National Drought Policy (HMNDP), organized in a joint effort by the United Nations Convention to Combat Desertification and Drought (UNCCD), the Food and Agriculture Organization (FAO) and the World Meteorological Organization (WMO) [6]. As a result, recommendations from the perspectives of policy and science were developed. In the latter case, one of the five key elements through which science can support a national drought management policy consists of “Promoting standard approaches to vulnerability and impact assessment” [9], an issue that is gaining importance in both science and policy-making and has even been classified as an urgent matter [6].
It has been recognized that the work of Adger [10] regarding the state-of-the-art of vulnerability assessment in connection with climate change gave a significant boost research on vulnerability to a changing climate. Although the conceptual framework in this field has incorporated new theoretical frameworks in recent decades [11,12,13,14,15,
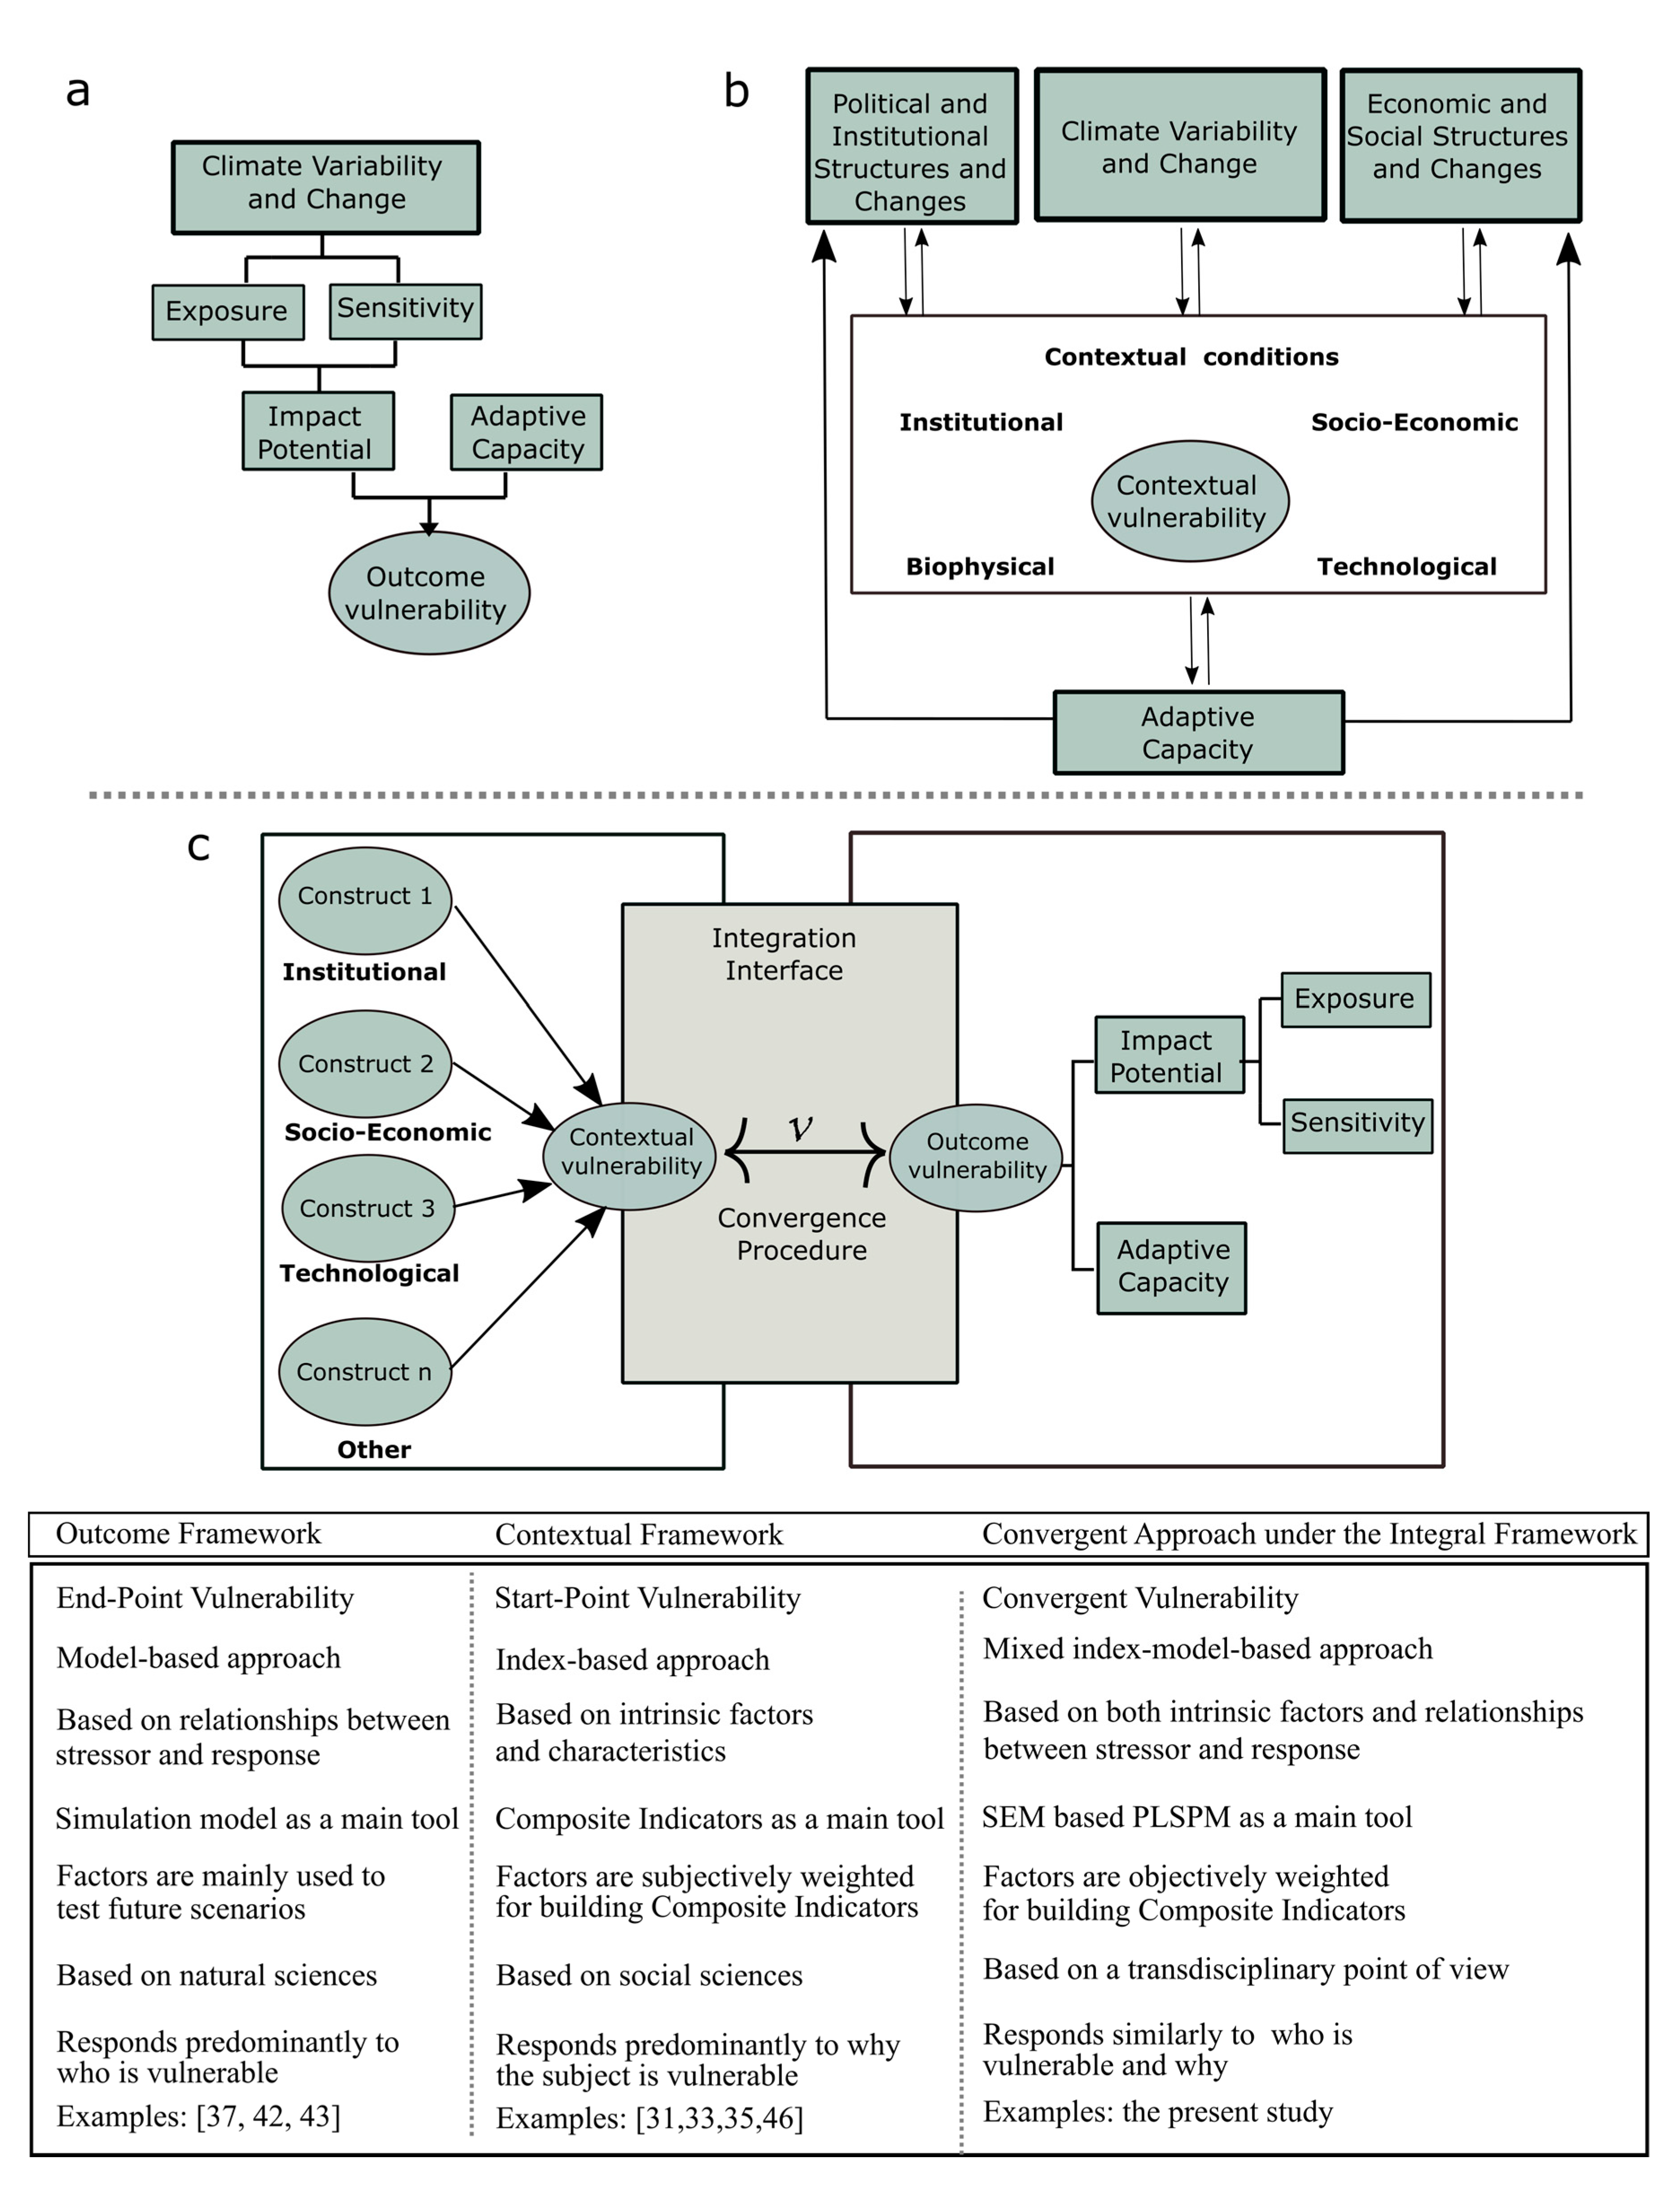
16], it is possible to highlight two main paradigms that have defined the way in which academia has conceptualized and operationalized vulnerability [15,17,18,19]: the contextual framework (also known as start-point vulnerability) and the outcome framework (also known as end-point vulnerability). In the former case, vulnerability is conceptualized around intrinsic factors—or characteristics—of the impacted system and is operationalized, broadly, in terms of so-called composite indicators [14]. In the second case, vulnerability is conceptualized as a functional relationship between the stressor and the response of the impacted system. To this end, it relies on a metric based on changes in the relevant variables due to changes in the stressor and its relationship to certain thresholds.
The main problem arising from the application of both frameworks—especially for promoting standard vulnerability assessment approaches—is what specialists understand as a lack of reconciliation between approaches that, in practice, address the exact same objects of study [17,19]. This issue can be considered relevant because it is not simply a matter of semantic differences, but rather two diametrically opposite positions in the conceptualization, diagnosis and subsequent reduction of vulnerability. Furthermore, as O’Brien et al. [
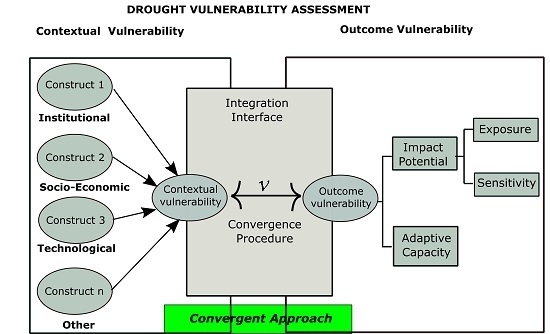
18] have argued, “because the two interpretations are rooted in different discourses and differ fundamentally in their conceptualization of the character and causes of vulnerability, they cannot be integrated into one common framework”. Contrary to this assertion, the authors of the present study believe that, in fact, there is space for reconciliation of this epistemic divorce and, therefore, present a conceptual/methodological/statistical approach called the convergent approach. It goes without saying that this tenet lies within the scope of the so-called integral frameworks [12]—also known as synthetic or hybrid [20]—which are regarded as the current paradigm in climate change vulnerability analysis. According to the latter authors, the integral framework “provides a broad conceptual and analytical platform by allowing the integration and application of different conceptual backgrounds as well as a range of methods and tools that have the potential to complement each other and improve the information provided”. Accordingly, and following Newell et al. [21], this study contributes to the effort to “develop ways to overcome existing conceptual barriers to integration “between” well-known and formidable cultural barriers”.
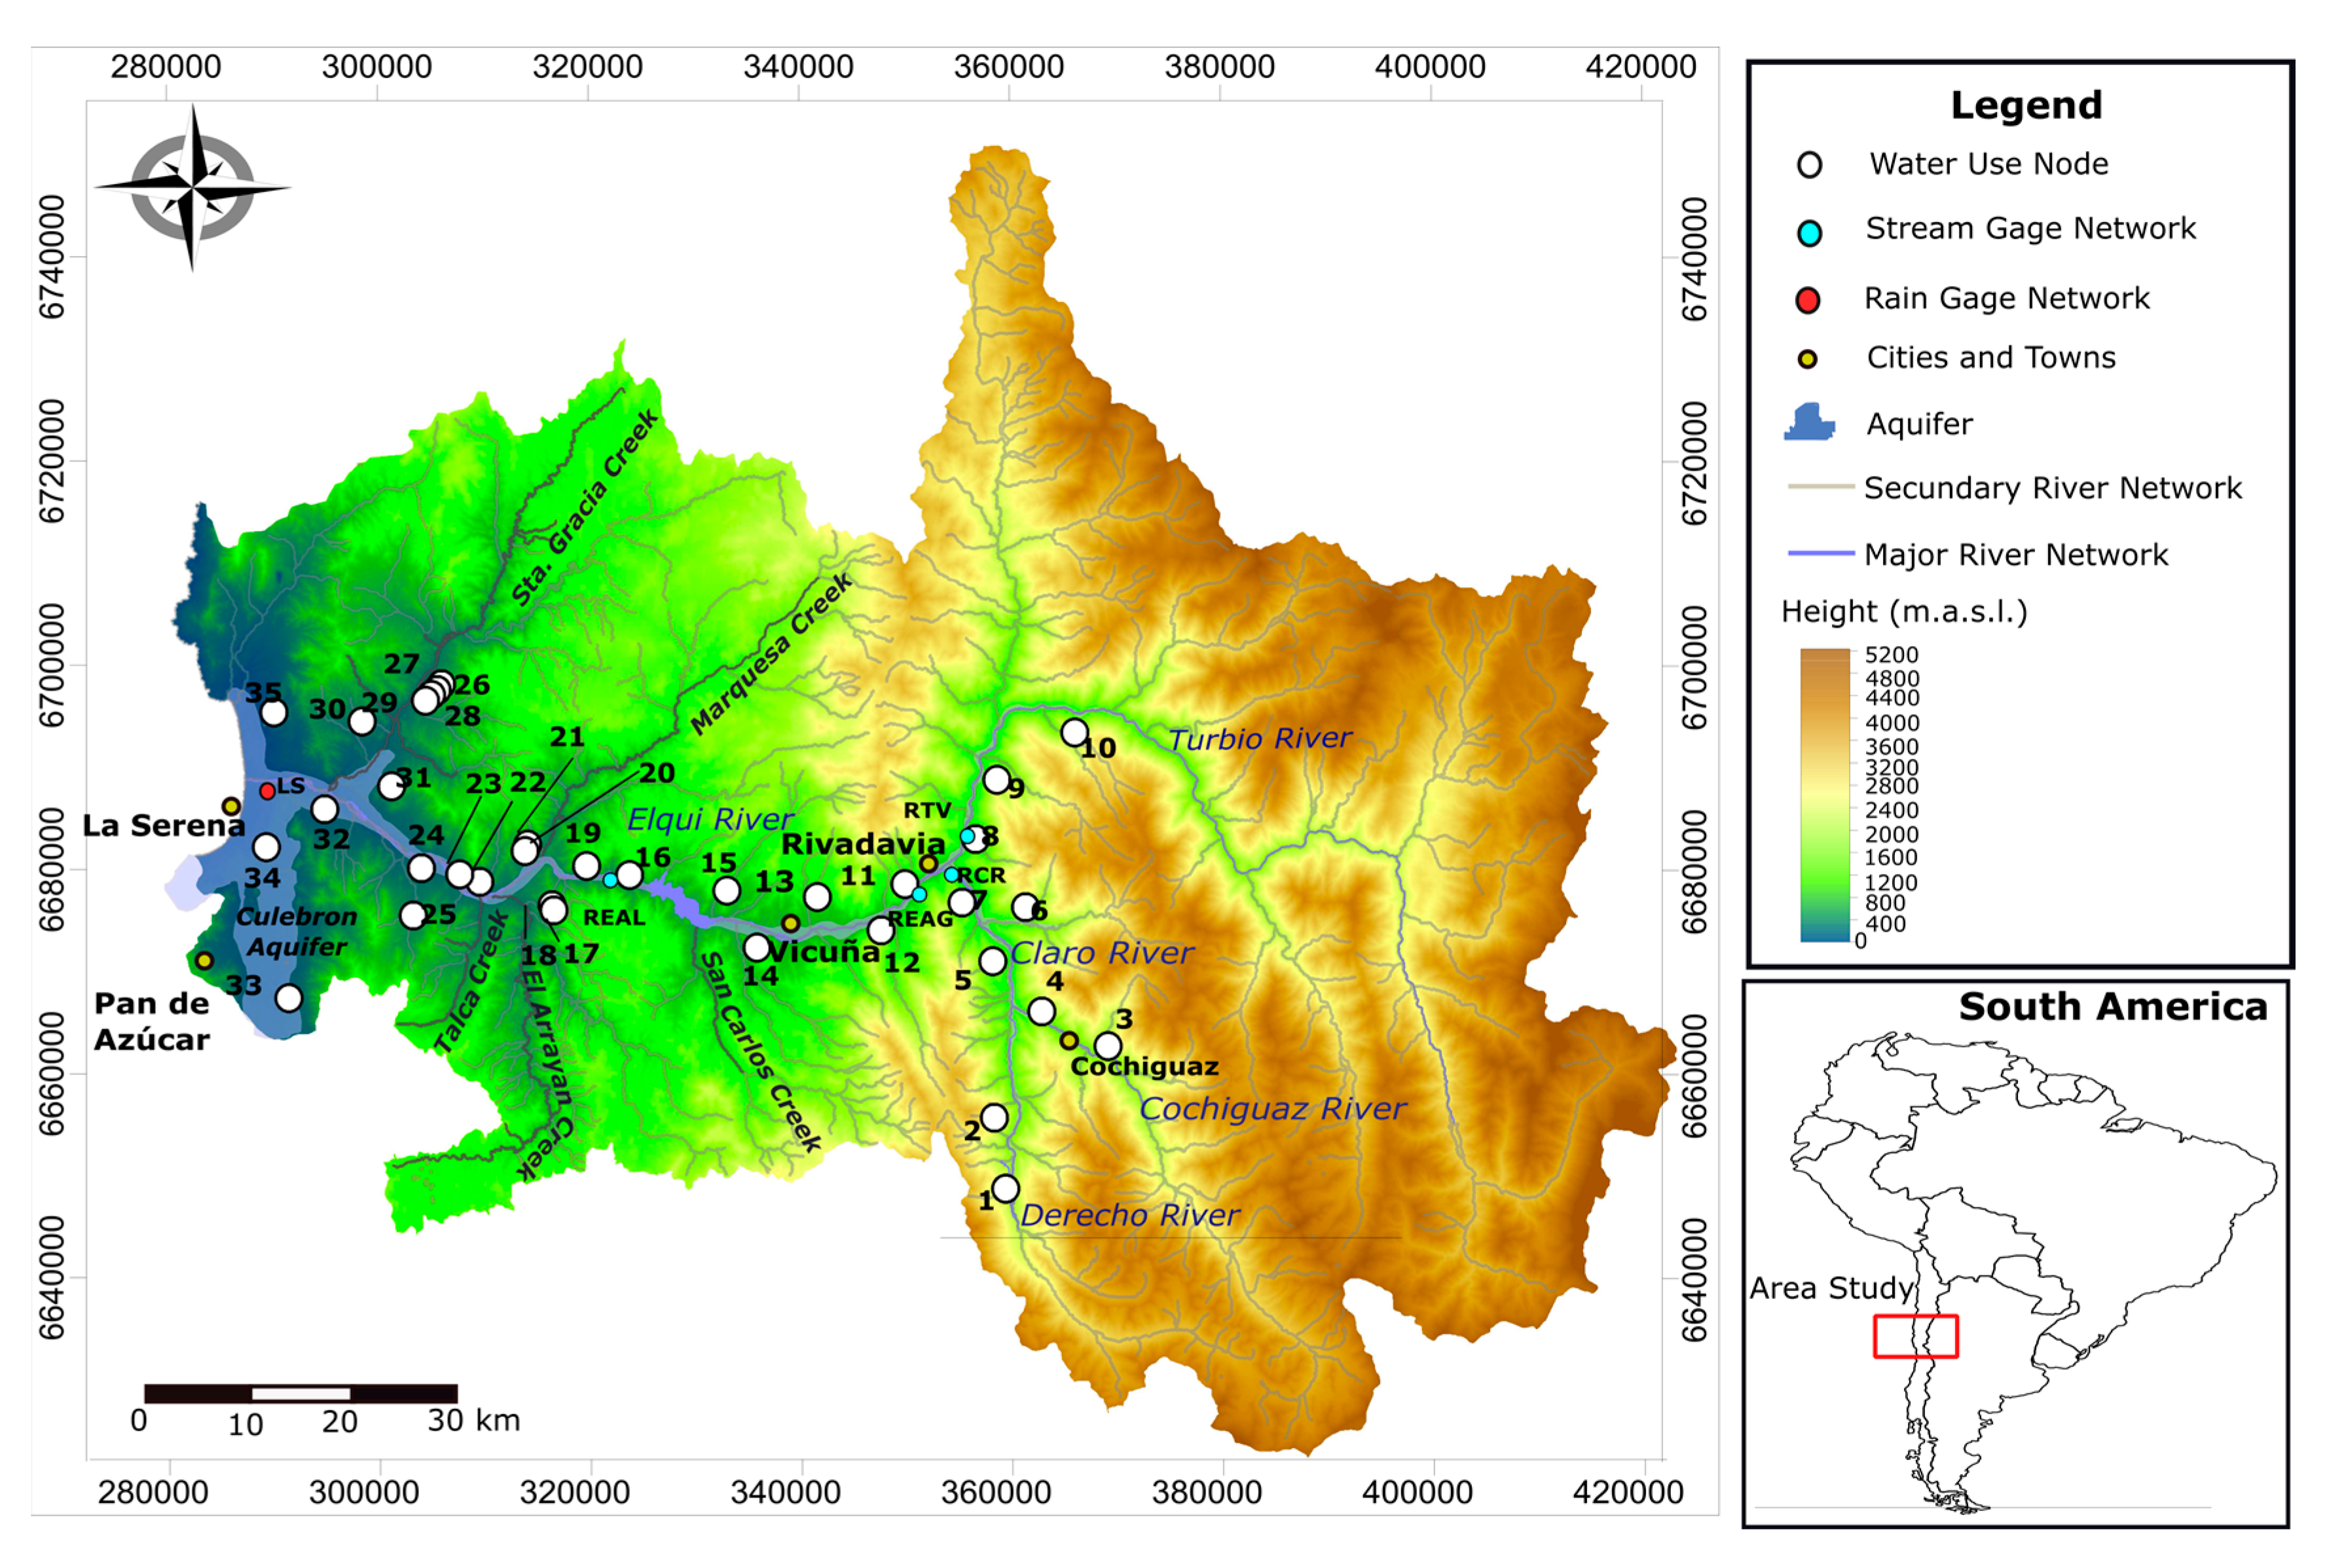
To this end, this work presents an application study carried out in the Elqui River basin (ERB), which is located on the southern border of the Atacama Desert in the arid region of north-central Chile. Specifically, this research makes use of a convergent approach to assess the vulnerability of water security to drought among water users in the ERB. The adoption of water security as a study object in the context of drought vulnerability is justified since it has emerged in the past two decades as a new paradigm that has attracted a considerable amount of attention not only in the academic field but also in public policy decision-making [22]. Within this paradigm, the perspective of risk, which includes vulnerability as one of its dimensions [15], has started to gain prevalence in water security studies [23]. This fact is reflected in the widely accepted definition of water security provided by Grey et al. [24] in terms of “a tolerable level of water-related risk to society”. In this context, drought is predominantly considered a key determinant with respect to water security for water-use sectors [23,25,26], whereas the concept of vulnerability has gained predominance in research areas such Climate Change Adaptation (CCA), Disaster Risk Reduction (DRR) [15] and water security [23,25,27].
Consequently, the aim of this study is to analyze, by means of a convergent approach, the vulnerability of water security to drought events in the Elqui River basin, Coquimbo Region, Chile. It is expected that the results of this research will achieve three objectives, two of which are presented in the HMNDP Scientific Document [9]: first, to strengthen the standard approaches to vulnerability assessment; second, to integrate science with the policy aspects of drought, with the understanding that a robust measure of vulnerability is an important and urgently needed tool for drought management [6] and third, to contribute to the adoption of integral frameworks to assess drought vulnerability [12,20,21].

2. Materials and Methods

2.1. Framework

2.1.1. The Epistemic Divorce

As with the term “drought”, there is no consensus among researchers on the definition of vulnerability [12,17,20]. One of the essential elements of the study of vulnerability has to do precisely with what O’Brien et al. [17] expressed as “one word, two interpretations”. On one hand, vulnerability is sometimes viewed as an end point—that is, as a residual of climate change impacts minus adaptation. This approach, hereafter called outcome vulnerability, is associated with the analysis of the relationships between the stressor and the impacted system [15,19,20]. On the other hand, vulnerability is sometimes viewed as a starting point, a characteristic or state generated by multiple environmental and social processes [15,19,20]. This framework, hereafter called contextual vulnerability, is associated with the study of the features of the system under analysis in terms of the factors or characteristics that can make it more or less vulnerable to the future impact of the stressor event.
The relevance of this background is that, rather than a matter of semantics, the two epistemic frameworks not only result in two different diagnoses of the problem of drought impact, but also two different kinds of cures [17]. From the quantitative point of view, this conceptual dichotomy manifests itself in two independent types of vulnerability metrics: the model-based and indicator-based metric approaches [13,19].
In the particular case of drought vulnerability, the previously discussed dichotomy manifests itself in the type of definitions proposed by the specialists. Some of these drought vulnerability definitions include “a function of exposure to stresses, associated sensitivities, and relevant adaptive capacities” [28] or “the degree of susceptibility either as a result of varying exposure to the hazard or because of variations in the ability to cope with its impact” [29]. A definition that has gained increasing acceptance was proposed by the United Nations Office for Disaster Risk Reduction (UNISDR) [30], which defines vulnerability—in the context of drought—as “the characteristics and circumstances of a community, system or asset that make it susceptible to the damaging effects of a hazard”. This definition is clearly consistent with the contextual approach, because vulnerability is associated with the study of the characteristics that would make the object under analysis susceptible to harm. This approach is shared by Naumann et al. [31], who address the study of drought vulnerability in Africa by understanding “the underlying causes of vulnerability”. Shiferaw et al. [32] adopt a similar approach when they conceive drought vulnerability as “the socioeconomic and biophysical characteristics of the region that make it susceptible to the adverse effects of drought”. Likewise, Carrão et al. [33], in a global mapping of drought risk, understand drought vulnerability as “a reflection of the state of the individual and collective social, economic and infrastructural factors of a region at hand”. In some way or another, the contextual framework has prevailed in studies of drought vulnerability, from the early work of Keenan and Krannich [34] and Wilhelmi and Wilhite [35] to more recent ones carried out by Naumann et al. [31] and Carrão et al. [33], as corroborated by Zarafshani et al. [16] in their latest review of the topic. This fact reveals that the use of integral frameworks such as the one adopted in this study has been practically non-existent in the discussion and proposals aimed at the construction of standard approaches for drought vulnerability assessment [6].

2.1.2. The Model-Based Approach for Vulnerability Quantification

Briefly, in the model-based approach, under the outcome vulnerability framework, vulnerability is defined in terms of the changes that have occurred or will occur in selected variables or stressors [12,15,19]. This is a definition consistent with the biophysical notion of vulnerability proposed by the IPCC [12].
Several authors have proposed or performed quantitative assessments of vulnerability under this approach [36,37,38,39,40,41,42]. The vulnerability metric developed by Luers et al. [37] can be considered a representative example. This metric states that “vulnerability of a system to small changes in forcings is a function of the system’s sensitivity to a given perturbation and the relative proximity of the system to its damage threshold”. In quantitative terms:
V = { s e n s i t i v i t y s t a t e _ r e l a t i v e _ t o _ a _ t h r e s h o l d } = ( | W / X | W / W 0 )
where W0 represents a threshold value of well-being below which the system is said to be damaged. Sensitivity is represented as the absolute value of the derivative of well-being W with respect to the stressor X [37]. In the case of drought, this approach has recently been used to assess agricultural drought vulnerability in Southern Alberta, Canada [43] and on a global scale by Guo et al. [42].

2.1.3. The Indicator-Based Approach for Vulnerability Quantification

In the indicator-based approach, within the contextual vulnerability framework, vulnerability represents a present inability to cope with external pressures or changes (in this research, hydrological drought events). According to this definition, vulnerability is considered a characteristic of social and ecological systems that is generated by multiple factors and processes (perturbations) [20]. This approach, closer to the social view of vulnerability, is related to the current socio-economic determinants of the impacted system that act as drivers of vulnerability such as social, economic and institutional conditions [19].
In the case of drought, several studies have assessed the vulnerability to this socio-natural disaster following this approach [31,32,33,34,35,44,45,46]. From a quantitative point of view, most of these studies establish vulnerability metrics based on so-called composite indicators (CI) [47,48]. A recent work in this line was done by Naumann et al. [31], who proposed a Drought Vulnerability Indicator (DVI) in studies carried out in Africa, while Carrão et al. [33] and Wu et al. [46] expanded this “indicator-based” perspective to a global scale. A common aspect of these studies, which expresses the weakness of CI procedures [48], is that the authors acknowledge the usual limitations of this kind of approach: (a) the need for an adequate theoretical framework that supports the selection of the components of the indicator; (b) the presence of subjectivity in the weight of the selected variables and (c) the difficulty of validation of such indicators in terms of a causal relationship between them and the drought impact measures. Thus, robust but especially objective vulnerability measures are probably one of the main and most urgent goals in order to make drought vulnerability assessment progress and, in terms of Beccari [48], develop it into a more mature state.

2.1.4. The Reconciliation Way: Conceptual, Methodological and Statistical Convergence

The lack of reconciliation between the two main frameworks of vulnerability assessment has led to recent studies that attempt to overcome this limitation from a more integrated (holistic, synthetic, hybrid, top-down/bottom-up) perspective [12,16,20,21]. Thus, integrated alternatives such as the Hazard-of-Place model [49], the Double Exposure Framework [50] and the Coupled Vulnerability Framework [12] have emerged. In the case of drought, a recent proposal integrates both approaches under the concept of “Vulnerability Hotspots”, although from the metric point of view, it is at the crossroads of the estimates of areas exposed to water deficit stress (end-point approach) and the adaptive capacity of the same areas (start-point approach) [51]. A similar proposal was made by Antwi-Agyei et al. [52] when they created a vulnerability index as a linear combination of the type V = f(E + SAC), where V is vulnerability of regions to drought, E is exposure to drought (reflected in the magnitude of drought), S is the sensitivity of crop harvest to rainfall perturbations and AC is the adaptive capacity of regions to cope with drought (determined using socio-economic proxy indicators). Although it is an improvement in that it moves toward an integrated approach to drought vulnerability assessment, it exhibits the same limitations of CI described by Naumann et al. [31]. More recently, Mehran et al. [53] proposed a hybrid framework using a multivariate approach—Multivariate Standardized Reliability and Resilience Index (MSRRI)—for assessing socioeconomic drought vulnerability based on a combination of top-down/bottom-up metrics.
The convergent approach in this study addresses integration by jointly considering conceptual, methodological and statistical aspects, as described below.
  • Conceptual consideration: The convergent approach, as its name suggests, aims to maximize the convergence of outcome vulnerability (end-point) and contextual vulnerability (start-point) estimates. In this study, the convergence of different epistemic cultures is understood in terms of the cooperation among scientific fields or disciplines with the potential to evolve into an assimilated epistemic culture [54]. Figure 1 shows the conceptual scheme used in this study. As shown, the convergent approach offers an integrated perspective of the scheme presented by Fellman [19], and is more in accord with the idea of top-down/bottom-up complementarity proposed by Dessai and Hulme [55], except that here the central focus is placed on vulnerability estimation. Implicitly, the scope under this conceptual framework is to answer who is vulnerable, why and what factors should be integrated [16,21].
  • Methodological consideration: The convergent approach faces the problem indicated by Nguyen et al. [56] of “combining the different ways of framing and performing vulnerability analysis” and shows, as stated by Zarafshani et al. [45], that “both empirical and theoretical methodologies can be used to combine the hard and soft dimensions of drought vulnerabilities”, thereby addressing the “standard method for combining biophysical and socioeconomic indicators”. Since the focus of the convergent approach is on vulnerability estimation, for methodological purposes there is a need to have the metrics (indicator- and model-based) for a unit of analysis as a function of the spatial and time scales [16]. Taking into account that the focus of this work is the vulnerability of water security at a basin scale, the main methodological constraint, which is also common to a number of studies carried out at a local scale, is the availability and accessibility of pertinent background information [48,57].
  • Statistical consideration: Operationally speaking, the task of making both vulnerability metrics converge is correlational in nature. Accordingly, the convergent approach is tackled using the Structural Equation Model-Partial Least Squares Path Modeling (SEM-PLSPM) procedure [58,59,60]. Compared to other multivariate statistical methods that are commonly used in the construction of composite indicators such as Principal Component Analysis or Factor Analysis [47,48], SEM can better test the causal relationship between variables by modeling measurement error [61]. As a matter of fact, the statistical advantages of SEM-PLSPM are what led Trinchera and Russolillo [62] to recently propose its use as a robust alternative for the construction of composite indicators. This robustness was explicitly acknowledged by Naumann et al. [31] in the estimation of drought vulnerability. According to Trinchera and Russolillo [62], SEM-PLSPM provides two kinds of weights: one measuring the impact of each indicator on the corresponding composite indicator and the other measuring the impact of the composite indicator on the complex indicator. Together with covariance-based SEM, SEM-PLSPM is one of the two statistical procedures in the SEM family [63]. SEM-PLSPM is formally defined by two sets of linear equations: the inner model and the outer model. The inner model specifies the relationships between unobserved or latent variables (constructs), whereas the outer model specifies the relationships between a latent variable and its observed or manifest variables [58]. Figure 2 shows an example of such a PLSPM.
In accord with this figure, the inner model for relationships between latent variables can be written as:
ξ = B ξ + ζ
where ξ is the vector of latent variables, B denotes the matrix of coefficients of their relationships, and ζ represents the inner model residuals. In addition, the reflective mode has causal relationships from the latent variable to the manifest variables in its block. In this case, each manifest variable in a certain measurement model is assumed to be generated as a linear function of its latent variables and the residual ε:
X x = Λ x ξ + ε x
where Λ x represents the loading (pattern) coefficients. The solution of the equations is performed in an iterative manner according to the algorithms described by Henseler et al. [58] and Hair et al. [59].

2.2. Case Study: Vulnerability of Water Security to Drought

2.2.1. Study Area

The study area was the Elqui River basin (ERB), which extends between 29°27′–30°34′ S and 71°22′–69°52′ W, covering an area of approximately of 9700 km2 in the Coquimbo Region, Chile (Figure 3) [64,65]. The ERB includes three sub-basins: the Turbio River (about 4200 km2, Qannual_mean = 7.75 m3/s), Claro River (about 1550 km2, Qannual_mean = 4.42 m3/s) and Elqui River (about 3950 km2, Qannual_mean = 11.0 m3/s) [65]. The Turbio River originates at the confluence of the Toro and La Laguna rivers [64], the Claro River stems from the confluence of the Derecho and Cochiguaz rivers and the Elqui River rises from the confluence of the Turbio and Claro rivers, near Rivadavia. From that point to the ocean, this river is fed by minor water flows such Santa Gracia and Marquesa creeks in the northern stretch and Arrayán, Talca and San Carlos creeks in the south [64].
The largest geomorphological units are the High Andes Mountains (elevation >3000 m a.s.l.), Middle Mountains (elevation between 600 and 3000 m a.s.l.), Fluvial Valleys (E–W oriented terraces) and the Coastal Border [66].
The arid climate of the study area is determined mainly by the interaction of the orographic surface, the Humboldt currents and the seasonal and interannual movement of the south–eastern Pacific anticyclone, with high variability in precipitation that contributes to highly recurrent drought events [66,67].
Despite the arid conditions, both permanent water availability from snow-fed Andean water flows and water management in the basin have contributed to the significant production and economic growth of the ERB. This growth has been sustained in recent decades by farming (c.a. 25,000 ha), mining, agro-industrial and service activities, which have led to exponential growth of the urban area known as the La Serena-Coquimbo conurbation [68,69]. Among the factors of the water system that have sustained the growth of the basin are: (a) the presence of permanent snow-fed water flows from the Andes; (b) the natural contribution of surface water provided by permanent stream systems; (c) the presence of an aquifer system with a storage capacity of c.a. 435 × 106 m3; (d) the presence of sound water infrastructure in the form of reservoirs (La Laguna, with a capacity of 36.66 × 10⁶ m3 and Puclaro, with 200.88 × 10⁶ m3) and irrigation canals (117 canals, with over 750 km in length) [70]; (e) the presence of water management organizations known as Water Users Organizations (WUO) such as the Elqui River Water Board (ERWB) and the Derecho River Water Board (DRWB) and (f) the monitoring and control of water management by different public entities such as the General Water Directorate (DGA) and the Directorate of Hydraulic Works (DOH), which together compose the so called “institutional landscape of the Water Management System in Chile” [71]. These factors have interacted in a context of growing pressure on scarce water resources, which by 2006—and without significant changes so far—meant a demand of which approximately 95% was accounted for by agriculture, 2.5% by industry, 2.5% by drinking water production and a marginal percentage by agro-industrial activity [64,69,70,72].

2.2.2. Outcome Vulnerability Estimation

Outcome vulnerability of water security to drought in 2000–2014 was calculated using the methodology proposed by Luers et al. [37]. Vulnerability values were estimated for a total of N = 35 nodes of the Water Evaluation and Planning System (WEAP)-Elqui model, which is a specific version for the ERB of WEAP [73]. It was calculated as follows:
V = ( | C / S S I 12 | C / C 0 ) P S S I 12 S S I 12
where | C / S S I 12 | corresponds to sensitivity or degree of change in coverage—estimated by WEAP-Elqui—with respect to S S I 12 . Sensitivity values were estimated as the linear regression slope between the mean annual coverage (as the well-being parameter) and the S S I 12 measured in April each year (as the stressor parameter).
C corresponds to the mean annual coverage during the simulation period. In the WEAP model, the term “coverage” refers to the percentage of demand satisfied. Therefore, the inflow to a demand site (DS) from all of its transmission links (Src) in WEAP-Elqui will equal its supply requirement times its coverage under the constraint that the coverage (for demand D) cannot exceed 100%. In quantitative terms, InflowSrc,DS = SupplyRequirementDS × CoverageDS.
C0 corresponds to the critical coverage threshold according to the node type. C0 threshold values are shown in Table 1.
S S I 12 corresponds to the Standardized Streamflow Index (SSI) for a cumulative period of 12 months, calculated according to Núñez et al. [74] with data obtained from the General Water Directorate.
P S S I 12 corresponds to the probability of occurrence of the stressor phenomenon (exposure), calculated as the percentage of the time in which S S I 12 values fall below −0.84. This is an institutionalized value used in Chile in general and in the ERB in particular to trigger a declaration of drought according to Decree 1674, which establishes the criteria to be used when declaring periods of severe drought according to the General Water Directorate and the Public Works Ministry [75].
The estimated sensitivity (vulnerability) values were rescaled to adopt values between 0 (lowest vulnerability) and 10 (highest vulnerability).
For comparison purposes, four simulation scenarios were established (Table 2).
The selected factors were (a) Presence/absence of an aquifer, due to the importance of groundwater for the sustainability of coupled human and natural systems under drought conditions, particularly in the study area [68,82] and (b) Presence/absence of the so-called Drought Coefficient (DC), included by RODHOS [73] in the WEAP-Elqui model to represent the effects of the 2010–2015 Chilean megadrought in the ERB [83]. The Drought Coefficient is a calibration parameter of the WEAP-Elqui model that reduces the value of the crop coefficients (kc) [76] of all of the crops in the basin from 2009 to 2014, simulating the decrease in effective agricultural demand (indirectly irrigated area and irrigation habits) due to the effect of drought. However, while it would have an impact on the estimation of water coverage, the DC would impede an accurate estimation of the water security of the basin.

2.2.3. Contextual Vulnerability Estimation

Contextual vulnerability of water security to drought was calculated using the composite indicator methodology [13,14,47,48]. To this end, a total of 27 indicators (Table 3) were set up/collected/preselected. Indicators that exhibited minimum variance or high skewness and/or kurtosis or minimum variability in a boxplot were discarded. Thus, the Predictable Coefficient of Use (PCU) and Quality Concentration (QC) indicators (Table 3) were eliminated, leaving 25 indicators available for the analysis. There was no need to fill in missing data. Indicators were normalized though a min-max procedure. Once the 25 indicators were determined, a theoretical clustering was devised and the indicators were distributed in a 2 × 3 conceptual matrix. Table 4 shows the proposed theoretical clustering.
Categories (Exposure, Sensitivity and Adaptive Capacity) were established following the conceptual model of Turner et al. [11] and considering typical clustering described in similar works [31,95,96]. Hydrological-Productive categories entail the idea that vulnerability is determined by structural factors (durably independent from policy makers’ will to change) and non-structural ones (durably dependent on policy makers’ will to change).

2.2.4. SEM-PLSPM-Based Convergence

Both contextual and outcome vulnerability were made to converge through SEM-PLSPM using SmartPLS v 3.1 software [97] (outcome vulnerability was obtained from scenario C as a reference vulnerability estimate). The performance of the models was assessed in terms of the so-called measurement and structural models [58,59].
The measurement model (relationship between indicators and construct) was assessed in terms of reliability (Cronbach’s alpha (α), Composite Reliability ( ρ c )) and validity (average variance extracted (AVE), square root of AVE ( A V E )). Cronbach’s alpha and Composite Reliability measure the reliability of the internal consistency of the constructs. The first does so in terms of the intercorrelation of the observed indicator variables and assumes that all of the indicators are equally reliable and have equal outer loadings with respect to the construct, which tends to underestimate true reliability. The second addresses this limitation by considering the different outer loadings of the indicator variables.
In the case of validity, AVE is a measure of Convergent Validity, and is the extent to which a measure correlates positively with alternative measures of the same construct. A V E , meanwhile, is a measure of Discriminant Validity—the extent to which a construct is truly distinct from other constructs—and it is expected that the square root of the AVE of a construct will be greater than its greatest correlation with another construct.
The structural model (relationship among constructs) was assessed in terms of the coefficient of determination R2 and the significance of path coefficients (β) obtained through bootstrapping [60]. In the first case, R2 is a measure of the predictive precision of the model and represents the combined effects of the various constructs on the response construct. In the second case, β represents the hypothesized relationships among the constructs with standardized values between −1 and +1. The criteria adopted for the interpretation of each of the mentioned indicators are presented in Section 3.

2.2.5. Sensitivity Analysis and Robustness

Due to the importance of the role of sensitivity analysis in the estimation of vulnerability on the basis of composite indicators [31,47,48] and given that, in the context of SEM–PLSPM, sample size has been the most debated issue [58,59], a sensitivity analysis was performed on the final vulnerability model with respect to the sample size. To this end, the approach presented by Memon and Rahman [98] was used by checking the stability of the model by calculating adequacy of sample size with a power analysis test. The sample size required that a statistical power of 80% be met, which was calculated using the G*Power 3.1.2 software package [99] with α = 0.95 and model size effect as:
f 2 = i = 1 k w i f i 2
where w i is relative importance of the β i-th path coefficient of the PLSPM model with k constructs and f i 2 was calculated as [60]:
f i 2 = R i n c l u d e d 2 R e x c l u d e d 2 1 R i n c l u d e d 2
In addition, the effect of misspecification exhibited by the measurement model (reflective versus formative) was assessed since this issue has been much debated [100]. In the reflective measurement model, the indicators represent the effects (or manifestations) of an underlying construct. In contrast, formative measurement models are based on the assumption that the indicators cause the construct. The effect was assessed in terms of the difference in placement of each of the 35 nodes in one of three vulnerability categories as a function of the measurement model specification. The categories were obtained through a cluster analysis based on the Ward model as applied to the scores of the four constructs in the Final Model, as described by Sánchez [101].
The robustness of the convergent approach was estimated by comparing its results with those obtained by a set of six alternative methods for the construction of composite indicators, very much like the approach used by Carrão et al. [33] to evaluate the robustness of their model to predict global vulnerability to drought. Table 5 describes the alternative methods used for comparison purposes, a comparison that was carried out in terms of the R2 of the correlation between contextual and outcome vulnerability estimated for scenario C.

3. Results

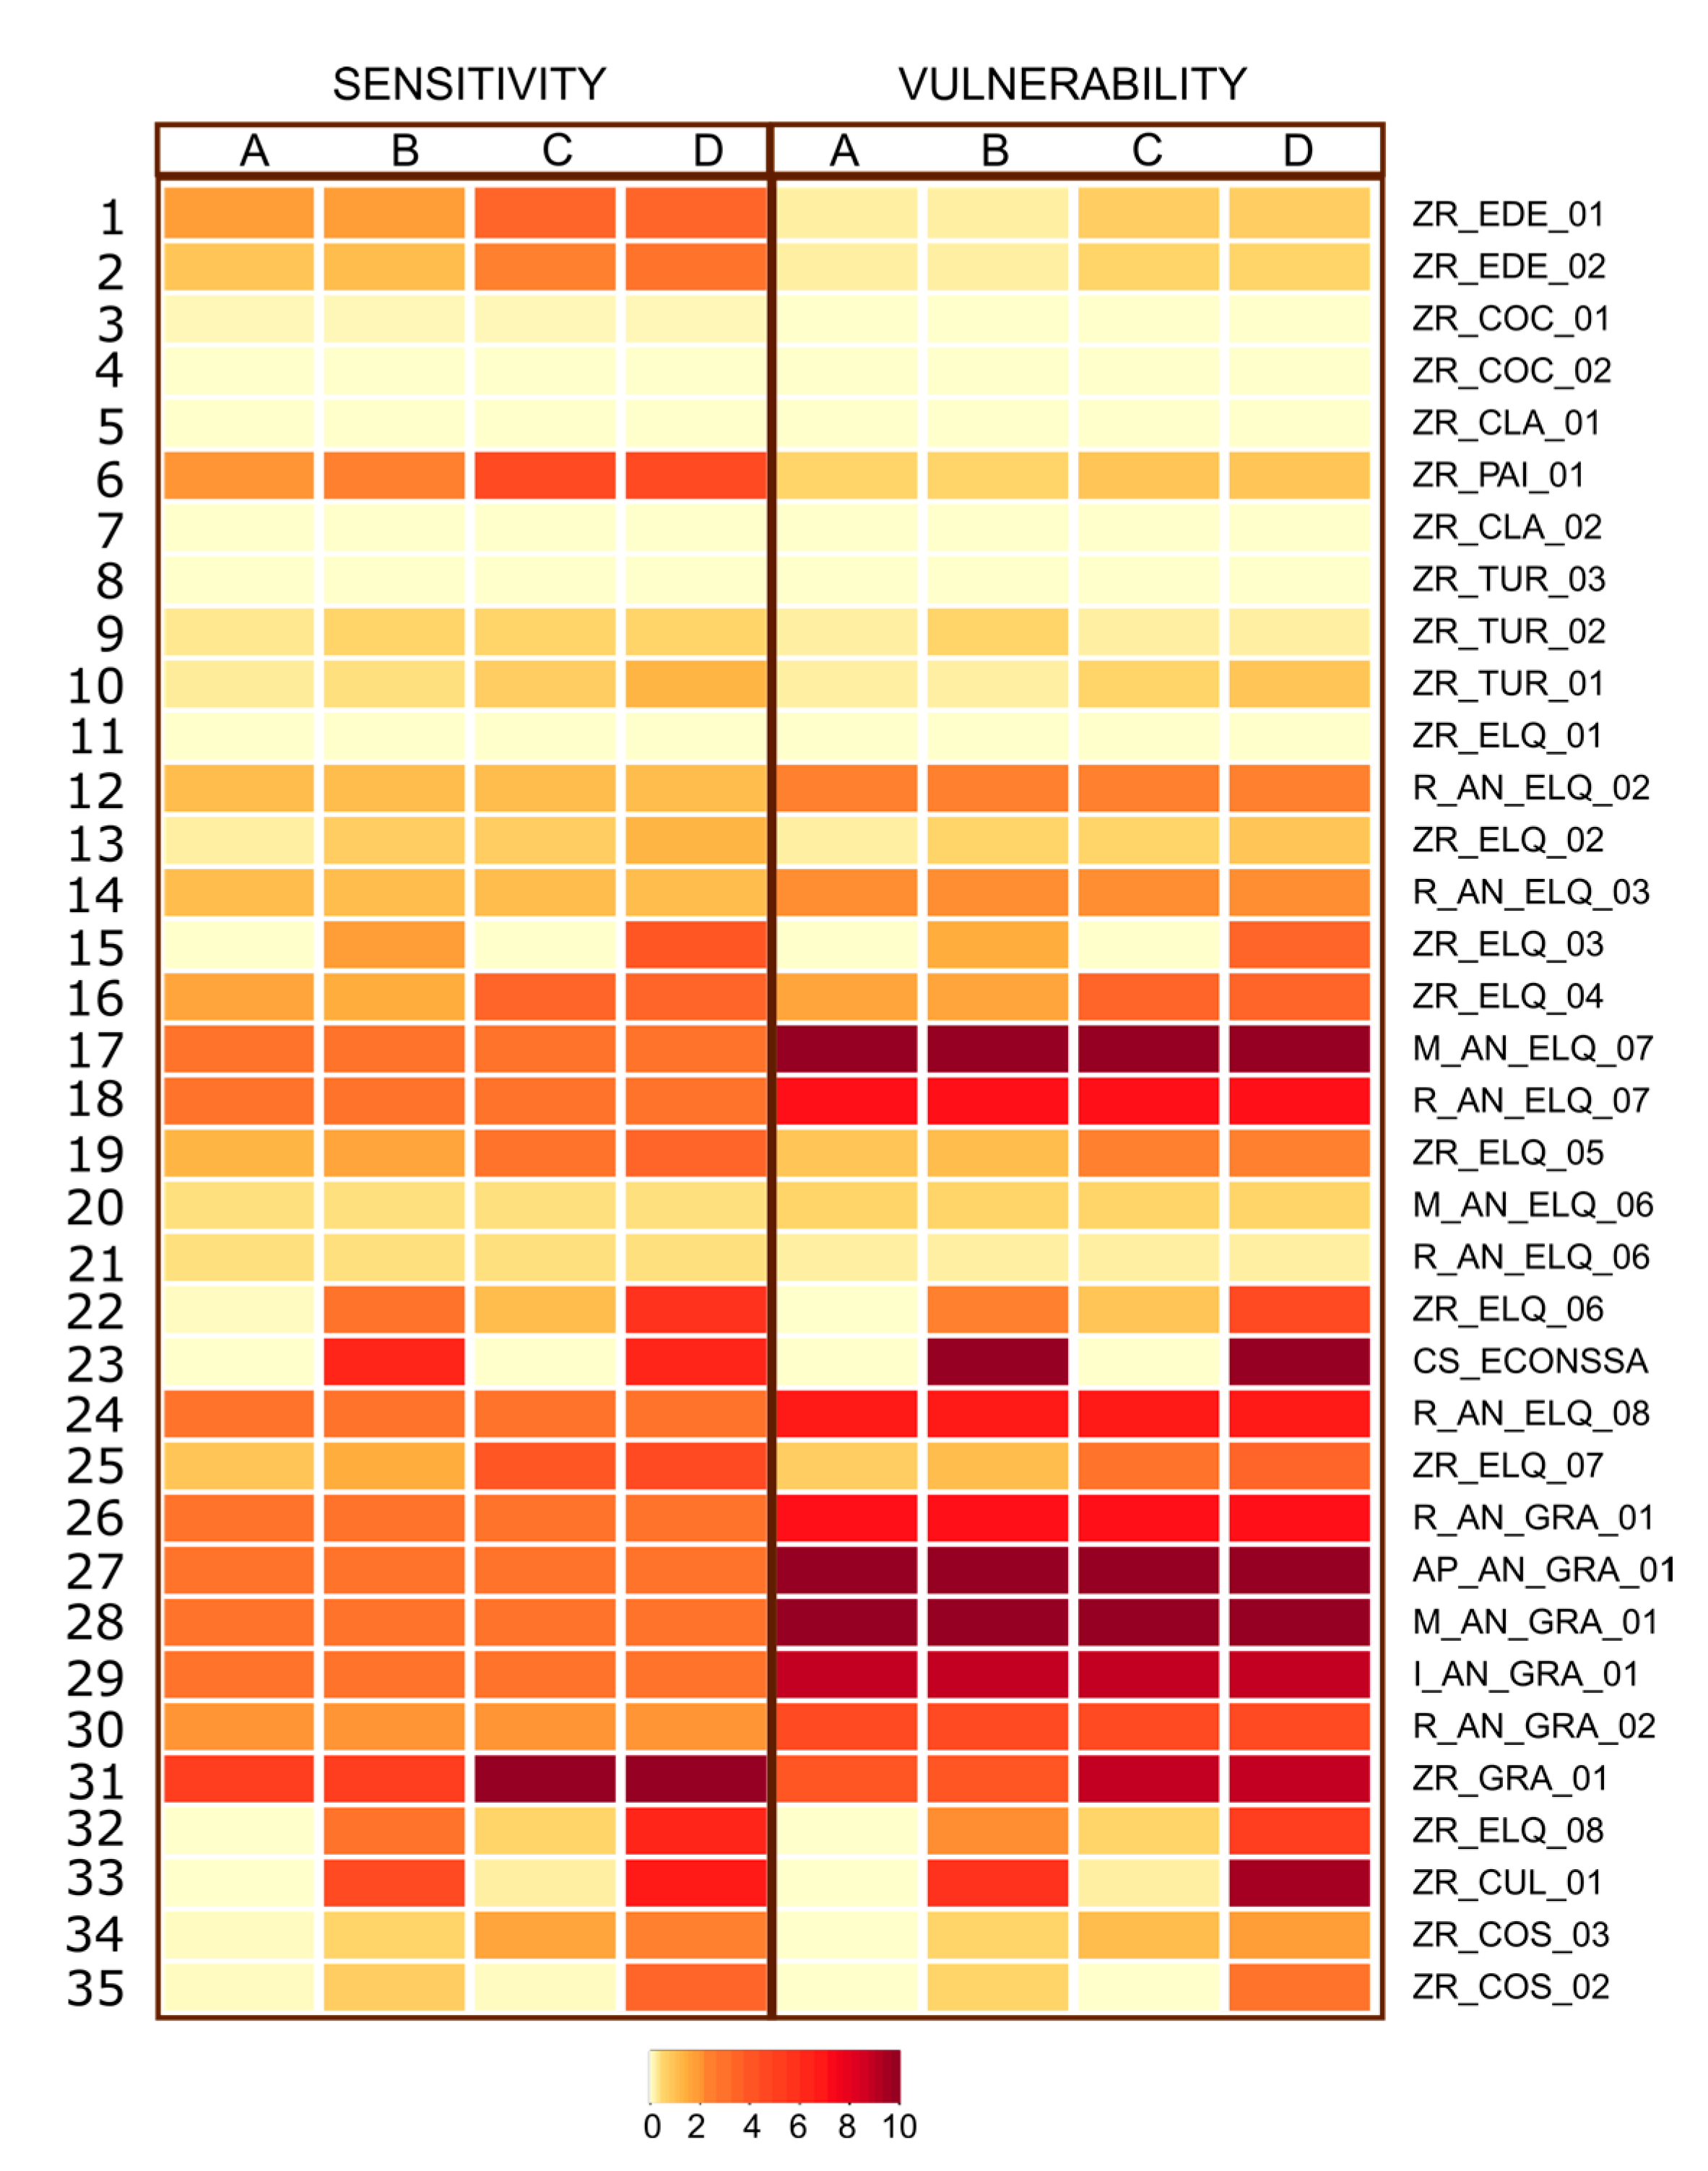
Figure 4 shows outcome sensitivity (vulnerability)—both derived from Equation (1) and estimated using Equation (4) based on Luers et al. [37] model-based approach under the outcome vulnerability framework (Figure 1)—of water security under drought events for water-use sectors (WEAP-Elqui nodes) in the ERB according to simulated scenarios.
Sensitivity (the degree of change in coverage with respect to S S I 12 , according to Equation (4), increases in the downstream direction of ERB, particularly from the confluence of the Turbio and Claro rivers. In the upper sector, irrigated zones (ZR) above the Derecho River (EDE) show higher sensitivity. That is, a high variation in drought intensity produces a high variation in the water coverage of this water-use sector. This may be due to the fact that the water distribution in the area is managed by an organization (DRWBother than that of the Elqui River, and therefore subject to different regulations. Sensitivity is influenced by the simulation scenarios, and is higher in conditions of aquifer absence and Drought Coefficient absence. The highest sensitivity values for the ERB are found, from lowest to highest, in: irrigated zones in Santa Gracia Creek (ZR-GRA_01), drinking water production for the La Serena-Coquimbo conurbation (CS_ECONSSA) and the irrigated area situated above the Culebrón aquifer (ZR_CUL_01). Vulnerability of water security to drought events, which, in accord with Equations (1) and (4), is understood as the susceptibility of the water-use sector to drought damage as a result of its sensitivity, status with respect to a threshold level and exposure to the phenomenon, as with sensitivity, is a function of (a) the location of water-use sectors (node) in the basin and (b) the selected simulation scenario. In the first case, vulnerability is higher downstream in the basin, showing intermediate values (2–6) in nodes located on the Elqui River (ELQ), and moderate to high values in nodes such as Santa Gracia Creek (GRA) and Culebrón aquifer (CUL). The lowest vulnerability values are found in the upper part of the basin at the convergence of the Claro (CLA) and Turbio (TUR) rivers. The areas that are permanently irrigated (ZR) by the three main rivers in the ERB show less vulnerability compared to areas where irrigation relies on natural sources (R). However, for the mining activity (M) that makes use of water from natural sources (AN), vulnerability depends more on its location in the basin than the stability of the source.
As for scenarios, the more restrictive they become (A to D), the higher the vulnerability values they show, though only in nodes that represent irrigated agricultural sectors (ZR,R) with access to aquifers. Scenarios without the Drought Coefficient (C,D) are more vulnerable, which is consistent with the hypothesis that drought conceals its direct impact on water security if the latter is calculated in terms of the water coverage of the node, as proposed by the WEAP-Elqui model by RHODOS [73]. Scenarios without an aquifer (B,D) are more vulnerable than those with an aquifer (A,C). The greatest effect appears in the Culebrón aquifer (CUL), in the agricultural sector known as Pan de Azúcar (Figure 3). This aquifer is the most important in the ERB since it accounts for the 39% of the total groundwater storage capacity in the basin. In the upper areas of the basin, at the confluence of the Turbio and Claro rivers, the general pattern shows low or no vulnerability. Only some sectors show an increase in vulnerability under the scenario without an aquifer, such as those linked to the Derecho River (EDE) and stretches of the Turbio River. In order to determine if the Drought Coefficient and Aquifer Presence/Absence factors included in the simulation scenarios significantly affect mean drought vulnerability in irrigated zones (ZR), a two-way analysis of variance (ANOVA) without interaction and Tukey’s HSD (Honestly Significant Difference) post hoc test for samples of equal size were applied. The latter procedure allows the comparison of all pairs of means. When used with equal sample sizes, the family-wise error rate is exactly equal to α, which was set at 0.05 in this case [109]. The analysis confirmed the statistical significance of both the Drought Coefficient factor (p < 0.0286) and the Aquifer Presence/Absence factor (p < 0.0221). This is a significant issue since the agricultural sector is the main water user in the basin [64,69].
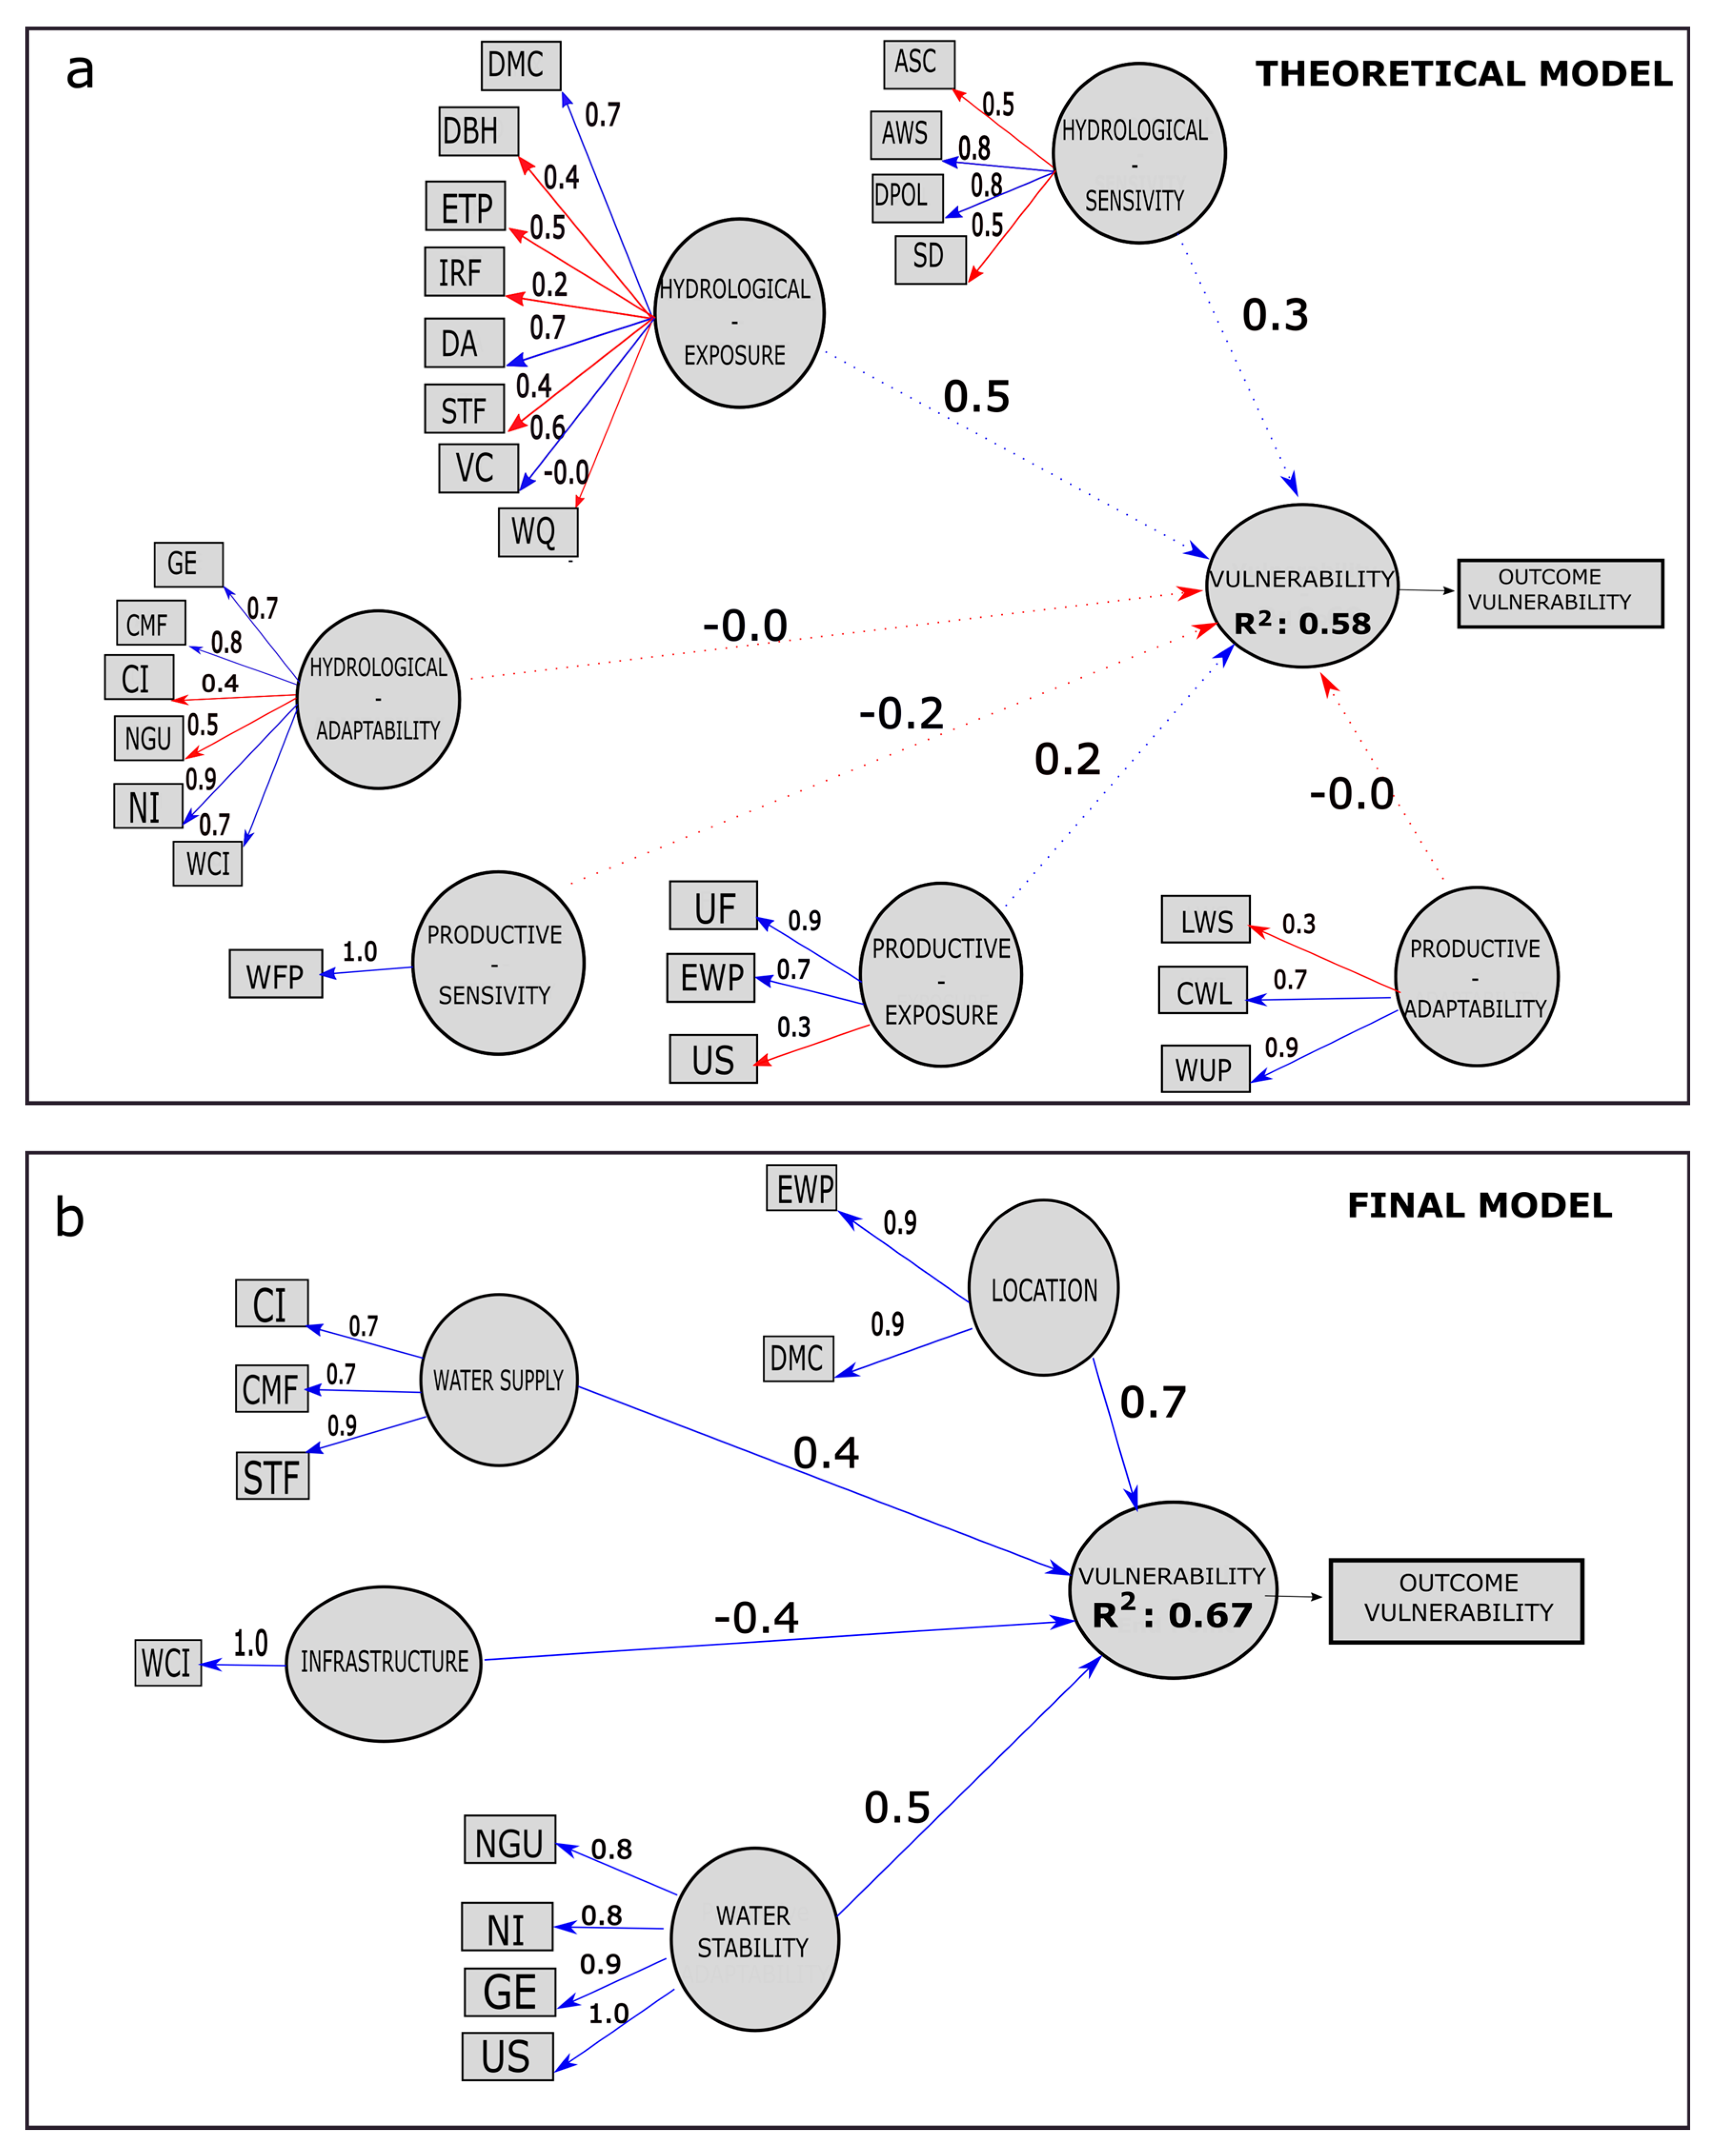
Figure 5 shows the Theoretical and Final contextual vulnerability models, whereas Table 6 shows the performance of the proposed models. As for the Theoretical Model, only three of the six proposed constructs (hydrology-sensitivity, hydrology-adaptability, productive-adaptability) show values that are considered sufficient for the criteria included in the measurement model (reliability and validity of construct). This fact corroborates the existing consensus on the effect that subjectivity exerts on the selection, combination and weighting of the indicators in use when constructing composite indicators [31,47,48,62]; it also explains the high diversity of current methodological approaches for the construction of this type of indicator. The structural model, meanwhile, exhibited a moderate predictive capacity (R2 = 0.58), but no path coefficients (β) appeared to show statistical significance [58]. Thus, the proposed Theoretical Model does not apply as an explicative model for the vulnerability of water security to drought in the ERB [58,60,61].
The Final Model, on the other hand, appears to satisfy the performance criteria for the measurement model (reliability and validity) and the structural model (β, R2). This model is composed of four constructs and kept 10 out of the 25 original indicators, a number of indicators on the low end of the range that is commonly used in the construction of composite indicators and drought vulnerability studies [31,33,35,48,95,96]. The Location construct is reflected in the indicators for node’s position in the basin (East–West Geographical Position [EWP], Distance to Main Canal [DMC]) and confirms the significant role that this construct plays in the spatial distribution of vulnerability in the ERB, as was previously noted in the estimation of outcome vulnerability. The Water Supply construct is reflected in indicators (Canal Infrastructure [CI], Canal Maximum Flow [CMF], Streamflow [STF]) that efficiently supply water to the water-use sector. The Infrastructure construct is reflected in the Water Control Infrastructure [WCI] indicator, which includes the number of automatic gates in the canal system that feeds each node. The Water Stability construct includes indicators (Groundwater Users [NGU], Node Immobility [NI], Groundwater Extraction [GE], User Size [US]) that relate to the capacity of the water system to provide conditions of stability to the water-use sector (node). Thus, the proposed constructs implicitly include the notions of exposure (Location), sensitivity (Water Stability) and adaptive capacity (Infrastructure, Water Supply), which are also components of the theoretical model of vulnerability proposed by Turner et al. [11]. The predictive capacity of the model is significant (R2 = 0.67) [58], thus confirming what Trinchera and Russolillo [62] state about the capacity of SEM-PLSPM to cope with subjective elements in the construction of composite indicators.
Concerning the sensitivity of the Final Model, model stability for a statistical power of 80% was reached for n = 23, a value that is less than the total N = 35 used in the modeling process. This value is consistent with that reported by Hair et al. [60] (N = 33) for α = 0.05, four constructs, a R2 = 0.75 and a statistical power of 80%. The lowest value of n in the Final Model is explained by a lower value of R2 (0.67), which in turn generates a lower size effect (
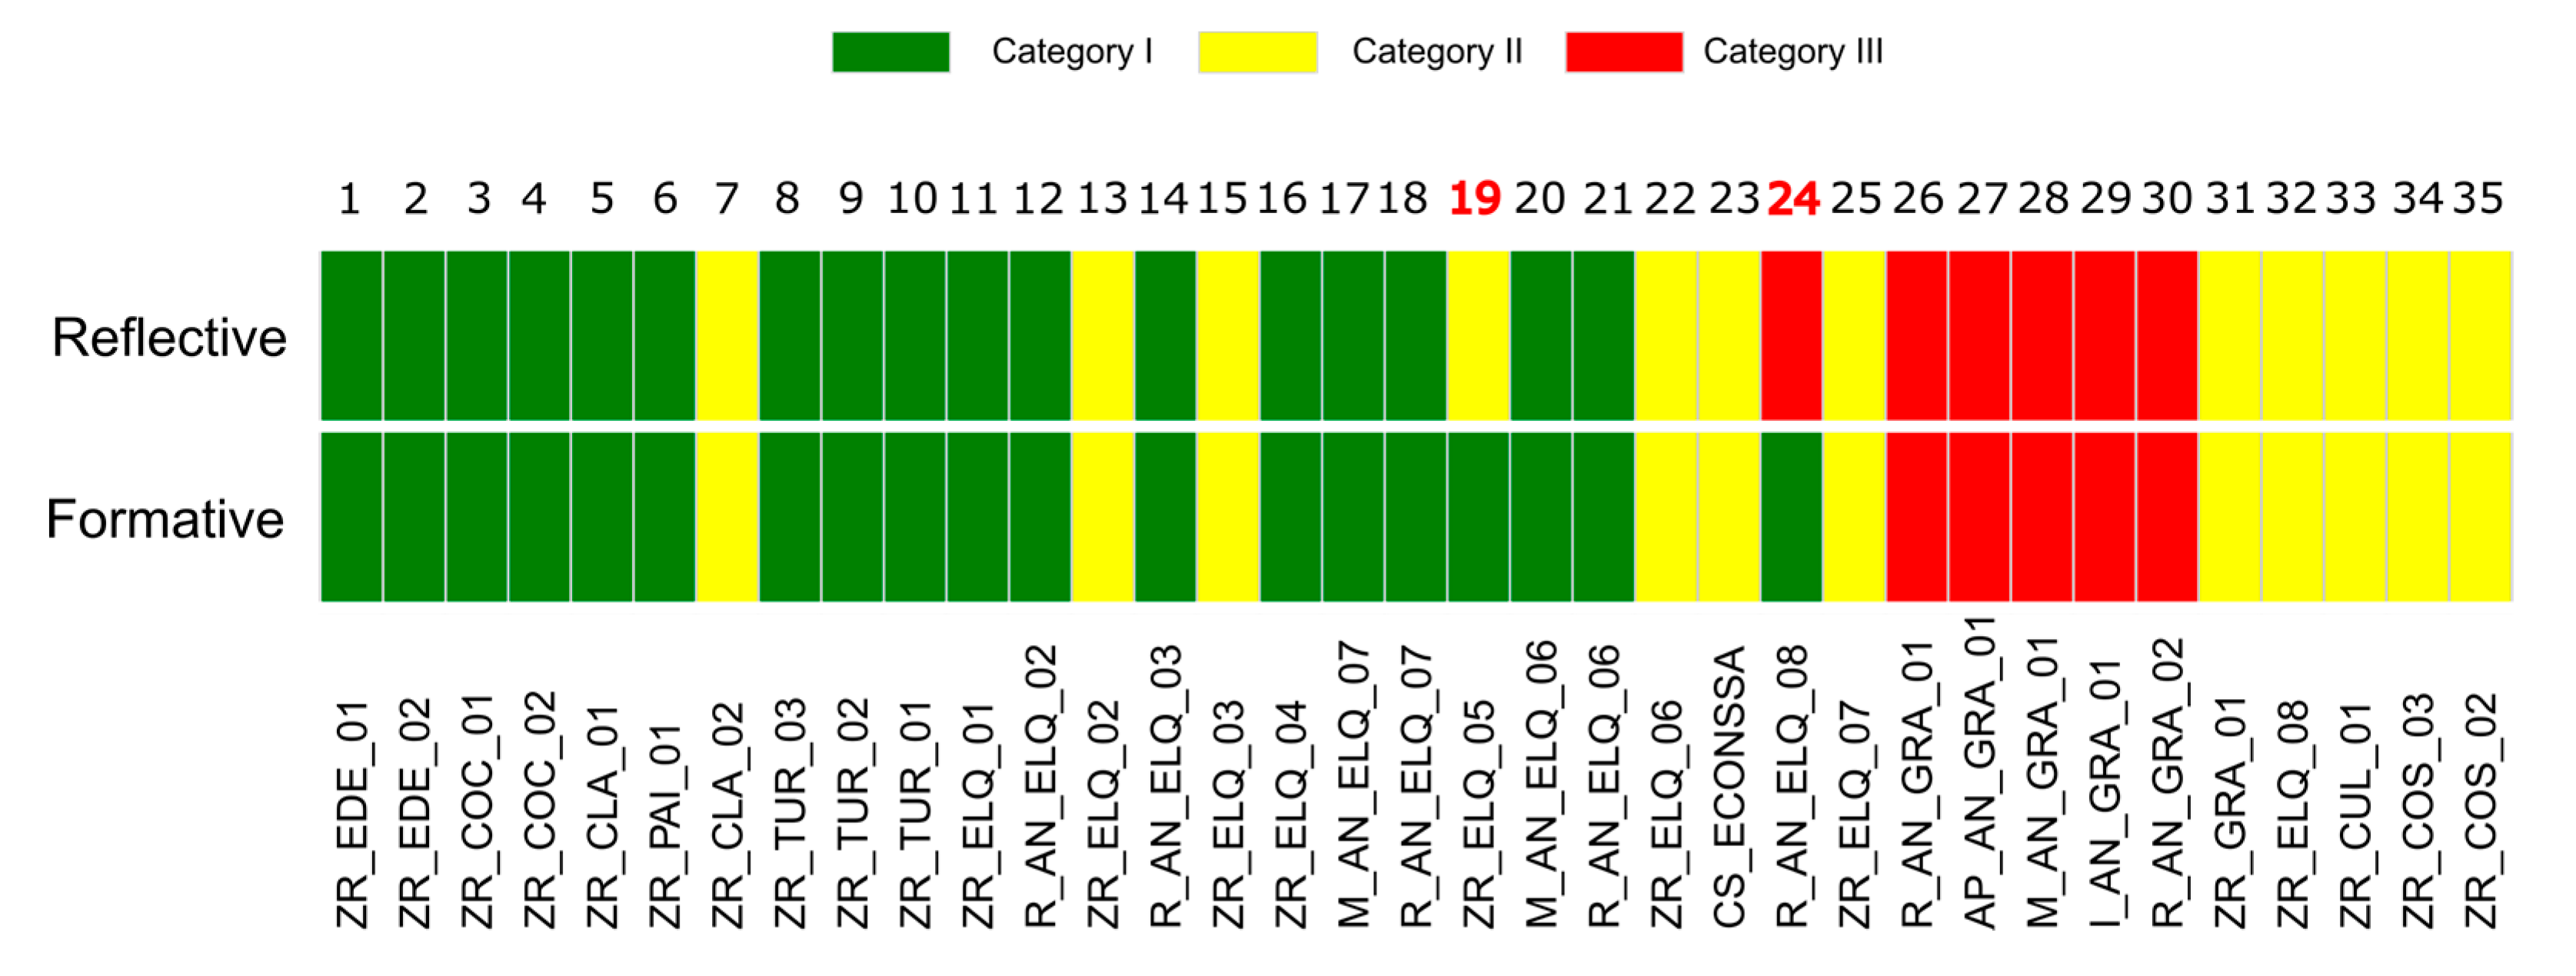
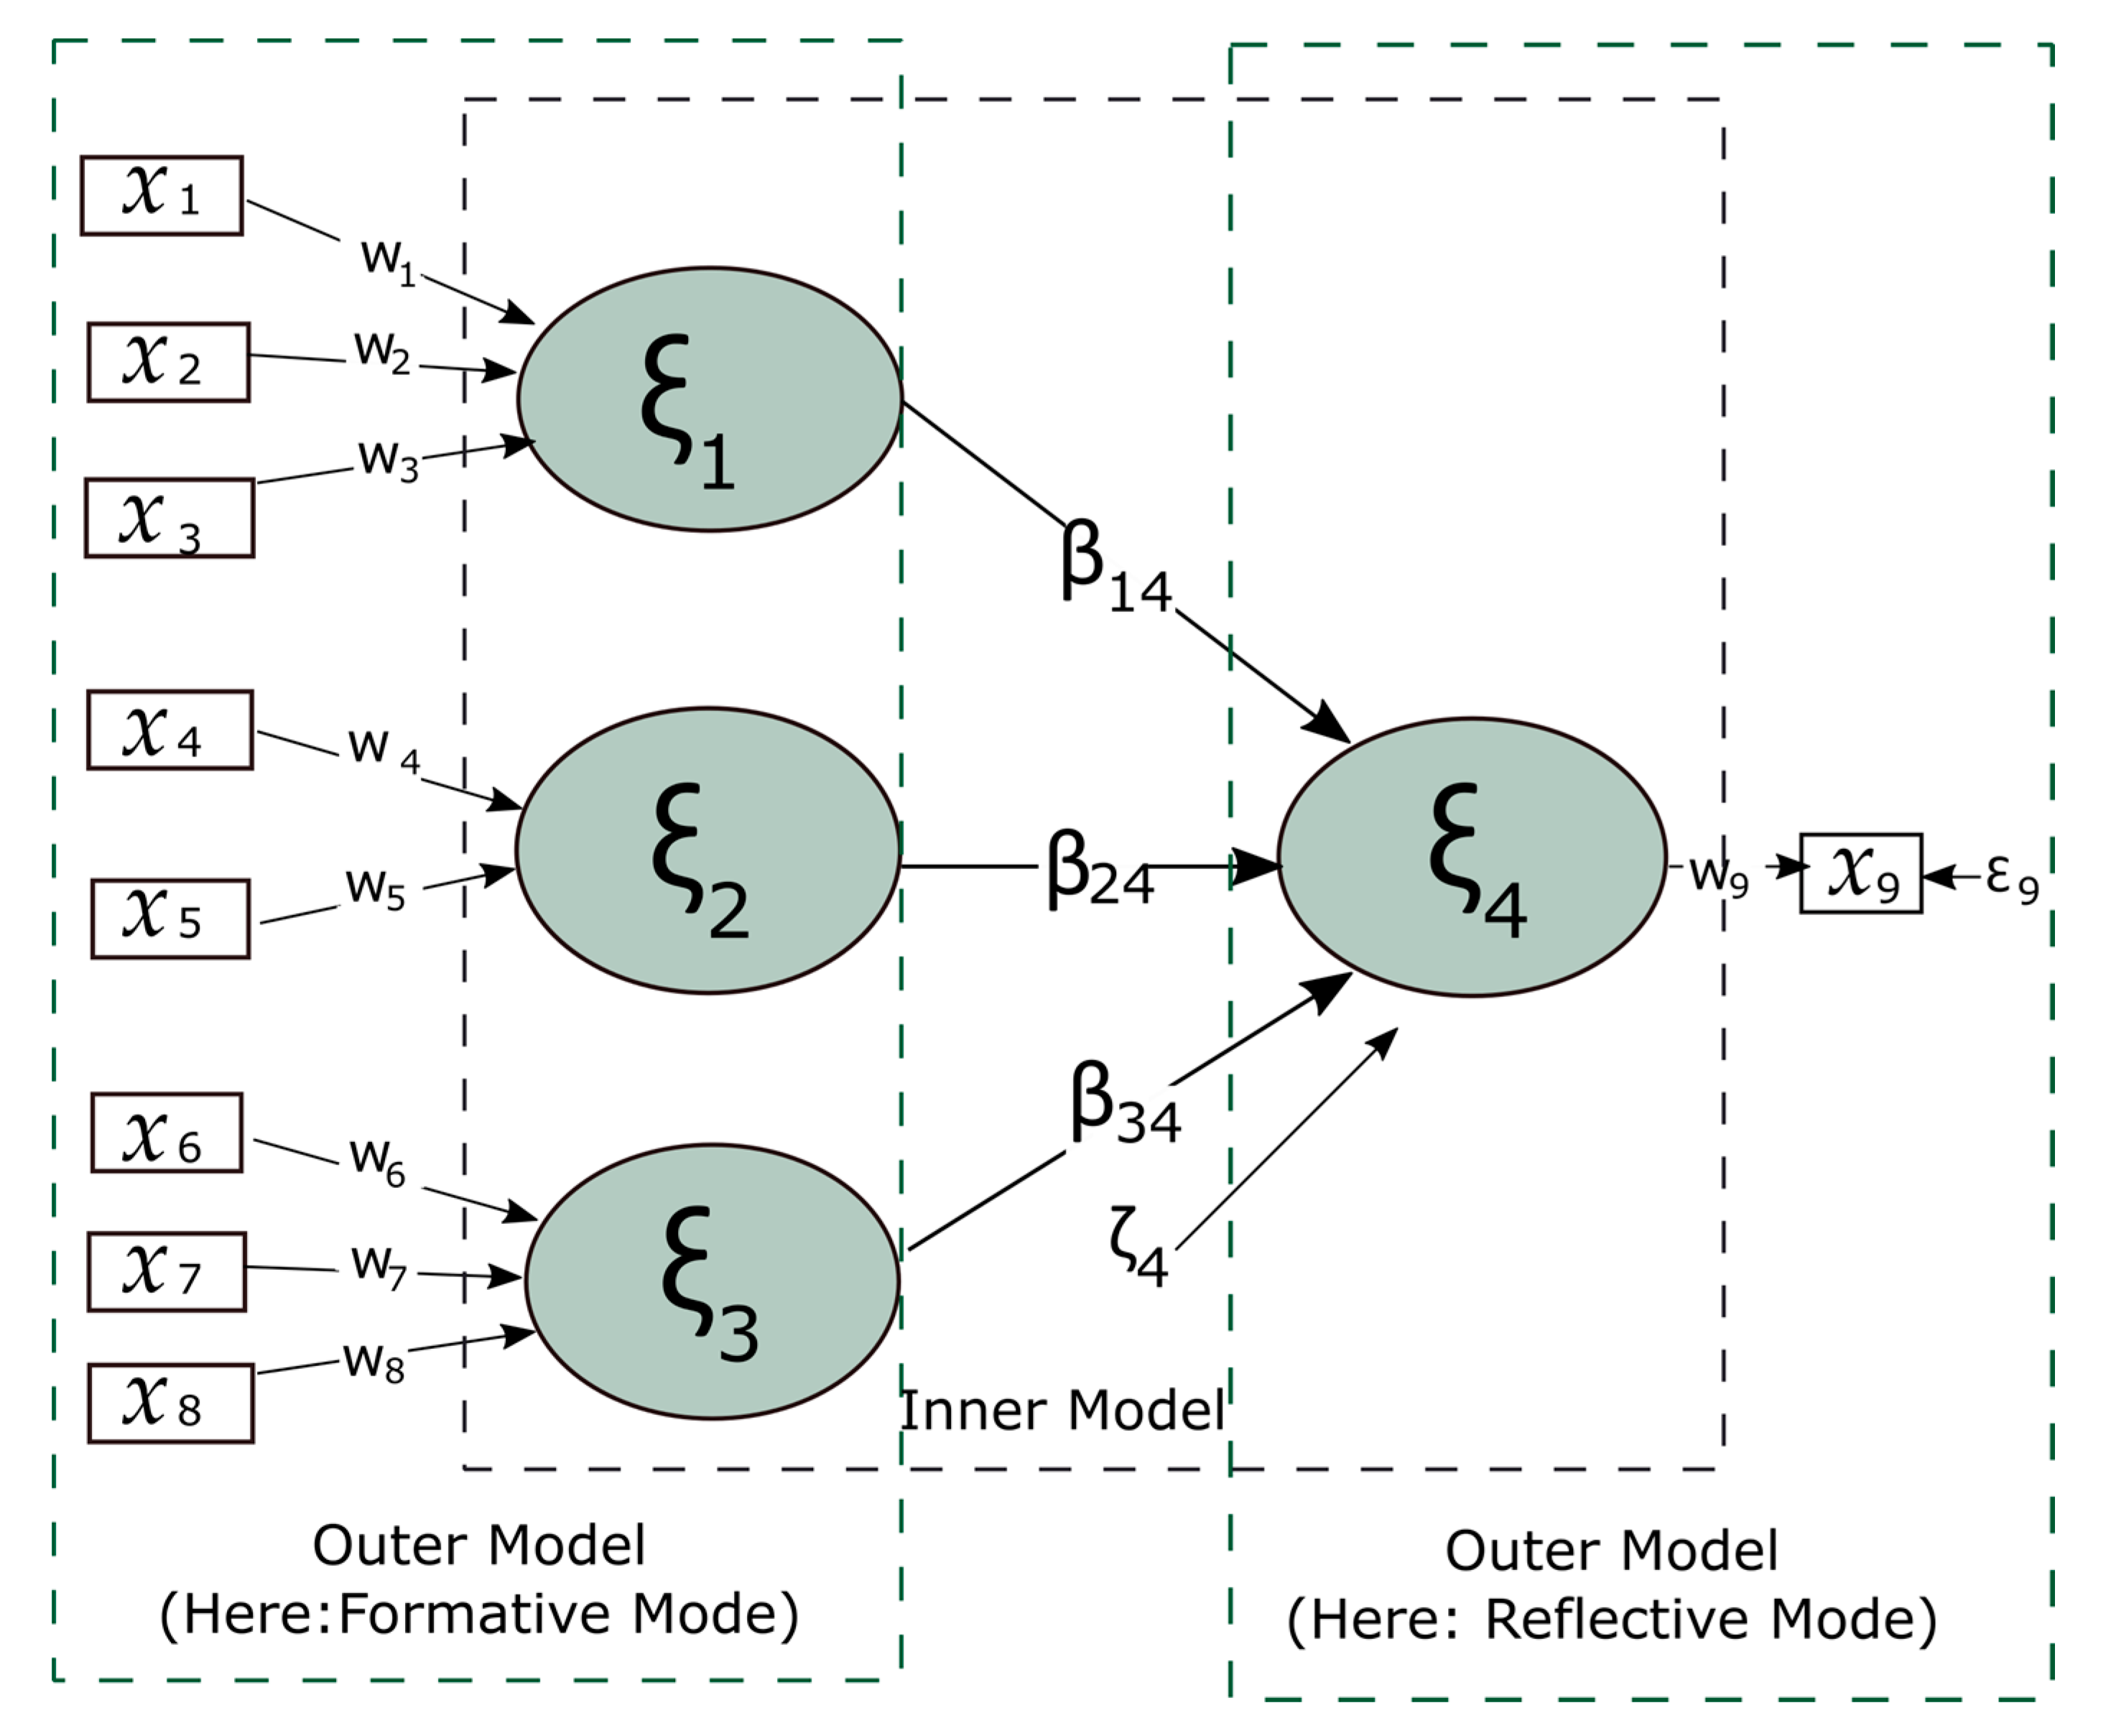
f2 = 0.3). In the case of the measurement model misspecification—the specification of the measurement model as reflective or formative—as shown in Figure 6, only two of the 35 nodes showed differences in allocation in the vulnerability category depending on the type of measurement model, although the predictive performance decreased to a R2 = 0.55 (moderate). Accordingly, and in line with Minotti et al. [100], the misspecification of either a reflective or formative model did not imply a significant impact on the estimation of the vulnerability category under which a water user is placed by the Final Model.
The robustness of the Final Model is confirmed in Table 7, which shows R2 values for the six alternatives for contextual vulnerability assessment under study. Accordingly, the SEM-PLSPM-based convergent approach shows one of the highest R2 values, slightly less than random forest, which is one of the algorithms with the highest predictive performance but lacks the ability to adjust indicators to a theoretical model [58,61]. The high predictive performance of SEM-PLSPM, (R2 = 0.91), slightly higher than random forest when isolated indicators are considered (SEMmax), should also be noted. Alternatives commonly used in the construction of composite indicators (PCA, FA, SES) and more recent proposals (BoD, RBoD) show a very low predictive performance, which confirms the soundness of the convergent approach proposed in this study as a means of advancing toward an objective assessment of vulnerability.

4. Discussion

Drought has been, is, and most likely will remain one of the most significant socio-natural disasters affecting society and the environment worldwide. “Promoting standard approaches to vulnerability and impact assessment” [9] is an issue that is gaining importance in both science and policy-making, to the extent that it is considered a priority [6]. The need to face this urgency, however, makes it necessary to acknowledge the lack of reconciliation between the two mayor epistemic frameworks (contextual and outcome) that deal with vulnerability assessment [15,17,19]. Some authors have suggested, prematurely perhaps, that “because the two interpretations are rooted in different discourses and differ fundamentally in their conceptualization of the character and causes of vulnerability, they cannot be integrated into one common framework” [18]. This view, however, has been challenged in recent years by the so-called integral frameworks (holistic, synthetic or hybrid) [12,20]. This development holds promise insofar as, at least in the case of drought, although it is similar to other areas concerning vulnerability to natural disasters [13], the contextual framework has been the most frequently employed [16]. Nonetheless, this work proposes a new approach—the convergent approach—to assess vulnerability within the integral framework. Vulnerability is assessed in the context of water security, which is now considered a new paradigm in both the academic and public policy fields concerning water resources [22,23,27]. The convergent approach, herein presented in conceptual, methodological and statistical terms, is applied to the analysis of the vulnerability of water security to drought in water-use sectors in the Elqui River basin, a typical basin of the mountainous area in the arid region of north-central Chile [25,64].
Vulnerability is estimated primarily under an outcome approach by means of a metric based on the proposal presented by Luers et al. [37]. With water security defined in terms of coverage of the demands of water users in the ERB, the results show high heterogeneity in vulnerability to drought within the basin. This heterogeneity exists basically as a function of spatial location in the basin and the simulation scenarios generated for comparison purposes. In the first case, the inequality in vulnerability within the ERB (Gini coefficient = 0.62) shows an east–west component downstream that allows a quasi-structural explanation derived from the historical water distribution practices carried out by different Water Users Organizations [69,70]. This finding is confirmed by the almost null coverage sensitivity to the hydrological drought in the upper sector of the basin, while in the lower sectors, where the highest demands are found in the urban sector (La Serena-Coquimbo conurbation) and the vast Pan de Azúcar agricultural area situated above the Culebrón aquifer [68], sensitivity and vulnerability show the highest values in the basin. This finding alone is very important if it is analyzed from the science-policy interface and as input for decision-making by stakeholders, especially in a moment in which water legislation in Chile is undergoing a debated reform process triggered by, among other aspects, the impact of drought and water scarcity in a large part of the country in the last decade. Although a detailed analysis of this aspect goes far beyond the objectives of this study, it shows the potential of the convergent approach—in the context of the integral framework—to provide information on the role that factors that are so sensitive to public opinion such as unequal water distribution play in the vulnerability of water security to drought events.
Vulnerability increases noticeably in scenarios without an aquifer—a highly probable scenario when there is unsustainable exploitation of aquifers during drought events [82], a practice for which there is already evidence in north-central Chile [110] in general and in the ERB in particular [68,69]. This is also the case when the impact of drought on water coverage is revealed by disregarding the effect of the so-called Drought Coefficient in the WEAP-Elqui model [73]. Both effects are statistically significant, mainly in irrigated agricultural zones (ZR), in which the major water users in the basin are located [64]. Thus, the outcome approach allows the question of who is vulnerable to drought in the basin to be answered [16,21].
If the question expands to include why they are objectively vulnerable, the answer—estimated on the basis of a set of 10 indicators combined in a structured model of four constructs that was made to converge with the outcome estimation—includes factors that are compatible with those related to exposure, sensitivity and adaptive capacity in the vulnerability model proposed by Turner et al. [11], which Zarafshabi et al. [16] consider essential in any model that attempts to assess drought vulnerability. These factors include Location, Water Supply, Infrastructure and Water Stability.
The Final Model of water security vulnerability to drought is considered stable for the available sample size thanks to its high R2 (0.67) and the corresponding size effect (f2 = 0.3) for a statistical power of 80% [60]. Stability is also maintained with respect to an error due to misspecification of the measurement model, since this aspect does not cause a significant change in the category of vulnerability to which a determined node is assigned. At the same time, the robustness of the model has been confirmed after comparison with six alternative methods traditionally used in the construction of composite indicators. This finding takes on special relevance in view of the call to integrate sensitivity analysis in the construction of composite indicators [48,111]. Robustness is a key factor in the construction of vulnerability assessment models. The iterative process that underlies the convergent procedure implies a convergence of the so-called deductive (theory-driven) and inductive (data-driven) approaches [13], acting as a filter for an objective selection of indicators. Meanwhile, performance requirements (measurement and structural models) constrain an ad hoc combination of indicators, which ameliorates the problem of misspecification of the model. The combined use of the stability criteria of the sample size, misspecification error and comparability allow the requirements of reliability (akin to the concept of precision) and validity (akin to the concept of accuracy) to be adequately addressed when assessing vulnerability [112] due to the fact that the commonly recommended sensitivity methods essentially focus on the former [111]. This is an aspect that is not commonly addressed ex ante in the construction of vulnerability composite indicators in general, and in composite indicators of vulnerability to drought in particular, despite the low validity (53%) shown by well-known resiliency and vulnerability indicators [113]. As a conclusion, and in agreement with Nardo et al. [111] and Balica [13], the authors of the present study claim that the convergent approach constitutes a methodological process qualitatively fitted for the construction of a vulnerability assessment model whose results improve the perception of reality regarding the vulnerability of water security to drought in the ERB.
It should be pointed out that the convergent approach presented in this study has been applied under restrictive methodological conditions due to the spatial scale (basin), since at this scale the availability of data for a single unit of analysis (water user sector) is limited, such as when the unit of analysis corresponds to spatial administrative units [57]. Fewer constraints may appear if the units of analysis are compatible with both approaches, as could be the case with administrative units at a national scale, without compromising the sample size. For example, Naumann et al. [31] estimate vulnerability to drought at a pan-African scale, which allows a greater availability of data for contextual estimation due to the unit of analysis (country), although sample size (12) could prove to be insufficient for an estimation based on SEM-PLSPM, even if a high R2 value is obtained. This problem could be tackled, however, by expanding the analysis of the mentioned authors to a global scale under the convergent approach, assuming at the same time that it is possible to obtain an outcome estimation of vulnerability in the same units of analysis. In this sense, the procedure developed by Naumann et al. [114] to estimate drought damage could constitute an initial approach to determine outcome vulnerability. A similar perspective could be used to adopt the convergent approach to global estimation of vulnerability to drought recently developed by Carrão et al. [33]. In this case, the selected indicators for a predefined spatial resolution compatible with the Global Administrative Unit Layers (GLU) could be used in the construction of a structural model and test its convergence with respect to global estimations of vulnerability to drought, such as that presented by Guo et al. [42] for the same spatial resolution. This would imply certain advantages for the sensitivity and robustness of the model in terms of sample size, but constraints could appear in terms of amount, quality and relevance of the available indicators with respect to a theoretical model for vulnerability to drought at that spatial scale [31].

5. Conclusions

A new procedure called the convergent approach was presented as an alternative for the estimation, within the integral framework, of drought vulnerability. The convergent approach, based on the SEM–PLSPM procedure, was applied to the case study dealing with the vulnerability of water security to drought in water–use sectors in the Elqui River basin in the arid region of north-central Chile. The convergent approach is proposed as a response to the recent call to promote standard approaches to vulnerability and impact assessment, an issue that is gaining importance in both science and policy to the extent that it is considered urgent matter. The applied results allow objective determination of the water user groups that show vulnerability of water security to drought and its potential causal factors. Estimates show that vulnerability is highly heterogeneous in the ERB and strongly influenced by spatial location downstream, which is explained mainly by historical water distribution practices. Infrastructure, water supply and water stability are also significant components, which can be associated with those of sensitivity, exposure and adaptive capacity that are considered in the vulnerability framework proposed by Turner et al. [11]. The Final Model generated to estimate vulnerability shows stability with respect to the sample size for a degree of statistical power of 80%. This model is considered robust since it shows higher performance than other existing alternatives for the construction of composite indicators. The results show that the convergent approach herein proposed, which includes conceptual, methodological and statistical aspects, sufficiently estimates the vulnerability of water security to drought in the ERB and that it has the potential to be extended to other applications such as recent estimations of global vulnerability to drought. Potential constraints on its use are also discussed. The authors of this study believe that it has contributed to the achievement of three objectives, two of which were declared in the context of the recently held High-Level Meeting on National Drought Policy (HMNDP). These objectives are to strengthen the standard approaches to vulnerability assessment, integrate science with the policy aspects of drought, with the understanding that a robust measure of vulnerability is an important and urgently needed tool for drought management, and contribute to the adoption of integral frameworks in the assessment of vulnerability to drought.

Acknowledgments

The authors acknowledge the Elqui River Water Board, the Water Center for Arid and Semi-Arid Zones in Latin America and the Caribbean (CAZALAC), the Regional Productive Development Corporation of the Coquimbo Region, the Agricultural Society of the North and the Maipo Canal Society for their support in this study. The paper benefited from the comments of two anonymous reviewers and the editors (Barbosa and Vogt). This work was funded by Fondecyt-CONICYT Chile, grant number 11140343.

Author Contributions

Jorge Núñez, principal investigator of the Fondecyt 11140343 project, with a background in drought and hydrology, designed the study and wrote the main text. Abraham Vergara and Camila Leyton, both environmental engineers, contributed the data analysis as part of their corresponding undergraduate theses. Christine Metzkes, given her background in hydrology and modeling, contributed with the implementation of the WEAP-Elqui-based outcome vulnerability estimation. Dagoberto Bettancourt, manager of the Elqui River Water Board, provided valuable data used in the contextual vulnerability analysis, together with relevant information related to water management in the Elqui River basin. Gabriel Mancilla, given his expertise in integrated water resources management in the Elqui River basin, reviewed preliminary drafts of the manuscript and, as Executive Director of UNESCO’s Category 2 CAZALAC, gave logistical support to the study.

Conflicts of Interest

The authors declare no conflict of interest. The founding sponsors had no role in the design of the study; in the collection, analyses, or interpretation of data; in the writing of the manuscript or in the decision to publish the results.

References

  1. Sheffield, J.; Wood, E.F.; Roderick, M.L. Little Change in Global Drought over the Past 60 Years. Nature 2012, 491, 435–438. [Google Scholar] [CrossRef] [PubMed]
  2. Dai, A. Increasing Drought under Global Warming in Observations and Models. Nat. Clim. Chang. 2013, 3, 52–58. [Google Scholar] [CrossRef]
  3. Dai, A.; Zhao, T. Uncertainties in Historical Changes and Future Projections of Drought. Part I: Estimates of Historical Drought Changes. Clim. Chang. 2016, 1–15. [Google Scholar] [CrossRef]
  4. Zhao, T.; Dai, A. Uncertainties in Historical Changes and Future Projections of Drought. Part II: Model-Simulated Historical and Future Drought Changes. Clim. Chang. 2016, 1–14. [Google Scholar] [CrossRef]
  5. Below, R.; Grover-Kopec, E.; Dilley, M. Documenting Drought-Related Disasters: A Global Reassessment. J. Environ. Dev. 2007, 16, 328–344. [Google Scholar] [CrossRef]
  6. Sivakumar, M.V.K.; Stefanski, R.; Bazza, M.; Zelaya, S.; Wilhite, D.; Magalhaes, A.R. High Level Meeting on National Drought Policy: Summary and Major Outcomes. Weather Clim. Extrem. 2014, 3, 126–132. [Google Scholar] [CrossRef]
  7. UNISDR. 2015: Disasters in Numbers; United Nations Office for Disaster Risk Reduction: Geneva, Switzerland, 2015; p. 2. [Google Scholar]
  8. Stanke, C.; Kerac, M.; Prudhomme, C.; Medlock, J.; Murray, V. Health Effects of Drought: A Systematic Review of the Evidence. PLoS Curr. Disasters 2013. [Google Scholar] [CrossRef] [PubMed]
  9. WMO-UNCCD. Science Document: Best Practices on National Drought Management Policy. In Proceedings of the High Level Meeting on National Drought Policy (HMNDP), World Meteorological Organization (WMO) United Nations Convention to Combat Desertification (UNCCD), Brasilia, Brazil, 11–12 June 2012; Available online: http://www.wmo.int/pages/prog/wcp/drought/hmndp/documents/ScienceDocumentRev_12-2013_En.pdf (accessed on 5 September 2016).
  10. Adger, W.N. Vulnerability. Glob. Environ. Chang. 2006, 16, 268–281. [Google Scholar] [CrossRef]
  11. Turner, B.L.; Kasperson, R.E.; Matson, P.A.; McCarthy, J.J.; Corell, R.W.; Christensen, L.; Eckley, N.; Kasperson, J.X.; Luers, A.; Martello, M.L.; et al. A Framework for Vulnerability Analysis in Sustainability Science. Proc. Natl. Acad. Sci. USA 2003, 100, 8074–8079. [Google Scholar] [CrossRef] [PubMed]
  12. Füssel, H.M. Vulnerability: A Generally Applicable Conceptual Framework for Climate Change Research. Glob. Environ. Chang. 2007, 17, 155–167. [Google Scholar] [CrossRef]
  13. Balica, S. Approaches of Understanding Developments of Vulnerability Indices for Natural Disasters. Environ. Eng. Manag. J. 2012, 11, 963–974. [Google Scholar]
  14. Tonmoy, F.N.; El-Zein, A.; Hinkel, J. Assessment of Vulnerability to Climate Change Using Indicators: A Meta-Analysis of the Literature. Wiley Interdiscip. Rev. Clim. Chang. 2014, 5, 775–792. [Google Scholar] [CrossRef]
  15. Giupponi, C.; Biscaro, C. Vulnerabilities—Bibliometric Analysis and Literature Review of Evolving Concepts. Environ. Res. Lett. 2015, 10, 123002. [Google Scholar] [CrossRef]
  16. Zarafshani, K.; Sharafi, L.; Azadi, H.; Van Passel, S. Vulnerability Assessment Models to Drought: Toward a Conceptual Framework. Sustainability 2016, 8, 588. [Google Scholar] [CrossRef]
  17. O’Brien, K.; Eriksen, S.; Schjolden, A.; Nygaard, L. What’s in a Word? Conflicting Interpretations of Vulnerability in Climate Change Research; CICERO Working Paper 2004:04; CICERO: Oslo, Norway, 2004. [Google Scholar]
  18. O’Brien, K.; Eriksen, S.; Nygaard, L.; Schjolden, A. Why Different Interpretations of Vulnerability Matter in Climate Change Discourses. Clim. Policy 2007, 7, 73–88. [Google Scholar] [CrossRef]
  19. Fellmann, T. The Assessment of Climate Change-Related Vulnerability in the Agricultural Sector: Reviewing Conceptual Frameworks—Semantic Scholar. In Building Resilience for Adaptation to Climate Change in the Agriculture Sector, Proceedings of a Joint FAO/OECD Workshop; OECD: Paris, France, 2012. [Google Scholar]
  20. Bruno Soares, M.; Gagnon, A.S.; Doherty, R.M. Conceptual Elements of Climate Change Vulnerability Assessments: A Review. Int. J. Clim. Chang. Strateg. Manag. 2012, 4, 6–35. [Google Scholar] [CrossRef]
  21. Newell, B.; Crumley, C.L.; Hassan, N.; Lambin, E.F.; Pahl-Wostl, C.; Underdal, A.; Wasson, R. A Conceptual Template for Integrative Human–environment Research. Glob. Environ. Chang. 2005, 15, 299–307. [Google Scholar] [CrossRef]
  22. Bakker, K. Water Security: Research Challenges and Opportunities. Science 2012, 337, 914–915. [Google Scholar] [CrossRef] [PubMed]
  23. Cook, C.; Bakker, K. Water Security: Debating an Emerging Paradigm. Glob. Environ. Chang. 2012, 22, 94–102. [Google Scholar] [CrossRef]
  24. Grey, D.; Garrick, D.; Blackmore, D.; Kelman, J.; Muller, M.; Sadoff, C. Water Security in One Blue Planet: Twenty-First Century Policy Challenges for Science. Philos. Trans. R. Soc. A 2013, 371, 20120406. [Google Scholar] [CrossRef] [PubMed]
  25. Scott, C.A.; Meza, F.J.; Varady, R.G.; Tiessen, H.; McEvoy, J.; Garfin, G.M.; Wilder, M.; Farfán, L.M.; Pablos, N.P.; Montaña, E. Water Security and Adaptive Management in the Arid Americas. Ann. Assoc. Am. Geogr. 2013, 103, 280–289. [Google Scholar] [CrossRef]
  26. Kundzewicz, Z.W.; Matczak, P. Hydrological Extremes and Security. In Proceedings of the International Association of Hydrological Sciences; Copernicus GmbH: Göttingen, Germany, 2015; Volume 366, pp. 44–53. [Google Scholar]
  27. Garrick, D.; Hall, J.W. Water Security and Society: Risks, Metrics, and Pathways. Ann. Rev. Environ. Resour. 2014, 39, 611–639. [Google Scholar] [CrossRef]
  28. Polsky, C.; Cash, D. Reducing Vulnerability to the Effects of Global Change: Drought Management in a Multi-Scale, Multi-Stressor World. In Drought and Water Crises: Science, Technology, and Management Issues; CRC Press: Amsterdam, The Netherlands, 2005; pp. 215–245. [Google Scholar]
  29. Nagarajan, R. Drought Assessment; Springer: Berlin, Germany, 2010. [Google Scholar]
  30. United Nations International Strategy for Disaster Reduction (UNISDR). Drought Risk Reduction Framework and Practices: Contributing to the Implementation of the Hyogo Framework for Action; Technical Report; UNISDR: Geneva, Switzerland, 2009; p. 213. [Google Scholar]
  31. Naumann, G.; Barbosa, P.; Garrote, L.; Iglesias, A.; Vogt, J. Exploring Drought Vulnerability in Africa: An Indicator Based Analysis to Be Used in Early Warning Systems. Hydrol. Earth Syst. Sci. 2014, 18, 1591–1604. [Google Scholar] [CrossRef] [Green Version]
  32. Shiferaw, B.; Tesfaye, K.; Kassie, M.; Abate, T.; Prasanna, B.M.; Menkir, A. Managing Vulnerability to Drought and Enhancing Livelihood Resilience in Sub-Saharan Africa: Technological, Institutional and Policy Options. Weather Clim. Extrem. 2014, 3, 67–79. [Google Scholar] [CrossRef]
  33. Carrão, H.; Naumann, G.; Barbosa, P. Mapping Global Patterns of Drought Risk: An Empirical Framework Based on Sub-National Estimates of Hazard, Exposure and Vulnerability. Glob. Environ. Chang. 2016, 39, 108–124. [Google Scholar] [CrossRef]
  34. Keenan, S.P.; Krannich, R.S. The Social Context of Perceived Drought Vulnerability1. Rural Sociol. 1997, 62, 69–88. [Google Scholar] [CrossRef]
  35. Wilhelmi, O.V.; Wilhite, D.A. Assessing Vulnerability to Agricultural Drought: A Nebraska Case Study. Nat. Hazards 2002, 25, 37–58. [Google Scholar] [CrossRef]
  36. Pritchett, L.; Suryahadi, A.; Sumarto, S. Quantifying Vulnerability to Poverty: A Proposed Measure, Applied to Indonesia; Policy Research Working Paper Series 2437; The World Bank: Washington, DC, USA, 2000. [Google Scholar]
  37. Luers, A.L.; Lobell, D.B.; Sklar, L.S.; Addams, C.L.; Matson, P.A. A Method for Quantifying Vulnerability, Applied to the Agricultural System of the Yaqui Valley, Mexico. Glob. Environ. Chang. 2003, 13, 255–267. [Google Scholar] [CrossRef]
  38. Metzger, M.J.; Leemans, R.; Schröter, D. A Multidisciplinary Multi-Scale Framework for Assessing Vulnerabilities to Global Change. Int. J. Appl. Earth Obs. Geoinf. 2005, 7, 253–267. [Google Scholar] [CrossRef]
  39. Semenov, M.A.; Shewry, P.R. Modelling Predicts That Heat Stress, Not Drought, Will Increase Vulnerability of Wheat in Europe. Sci. Rep. 2011, 1, 66. [Google Scholar] [CrossRef] [PubMed]
  40. Acosta, L.A.; Galli, F. Crisis Probability Curves (CPCs): A Model for Assessing Vulnerability Thresholds Across Space and Over Time. J. Environ. Sci. Manag. 2013, 16, 1. [Google Scholar]
  41. Jayanthi, H.; Husak, G.J.; Funk, C.; Magadzire, T.; Chavula, A.; Verdin, J.P. Modeling Rain-Fed Maize Vulnerability to Droughts Using the Standardized Precipitation Index from Satellite Estimated rainfall—Southern Malawi Case Study. Int. J. Disaster Risk Reduct. 2013, 4, 71–81. [Google Scholar] [CrossRef]
  42. Guo, H.; Zhang, X.; Lian, F.; Gao, Y.; Lin, D.; Wang, J. Drought Risk Assessment Based on Vulnerability Surfaces: A Case Study of Maize. Sustainability 2016, 8, 813. [Google Scholar] [CrossRef]
  43. Ren, X.; Xu, W.; Smith, A. Remote Sensing, Crop Yield Estimation and Agricultural Vulnerability Assessment: A Case of Southern Alberta. Open Hydrol. J. 2012, 6, 1–7. [Google Scholar] [CrossRef]
  44. Swain, M.; Swain, M. Vulnerability to Agricultural Drought in Western Orissa: A Case Study of Representative Blocks. Agric. Econ. Res. Rev. 2011, 24, 47–56. [Google Scholar]
  45. Zarafshani, K.; Sharafi, L.; Azadi, H.; Hosseininia, G.; De Maeyer, P.; Witlox, F. Drought Vulnerability Assessment: The Case of Wheat Farmers in Western Iran. Glob. Planet. Chang. 2012, 98–99, 122–130. [Google Scholar] [CrossRef] [Green Version]
  46. Wu, J.; Geng, G.; Zhou, H.; Liu, J.; Wang, Q.; Yang, J. Global Vulnerability to Agricultural Drought and Its Spatial Characteristics. Sci. China Earth Sci. 2017, 60, 910–920. [Google Scholar] [CrossRef]
  47. Nardo, M.; Saisana, M.; Saltelli, A.; Tarantola, S.; Hoffman, A.; Giovannini, E. Handbook on Constructing Composite Indicators; OECD Statistics Working Papers; OECD: Paris, France, 2005. [Google Scholar]
  48. Beccari, B. A Comparative Analysis of Disaster Risk, Vulnerability and Resilience Composite Indicators. PLoS Curr. 2016, 8. [Google Scholar] [CrossRef] [PubMed]
  49. Cutter, S.L. Vulnerability to Environmental Hazards. Prog. Hum. Geogr. 1996, 20, 529–539. [Google Scholar] [CrossRef]
  50. O’Brien, K.; Leichenko, R.; Kelkar, U.; Venema, H.; Aandahl, G.; Tompkins, H.; Javed, A.; Bhadwal, S.; Barg, S.; Nygaard, L.; et al. Mapping Vulnerability to Multiple Stressors: Climate Change and Globalization in India. Glob. Environ. Chang. 2004, 14, 303–313. [Google Scholar] [CrossRef]
  51. Fraser, E.D.G.; Simelton, E.; Termansen, M.; Gosling, S.N.; South, A. “Vulnerability Hotspots”: Integrating Socio-Economic and Hydrological Models to Identify Where Cereal Production May Decline in the Future due to Climate Change Induced Drought. Agric. For. Meteorol. 2013, 170, 195–205. [Google Scholar] [CrossRef]
  52. Antwi-Agyei, P.; Fraser, E.D.G.; Dougill, A.J.; Stringer, L.C.; Simelton, E. Mapping the Vulnerability of Crop Production to Drought in Ghana Using Rainfall, Yield and Socioeconomic Data. Appl. Geogr. 2012, 32, 324–334. [Google Scholar] [CrossRef]
  53. Mehran, A.; Mazdiyasni, O.; AghaKouchak, A. A Hybrid Framework for Assessing Socioeconomic Drought: Linking Climate Variability, Local Resilience, and Demand. J. Geophys. Res. Atmos. 2015, 120, 7520–7533. [Google Scholar] [CrossRef]
  54. Kastenhofer, K. Converging Epistemic Cultures? Innov. Eur. J. Soc. Sci. Res. 2007, 20, 359–373. [Google Scholar] [CrossRef]
  55. Dessai, S.; Hulme, M. Does Climate Adaptation Policy Need Probabilities? Clim. Policy 2004, 4, 107–128. [Google Scholar] [CrossRef]
  56. Nguyen, T.; Bonetti, J.; Rogers, K.; Woodroffe, C. Indicator-Based Assessment of Climate-Change Impacts on Coasts: A Review of Concepts, Methodological Approaches and Vulnerability Indices. Ocean Coast. Manag. 2016, 123, 18–43. [Google Scholar] [CrossRef]
  57. Corobov, R.; Sîrodoev, I.; Koeppel, S.; Denisov, N.; Sîrodoev, G. Assessment of Climate Change Vulnerability at the Local Level: A Case Study on the Dniester River Basin (Moldova). Sci. World J. 2013, 2013, e173794. [Google Scholar] [CrossRef] [PubMed]
  58. Henseler, J.; Ringle, C.M.; Sinkovics, R.R. The Use of Partial Least Squares Path Modeling in International Marketing. In New Challenges to International Marketing; Advances in International Marketing; Emerald Group Publishing Limited: Bingley, UK, 2009; Volume 20, pp. 277–319. [Google Scholar]
  59. Hair, J.F.; Ringle, C.M.; Sarstedt, M. PLS-SEM: Indeed a Silver Bullet. J. Mark. Theory Pract. 2011, 19, 139–152. [Google Scholar] [CrossRef]
  60. Hair, J.F.; Tomas, H.; Ringle, C.; Sarstedt, M. A Primer on Partial Least Squares Structural Equation Modeling (PLS-SEM); SAGE Publications Inc.: Thousand Oaks, CA, USA, 2014. [Google Scholar]
  61. Zou, L.L. The Impacting Factors of Vulnerability to Natural Hazards in China: An Analysis Based on Structural Equation Model. Nat. Hazards 2012, 62, 57–70. [Google Scholar] [CrossRef]
  62. Trinchera, L.; Russolillo, G. On the Use of Structural Equation Models and PLS Path Modeling to Build Composite Indicators; Working Paper 30–2010; Department of Studies on Economic Development (DiSSE), Macerata University: Macerata, Italy, 2010. [Google Scholar]
  63. Hair, J.F.; Ringle, C.M.; Sarstedt, M. Editorial-Partial Least Squares: The Better Approach to Structural Equation Modeling? SSRN Scholarly Paper ID 2227601; Social Science Research Network: Rochester, NY, USA, 2012. [Google Scholar]
  64. Oyarzún, R.; Oyarzún, J.; Señoret, M.; Maturana, H.; Orth, K.; Soto, G.; Soto, M.; Kretschmer, N. Technical Report on River Basin Characteristics, Pressures and Issues. Elqui River Basin, Chile. In Catchment Management and Mining Impacts in Arid and Semi-Arid South America; Technical Report INCO-CT2006–032539; Centro del Agua Para Zonas Áridas y Semiáridas de América Latina y el Caribe: La Serena, Chile, 2008; p. 33. [Google Scholar]
  65. Ribeiro, L.; Kretschmer, N.; Nascimento, J.; Buxo, A.; Rötting, T.S.; Soto, G.; Soto, M.; Oyarzún, J.; Maturana, H.; Oyarzún, R. Water Quality Assessment of the Mining-Impacted Elqui River Basin, Chile. Mine Water Environ. 2014, 33, 165–176. [Google Scholar] [CrossRef]
  66. Cortés, A.E.; Oyarzún, R.; Kretschmer, N.; Chaves, H.; Soto, G.; Soto, M.; Amézaga, J.; Oyarzún, J.; Rötting, T.; Señoret, M.; et al. Aplicación del Índice de Sustentabilidad de Cuencas en la Cuenca Del Río Elqui, Centro-Norte de Chile. Obras Proy. 2012, 12, 57–69. [Google Scholar] [CrossRef]
  67. Núñez, J.; Hallack-Alegría, M.; Cadena, M. Resolving Regional Frequency Analysis of Precipitation at Large and Complex Scales Using a Bottom-up Approach: The Latin America and the Caribbean Drought Atlas. J. Hydrol. 2016, 538, 515–538. [Google Scholar] [CrossRef]
  68. Salinas, C.X.; Gironás, J.; Pinto, M. Water Security as a Challenge for the Sustainability of la Serena-Coquimbo Conurbation in Northern Chile: Global Perspectives and Adaptation. Mitig. Adapt. Strateg. Glob. Chang. 2016, 21, 1235–1246. [Google Scholar] [CrossRef]
  69. CONIC-BF. Diagnóstico Plan Maestro Para la Gestión de Recursos Hídricos. Región de Coquimbo; Gobierno Regional Región de Coquimbo: La Serena, Chile, 2013. [Google Scholar]
  70. CAZALAC-RODHOS. Aplicación de Metodologías Para Determinar la Eficiencia de uso del Agua Estudio de Caso en la Región de Coquimbo; Gobierno Regional-Región de Coquimbo: La Serena, Chile, 2006. [Google Scholar]
  71. Retamal, M.R.; Andreoli, A.; Arumi, J.L.; Rojas, J.; Parra, O. Gobernanza del Agua y Cambio Climático: Fortalezas y Debilidades del Actual Sistema de Gestión del Agua en Chile; Análisis Interno; Interciencia: Caracas, Venezuela, 2013; Available online: http://www.redalyc.org/articulo.oa?id=33926506011 (accessed on 16 May 2016).
  72. Aitken, D.; Rivera, D.; Godoy-Faúndez, A.; Holzapfel, E. Water Scarcity and the Impact of the Mining and Agricultural Sectors in Chile. Sustainability 2016, 8, 128. [Google Scholar] [CrossRef]
  73. RODHOS. Estudio de Modelos de Gestión de Recursos Hídricos Superficiales y Subterráneos, Para las Cuencas de las Provincias de Elqui, Limarí y Choapa; Corporación Regional de Desarrollo Productivo Región de Coquimbo: La Serena, Chile, 2014; p. 532. [Google Scholar]
  74. Núñez, J.; Rivera, D.; Oyarzún, R.; Arumí, J.L. On the Use of Standardized Drought Indices under Decadal Climate Variability: Critical Assessment and Drought Policy Implications. J. Hydrol. 2014, 517, 458–470. [Google Scholar] [CrossRef]
  75. DGA. Resolución N°1674, de 2012, de Dirección General de Aguas, deja sin Efecto Resolución DGA N°39, de 1984, y Establece Nuevos Criterios para Calificar Épocas de Extraordinaria Sequía; DGA: Santiago, Chile, 2012; Available online: http://www.dga.cl/legistlacionynormas/resoluciones/Resoluciones/1674_2012.pdf (accessed on 5 September 2016).
  76. Steduto, P.; Hsiao, T.; Fereres, E.; Raes, D. Crop Yield Response to Water; FAO Irrigation and Drainage Paper; FAO: Rome, Italy, 2012. [Google Scholar]
  77. SANAG. Situación actual del sector agrícola. In Medidas Necesarias Para Enfrentar la Escasez Hídrica; Sociedad Agrícola del Norte A.G.: La Serena, Chile, 2015. [Google Scholar]
  78. Gunson, A.J.; Klein, B.; Veiga, M.; Dunbar, S. Reducing Mine Water Requirements. J. Clean. Prod. 2012, 21, 71–82. [Google Scholar] [CrossRef]
  79. Fortin, S.J.R. Open Pit Mining & the Cost of Water Potential Opportunities towards Sustainable Mining. Master’s Thesis, Simon Fraser University, Burnaby, BC, Canada, 2015. [Google Scholar]
  80. COD. Informe de la Comisión Especial Investigadora Acerca del Rol de la Superintendencia de Servicios Sanitarios y de la Empresa Concesionaria de Servicios Sanitarios S.A. (ECONSSA), Respecto de los Problemas Generados por la Empresa Aguas del Valle en el Tratamiento y Distribución de Agua Potable en la Región de Coquimbo; Chamber of Deputies of Chile: Santiago, Chile, 2015; Available online: https://www.camara.cl/pdf.aspx?prmID=16942&prmTIPO=INFORMECOMISION (accessed on 5 September 2016).
  81. Gochicoa, P.I.; Eastman, L.B. A Climate and Operational Vulnerability Assessment of the Water Company in Salamanca, Chile. Master’s Thesis, Duke University, Durham, NC, USA, 2017. [Google Scholar]
  82. Wenger, K.; Vadjunec, J.M.; Fagin, T. Groundwater Governance and the Growth of Center Pivot Irrigation in Cimarron County, OK and Union County, NM: Implications for Community Vulnerability to Drought. Water 2017, 9, 39. [Google Scholar] [CrossRef]
  83. Garreaud, R.; Alvarez-Garreton, C.; Barichivich, J.; Boisier, J.P.; Christie, D.; Galleguillos, M.; LeQuesne, C.; McPhee, J.; Zambrano-Bigiarini, M. The 2010–2015 Mega Drought in Central Chile: Impacts on Regional Hydroclimate and Vegetation. Hydrol. Earth Syst. Sci. Discuss. 2017, 2017, 1–37. [Google Scholar] [CrossRef]
  84. CIREN. Cálculo y Cartografía de la Evapotranspiración Potencial en Chile; CIREN: Santiago, Chile, 1997; 54p. [Google Scholar]
  85. Penman, H.L. Natural Evaporation from Open Water, Bare Soil and Grass. Proc. R. Soc. Lond. Math. Phys. Eng. Sci. 1948, 193, 120–145. [Google Scholar] [CrossRef]
  86. Zhang, K.; Kimball, J.S.; Nemani, R.R.; Running, S.W.; Hong, Y.; Gourley, J.J.; Yu, Z. Vegetation Greening and Climate Change Promote Multidecadal Rises of Global Land Evapotranspiration. Sci. Rep. 2015, 5, 15956. [Google Scholar] [CrossRef] [PubMed]
  87. DGA. Información Oficial Hidrometeorológica y de Calidad de Aguas en Línea. Available online: http://snia.dga.cl/BNAConsultas/reports (accessed on 5 September 2016).
  88. McNab, A.; Karl, T. Evapotranspiration and Drought. In National Water Summary 1988–89: Hydrologic Events and Floods and Droughts; USGS: Reston, VA, USA, 1991; pp. 99–104. [Google Scholar]
  89. DGA. Manual de Normas y Procedimientos para la Administración de Recursos Hídricos. Available online: http://www.dga.cl/legistlacionynormas/normativascirculares/Normativas/proced_darh.pdf (accessed on 5 September 2016).
  90. Osorio, A. Determinación de la Huella del agua y Estrategias de Manejo de Recursos Hídricos; Instituto de Investigaciones Agropecuarias (INIA): La Serena, Chile, 2013. [Google Scholar]
  91. INN. Norma Chilena Oficial Nch409/1.Of2005. Available online: http://ecommerce.inn.cl/Ficha_Producto/?p=NCh409/1:2005 (accessed on 5 September 2016).
  92. INN. Norma Chilena Oficial Nch1333.Of78. Available online: http://ecommerce.inn.cl/Ficha_Producto/?p=NCh1333:1978%20Mod.1987 (accessed on 5 September 2016).
  93. COCHILCO. Boletín Mensual Electrónico. Available online: https://www.cochilco.cl/Paginas/Estadisticas/Publicaciones/Bolet%EDn-Mensual-Electr%F3nico.aspx (accessed on 5 September 2016).
  94. Forster, W.; Valdés, A. ¿Cuál es el Tamaño Económico del Sector Silvoagropecuario en Chile? Cálculo para el año 2008 Considerando Encadenamientos; Ministerio de Agricultura de Chile: Santiago, Chile, 2013; Available online: http://studylib.es/doc/5570749/&#xBF;cu&#xE1;l-es-el-tama&#xF1;o-econ&#xF3;mico-del-sector (accessed on 5 September 2016).
  95. Ballesteros, M.; Tánago, I.G.; Urquijo, J.; De Stefano, L. Vulnerability to Drought: Mapping Underlying Factors across Europe. In Drought: Research and Science-Policy Interfacing; CRC Press: Boca Raton, FL, USA, 2015; pp. 361–367. [Google Scholar]
  96. Tánago, I.G.; Ballesteros, M.; Urquijo, J.; De Stefano, L. Exploring Situations of Vulnerability to Drought from a Sectorial Perspective: A Starting Point for Regional Assessments. In Drought: Research and Science-Policy Interfacing; CRC Press: Boca Raton, FL, USA, 2015; pp. 341–348. [Google Scholar]
  97. Ringle, C.; Wende, S.; Becker, J.M. SmartPLS 3; SmartPLS GmbH: Bönningstedt, Germany, 2015. [Google Scholar]
  98. Memon, A.H.; Rahman, I.A. SEM-PLS Analysis of Inhibiting Factors of Cost Performance for Large Construction Projects in Malaysia: Perspective of Clients and Consultants. Sci. World J. 2014, 2014, e165158. [Google Scholar] [CrossRef] [PubMed]
  99. Faul, F.; Erdfelder, E.; Buchner, A.; Lang, A.G. Statistical Power Analyses Using G*Power 3.1: Tests for Correlation and Regression Analyses. Behav. Res. Methods 2009, 41, 1149–1160. [Google Scholar] [CrossRef] [PubMed]
  100. Minotti, S.C.; Lamberti, G.; Aluja-Banet, T.; Ciampi, A. On the Effect of Measurement Model Misspecification in PLS Path Modeling: The Reflective Case; University of Sevilla: Sevilla, Spain, 2015; pp. 1–12. [Google Scholar]
  101. Sánchez, G. PLS Path Modeling with R; Trowchez Editions: Berkeley, CA, USA, 2013. [Google Scholar]
  102. Nicoletti, G.; Scarpetta, S.; Boylaud, O. Summary Indicators of Product Market Regulation with an Extension to Employment Protection Legislation; OECD Economics Department Working Papers; OECD: Paris, France, 2000. [Google Scholar]
  103. Greyling, T. A Composite Index of Quality of Life for the Gauteng City-Region: A Principal Component Analysis Approach; Wits Institutional Repository; University of the Witwatersrand: Johannesburg, South Africa, 2015. [Google Scholar]
  104. Maier, M.J. Companion Package to the Book “R: Einführung Durch Angewandte Statistik”; Pearson Deutschland GmbH: Hallbergmoos, Germany, 2015. [Google Scholar]
  105. Lê, S.; Josse, J.; Husson, F. FactoMineR: An R Package for Multivariate Analysis. J. Stat. Softw. 2008, 25, 1–18. [Google Scholar] [CrossRef]
  106. Lalloué, B.; Deguen, S.; Monnez, J.M.; Padilla, C.; Kihal, W.; Zmirou-Navier, D.; Le Meur, N. SesIndexCreatoR: An R Package for Socioeconomic Indices Computation and Visualization. Open J. Stat. 2015, 5, 291–302. [Google Scholar] [CrossRef]
  107. Vidoli, F.; Fusco, E.; Mazziotta, C. Non-Compensability in Composite Indicators: A Robust Directional Frontier Method. Soc. Indic. Res. 2015, 122, 635–652. [Google Scholar] [CrossRef]
  108. Hothorn, T.; Hornik, K.; Zeileis, A. Unbiased Recursive Partitioning: A Conditional Inference Framework. J. Comput. Graph. Stat. 2006, 15, 651–674. [Google Scholar] [CrossRef]
  109. Kao, L.S.; Green, C.E. Analysis of Variance: Is There a Difference in Means and What Does It Mean? J. Surg. Res. 2008, 144, 158–170. [Google Scholar] [CrossRef] [PubMed]
  110. Suárez, F.; Muñoz, J.F.; Fernández, B.; Dorsaz, J.M.; Hunter, C.K.; Karavitis, C.A.; Gironás, J. Integrated Water Resource Management and Energy Requirements for Water Supply in the Copiapó River Basin, Chile. Water 2014, 6, 2590–2613. [Google Scholar] [CrossRef]
  111. Nardo, M.; Saisana, M.; Tarantola, S. Tools for Composite Indicators Building; EUR 21682; Joint Research Centre: Ispra, Italy, 2005; p. 133. [Google Scholar]
  112. Trajković, G. Measurement: Accuracy and Precision, Reliability and Validity Measurement: Accuracy and Precision, Reliability and Validity. In Encyclopedia of Public Health; Kirch, W., Ed.; Springer: Berlin, Germany, 2008; pp. 888–892. [Google Scholar]
  113. Bakkensen, L.A.; Fox-Lent, C.; Read, L.K.; Linkov, I. Validating Resilience and Vulnerability Indices in the Context of Natural Disasters. Risk Anal. 2016, 37, 982–1004. [Google Scholar] [CrossRef] [PubMed]
  114. Naumann, G.; Spinoni, J.; Vogt, J.V.; Barbosa, P. Assessment of Drought Damages and Their Uncertainties in Europe. Environ. Res. Lett. 2015, 10, 124013. [Google Scholar] [CrossRef]
Figure 1. Conceptual scheme of the outcome (a) and contextual (b) frameworks and the convergent approach under the integral framework (c) for vulnerability assessment. Outcome and contextual schemes adapted from Fellman [19]. The main characteristics of each framework are also presented. SEM: Structural Equation Modeling; PLSPM: Partial Least Squares Path Modeling.
Water 09 00589 g001
Figure 2. Example of a typical SEM Partial Least Squares (PLS) Path Model. Adjusted from Henseler et al. [58] and Hair et al. [59]. χx: manifested variable; w: outer loading; ξ: latent variable; β: path coefficient; ζ: inner model residual; ε: residual.
Water 09 00589 g002
Figure 3. Study area location with rain and stream gauge network. Also shown are points and places of interest. White circles with adjacent numbers refer to nodes of the Water Evaluation and Planning System (WEAP)-Elqui model (Section 2.2.2).
Water 09 00589 g003
Figure 4. Outcome sensitivity (vulnerability) of Elqui River Basin water-use sectors as a function of simulation scenarios. The numbers on the left axis refer to the order of nodes according to Figure 3. The acronyms on the right axis refer to WEAP-Elqui node names. There are two kinds of codes: NODETYPE_LOCATION_NODEID and NODETYPE_NODESOURCE_LOCATION_NODID. ZR (Irrigated zone), R (Irrigated place), AP (Drinking water), M (Mining), CS (surface water extraction by drinking water industry), I (Industry). AN (temporary water source, e.g., Creek), EDE (Derecho River), COC (Cochiguaz), CLA (Claro River), PAI (Paihuano), ELQ (Elqui River), ECONSSA (Drinking water company), GRA (Santa Gracia Creek), CUL (Culebrón aquifer), COS (coast).
Water 09 00589 g004
Figure 5. PLSPM-based contextual vulnerability of water security to drought. Circle: construct (latent variable); rectangle: indicator (manifest variable); construct-indicator arrow: load; construct-construct arrow: path; numbers above paths: path coefficients β; R2: determination coefficient. Blue: above criteria; red: below criteria; continuous line: statistically significant; dotted line: not statistically significant. Acronyms according to Table 3. ETP: Potential Evapotranspiration; VC: Vegetation Cover; IRF: Infiltration/Runoff Flow; STF: Streamflow; DMC: Distance to Main Canal; DBH: Distance to River Basin Head; DA: Distance to the Aquifer; WQ: Water Quality; AWS: Alternative Water Sources; DPOL: Drought Propagation Order Link; SD: Soil Drainage; ASC: Aquifer Storage Capacity; NI: Node Immobility; CI: Canal Infrastructure; WCI: Water Control Infrastructure; CMF: Canal Maximum Flow; GE: Groundwater Extraction; NGU: Groundwater Users; UF: Use Factor; US: User Size; EWP: East–West Geographical Position; WFP: Water Footprint; LWS: Legal Water Supply; WUP: Water Use Profitability; CWL: Canal Water Losses.
Water 09 00589 g005
Figure 6. Cluster-analysis-based contextual vulnerability category as a function of SEM PLSPM measurement model type. Node ID numbers (above) and names (below) as in Figure 4. Red numbers reflect category differences in the corresponding node.
Water 09 00589 g006
Table 1. Threshold value ( C 0 ) as a function of node type.
Node TypeAcronym *C0CriteriaSource
Irrigated ZoneZR0.7Relative water coverage resulting in 70% relative yield of main crops in the Elqui River basin (ERB) and the impact of the 2010–2015 drought on the agricultural surface of the ERB[76,77]
IrrigatedR ¥0.7Relative water coverage resulting in 70% relative yield of main crops in the ERB and the impact of the 2010–2015 drought on the agricultural surface of the ERB[76,77]
IndustryI0.9Similar to mining but less restrictive
MiningM0.95Based on actual levels of water use efficiency in the mining industry in Chile, current limitations to accessing new freshwater sources and incremental technological costs[72,78,79]
Drinking WaterAP0.98Based on the impact of the maximum number of consecutive days in a year without continuous service[80,81]
Notes: * Acronym based on original Water Evaluation and Planning System (WEAP)-Elqui description. ZR: Irrigated Zone; R: Irrigated; I: Industry; M: Mining; ¥: Irrigated with non-river surface water sources.
Table 2. Simulation scenarios for WEAP-Elqui-based outcome vulnerability.
FactorWith AquiferWithout Aquifer
With Drought CoefficientAB
Without Drought CoefficientCD
Table 3. Definitions and characteristics of water security indicators and data sources.
Dim 1Dim 2SignIndicator NameDefinition, Notion, Data Source and ReferenceUnit
EHPotential Evapotranspiration (ETP)Measures the amount of water transpired in a given time by a short green crop, completely shading the ground, of uniform height and with adequate water status in the soil profile [84,85].mm yr−1
EHVegetation Cover (VC)Measures vegetation cover in the node’s area of influence limited by its corresponding Thiessen polygon. Landsat 8 (Date: 23 February 2016) (https://earthexplorer.usgs.gov) [86].ha
EHInfiltration/Runoff Flow (IRF)Measures the volume of flow that is lost from the node to the surface and groundwater sources. WEAP-Elqui [73].Mm3 yr−1
EHStreamflow (STF)Measures the amount of surface water that passes through the node. WEAP-Elqui [73].Mm3 yr−1
EH+Distance to Main Canal (DMC)Measures the linear distance between the node and the main canal that supplies it [70,73].km
EHDistance to River Basin Head (DBH)Measures the linear distance between the node and the highest point of the basin that supplies it [70,73].km
EHDistance to the Aquifer (DA)Measures the linear distance between the node and the center of gravity of the aquifer that supplies it [70,73].km
EH+Water Quality (WQ)Measures the water quality of the node, in terms of the mean concentration of Fe++. [87]mg L−1
SHAlternative Water Sources (AWS)Measures the number of water sources that a node possesses to extract water from. WEAP-Elqui [73].ADIM
SHDrought Propagation Order Link (DPOL)Measures the type of source that feeds the node in terms of drought propagation (Surface Runoff: 1—Streamflow: 2—Mixed: 3—Gouwndwater: 4) [73,88].LIKERT
SH+Soil Drainage (SD)Measures soil drainage capacity in the node’s area of influence [70,73].LIKERT
SHAquifer Storage Capacity (ASC)Measures the maximum volume of water that can be stored in an aquifer. WEAP-Elqui [73].Mm3
ACHNode Immobility (NI)Measures the capacity of the node’s water users to move between alternative nodes as a function of the amount of water users within the node. WEAP-Elqui [73].ADIM
ACHCanal Infrastructure (CI)Measures the ratio between the km of canal lining with respect to the total km of canal. Elqui River Water Board, 2016 (Interview).ADIM
ACHWater Control Infrastructure (WCI)Measures the number of automatic gates present in the canals that feed each node. Elqui River Water Board, 2016 (Interview).ADIM
ACHCanal Maximum Flow (CMF)Measures the maximum flow allowed by the canal that supplies the node. Elqui River Water Board, 2016 (Interview).L s−1
ACHGroundwater Extraction (GE)Measures the node’s groundwater extraction. WEAP-Elqui [73].L s−1
ACHGroundwater Users (NGU)Measures the number of groundwater users that belong to the node. WEAP-Elqui [73].ADIM
ELPUse Factor (UF)Measures the relationship between the flow captured by the node versus the flow rate used considering the losses [70,73].ADIM
ELP+Predictable Coefficient of Use (PCU) *Measures the ratio between the node’s real water use with respect to the node’s potential water use under continuous extraction. [89] %
ELPUser Size (US)Measures the total quantity of water demanded by the node. WEAP-Elqui [73].Mm3 yr−1
ELPEast–West Geographical Position (EWP)Measures the geographic location of the node with respect to its east–west axis coordinate. WEAP-Elqui [73].UTM m
SLPWater Footprint (WFP)Measures the total volume of fresh water used to produce a good or service unit. [90] L ton−1
SLPQuality Concentration (QC) *Refers to the Fe++ concentration accepted by Chilean regulations (NCh. 409. Of2005) [91]; NCh.1333.Of1978 [92]mg L−1
ACLP+Legal Water Supply (LWS)Measures the number of water shares that are set per hectare in a channel. Elqui River Water Board, 2016 (Interview).acc/ha
ACLP+Water Use Profitability (WUP)Measures the contribution of the economic sectors in the node to the Chilean GDP. [93,94]%
ACLPCanal Water Losses (CWL)Measures water losses in the canal network that feeds each node. Elqui River Water Board, 2016 (Interview).%
Notes: E: Exposure, S: Sensitivity, AC: Adaptive Capacity, H: Hydrology, LP: Legal-Productive, *: Non-selected indicator, Sign: Sign of the assumed relationship between the indicator and vulnerability.
Table 4. Theoretical matrix for contextual vulnerability estimation.
ExposureSensitivityAdaptive Capacity
Hydrological DimensionPotential EvapotranspirationAlternative Water SourcesNode Immobility
Vegetation CoverDrought Propagation Order LinkCanal Infrastructure
Infiltration/Runoff FlowSoil DrainageWater Control Infrastructure
StreamflowAquifer Storage CapacityCanal Maximum Flow
Distance to Main Canal Groundwater Extraction
Distance to River Basin Head Groundwater Users
Distance to the Aquifer
Water Quality
Productive DimensionUse FactorWater FootprintLegal Water Supply
Predictable Coefficient of UseQuality ConcentrationWater Use Profitability
User Size Canal Water Losses
East–West Geographical Position
Table 5. Comparison methods for contextual vulnerability estimation.
MethodAcronymDescription
Principal Component AnalysisPCAProcedure based on Nicoletti et al. [102] and Greyling [103]
The feasibility of PCA was assessed using Pearson pairwise correlations.
Bartlett’s Test of Sphericity (BTS) and the Kaiser–Meyer–Olkin (KMO) measure of sampling adequacy were calculated with the REdaS R package [104]. Thirteen indicators with KMO > 0.5 were retained.
PCA performed with FactoMiner R package [105]. Four PC were extracted.
SES IndexSESEstimated with SesIndexCreatoR R package [106] and applied to the same 13 indicators as in PCA.
Factorial AnalysisFAProcedure based on Nardo et al. [47]. Estimated using ci_factor command in Compind R package [99] with CH = 4 and the same 13 indicators as in PCA.
Benefit of DoubtBoDProcedure based on Nardo et al. [47].
Estimated using ci_bod command in Compind R package [107]. Applied to the same 4 PC extracted from PCA.
Robust Benefit of DoubtRBoDProcedure based on Vidoli et al. [107].
Estimated using ci_rbod command in Compind R package [107] with M = 20, B = 20. Applied to the same 4 PC extracted from PCA.
Unbiased Random ForestRFProcedure based on Hothorn et al. [108].
Estimated using cforest command in party R package [108].
Predictors = 25 selected indicators (Table 3).
Predictant = outcome vulnerability estimation for scenario C.
Used as a reference of maximum predictability.
SEM PLSPMFMODStructural Equation Model-Partial Least Squares Path Model (SEM-PLSPM) Final Model using SmartPLS v.3 [97] based on Hair et al. [60].
SEM PLSPMSEMMaxSEM-PLSPM model with all (25) indicators as isolated manifest variables, estimated with SmartPLS v.3 [97] and based on Hair et al. [60].
Table 6. Results of measurement and structural model evaluation.
Measurement ModelStructural Model
αCRAVE A V E βSigR2
Theoretical Model
Hydrological Exposure0.50.70.20.50.5 0.58
Hydrological Sensitivity0.60.80.50.70.3
Hydrological Adaptability0.80.80.50.7−0.0
Productive Exposure0.40.70.50.70.2
Productive Sensitivity1.01.01.01.0−0.2
Productive Adaptability0.60.70.50.7−0.0
Final Model
Location0.70.90.80.90.7*0.67
Water Supply0.70.80.60.80.4*
Infrastructure1.01.01.01.0−0.4*
Water Stability0.90.90.70.90.5*
Notes: α = Cronbach’s alpha, CR = Composite Reliability, AVE = Average Variance Extracted, A V E = sqrt(AVE), β = path coefficient, R2 = Coefficient of Determination, Sig = Statistical significance of path coefficient β obtained from bootstrapping, * = p < 0.05. Criteria for acceptability [58,59,60]: α > 0.6, CR > 0.6; AVE ≥ 0.5; A V E > β; |β| > 0.2; R2 values of 0.67, 0.33 and 0.19 are substantial, moderate and weak, respectively. Bold type: values that met acceptability criteria.
Table 7. Coefficient of determination R2 as a function of contextual vulnerability estimation procedure.
PCASESFABoDRBoDRFSEMSEMmax *
0.240.080.250.090.070.900.670.91
Notes: PCA: Principal Components Analysis, SES: SESindex, FA: Factor Analysis, BoD: Benefit of Doubt, RBoD: Robust Benefit of Doubt, RF: RandomForest, SEM: SEM-PLSPM, * SEMmax: SEM-PLSPM estimation for maximum R2 with 25 isolated indicators.

