Mitigation Options for Future Water Scarcity: A Case Study in Santa Cruz Island (Galapagos Archipelago)

 ,
,
Abstract
:1. Introduction
2. Literature Review
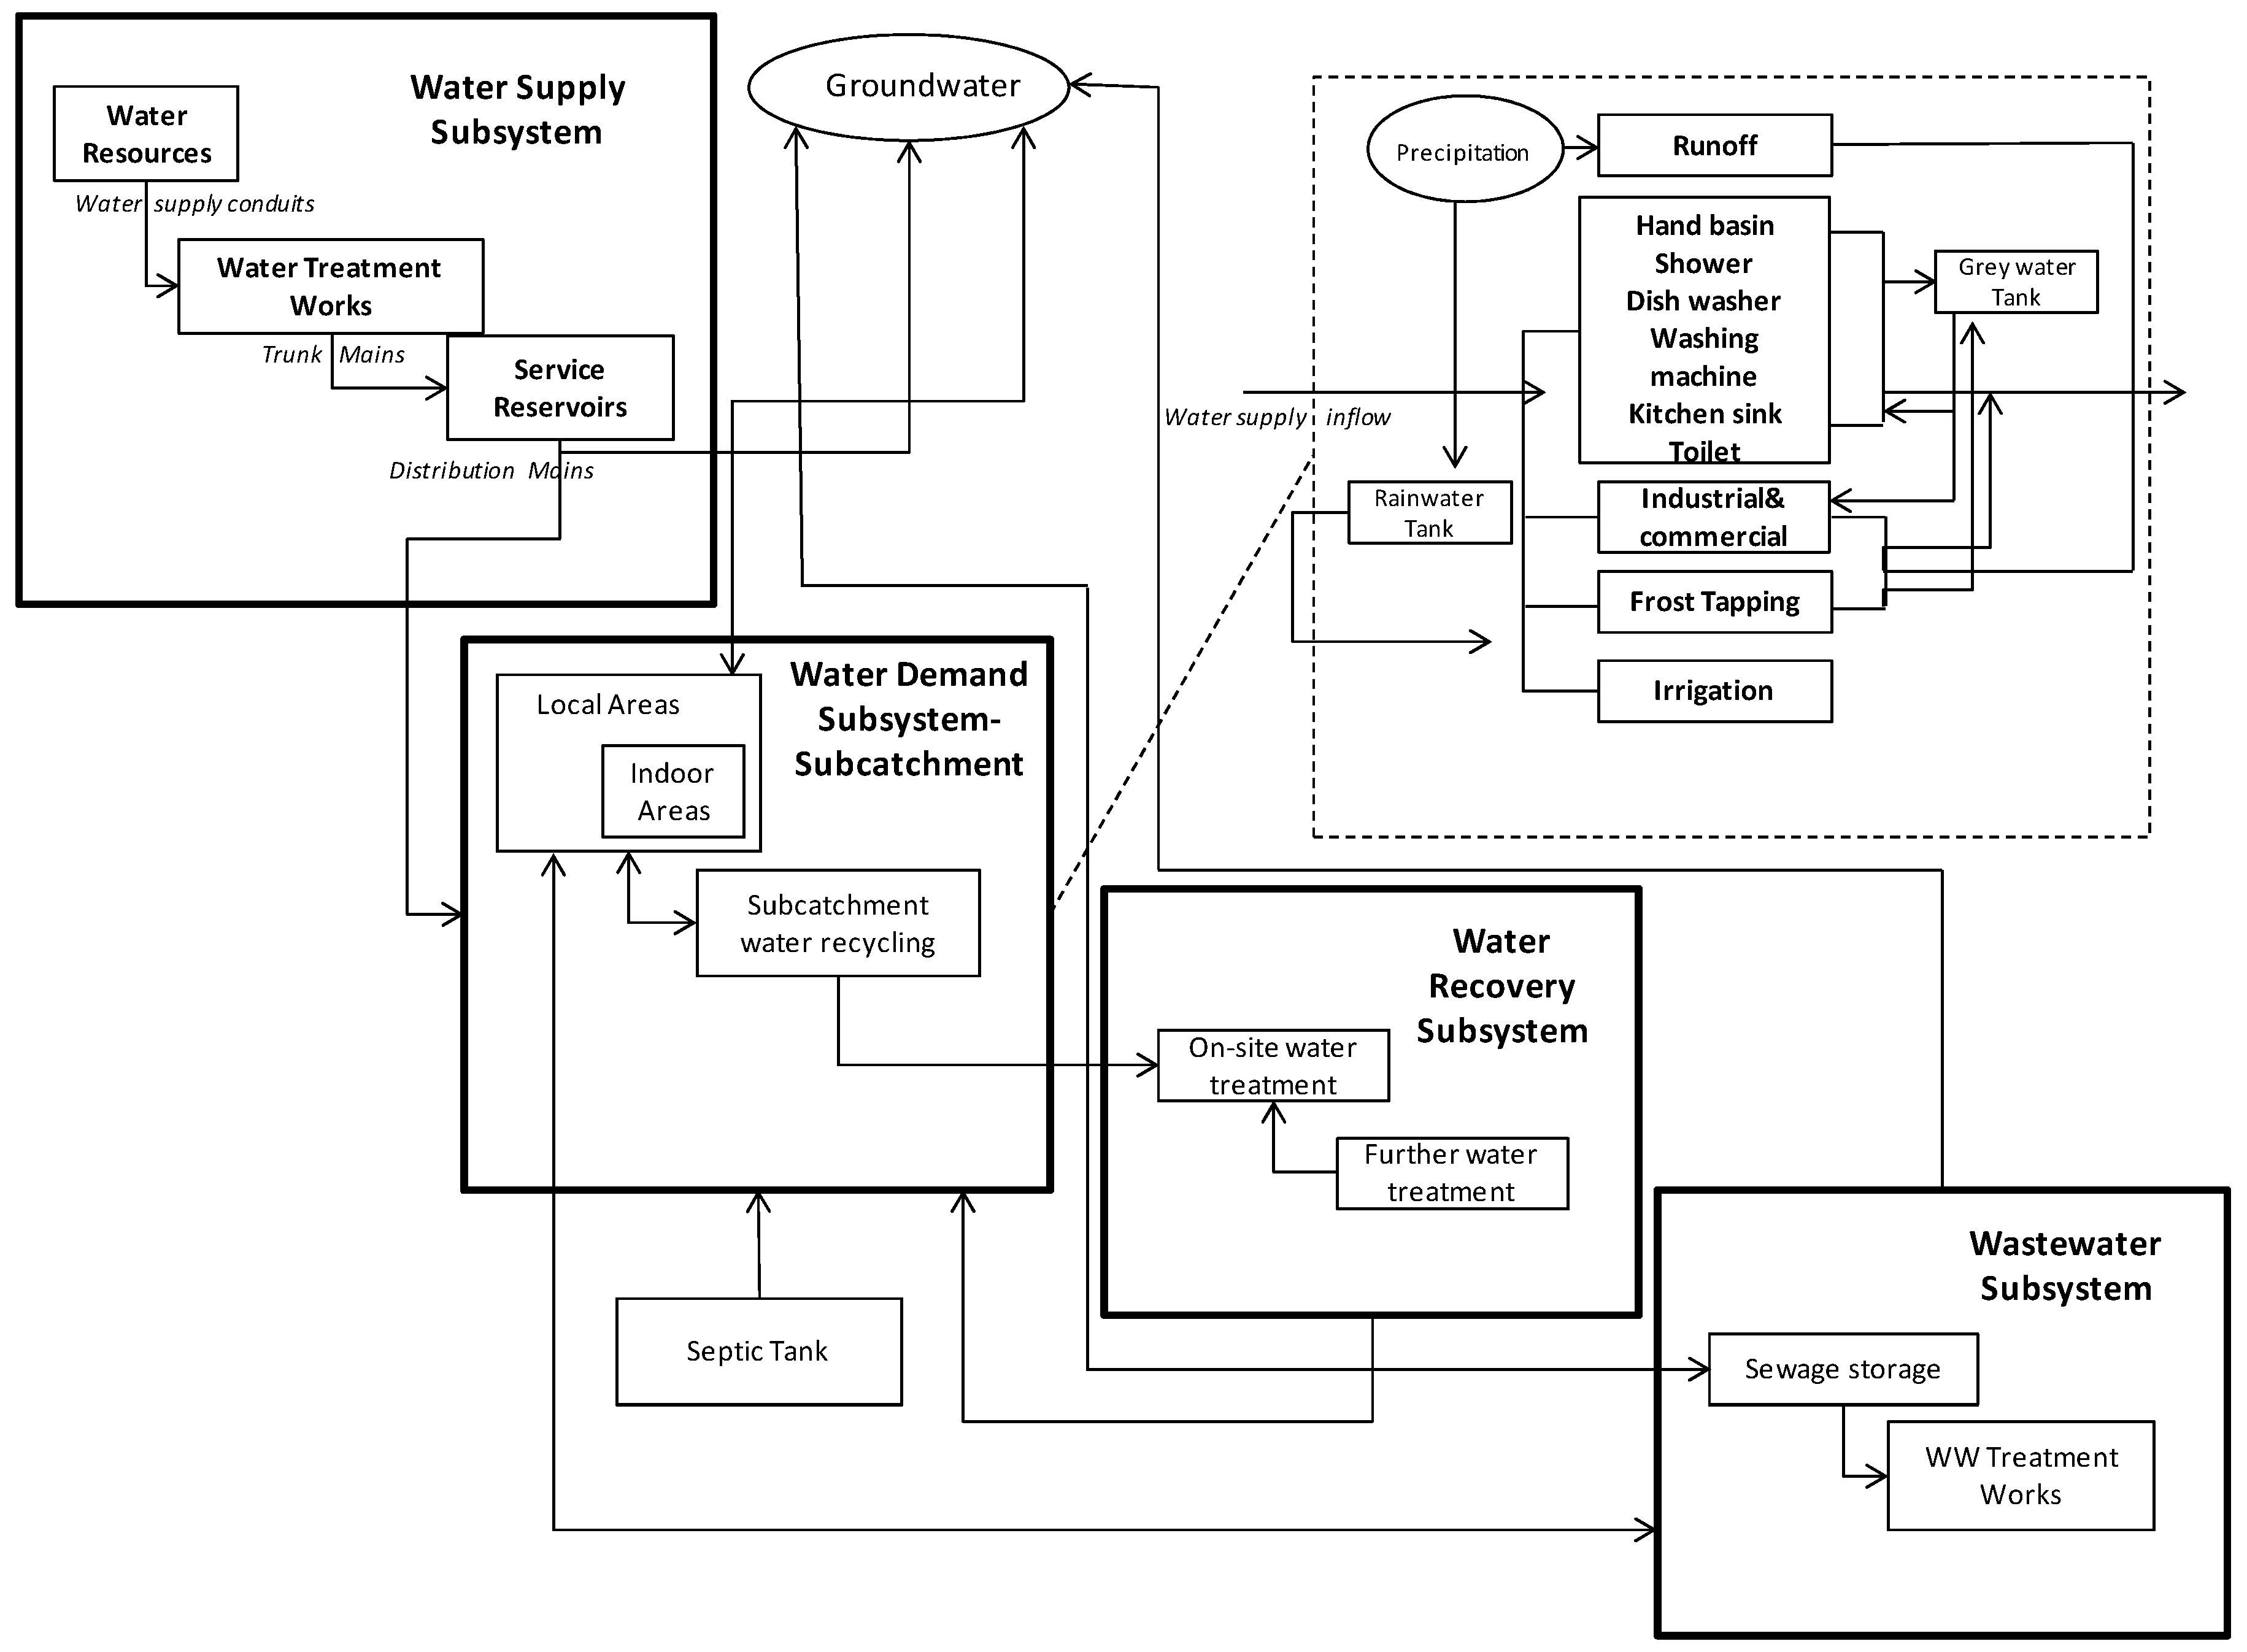
2.1. Urban Water System Modelling Approach
2.2. Population and Tourism Growth Scenarios
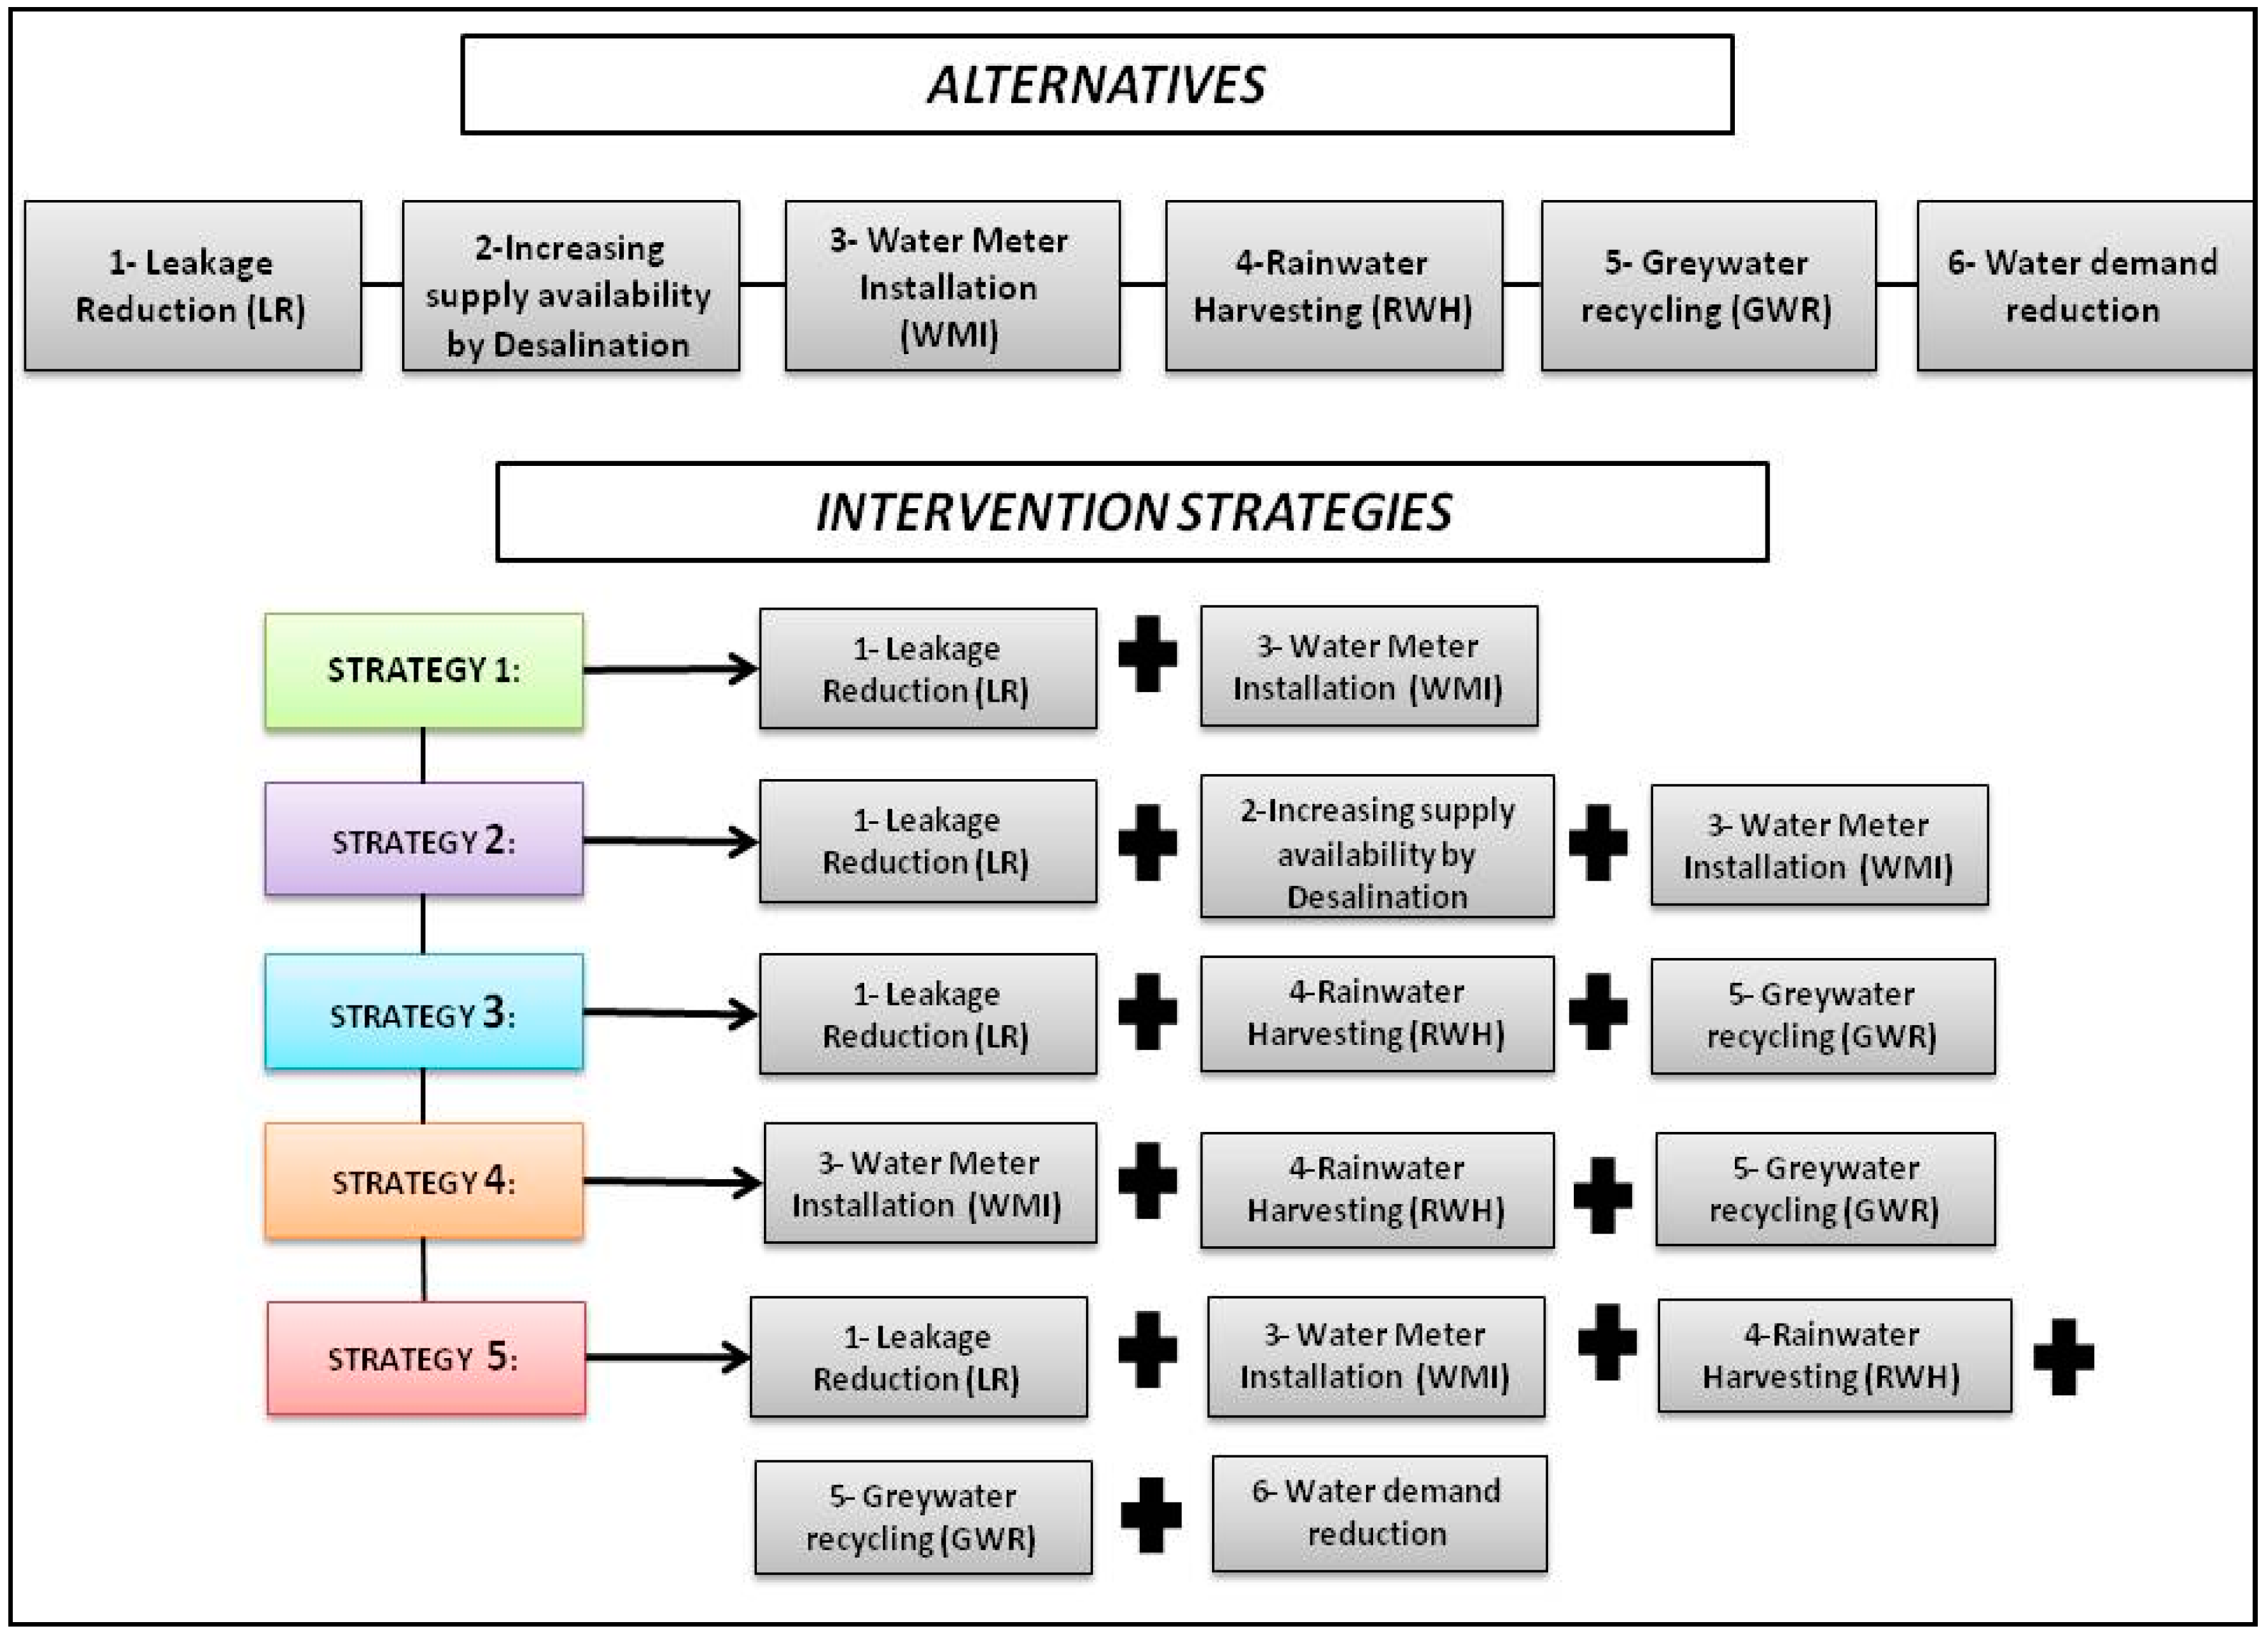
2.3. Alternatives and Intervention Strategies
3. Methodology
4. Case Study
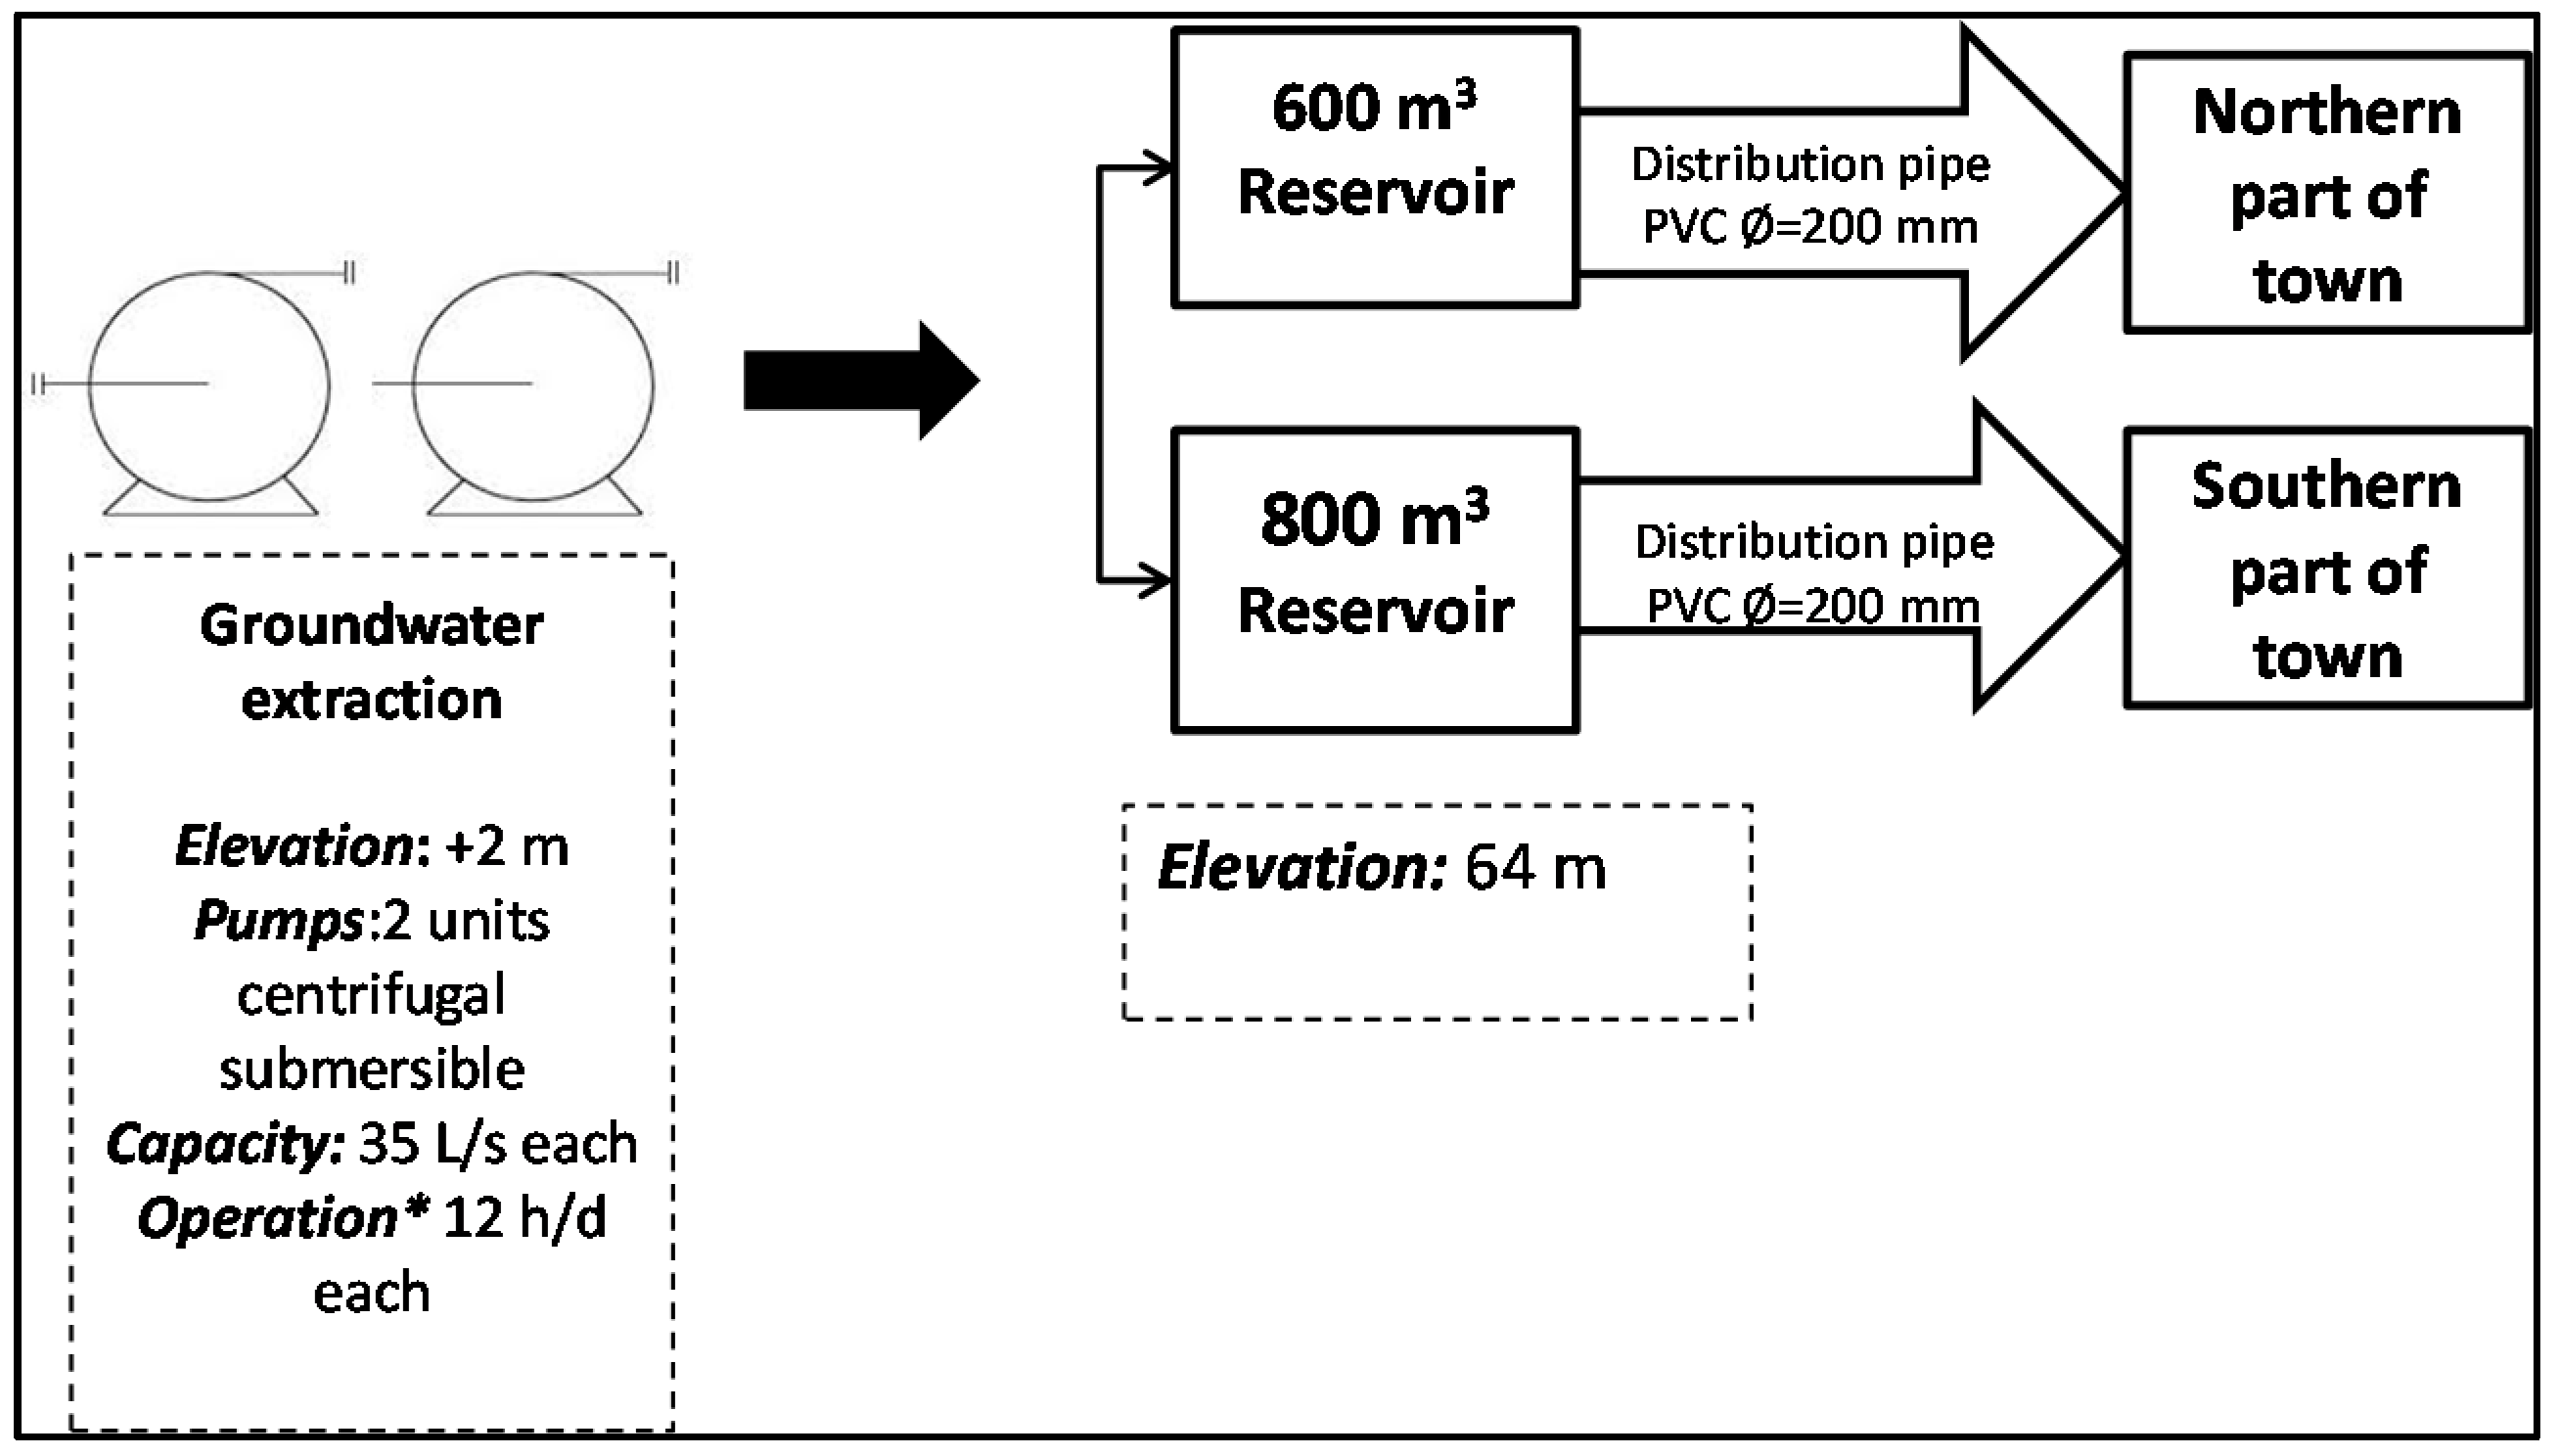
4.1 Description
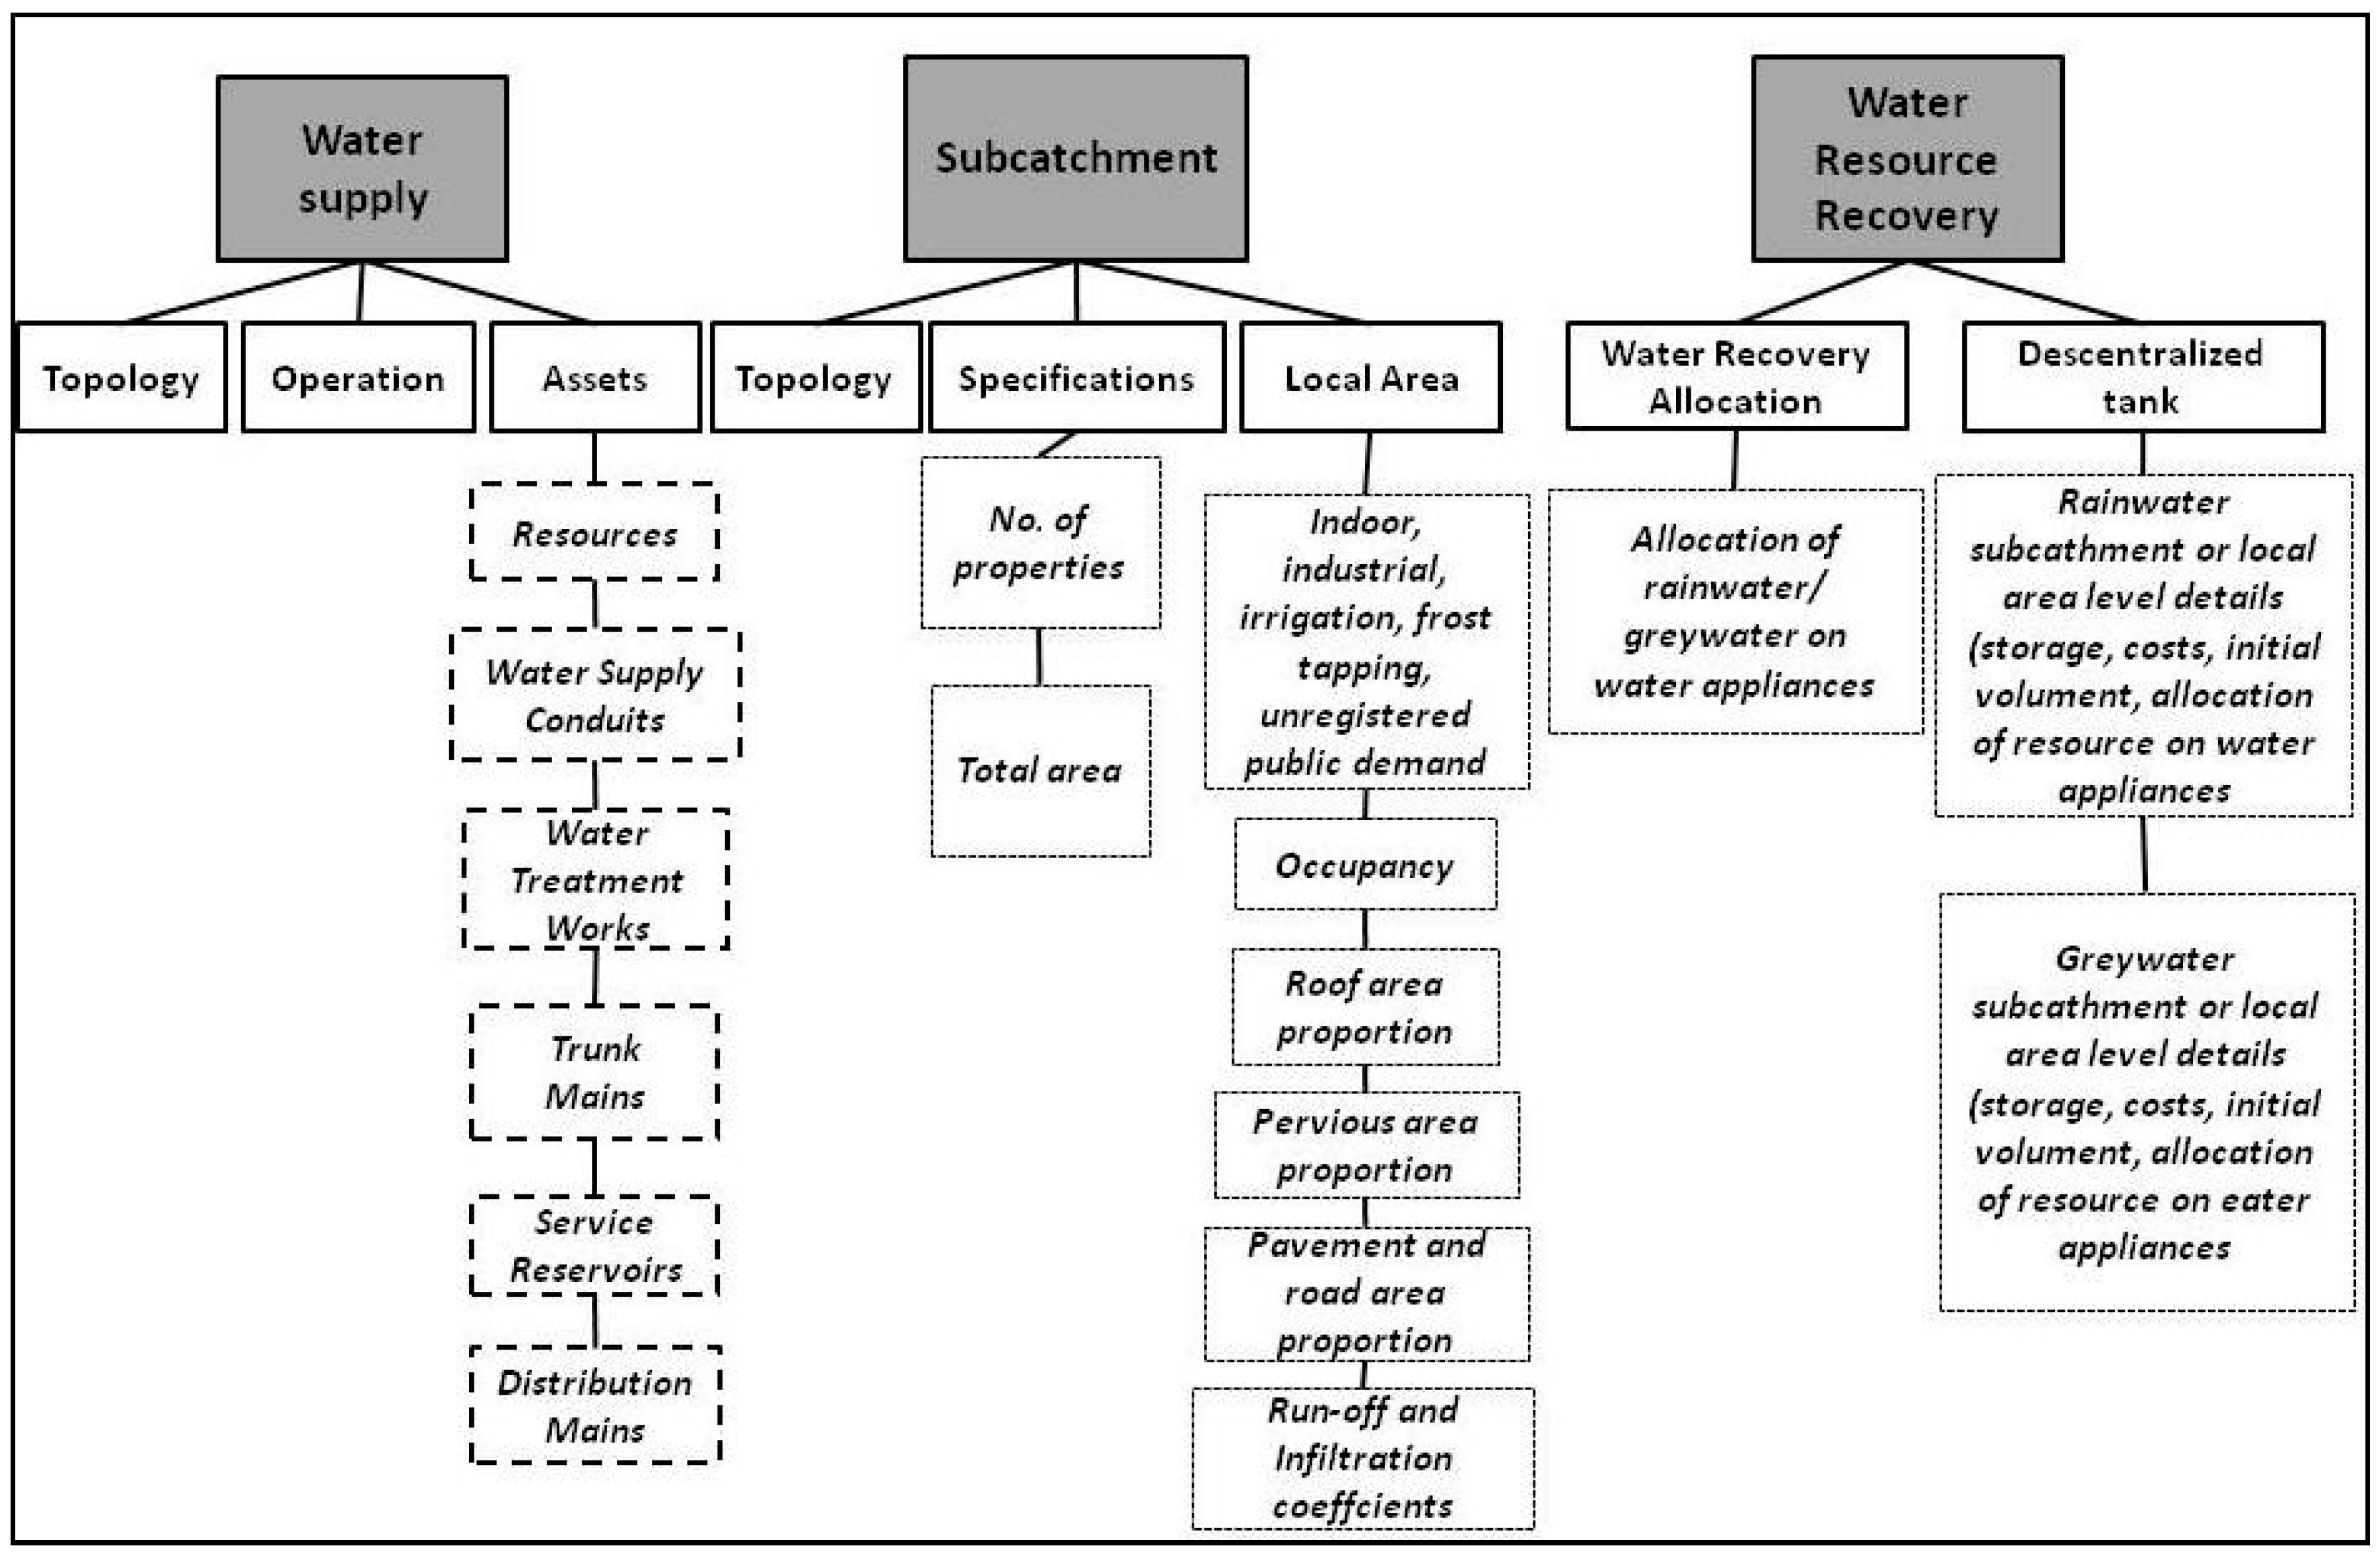
4.2. WaterMet2 Model Building
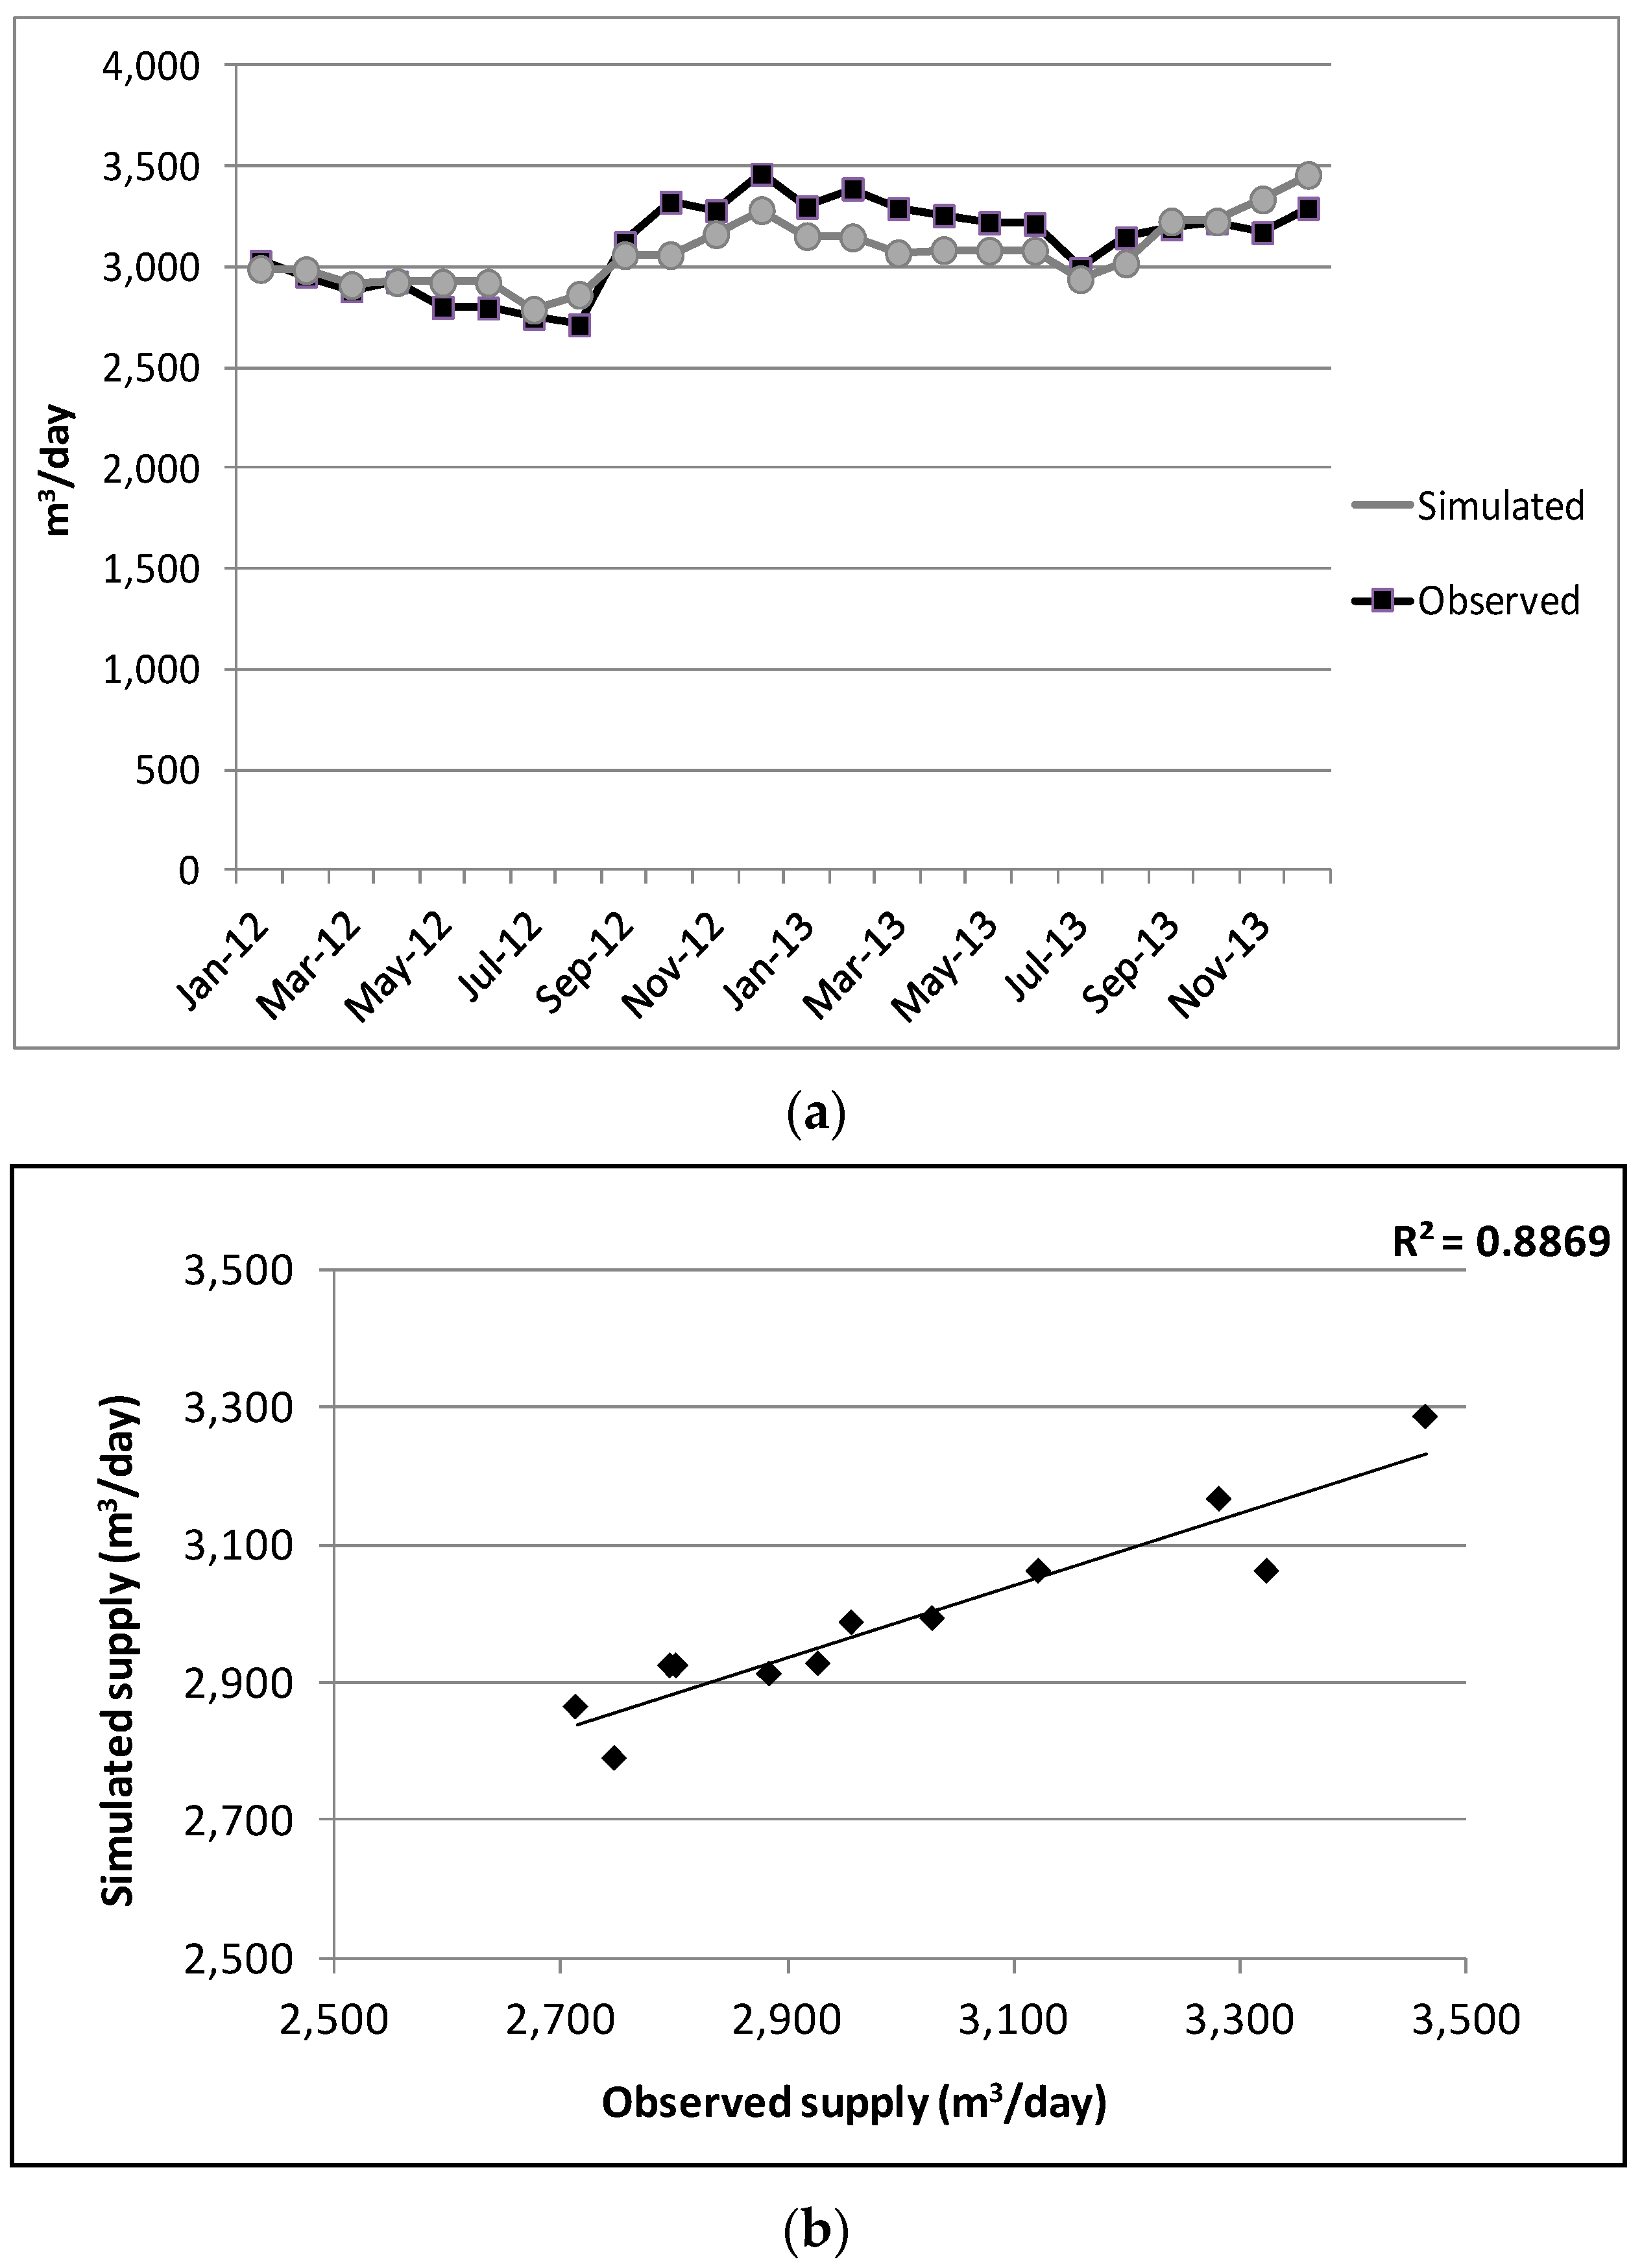
4.3. WaterMet2 Model Calibration
4.4. Population and Tourist Growth Scenarios for Puerto Ayora
4.5. Alternatives and Intervention Strategies
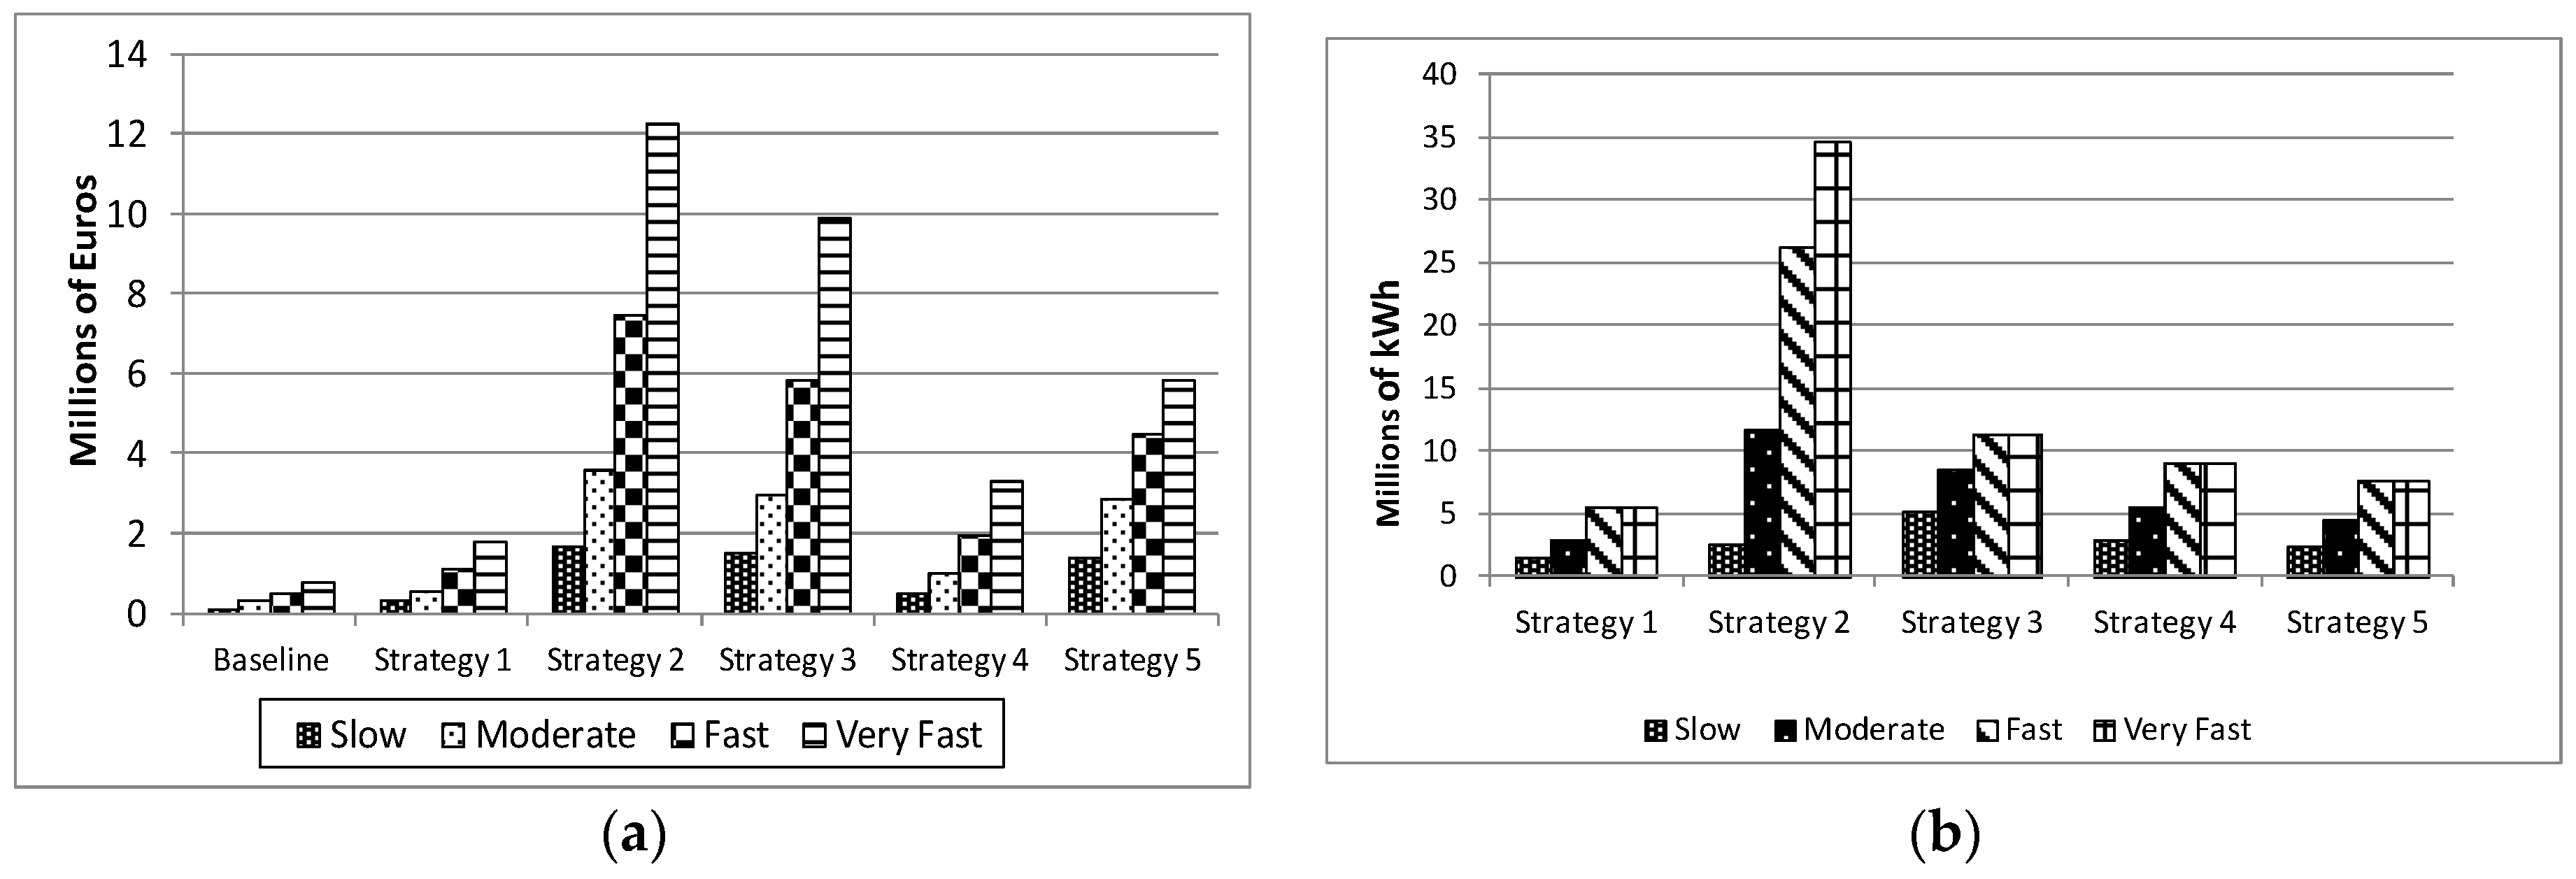
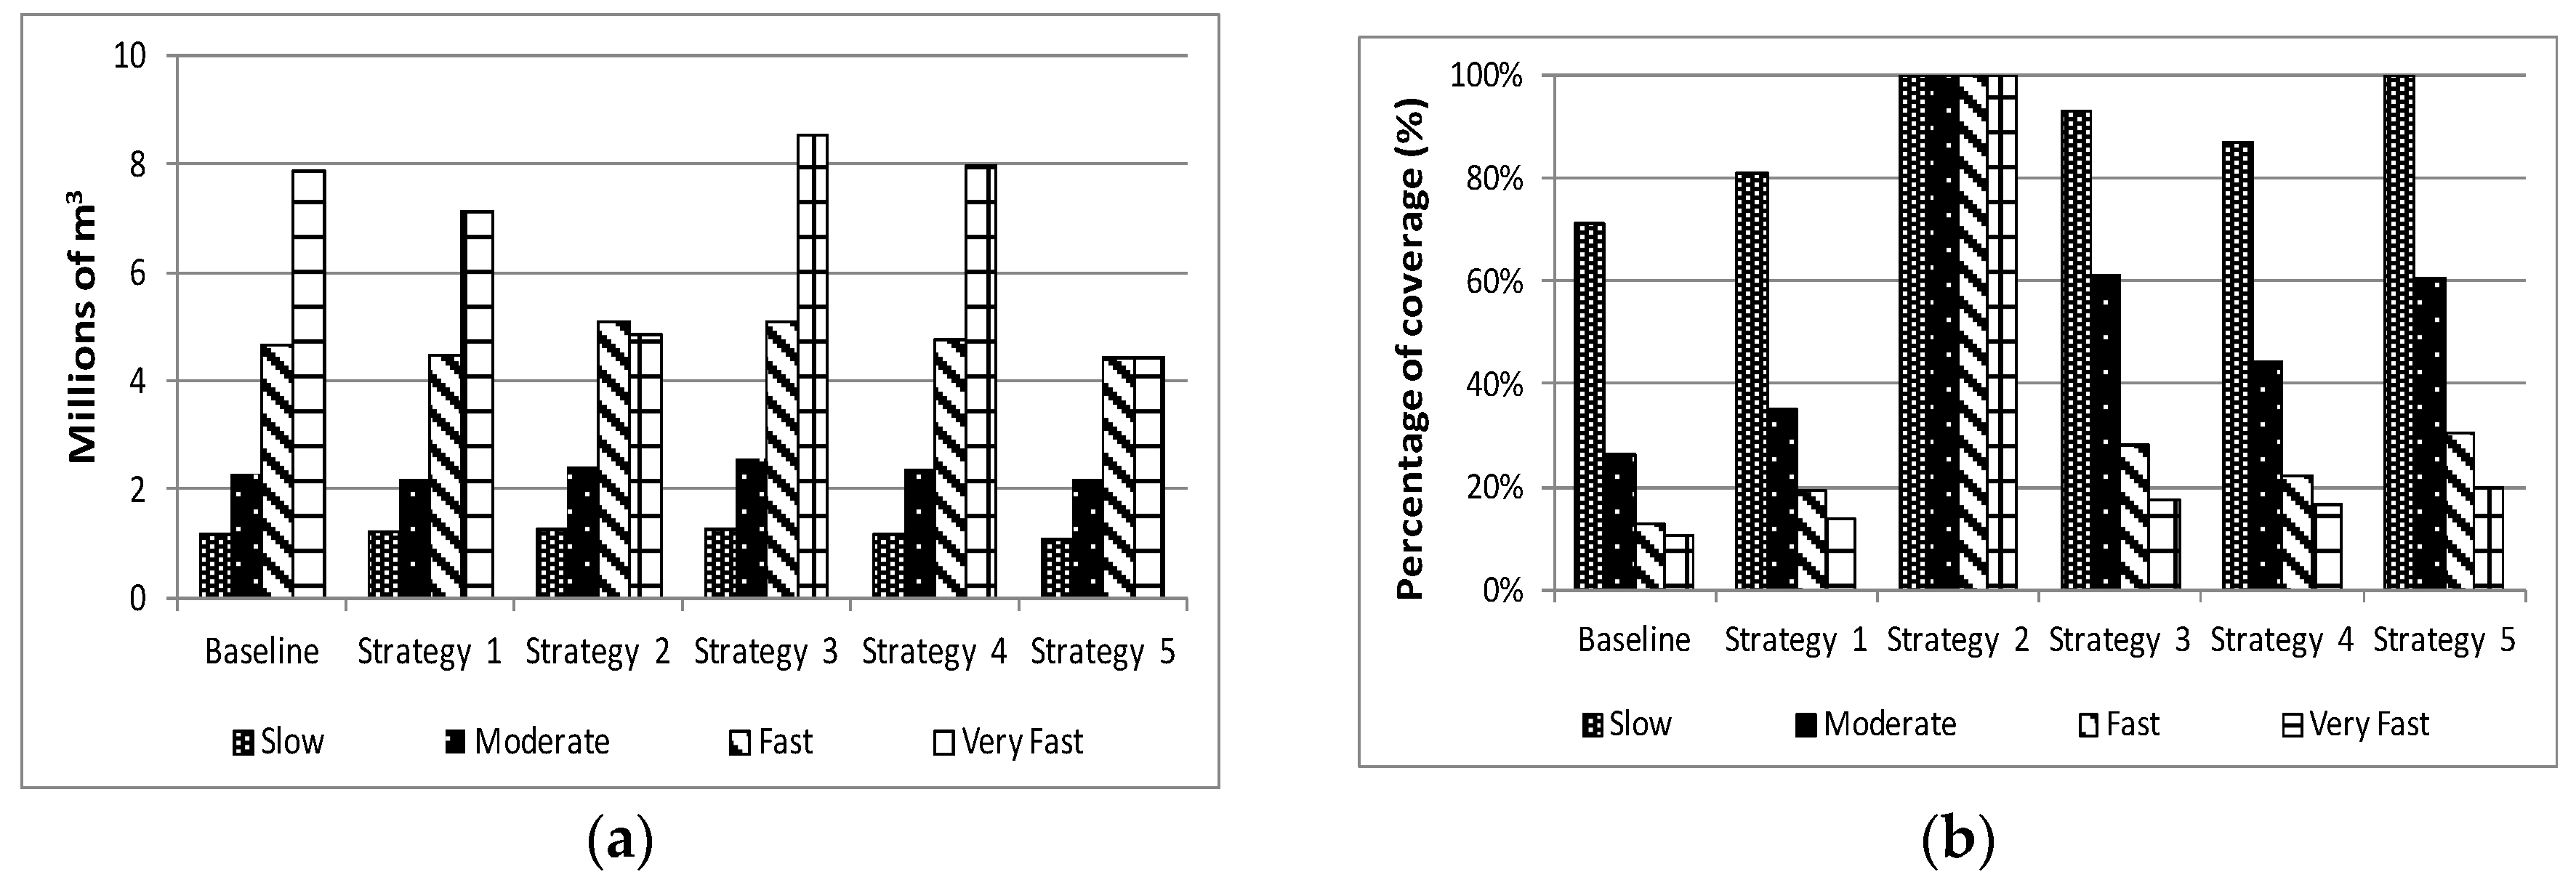
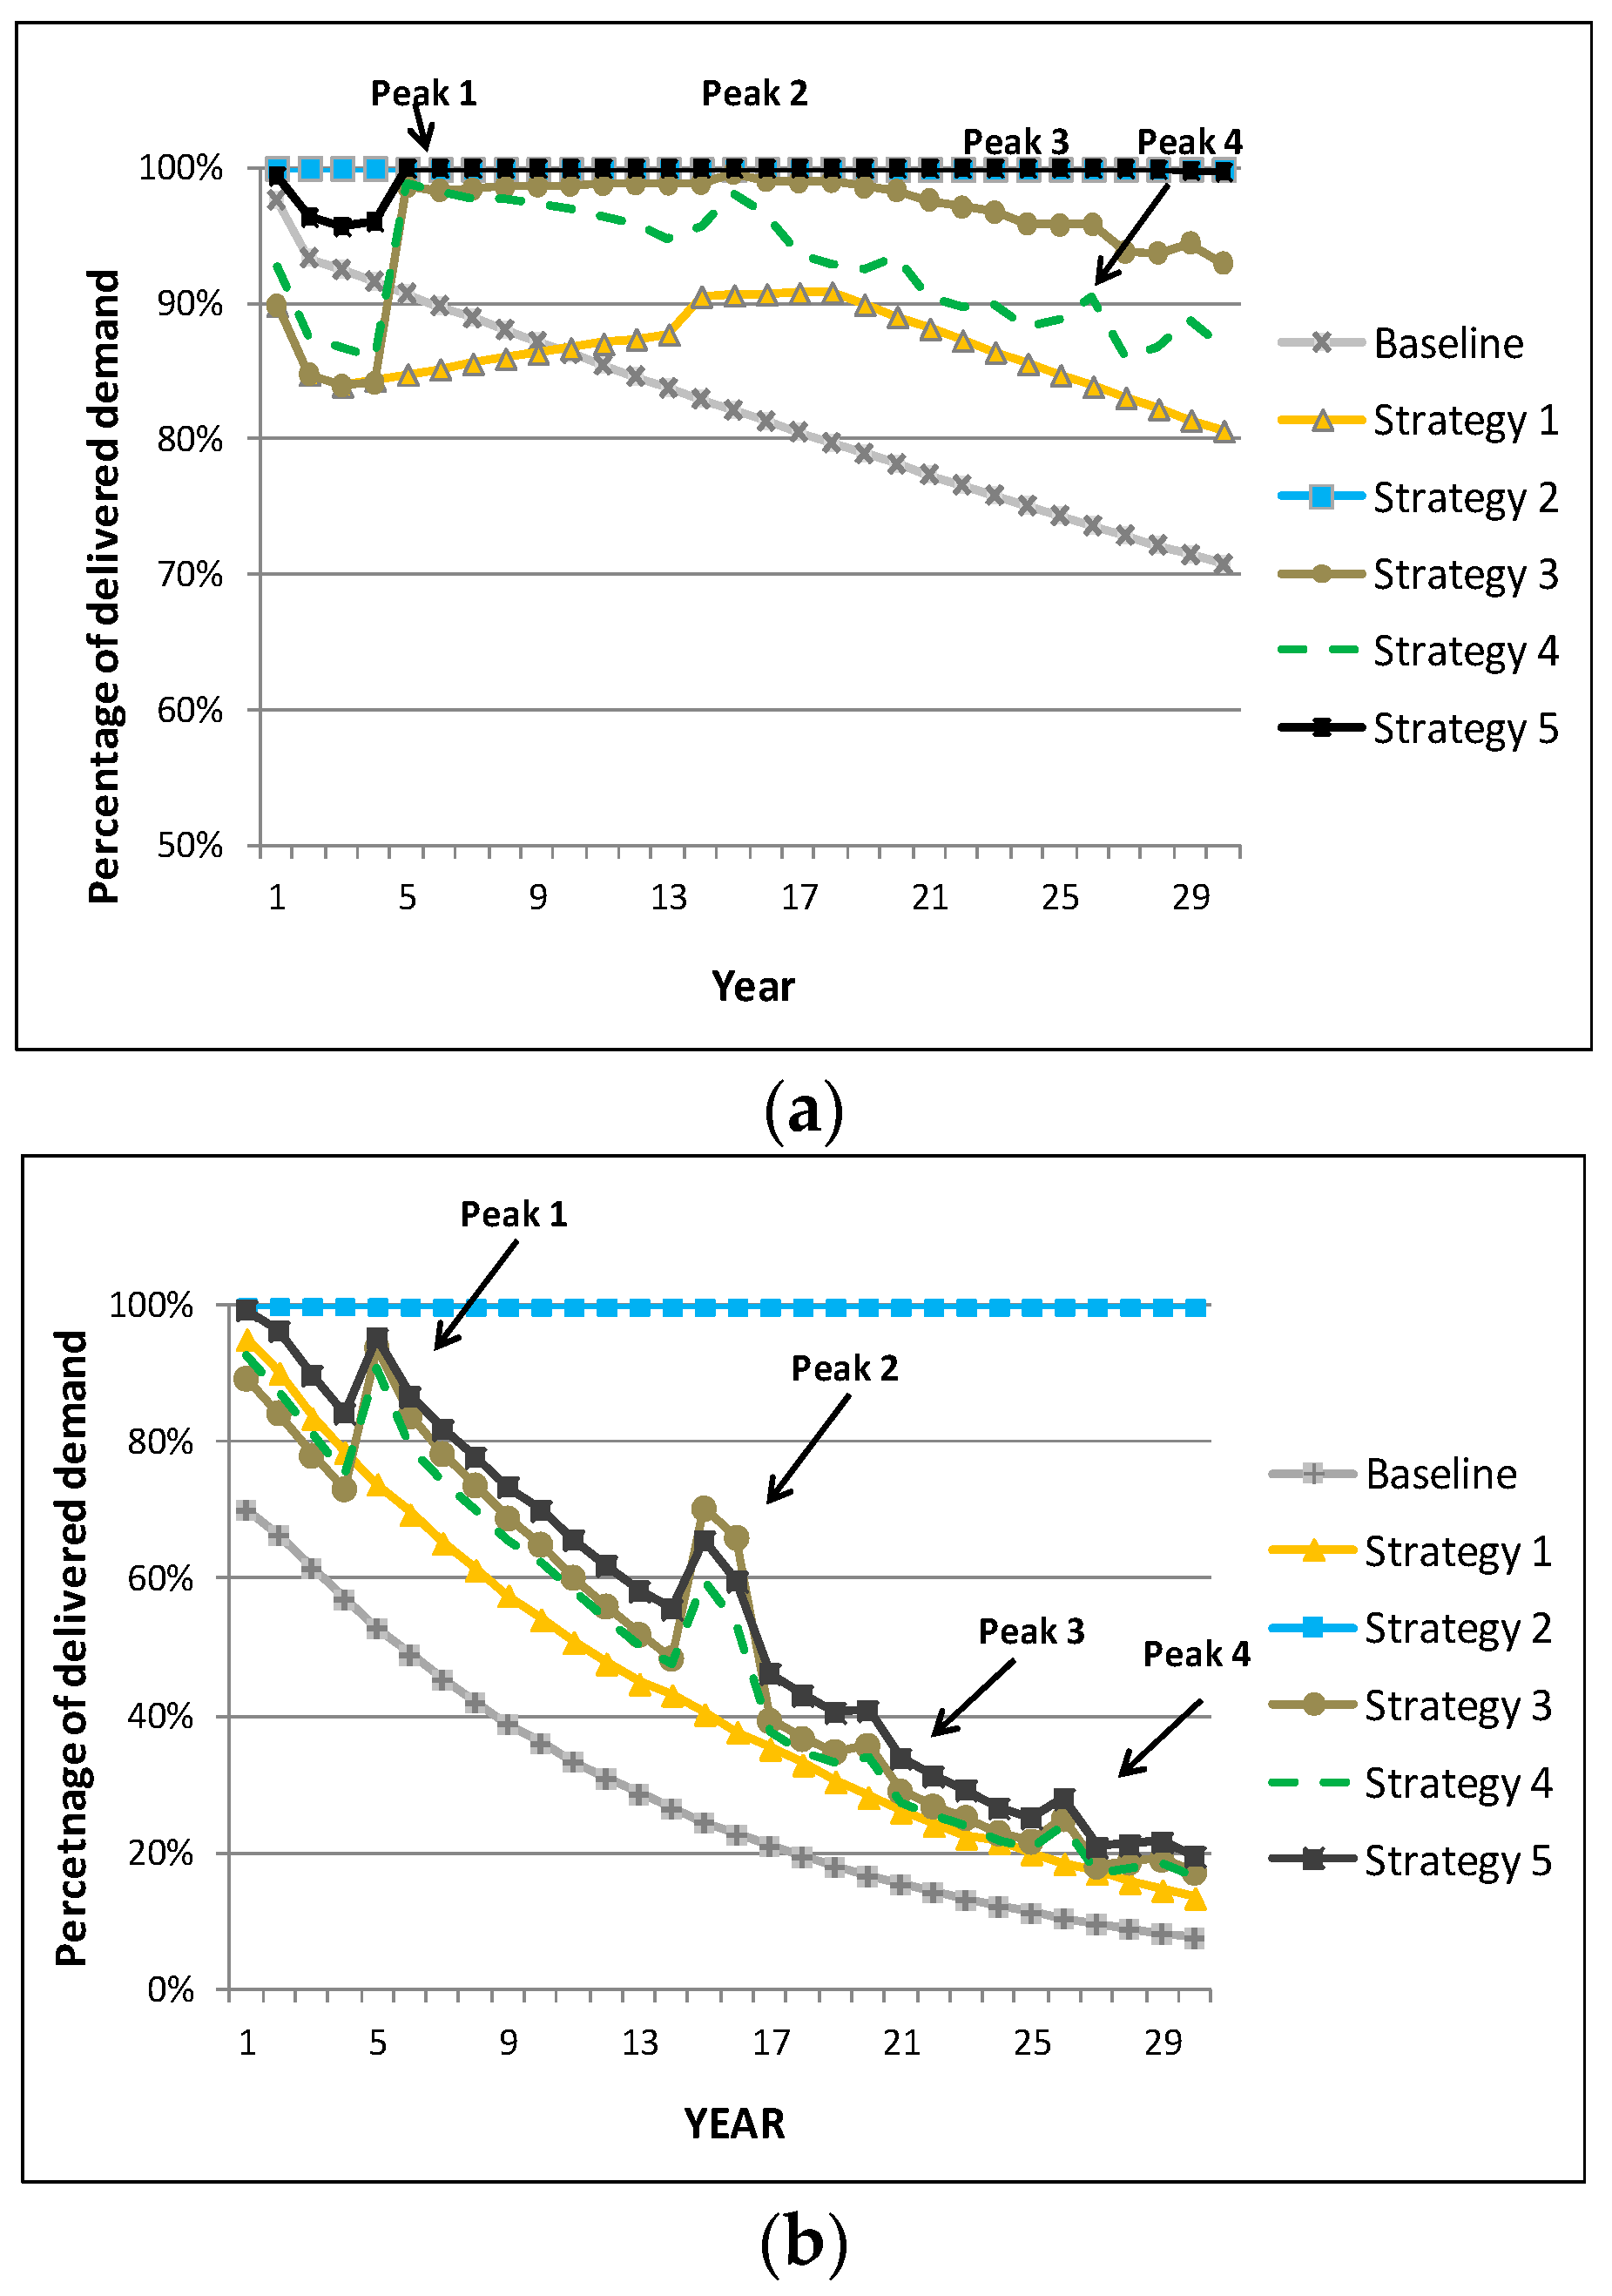
5. Results and Discussion
6. Conclusions
Acknowledgments
Author Contributions
Conflicts of Interest
References
- Epler, B. Tourism, the Economy, Population Growth, and Conservation in Galapagos; Report for Charles Darwin Foundation; Charles Darwin Foundation: Puerto Ayora, Ecuador, 2007. [Google Scholar]
- Independent National Electoral (INEC). Censo de población y vivienda del Ecuador 2010. Ecuador, Instituto Nacional de Estadísticas y Censos, 2010. Available online: http://www.ecuadorencifras.gob.ec (accessed on 1 September 2015).
- DPNG Dirección del Parque Nacional Galápagos. 2016. Available online: http://www.galapagospark.org/ (accessed on 5 February 2016).
- González, J.A.; Montes, C.; Rodríguez, J.; Tapia, W. Rethinking the Galapagos Islands as a complex social-ecological system: Implications for conservation and management. Ecol. Environ. 2008, 13, 13. [Google Scholar] [CrossRef]
- Pizzitutti, F.; Mena, C.F.; Walsh, S.J. Modelling tourism in the Galapagos Islands: An agent-based model approach. J. Artif. Soc. Soc. Simul. 2014, 17, 14. [Google Scholar] [CrossRef]
- Mena, C. Determination of Social, Environmental and Economic Relations which Allow the Development Based on Different Processes of Modelling, Potential Scenarios of Sustainability of the Socio-Ecological System of the Galápagos Islands with Emphasis on the Dynamic of the Flux of Tourist Visitors; Report for the Ministry of Environment; the Ministry of Environment: Puerto Ayora, Ecuador, 2014; unpublished.
- Reyes, M.; Trifunovic, N.; Sharma, S.; Kennedy, M. Data Assessment for Water Demand and Supply Balance in the Island of Santa Cruz (Galápagos Island). Desalin. Water Treat J. 2015. [Google Scholar] [CrossRef]
- Watkins, G.; Cruz, F. Galapagos at Risk: A Socioeconomic Analysis; Report for Charles Darwin Foundation; Charles Darwin Foundation: Puerto Ayora, Ecuador, 2007. [Google Scholar]
- Proctor and Redfern CA. Estudio De Provisión De Agua y Tratamiento De Aguas Residuales De Santa Cruz; Proctor and Redfern International Limited: Santa Cruz-Galápagos, Ecuador, 2003. [Google Scholar]
- Reyes, M.; Trifunovic, N.; Sharma, S.; Kennedy, M. Implications of Water Tariff Structure on Water Demand in Santa Cruz Island (Galapagos Archipelago). In Proceedings of the XVth World Water Congress, Edinburgh, Scotland, UK, 25–29 May 2015. [Google Scholar]
- D’Ozouville, N.; Deffontaines, B.; Benveniste, J.; Wegmüller, U.; Violette, S.; De Marsily, G. DEM generation using ASAR (ENVISAT) for addressing the lack of freshwater ecosystems management, Santa Cruz Island, Galápagos. Remote Sens. Environ. 2008, 112, 4131–4147. [Google Scholar] [CrossRef]
- Reyes, M.; Trifunovic, N.; d’Ozouville, N.; Sharma, S.; Kennedy, M. Quantification of urban water demand in the Island of Santa Cruz (Galápagos Archipelago). Desalin. Water Treat. 2017, 64, 1–11. [Google Scholar]
- Behzadian, K.; Kapelan, Z.; Venkatesh, G.; Brattebø, H.; Sægrov, S.; Rozos, E.; Makropoulos, C. Quantitative UWS Performance Model: WaterMet2, 2014, TRUST Report. Available online: https://ore.exeter.ac.uk/repository/bitstream/handle/10871/17062/d332-Final.pdf?sequence=1&isAllowed=y (accessed on 25 May 2016).
- Mitchell, V.G.; Diaper, C. UVQ User Manual urban water balance and contaminant balance analysis tool. CSIRO Version1 2010, 2, 2005–2282. [Google Scholar]
- Dos Santos, C.C.; Pereira Filho, A.J. Water Demand Forecasting Model for the Metropolitan Area of São Paulo, Brazil. Water Resour. Manag. 2014, 28, 4401–4414. [Google Scholar] [CrossRef]
- Billings, R.B.; Jones, C.V. Forecasting Urban Water Demand; American Water Works Association: Denver, CO, USA, 2008. [Google Scholar]
- Ajbar, A.; Ali, E. Prediction of municipal water production in touristic Mecca City in Saudi Arabia using neural networks. J. King Saud Univ. Eng. Sci. 2015, 27, 83–91. [Google Scholar] [CrossRef]
- Soyer, R.; Roberson, J.A. Urban Water Demand Forecasting: A Review of Methods and Models; American Society of Civil Engineers: Reston, VA, USA, 2010. [Google Scholar]
- Mitchell, V.; Duncan, H.; Inma, R.M.; Stewart, J.; Vieritz, A.; Holt, P.; Grant, A.; Fletcher, T.; Coleman, J.; Maheepala, S. State of the art review of integrated urban water models. Novatech Lyon France 2007, 1, 507–5014. [Google Scholar]
- Makropoulos, C.K.; Natsis, K.; Liu, S.; Mittas, K.; Butler, D. Decision support for sustainable option selection in integrated urban water management. Environ. Model. Softw. 2008, 23, 1448–1460. [Google Scholar] [CrossRef]
- Last, E. City Water Balance: A New Scoping Tool for Integrated Water Management Options. Ph.D. Thesis, Univeristy of Birmingham, Birmingham, UK, 2010. [Google Scholar]
- Behzadian, K.; Kapelan, Z. Modelling metabolism based performance of an urban water system using WaterMet2. Resour. Conserv. Recycl. 2015, 99, 84–99. [Google Scholar] [CrossRef] [Green Version]
- Behzadian, K.; Kapelan, Z. Advantages of integrated and sustainability based assessment for metabolism based strategic planning of urban water systems. Sci. Total Environ. 2015, 527, 220–231. [Google Scholar] [CrossRef] [PubMed] [Green Version]
- Sharma, S. Urban Water Supply and Demand Management; Lecture Notes; UNESCO-IHE (Institute for Water Education): Delft, The Netherlands, 2014. [Google Scholar]
- Trifunovic, N. Introduction to Urban Water Distribution: Unesco-IHE Lecture Note Series; CRC Press: Boca Raton, FL, USA, 2006. [Google Scholar]
- Reyes, M.; Trifunovic, N.; Sharma, S.; Kennedy, M. Assessment of Domestic Consumption in Puerto Ayora Intermittent Supply System (Santa Cruz Island-Galápagos). Manuscr. Rev. J. Water Supply Res. Technol. 2017. under review. [Google Scholar]
- D’Ozouville, N. Water Resource Management: The Pelican Bay Watershed; Galápagos Report 2007–2008, 2009. Available online: https://www.galapagos.org/wp-content/uploads/2012/04/biodiv11-water-resource-mgmt.pdf (accessed on 12 August 2017).
- Domínguez, C.; Pryet, A.; Vera, G.M.; Gonzalez, A.; Chaumont, C.; Tournebize, J.; Villacis, M.; d’Ozouville, N.; Violette, S. Comparison of deep percolation rates below contrasting land covers with a joint canopy and soil model. J. Hydrol. 2016, 532, 65–79. [Google Scholar] [CrossRef]
- Gobierno Autonomo Descentralizado Municipio de Santa Cruz. Atlás Geográfico del Cantón Santa Cruz; Secretaria Técnica de Planificación y Desarrollo Sustentable del Gobierno Autonomo Municipal Descentralizado de Santa Cruz: Santa Cruz- Galápagos, Ecuador, 2012; p. 50. (In Spanish)
- Verrecht, B.; Maere, T.; Benedetti, L.; Nopens, I.; Judd, S. Model-based energy optimisation of a small-scale decentralised membrane bioreactor for urban reuse. Water Res 2010, 44, 4047–4056. [Google Scholar] [CrossRef] [PubMed] [Green Version]
- Ghaffour, N.; Missimer, T.; Amy, G. Technical review and evaluation of the economics of water desalination: Current and future challenges for better water supply sustainability. Desalination 2013, 309, 197–207. [Google Scholar] [CrossRef]
- Al-Karaghouli, A.; Kazmerski, L. Energy consumption and water production cost of conventional and renewable-energy-powered desalination processes. Renew. Sustain. Energy Rev. 2013, 24, 343–356. [Google Scholar] [CrossRef]
- Watereuse Association Desalination Committee. Seawater Desalination Costs: White Paper, 2011. Available online: https://watereuse.org/wp-content/uploads/2015/10/WateReuse_Desal_Cost_White_Paper.pdf (accessed on 12 August 2017).
- Lattemann, S.; Kennedy, M.D.; Schippers, J.C.; Amy, G. Global desalination situation. Sustain. Sci. Eng. 2010, 2, 7–39. [Google Scholar]
- Tam, V.W.Y.; Tam, L.; Zeng, S.X. Cost effectiveness and tradeoff on the use of rainwater tank: An empirical study in Australian residential decision-making. Resour. Conserv. Recycl. 2010, 54, 178–186. [Google Scholar] [CrossRef]
- Retamal, M.; Turner, A.; White, S. Energy implications of household rainwater systems. Aust. Water Assoc. 2009, 38, 70–75. [Google Scholar]
- Hauber-Davidson, G.; Shortt, J. Energy Consumption of Domestic Rainwater Tanks. Water J. 2011, 3, 1–5. [Google Scholar]
- Fletcher, H.; Mackley, T.; Judd, S. The cost of a package plant membrane bioreactor. Water Res. 2007, 41, 2627–2635. [Google Scholar] [CrossRef] [PubMed]
- Boehler, M.; Joss, A.; Buetzer, S.; Holzapfel, M.; Mooser, H.; Siegrist, H. Treatment of toilet wastewater for reuse in a membrane bioreactor. Water Sci. Technol. 2007, 56, 63–70. [Google Scholar]
- Gnirss, R.; Luedicke, C.; Vocks, M.; Lesjean, B. Design criteria for semi-central sanitation with low pressure network and membrane bioreactor—The ENREM project. Water Sci. Technol. 2008, 57, 403–410. [Google Scholar] [CrossRef] [PubMed]
- Fountoulakis, M.; Markakis, N.; Petousi, I.; Manios, T. Single house on-site grey water treatment using a submerged membrane bioreactor for toilet flushing. Sci. Total Environ. 2016, 551, 706–711. [Google Scholar] [CrossRef] [PubMed]
- Guyot-Tephany, J.; Grenier, C.; Orellana, D. Uses, Perceptions and Management of Water in Galápagos; Galapagos Report 2011-2012; GNPS, GCRG, CDF and GC: Puerto Ayora, Galápagos, Ecuador, 2013. [Google Scholar]
- Dhakal, N.; Salinas Rodriguez, J.C.; Schippers, J.C.; Kennedy, M.D. Perspectives and challenges for desalination in developing countries. IDA J. Desalin. Water Reuse 2014, 6, 10–14. [Google Scholar] [CrossRef]
- Pryet, A.; Dominguez, C.; Tomai, P.F.; Chaumont, C.; d’Ozouville, N.; Villacís, M.; Violette, S. Quantification of cloud water interception along the windward slope of Santa Cruz Island, Galapagos (Ecuador). Agric. For. Meteorol. 2012, 161, 94–106. [Google Scholar] [CrossRef] [Green Version]


| Category | Municipal Supply (m3/day) | Bottled Water (m3/day) | Water Trucks (m3/day) | Total Demand (m3/day) |
|---|---|---|---|---|
| Domestic | 1951 | 20 | 158 | 2129 |
| Hotels | 1107 | 21 | 1789 | 2917 |
| Restaurants | 69 | 8 | 51 | 128 |
| Laundries | 29 | 0 | 20 | 49 |
| TOTAL | 3156 | 48 | 2018 | 5222 |
| Water Resources Form | ||
|---|---|---|
| Component Name | Unit | Puerto Ayora |
| Type | - | Groundwater |
| Energy consumption (electricity and fossil fuel) | kWh/m3 (for electricity) L/m3 (for fossil fuel) | 0.66 kWh/m3 and 0.3 L/m3 |
| Fixed annual operation costs | EUR/ year * (cost of elec: 0.17 EUR/kWh Cost of fuel: 0.22 EUR/L) | 219,120 |
| Water Loss | % | Assumed there are no water losses at the point of extraction. |
| Water Supply Conduits | ||
| Component name | Unit | Puerto Ayora |
| Transmission capacity *** | m3/day | 3024 |
| Leakage ** | % | 8 |
| Pumping system | m3 | N/A |
| Energy consumption | kWh/m3 (for electricity) L/m3 (for fossil fuel) | 0.66 and 0.5 |
| Fixed annual operation costs | EUR/year * (cost of elec: 0.17 EUR/kWh Cost of fuel: 0.22 EUR/L) | 4980 |
| Service Reservoirs | ||
| Storage Capacity *** | m3/day | 3024 |
| Initial volume | m3 | 1500 |
| Operational cost | EUR/year * | 2490 |
| Distribution Mains | ||
| Transmission Capacity *** | m3/day | 3024 |
| Leakage ** | % | 20 |
| Operational Costs | EUR/year * | 58,100 |
| Component Name | Unit | Puerto Ayora |
|---|---|---|
| Topology | Defined as only one sub-catchment area and one local area | |
| Number of properties | - | 1996 (domestic) |
| Total area | Ha | 163 |
| Current indoor water demand | L/cap/day | 160 |
| Current Industrial/Commercial water demand | m3/day | 1200 |
| Average occupancy per property | Inhabitants/household | 4 |
| Roof area proportion | (%) | 40 |
| Pervious area proportion * | (%) | 30 |
| Pavement & road area proportion * | (%) | 30 |
| Run-off coefficient * | (0-1) | 0.85 |
| Infiltration coefficient * | (0–1) | 0.9 |
| Month | Puerto Ayora |
|---|---|
| January | 1.027 |
| February | 1.019 |
| March | 0.991 |
| April | 0.993 |
| May | 0.967 |
| June | 0.965 |
| July | 0.922 |
| August | 0.941 |
| September | 1.014 |
| October | 1.050 |
| November | 1.036 |
| December | 1.080 |
| Growth Scenario | Local Population Increase | Tourist Visitors Increase * |
|---|---|---|
| Very Fast | 7% | 9% |
| Fast | 5% | 7% |
| Moderate | 3% | 4% |
| Slow | 1% | 1% |
| Alternative | Description | Input Values | Assumptions | Total Costs b (EUR/m3) | Reference |
|---|---|---|---|---|---|
| (1) Leakage Reduction | Reduction from 28% a to 13% (1% annually). | Energy consumption: 0.66 KWh/m3 (current use of energy). The same values for all four growth scenarios | Installation of automatic and computerized leakage and control system (e.g., pressure and flow monitoring). | 0.66 | Municipality of Santa Cruz and local providers |
| Replacement of old pipes (17,800 m of PVC pipes). | |||||
| (2) Desalination Plant | Installation of a new SWRO desalination plant (BWRO was not considered to avoid extra pressure on the basal aquifer and increase of salinity) with energy recovery system. Open seawater intake (35,000 ppm), 55% recovery rate, 99% salt rejection. | (1) small growth (9000 m3/day)
(2) moderate growth (16,000 m3/day) (3) fast growth (28,000 m3 day) (4) very fast growth (50, 000 m3/day) Energy consumption c: 3 KWh/ m3 | Cost includes plant, land, civil works and amortization costs, chemicals for pre and post water treatment, energy requirement, brine dissolution and discharge, cooling towers(including electricity and steam), spares and maintenance (including membrane replacement every 5 years), and labour. | (1) 1.27, (2) 1.25, (3) 1.23, (4) 1.22 | [30,31,32,33] |
| (3) Water Meter Installation | Installation of water meters per premise with a rate of 10% annually. | 140 EUR/unit (including installation and maintenance) The same unit cost for all growth scenarios | Installation of Flodis-single jet turbine device) | 0.04 | Municipality of Santa Cruz |
| (4) Rainwater Harvesting | Installation of a household rainwater harvesting tank for indoor and/or outdoor use (2 m3) | Capacity calculated as 4000 m3 (approx. 2000 households) Energy consumption: 2 Kwh/m3 | Water collected from roofs only e. The collected rainwater used for toilet flushing, hand and kitchen basin, showers and outdoor use. The cost includes purchase cost of tank, pumping, delivery and installation, household plumbing, and mains water switching devices, energy consumption, maintenance and pump replacement (every ten years). | 0.21 | [34,35,36] |
| (5) Greywater Recycling | Installation of single house on-site and decentralized greywater treatment using a submerged membrane (MBR), including disinfection unit | Based on household greywater treatment capacity of 350 L capacity and 2000 households; 5 inhabitants per household and 163 Lpcpd d. Flow capacity of 200 L/population equivalent | Greywater collected from kitchen, hand basins and showers, which account to approximately 48% of total water demand). Household treatment assumed with membrane bioreactor plant (biological treatment, aeration, and membrane filtration. Treated greywater used on-site for toilet flushing and outdoor use. | 1.08 | [37,38,39,40,41] |
| (6) Water Demand Reduction f | Reduction of specific demand of municipal water | Reduction from 163 lpcpd d to 120 lpcpd d (assuming 1% annual reduction on water demand starting in year 3, in order to complete the reduction at the end of the planning horizon | Assumed the change of “water tariff” structure to reduce the average specific demand | - | - |
| Population Growth | Baseline | Alternative 1 | Alternative 2 | Alternative 3 | Alternative 4 | Alternative 5 | Alternative 6 |
|---|---|---|---|---|---|---|---|
| Slow | 0.52 | 0.64 | 1.00 | 0.68 | 0.72 | 0.79 | 0.73 |
| Moderate | 0.35 | 0.36 | 1.00 | 0.37 | 0.40 | 0.43 | 0.41 |
| Fast | 0.17 | 0.17 | 0.99 | 0.18 | 0.21 | 0.22 | 0.20 |
| Very Fast | 0.10 | 0.11 | 1.00 | 0.11 | 0.16 | 0.13 | 0.12 |
© 2017 by the authors. Licensee MDPI, Basel, Switzerland. This article is an open access article distributed under the terms and conditions of the Creative Commons Attribution (CC BY) license (http://creativecommons.org/licenses/by/4.0/).
Share and Cite
Reyes, M.F.; Trifunović, N.; Sharma, S.; Behzadian, K.; Kapelan, Z.; Kennedy, M.D. Mitigation Options for Future Water Scarcity: A Case Study in Santa Cruz Island (Galapagos Archipelago). Water 2017, 9, 597. https://doi.org/10.3390/w9080597
Reyes MF, Trifunović N, Sharma S, Behzadian K, Kapelan Z, Kennedy MD. Mitigation Options for Future Water Scarcity: A Case Study in Santa Cruz Island (Galapagos Archipelago). Water. 2017; 9(8):597. https://doi.org/10.3390/w9080597
Chicago/Turabian StyleReyes, Maria Fernanda, Nemanja Trifunović, Saroj Sharma, Kourosh Behzadian, Zoran Kapelan, and Maria D. Kennedy. 2017. "Mitigation Options for Future Water Scarcity: A Case Study in Santa Cruz Island (Galapagos Archipelago)" Water 9, no. 8: 597. https://doi.org/10.3390/w9080597