Different Irrigation Water Requirements of Seed Corn and Field Corn in the Heihe River Basin

1
Key Laboratory of Land Surface Pattern and Simulation, Institute of Geographic Sciences and Natural Resources Research, Chinese Academy of Sciences, 11A Datun Road, Beijing 100101, China
2
International College, University of Chinese Academy of Sciences, Beijing 100049, China
3
College of Resources and Environment, University of Chinese Academy of Sciences, Beijing 100049, China
*
Author to whom correspondence should be addressed.
Water 2017, 9(8), 606; https://doi.org/10.3390/w9080606
Submission received: 24 June 2017
/
Revised: 4 August 2017
/
Accepted: 9 August 2017
/
Published: 18 August 2017
(This article belongs to the Special Issue Sustainable Water Management within Inland River Watershed)
Abstract
:The Heihe River is the second largest river in arid areas of China, and the irrigation water of oasis agriculture in its middle reaches accounts for almost 80% of the water resources in the whole watershed. Corn is the most important crop in the middle reaches of the Heihe River, and its water consumption is about 50% of the total agriculture water consumption of the middle reaches. Therefore, in order to effectively use the water resources in the watershed, it is crucial to improve the efficiency of corn irrigation. In this paper, using the Ganzhou District in the middle reaches of the Heihe River as the study region, we carried out a field survey to obtain characteristics of seed and field corn. Based on our results, we conducted parameter calibration using the CROPWAT model and calculated the irrigation water requirements (IWR) of these two corn types. The irrigation water requirements of seed and field corn in the growing seasons were 470.1 and 488.5 mm, respectively. However, we observed big differences in the water consumption sequences of these two corn types. Prior to mid-July, evapotranspiration and IWR of seed corn were 14.3% and 20.1% higher, respectively, than those of field corn. In September, IWR of the two corn types started to decrease, with a value of 82.3 mm for seed corn, which was 32.1% lower than the IWR of field corn (108.7 mm) during the same period. However, there were no significant differences in the irrigation time and single irrigation amount for seed and field corn in the study area. Since corn is widely cultivated in the Zhangye Region, there is a considerable water-saving potential in agriculture if the irrigation water consumption can be adjusted according to the IWR of the two corn types.
1. Introduction
In arid regions, due to low rainfall conditions and high evaporation, agricultural development heavily depends on irrigation [1]. Irrigation water accounts for over 80% of the total water consumption in such areas [2,3]. Due to the extensive use of surface and ground water for irrigation, the hydrologic cycle of the watershed is greatly changed, which entails a variety of environmental issues, such as downstream cutoff, lake shrinking, underground water decline, natural vegetation decrease, salinization, and sandstorm area expansion [1,2,3,4,5]. Adequate management of irrigation water is, therefore, crucial for the sustainable use of regional water resources [4,5]. According to previous studies, water management needs to be based on the accurate assessment of the agricultural water requirement [6,7].
The calculation of agricultural water requirements is usually based on the measurement of evaporation or evapotranspiration (ET), using various methods [8]. First, ET is obtained based on ground experiment or observation, such as the energy budget (Bowen Ratio, the eddy covariance) method [7,9,10]. Second, some models are used to estimate ET such as the Two-Source Energy Balance Model or the CROPWAT model [7,8,10,11,12,13,14]. Of these, the CROPWAT model is a reliable model to calculate ET [7]. This model has been provided by the United Nations Food and Agriculture Organization (FAO) and can directly output the ET and irrigation water requirements of crops [15].
The Heihe River is the second largest river in arid areas in China, and its oasis in the middle reaches represents an important food base in northwest China. For example, the annual sowing area of the Zhangye Region in the middle reaches is close to 270,000 ha [16]. The development of oasis agriculture heavily depends on water resources. However, annual rainfall in the watershed of the middle reaches of the Heihe River is only 164 mm, whereas annual evaporation can reach up to 1900 mm [17]. As a consequence, the regional agricultural water requirement mainly relies on the use of surface water from the Heihe River or on ground water, and about 90% of the water resources in the watershed are used for irrigation [4,18]. Such an excessive consumption of water resources is the main reason for water consumption issues in the Heihe River basin, the disruption of downstream ecological environments, and the decline of ground water [19]. At present, the depth of the ground water in the Heihe River valley rapidly increases at a rate of 0.5–1.8 m each year [20].
Corn is the most important crop of oasis agriculture in the middle reaches of the Heihe River. Especially since the late 1990s, the Zhangye Region in the middle reaches of the Heihe River has been significantly dependant on the corn seed production industry, which has promoted the transformation of large areas from field corn to seed corn cultivation; the Zhangye Region is currently an important seed corn production area in China. In 2012, the corn fields in the Ganzhou District of Zhangye City covered an area of up to 49,100 hectares, which accounts for 63.3% of the total crop area in this region [16]. In previous studies on oasis agriculture in the Heihe River basin, the focus was put on corn, with extensive research on its water requirement in growing seasons [21], irrigation regimes [22], and other aspects. However, seed corn and field corn were not separately analyzed in these studies. At present, the establishment of crop irrigation quotas in the watershed of the middle reaches of the Heihe River does not distinguish between seed corn and field corn. However, based on the results of on-the-spot investigations, there are obvious differences between seed and field corn. First, the growth stage of seed corn is shorter than that of field corn. Second, the yield of seed corn is lower than that of field corn, and plant height of the former is lower than that of the latter. As a consequence, their water requirements largely differ. Knowledge of the different water requirements of these crops may provide a basis for the development of water saving strategies in corn irrigation and for the improvement of the efficiency of agricultural water use in arid areas.
In this study, based on the results of a field survey, the parameters of the CROPWAT model were first calibrated. Subsequently, we used the Ganzhou District in the middle reaches of the Heihe River as an example to calculate the irrigation water requirement curves and irrigation water amounts of seed and field corn, using a day as the time step. Our results provide a scientific basis for the establishment of improved corn irrigation strategies, thereby enhancing water use efficiency.
2. Materials and Methods
The Ganzhou District is located at 100°27′ east longitude and 38°56′ north latitude, in the middle reaches of the Heihe River Basin (Figure 1). The climate is continental, with an annual average temperature of 7.5 °C. Annual rainfall and annual evaporation capacities are about 136.8 and 1840.1 mm, respectively [16]. The Ganzhou District is the main agricultural county of Zhangye City, with corn being the most important crop. In 2012, the district produced 53.7% of the total seed corn yield and 28.1% of the total field corn yield of Zhangye City, with an annual corn output of up to 340,000 t. Ganzhou District covers an area of 4240, 575 km2 are cultivated.
2.1. Data Sources and Data Processing
Meteorological data were obtained from the China Meteorological Data Sharing Service Network. We used daily meteorological observation data from the Zhangye station in 2012; the anemometer was located 10 m above the ground. According to the requirements of the CROPWAT model, the wind speed values at the Zhangye station were converted via the logarithmic wind profile relationship:
where u2 is the wind speed (m/s) at 2 m above the earth surface; uz is the wind speed (m/s) at z m above the earth surface; and z is the height above the earth surface where the wind speed was measured. On the basis of Equation (1), the wind speed conversion factor at 10 m above the earth surface is 0.748.
Crop parameters were derived from the data of the on-the-spot questionnaire survey. The on-the-spot survey involved eight villages in the Ganzhou District, covering a total of 83 households; the evaluated parameters are summed up in Table 1, including sowing date, length of the growth stage, root depth, and plant height. For instance, according to the survey data, the root depth and plant height of seed corn are shorter or lower than those of field corn. The plant height of field corn in the study area equals the recommended value by the FAO-56.
2.2. Research Methods
2.2.1. Introduction of the CROPWAT Model
The CROPWAT model was developed by the Department of Land and Water Resources of FAO. Its basic functions include: (1) calculating the reference ET (ET0); (2) calculating the ET of the crop; (3) calculating the irrigation water requirement of the crop; and (4) formulating and evaluating the irrigation regime. The applicability of the simulation on the ET by this model has been verified under different irrigation conditions in northwest arid regions of China by several studies. In this study, we mainly used the Crop Water Requirement (CWR) module of the model to calculate the ET and irrigation water requirement of the crop during the growth period.
The calculation flowchart of the CWR module is illustrated in Figure 2. First, combined with the local meteorological data, the ET0 is calculated based on the Penman-Monteith (P-M) formula. Subsequently, the ET of the crop is derived by the single crop coefficient method via the crop coefficient during each growth stage. Finally, by calculating the effective rainfall by the United States Department of Agriculture (USDA) method, the crop irrigation water requirement can be obtained from the differences between the actual crop evapotranspiration and the effective rainfall amount.
2.2.2. Calculation of the Reference ET
ET0 is a climatic parameter, which can be calculated from weather data. This parameter can be used to measure the evaporating power of the atmosphere, without considering the crop characteristics and soil factors. The CROPWAT model uses the P-M formula to calculate ET0. This formula can provide relatively accurate calculation results under both arid and humid climate conditions [23]. The model can calculate ET0 using three kinds of time steps, i.e., day, decade, and month. Since related research has shown that this model provides better results for the calculation of ET0 using day as the time step based on the P-M formula method [23], we calculated the ET0 based on the time step of one day.
2.2.3. Calculation of the ET of the Crop
The CROPWAT model uses the single crop coefficient method to calculate ET via the following formula:
where Kc is the crop coefficient.
The CROPWAT model divides the crop growth into four different growth stages, including initial growth stage, rapid growth stage, middle growth stage, and end growth stage. Different growth stages correspond to different crop coefficient Kc values, and the crop coefficient values at the initial, middle, and end growth stage (Kcini, Kcmid, and Kcend, respectively) are required in the CROPWAT model. The FAO-56 provides the reference values of Kcini, Kcmid, and Kcend for different crops. In arid regions without rainfall events at the initial growth stage, the Kcini values can refer to the value recommended by the FAO-56, while Kcmid and Kcend should be corrected according to the actual climate conditions and crop characteristics in the study area. Taking the middle growth stage as an example, the corrected formula is:
where is the . value recommended by the FAO-56; u2 is the daily average wind speed (m/s) at 2 m above the earth surface at the middle growth stage; . is the daily average minimum relative humidity at the middle growth stage (%), 20% < < 80%; h is the average height of the crop at the middle growth stage (m).
In the study area, there was no rainfall event during the corn planting at the initial stage in 2012; therefore, the Kcini values of the two kinds of corn both adopt the values recommended by the FAO-56. The Kcmid and Kcend values of seed corn and the Kcmid value of field corn are corrected using the same method with Equation (4). For the field corn in the study area, the grain moisture content was less than 18% at harvest; therefore, the Kcend value adopts the recommended value of 0.35 by the FAO-56, without further revision.
In addition, the field survey showed that mulching layers were used in the study area. Hence, according to the correction suggestions of the FAO-56 regarding the crop coefficient under mulching conditions, the crop coefficients of the two types of corn are corrected again. Finally, the crop coefficients of seed corn and field corn at each growth stage can be obtained as shown in Table 2.
2.2.4. Calculation of Effective Rainfall and Irrigation Water Requirement
Effective precipitation can be calculated by the soil conservation service method of USDA, using the following formula:
where Peff is the effective precipitation (mm) and P is the total precipitation (mm).
The irrigation water requirement adopts the difference of the crop evapotranspiration and the effective precipitation, using the following formula:
2.2.5. The ET Measurements
To verify the simulation results, this study used the ET measurements, calculated from the continuous 30-min latent heat flux (LE) data, based on the nonlinear regression method. Liu et al. introduced this dataset in detail and calculation process [24]. The LE data was measured by the eddy covariance method, and the eddy correlated data were obtained from the Heihe Data Center [24,25,26].
3. Results and Discussion
3.1. Simulation and Verification of Corn Evapotranspiration
Based on the daily meteorological data and the corrected crop parameters at Zhangye station, we used the CROPWAT model to separately estimate the ET values of seed corn and field corn during the growth period of 2012 in the oasis farmland of the Ganzhou District. To verify the simulation results, we analyzed the results obtained from the model using the ET measurements by the eddy covariance method. Since the underlying surface of the vortex viewer was the seed corn, the measured eddy correlated data were compared with the ET value of seed corn simulated by the model. The results show that the variation rule of simulated ET values by the CROPWAT model is basically consistent with that of the measured ET values. The determination coefficient R2 was 0.73, and the average relative error (RE) was 11%. Previous research has indicated that there are usually energy balance errors for the crop ET data measured by the eddy covariance method [27,28]. In the study area, flooding irrigation is widespread and irrigation is sufficient, and the ET of the corn farmland may even be equivalent to the water area ET during the irrigation period [29], which means that the measured ET may be higher than the simulated ET. In this article, based on the CROPWAT model, the simulated ET values of seed corn and field corn were 3.5 and 3.45 mm/day respectively, which are in agreement with previous findings. Previous research generally considers that the average ET values of corn vary between 3.2 and 4.1 mm/day during the growing season [30,31].
3.2. Variation Rules of Irrigation Water Requirement of Corn
Figure 3 and Figure 4 show the decadal ET, effective precipitation, and IWR of seed corn and field corn during the growth period simulated by the CROPWAT model. The variation curves of ET and IWR for seed corn and field corn were similar during the growth period.
Figure 3 shows that from sowing time to early May, the ET values of seed corn and field corn were both smaller. This could mainly be attributed to the absence of crop coverage at this stage. Thus, soil evaporation plays a dominant role in the total evaporation at this stage, whereas mulching decreases total ET. From the middle of May, the ET values of both seed corn and field corn presented a significant increasing trend, and the ET value of seed corn was larger than that of field corn. From early July, the ET value of seed corn started to decrease slightly, while that of field corn still increased. From mid-July, the ET values of seed corn and field corn were relatively similar and from early September, the ET values of both corn types started to decline (Figure 3).
The variation curves of the IWR for these two types of corn were similar to those of the ET. In particular, the IWR and ET peaked in late August and then rapidly declined. Because of the influence of effective precipitation, the IWR curves are more complex and their fluctuations were more obvious; in some places, IWR values were even negative.
3.3. Differences in Irrigation Water Requirement of Seed Corn and Field Corn
Across the entire growth period, the IWR values of seed corn and field corn were 470.1 and 488.5 mm, respectively, with no significant difference. However, there was a big difference in the water requirement time sequence for seed corn and field corn. Prior to mid-July, the ET and IWR values of seed corn were 14.3% and 20.1% higher, respectively, than those of field corn. From mid-July to August, the IWR values of both types of corn were relatively high, with only small differences. In September, the IWR values of both corn types started to decline, with significant differences. The IWR value of seed corn was 82.3 mm, which is 32.1% lower than that of field corn at the same period (108.7 mm).
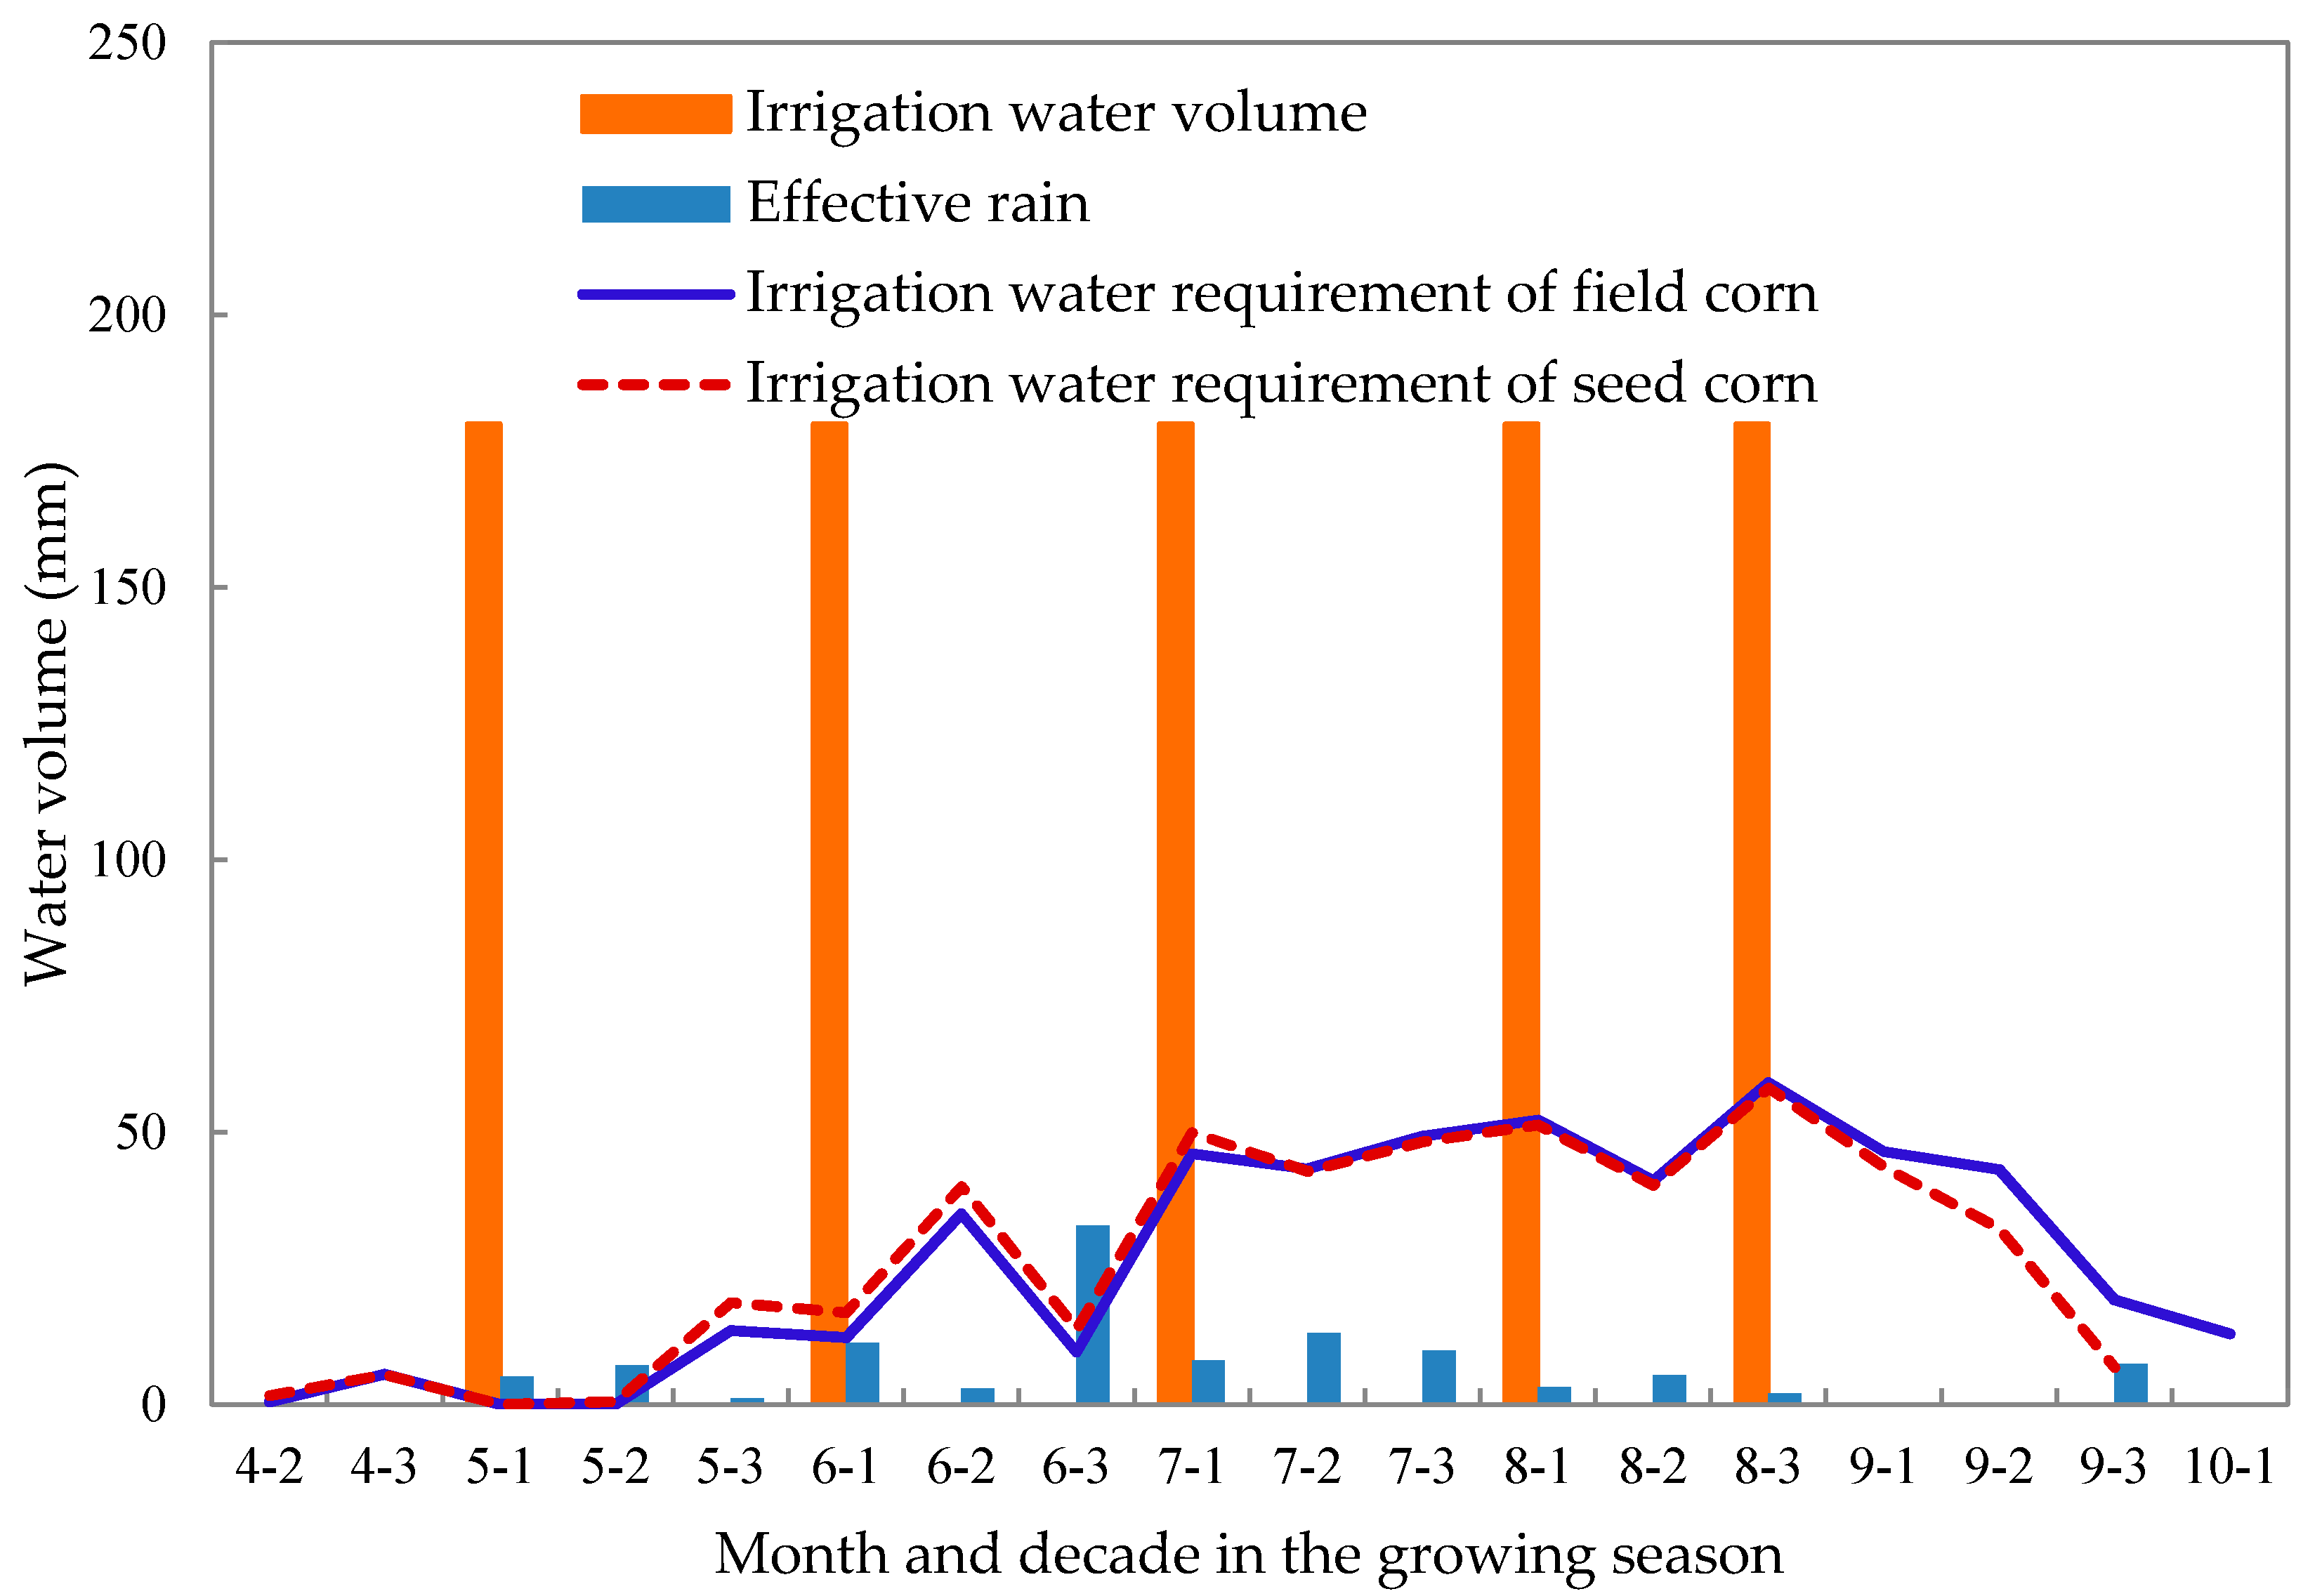
However, according to the Annual Report provided by the Heihe River Bureau in Zhangye City, seed corn and field corn have the same irrigation quota. Based on the results of our field survey, irrigation time and single irrigation amount did not significantly differ between seed corn and field corn in the Ganzhou District. The corn was irrigated five times during the growth period, with a single irrigation amount of 180 mm, resulting in a total irrigation amount of 900 mm (Figure 5). In early May 2012, since the effective precipitation had met the water requirement of the crop, the IWR of the corn was negative. However, irrigation was still provided, with an amount of 180 mm.
The corn irrigation schedule is mainly associated with the rotational irrigation system in this region. In the study area, the irrigation quota was converted into water diversion time and subsequently draws off water to the irrigation areas [32]. Considering the obvious difference in the water requirement time sequences of seed corn and field corn, it is suggested that the irrigation regime of corn in the middle reaches of the Heihe River should be adjusted accordingly. Prior to mid-July, the irrigation water consumption of seed corn should be higher than that of field corn, while after mid-September, the irrigation water consumption should follow the opposite trend. Considering that corn is widely planted in Zhangye, the agricultural water-saving potential could be high if the irrigation water consumption of these two types of corn can be adequately adjusted according to their water requirement characteristics.
In addition, the irrigation amount in the study area is far higher than the actual crop water requirement. In Ganzhou District, the method of choice for corn irrigation is usually flooding irrigation, which has a low water use efficiency [2]. In the actual irrigation, because the rotational irrigation method is adopted, the irrigation areas are irrigated successively according to the water supply time. Thus, the irrigation amount not only depends on the irrigation time, but is also related to the water flow. Therefore, in practice, it is difficult to control the irrigation amount, and the actual irrigation water amount is often greater than the irrigation quota. A similar study has calculated a crop irrigation quota of 820 mm/ha for the Ganzhou District, although the actual water irrigation amount was about 1330 mm, which was 60% higher than the crop irrigation quota [32]. Other studies have also discovered that the agricultural irrigation water in some arid regions in the Hexi Corridor in China was up to 1100 mm [20]. This means that in some cases, the irrigation amount in the study area is far higher than the crop water requirement, indicating a large water-saving potential.
4. Conclusions
In this research, the related parameters of the CROPWAT model were adjusted using field survey data and local climate data. This adjusted model was then employed to simulate the evapotranspiration and irrigation water requirements of seed corn and field corn in the Ganzhou District. We can draw the following conclusions:
The calibrated CROPWAT model can adequately simulate the evapotranspiration amount of corn, and the simulated evapotranspiration curve is similar to the measured evapotranspiration curve.
Across the entire growth period, the irrigation amount in the study area exceeded the crop water requirement and water use efficiency was low. As for the irrigation time sequence, from sowing to early July, the irrigation water requirement of seed corn was 146.8 mm, which is 16.8% higher than that of field corn (122.2 mm). From September, the irrigation water requirement of the two corn types started to decline. However, during this period, there were big differences in irrigation water requirements for the two corn types. The requirement of seed corn was 82.3 mm, which is 32.1% lower than that of field corn at the same period (108.7 mm). Therefore, the irrigation quota of corn irrigation in the Ganzhou District should be adjusted to the actual requirements, which would allow the establishment of irrigation quotas for seed and field corn, respectively. This means than from sowing to early July, the actual irrigation amount of seed corn should be higher than that of field corn, while from mid-July, an opposite irrigation pattern should be followed.
Acknowledgments
This work was supported by the Natural Science Foundation of China (Grant No. 91325302).
Author Contributions
Minghong Tan and Luqian Zheng collected and analyzed the data and ran the CROPWAT model; Minghong Tan and Luqian Zheng wrote the paper.
Conflicts of Interest
The authors declare no conflict of interest.
References
- Tanji, K.K.; Kielen, N.C. Agricultural Drainage Water Management in Arid and Semi-Arid Areas; Food and Agriculture Organization of the United Nations: Rome, Italy, 2002; pp. 1–205. [Google Scholar]
- Wang, G.F.; Chen, J.C.; Wu, F.; Li, Z.H. An integrated analysis of agricultural water-use efficiency: A case study in the Heihe River Basin in Northwest China. Phys. Chem. Earth 2015, 89–90, 3–9. [Google Scholar] [CrossRef]
- Hamdy, A.; Ragab, R.; Scarascia-Mugnozza, E. Coping with water scarcity: Water saving and increasing water productivity. Irrig. Drain. 2003, 52, 3–20. [Google Scholar] [CrossRef]
- Sun, T.H.; Wang, J.X.; Huang, Q.Q.; Li, Y.R. Assessment of water rights and irrigation pricing reforms in Heihe River Basin in China. Water 2016, 8, 333. [Google Scholar] [CrossRef]
- Huang, Q.Q.; Wang, J.X.; Li, Y.M. Do water saving technologies save water? Empirical evidence from North China. J. Environ. Econ. Manag. 2017, 82, 1–16. [Google Scholar] [CrossRef]
- Masafu, C.K.; Trigg, M.A.; Carter, R.; Howdend, N.J.K. Water availability and agricultural demand: An assessment framework using global datasets in a data scarce catchment, Rokel-Seli River, Sierra Leone. J. Hydrol. Reg. Stud. 2016, 8, 222–234. [Google Scholar] [CrossRef]
- Zheng, X.; Zhu, J.J.; Yan, Q.L.; Song, L.N. Effects of land use changes on the groundwater table and the decline of Pinus sylvestris var. mongolica plantations in southern Horqin Sandy Land, Northeast China. Arg. Water Manag. 2012, 109, 94–106. [Google Scholar] [CrossRef]
- Li, J.; Zhu, T.; Mao, X.M.; Adeloye, A.J. Modeling crop water consumption and water productivity in the middle reaches of Heihe River Basin. Comput. Electron. Agric. 2016, 123, 242–255. [Google Scholar] [CrossRef]
- Uddin, J.; Hancock, N.H.; Smith, R.J.; Foley, J.P. Measurement of evapotranspiration during sprinkler irrigation using a precision energy budget (Bowen ratio, eddy covariance) methodology. Agric. Water Manag. 2013, 116, 89–100. [Google Scholar] [CrossRef]
- Zhuang, Q.F.; Wu, B.F. Estimating evapotranspiration from an improved two-source energy balance model using ASTER satellite imagery. Water 2015, 7, 6673–6688. [Google Scholar] [CrossRef]
- Li, S.; Kang, S.Z.; Zhang, L.; Zhang, J.H.; Du, T.S.; Tong, L.; Ding, R.S. Evaluation of six potential evapotranspiration models for estimating crop potential and actual evapotranspiration in arid regions. J. Hydrol. 2016, 543, 450–461. [Google Scholar] [CrossRef]
- Li, X.M.; Lu, L.; Yang, W.F.; Cheng, G.D. Estimation of evapotranspiration in an arid region by remote sensing—A case study in the middle reaches of the Heihe River Basin. Int. J. Appl. Eart Obs. Geoinf. 2012, 17, 85–93. [Google Scholar] [CrossRef]
- Luo, X.; Wang, K.; Jiang, H.; Sun, J.; Zhu, Q. Estimation of land surface evapotranspiration over the Heihe River basin based on the revised three-temperature model. Hydrol. Process 2012, 26, 1263–1269. [Google Scholar] [CrossRef]
- Jarchow, C.J.; Nagler, P.L.; Glenn, E.P.; Ramírez-Hernandez, J.; Rodríguez-Burgueño, E. Evapotranspiration by remote sensing: An analysis of the Colorado River Delta before and after the Minute 319 pulse flow to Mexico. Ecol. Eng. 2016. [Google Scholar] [CrossRef]
- Land and Water Development Division of Food and Agriculture Organization (LWD-FAO). 2009. Available online: http://www.fao.org/land-water/databases-and-software/cropwat/en/ (accessed on 18 March 2013).
- Zhangye’s Statistical Bureau. Zhangye’s Statistical Yearbook in 2012; Zhangye’s Statistical Bureau: Zhangye, China, 2012. [Google Scholar]
- Chen, Y.; Zhang, D.Q.; Sun, Y.B.; Lin, X.N.; Wang, N.Z.; Savenije, H.H.G. Water requirement management: A case study of the Heihe River Basin in China. Phys. Chem. Earth 2005, 30, 408–419. [Google Scholar] [CrossRef]
- Yang, B.; Wen, X.F.; Sun, X.M. Irrigation depth far exceeds water uptake depth in an oasis cropland in the middle reaches of Heihe River Basin. Sci. Rep. 2015, 5. [Google Scholar] [CrossRef] [PubMed]
- Wang, J.F.; Gao, Y.C.; Wang, S. Land use/cover change impacts on water table change over 25 years in a desert-oasis transition zone of the Heihe River Basin, China. Water 2016, 8, 11. [Google Scholar] [CrossRef]
- Chai, Q.; Gan, Y.T.; Turner, N.C.; Zhang, R.Z.; Yang, C.; Niu, Y.N.; Siddique, K.H.M. Water-saving innovations in Chinese agriculture. Adv. Agron. 2014, 126, 149–201. [Google Scholar] [CrossRef]
- Zhao, L.W.; Zhao, W.Z.; Ji, X.B. Division between transpiration and evaporation, and crop water consumption over farmland within oases of the middlestream of Heihe River basin, Northwestern China. Acta Ecol. Sin. 2015, 35, 1114–1123. [Google Scholar] [CrossRef]
- Li, D.S.; Ji, X.B.; Zhao, L.W. Simulation of seed corn farmland soil moisture migration regularity in the midstream of the Heihe River Basin. Arid Zone Res. 2015, 32, 467–475. [Google Scholar] [CrossRef]
- Allen, R.G.; Pereira, L.S.; Raes, D.; Smith, M. FAO Irrigation and Drainage Paper No. 56; Food and Agriculture Organization of the United Nations: Rome, Italy, 1998. [Google Scholar]
- Liu, S.M.; Xu, Z.W.; Zhao, Q.Y.; Xu, T.R.; Ge, Y.; Ma, Y.F.; Song, L.S.; Zhu, Z.L.; Jia, Z.Z.; Zhang, F. Upscaling evapotranspiration measurements from multi-site to the satellite pixel scale over heterogeneous land surfaces. Agric. For. Meteorol. 2016, 230–231, 97–113. [Google Scholar] [CrossRef]
- Xu, Z.W.; Liu, S.M.; Li, X.; Shi, S.J.; Wang, J.; Zhu, Z.L.; Xu, T.R.; Wang, W.Z.; Ma, M.G. Intercomparison of surface energy flux measurement systems used during the HiWATER-MUSOEXE. J. Geophys. Res-Atmos. 2013, 118, 13140–13157. [Google Scholar] [CrossRef]
- Liu, S.M.; Xu, Z.W.; Wang, W.Z.; Jia, Z.Z.; Zhu, M.J.; Bai, J.; Wang, J.M. A comparison of eddy-covariance and large aperture scintillometer measurements with respect to the energy balance closure problem. Hydrol. Earth Syst. Sci. 2011, 15, 1291–1306. [Google Scholar] [CrossRef]
- Wolf, A.; Saliendra, N.; Akshalov, K.; Johnson, D.A.; Laca, E. Effects of different eddy covariance correction schemes on a energy balance closure and comparisons with the modified Bowen ratio system. Agric. For. Meteorol. 2008, 148, 942–952. [Google Scholar] [CrossRef]
- Shi, T.T.; Guan, D.X.; Wu, J.B.; Wang, A.Z.; Jin, C.J.; Han, S.J. Comparison of methods for estimating evapotranspiration rate of dry forest canopy: Eddy covariance, Bowen ratio energy balance, and Penman-Monteith equation. J. Geophys. Res-Atmos. 2008, 113. [Google Scholar] [CrossRef]
- Li, Z.S.; Jia, L.; Hu, G.C.; Lu, J.; Zhang, J.; Chen, Q.T.; Wang, K. Estimation of growing season daily ET in the middle stream and downstream areas of the Heihe River Basin using HJ-1 data. IEEE Geosci. Remote Sens. Lett. 2015, 12, 948–952. [Google Scholar]
- Zhao, L.W.; Ji, X.B. Quantification of transpiration and evaporation over agricultural field using the FAO-56 dual crop coefficient approach-A case study of the maize field in an oasis in the middlestream of the Heihe River Basin in northwest China. Sci. Agric. Sin. 2010, 43, 4016–4026. [Google Scholar]
- Wu, J.K.; Ding, Y.J.; Wang, G.X.; Yamazaki, Y.; Kubota, J. Evapotranspiration of seed maize field in arid region. J. Irrig. Drain. 2007, 26, 14–17. [Google Scholar]
- Shi, M.J.; Wang, L.; Wanng, X.J. A study on changes and driving factors of agricultural water supply and demand in Zhangye after water reallocation of the Heihe River. Resour. Sci. 2011, 33, 1489–1497. [Google Scholar]
Figure 1.
Location map of the study area.
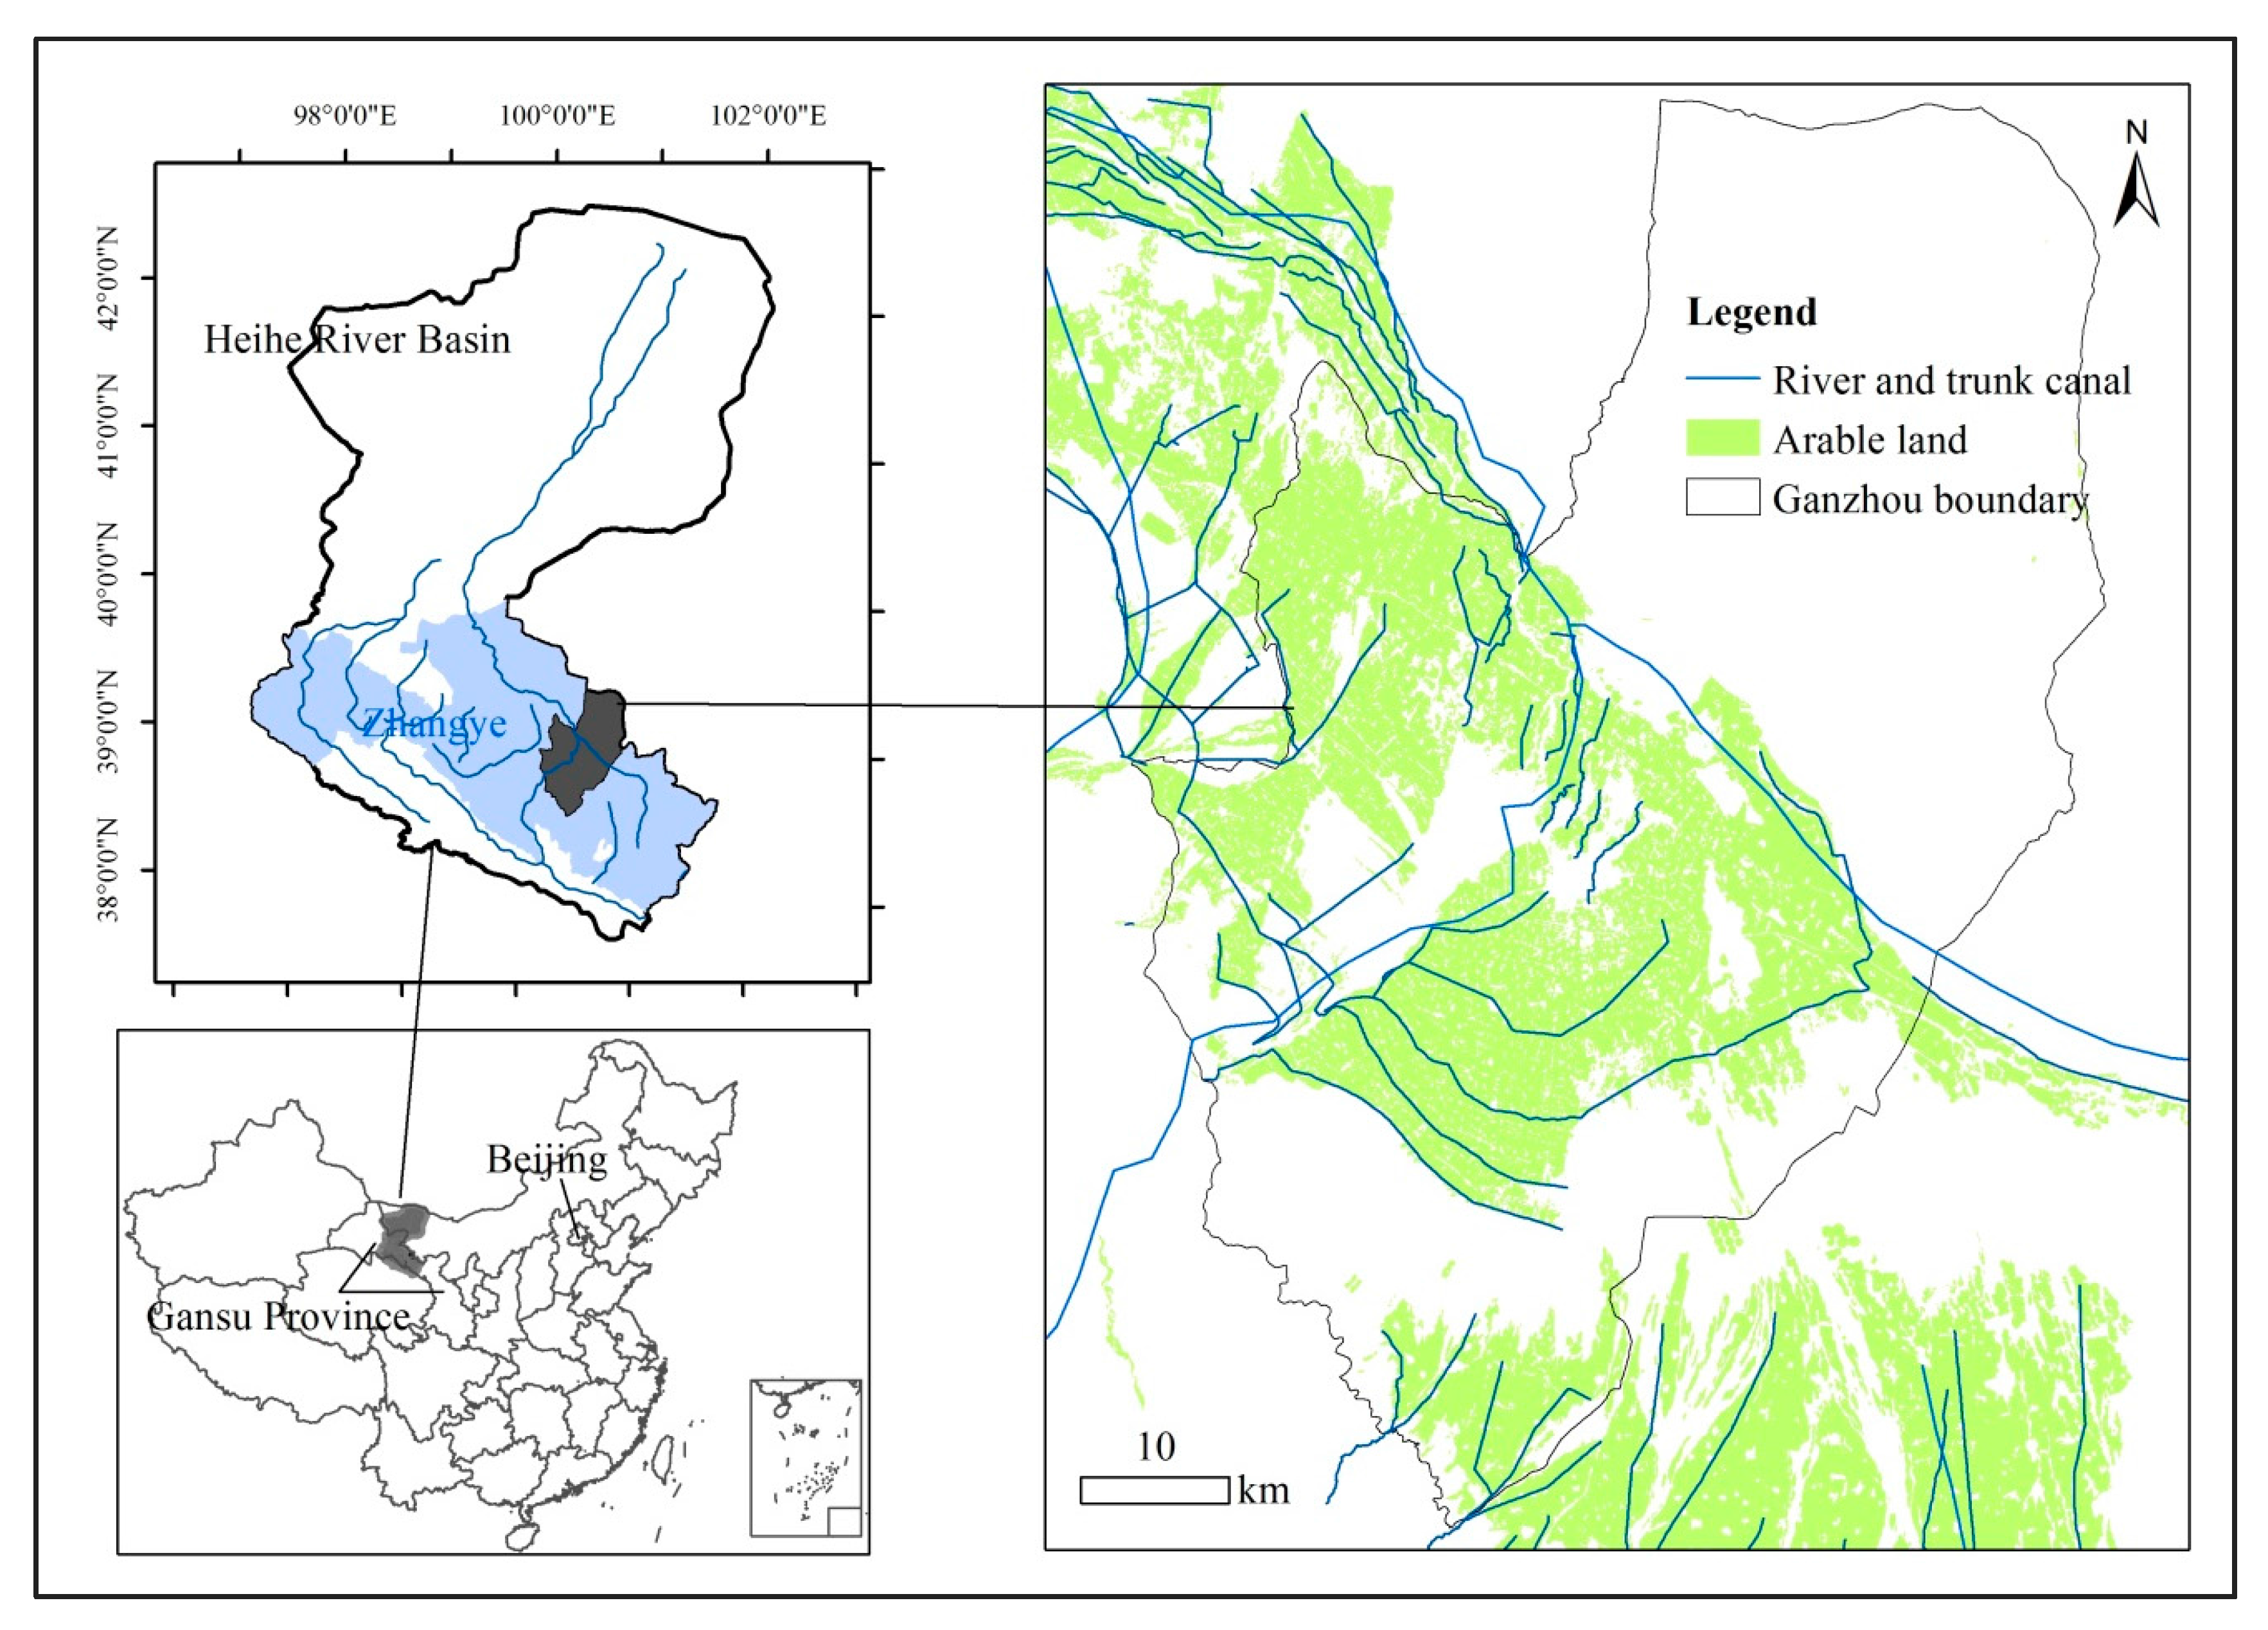
Figure 2.
Flowchart describing the Crop Water Requirement (CWR) technique.
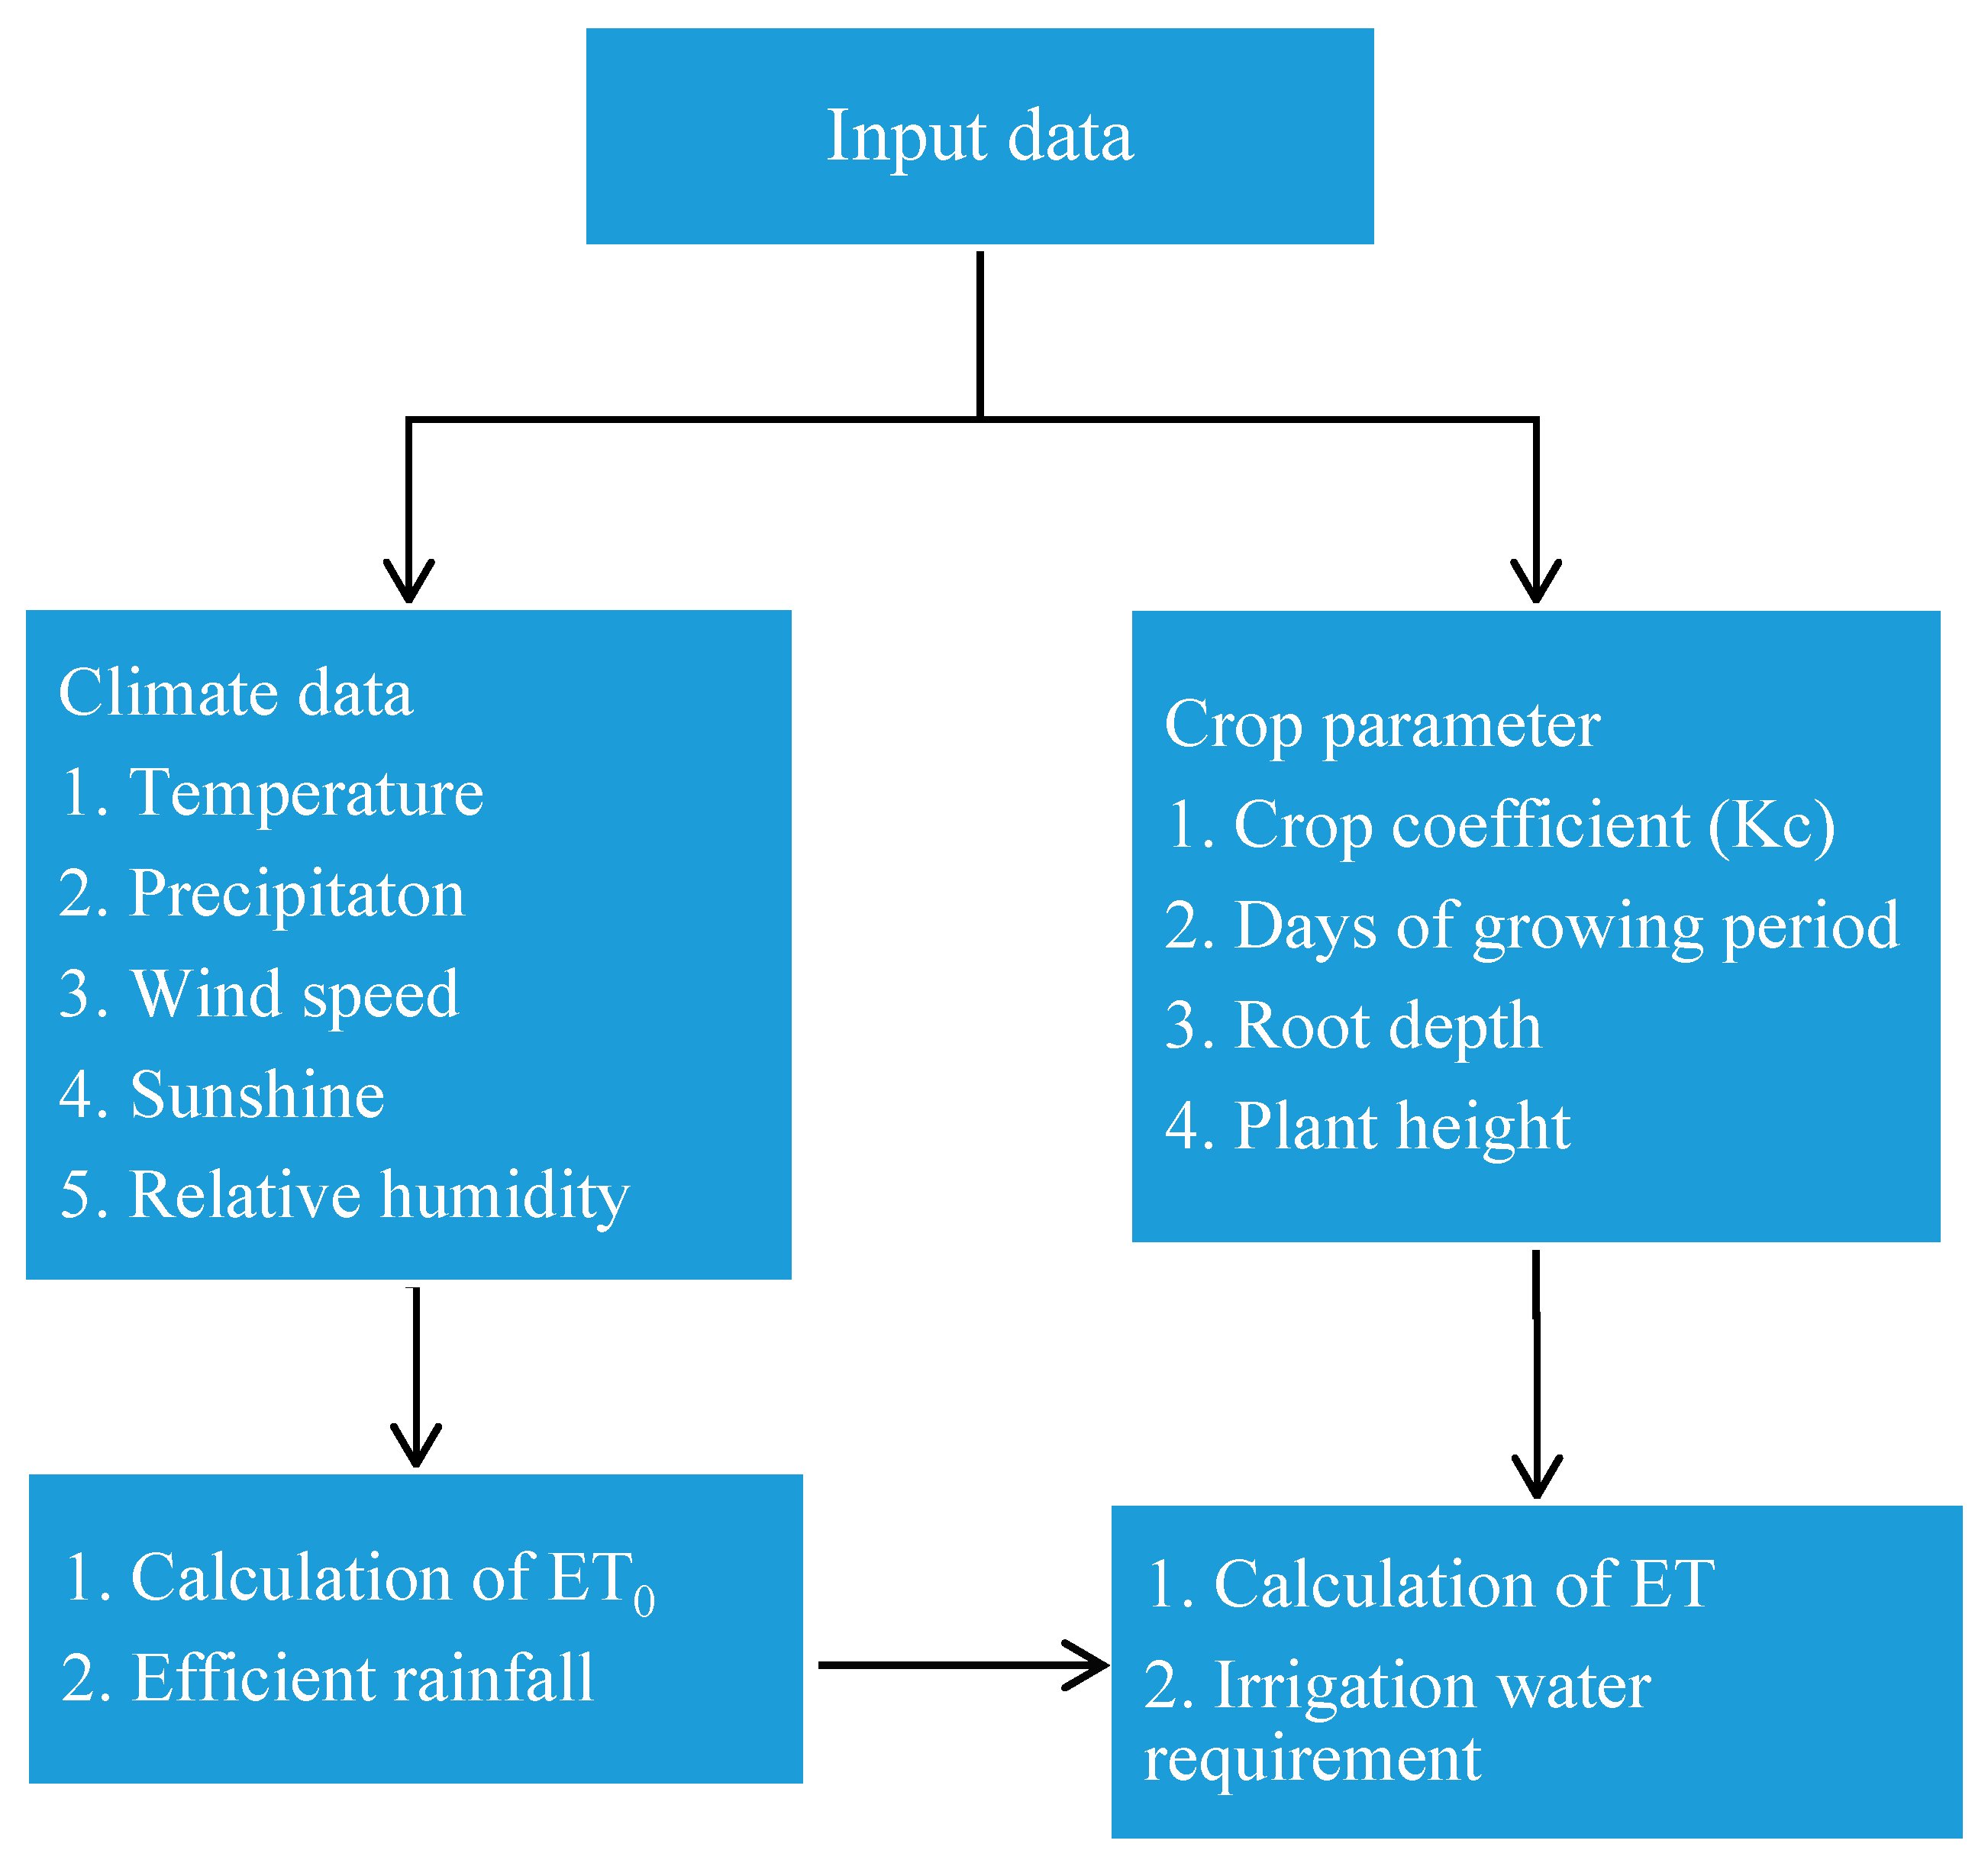
Figure 3.
Decadal evapotranspiration of seed corn and field corn. Note: In the horizontal axis, figures before and after the hyphen represent month and decade, respectively. For instance, 5-1, 5-2, and 5-3 represent early May, mid-May, and late May.
Figure 3.
Decadal evapotranspiration of seed corn and field corn. Note: In the horizontal axis, figures before and after the hyphen represent month and decade, respectively. For instance, 5-1, 5-2, and 5-3 represent early May, mid-May, and late May.
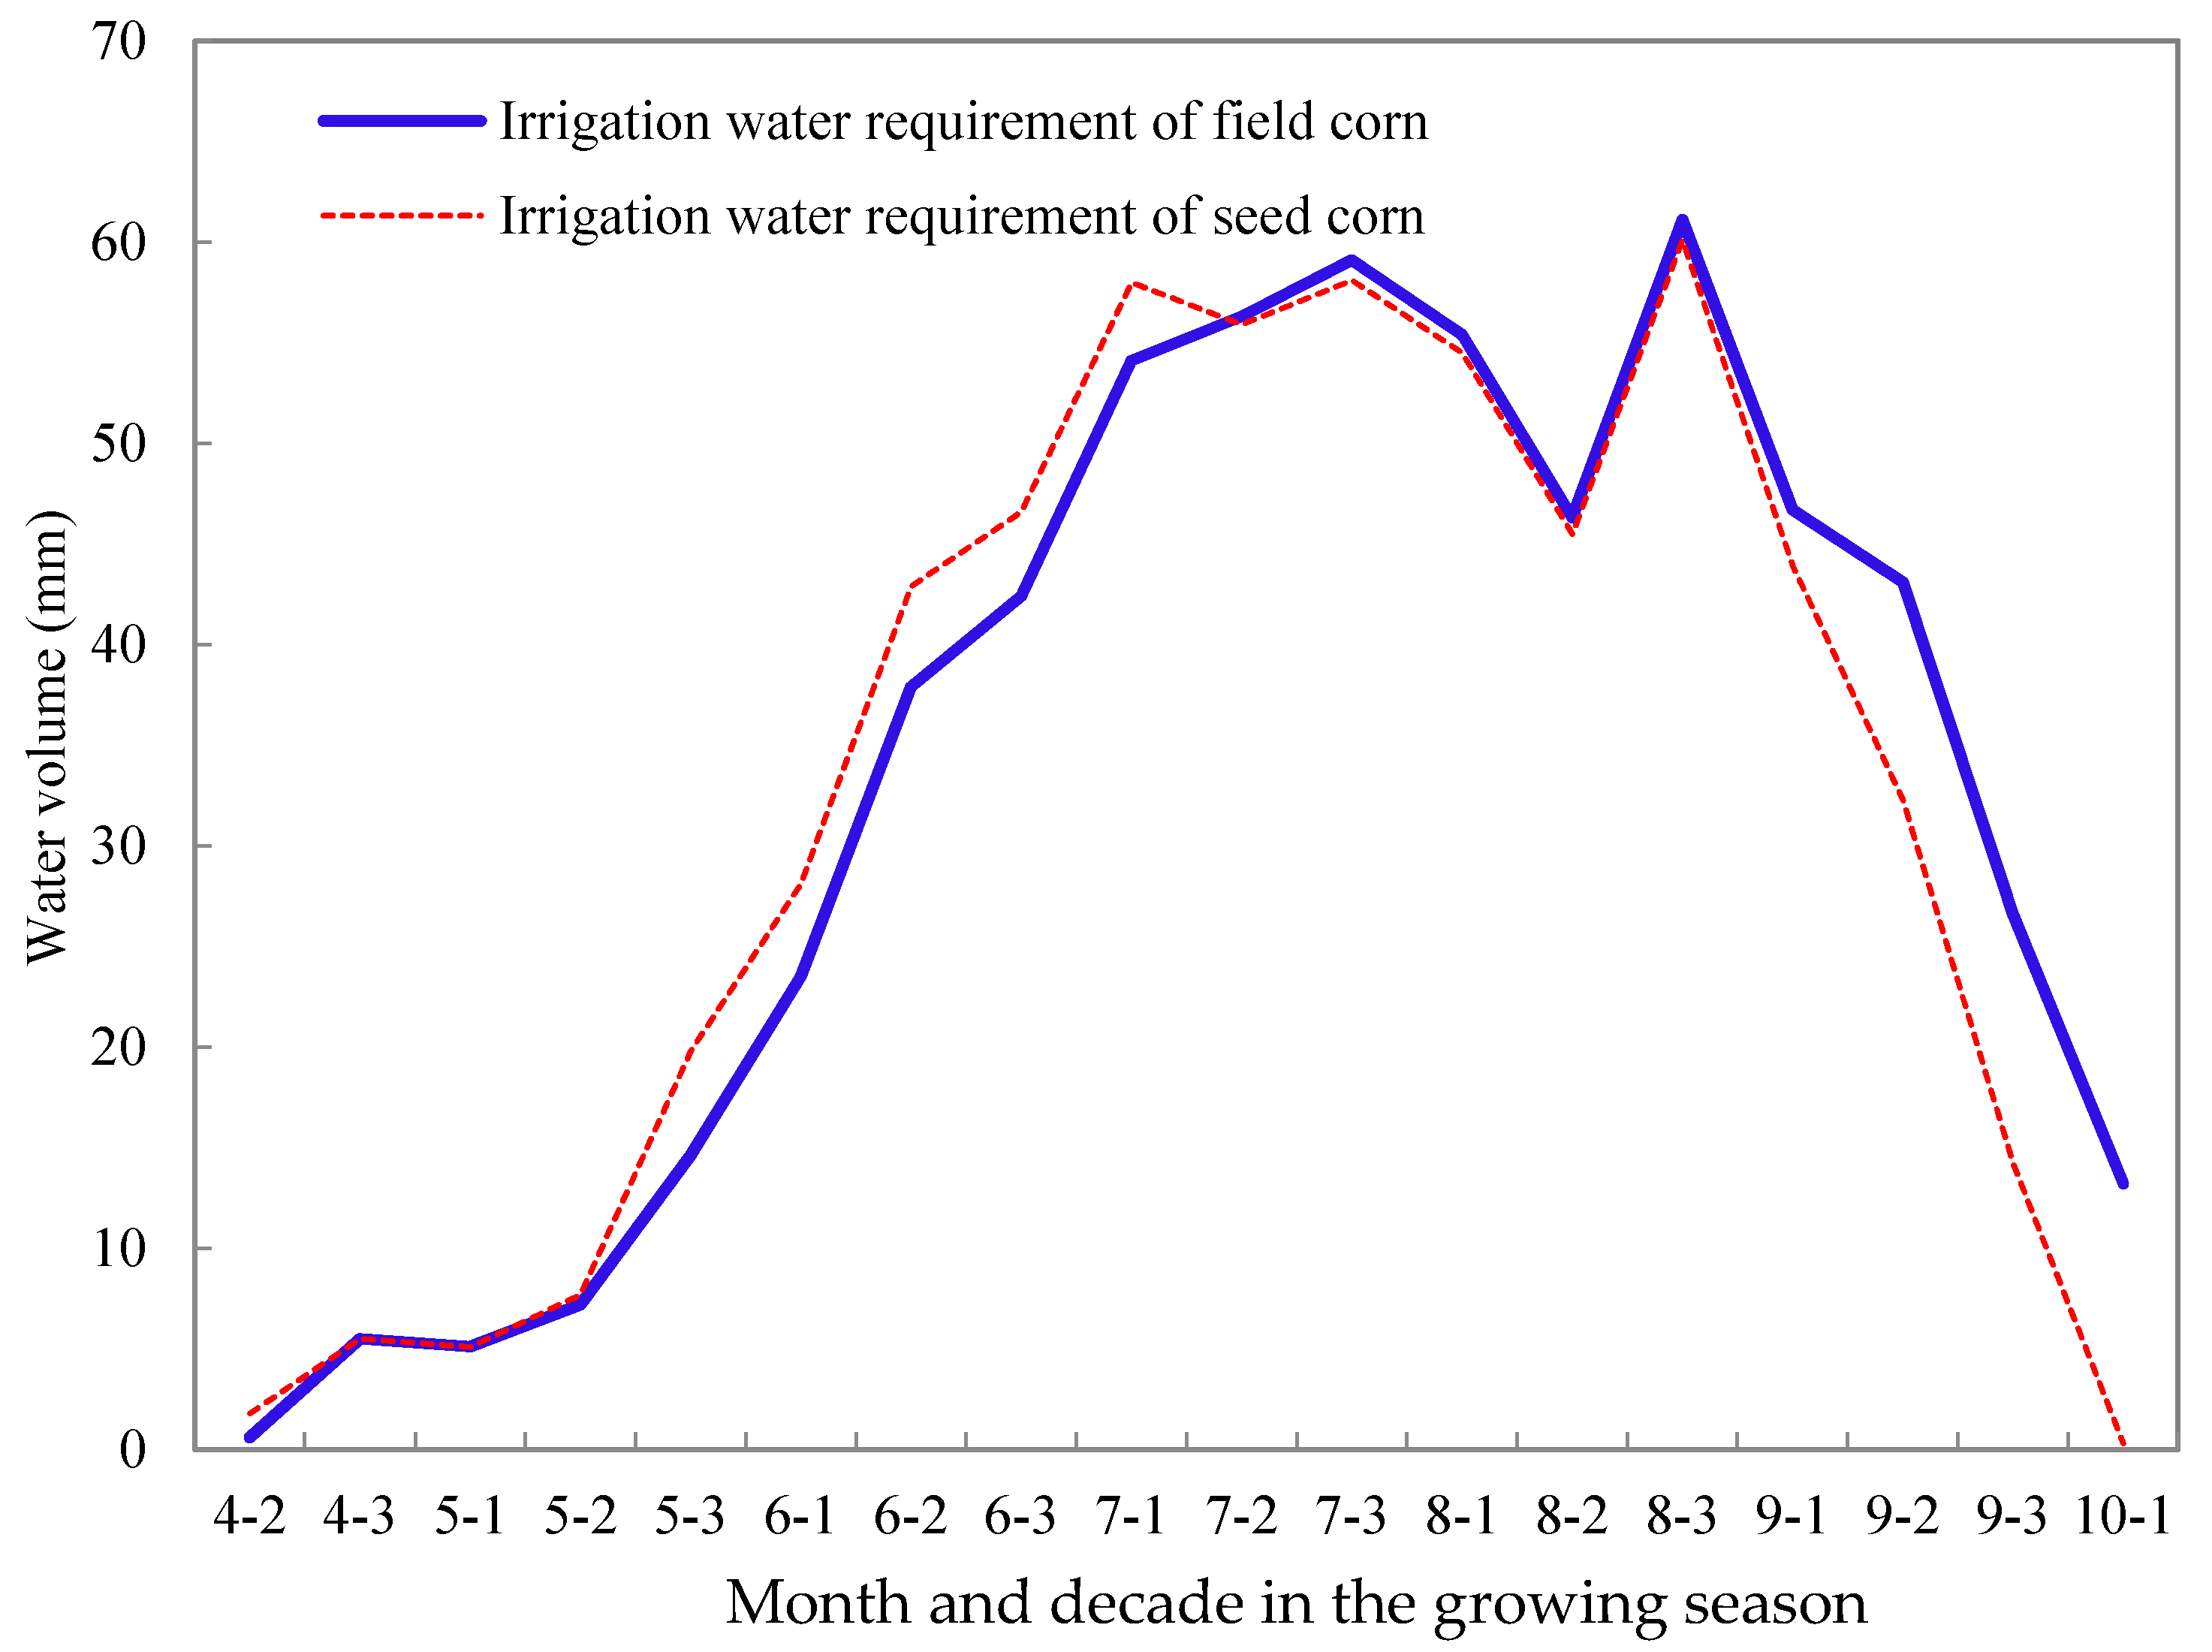
Figure 4.
Irrigation water requirements of seed corn and field corn. Note: The meanings of figures in the horizontal axis are similar to those in Figure 3.
Figure 4.
Irrigation water requirements of seed corn and field corn. Note: The meanings of figures in the horizontal axis are similar to those in Figure 3.
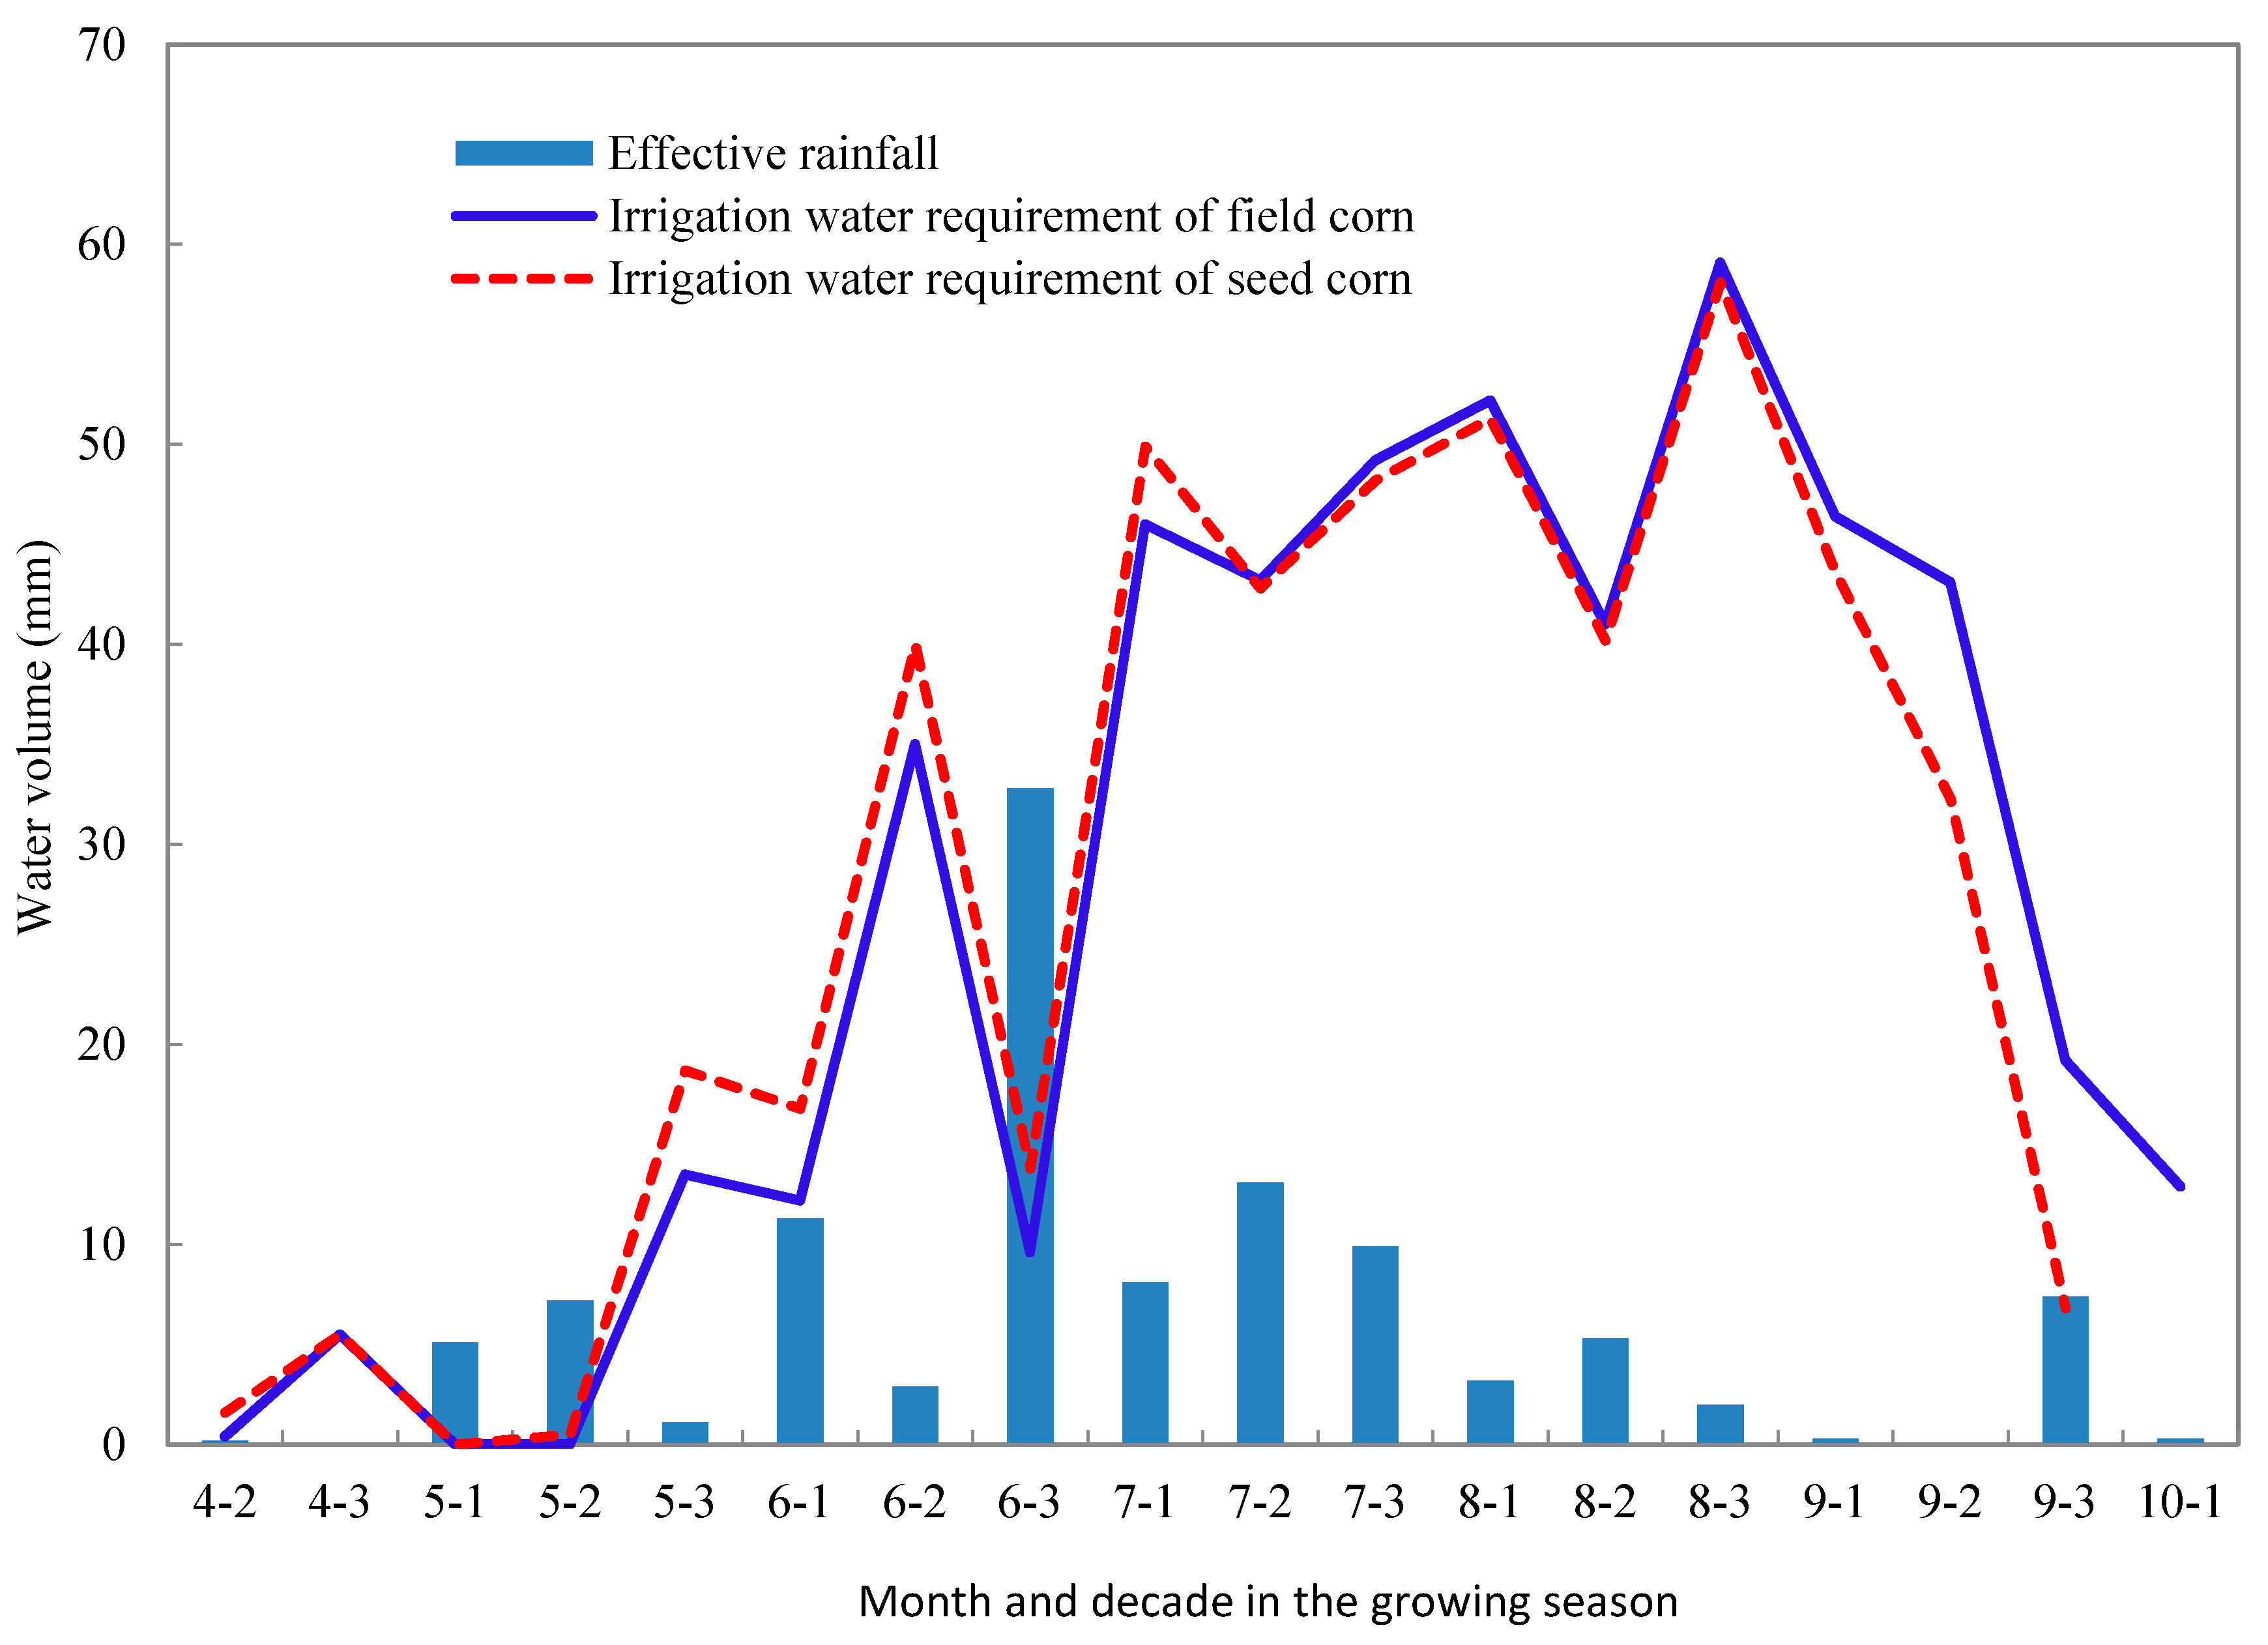
Figure 5.
Irrigation water requirement and actual irrigation water consumption of corn during the growth period. Note: The meanings of figures in the horizontal axis are similar to those in Figure 3.
Figure 5.
Irrigation water requirement and actual irrigation water consumption of corn during the growth period. Note: The meanings of figures in the horizontal axis are similar to those in Figure 3.


Table 1.
Crop parameters of seed corn and field corn.
| Crop | Sowing Date | Length of the Growth Stage (Days) | Root Depth (m) | Plant Height (m) | ||||
|---|---|---|---|---|---|---|---|---|
| Initial Growth Stage | Rapid Growth Stage | Middle Growth Stage | End Growth Stage | Initial Root Depth | Grown Root Depth | |||
| Seed corn | 15 April | 30 | 56 | 57 | 21 | 0.6 | 1.5 | 1.8 |
| Field corn | 20 April | 30 | 56 | 67 | 21 | 0.6 | 2.3 | 2.5 |
Table 2.
Corrected values of crop coefficients.
| Crop Types | Crop Coefficients | ||
|---|---|---|---|
| Kcini | Kc mid | Kc end | |
| Seed corn | 0.1 | 1.02 | 0.56 |
| Field corn | 0.1 | 1.03 | 0.38 |
Note: Kcini, Kc mid, and Kc end were the crop coefficient values at the initial, middle, and end growth stage.
© 2017 by the authors. Licensee MDPI, Basel, Switzerland. This article is an open access article distributed under the terms and conditions of the Creative Commons Attribution (CC BY) license (http://creativecommons.org/licenses/by/4.0/).
Share and Cite
MDPI and ACS Style
Tan, M.; Zheng, L. Different Irrigation Water Requirements of Seed Corn and Field Corn in the Heihe River Basin. Water 2017, 9, 606. https://doi.org/10.3390/w9080606
AMA Style
Tan M, Zheng L. Different Irrigation Water Requirements of Seed Corn and Field Corn in the Heihe River Basin. Water. 2017; 9(8):606. https://doi.org/10.3390/w9080606
Chicago/Turabian StyleTan, Minghong, and Luqian Zheng. 2017. "Different Irrigation Water Requirements of Seed Corn and Field Corn in the Heihe River Basin" Water 9, no. 8: 606. https://doi.org/10.3390/w9080606
Note that from the first issue of 2016, this journal uses article numbers instead of page numbers. See further details here.