Exploring Jeddah Floods by Tropical Rainfall Measuring Mission Analysis

Civil Engineering Department, Çankırı Karatekin University, Çankırı 18100, Turkey
Water 2017, 9(8), 612; https://doi.org/10.3390/w9080612
Submission received: 13 June 2017
/
Revised: 31 July 2017
/
Accepted: 10 August 2017
/
Published: 16 August 2017
(This article belongs to the Special Issue Applications of Remote Sensing/GIS in Water Resources and Flooding Risk Managements)
Abstract
:Estimating flash floods in arid regions is a challenge arising from the limited time preventing mitigation measures from being taken, which results in fatalities and property losses. Here, Tropical Rainfall Measuring Mission (TRMM) Multi Satellite Precipitation Analysis (TMPA) Real Time (RT) 3B2RT data are utilized in estimating floods that occurred over the city of Jeddah located in the western Kingdom of Saudi Arabia. During the 2000–2014 period, six floods that were effective on 19 days occurred in Jeddah. Three indices, constant threshold (CT), cumulative distribution functions (CDFs) and Jeddah flood index (JFI), were developed using 15-year 3-hourly 3B42RT. The CT calculated, as 10.37 mm/h, predicted flooding on 14 days, 6 of which coincided with actual flood-affected days (FADs). CDF thresholds varied between 87 and 93.74%, and JFI estimated 28 and 20 FADs where 8 and 7 matched with actual FADs, respectively. While CDF and JFI did not miss any flood event, CT missed the floods that occurred in the heavy rain months of January and December. The results are promising despite that only rainfall rates, i.e., one parameter out of various flood triggering mechanisms, i.e., soil moisture, topography and land use, are used. The simplicity of the method favors its use in TRMM follow-on missions such as the Global Precipitation Measurement Mission (GPM).
1. Introduction
Disasters, which can be categorized as either man-made or natural, are defined as events or dangerous cases that may lead to injury or loss of human life with/without property loss [1] in addition to the interruptions they cause on human activities [2]. Out of 31 natural disasters, 28 are the result of meteorological events [3]. Among these 28 meteorology-based disasters, floods are the most common [4]. Despite the limited areas in which they occur [5], flash floods are the most commonly faced, the most deadly and the most challenging [6,7]. It is the limited response time that makes flash floods challenging. Hapuarachi et al. [8] identified excess rainfall as the main driving mechanism for flash floods.
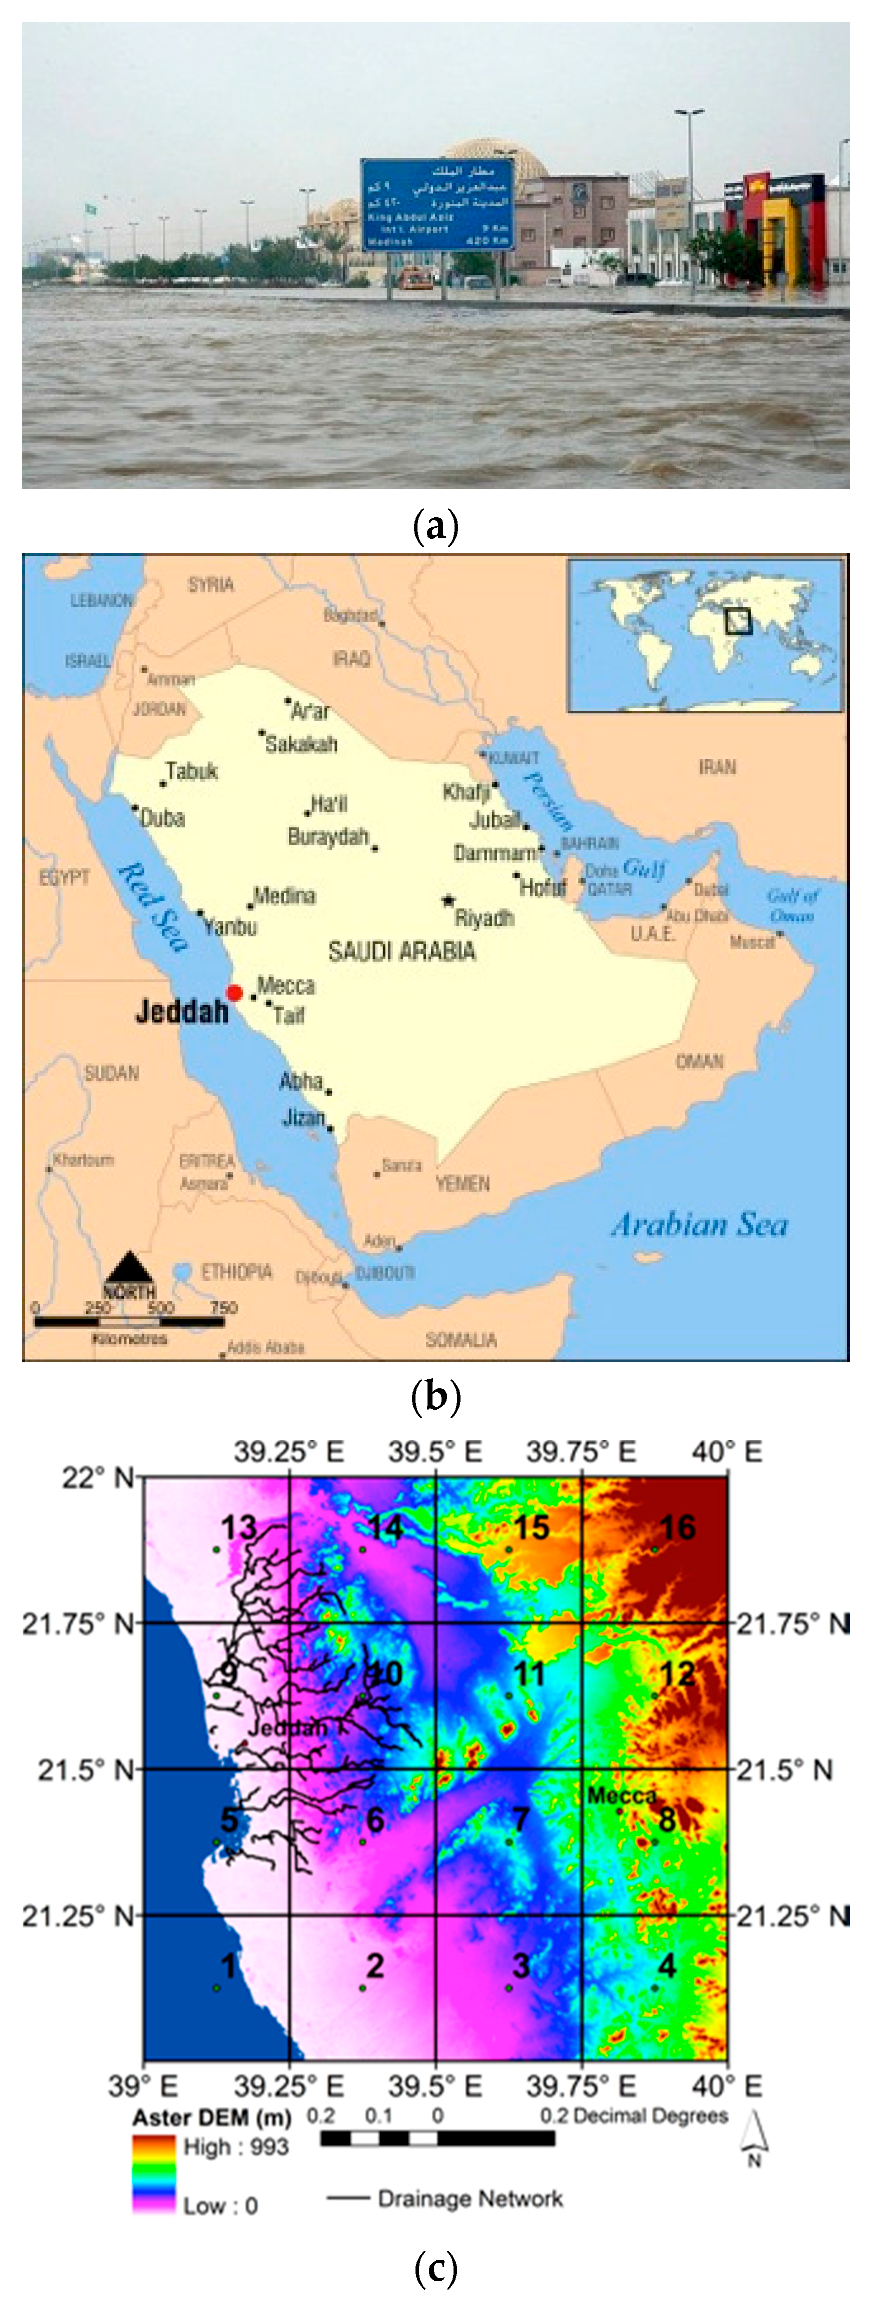
The vulnerability of arid and semi-arid regions to flash floods has been indicated to be equal to that of regions with heavy rain. Moreover, Zipser et al. [9] mentioned the occurrence of the strongest convective storms, and Haggag and El-Badry [10] indicated the rapid formation of flash floods in arid and semi-arid regions. The Kingdom of Saudi Arabia (KSA) is well known for its dry climatic conditions [11] and is classified as a semi-arid region [12,13]. However, the floods that occurred over Jeddah, Makkah and Riyadh in KSA indicate flash floods risks in the semi-arid kingdom (Figure 1a). The risks as well as the impact of flash floods increase due to the rainfall intensity and lack of mitigation implementations [11].
Negri et al. [14] identified the establishment of early warning systems as the most effective way to reduce life and property damage in flash flood cases. Despite improvements in numerical weather predictions, it is not easy to detect flash floods. This situation increases the importance of rainfall observations in flash flood estimations.
Ground-based rain gauges have been the main source of data for rainfall observations. However, as mentioned in Negri et al. [14], in these ground-based stations, data transfer problems can be seen during flooding events, and maintenance of the stations are needed after flooding [15]. In addition Borga et al. [5] indicated the inadequacy of ground-based rain gauges in showing the spatial variability of rainfall. Moreover, insufficiency in spatial and temporal coverage, particularly for rainfall observations over Jeddah, is mentioned in Deng et al. [16].
Ground radar and satellite-based remote sensing are free from such disadvantages and are being used more frequently in both research and operational applications [17]. In particular, satellite-based remote sensing provides new techniques to monitor extreme rainfall events in an uninterrupted manner and enables implementation of new flood warning systems [15,18]. Rainfall intensities at high spatial (1 km to 10 km) and temporal (30 min–3 h) resolutions can be obtained in near real time [19]. Borga et al. [5] mentioned that as remotely sensed precipitation became a major component in flood warning systems, mortality decreased due to timely warnings provided by satellite-based rainfall intensities [18,20].
In this study, three different flood indexes, namely, the constant threshold (CT), cumulative distribution functions (CDFs) and Jeddah flood index (JFI) that are based on the Tropical Rainfall Measuring Mission (TRMM) satellite 3B42RT rainfall rates are compared in forecasting of flooding events in Jeddah. Thus, the main objective is assessing the forecasting capabilities of TRMM 3B42RT-based indices in identifying the Jeddah floods.
2. Study Area and Data Sets
2.1. Study Area
With a population of 4.2 million over an area of 1600 km2, Jeddah, the second largest city in KSA after the capital Riyadh is the largest sea port on the Red Sea coast (Figure 1b) and has been a commercial hub in KSA [21]. Jeddah extends in a northern to southern direction bordered by the Red Sea in the west and by mountains in the east (Figure 1c). Drainage extending from those mountains in the east crosses the city, transporting surface flow to the city and ultimately merges with Red Sea (Please Refer to Figure 8 in Youssef et al. [12]).
With air temperatures dropping to 15 °C in winter and reaching as high as 52 °C in summer, Jeddah can be classified as having a hot, arid climate [21]. Despite Jeddah being located in the rainiest region of KSA, precipitation is still low, below the potential evaporation point, and indicates high temporal and spatial variability [12]. The monthly maximum, average and minimum air temperatures (°C) and monthly cumulative precipitation (mm) observed in Jeddah are provided in Figure 2 [21]. As seen in Figure 2, the summer period can be very hot (max 52 °C) with no rainfall. Based on precipitation values in Figure 2, Jeddah exhibits three main seasons. The high rain season covers November, December and January, the low rain season covers February, March, April and October and the dry season covers June, July, August and September. Most of the rain is received in brief thunderstorms during the high rain season [12]. Table 1 presents the Jeddah floods gathered from various sources. Figure 2 indicates that, out of six floods observed over Jeddah, 3 occurred in the high season (January, November, December), 2 in the low season (April, October) and 1 in the dry (July) season.
2.2. Satellite Data
The Tropical Rainfall Measuring Mission (TRMM) is a collaboration between the Japan Aerospace Exploration Agency (JAXA) and National Aeronautics and Space Administration (NASA). It was the first satellite to carry a precipitation radar. Besides the radar, microwave imaging and lightning sensors are used in rainfall detection [30]. Using multi-channel microwave and infrared observations from satellites [31], TRMM Multi-satellite Precipitation Analysis (TMPA) data produce the “best” precipitation estimate between 50° N–50° S. Precipitation products have high temporal (3 h) and high spatial resolution (0.25° × 0.25°). Real-time (RT) data (3B42RT) are provided to users 6–9 h following the data reception and research products (3B42) are available 15 days following the end of month [32].
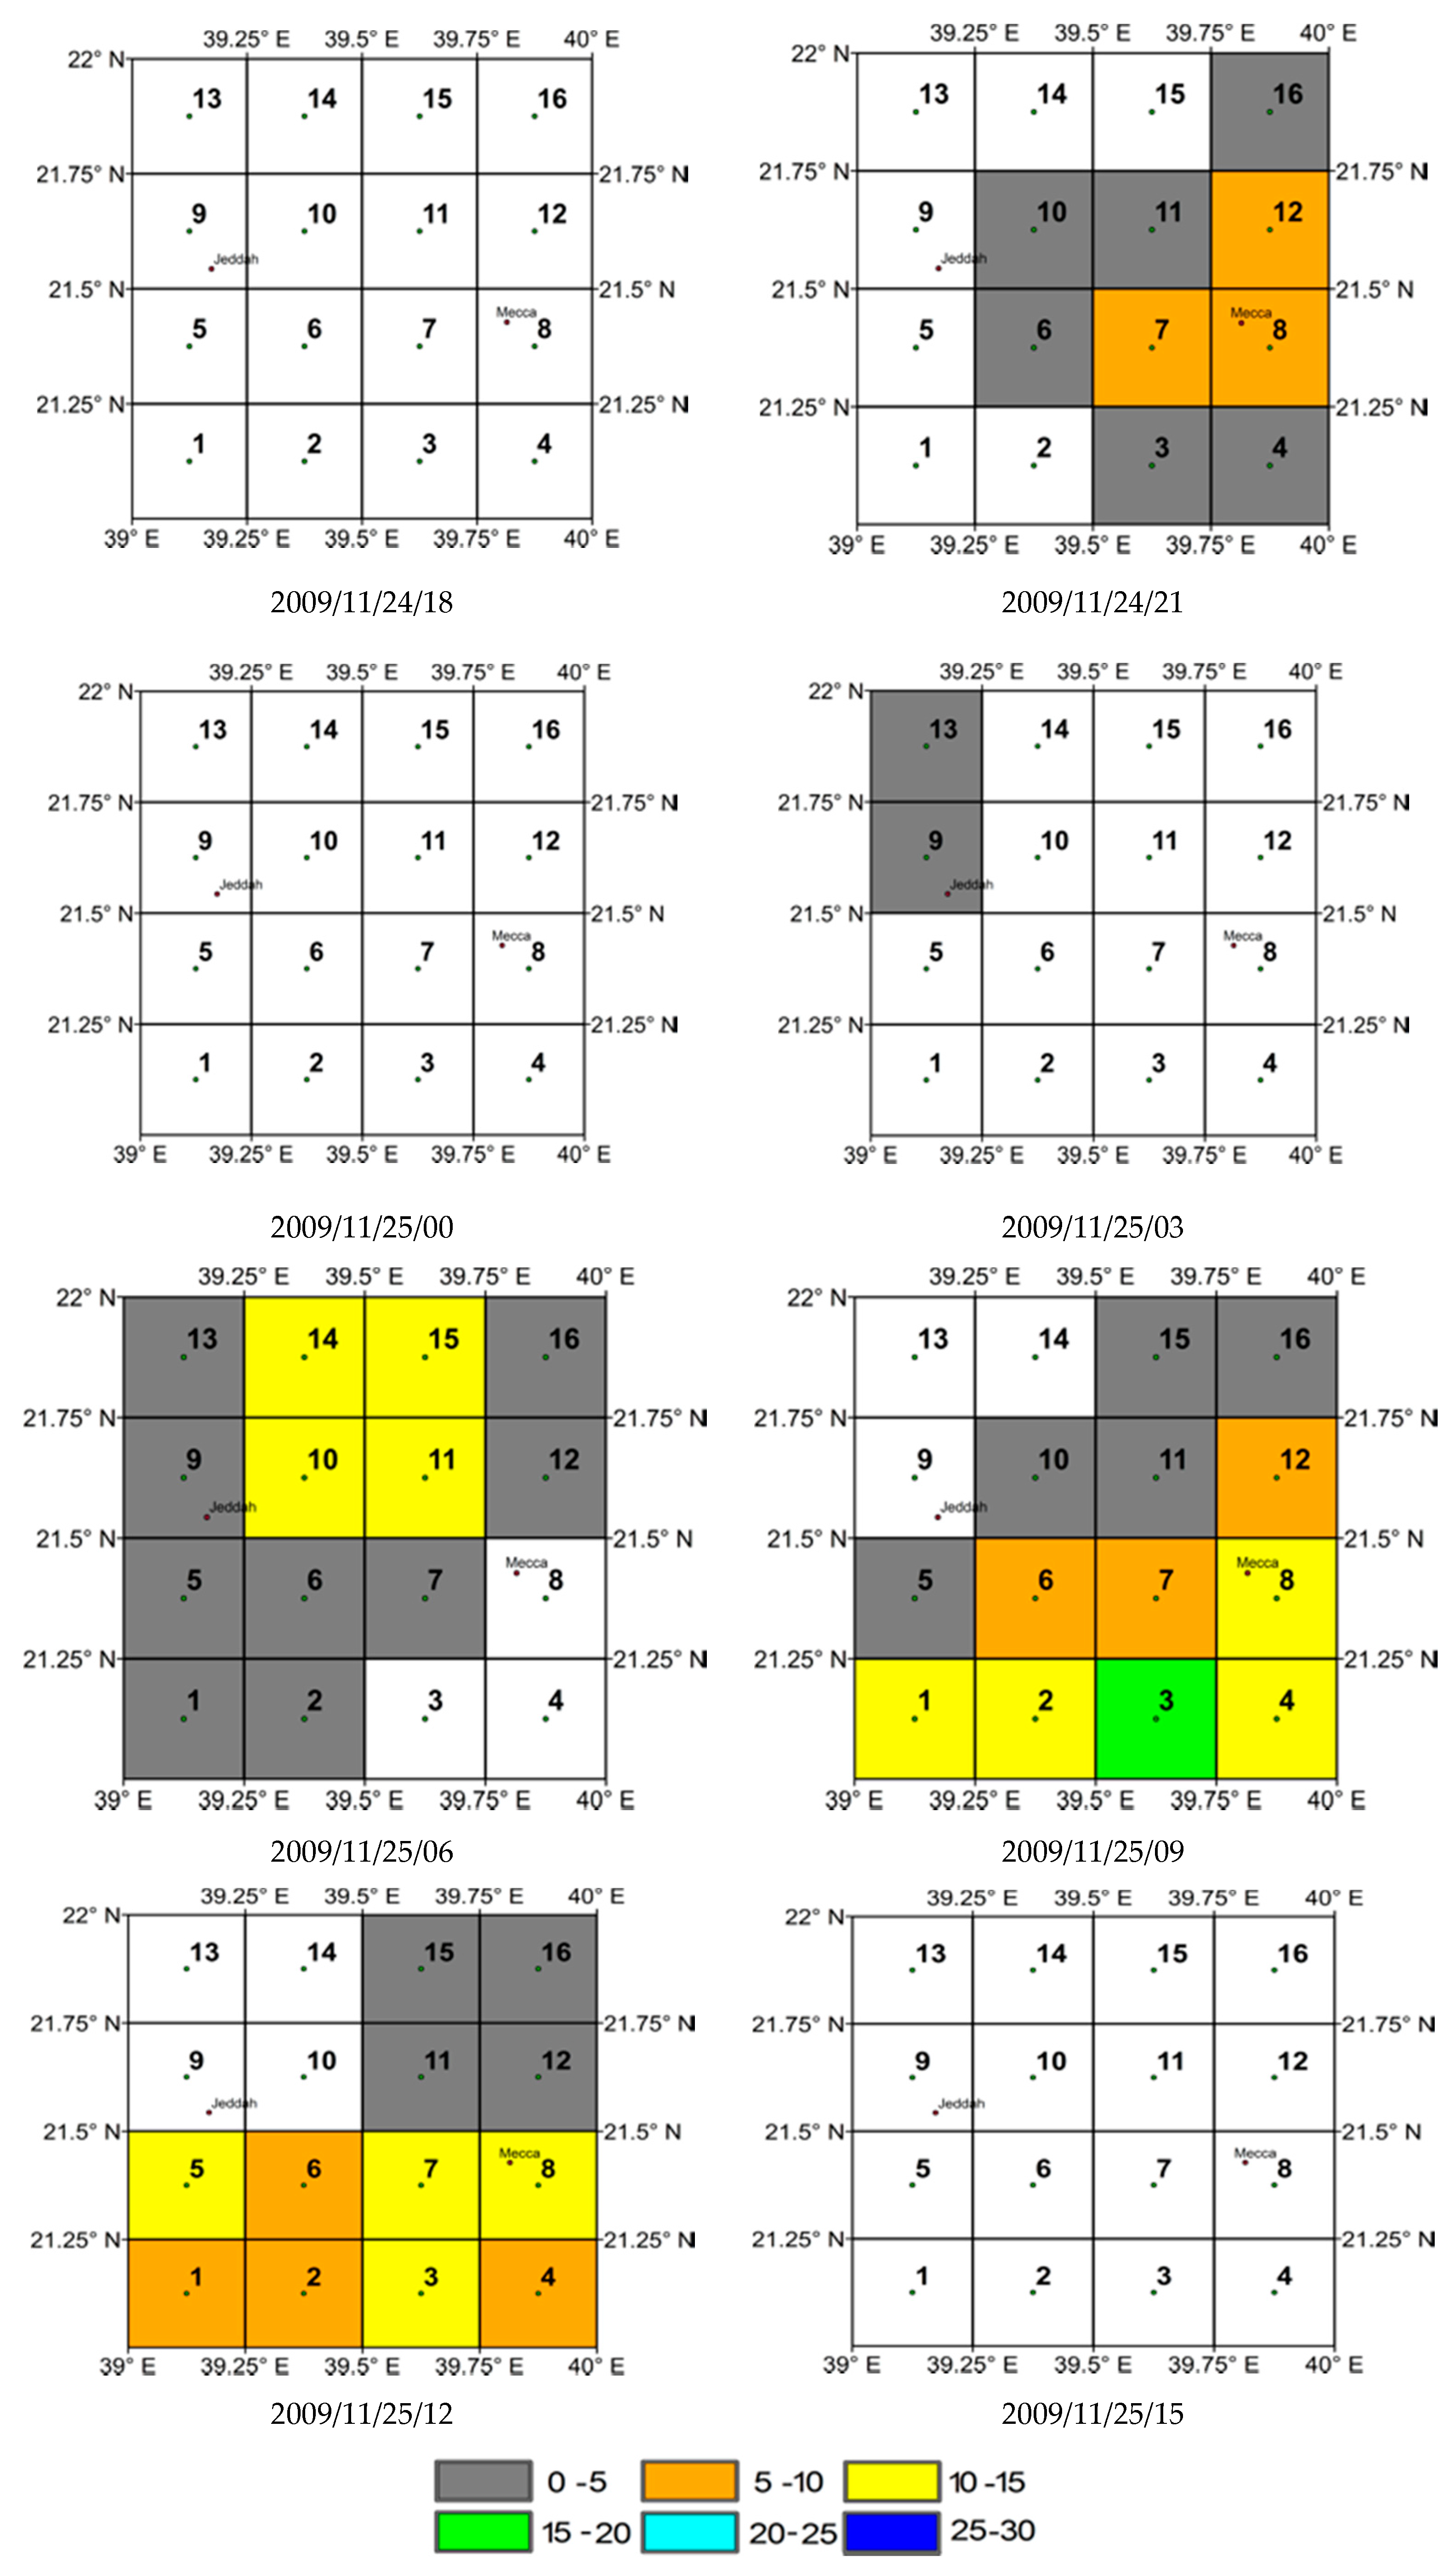
Usability of TRMM 3B42 data for water resource applications and high performance over KSA was demonstrated by Almazroi [33] and Kheimi and Gutub [34]. Tekeli and Fouli [35] indicated the capability of 3B42RT data in forecasting floods in Riyadh, KSA. Similar to Tekeli and Fouli [35] version 7 (V7) of 3B42RT data posted online in May of 2012 [36] is used here. Figure 3 presents TRMM 3B42RT pixel coverage over Jeddah. Despite Haggag and El-Badry [10] stating the underestimation of rainfall fields by TRMM 3B42 data, Figure 4 shows the flooding event on 25 November 2009 as detected by 3B42RT data. Details of TRMM 3B42RT data production algorithms can be obtained from the TRMM website [37], and data can be downloaded from the web address; https://pmm.nasa.gov/data-access/downloads/trmm.
3. Methodology
Hapuarachi et al. [8] and Alfieri and Thielen [38] reviewed flash flood occurrences and found that rainfall comparison (RC) provides good estimates despite its simplicity, as it just requires Quantitative Precipitation Estimates (QPE). Borga et al. [5] mentioned that event detection is the most important step in flash flood warnings. Thus, the comparison of rainfall amounts, RC, with thresholds has been used in detecting flash floods [39]. However, as Hamada et al. [40] indicated, regional differences should be considered in determining thresholds. In addition, a large database is needed for flash flood threshold determination, as flash floods are not frequent occurrences. For this study, 3-h interval 3B42RT TRMM data covering the years from 2000 to 2014 are used to obtain three indices, namely constant threshold (CT), cumulative distribution function (CDF) and Jeddah flood index (JFI).
3.1. Constant Threshold
The intensity duration frequency (IDF) curves indicate the relationship between intensity (i), duration (d) and frequency (f) of rainfall and provide rainfall intensity for a given (selected) rainfall duration and frequency [41]. Equation (1) represents the IDF curve for Jeddah that was developed by Ewea et al. [42] using storms recorded at Mudaylif station for 27 years covering the period 1975–2001.
where Tr is the return period, D is rainfall duration and i is the rainfall intensity in mm/h. Table 2 shows the calculated rainfall intensities that would cause flooding over Jeddah for different return periods based on Equation (1).
i(mm/h) = (236.63ln(Tr) + 388.48) * (D) (0.0107ln(Tr) − 0.7869)
Taking the return period as 2.33 for average annual flooding [43] and rainfall duration as 180 min (as 3B42RT data are 3 hourly), a flood causing the rainfall intensity threshold is determined as 10.37 mm/h.
3.2. Cumulative Distribution Function (CDF)
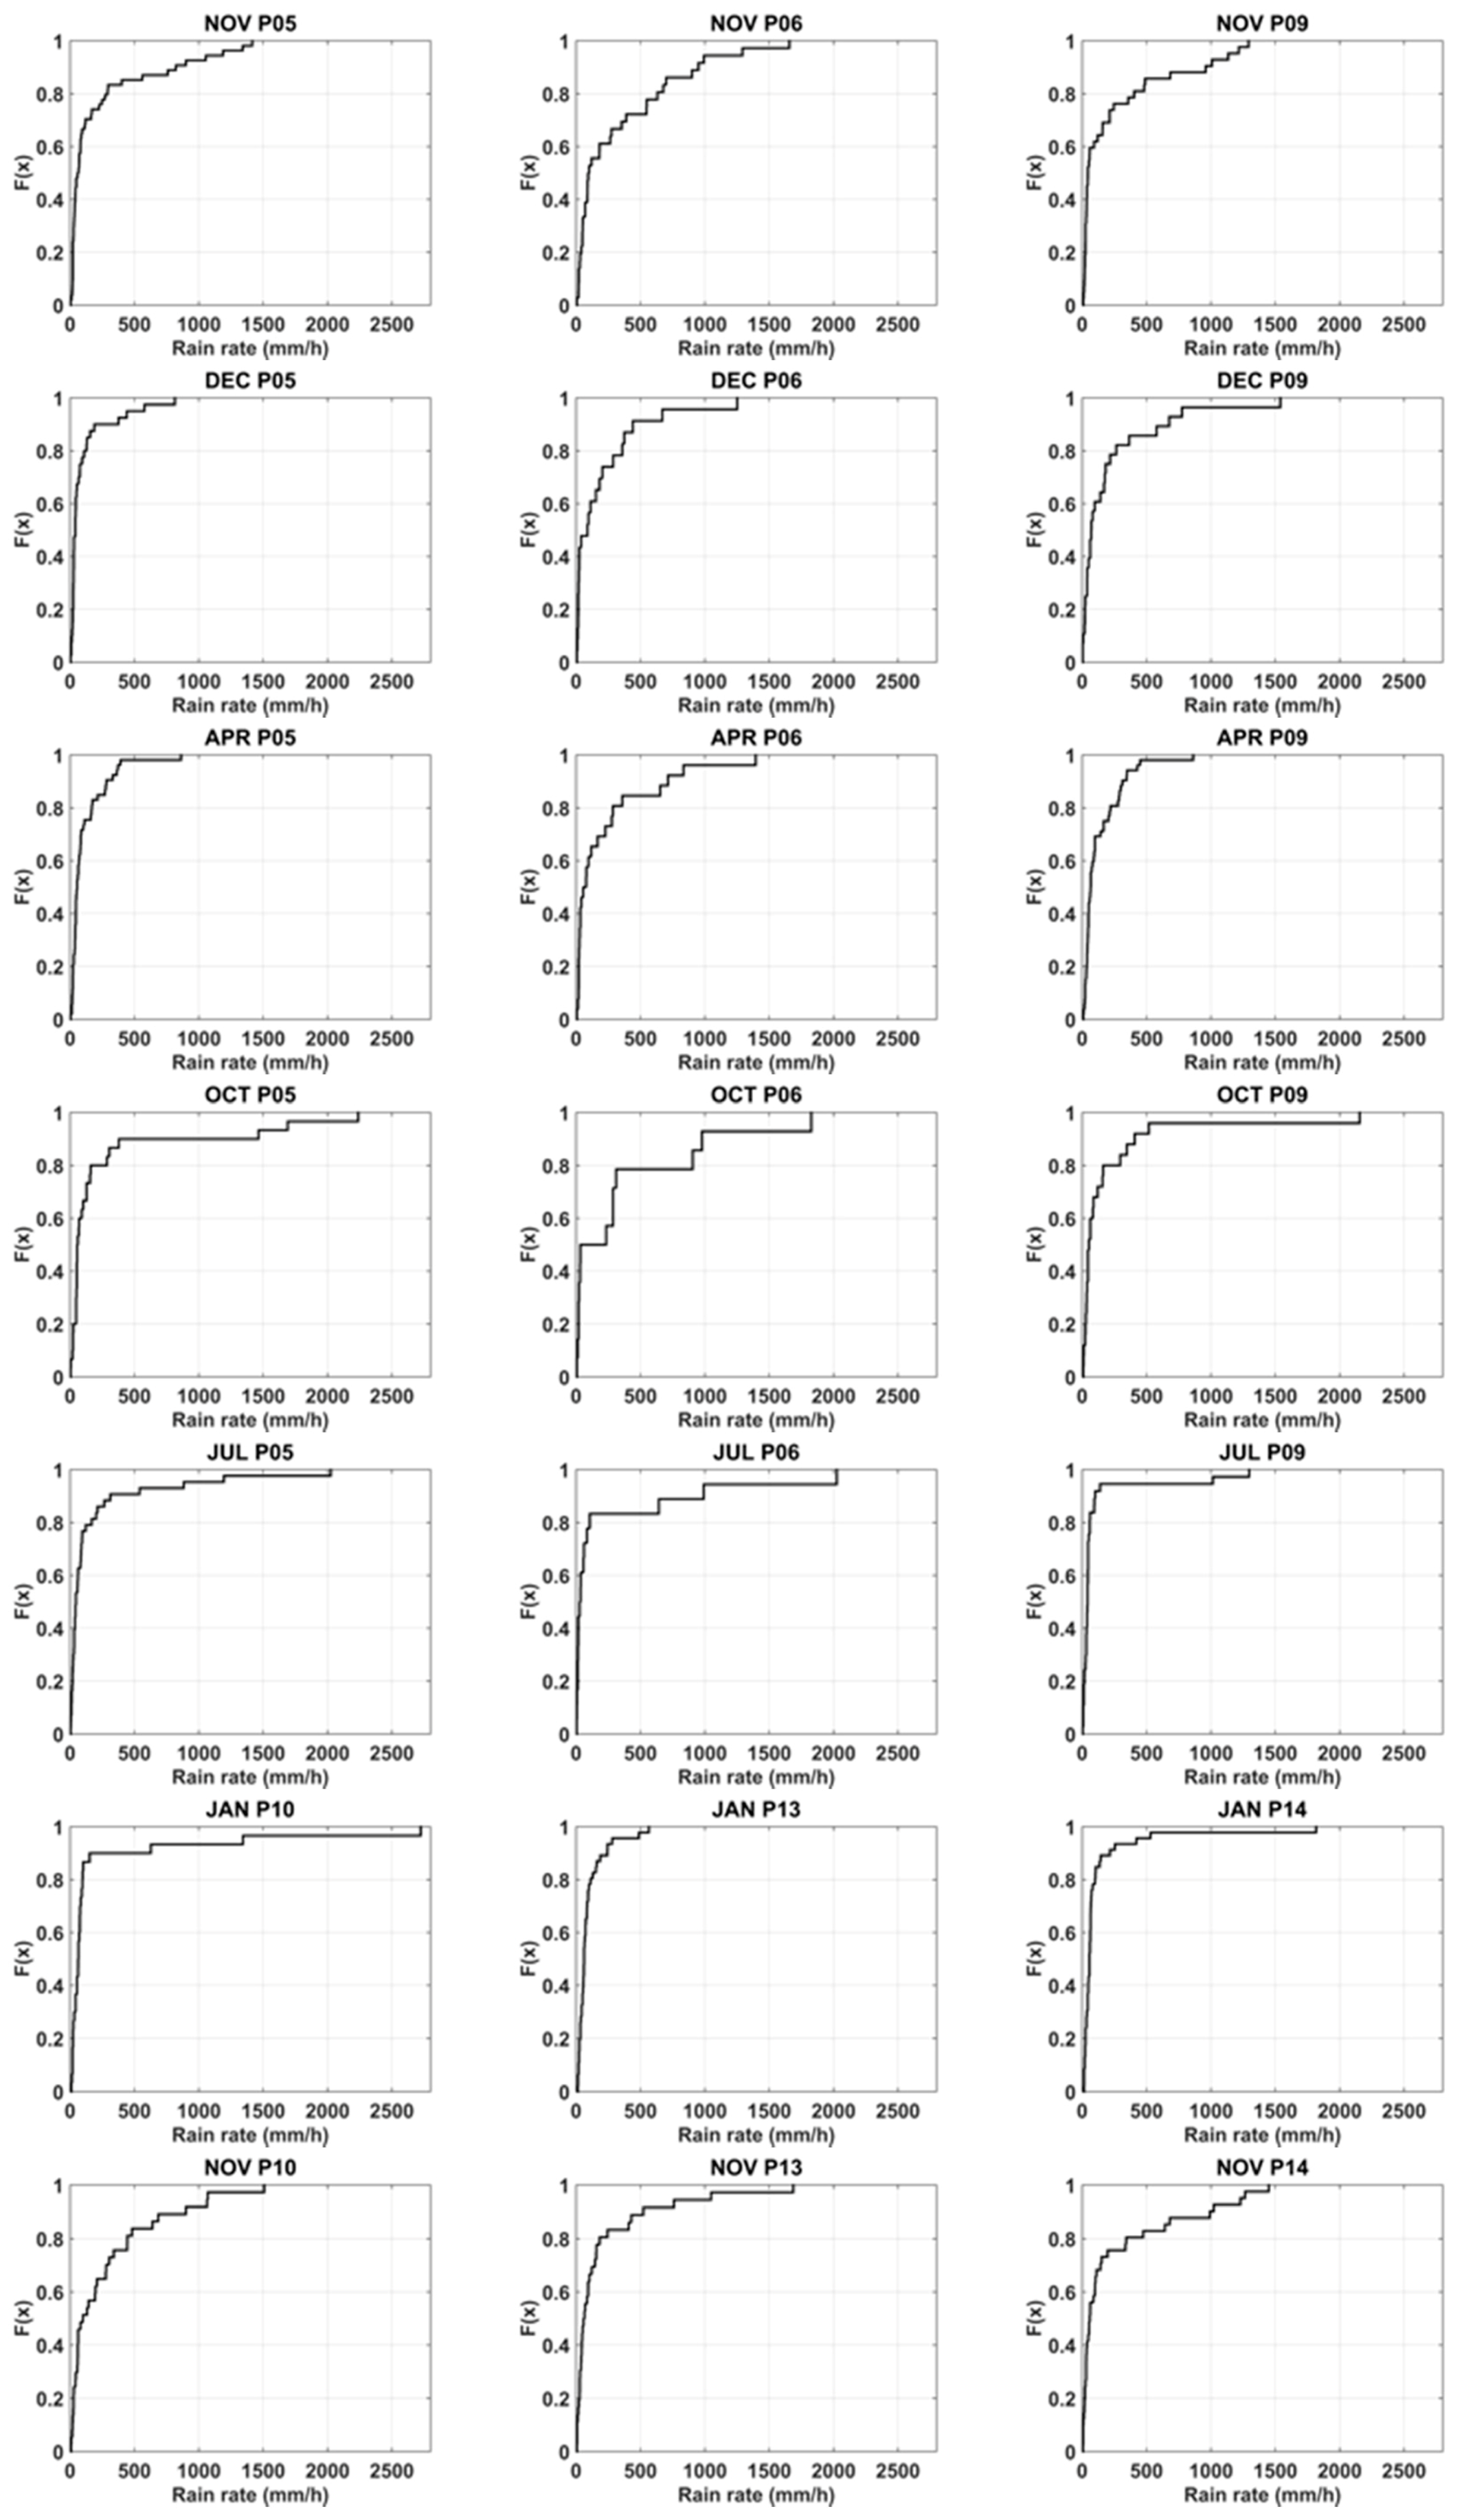
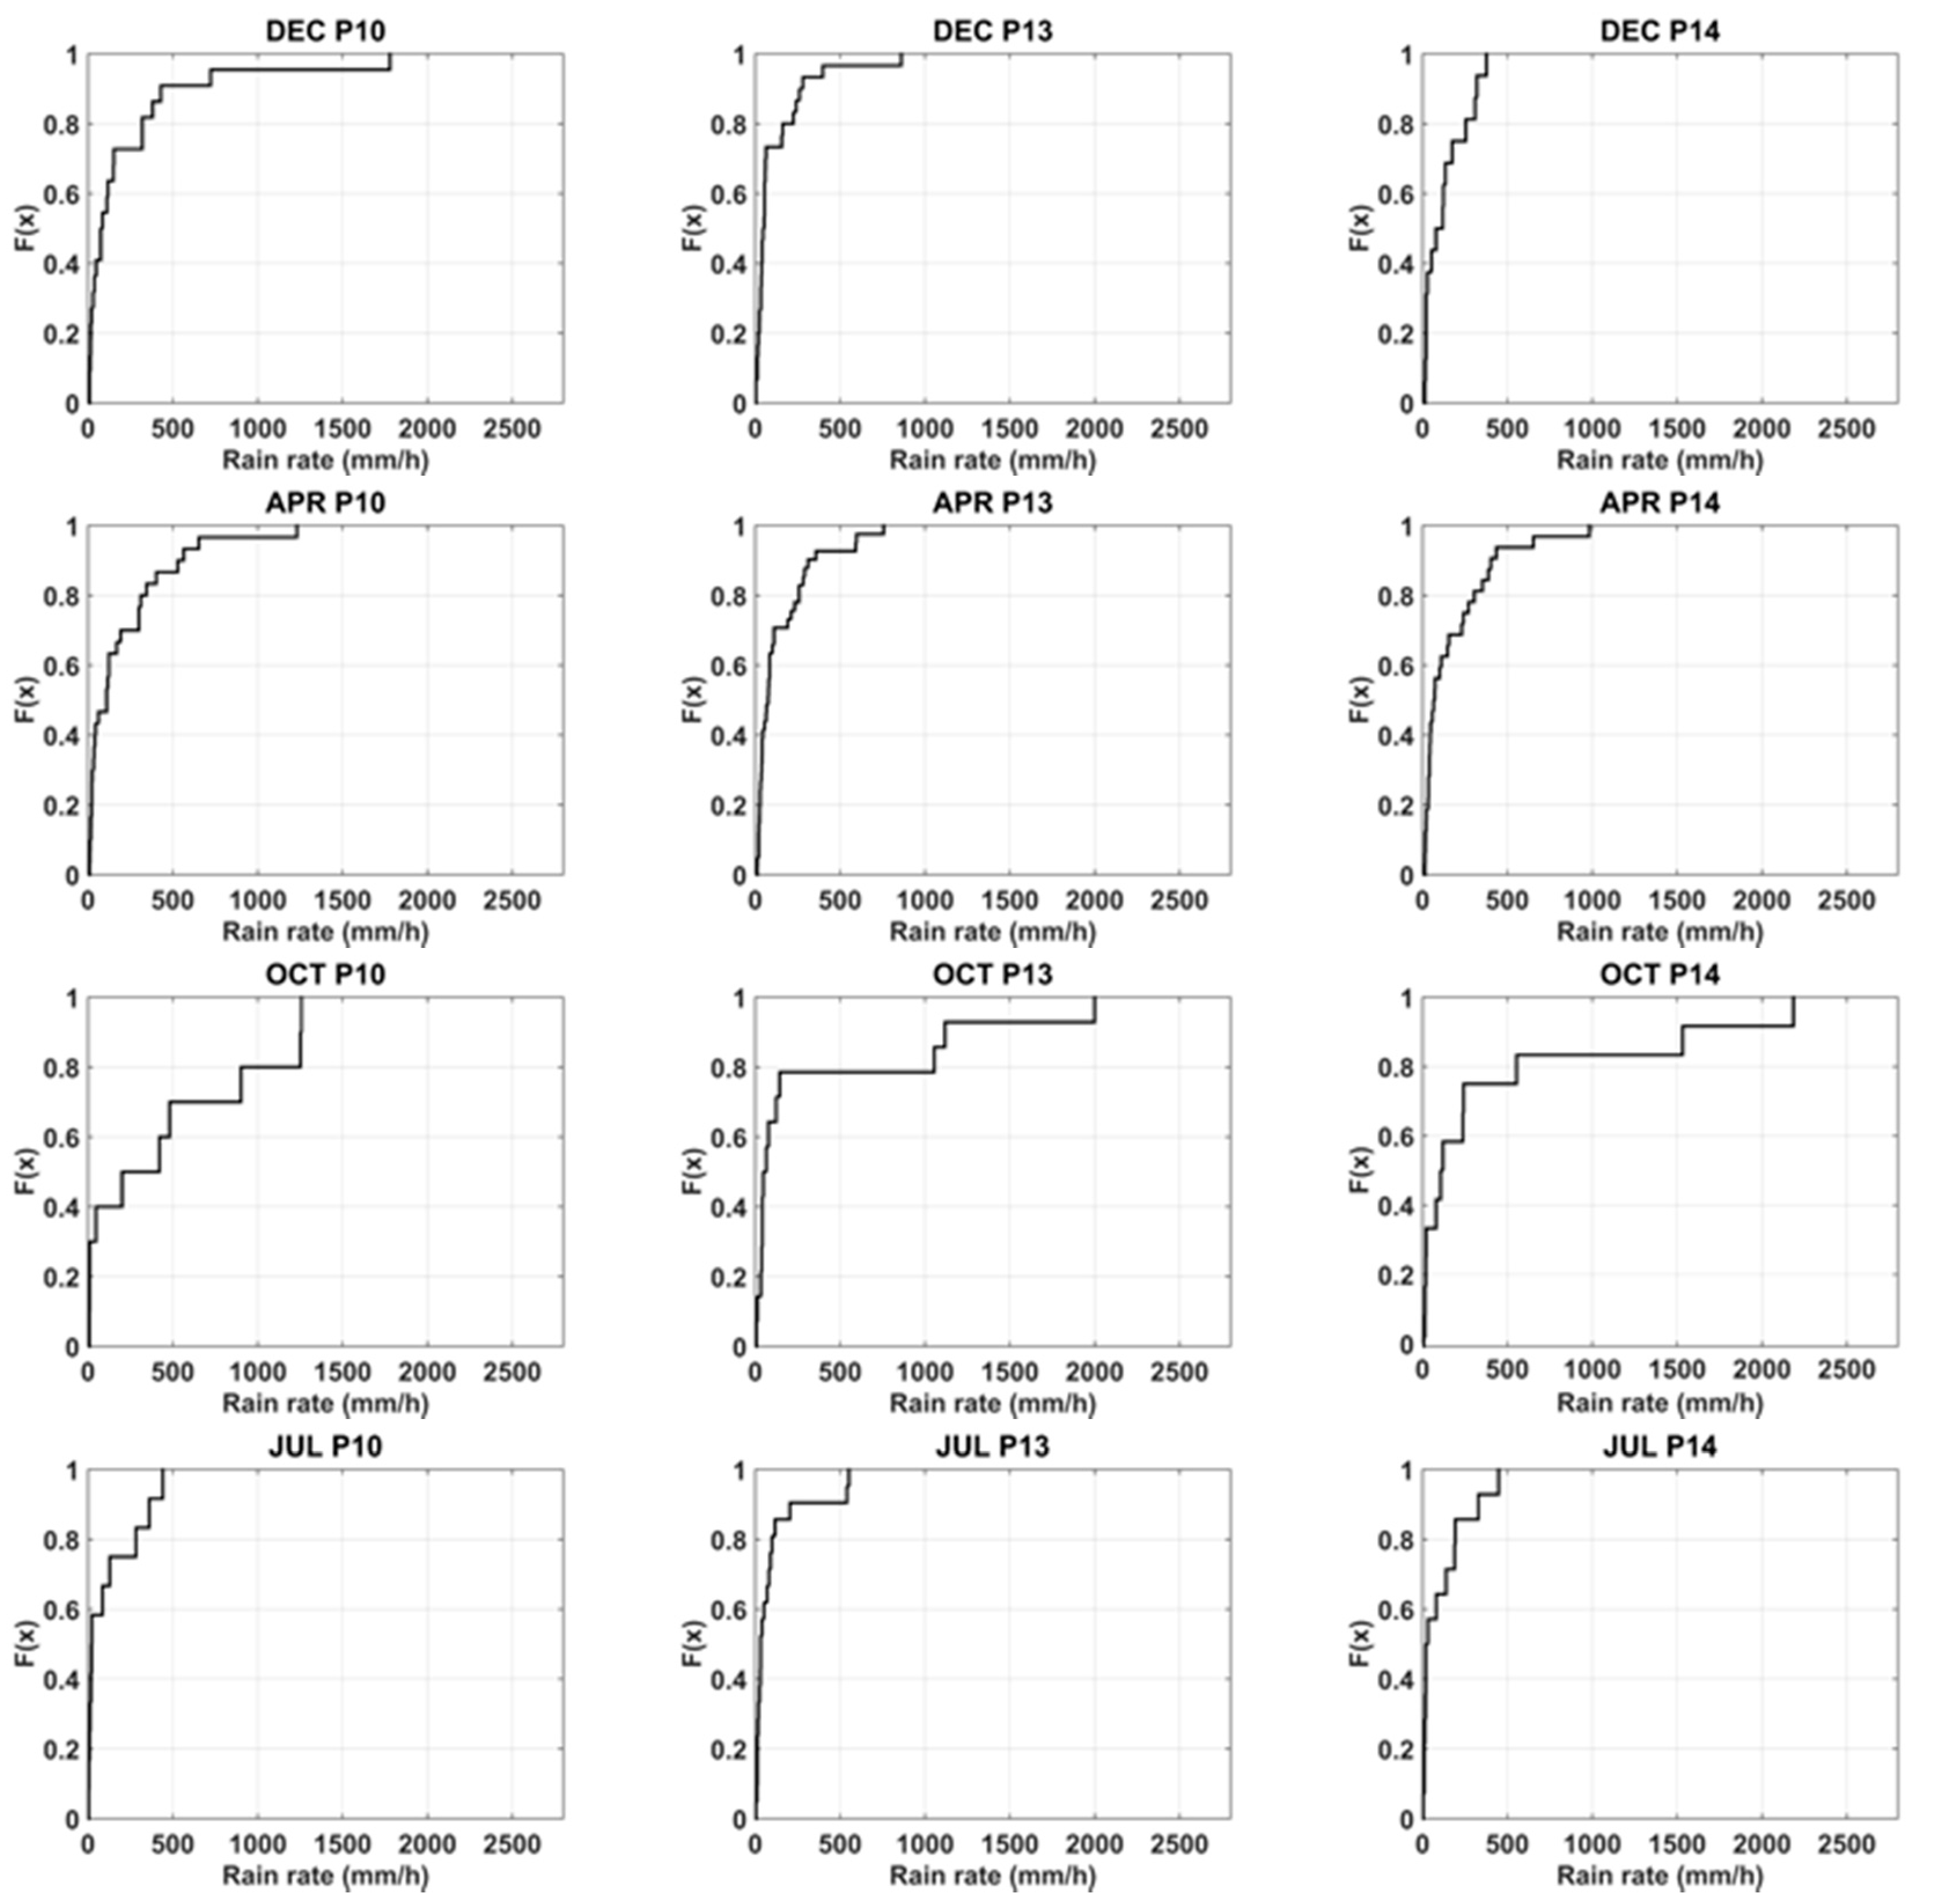
Three-hourly TRMM 3B42RT rainfall intensities over the pixels (pixels 5, 6, 9, 10, 13 and 14—See Figure 3) are aggregated monthly, pixel wise, and cumulative distribution functions (CDFs) are obtained for each pixel for each month. Figure 5 presents monthly CDFs covering the 2000–2014 period for the flood observed months.
3.3. Jeddah Flood Index (JFI)
Tekeli and Fouli [35] proposed the Riyadh Flood Precipitation Index (RFPI), which is a modified version of the European Precipitation Climatology Index (EPIC) proposed by Alfieri et al. [7] and by Alfieri and Thielen [38] for extreme rain storm and flash flood early warning. Modification to the EPIC implemented by [35] included the monthly calculation instead of yearly values in EPIC. In this study, the Jeddah Flood Index (JFI) was developed similar to the monthly case proposed by [35]. Thus, JFI can be given by the following equation.
Pi indicates the 3-h rain rate in 3B42RT data, and N is the number of years with available 3B42RT data. The denominator is the monthly average of the maximum three-hour interval of rain rates found in 3B42RT. Monthly values of the denominator are based on 3-h intervals for 15-year (2000–2014) TRMM data for the pixels covering Jeddah, summarized in Table 3.
4. Results and Discussion
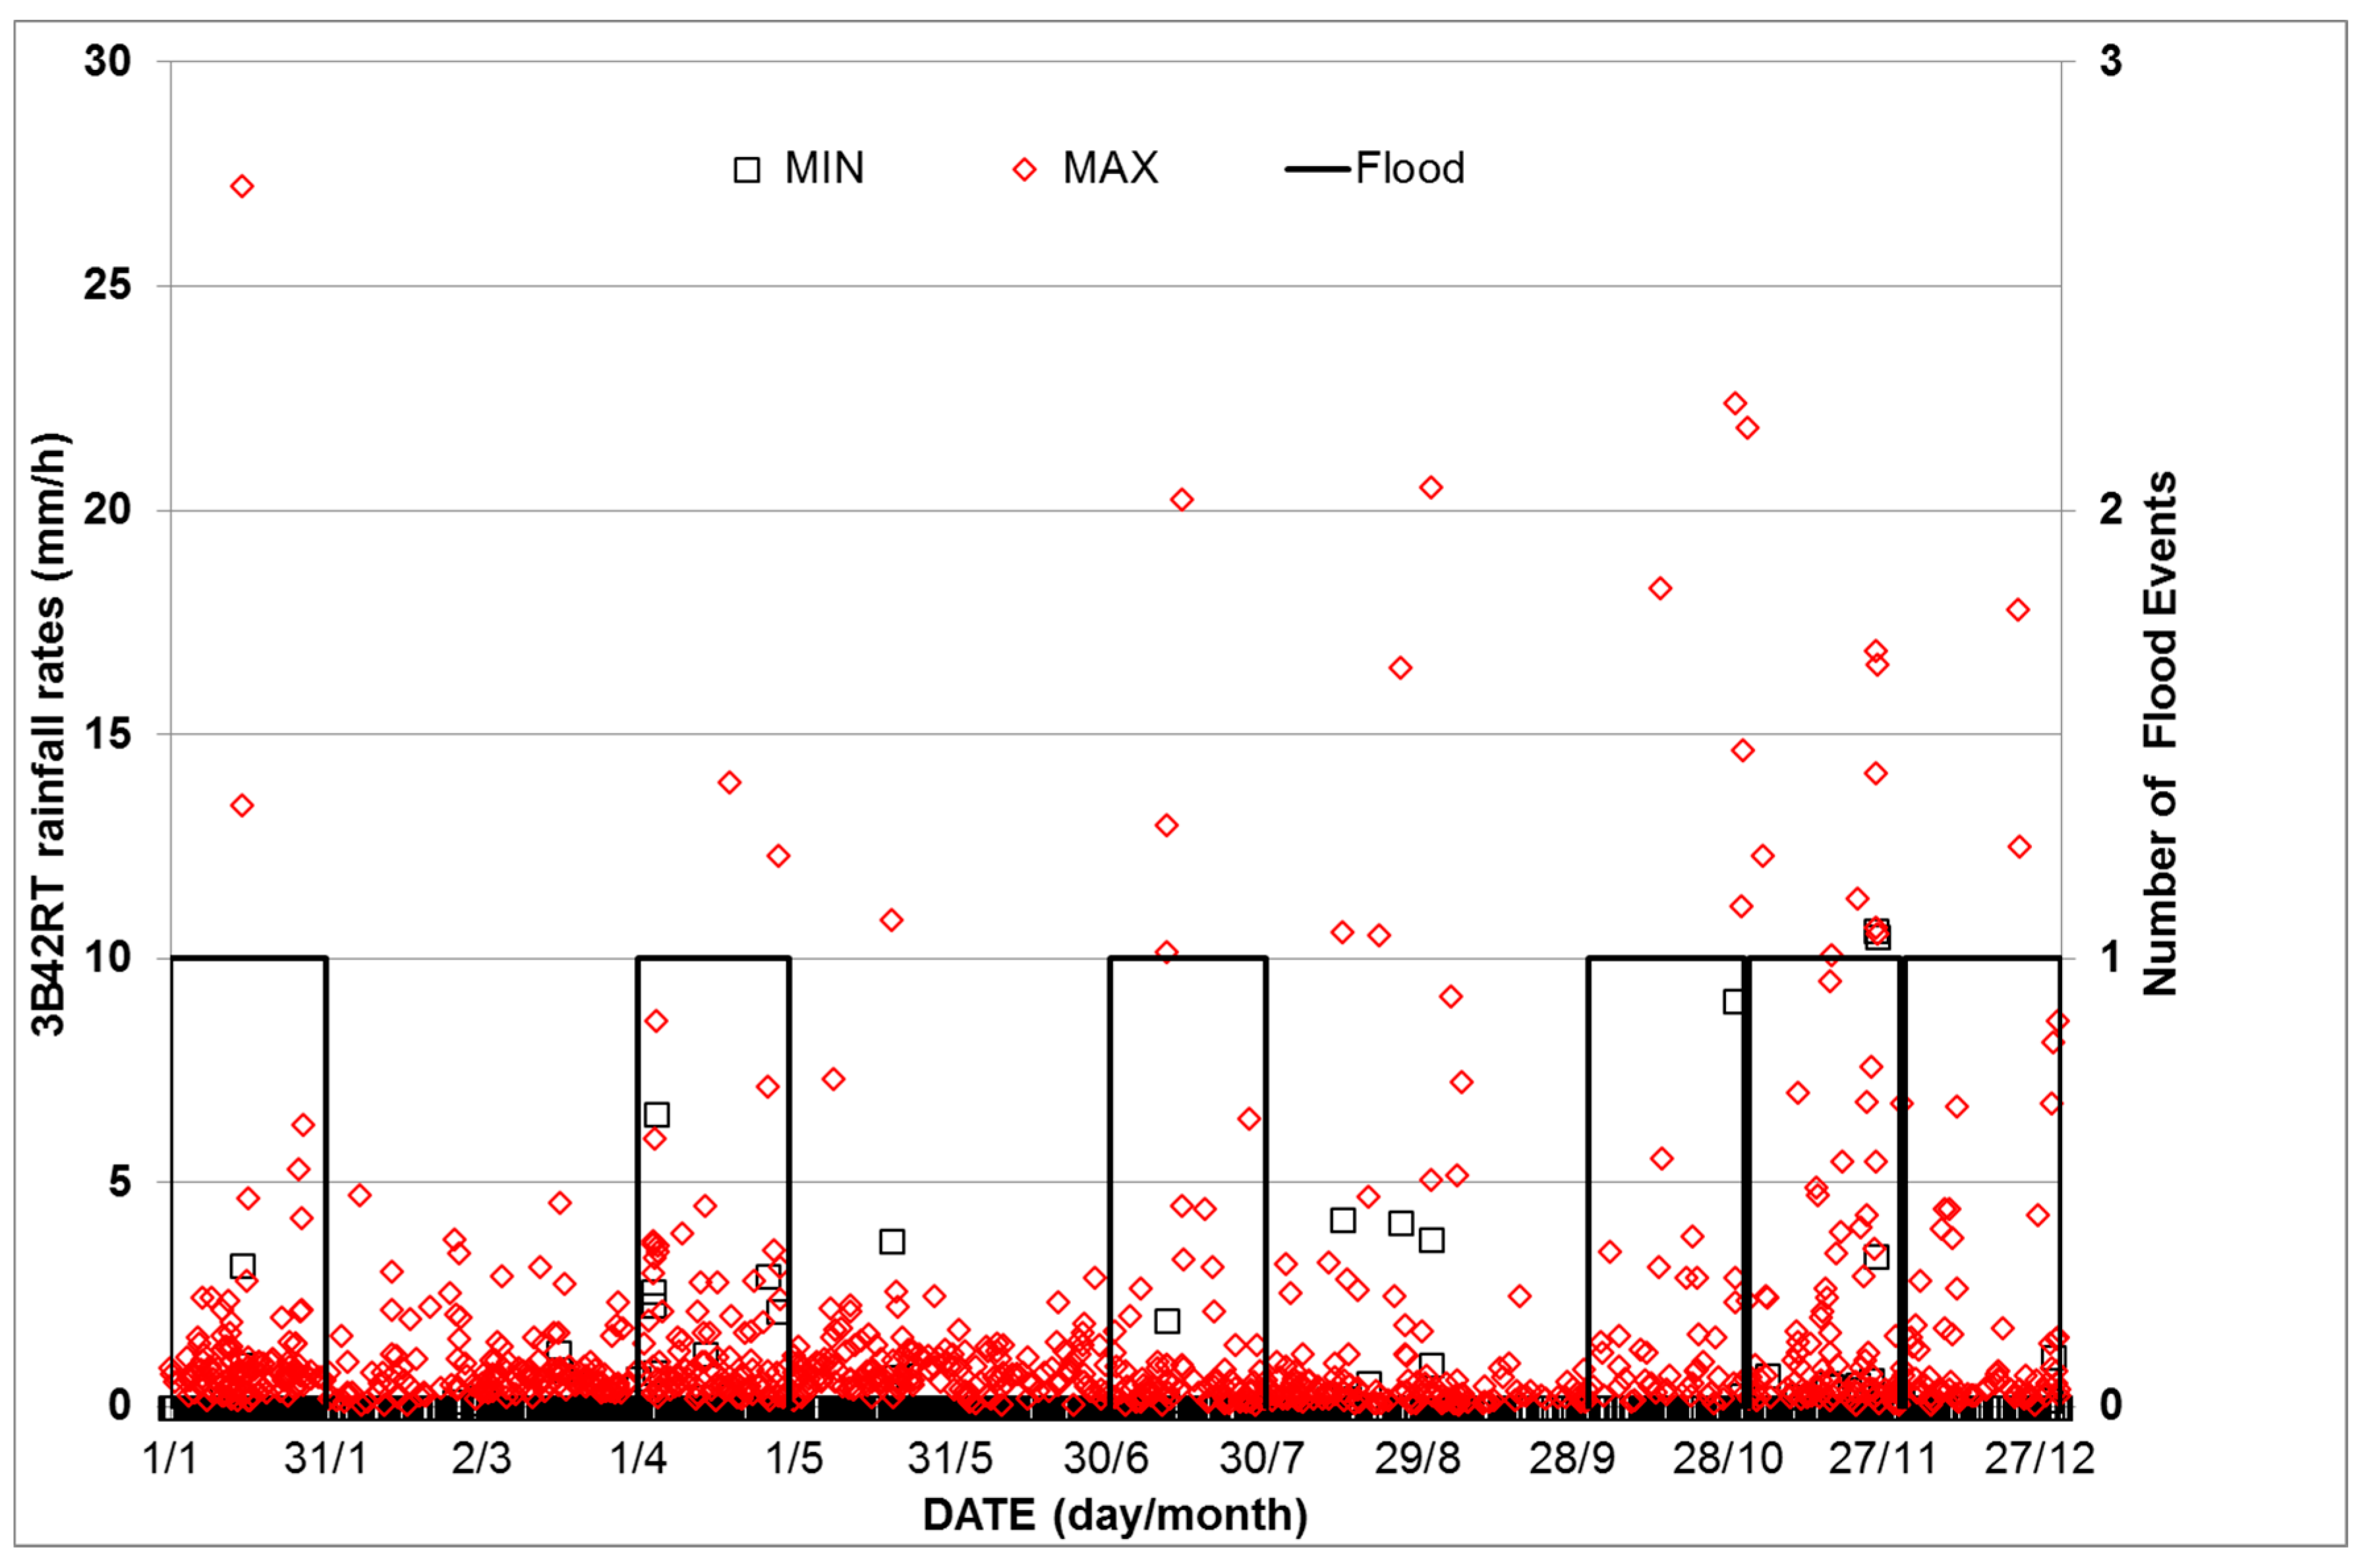
Flood events and minimum and maximum rainfall rates obtained from TRMM 3B42RT data are presented in Figure 6. High rainfall rates matched well with flood events except for August, during which no floods were reported. Moreover, both frequency and magnitude of the high rainfall rates are more common during the high rain season (November, December and January period). Thus, seasonality of rainfall patterns of Jeddah are also detected well by 3B42RT.
It is seen that 3B42RT intensities increase towards to the east of Jeddah (Figure 4). This is in line with the topography where high mountains on the east cause large amounts of rainfall that flow down quickly to Jeddah city [16,24]. Moreover, Haggag and El-Badry [10] also mentioned that eastern parts of the catchment receive 220mm/year more rainfall than other parts.
For the constant threshold (CT), rainfall rates equal or greater than 10.37 mm/h obtained from Equation (1) were searched for in all three-hour interval 3B42RT TRMM data covering the 2000–2014 period. Tekeli and Fouli [35] and Hamada et al. [40] used 90% and 99.9% as threshold values in cumulative distribution functions (CDFs). As an initial value, CDF 90% is used as a threshold value in this study. For each 3-h interval covering the 2000–2014 period, the Jeddah Flood Index (JFI) of the 3B42RT pixels are calculated, and values greater than the threshold value 1, are searched.
Based on the above-mentioned thresholds for each method, estimated flood events are summarized in Table 4. Estimated events that match with the real flood observations are framed by a thick dark border. CT yielded 20 estimated flood events on 14 different days. This led to the identification of 8 events on 6 days. For CDFs, a 90% thresholds resulted in too many false alarms, especially for January, April and December—all of which are in the high rain season. JFI, with a threshold value of 1.00, yielded the highest number flood estimates. It is easily seen that other than December and January, the observed floods are seen when all CT, CDF and JFI indicated flooding.
Dönmez and Tekeli [44] reduced false flood alarms by updating the CDF thresholds. Since they knew the places where flooding occurred, they used the CDFs of the respective pixels and performed updates accordingly. Unfortunately, the case is not the same in this study. In the approach proposed by [35], they used the constant threshold value of (3 mm/h) derived from intensity duration curves to determine the respective CDFs. Similarly, in this study, the value obtained from the intensity duration curve, 10.37 mm/h, is used to determine thresholds. The months October and November indicated values higher than the constant value. Thus, these months were used to derive the new thresholds. New values were determined as 91.68%, 91.62%, 93.74%, 87.30%, 88.87% and 87.46% for respective pixels 5, 6, 9, 10, 13 and 14. The first three values (91.68%, 91.62%, 93.74%) are within the 90–99.9% range mentioned in [35,40]. However, the last three (87.30%, 88.87% and 87.46%) are not within the range. Using these as thresholds and using the respective months’ CDFs, flood estimations of the CDF-based method are updated. In addition, JFI values are also updated based on the actual flood occurrences. Estimated flood events based on updated thresholds are presented in Table 5. Both updates drastically reduced false flood alarms.
Table 6 summarizes the estimated number of flood alarms before and after updating under “Estimated/Updated” columns for CDF and JFI and under “Detected” columns number of missed, false and true detection number is presented for CT, CDF and JFI. Table 6 indicates that CT, CDF and JFI estimated 14, 28 and 20 flood-affected days (FADs) where 6, 8 and 7 matched with actual FADs. CT, with a ratio of 6/14, seems to be superior to CDF (8/28) and JFI (7/20). However, as CT missed January and December floods, the second best, JFI, is selected as the main flood estimation index.
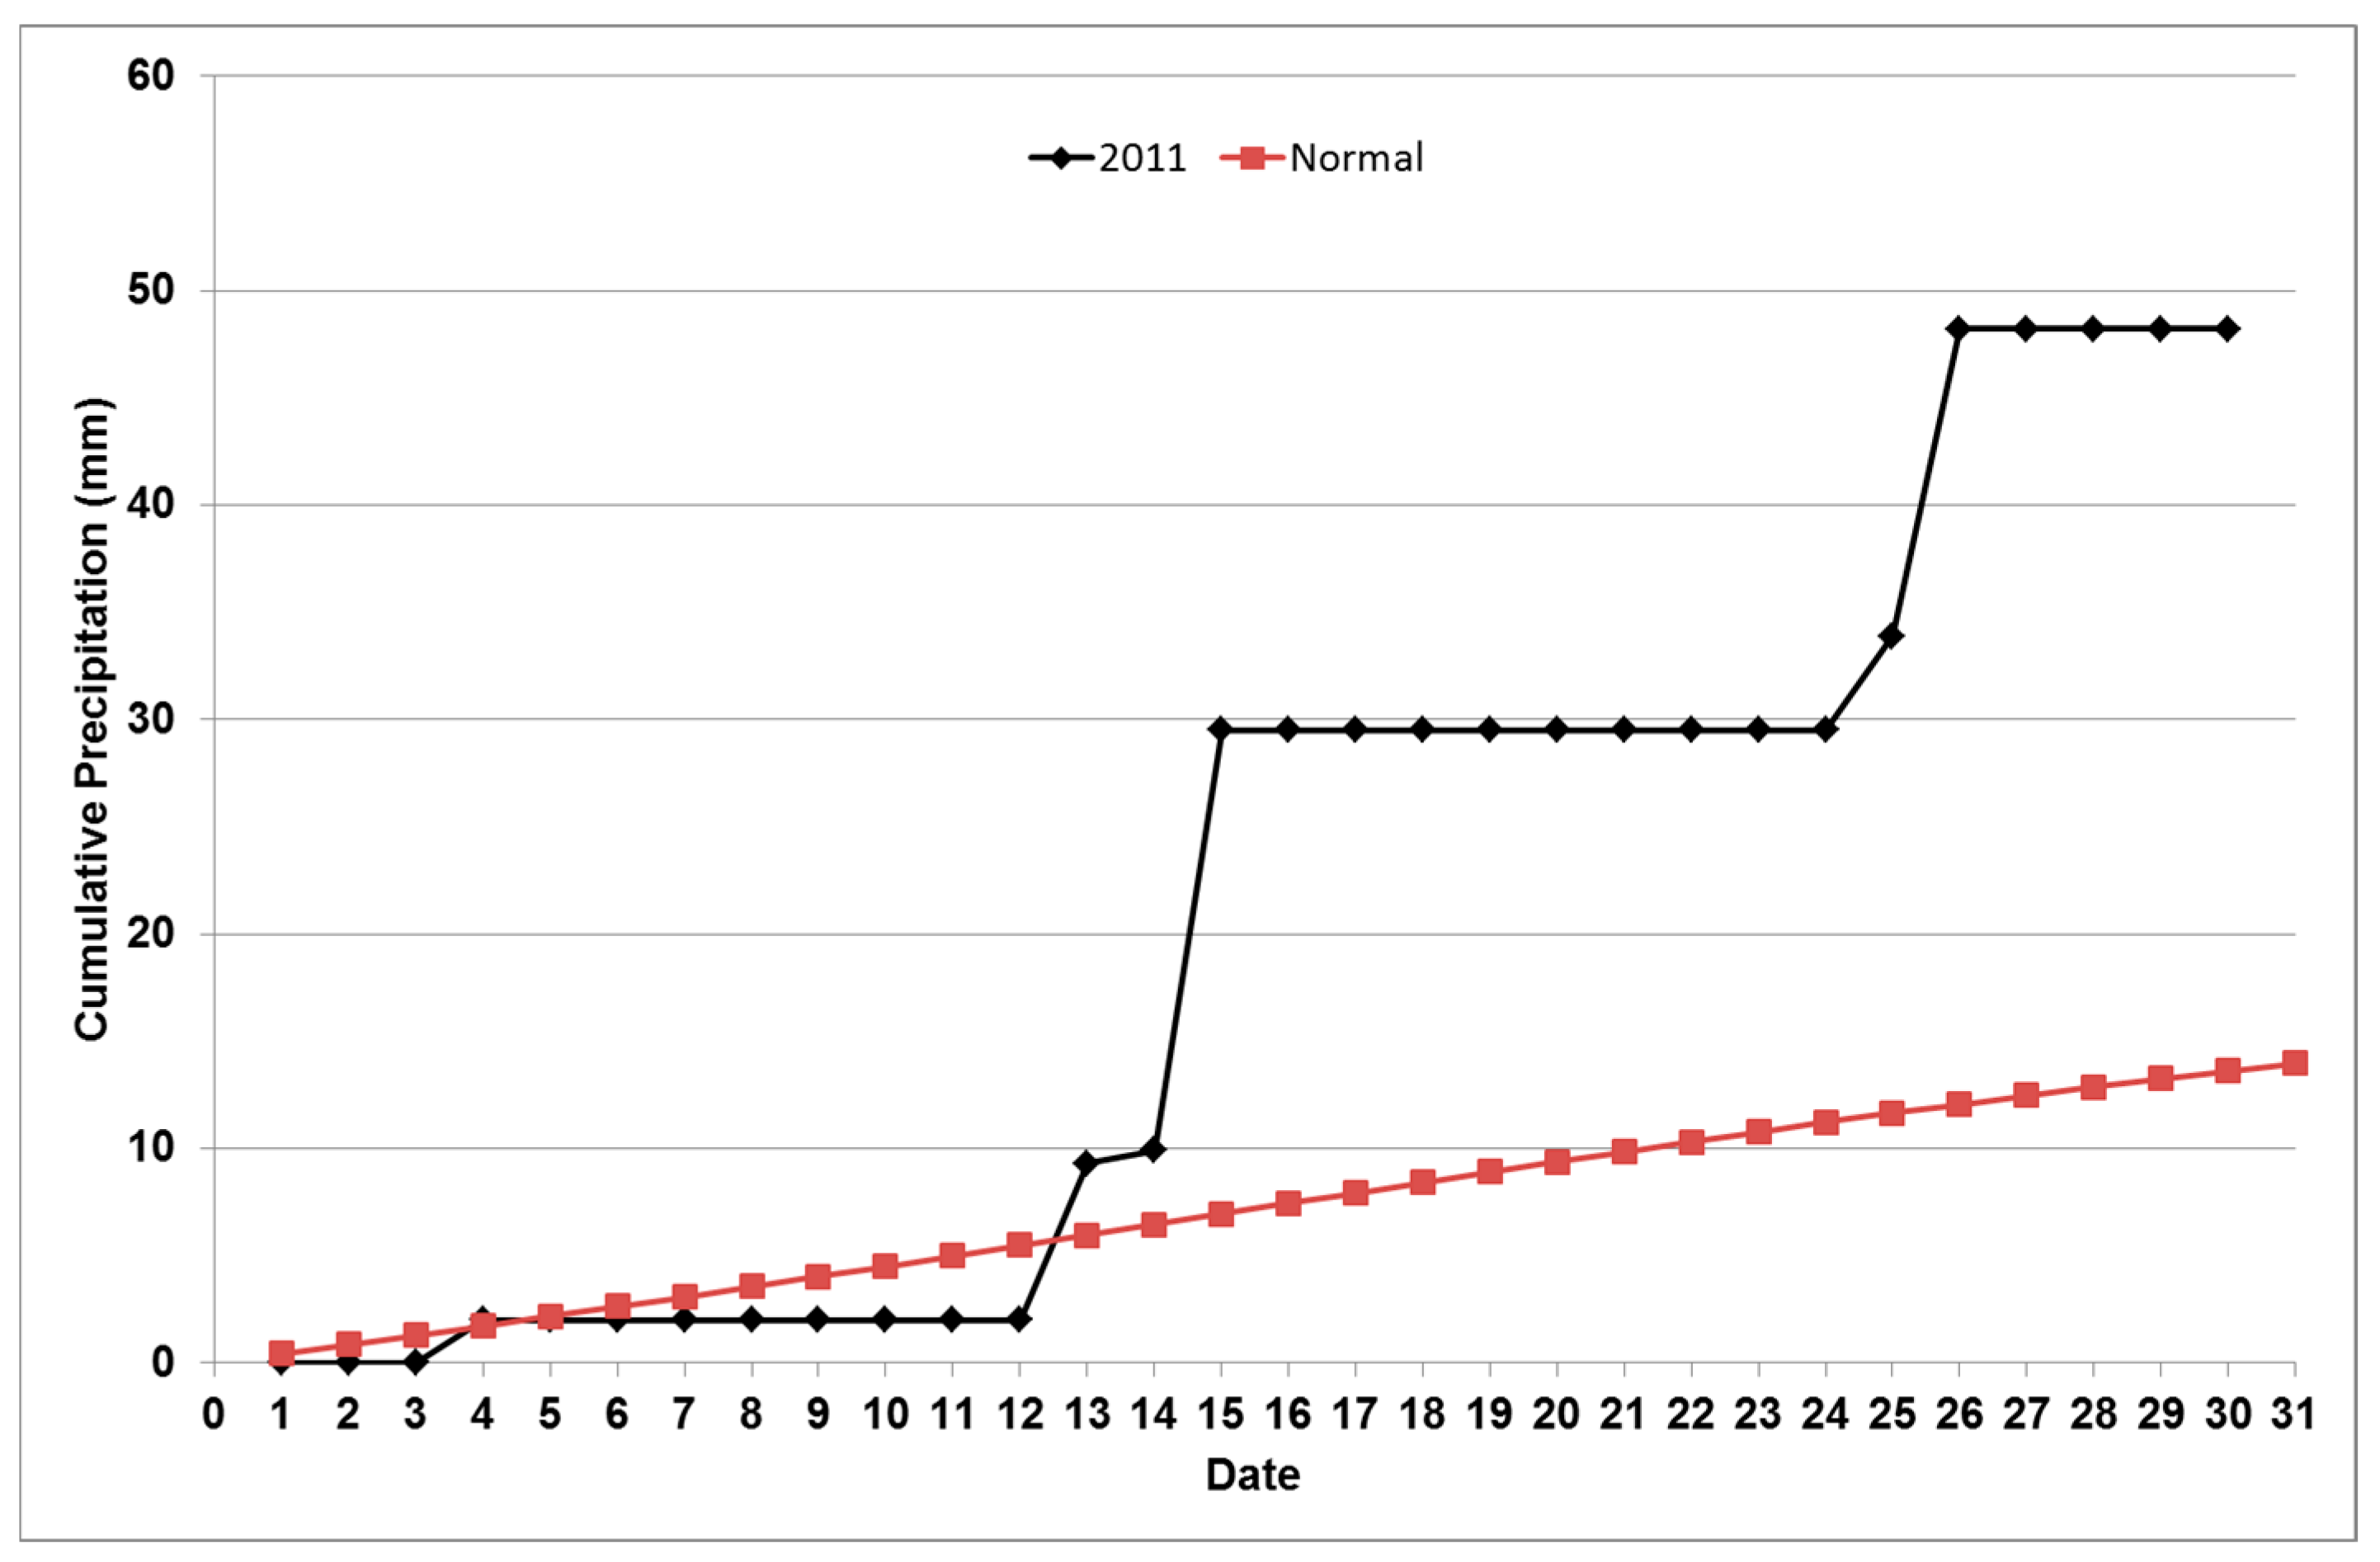
For the 14 January 2011, all indexes (Table 5, CT, CDF, JFI) indicated flooding. However, nothing was mentioned in the published literature. However, as can be seen from the cumulative precipitation figure (Figure 7) for the World Meteorological Organization (WMO) station 41024, which is located in Jeddah, heavy rains were recorded. Also, video clips dated the 14 January 2011 are found on the internet (https://www.youtube.com/watch?v=TiA1AhWrZTs and https://www.youtube.com/watch?v=1mgDiQ4iDUg) showing the flooded streets. Thus, the event on the 14 January 2011 can be treated as a correct detection. Moreover, the TRMM 3B42RT rainfall rates for the 25–26 January 2011 were lower than those for the 14 January 2011.
This is evident from the case that only CDF and JFI indicated flooding for the 25 January 2011. Despite the smaller rainfall intensities, the flood (25–31 January 2011) damage seemed more extensive than on the 14 January 2011. This might have occurred due to soil being saturated by rainfall on the 14 January 2011. Soil moisture is indicated as the second major flood triggering component, and the effect of soil moisture on flood estimations over Riyadh city is shown in [46].
Table 7 shows the flood estimations based on the updates (Table 5) and rain observations for WMO station 41024. In Table 7, flood observed dates are indicated in black boxes. Unfortunately, data for WMO 41024 are available back to 2008 on the website [47]. Table 7 indicates that for CT, 5 out of 6 days; for CDF, 9 out of 14 days; and for JFI, 7 out of 8 days of rain were observed at WMO station 41024. These high detection rates (0.83, 0.64 and 0.88) for CT, CDF and JFI, respectively, show the dependability of the methods. Higher detection rates of JFI with respect to CT support JFI being better in flood estimations.
5. Conclusions
This is the first study to show that during floods in Jeddah, TRMM 3B42RT indicated high rainfall intensities. In addition, the seasonal variation of flood occurrences could be represented by 3B42RT data. Moreover, the rainfall timing and rates seemed to match the Weather Research Forecasting (WRF) Model simulations performed by [16]. The movements of storms from the northwest to southeast seen in 3B42RT images were in parallel with the model results of [16].
Using 3B42RT data, three different indices, constant threshold (CT), cumulative distribution functions (CDFs) and Jeddah Flood Index (JFI), were developed and compared for Jeddah flood detection capability. For the whole TRMM 3B42RT data period, i.e., 2000–1014, CT, CDF and JFI estimated 14, 28 and 20 flood affected days (FADs) where 6, 8 and 7 matched with actual FADs, leading to detection ratios of 6/14, 8/28 and 7/20, respectively. WMO has a station in Jeddah (with id: 41024); on the web, these data go back to 2008. After 2008, CT, CDF and JFI showed 6, 14 and 8 FADs where 5, 9 and 7 days of these, respectively, matched with 41024 rain records. Despite the higher 6/14 ratio of CT, since CT missed January and December floods and because of the higher rain match ratio of JFI with 41024, JFI is considered as the best index to indicate floods in Jeddah.
Accuracy assessments of all three methods were performed by using the flood information obtained from International Disasters Database and by combining information obtained from various papers. Thus, the accuracy of flood information (both location and time) is very important for valid assessments. The need for good documentation of flood events was also mentioned in [22].
Rainfall rate is one of the various flood triggering mechanisms considered in this study. Other parameters such as soil moisture (SM), land use and topography can be helpful in accurate flood predictions. Reductions in false flood alarms by using ancillary soil moisture information in flood estimations was presented by [46]. The occurrence of the 25–31 January 2011 flood despite its lower rainfall rates with respect to the 11–14 January 2011 3B42RT rainfall rates indicate the importance of SM. Thus, future flood estimation studies should consider incorporating SM values.
The task of TRMM has already been terminated. Nevertheless, the methodology presented can be implemented in follow-up missions such as the Global Precipitation Measuring Mission (GPM).
Acknowledgments
The data providers of TRMM 3B42RT Version 7 are acknowledged.
Conflicts of Interest
The author declares no conflicts of interest.
References
- EMA. Hazards, Disasters and Survival; Emergency Management Australia: Dickson, ACT, Australia, 2002.
- Ergünay, O. Acil yardim planlamasi ve Afet yönetimi. Uzman Der Derg. 1999, 10, 6–7. [Google Scholar]
- AFAD. Available online: https://www.afad.gov.tr/tr/IcerikListele.aspx?ID=153 (accessed on 13 July 2016).
- International Federation of Red Cross and Red Crescent Societies. World Disasters Report; International Federation of Red Cross and Red Crescent Societies: New Delhi, Indian, 2003. [Google Scholar]
- Borga, M.; Stoffel, M.; Marchi, L.; Marra, F.; Jakob, M. Hydrogeomorphic response to extreme rainfall in headwater systems: Flash floods and debris flows. J. Hydrol. 2014, 518, 194–205. [Google Scholar] [CrossRef]
- Jonkman, S.N.; Kelman, I. An Analysis of the Causes and Circumstances of Flood Disaster Deaths. Disasters 2005, 29, 75–97. [Google Scholar] [CrossRef] [PubMed]
- Alfieri, L.; Velasco, D.; Thielen, J. Flash flood detection through a multi-stage probabilistic warning system for heavy precipitation events. Adv. Geosci. 2011, 29, 69–75. [Google Scholar] [CrossRef] [Green Version]
- Hapuarachchi, H.A.P.; Wang, Q.J.; Pagano, T.C. A review of advances in flash flood forecasting. Hydrol. Process. 2011, 25, 2771–2784. [Google Scholar] [CrossRef]
- Zipser, E.J.; Cecil, D.J.; Liu, C.; Nesbitt, S.W.; Yorty, D.P. Where are the most intense thunderstorms on earth? Bull. Am. Meteorol. Soc. 2006, 87, 1057–1071. [Google Scholar] [CrossRef]
- Haggag, M.; El-Badry, H. Mesoscale numerical study of quasi-stationary convective system over Jeddah in November 2009. Atmos. Clim. Sci. 2013, 3, 73–86. [Google Scholar] [CrossRef]
- Al Saud, M. Assessment of flood hazard of Jeddah area 2009, Saudi Arabia. J. Water Res. Prot. 2010, 2, 839–847. [Google Scholar] [CrossRef]
- Youssef, A.M.; Sefry, S.A.; Pradhan, B.; Alfadail, E.B. Analysis on causes of flash flood in Jeddah city (Kingdom of Saudi Arabia) of 2009 and 2011 using multi-sensor remote sensing data and GIS. Geomat. Nat. Hazards Risk 2016, 7, 1018–1042. [Google Scholar] [CrossRef]
- Peel, M.C.; Finlayson, B.L.; McMahon, T.A. Updated world map of the Köppen-Geiger climate classification. Hydrol. Earth Syst. Sci. 2007, 11, 1633–1644. [Google Scholar] [CrossRef]
- Negri, A.J.; Burkardt, N.; Golden, J.H.; Halverson, J.B.; Huffman, G.J.; Larsen, M.C.; McGinley, J.A.; Updike, R.G.; Verdin, J.P.; Wieczorek, G.F. The hurricane-flood-landslide continuum. Bull. Am. Meteorol. Soc. 2005, 86, 1241–1247. [Google Scholar] [CrossRef]
- Asante, K.O.; Macuacuca, R.D.; Artan, G.A.; Lietzow, R.W.; Verdin, J.P. Developing a flood monitoring system from remotely sensed data for the Limpopo Basin. IEEE Trans. Geosci. Remote Sens. 2007, 45, 1709–1714. [Google Scholar] [CrossRef]
- Deng, L.; McCabe, M.F.; Stenchikov, G.; Evans, J.P.; Kucera, P.A. Simulation of flash flood producing storm events in Saudi Arabia using the Weather Research and Forecasting Model. J. Hydrom. 2015, 16, 615–630. [Google Scholar] [CrossRef]
- Wardah, T.; Abu Bakar, S.H.; Bardossy, A.; Maznorizan, M. Use of geostationary meteorological satelliteimages in convective rain estimation for flash-flood forecasting. J. Hydrol. 2008, 356, 283–298. [Google Scholar] [CrossRef]
- Hong, Y.; Adler, R.F.; Negri, A.; Huffman, G.J. Flood and landslide applications of near real-time satellite rainfall products. Nat. Hazards 2007, 43, 285–294. [Google Scholar] [CrossRef]
- Hong, Y.; Adler, R.F.; Huffman, G.J.; Pierce, H.; Gebremichael, M.; Hossain, F. Applications of TRMM-Based Multi-Satellite Precipitation Estimation for Global Runoff Prediction: Prototyping a Global Flood Modeling System. In Satellite Rainfall Applications for Surface Hydrology, 1st ed.; Gebremichael, M., Hossain, F., Eds.; Springer: New York, NY, USA, 2010. [Google Scholar]
- Hatim, O.S.; Al-Zahrani, M.; El-Hassan, A. Physically, Fully-Distributed Hydrologic Simulations Driven by GPM Satellite Rainfall over an Urbanizing Arid Catchment in Saudi Arabia. Water 2017, 9, 163. [Google Scholar] [CrossRef]
- Wikipedia. Available online: https://en.wikipedia.org/wiki/Jeddah#Climate (accessed on 30 April 2017).
- Alamri, Y.A. Rains and Floods in Saudi Arabia. Crying of the Sky or of the People? Saudi Med. J. 2011, 32, 3. [Google Scholar]
- The Saudi Blog. Available online: http://the-saudi-blog.blogspot.com.tr/2006/10/jeddah-suffers.html (accessed on 15 August 2017).
- Almazroui, M.; Raju, P.V.S.; Yusef, A.; Hussein, M.A.A.; Omar, M. Simulation of extreme rainfall event of November 2009 over Jeddah, Saudi Arabia: The explicit role of topography and surface heating. Theor. Appl. Climatol. 2017, 1–13. [Google Scholar] [CrossRef]
- Ameur, F. Floods in Jeddah, Saudi Arabia: Unusual phenomenon and huge losses. In Proceedings of the 3rd European Conference on Flood Risk Management, FLOODrisk 2016, E3S Web of Conferences 7, 04019, Lyon, France, 17–21 September 2016. [Google Scholar] [CrossRef]
- Subyani, A.M. Flood Hazards Analysis of Jeddah City, Western Saudi Arabia. JAKU Earth Sci. 2011, 23, 35–48. [Google Scholar] [CrossRef]
- Al-Khalaf, A.K.; Basset, H.A. Diagnostic study of a severe thunderstorm over Jeddah. Atmos. Clim. Sci. 2013, 3, 150–164. [Google Scholar]
- International Disasters Database. Available online: http://emdat.be/disaster_list/index.html (accessed on 30 April 2017).
- Global Hazards. Available online: https://www.ncdc.nocc.gov/sotc/hazards/201007 (accessed on 15 August 2017).
- TRMM. Available online: https://pmm.nasa.gov/TRMM/trmm-instruments (accessed on 31 January 2017).
- Wanders, N.; Pan, M.; Wood, E.F. Correction of real time satellite precipitation with multi sensor satellite observations of land surface variables. Remote Sens. Environ. 2015, 160, 206–221. [Google Scholar] [CrossRef]
- Huffman, G.J.; Adler, R.F.; Bolvin, D.T.; Gu, G.; Nelkin, E.J.; Bowman, K.P.; Hong, Y.; Stocker, E.F.; Wolff, D.B. The TRMM Multisatellite Precipitation Analysis (TMPA): Quasi-Global, Multilayer, Combined-Sensor Precipitation Estimates at Fine Scales. J. Hydrom. 2007, 8, 38–55. [Google Scholar] [CrossRef]
- Almazroui, M. Calibration of TRMM rainfall climatology over Saudi Arabia during 1998–2009. Atmos. Res. 2011, 99, 400–414. [Google Scholar] [CrossRef]
- Kheimi, M.M.; Gutub, S. Assessment of remotely sensed precipitation products across the Saudi Arabia region. In Proceedings of the 6th International Conference on Water Resources and Arid Environments, Riyadh, Saudi Arabia, 16–17 December 2014; pp. 315–327. [Google Scholar]
- Tekeli, A.E.; Fouli, H. Evaluation of TRMM satellite-based precipitation indexes for flood forecasting over Riyadh City, Saudi Arabia. J. Hydrol. 2016, 31, 1243. [Google Scholar] [CrossRef]
- Duan, Z.; Bastiaanssen, W.G.M. First results from Version 7 TRMM 3B43 precipitation product in combination with a new downscaling-calibration procedure. Remote Sens. Environ. 2013, 131, 1–13. [Google Scholar] [CrossRef]
- TRMM. Available online: http://trmm.gsfc.nasa.gov/3b42.html (accessed on 31 January 2017).
- Alfieri, L.; Thielen, J. A European precipitation index for extreme rain-storm and flash flood early warning. Meteorol. Appl. 2012, 22, 3–13. [Google Scholar] [CrossRef]
- Zehe, E.; Sivapalan, M. Threshold behaviour in hydrological systems as (human) geo-ecosystems: Manifestations, controls, implications. Hydrol. Earth Syst. Sci. 2009, 13, 1273–1297. [Google Scholar] [CrossRef]
- Hamada, A.; Murayama, Y.; Takayabu, Y.N. Regional Characteristics of Extreme Rainfall Extracted from TRMM PR Measurements. J. Clim. 2014, 27, 8151–8169. [Google Scholar] [CrossRef]
- Usul, N. Engineering Hydrology, 3rd ed.; METU Press: Ankara, Turkey, 2005. [Google Scholar]
- Ewea, H.A.; Elfeki, A.M.; Al-Amri, N.S. Development of intensity-duration-frequency curves for the Kingdom of Saudi Arabia. Geomat. Nat. Hazards Risk 2016, 1–15. [Google Scholar] [CrossRef]
- Viessman, W.; Lewis, G.L. Introduction to Hydrology, 5th ed.; Prentice Hall: Upper Saddle River, NJ, USA, 2002. [Google Scholar]
- Dönmez, S.; Tekeli, A.E. Comparison of TRMM based flood indices for Gaziantep, Turkey. Nat. Hazards 2017, 88, 821–834. [Google Scholar] [CrossRef]
- Pombo, S.; De Oliveira, R.P. Evaluation of extreme precipitation estimates from TRMM in Angola. J. Hydrol. 2015, 523, 663–679. [Google Scholar] [CrossRef]
- Tekeli, A.E.; Fouli, H. Reducing False Flood Warnings of TRMM Rain Rates Thresholds over Riyadh City, Saudi Arabia by Utilizing AMSR-E Soil Moisture Information. Water Resour. Manag. 2017, 541, 471–479. [Google Scholar] [CrossRef]
- WMO. Available online: https://gis.pecad.fas.usda.gov/WmoStationExplorer/ (accessed on 15 August 2017).
Figure 1.
Flooding event in Jeddah from 24–26 November 2009 (a) Source: https://ontheredsea.wordpress.com/tag/jeddah/, location of Jeddah in KSA (b) Source: http://www.weather-forecast.com/system/images/249/original/Jeddah.jpg?1299372620, Digital Elevation Model of Jeddah city and surroundings obtained from ASTER DEM (30 m) (c).

Figure 2.
Monthly maximum, average and minimum air temperatures (°C), monthly cumulative precipitation (mm) and number of observed floods for Jeddah (Data source: https://en.wikipedia.org/wiki/Jeddah#Climate).
Figure 2.
Monthly maximum, average and minimum air temperatures (°C), monthly cumulative precipitation (mm) and number of observed floods for Jeddah (Data source: https://en.wikipedia.org/wiki/Jeddah#Climate).
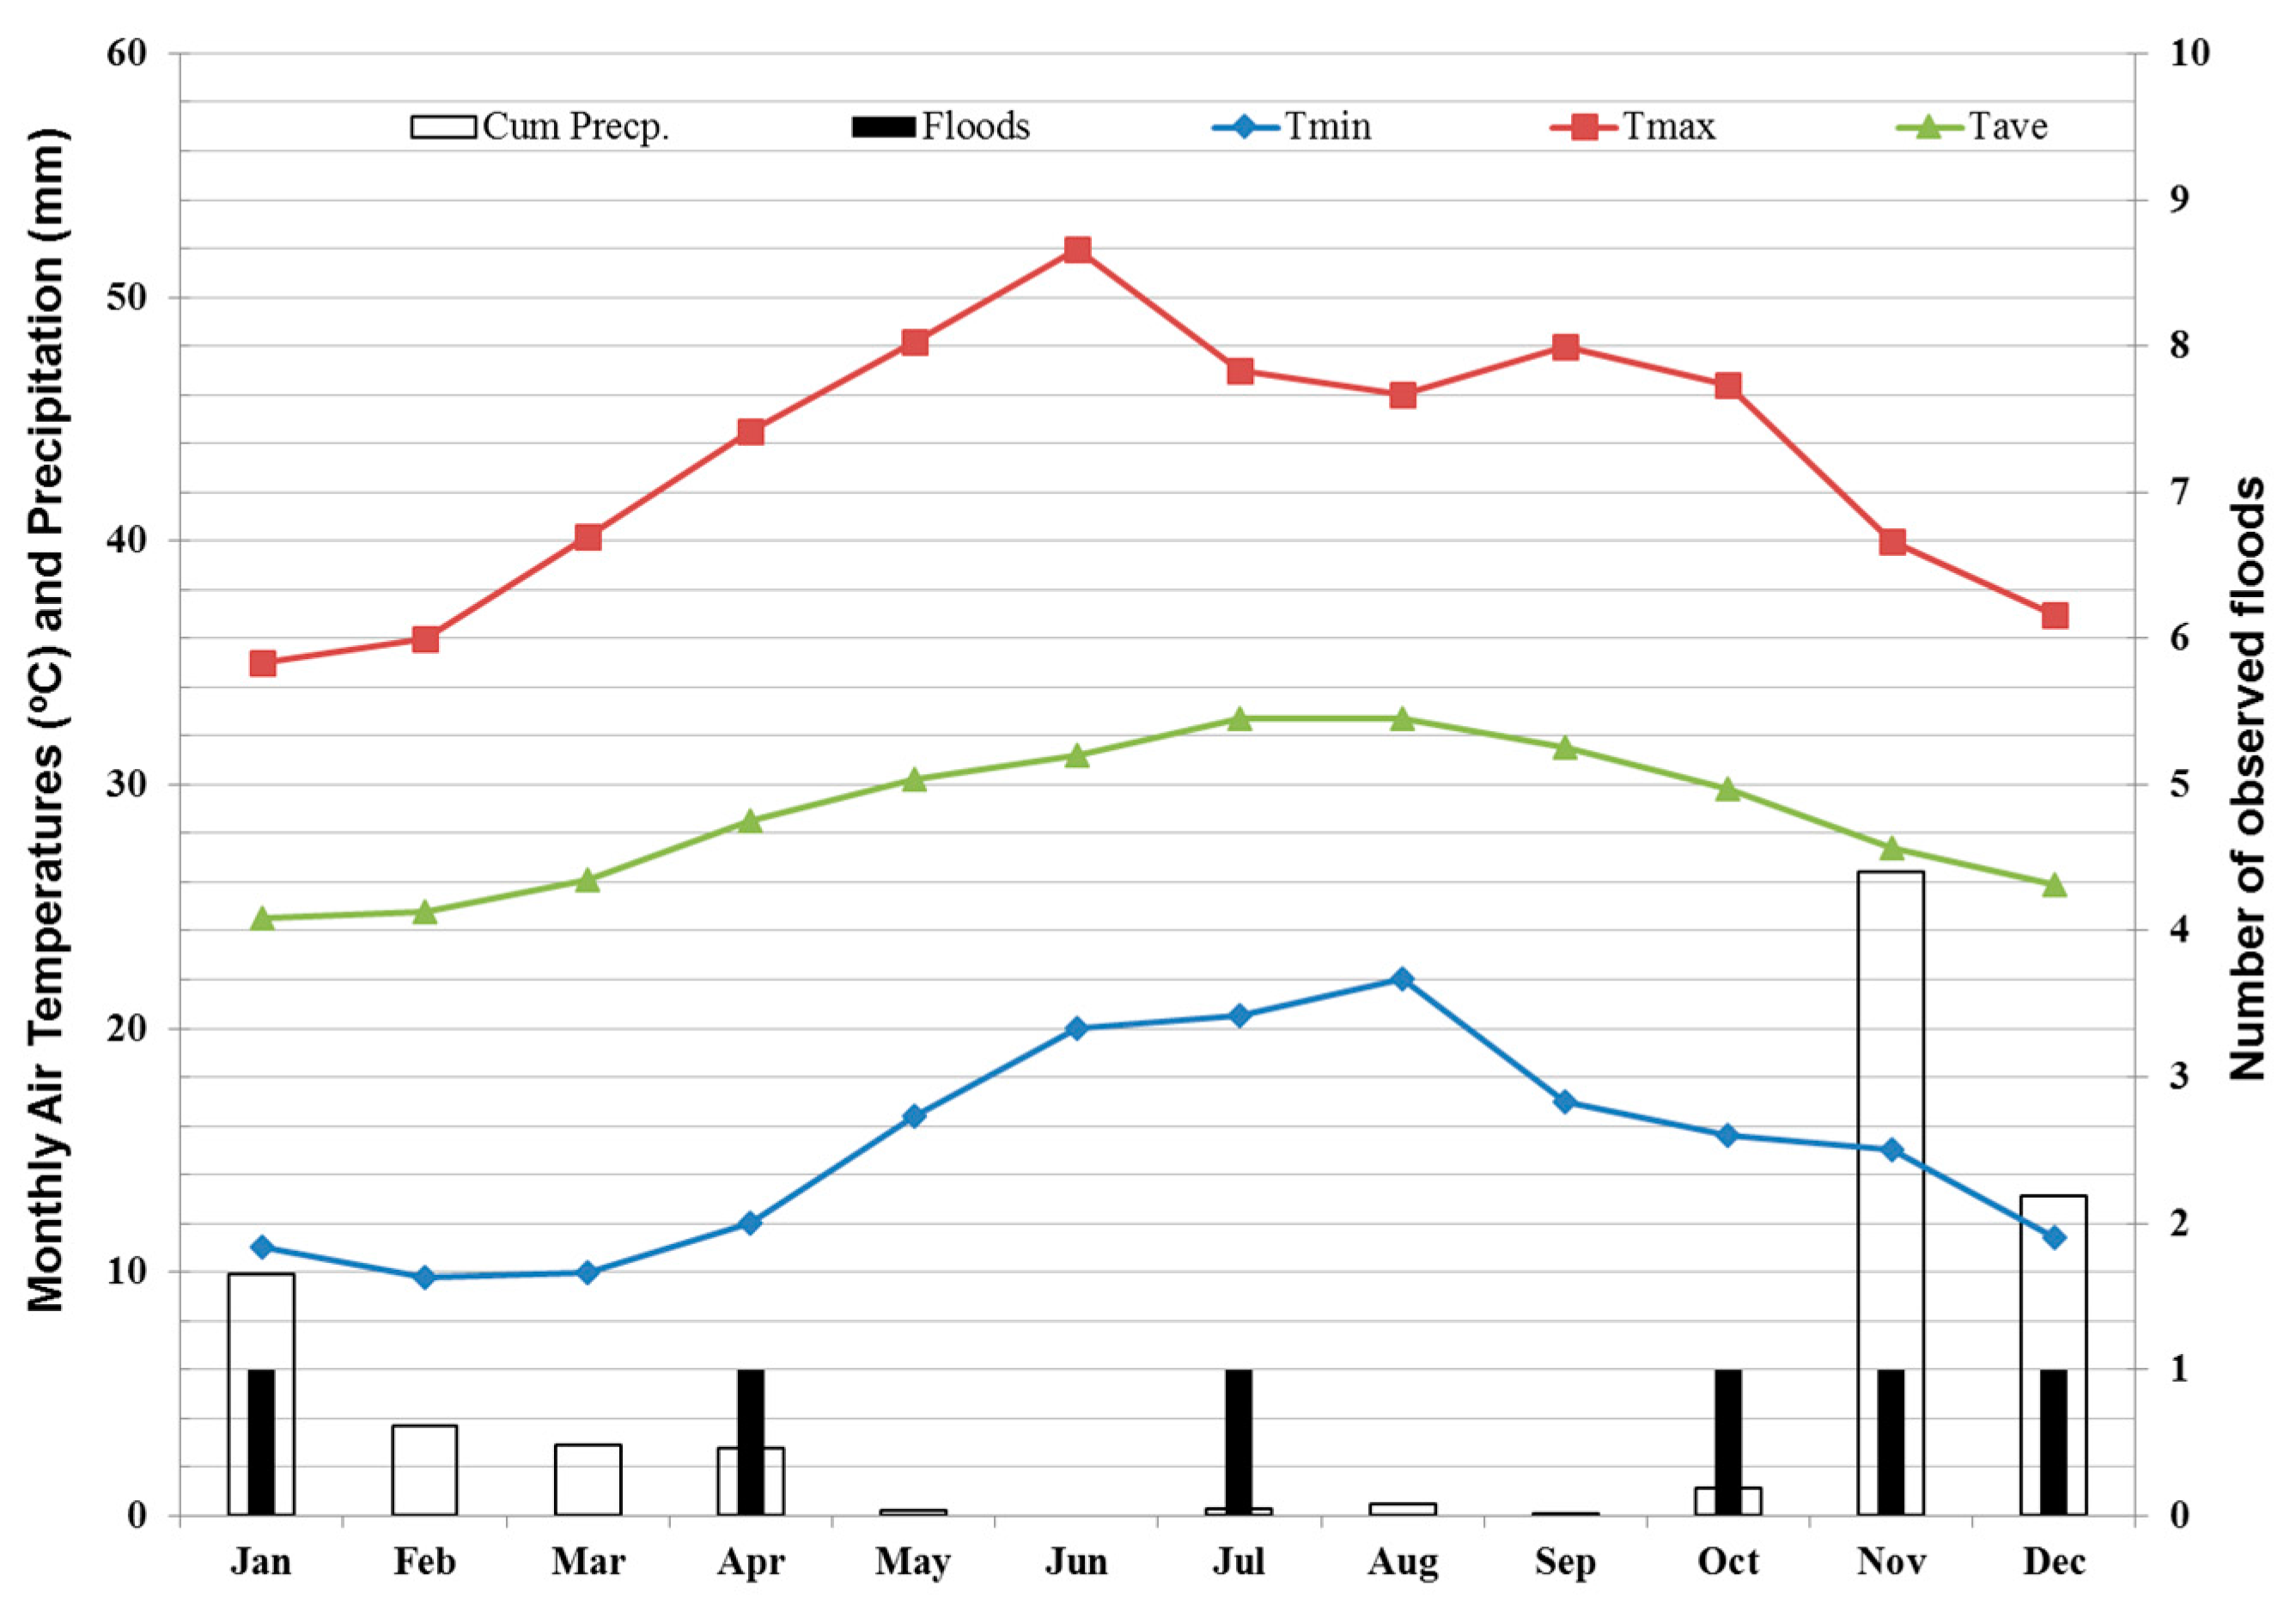
Figure 3.
Coverage of TRMM 3B42RT pixels over Jeddah.
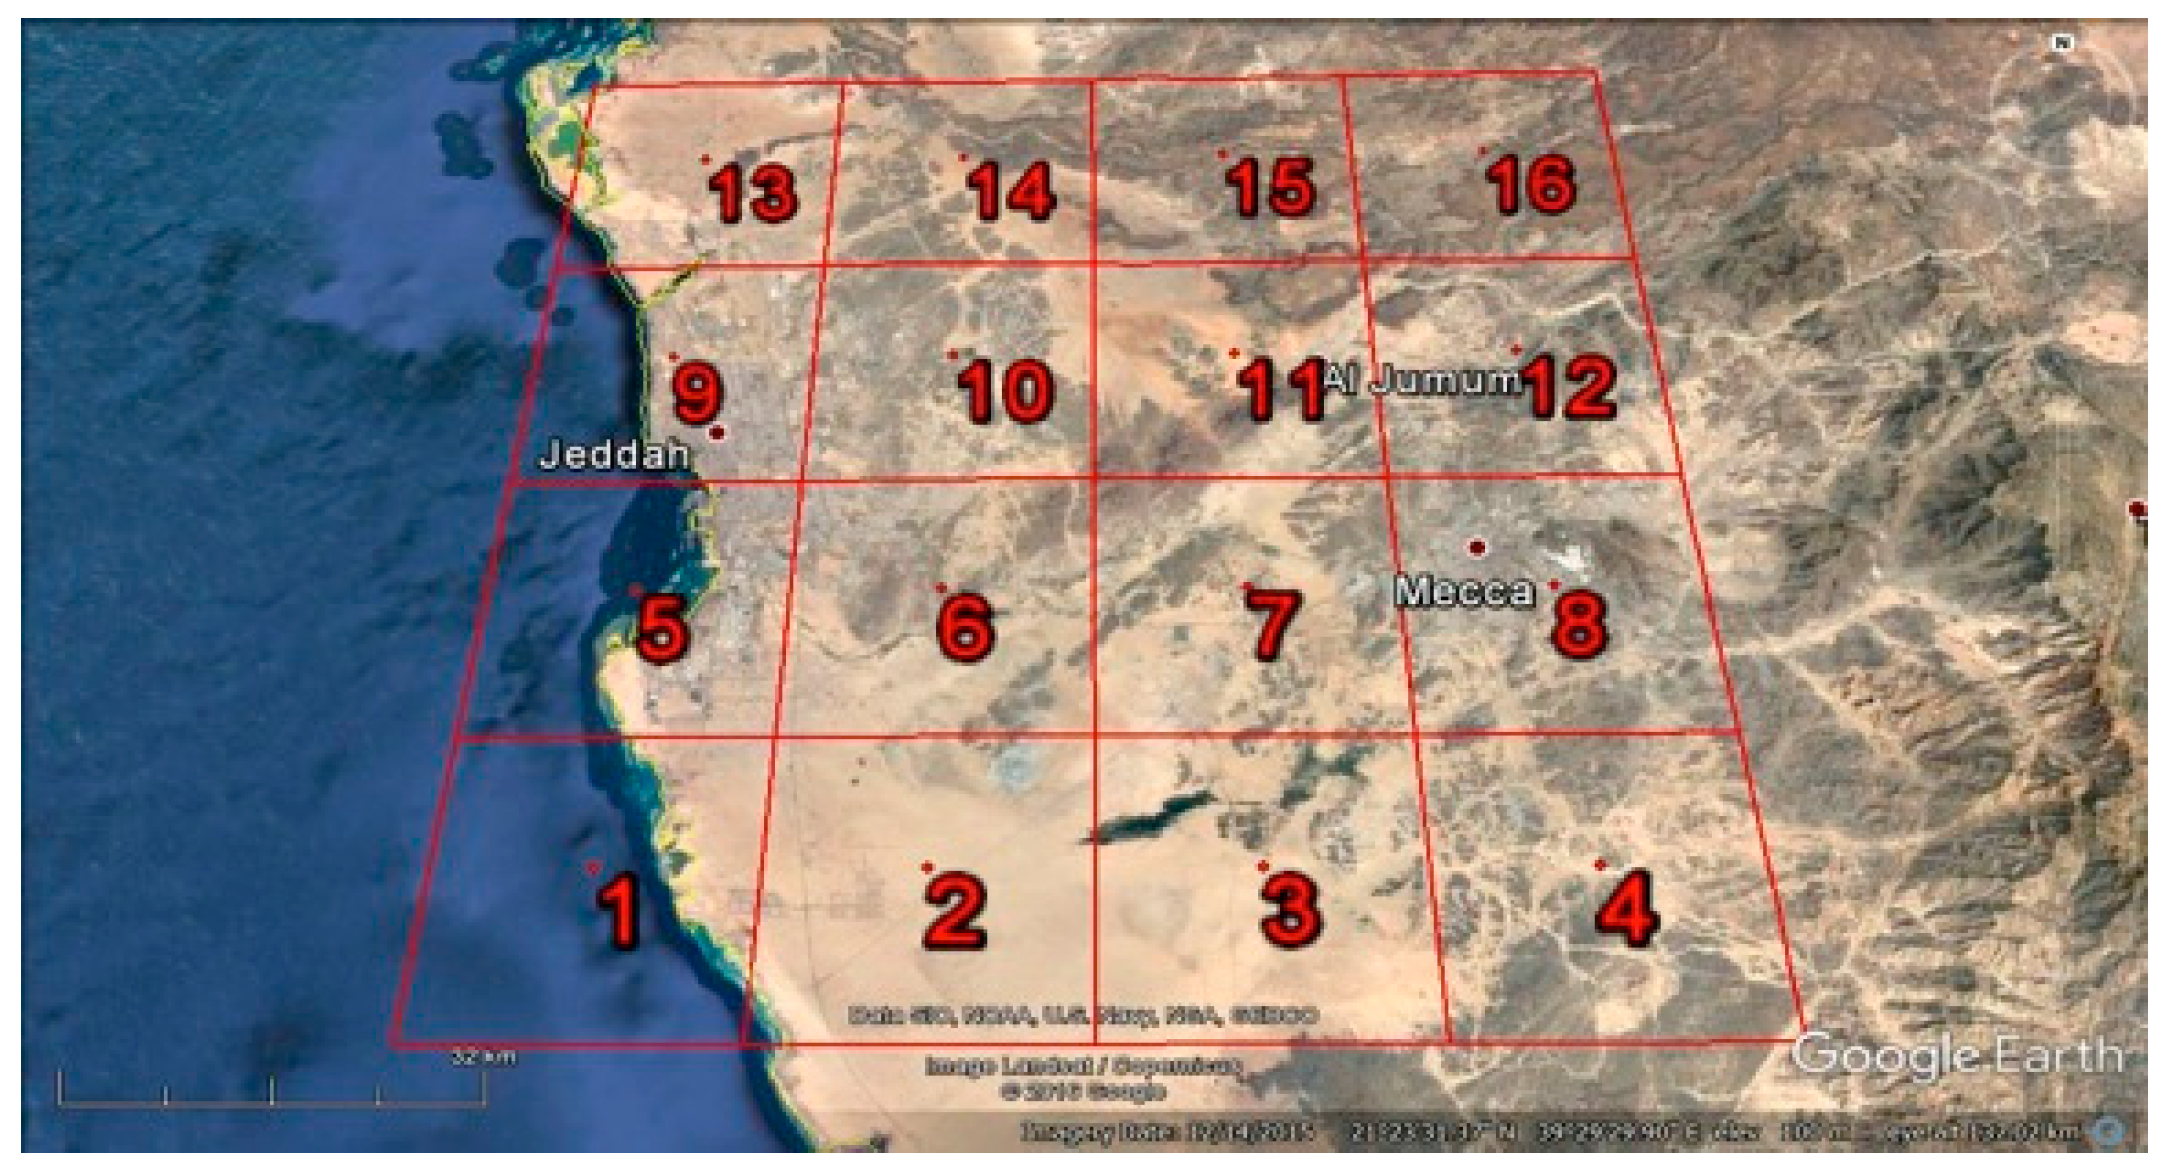
Figure 4.
3B42RT rainfall rates for 24–25 November 2009 (in mm/h) indicated in year/month/day/hour.

Figure 5.
Cumulative distribution functions of 3B42RT pixels over Jeddah. P indicates the pixel numbers given in Figure 3. (Rain rates should be multiplied by 0.01).
Figure 5.
Cumulative distribution functions of 3B42RT pixels over Jeddah. P indicates the pixel numbers given in Figure 3. (Rain rates should be multiplied by 0.01).
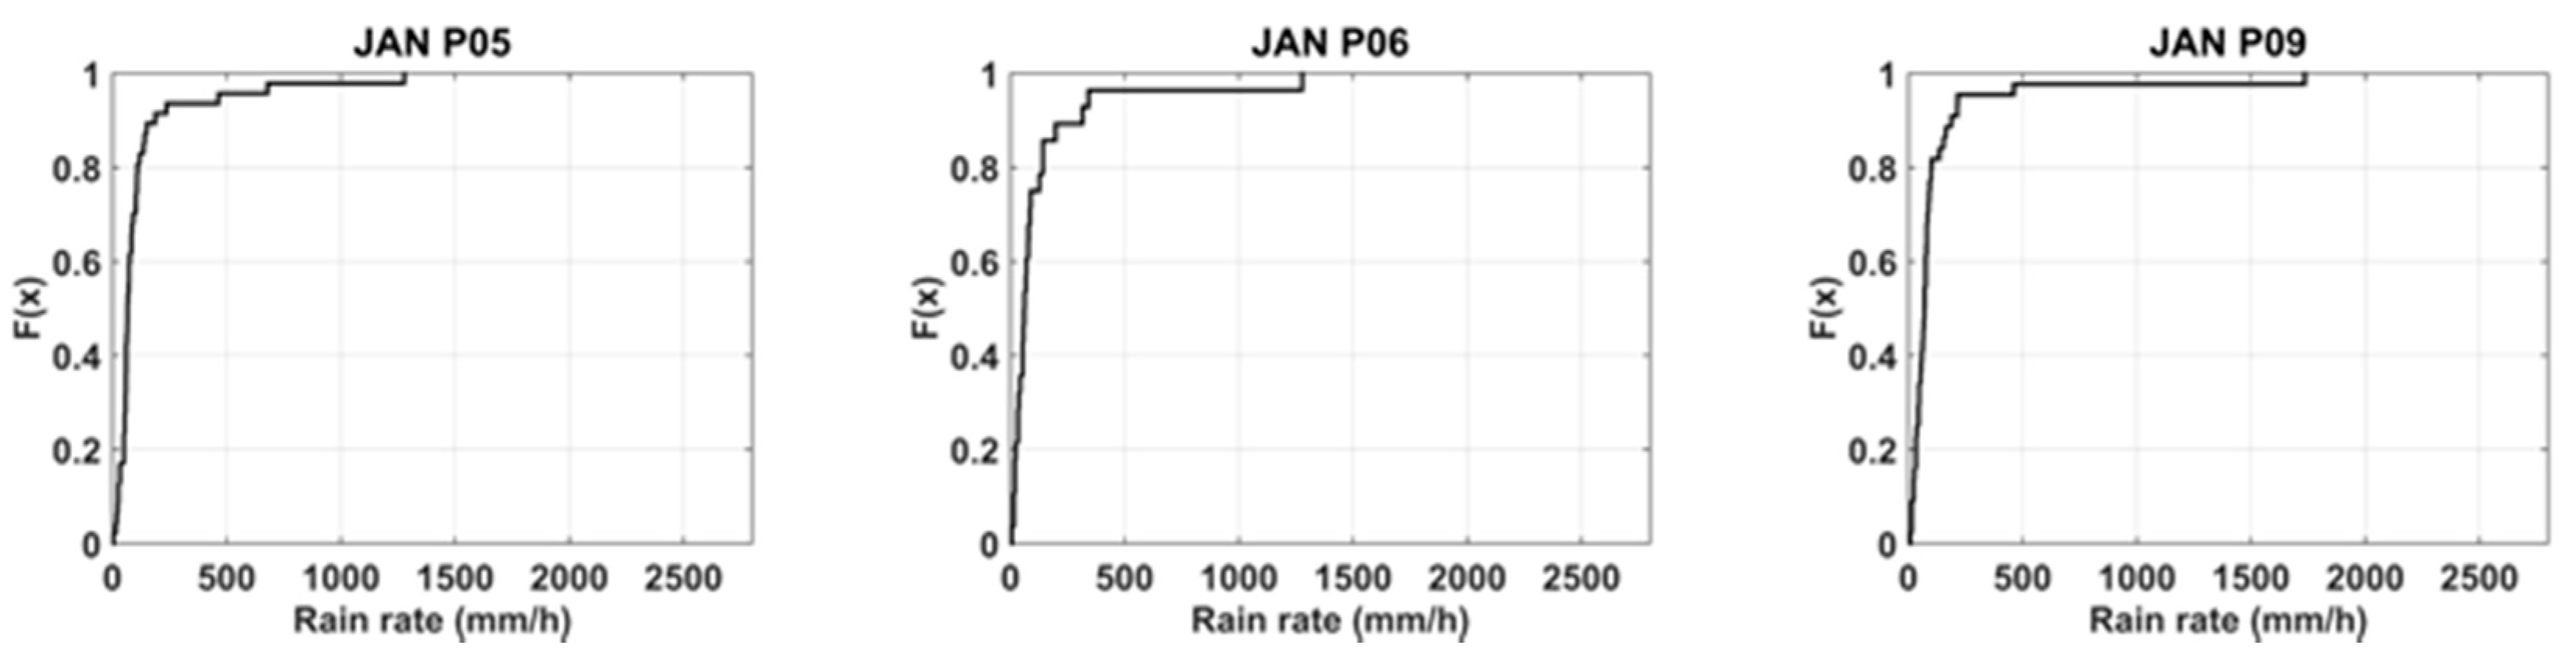


Figure 6.
Temporal distribution of major flood events over Jeddah throughout the year and minima (black squares) and maxima (red diamonds) rainfall rates obtained from 3B42RT data for Jeddah between 2000 and 2014.
Figure 6.
Temporal distribution of major flood events over Jeddah throughout the year and minima (black squares) and maxima (red diamonds) rainfall rates obtained from 3B42RT data for Jeddah between 2000 and 2014.

Figure 7.
Cumulative precipitation plot for WMO station 41024 in Jeddah.


Table 1.
Major flood events observed over Jeddah city in KSA.
| Start | End | Flood Affected | |
|---|---|---|---|
| Date | Date | Days | Data Source |
| 28 April 2005 | 28 April 2005 | 1 | [22] |
| 29 October 2006 | 31 October 2006 | 3 | [23] |
| 24 November 2009 | 26 November 2009 | 3 | [10,16,22,24,25,26,27,28] |
| 13 July 2010 | 16 July 2010 | 4 | [29] |
| 30 December 2010 | * | 1 | [10,25] |
| 25 January 2011 | 31 January 2011 | 7 | [10,24,25,26,28] |
Note: * Related information could not be found.
Table 2.
Calculated rainfall intensities using Equation (1) for Jeddah city in KSA.
| Tr (Years) | Duration (min) | I (mm/h) |
|---|---|---|
| 2.33 | 180 | 10.37 |
| 5 | 180 | 14.13 |
| 25 | 180 | 23.11 |
| 50 | 180 | 27.44 |
| 100 | 180 | 32.08 |
Table 3.
Calculated monthly denominator values for JFI (Equation (2)) for Jeddah city in KSA (mm/h).
Table 3.
Calculated monthly denominator values for JFI (Equation (2)) for Jeddah city in KSA (mm/h).
| P5 | P6 | P9 | P10 | P13 | P14 | |
|---|---|---|---|---|---|---|
| January | 2.48 | 2.32 | 2.42 | 3.33 | 1.78 | 2.70 |
| February | 1.18 | 1.59 | 1.09 | 0.73 | 0.83 | 1.07 |
| March | 0.86 | 0.87 | 1.45 | 0.76 | 1.00 | 1.26 |
| April | 2.26 | 3.06 | 2.40 | 3.25 | 2.37 | 2.50 |
| May | 1.82 | 3.07 | 1.98 | 1.90 | 1.63 | 1.42 |
| June | 1.13 | 0.48 | 1.28 | 0.38 | 0.87 | 0.64 |
| July | 2.87 | 3.66 | 1.57 | 1.07 | 0.99 | 1.51 |
| August | 2.60 | 5.01 | 3.15 | 4.08 | 1.85 | 3.06 |
| September | 0.43 | 0.69 | 0.39 | 3.04 | 0.52 | 5.16 |
| October | 5.29 | 5.26 | 3.70 | 9.04 | 3.35 | 5.91 |
| November | 4.27 | 6.92 | 4.08 | 4.83 | 2.66 | 4.60 |
| December | 1.78 | 3.34 | 3.53 | 5.34 | 2.10 | 1.75 |
Table 4.
Estimated flood dates and time (UTC) according to the constant threshold (10.37 mm/h), cumulative distribution function (90%) and Jeddah flood index (1.00).
Table 4.
Estimated flood dates and time (UTC) according to the constant threshold (10.37 mm/h), cumulative distribution function (90%) and Jeddah flood index (1.00).
| Year | Month | Day | Hour | CT | CDF | JFI | Year | Month | Day | Hour | CT | CDF | JFI |
|---|---|---|---|---|---|---|---|---|---|---|---|---|---|
| 2003 | 1 | 15 | 12 | X | X | 2000 | 10 | 14 | 21 | X | X | X | |
| 2003 | 1 | 16 | 0 | X | X | 2006 | 10 | 29 | 3 | X | X | X | |
| 2004 | 1 | 8 | 18 | X | X | 2006 | 10 | 30 | 12 | X | X | X | |
| 2004 | 1 | 12 | 0 | X | 2006 | 10 | 30 | 15 | X | X | X | ||
| 2008 | 1 | 10 | 21 | X | 2006 | 10 | 31 | 15 | X | X | X | ||
| 2009 | 1 | 12 | 15 | X | |||||||||
| 2010 | 1 | 7 | 0 | X | X | 2000 | 11 | 13 | 18 | X | |||
| 2011 | 1 | 14 | 18 | X | X | X | 2000 | 11 | 14 | 0 | X | ||
| 2011 | 1 | 14 | 21 | X | X | X | 2000 | 11 | 16 | 18 | X | X | |
| 2011 | 1 | 25 | 18 | X | X | 2003 | 11 | 23 | 15 | X | |||
| 2011 | 1 | 26 | 0 | X | 2003 | 11 | 24 | 9 | X | ||||
| 2011 | 1 | 26 | 3 | X | 2003 | 11 | 25 | 6 | X | X | X | ||
| 2011 | 1 | 26 | 6 | X | X | 2003 | 11 | 25 | 9 | X | X | X | |
| 2011 | 1 | 26 | 9 | X | X | 2003 | 11 | 25 | 12 | X | X | X | |
| 2004 | 11 | 3 | 15 | X | X | X | |||||||
| 2004 | 4 | 3 | 21 | X | 2009 | 11 | 25 | 6 | X | X | X | ||
| 2000 | 4 | 4 | 0 | X | X | 2009 | 11 | 25 | 12 | X | X | X | |
| 2000 | 4 | 4 | 3 | X | X | 2012 | 11 | 18 | 21 | X | |||
| 2000 | 4 | 4 | 6 | X | X | 2012 | 11 | 23 | 15 | X | |||
| 2000 | 4 | 4 | 12 | X | X | 2013 | 11 | 10 | 9 | X | |||
| 2004 | 4 | 23 | 6 | X | 2014 | 11 | 16 | 12 | X | X | |||
| 2005 | 4 | 18 | 15 | X | X | X | 2014 | 11 | 21 | 21 | X | X | X |
| 2005 | 4 | 25 | 21 | X | X | ||||||||
| 2005 | 4 | 28 | 3 | X | X | X | 2001 | 12 | 31 | 12 | X | X | |
| 2005 | 4 | 28 | 9 | X | 2004 | 12 | 3 | 18 | X | X | |||
| 2006 | 4 | 4 | 21 | X | X | 2004 | 12 | 8 | 0 | X | X | ||
| 2006 | 4 | 9 | 9 | X | 2009 | 12 | 22 | 18 | X | X | X | ||
| 2006 | 4 | 13 | 21 | X | X | 2009 | 12 | 22 | 21 | X | X | X | |
| 2006 | 4 | 27 | 0 | X | X | 2010 | 12 | 9 | 12 | X | X | ||
| 2008 | 4 | 12 | 21 | X | 2010 | 12 | 10 | 0 | X | X | |||
| 2010 | 4 | 3 | 21 | X | X | 2010 | 12 | 11 | 0 | X | X | ||
| 2012 | 4 | 4 | 18 | X | 2010 | 12 | 29 | 6 | X | X | |||
| 2010 | 12 | 29 | 9 | X | X | ||||||||
| 2001 | 7 | 14 | 21 | X | 2010 | 12 | 30 | 6 | X | ||||
| 2005 | 7 | 29 | 0 | X | 2014 | 12 | 8 | 12 | X | ||||
| 2008 | 7 | 20 | 15 | X | |||||||||
| 2008 | 7 | 24 | 21 | X | |||||||||
| 2010 | 7 | 11 | 18 | X | X | X | |||||||
| 2010 | 7 | 11 | 21 | X | X | ||||||||
| 2010 | 7 | 14 | 15 | X | X | X | |||||||
| 2010 | 7 | 14 | 18 | X | X | ||||||||
| 2010 | 7 | 19 | 0 | X | X | ||||||||
| 2011 | 7 | 10 | 3 | X | |||||||||
| 2012 | 7 | 27 | 15 | X | X | ||||||||
| 2014 | 7 | 6 | 18 | X |
Note: Estimated events that match with the real flood observations are framed by a thick dark border.
Table 5.
Estimated flood dates and time (UTC) according to the constant threshold (10.37 mm/h), and updated cumulative distribution function and Jeddah flood index.
Table 5.
Estimated flood dates and time (UTC) according to the constant threshold (10.37 mm/h), and updated cumulative distribution function and Jeddah flood index.
| Year | Month | Day | Hour | CT | CDF | JFI | Year | Month | Day | Hour | CT | CDF | JFI |
|---|---|---|---|---|---|---|---|---|---|---|---|---|---|
| 2003 | 1 | 15 | 12 | 2000 | 10 | 14 | 21 | X | X | ||||
| 2003 | 1 | 16 | 0 | 2006 | 10 | 29 | 3 | X | X | X | |||
| 2004 | 1 | 8 | 18 | 2006 | 10 | 30 | 12 | X | X | ||||
| 2004 | 1 | 12 | 0 | 2006 | 10 | 30 | 15 | X | X | ||||
| 2008 | 1 | 10 | 21 | 2006 | 10 | 31 | 15 | X | X | X | |||
| 2009 | 1 | 12 | 15 | ||||||||||
| 2010 | 1 | 7 | 0 | 2000 | 11 | 13 | 18 | ||||||
| 2011 | 1 | 14 | 18 | X | X | X | 2000 | 11 | 14 | 0 | |||
| 2011 | 1 | 14 | 21 | X | X | X | 2000 | 11 | 16 | 18 | |||
| 2011 | 1 | 25 | 18 | X | X | 2003 | 11 | 23 | 15 | ||||
| 2011 | 1 | 26 | 0 | 2003 | 11 | 24 | 9 | ||||||
| 2011 | 1 | 26 | 3 | 2003 | 11 | 25 | 6 | X | X | X | |||
| 2011 | 1 | 26 | 6 | 2003 | 11 | 25 | 9 | X | X | X | |||
| 2011 | 1 | 26 | 9 | 2003 | 11 | 25 | 12 | X | X | X | |||
| 2004 | 11 | 3 | 15 | X | X | X | |||||||
| 2004 | 4 | 3 | 21 | 2009 | 11 | 25 | 6 | X | X | X | |||
| 2000 | 4 | 4 | 0 | X | 2009 | 11 | 25 | 12 | X | X | X | ||
| 2000 | 4 | 4 | 3 | X | X | 2012 | 11 | 18 | 21 | ||||
| 2000 | 4 | 4 | 6 | 2012 | 11 | 23 | 15 | ||||||
| 2000 | 4 | 4 | 12 | X | 2013 | 11 | 10 | 9 | |||||
| 2004 | 4 | 23 | 6 | 2014 | 11 | 16 | 12 | ||||||
| 2005 | 4 | 18 | 15 | X | X | X | 2014 | 11 | 21 | 21 | |||
| 2005 | 4 | 25 | 21 | X | X | ||||||||
| 2005 | 4 | 28 | 3 | X | X | X | 2001 | 12 | 31 | 12 | X | X | |
| 2005 | 4 | 28 | 9 | 2004 | 12 | 3 | 18 | X | |||||
| 2006 | 4 | 4 | 21 | X | 2004 | 12 | 8 | 0 | X | ||||
| 2006 | 4 | 9 | 9 | 2009 | 12 | 22 | 18 | X | X | X | |||
| 2006 | 4 | 13 | 21 | X | X | 2009 | 12 | 22 | 21 | X | X | ||
| 2006 | 4 | 27 | 0 | X | 2010 | 12 | 9 | 12 | X | ||||
| 2008 | 4 | 12 | 21 | 2010 | 12 | 10 | 0 | ||||||
| 2010 | 4 | 3 | 21 | X | 2010 | 12 | 11 | 0 | X | ||||
| 2012 | 4 | 4 | 18 | 2010 | 12 | 29 | 6 | X | X | ||||
| 2010 | 12 | 29 | 9 | X | X | ||||||||
| 2001 | 7 | 14 | 21 | 2010 | 12 | 30 | 6 | X | X | ||||
| 2005 | 7 | 29 | 0 | 2014 | 12 | 8 | 12 | ||||||
| 2008 | 7 | 20 | 15 | ||||||||||
| 2008 | 7 | 24 | 21 | ||||||||||
| 2010 | 7 | 11 | 18 | X | X | X | |||||||
| 2010 | 7 | 11 | 21 | X | X | ||||||||
| 2010 | 7 | 14 | 15 | X | X | X | |||||||
| 2010 | 7 | 14 | 18 | X | |||||||||
| 2010 | 7 | 19 | 0 | X | |||||||||
| 2011 | 7 | 10 | 3 | ||||||||||
| 2012 | 7 | 27 | 15 | X | |||||||||
| 2014 | 7 | 6 | 18 |
Note: Estimated events that match with the real flood observations are framed by a thick dark border.
Table 6.
Comparison of flood alarms after updating the thresholds.
| Month | Actual Flood Occurrence | CT | CDF | JFI | |||
|---|---|---|---|---|---|---|---|
| Estimated | Detected | Estimated/Updated | Detected | Estimated/Updated | Detected | ||
| JAN | 1 | 1 | 1M | 10/2 | 2T + 8F/1T + 1F | 7/2 | 2T + 5F/1T + 1F |
| APR | 1 | 2 | 1T + 1F | 8/6 | 1T + 7F/1T + 5F | 13/7 | 1T + 12F/1T + 6F |
| JUL | 1 | 2 | 1T + 1F | 6/4 | 1T + 5F/1T + 3F | 8/2 | 1T + 7F/1T + 1F |
| OCT | 1 | 4 | 3T + 1F | 4/4 | 3T + 1F/3T + 1F | 4/2 | 3T + 1F/2T + 0F |
| NOV | 1 | 4 | 1T + 3F | 6/4 | 1T + 5F/1T + 3F | 13/3 | 1T + 12F/1T + 2F |
| DEC | 1 | 1 | 0T + 1F | 8/8 | 0T + 8F/1T + 7F | 10/4 | 1T + 9F/1T + 3F |
| Overall detection | 6/14 | 8/28 | 7/20 | ||||
Note: M, F and T denotes missed, false and true detection respectively.
Table 7.
Updated flood estimations and rain observations at WMO station 41024.
| Year | Month | Day | Hour | CT | CDF | JFI | WMO41024 |
|---|---|---|---|---|---|---|---|
| 2011 | 1 | 14 | 18 | X | X | X | Rain |
| 2011 | 1 | 14 | 21 | X | X | X | Rain |
| 2011 | 1 | 25 | 18 | X | X | Rain | |
| 2010 | 4 | 3 | 21 | X | No Rain | ||
| 2010 | 7 | 11 | 18 | X | X | X | Rain |
| 2010 | 7 | 11 | 21 | X | X | Rain | |
| 2010 | 7 | 14 | 15 | X | X | X | No Rain |
| 2010 | 7 | 14 | 18 | X | No Rain | ||
| 2010 | 7 | 19 | 0 | X | No Rain | ||
| 2012 | 7 | 27 | 15 | X | No Rain | ||
| 2009 | 11 | 25 | 6 | X | X | X | Rain |
| 2009 | 11 | 25 | 12 | X | X | X | Rain |
| 2014 | 11 | 21 | 21 | X | X | Rain | |
| 2009 | 12 | 22 | 18 | X | X | X | Rain |
| 2009 | 12 | 22 | 21 | X | X | Rain | |
| 2010 | 12 | 9 | 12 | X | Rain | ||
| 2010 | 12 | 11 | 0 | X | No Rain | ||
| 2010 | 12 | 29 | 6 | X | X | Rain | |
| 2010 | 12 | 29 | 9 | X | X | Rain | |
| 2010 | 12 | 30 | 6 | X | X | Rain |
Note: Estimated events that match with the real flood observations are framed by a thick dark border.
© 2017 by the author. Licensee MDPI, Basel, Switzerland. This article is an open access article distributed under the terms and conditions of the Creative Commons Attribution (CC BY) license (http://creativecommons.org/licenses/by/4.0/).
Share and Cite
MDPI and ACS Style
Tekeli, A.E. Exploring Jeddah Floods by Tropical Rainfall Measuring Mission Analysis. Water 2017, 9, 612. https://doi.org/10.3390/w9080612
AMA Style
Tekeli AE. Exploring Jeddah Floods by Tropical Rainfall Measuring Mission Analysis. Water. 2017; 9(8):612. https://doi.org/10.3390/w9080612
Chicago/Turabian StyleTekeli, Ahmet Emre. 2017. "Exploring Jeddah Floods by Tropical Rainfall Measuring Mission Analysis" Water 9, no. 8: 612. https://doi.org/10.3390/w9080612
Note that from the first issue of 2016, this journal uses article numbers instead of page numbers. See further details here.