Simulation and Regulation of Market Operation in Hydro-Dominated Environment: The Yunnan Case


1
Institute of Hydropower System & Hydroinformatics, Dalian University of Technology, Dalian 116024, China
2
Key Laboratory of Ocean Energy Utilization and Energy Conservation of Ministry of Education, Dalian University of Technology, Dalian 116024, China
3
Department of Civil Engineering and Center for Environmental Resource Management, University of Texas at El Paso, 500 W University Ave., El Paso, TX 79968, USA
*
Author to whom correspondence should be addressed.
Water 2017, 9(8), 623; https://doi.org/10.3390/w9080623
Submission received: 13 July 2017
/
Revised: 4 August 2017
/
Accepted: 16 August 2017
/
Published: 20 August 2017
(This article belongs to the Special Issue Planning and Operations of Multi-Objective River and Reservoir Systems)
Abstract
:This paper presents an integrated method to obtain optimal market operation and regulation with the objective of reducing the market price and increasing the electricity consumption in hydro-dominated electricity markets, in which giant cascaded hydropower facilities along different rivers are main power suppliers. To this end, a comprehensive indicator composed of market prices and electricity consumption is proposed to evaluate the situation of hydro-dominated market operation. Moreover, an iterative algorithm is proposed to investigate the strategic behaviors of power suppliers and to simulate the operation of the market. Furthermore, an integrated solution methodology based on a multi-core parallel tabu genetic algorithm (MPTGA) is proposed to provide the optimal assignment of bilateral contracts, considering the market simulation, in order to achieve the optimal market regulation. The results from the case study, with real data based on Yunnan’s electricity market, demonstrate that the proposed indicator and method are effective and efficient to simulate and regulate the market operation, and the effects of MPTGA are discussed last.
1. Introduction
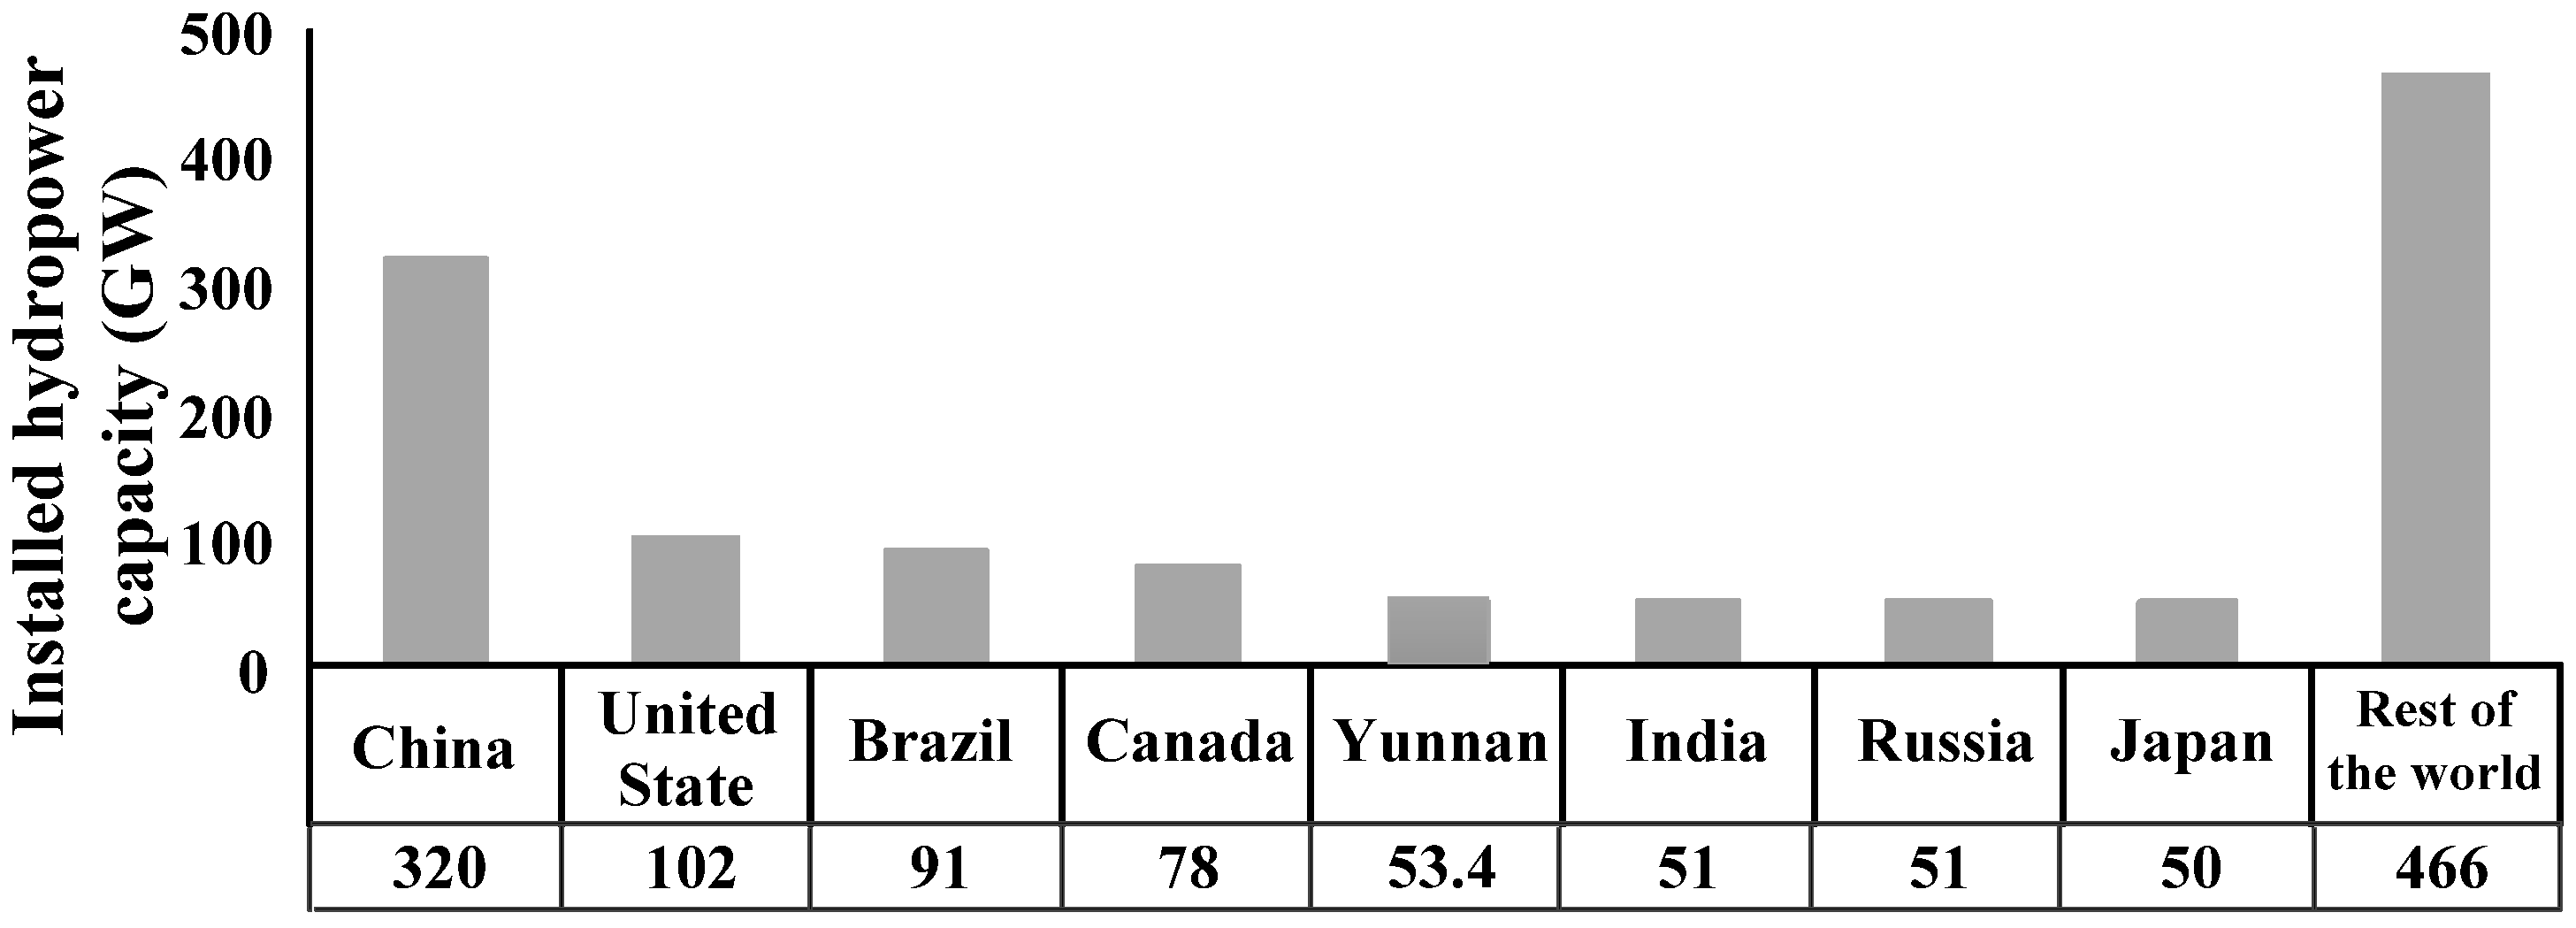
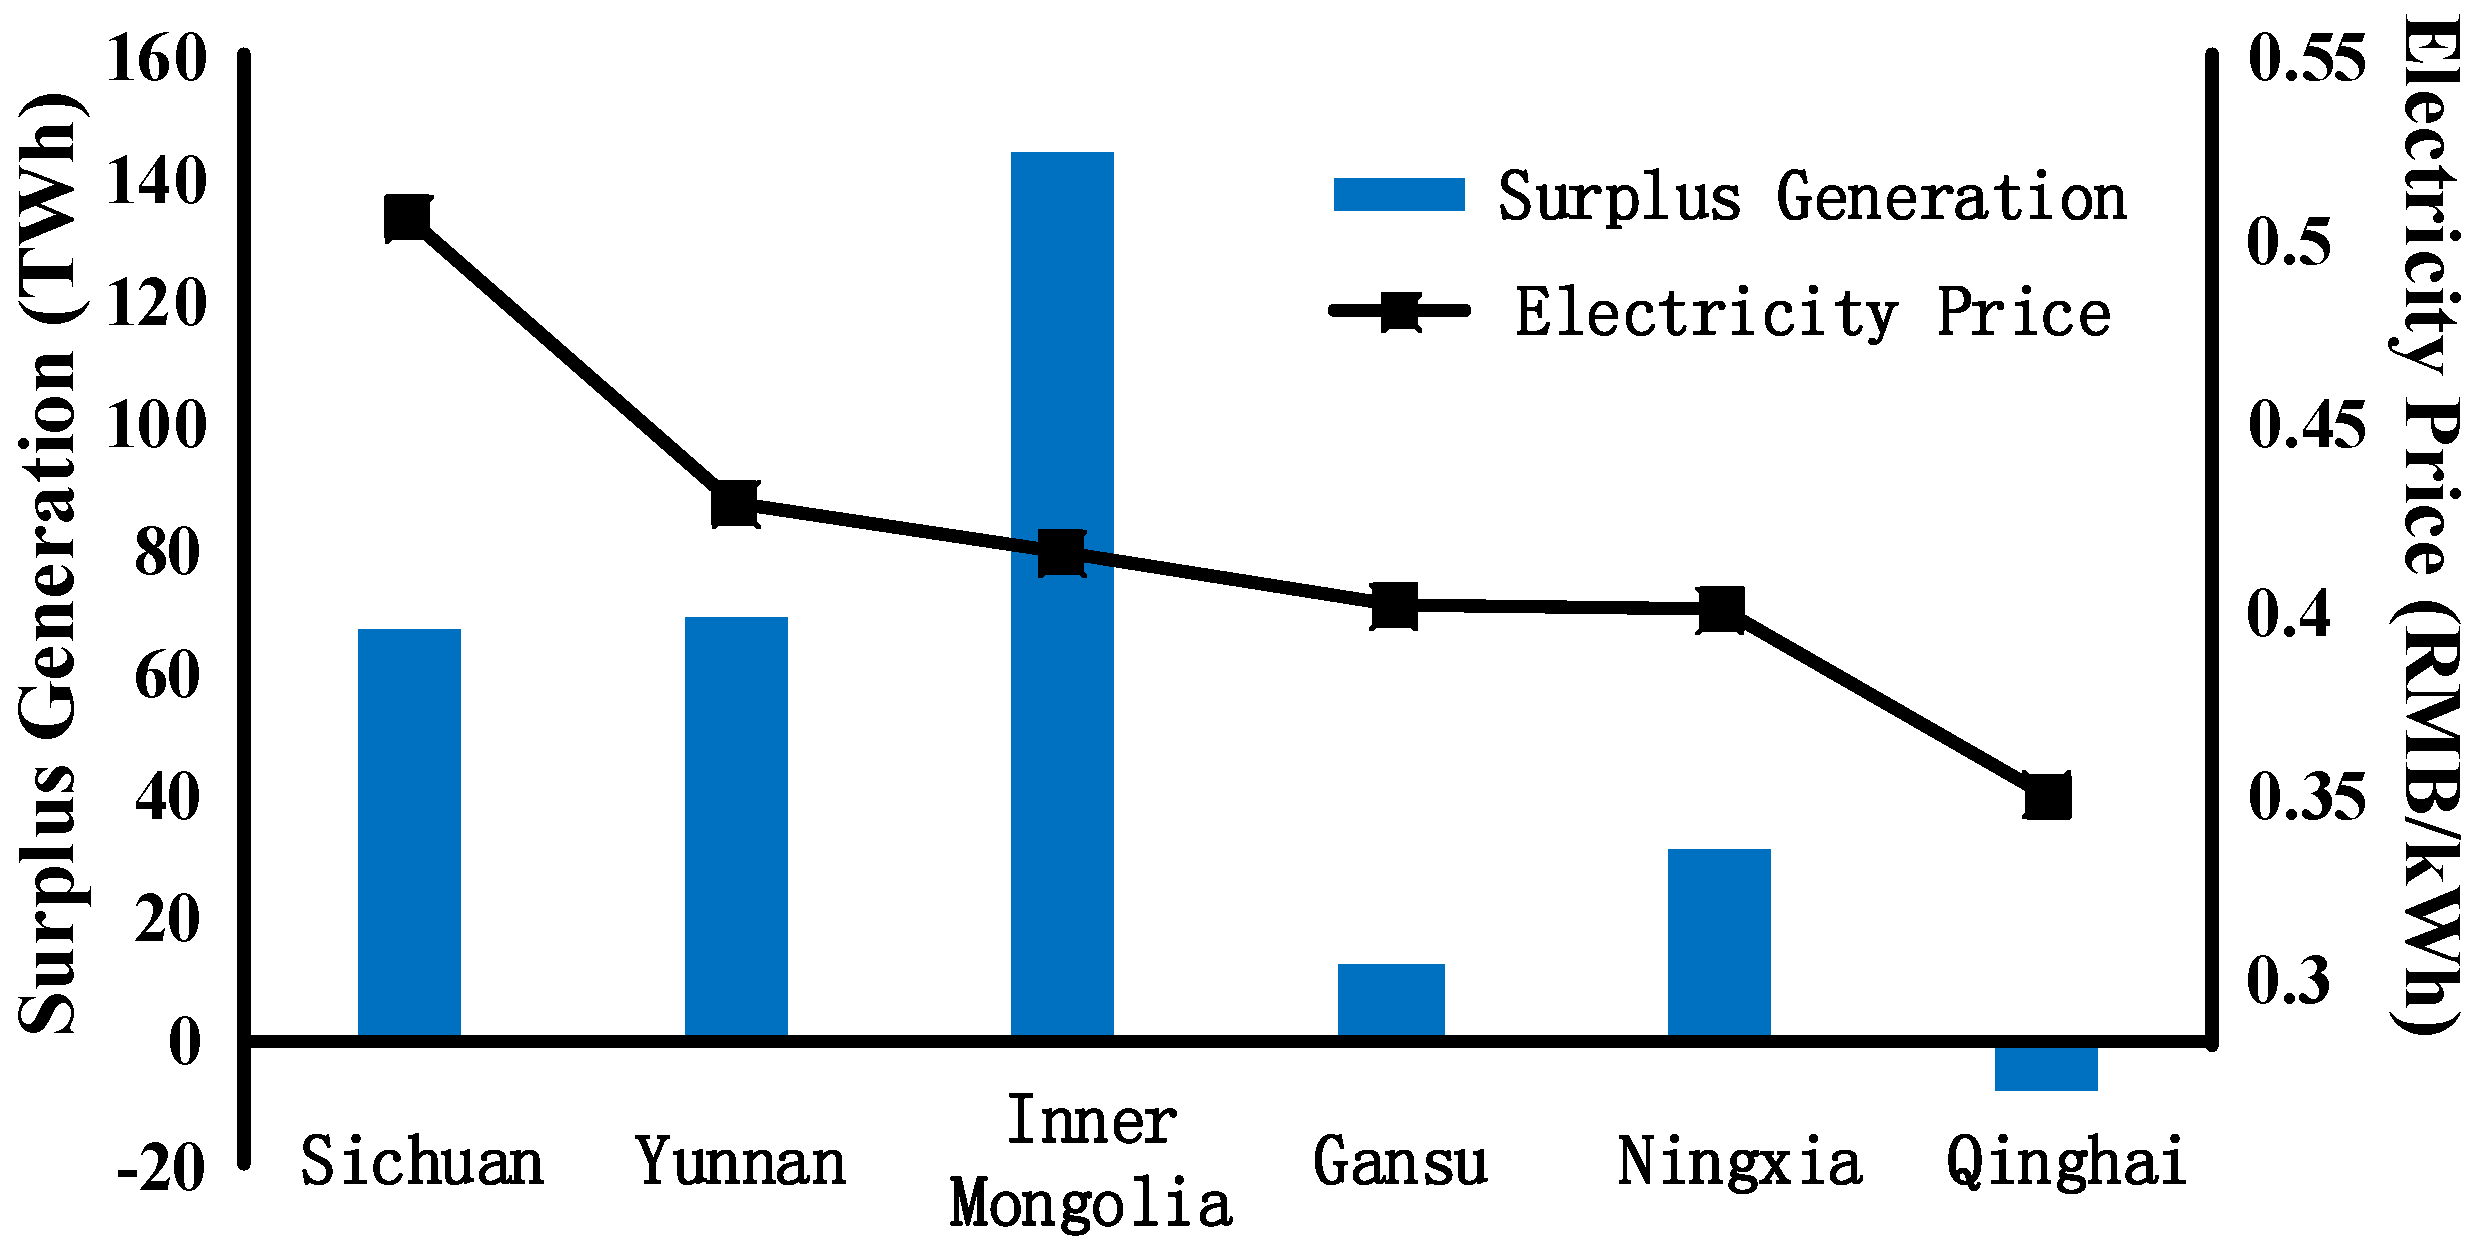
Electricity industries worldwide have been experiencing major reforms since the late 1980s, introducing competition into the power supply side through electricity markets. After several failures in building electricity markets in China, the first functional market was launched in Yunnan Province in 2015, which is a monthly hydro-dominated market. Yunnan is located in Southwest China, and its electricity industry has experienced a development boom in the last few years, especially in terms of installed capacity [1]. By the end of 2015, the cumulative installed capacity of hydropower in Yunnan (53.4 GW) was more than half of that in the United States [2,3] (Figure 1), accounting for more than 74% of the cumulative installed power capacity in Yunnan. Compared with the fast development of the power supply side, the power demand side within the province experienced a slow increase during China’s 12th Five-Year Plan (2011 to 2015) [4]. This phenomenon exacerbates the imbalance between electricity generation and consumption in Yunnan. Issues of huge losses of potential electricity generation that can be fed into the grid have become more serious in recent years. According to the statistical data of the China Electricity Council, the cumulative installed generation capacity in Yunnan (53.4 GW) accounts for 5.3% of the national total, and the generation (215 TWh) accounts for 4.0% of the national total, while the total electricity consumption of the whole province (146 TWh) just accounts for 2.7% of the national total. However, under such circumstances, the electricity price in Yunnan still remains relatively high compared to that of other provinces, as shown in Figure 2. It can be seen that the surplus generation in Inner Mongolia is as twice as much as in Yunnan, but the electricity price there is lower. The price in Qinghai is much lower than in Yunnan, and even Qinghai needs import electricity from neighboring provinces.
In such particular situations, the vital aims for policy-makers in building the electricity market are to (1) reduce the electricity price in the market and (2) increase the electricity consumption of energy consumers. In a perfect competition environment, no power supplier has the ability to unilaterally manipulate the market price. However, in a real market environment, monopolistic power suppliers can influence the price by strategizing their strategic bidding schemes. Compared with a thermal based electricity market, it is difficult to read the bidding and operation strategy for cascaded hydropower stations, and it is more challenging to reduce the price and increase the electricity consumption in hydro-dominated electricity markets [5]. Moreover, in order to achieve the optimal market regulation in hydro-dominated electricity markets, it is necessary to study the strategic behavior of power suppliers. The generation outputs of hydropower plants are limited and influenced by inflows, and cascaded hydropower plants are capable of shifting energy between consecutive periods and adjacent locations, a distinction from a thermal-based electricity market. Policy makers should evaluate the market operation situation and take proper actions (the present study focuses on the optimal assignment of bilateral contracts) to obtain optimal market regulation, which is a more complicated task.
Several researches focus on the bidding and operation strategies of hydropower stations in different electricity markets. Baslis et al. [6] and Pousinho et al. [7] studied the strategic behavior via Mixed-integer linear programming (MILP) for a single hydropower supplier. Scott et al. modeled two hydropower suppliers in a decentralized duopoly market, but their model only works for a relatively small number of reservoirs [8]. Ramos et al. incorporated the equilibrium constraints into their model but neglected the inflow uncertainty [9]. Kelman et al. introduced the Nash-Cournot model to determine the optimal operations for hydropower stations in multi-stage and stochastic situations [10]. A variety of methods have been tried for optimal hydropower operation, with varying degrees of success. However, most of them started from the view of power suppliers, and only a few studies focused on the market simulation and regulation issues. Rangel reviewed the main issues in hydro-dominated electricity markets and argued the technical differences between hydro and thermal power stations [5]. The approaches to and methods for market simulation and market regulation were also analyzed by Rangel. Flatabo et al. introduced the experiences of Nord Pool design and implementation, which is a hydro-dominated environment [11]. Wolak discussed the impacts of market structure and market rules on the market power in different markets and operation situations [12]. As to the impact of bilateral contracts (the main research objective in this paper) on market operation, studies [10,13] have shown that, in hydrothermal systems, market efficiency increases as the level of bilateral contracts increases. However, levels of bilateral contracts are based on generation capacities, and, in most of these works, some realistic features are ignored when simulating the market such as limitations of suppliers’ outputs and temporal and spatial couplings of cascaded hydropower stations. Thus, there are urgent needs for policy makers to study effective methods for achieving optimal market regulation in the newly established hydro-dominated Yunnan electricity market.
This paper presents an integrated method to simulate market operation and achieve optimal market regulation, with the objective of reducing the market price and increasing the electricity consumption in hydro-dominated environments. A comprehensive indicator composed of market prices and electricity consumption is proposed to evaluate the market operation situation. An iterative algorithm is introduced to investigate the strategic behavior of power suppliers and to simulate the operation of the electricity market. Moreover, an integrated solution methodology based on a multi-core parallel tabu genetic algorithm is proposed to solve the complex, sequential, combinatorial optimization problem and to achieve the optimal assignment of bilateral contracts. The remainder of this paper is organized as follows. In Section 2, the comprehensive indicator to evaluate the market operation situation is proposed, and the mathematical models for market operation simulation and regulation are introduced in Section 3. The iterative algorithm for market simulation and the integrated solution methodology are presented in Section 4, followed by the results from real case studies in Yunnan’s electricity market in Section 5. Finally, the conclusions are given in Section 6.
2. Indicator of Market Operation Situation
Market simulation is an effective method to identify the situation of market operation, and the market price and the electricity production/consumption are two main concerns. In hydro-dominated environments, giant cascaded hydropower plants can easily shift energy between consecutive periods and adjacent locations (upstream and downstream reservoirs) to gain extra profits. Thus, an indicator that considers the manipulation of market price and electricity production/consumption is needed to evaluate the market operation situation. Moreover, the proper indicator should take multiple trading periods rather than just a single trading period into consideration (in this study, multiple trading periods are set to one year that contains 12 trading periods). Since giant cascaded hydropower plants can manipulate the market price and maximize its profits without withdrawing any electricity production (they store water in reservoirs in one trading period and generate in another period), there might be no direct relationship between market prices and the electricity production.
2.1. Market Price Indicator of Market Operation Situation (MPI)
MPI is presented to study the market operation situation related to the market price. Referring to the idea of well-known market power indicators Lerner Index (LI) and Price Cost Margin Index (PCMI) and following the practical usage in [14], MPI can be expressed by Formula (1), obtained from comparing prices between different regulation scenarios:
where represents the market price indicator of the market operation situation; represents the average market clearing price during multiple trading periods; and and represent the highest and lowest average market clearing prices of multiple trading periods among different regulation scenarios, respectively.
A value of closer to 1 could indicate better and more efficient market operation and regulation since the average market clearing price is closer to . It is obvious that and are important parameters when evaluating the market operation situation via MPI. In this study, a market environment with no regulation implemented is selected as the highest price situation, in which power suppliers can easily exert market power. A regulated non-market environment is selected as the ideal market regulation situation. The electricity price derived from this regulated environment is regarded as the lowest price because the system operator solves an optimization problem with the objective of average price minimization in this situation. The average market clearing price of multiple trading periods can be calculated as follows:
where t and T represent the index and total number of the trading period, respectively; represents the market clearing price in period t; and represents the electricity production/consumption in period t.
2.2. Electricity Consumption Indicator of Market Operation Situation (ECI)
The optimal method to increase electricity consumption is shifting the demand curve rather than moving along the curve, but the industrial production plan can hardly adjust according to the electricity price within a month. Thus the shift of the demand curve is neglected in the present study. ECI is presented to identify the market operation situation related to the electricity consumption. The indicator is obtained through comparing the electricity consumption between different market regulation scenarios, and the ECI can be expressed by Formula (3):
where represents the electricity consumption indicator of the market operation situation; represents the total electricity production/consumption during multiple trading periods; and and represent the highest and lowest electricity production/consumption during multiple trading periods among different regulation scenarios.
A value of closer to 1 can indicate better and more efficient market operation and regulation since the electricity consumption is closer to .
2.3. Comprehensive Indicator of Market Operation Situation (CI)
CI is presented to comprehensively evaluate the market operation situation, taking both the market price (MPI) and the electricity consumption (ECI) into consideration. It could be calculated by Formula (4):
where represents the comprehensive indicator of the market operation situation and represents the comprehensive coefficient of the CI.
Overall, a value of closer to 1 can indicate a better electricity market environment, considering the definition of and . Since CI is a linear combination of and , policy makers from different electricity markets can find the suitable CI by weighing the importance of MPI and ECI and can adjust the coefficient based on different practical situations.
3. Mathematical Model
In the Yunnan electricity market, not all the power suppliers with generating capacity can bid in the market because some of them are contracted in bilateral contracts. At the present stage, the system operator assigns bilateral contracts to power suppliers with the purpose of securing the safety and stability of the power system in the transition period. The electricity prices of bilateral contracts are determined in the market; the total generation bid in the monthly market equals the generation in the bilateral contract plus the additional generation in the market. To some extent, the bilateral contracts are binding upon the operation of power suppliers. Thus, in the present study, bilateral contracts are regarded as proper regulating measures. Policy-makers evaluate the market operation situation by measuring CI and achieve market regulation by assigning optimal levels of bilateral contracts to different power suppliers in different periods. However, after bilateral contracts are assigned, power suppliers can easily adjust their bidding and operation strategies and game with each other to maximize their own profits, and the market operation situation and CI are changed compared with the situation when the policy makers initially assigned the bilateral contracts. Policy-makers should reassign bilateral contracts based on the changed market operation situation to achieve better regulation. Therefore, the optimal market regulation problem is not only a game between different power suppliers but also between policy makers and power suppliers. To solve this complex problem, mathematical models of the different power suppliers and policy makers are proposed in this section.
When simulating the market operation, the Cournot model is selected as a game theory approach to describing the strategic behavior of power suppliers. This widely used model assumes that price makers’ bidding behaviors are based on quantity strategies. The Cournot model has some advantages compared with other market competition models such as the Bertrand model and the supply function model [15]. The Bertrand model assumes that competition is based on price strategies, but it has limitations (e.g., it is unable to describe the capacity-constrained oligopoly) for application to electricity markets [16]. The supply function model can better capture the power suppliers’ bidding behavior than the Cournot and Bertrand models. However, the Cournot model is more flexible when taking other aspects of the electricity market into consideration, including bilateral contracts and technical limits. Furthermore, calculating the equilibrium state of the Cournot model is more mathematically tractable than that of supply function model. The demand in the market is described as elastic, but demand side bidding is not considered. Thus, the market clearing price at trading period t can be expressed as (RMB/kWh), in which and represent the slope and the intercept of the inverse demand curve at trading period t, respectively, and they are fitted based on the real data of the market, and represents the electricity production/consumption at trading period t.
3.1. Giant Cascaded Hydropower Stations
Giant cascaded hydropower stations could obtain the assignment of bilateral contracts from policy makers and other suppliers’ bidding and operation strategies in the market environment. Then they optimize their own strategies based on the profit-maximizing objective and bid (kWh) into the market, considering others’ strategies as fixed. The operating costs of hydropower stations consist of depreciation costs, maintenance costs, salaries, and other costs. The depreciation costs and maintenance costs of each station are usually calculated based on its fixed assets and can be regarded as fixed costs. Salaries and other costs are calculated based on generation and can be regarded as operating costs, but they are usually too small for the profit analysis (less than 0.01 RMB/kWh), so they can be neglected when modeling their profits for simplicity [17]. The profit-maximizing objective for giant cascaded hydropower stations during multiple trading periods can be expressed as:
where i and I represent the index and total number of cascaded hydropower stations; (RMB) represents the profit of giant cascaded hydropower stations; (RMB) represents the profit of station i at period t; (kWh) is obtained through in which (m3/s) is the generating discharge of hydropower station i at period t; is the relationship between water head (m) and water volume used per kiloWatt-hour (m3/kWh), which is a characteristic curve of the turbine at hydropower station i, as shown in Figure 3; and (s) is the duration of one single trading period.
The constraints faced by giant cascaded hydropower stations are:
- Mass conservation equation:where (m3) represents the initial storage of hydropower station i at period t; (m3/s) represents the inflow of the hydropower station; and (m3/s) represents the spill discharge of hydropower station i at period t.
- Final reservoir storage constraint:where (m3) represents the reservoir storage at the end of multiple periods of hydropower station i, and it is fixed at (m3), which is determined by the dispatching center of the system operator, considering the non-market functions of the hydropower station such as flood control, irrigation, and navigation. Therefore, the future value of the reservoir storage can be ignored.
- Maximum and minimum turbine discharge constraint:where (m3/s) and (m3/s) represent the maximum and minimum turbine discharge of hydropower station I, respectively. The relationships between , , and net head are neglected in this study.
- Minimum and maximum power output constraint:where (MW) represents the power output by hydropower station i at time period t and (MW) and (MW) represent the minimum and maximum power outputs by hydropower station i, respectively.
- Lower and upper reservoir storage constraint:where (m3) and (m3) represent the lower and upper bounds of the initial reservoir storage of hydropower station i, respectively.
- Minimum and maximum release constraint:where (m3/s) represents the water release of hydropower station i at period t; consists of the generating discharge and the spillage discharge ; and (m3/s) and (m3/s) represent the minimum and maximum releases of hydropower station i, respectively.
- Minimum bilateral contract constraint:where (kWh) represents the bilateral contract assigned to hydropower station i at period t. The generation of hydropower station i at period t must be no less than , which is determined by policy makers.
Note that water delays between upstream and downstream stations are usually 2 to 3 h, so they are not considered in the monthly operation of the cascaded hydropower stations. Additionally, since day-ahead generation schedules and the real-time operation of hydropower stations are still regulated by the system operator in the monthly market, the frequency control or other services [18,19] are not considered in this study. Moreover, environmental constraints are also excluded [20].
3.2. Thermal Power Stations
Thermal power stations could also obtain bilateral contracts from policy makers and other suppliers’ strategies in the market. They optimize their own strategies based on the profit-maximizing objective and bid (kWh) into the market. The profit-maximizing objective for thermal power stations during multiple trading periods can be expressed as:
where g and G represent the index and the total number of thermal power stations, respectively, and represents the generating cost of thermal power station g.
Mid-term (monthly) scheduling of thermal power requires the determination of the number of online units. Thus the constraints faced by thermal power stations are [21]:
- Number of online units:where represents the number of online units of thermal power station g at period t and and represent the minimum and maximum online units of thermal power station g, respectively.
- Online unit peak and valley minimum duration time:where (h) and (h) represent the time duration at the eth peak and the valley period of thermal power station g, respectively, and (h) and (h) represent the minimum time duration of the online units in the peak and valley periods, respectively.
- Minimum bilateral contract constraint:where (kWh) represents the bilateral contract assigned to thermal power station g at period t. The generation of thermal power station g at period t must be no less than , which is determined by policy makers.
3.3. Power Exchange Policy Makers
Policy makers receive the bid information from power suppliers, clear the market, and make the bidding and clearing information available to all power suppliers. Meanwhile, policy makers could evaluate the market operation situation by measuring the CI value in the market equilibrium state and then regarding and as decision variables to achieve optimal market regulation, with the objective of CI maximization:
The constraints faced by policy makers are the minimum and maximum bilateral contracts that are assigned to different power suppliers at different time periods:
where and respectively represent the minimum and maximum levels of bilateral contracts assigned to hydropower station i at period t and and respectively represent the minimum and maximum levels of bilateral contracts assigned to thermal power station g at period t. Note that no bilateral contract is assigned to thermal power stations in order to increase the consumption of clean energy and reduce the consumption of fossil-based energy in hydro-dominated electricity markets. Thus .
4. Solution Methodology
4.1. Market Simulation and Market Equilibrium State
An iterative algorithm is introduced to simulate the operation of the electricity market [13,22,23]. Power suppliers that own giant cascaded hydropower or thermal power stations and policy makers are considered to be optimizing their own objectives separately in the algorithm. The technology mix is neglected in the present study based on practical situation of Yunnan for simplicity. Each individual power supplier’s optimal bidding and operation strategy is the best response to the market when other suppliers’ strategies are fixed. Using this information for the whole electricity supply system, a market simulation can be performed to learn more about plausible behaviors and situations in the market. When simulating the operation of the market, power suppliers compete to maximize their own profits, and each power supplier adjusts its own strategy according to others’ strategic behaviors. A market equilibrium state will be achieved when no one can increase their own profit by unilaterally adjusting their strategy. The proposed iterative algorithm helps to simulate the operation of market and to obtain the market equilibrium state. The specific steps of the iterative algorithm are as follows:
Step One: Assume that certain levels of bilateral contracts are assigned to different power stations at different periods. Initialize the bidding and operation strategy of each power supplier in the market randomly and make this information available to other power suppliers.
Step Two: For each power supplier, solve its own profit maximization model considering other power suppliers’ strategies as fixed in order to determine the best individual responses to the market.
Step Three: Proceed with the iteration process until no power suppliers’ strategies are updated compared with the previous iteration round. The algorithm converges when no individual power supplier can unilaterally improve its profit, indicating a state of market equilibrium.
Inflow uncertainty is an important factor when we study the operation of hydropower stations in hydro-dominated environments. Since the main river basins in Yunnan have large volumes and stable inflows, a frequency analysis method is used to describe the inflows to hydropower plants in each river basin. Five inflow scenarios of different frequencies (5%, 25%, 50%, 75%, and 95% of inflow reliability) are derived through a frequency analysis method, and the inflow is obtained by the combination of these five scenarios when analyzing bidding and operation strategies. A progressive optimality algorithm, discrete differential dynamic programming, and a successive approximation method are combined to solve the optimal problem faced by giant cascaded hydropower stations, as introduced in [21]. A hybrid search algorithm consisting of a heuristics search, a progressive optimality algorithm, and a local optimum avoiding strategy is used to solve the optimal problem faced by thermal power stations, as introduced in [24]. The solution methodology for policy makers to achieve optimal market regulation in hydro-dominated electricity markets is introduced in Section 4.2.
4.2. Multi-Core Parallel Tabu Genetic Algorithm (MPTGA)
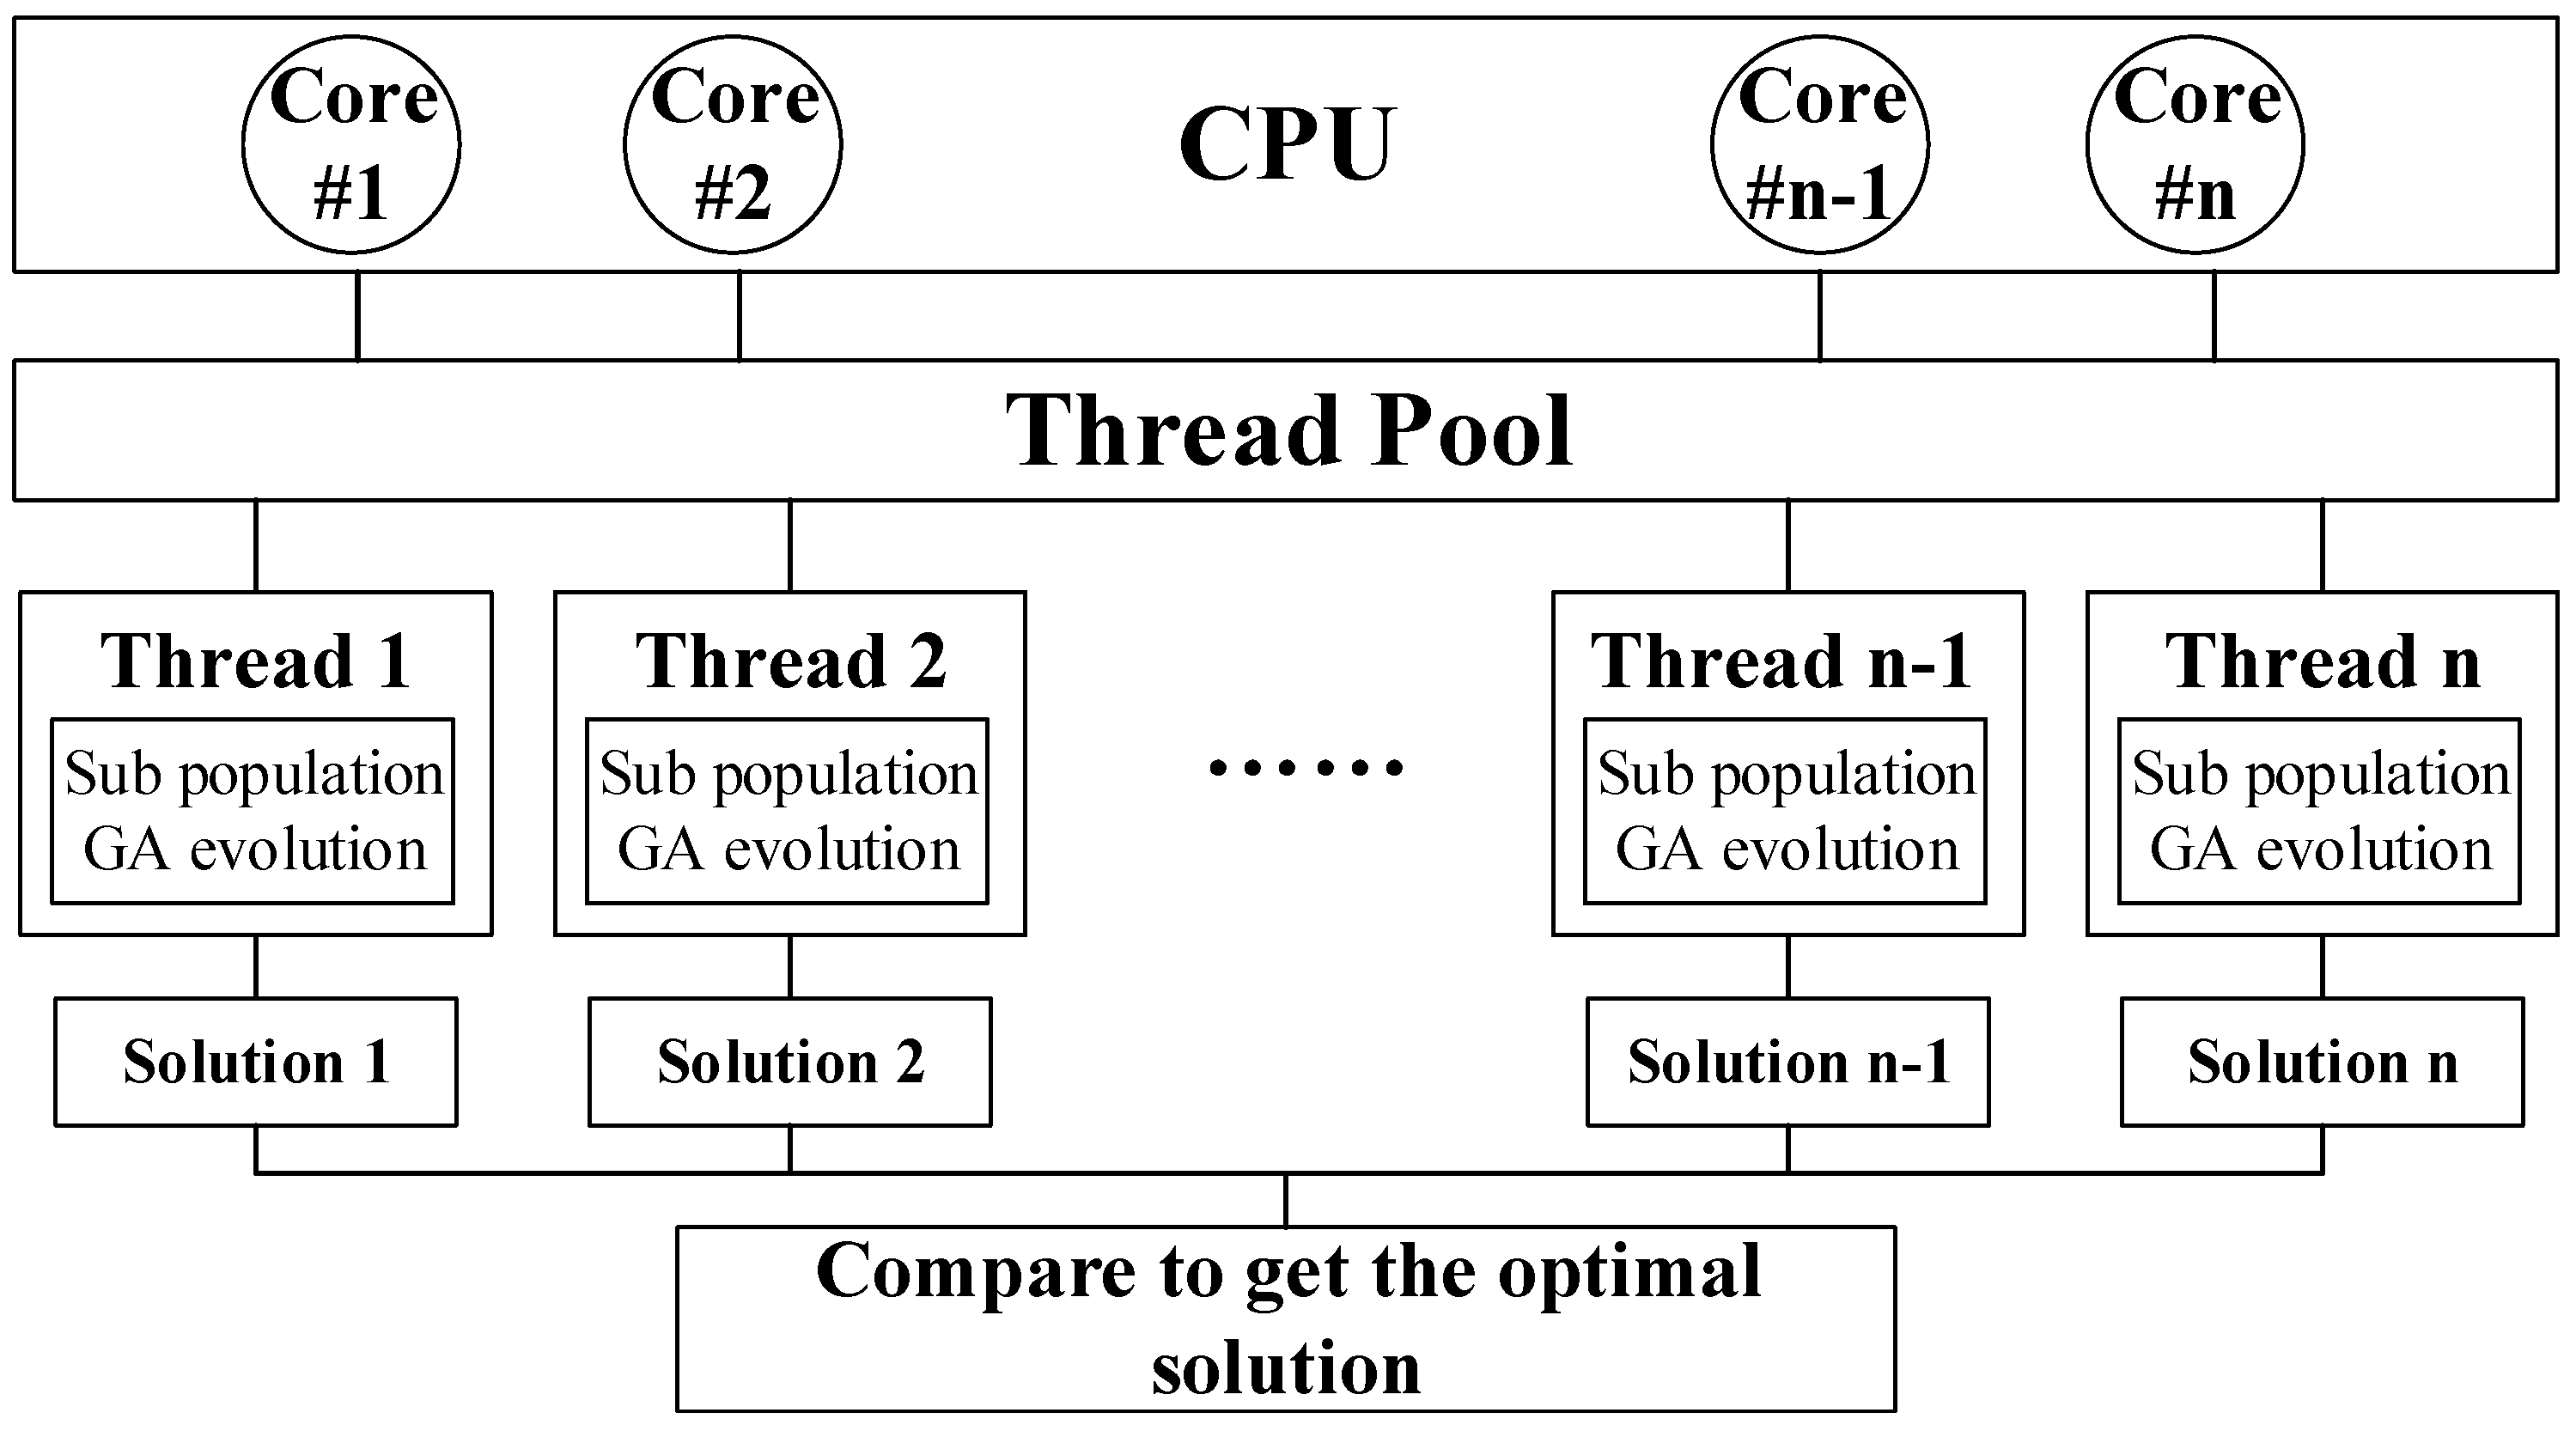
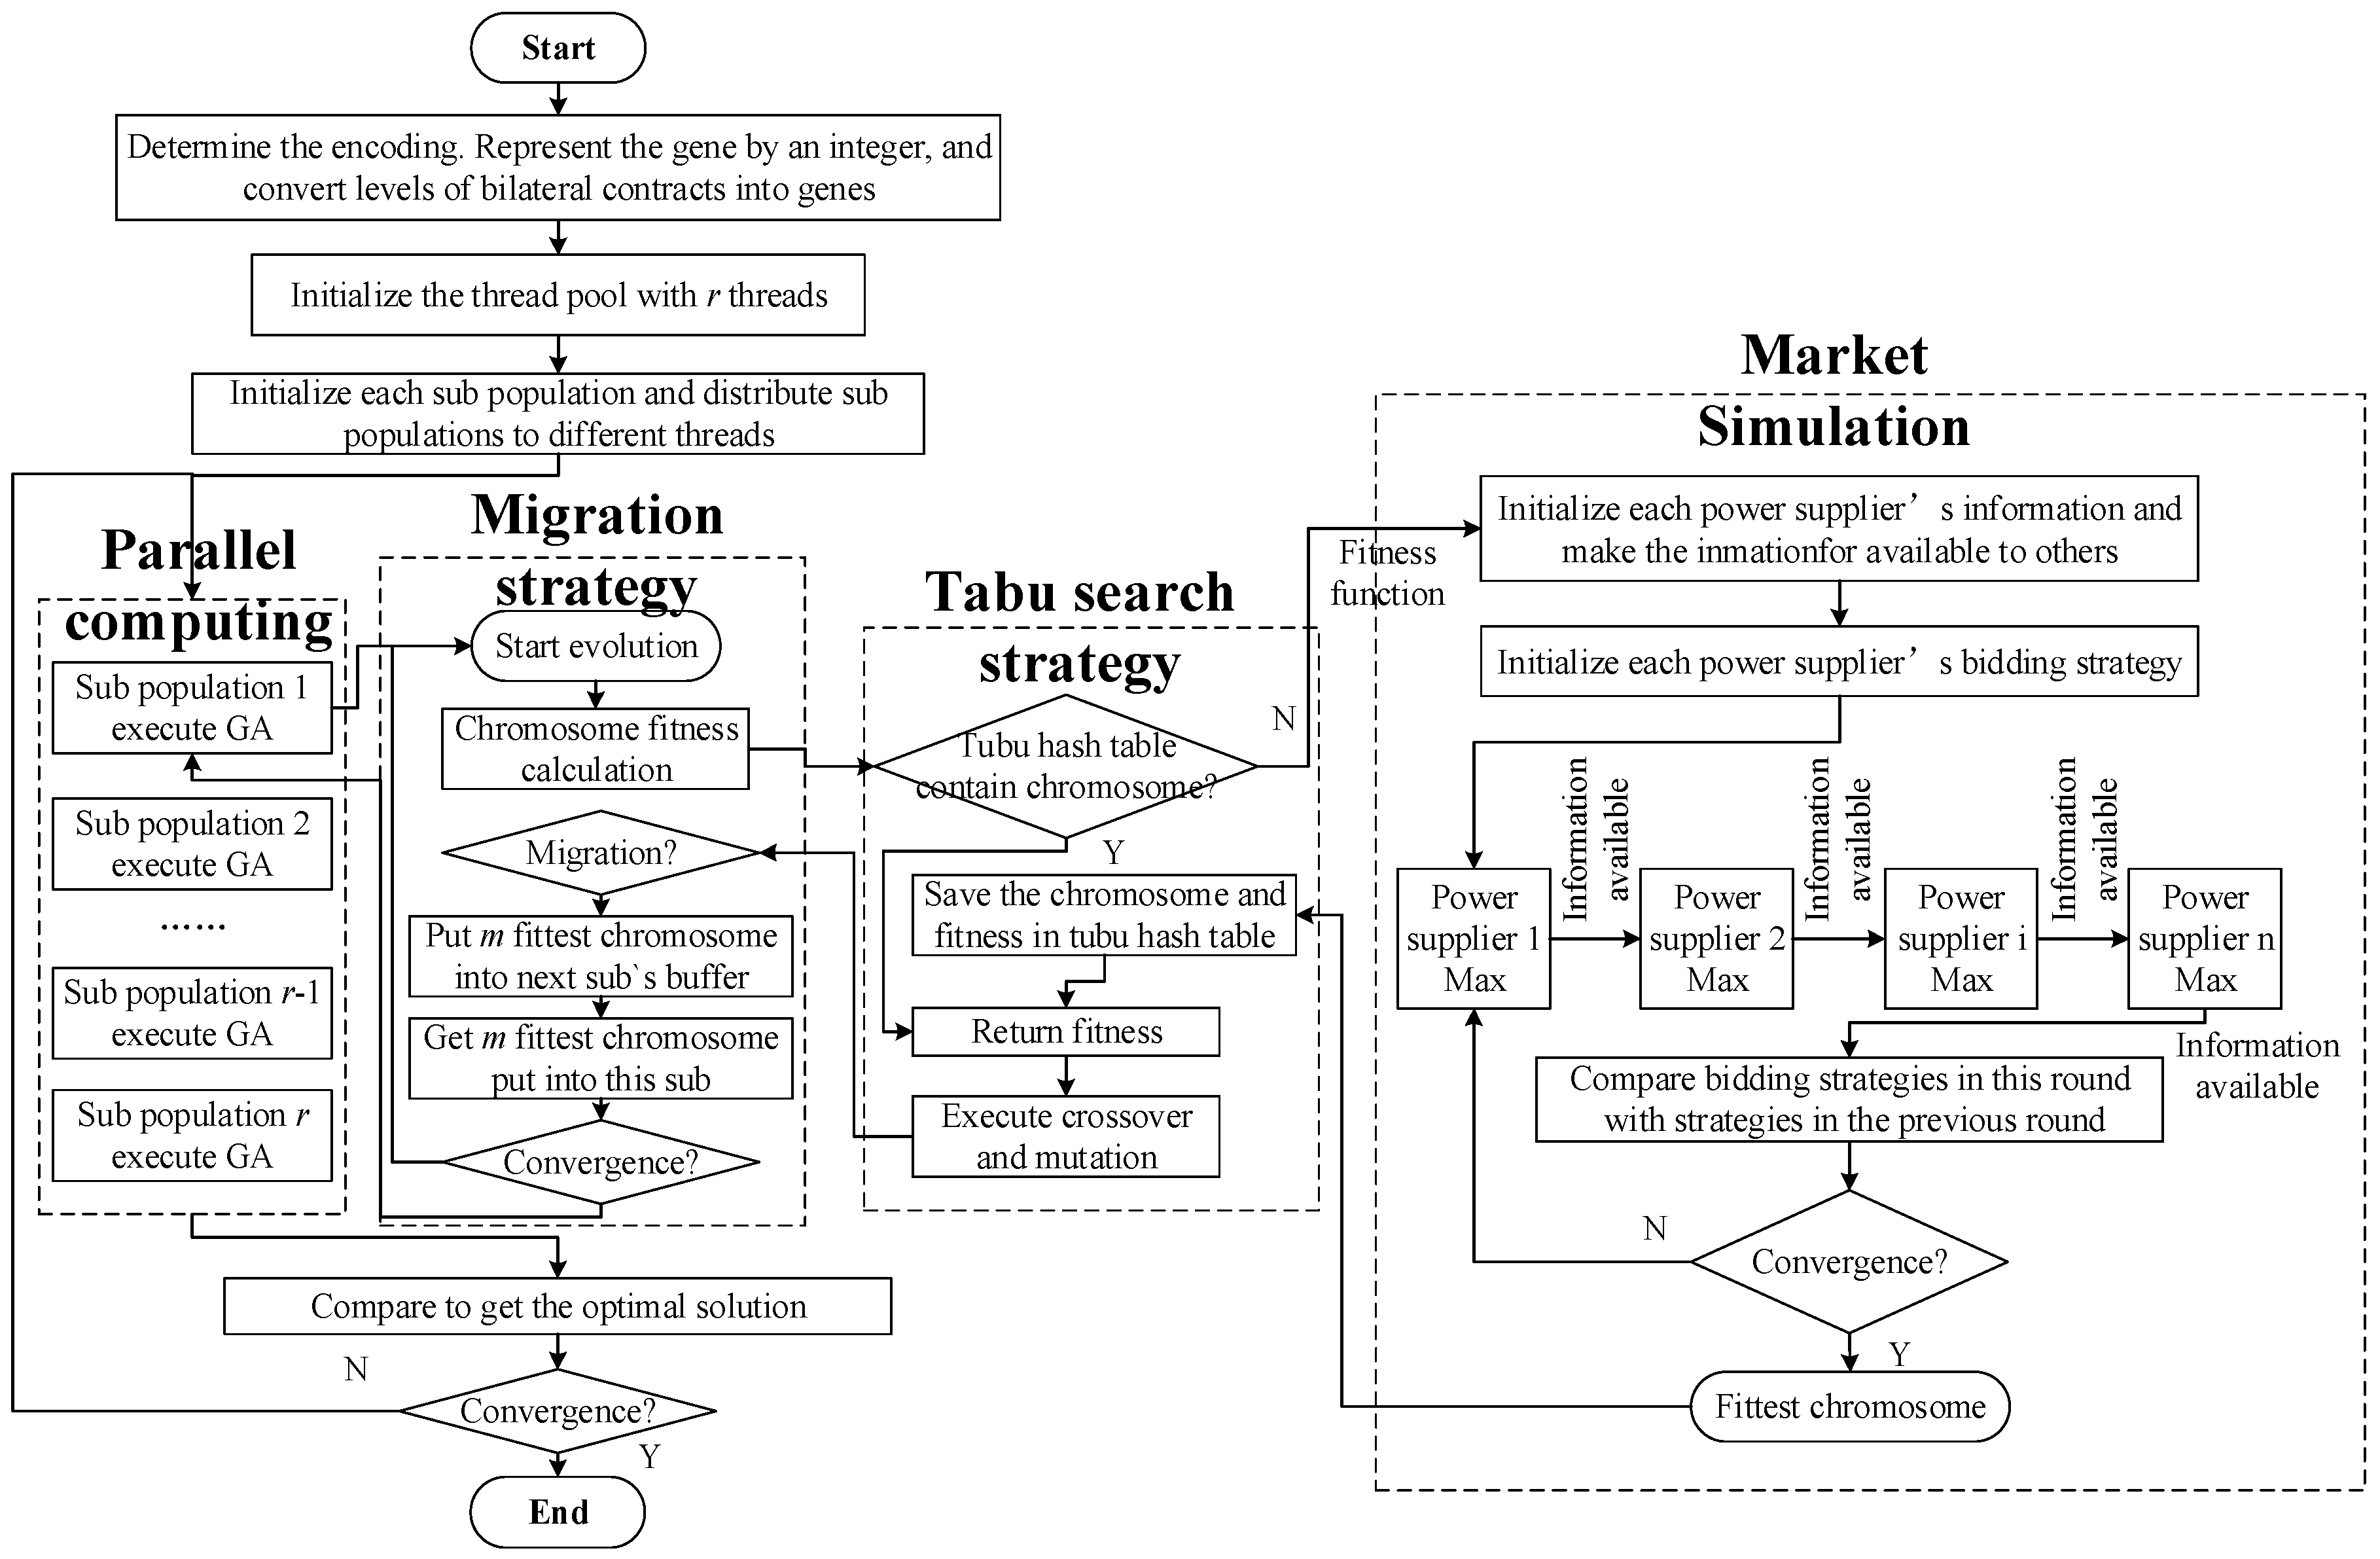
The aforementioned algorithm enables policy makers to evaluate the effects of a certain level of bilateral contracts on the market operation situation by measuring CI. The optimal levels of bilateral contracts have to be found among many different plausible levels of bilateral contracts, which form a huge solution space for policy makers [25]. This is a complex, sequential, combinatorial optimization problem that can take a long time to solve because the optimal market regulation is based on the market simulation, which is, in turn, based on individual profit maximizations. The Genetic Algorithm (GA), a random intelligent optimization method, which can improve the computational efficiency. Since the GA is robust and adaptable, it has been widely used in different applications [26,27]. However, the possibility of getting trapped in local optima remains a general pitfall of conventional GA due to the difficulty of confirming the global optimality of the solutions. This issue can impose a limit on the application of GA to large-scale, complex optimization problems with very large solution spaces. Based on the problem mentioned before, the present study first solves the GA problem, starting from multi-subpopulations, to maintain the diversity of the population. Secondly, a migration strategy is adopted to exchange information between sub-populations in order to break the enclosed environment in case local optima are achieved. A cone topology model is used to migrate chromosomes between sub-populations, which takes both separations between sub-populations and the diversity of the global population into consideration. Thirdly, a tabu search strategy is introduced to increase the computation efficiency by avoiding calculating the same chromosome repeatedly through a tabu hash table. Finally, taking the advantage of the natural parallelism of GA by dividing the initial population into several sub-populations, multi-core parallel computing is used to further reduce the computation time. Figure 4 shows the schematic of this multi-core parallel computing strategy. It performs each sub-population’s genetic manipulation as a task, using a thread pool for task scheduling and the reasonable distribution of computing resources, (i.e., efficient use of the CPU resources) [27]. Above all, MPTGA is achieved to solve the proposed problem.
The specific process of applying MPTGA for solving the CI-maximization problem is described in the following steps:
Step One: determine the encoding. The present study adopts the real-coded genetic algorithms (GA) because it is more efficient and precise than the binary-coded GA. According to the precision requirements, divide the level of bilateral contract into l parts between , then represent each gene in the chromosome by an integer . The gene can be converted to levels of bilateral contracts by the following formula:
Step Two: initialize the thread pool with r threads.
Step Three: determine the length of chromosome L according to the number of power stations and the number of trading periods.
Step Four: initialize each sub-population randomly, and assign them to different threads for GA execution.
Step Five: within each sub-population, check whether the global tabu hash table contains the chromosome; if the global tabu hash table contains the chromosome, return its corresponding fitness. Otherwise continue to Step Six.
Step Six: complete the GA execution on each thread (i.e., crossover, mutation, and selection at each generation) and each sub-population. When computing the chromosome fitness, decode the chromosome, simulate the market operation via the proposed iterative algorithm introduced in Section 4.1, and compute the objective function value based on the penalties for violating the constraints. Save the chromosome and its fitness value into the tabu hash table.
Step Seven: when the evolution reaches the migration point (every g generations), select the top m fittest chromosomes in one sub-population, put them into next sub-population’s buffer zone, and get m chromosomes from the buffer zone into the sub-population.
Step Eight: stop and compute the result using the fittest chromosome when the termination condition is met. Otherwise, return to Step Six.
Thus, the optimal assignment of bilateral contracts for achieving optimal market regulation in hydro-dominated electricity markets can be obtained. The integrated flowchart of the solution method is illustrated in Figure 5.
5. Case Study
5.1. Case Study Background
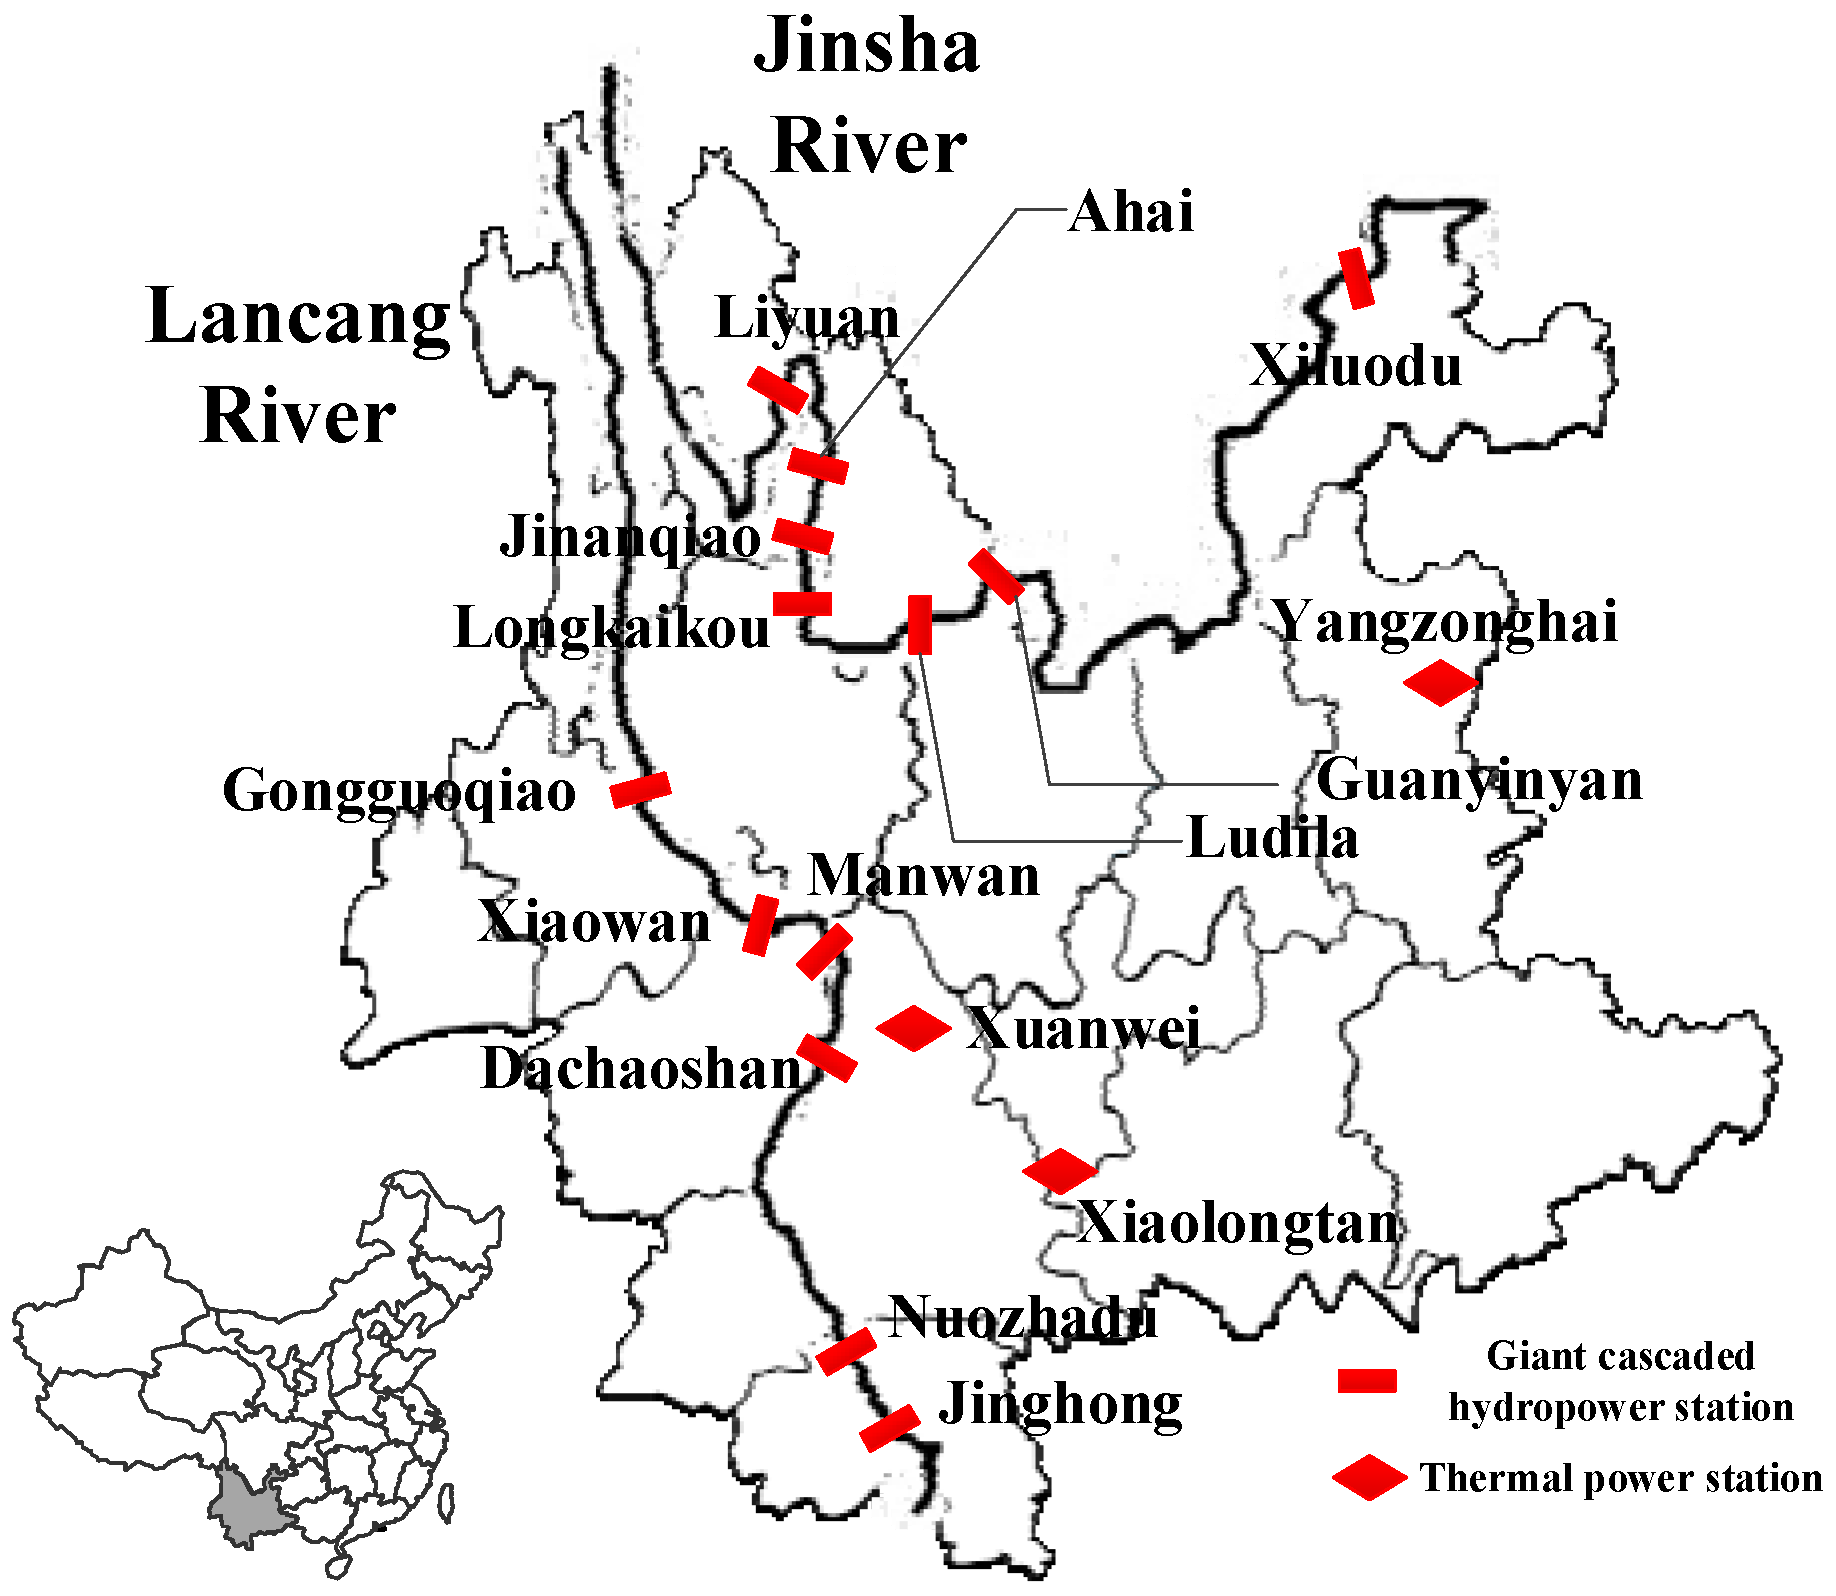
In Yunnan Province, the giant cascaded hydropower stations are mainly located along two river basins: Lancang River (LR, upstream of the Mekong River) and Jinsha River (JR, upstream of the Yangtze River). There are six hydropower stations along LR and seven hydropower stations along JR. Since cascaded hydropower stations have close hydraulic and electrical connections, in this study we consider LR and JR as two strategic players in the market; although, in actuality, not all hydropower plants along the same river belong to the same stakeholder. Xiluodu is excluded from the study because it transfers part of its electricity directly to Zhejiang Province through ±800 kv Xi-Zhe ultra high voltage direct current transmission lines and the rest to Guangdong Province through ±500 kv Niu-Cong high voltage direct current transmission lines. The other oligopolistic power suppliers that are considered in this case are the thermal power stations from China Guodian Corporation (CGC, see Figure 6 and Table 1 for details). The multiple trading periods consist of 12 months (from January to December). The reservoirs’ initial and final water levels are fixed at a normal high water level. The parameters of the demand curve in each month are fitted based on real data from Yunnan’s electricity market in 2015; non-market demand is removed from the demand curve; and is fitted as 641 and is fitted as 0.00004 at each trading period. The proposed algorithm is implemented in Java language in the Java 2 platform Standard Edition (J2SE) on a Lenovo T540p. The operating system is Windows 7, and the CPU consists of one Inter(R) Core(TM) [email protected] with 12.0 GB RAM.
5.2. CI Coefficient Analysis and Selection
In this case, all giant cascaded hydropower stations along the LR and JR (except Xiluodu) and the thermal power stations in CGC are taken into consideration. The hydraulic constraints faced by LR and JR can be obtained through the multi-year schedule and the historical operation of the cascaded hydropower stations, which are not discussed in detail in this study. The minimum and maximum levels of bilateral contracts assigned to each hydropower station at each period are determined proportional to their average generation capacities over the same period in history. For simplicity, in this case study, the minimum and maximum levels are set at 30% and 70% of the average generation capacity over the same period in history, respectively. The parameters of MPTGA in this study are set as follows: total population size: 500; maximum number of iterations: 1000; elitism rate: 0.2; crossover rate: 0.8; mutation rate: 0.2; migration number: 5; and migration interval generation: 50.
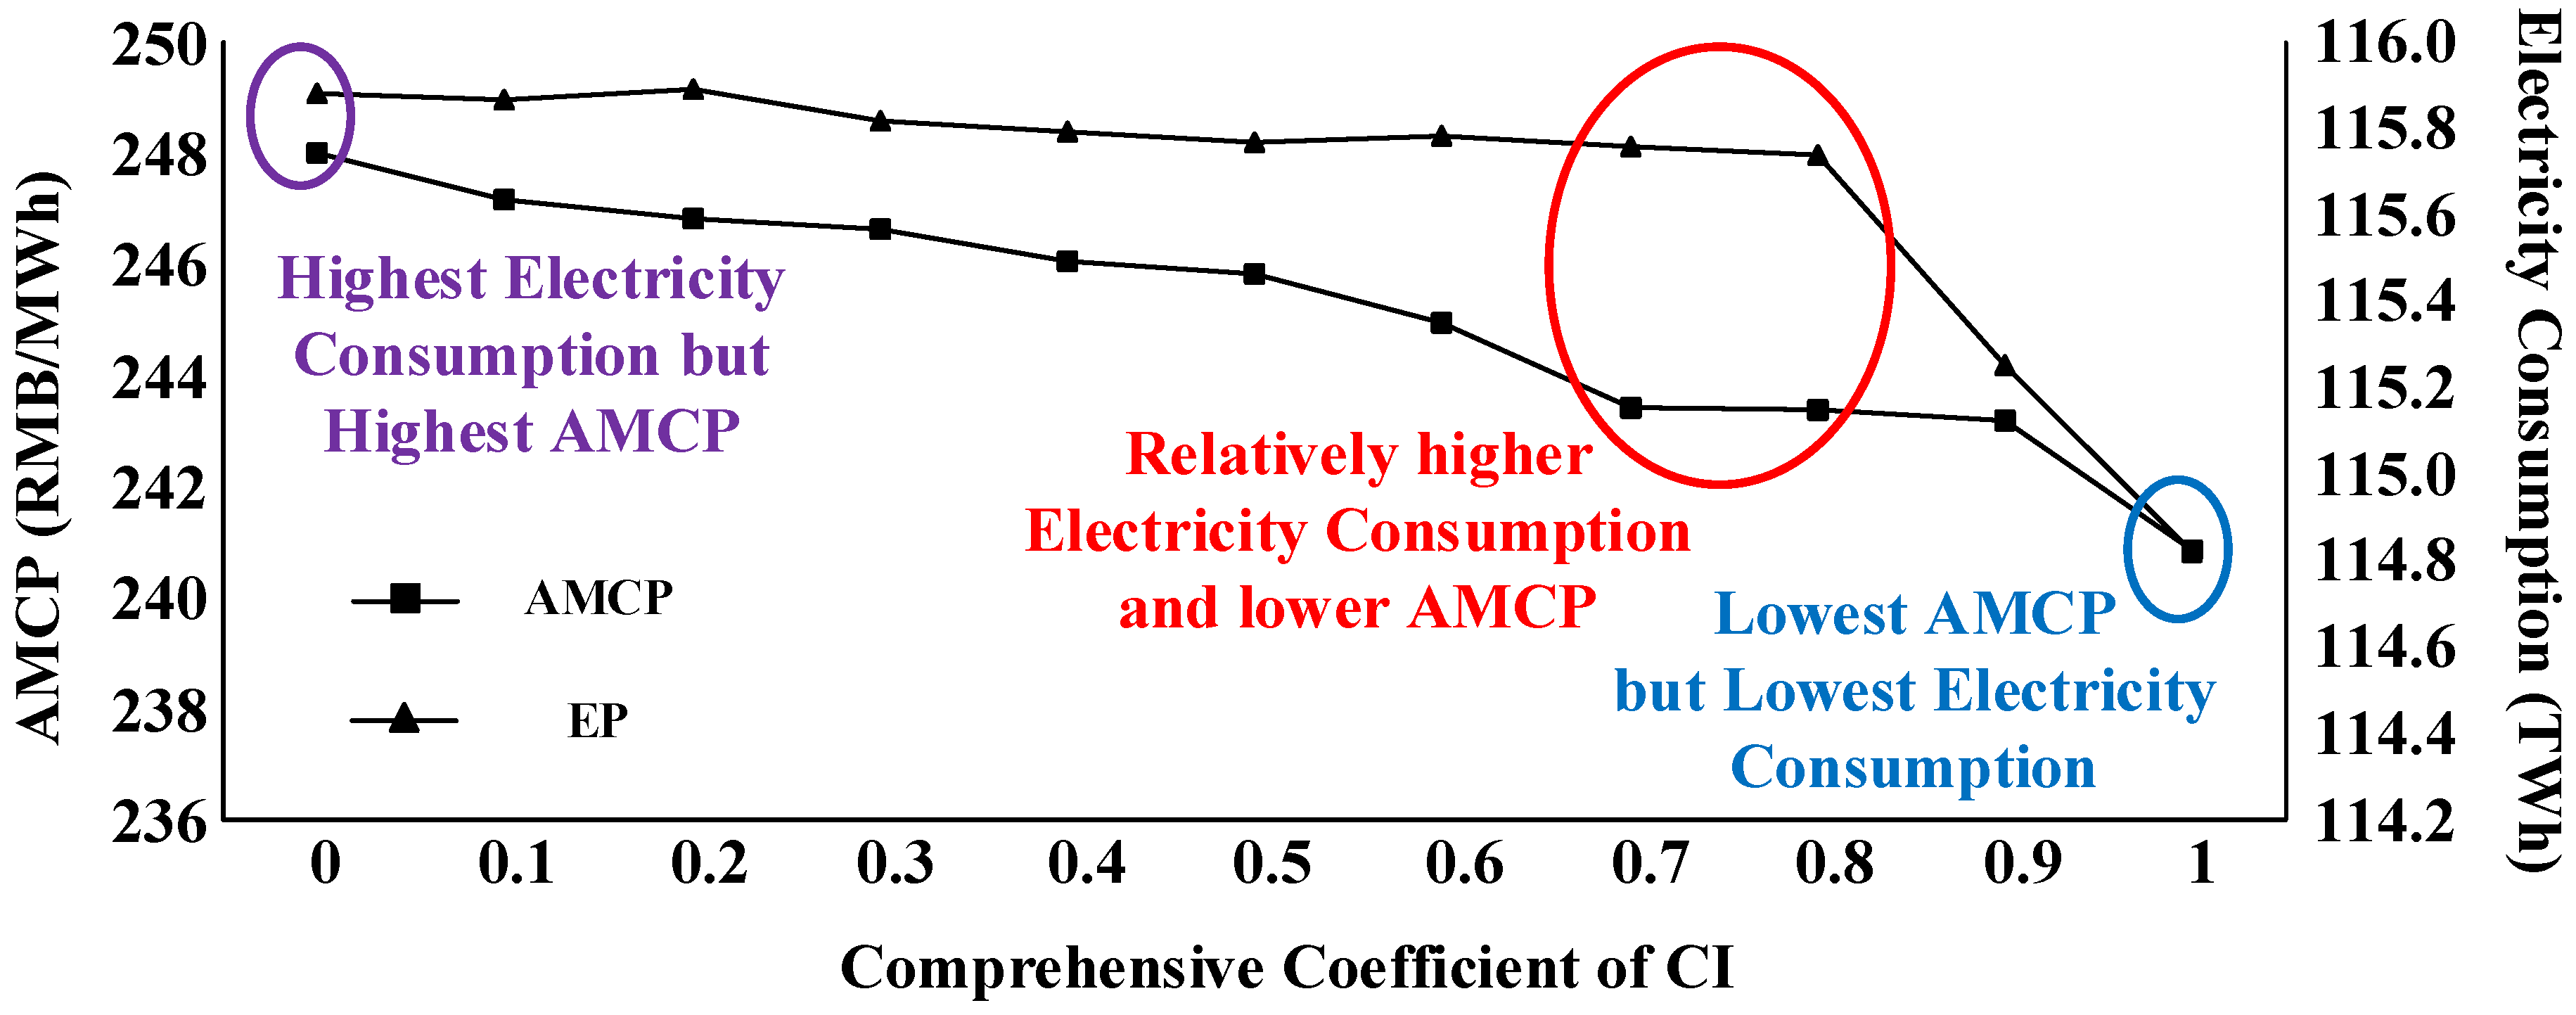
First of all, the impacts of different CI coefficients on market regulation are analyzed, and a proper value of the CI coefficient is selected for further study about the simulation and regulation of the market operation. Figure 7 illustrates impacts of varying CI coefficients on the average market clearing price and the total electricity consumption under corresponding optimal market regulation scenarios. If the CI coefficient turns to 0, in this case, in Formula (4) equals 0, and then turns into . Under this circumstance, the objective of optimal market regulation could be described as electricity consumption maximization. As can be seen from Figure 7, when the CI coefficient is 0, the electricity consumption under optimal regulation is the highest compared to that of the different CI coefficients. However, the average market clearing price is also the highest since MPI is not considered by policy makers when . As the CI coefficient increases, MPI plays more important role when regulating the market operation. Thus the average market clearing price and the electricity consumption in the market both decrease as the CI coefficient increases. If the CI coefficient turns to 1, in this case, in Formula (4) equals 1, and then turns into . Under this circumstance, the objective of optimal market regulation could be described as the minimization of the average market clearing price.
Therefore, policy makers could select a proper CI coefficient when achieving optimal market regulation, according to the actual situation of the specific electricity market. In this case, we can tell from Figure 7 that 0.7 or 0.8 would be suitable CI coefficients, since, under these circumstances, the electricity consumption remains at a relatively high level, while the average market clearing price is relatively low. Therefore, 0.7 is selected as the CI coefficient for further study on market simulation and regulation in the following subsections.
5.3. Market Simulation and Regulation
As discussed in the previous section, 0.7 is selected as the CI coefficient when policy makers achieve optimal regulation of the market operation in this case. The market operation situations under different levels of bilateral contracts should be compared to show the effectiveness of the proposed model in achieving optimal market regulation. Kelman et al. uses bilateral contracts to reduce market power in hydrothermal systems [10]. The results show that prices decrease and generation increases as the amount of contracts signed by the generators increases. The results from [13] indicate that the exercise of market power drops significantly when there is an increase in generation contracting. Following similar practices in these studies, when bilateral contracts are assigned to power suppliers in proportion to their capacities, different levels of bilateral contracts for comparison are set in Table 2. Table 3 summarizes the electricity production (EP) and the profits of power suppliers, as well as the average market clearing price (AMCP) and the CI value under different levels of bilateral contracts. It can be seen that, as the CI value increases, the total EP in the market increases and the AMCP decreases in general. When optimal levels of bilateral contracts derived from the proposed model are adopted, the CI value is the highest, the total EP is the highest, and the AMCP is the lowest across the different scenarios. These results prove that CI is an effective indicator to evaluate the market’s operation, and solving the proposed model could obtain optimal levels of bilateral contracts between hydropower stations during multiple trading periods for market operation regulation.
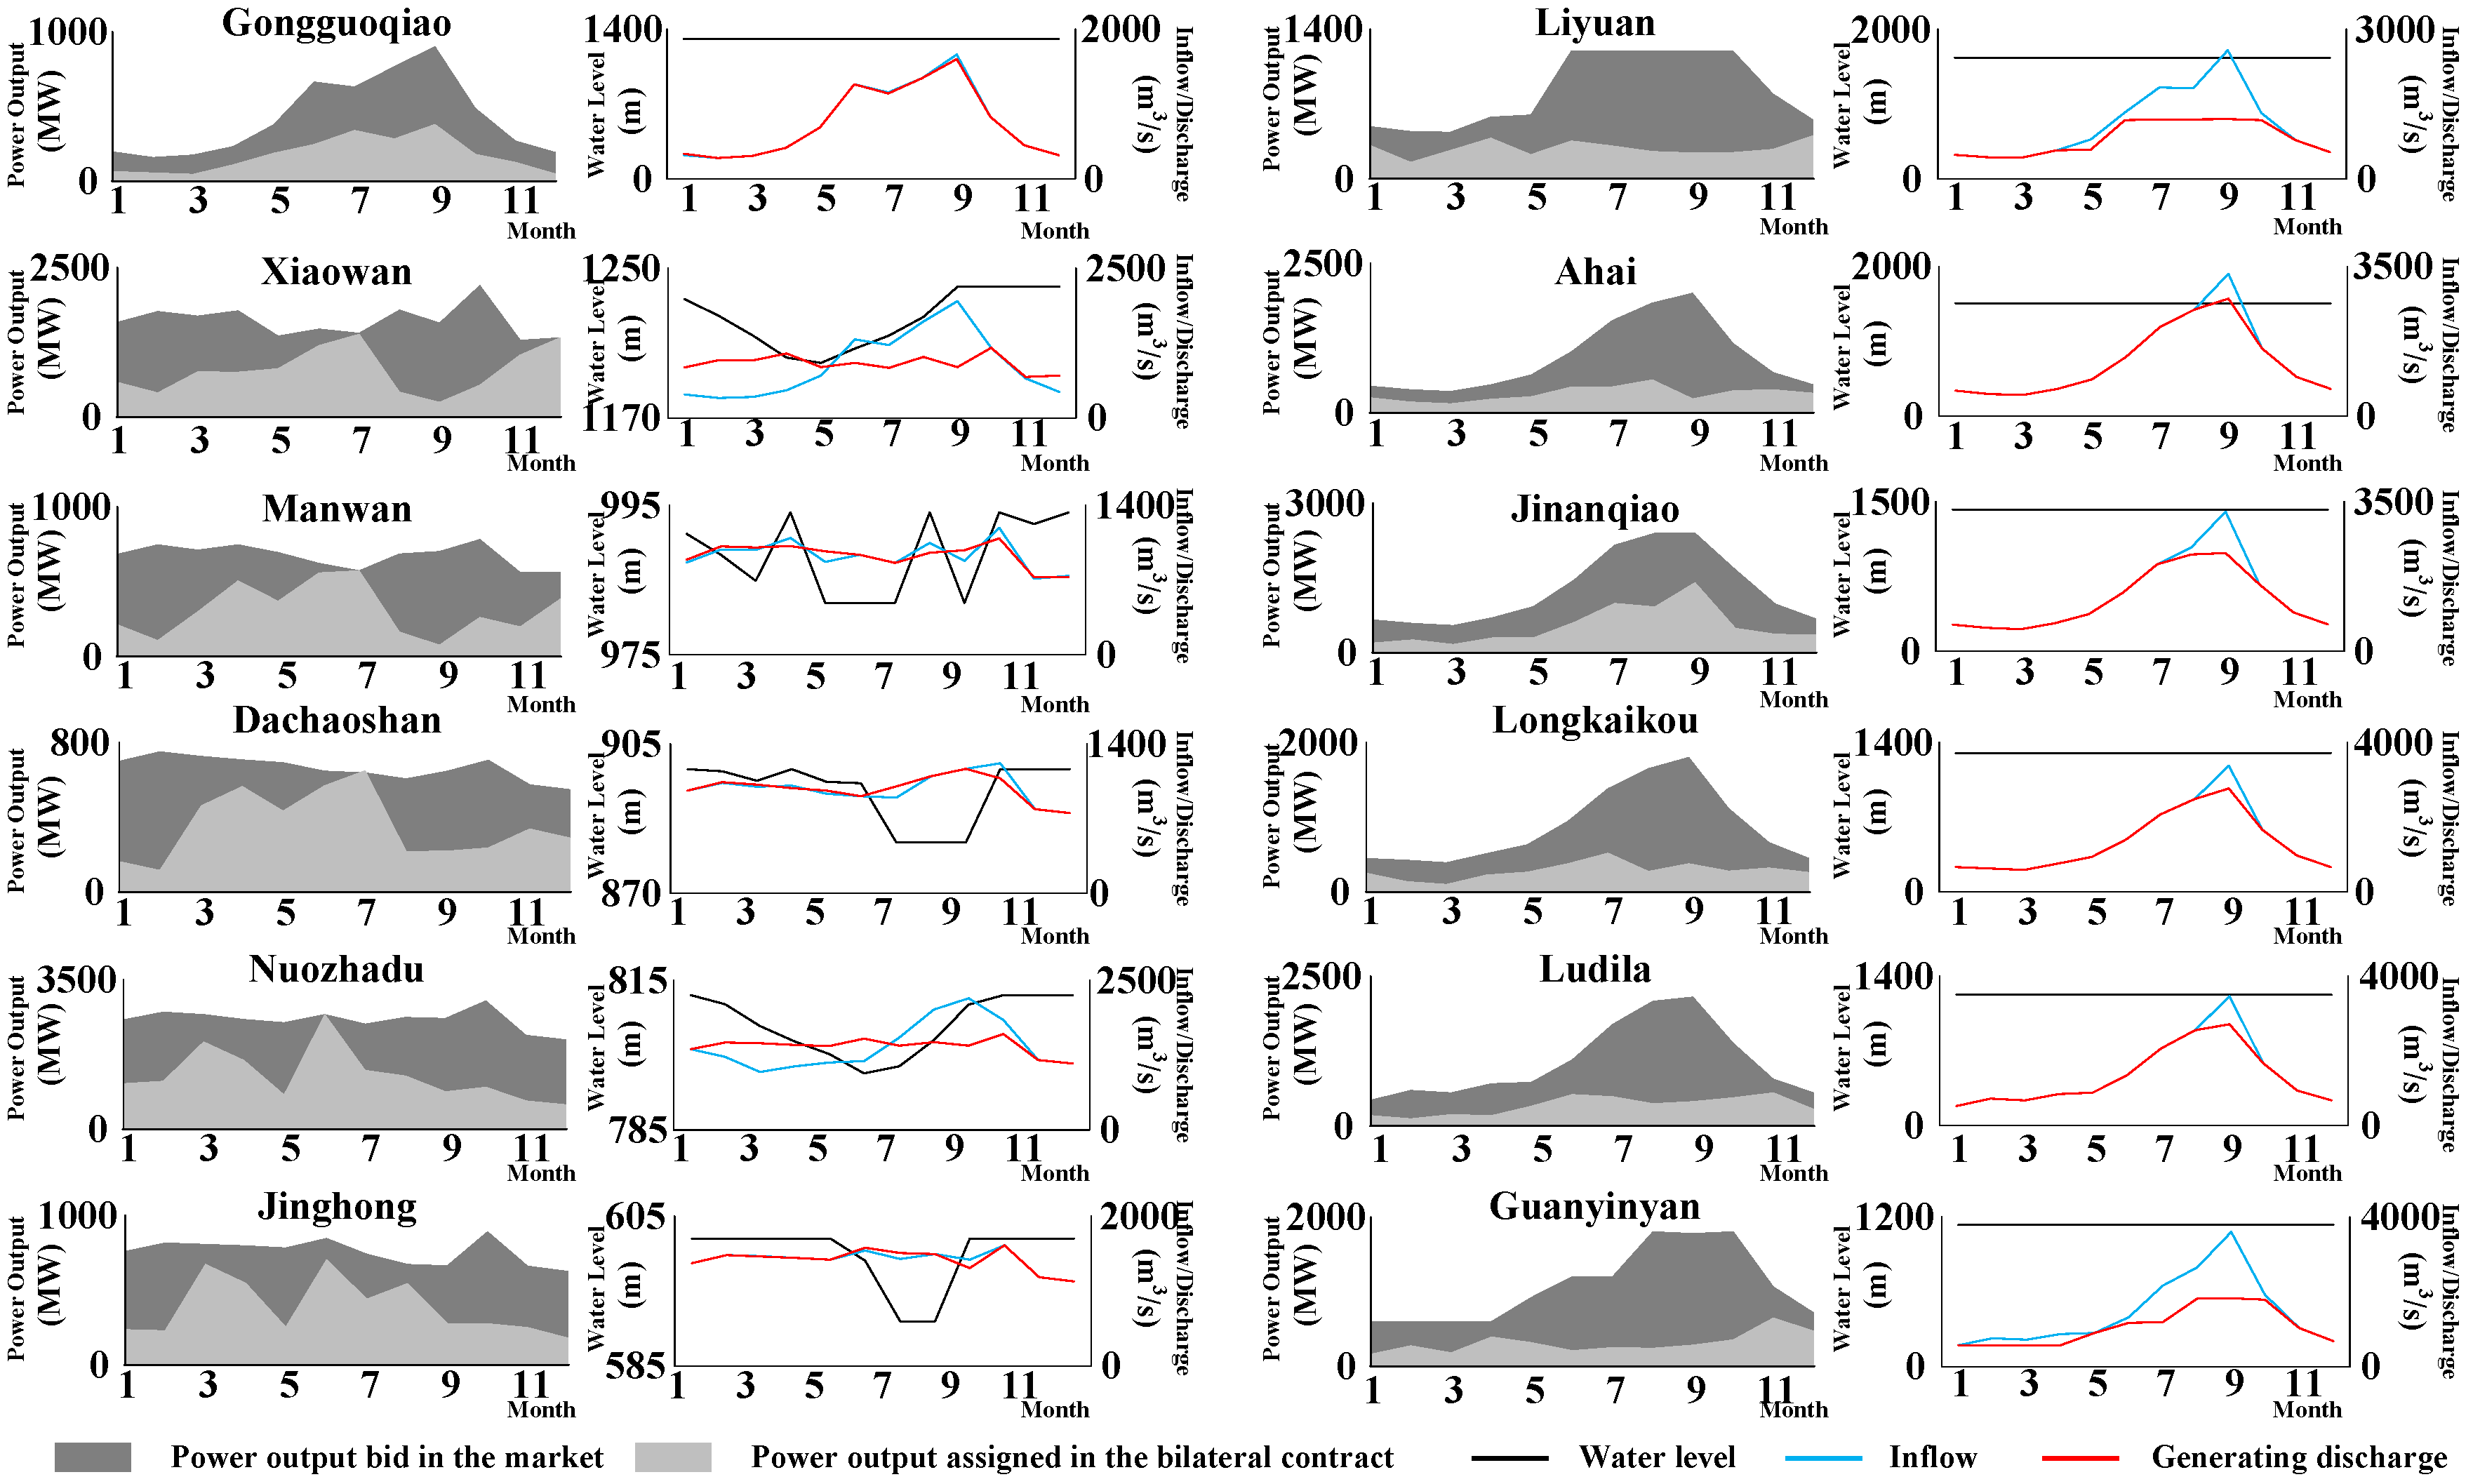
More specifically, the optimal levels of bilateral contracts and the corresponding optimal operation of the giant cascaded hydropower stations are illustrated in Figure 8. Since Xiaowan and Nuozhadu have good regulating abilities (annual or plurennial) and huge storage capacities (, ), they can reallocate the inflow and adjust their operation schedules between different months. Therefore, the monthly operation schedules of Xiaowan and Nuozhadu have great influences on the overall generation capacity of LR and the entire system as well. Manwan, Dachaoshan, and Jinghong also have good regulating abilities (seasonal or annual), but their storage capacities are relatively small, as shown in Table 1. Thus they can adjust their monthly operation schedules to optimize their profit to some extent, but they have little influence on the generation capacity of the system throughout the year. Gongguoqiao and all hydropower stations along the JR have poor regulating abilities on the monthly scale (daily or weekly), which means that they can only reallocate the inflow within a week or a day. Thus, in order to maximize their profits, they usually remain operating at normal high water levels throughout the year and generate according to the inflow. Moreover, from Figure 8, we can tell that sometimes the inflow exceeds the generating discharge in flood season, but the water level remains unaltered. That is mainly because such stations already generate the maximum power output, so the surplus inflow results in water spillage due to their poor regulating abilities. In terms of thermal power stations, their operating costs are much higher than those of hydropower station, so they are not competitive in hydro-dominated environments. However, in the transition period from a regulated power system to a deregulated one, thermal power is important for ensuring the security of the power system, since thermal power stations are close to the load center. Thus, they keep generating at minimum power output because of the setting of constraint conditions.
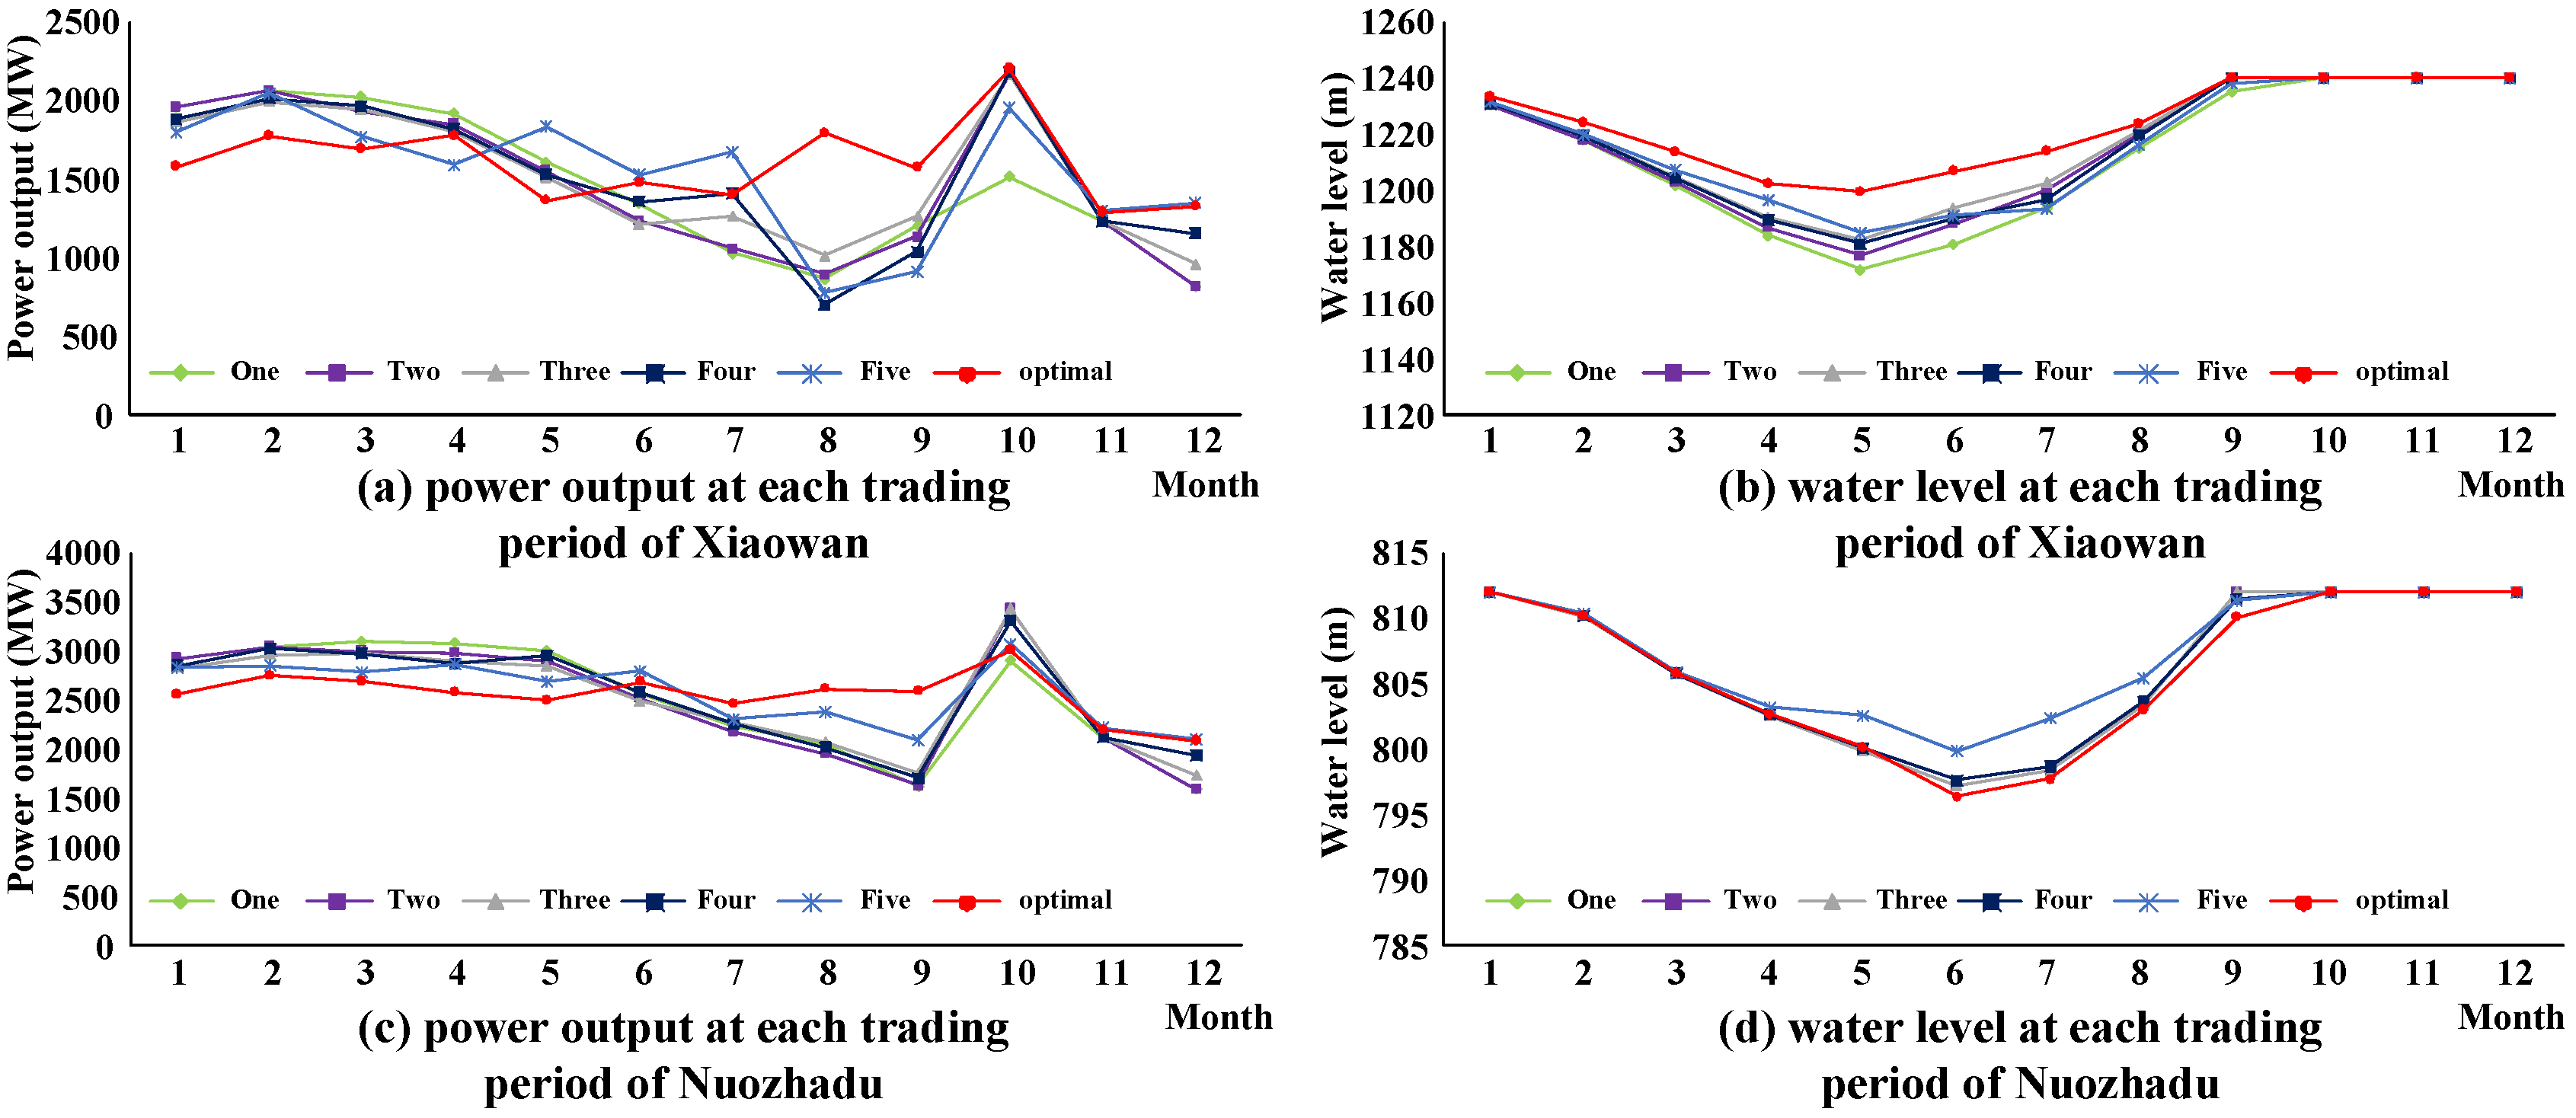
Figure 9 illustrates the generation schedules of Xiaowan and Nuozhadu under different market operation regulation scenarios. By comparing the generation schedule of Xiaowan in the optimal scenario with those in the other five regulation scenarios, we can tell from Figure 9a that Xiaowan generates less electricity in the dry season (from December to April) in the optimal regulation scenario. Meanwhile, Xiaowan keeps operating at a relatively high water level (lower than the flood control level 1236 m) before and during the flood season (from June to October), as in Figure 9b. During the flood season, Xiaowan raises its generating output in order to increase the total electricity production of LR. The generating schedule of downstream station Xiluodu is similar to Xiaowan, as can be seen from Figure 9c,d. Its power outputs are lower in the dry season and higher in the flood season in the optimal regulation scenario than in other scenarios. Since the upstream station Xiaowan will increase its generating discharge in the flood season to raise its power output, the inflow of downstream station Nuozhadu will increase correspondingly. Thus, even if it operates at a relatively low water level before and during the flood season, Nuozhadu could also generate sufficient electricity production in the flood season and store enough water to bring the water level back to a normal high water level at the end of the flood season.
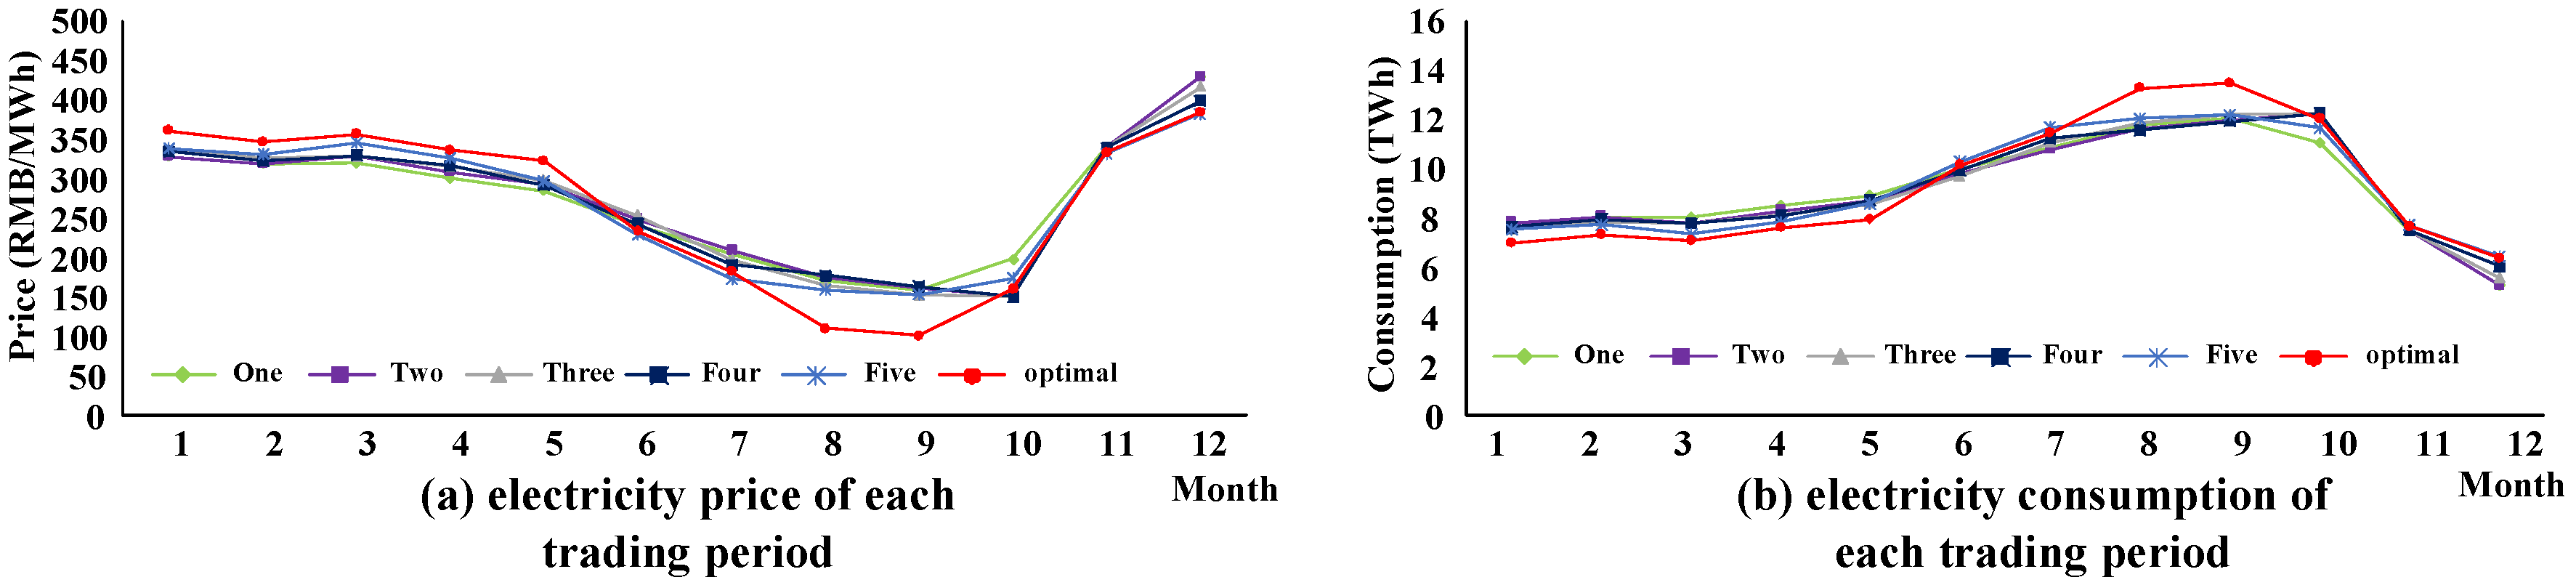
Figure 10 shows the market clearing price and the electricity consumption of each month in the different regulation scenarios. Compared with the outcomes in the optimal regulation scenario, the entire system is willing to transfer the electricity production/consumption from the flood season to the dry season (the same trend as in the operation schedules of Xiaowan and Nuozhadu) in order to raise market clearing prices in the flood season. Overall, cascaded hydropower stations could abuse their regulating abilities to gain extra profit in the market environment. It can be seen from Figure 10 that the electricity production increases in the dry season and decreases in the flood season in the other five regulation scenarios compared with the optimal regulation scenario. This operation schedule results in about an average 0.96% production reduction during multiple trading periods, but an average 3.98% extra profit. When policy makers regulate the market with the levels of bilateral contracts derived from the proposed model, the willingness to abuse market power drops, resulting in the lowest average market clearing price and the highest electricity production during multiple trading periods. In summary, the proposed indicator and the model are effective in achieving the optimal regulation of market operation in order to build a better electricity market environment.
5.4. Effects of MPTGA
To verify the effect of the proposed MPTGA, the same parameters for serial and multi-core situations of a multi-core parallel genetic algorithm (MPGA) and the MPTGA are calculated and compared. Speedup, , and efficiency, , are two significant indices for evaluating the performances of the models [28,29]. They are calculated as follows:
where represents the computation time for completing the task in serial with a single CPU core and represents the computation time for the task using parallel processing with P CPU cores.
As listed in Table 4, MPGA and MPTGA both have positive effects on reducing the computational time. Compared with MPGA, MPTGA costs less time to reach the convergence since it avoids the repeated calculation of the same chromosomes in the late part of the algorithm because of the adoption of the tabu search strategy. The speedup increases as the number of CPU cores increases because the degree of parallelism rises with more cores. However, more cores cause more costs in communicating and scheduling between different cores, which, in turn, decreases the efficiency, resulting in deviations between the observed speedup and the ideal speedup.
6. Conclusions
In this paper, an integrated method is proposed for achieving the optimal market regulation in hydro-dominated environments. In the proposed method, a comprehensive indicator is introduced for the evaluating market operation situation, an iterative algorithm is introduced for market simulation, and a solution methodology based on MPTGA is presented to reduce the market price and increase the electricity consumption through optimal levels of bilateral contracts. The following major conclusions could be made from the numerical results and the analysis of Yunnan’s electricity market:
- (1)
- The proposed comprehensive indicator composed of the market price and the electricity consumption is an effective method to evaluate the market operation situation. Different coefficients of the comprehensive indicator used by policy makers could result in different situations of market operation.
- (2)
- The optimal level of bilateral contracts derived from the proposed model proves it to be an effective measure to achieve optimal market regulation in hydro-dominated electricity markets since the proposed method takes full consideration of energy shifting abilities and the temporal and spatial couplings of the giant cascaded hydropower stations.
- (3)
- The proposed MPTGA based solution methodology could substantially promote an efficient solution and reduce the computational time in comparison to MPGA.
- (4)
- The proposed integrated method could be used in other similar hydro-dominated environments in their early stages with regulated power suppliers, with some minor modifications according to different practical situations.
- (5)
- This study focuses on the monthly operation of cascaded hydropower stations instead of the weekly or daily operation because the Yunnan electricity market is a monthly transaction market at the present stage. Future studies will focus on weekly or daily simulation and the regulation of market operation in hydro-dominated environments as the transaction time scale changes.
Acknowledgments
This study was supported by the National Natural Science Foundation of China (No. 91547201), the Major International Joint Research Project from the National Nature Science Foundation of China (51210014), and the China Postdoctoral Science Foundation (2016M590225).
Author Contributions
Fu Chen developed and solved the proposed model and carried out the analysis. Fu Chen and Benxi Liu proposed the solution methodology. Chuntian Cheng and Ali Mirchi helped with the English revision of the manuscript.
Conflicts of Interest
The authors declare no conflict of interest.
References
- Hennig, T.; Wang, W.; Magee, D.; He, D. Yunnan’s Fast-paced large hydropower development: A powershed-based approach to critically assessing generation and consumption paradigms. Water. 2016, 8, 476. [Google Scholar] [CrossRef]
- Uria-Martinez, R.; O’Connor, P.; Johnson, M.M. 2014 Hydropower Market Report; Oak Ridge National Laboratory: Oak Ridge, TN, USA, 2015.
- Cheng, C.; Yan, L.; Mirchi, A.; Madani, K. China’s booming hydropower: systems modeling challenges and opportunities. J. Water Resour. Plan. Manag. 2016, 143, 02516002. [Google Scholar] [CrossRef]
- Hong, L.; Zhou, N.; Fridley, D.; Raczkowski, C. Assessment of China’s renewable energy contribution during the 12th Five Year Plan. Energy Policy 2013, 62, 1533–1543. [Google Scholar] [CrossRef]
- Rangel, LF. Competition policy and regulation in hydro-dominated electricity markets. Energy Policy 2008, 36, 1292–1302. [Google Scholar] [CrossRef]
- Scott, T.; Read, E. Modelling hydro reservoir operation in a deregulated electricity market. Int. Trans. Oper. Res. 1996, 3, 243–253. [Google Scholar] [CrossRef]
- Ramos, A.; Ventosa, M.; Rivier, M. Modeling competition in electric energy markets by equilibrium constraints. Util. Policy 1999, 7, 233–242. [Google Scholar] [CrossRef]
- Kelman, R.; Barroso, L.; Pereira, M. Market power assessment and mitigation in hydrothermal systems. IEEE Trans Power Syst. 2001, 16, 354–359. [Google Scholar] [CrossRef]
- Baslis, C.; Bakirtzis, A. Mid-term stochastic scheduling of a pricemaker hydro producer with pumped storage. IEEE Trans. Power Syst. 2011, 26, 1856–1865. [Google Scholar] [CrossRef]
- Pousinho, H.M.I.; Contreras, J.; Catalao, J. Operations planning of a hydro producer acting as a price-maker in an electricity market. In Proceedings of the IEEE Power and Energy Society General Meeting, San Diego, CA, USA, 22–26 July 2012; pp. 1–7. [Google Scholar]
- Flatabo, N.; Doorman, G.; Grande, O.S.; Randen, H.; Wangensteen, I. Experience with the Nord Pool design and implementation. IEEE Trans. Power Syst. 2003, 18, 541–547. [Google Scholar] [CrossRef]
- Wolak, F.A. Market design and price behavior in restructured electricity markets: An international comparison. Top. Regul. Econ. Policy 2000, 36, 79–137. [Google Scholar]
- Villar, J.; Rudnick, H. Hydrothermal market simulator using game theory: Assessment of market power. IEEE Trans. Power Syst. 2003, 18, 91–98. [Google Scholar] [CrossRef]
- Sweetser, A. Measuring a dominant firm’s market power in a restructured electricity market, a case study of Colorado. Util. Policy 1999, 7, 243–257. [Google Scholar] [CrossRef]
- Li, G.; Shi, J.; Qu, X. Modeling methods for GenCo bidding strategy optimization in the liberalized electricity spot market—A state-of-the-art review. Energy 2011, 36, 4686–4700. [Google Scholar] [CrossRef]
- Borenstein, S.; Bushnell, J.; Knittel, C.R. Market power in electricity markets: Beyond concentration measures. Energy J. 1999, 20, 65–88. [Google Scholar] [CrossRef]
- Gaudard, L.; Gabbi, J.; Bauder, A.; Romerio, F. Long-term uncertainty of hydropower revenue due to climate change and electricity prices. Water Resour. Manag. 2016, 30, 1325. [Google Scholar] [CrossRef]
- Ortner, A.; Graf, C. Multi-market unit-commitment and capacity reserve prices in systems with a large share of hydro power: A case study. In Proceedings of the 2013 10th International Conference on the European Energy Market (EEM), Stockholm, Sweden, 27–31 May 2013; pp. 1–8. [Google Scholar]
- Chazarra, M.; Pérez-Díaz, J.I.; García-González, J. Optimal energy and reserve scheduling of pumped-storage power plants considering hydraulic short-circuit operation. IEEE Trans. Power Syst. 2017, 32, 344–353. [Google Scholar] [CrossRef]
- Carpentier, D.; Haas, J.; Olivares, M.; de la Fuente, A. Modeling the multi-seasonal link between the hydrodynamics of a reservoir and its hydropower plant operation. Water 2017, 9, 367. [Google Scholar] [CrossRef]
- Wu, X.; Cheng, C.; Wang, J.; Tang, H.; Li, C. Long term hydropower optimal operation model with electric power transmission restrictions for absorbed energy Maximization. Proc. CSEE 2011, 31, 8–16. [Google Scholar]
- Cheng, C.; Chen, F.; Li, G.; Tu, Q. Market equilibrium and impact of market mechanism parameters on the electricity price in yunnan’s electricity market. Energies 2016, 9, 463. [Google Scholar] [CrossRef]
- Weber, J.D.; Overbye, T.J. A two-level optimization problem for analysis of market bidding strategies. Power Eng. Soc. Summer Meet. 1999, 2, 682–687. [Google Scholar]
- Wang, J.; Liao, S.; Cheng, C.; Cai, H. Optimization of medium-term thermal power boot based on hybrid search algorithm. Proc. CSEE 2011, 31, 94–100. [Google Scholar]
- Shafie-khah, M.; Moghaddam, M.P.; Sheikh-El-Eslami, M.K. Ex-ante evaluation and optimal mitigation of market power in electricity markets including renewable energy resources. IET Gener. Transm. Distrib. 2016, 10, 1842–1852. [Google Scholar] [CrossRef]
- Liu, B.; Liao, S.; Cheng, C.; Wu, X. A multi-core parallel genetic algorithm for the long-term optimal operation of large-scale hydropower systems. In Proceedings of the World Environmental & Water Resources Congress 2016, West Palm Beach, FL, USA, 22–26 May 2016. [Google Scholar]
- Cheng, C.; Wang, W.; Xu, D.; Chau, K.W. Optimizing hydropower reservoir operation using hybrid genetic algorithm and chaos. Water Resour. Manag. 2008, 22, 895–909. [Google Scholar] [CrossRef]
- Cheng, C.; Wang, S.; Chau, K.; Wu, X. Parallel discrete differential dynamic programming for multireservoir operation. Environ. Model. Softw. 2014, 57, 152–164. [Google Scholar] [CrossRef]
- Zhang, X.; Beeson, P.; Link, R.; Manowitz, D.; Izaurralde, R.C.; Sadeghi, A.; Thomson, A.M.; Sahajpal, R.; Srinivasan, R.; Arnold, J.G. Efficient multi-objective calibration of a computationally intensive hydrologic model with parallel computing software in Python. Environ. Model. Softw. 2013, 46, 208–218. [Google Scholar] [CrossRef]
Figure 1.
Installed hydropower capacity of the top seven hydropower producing countries and of Yunnan Province.
Figure 1.
Installed hydropower capacity of the top seven hydropower producing countries and of Yunnan Province.

Figure 2.
Electricity prices and surplus generation in some provinces of China.

Figure 3.
The characteristic curve of the relationship between water head and water volume used per kiloWatt-hour.
Figure 3.
The characteristic curve of the relationship between water head and water volume used per kiloWatt-hour.
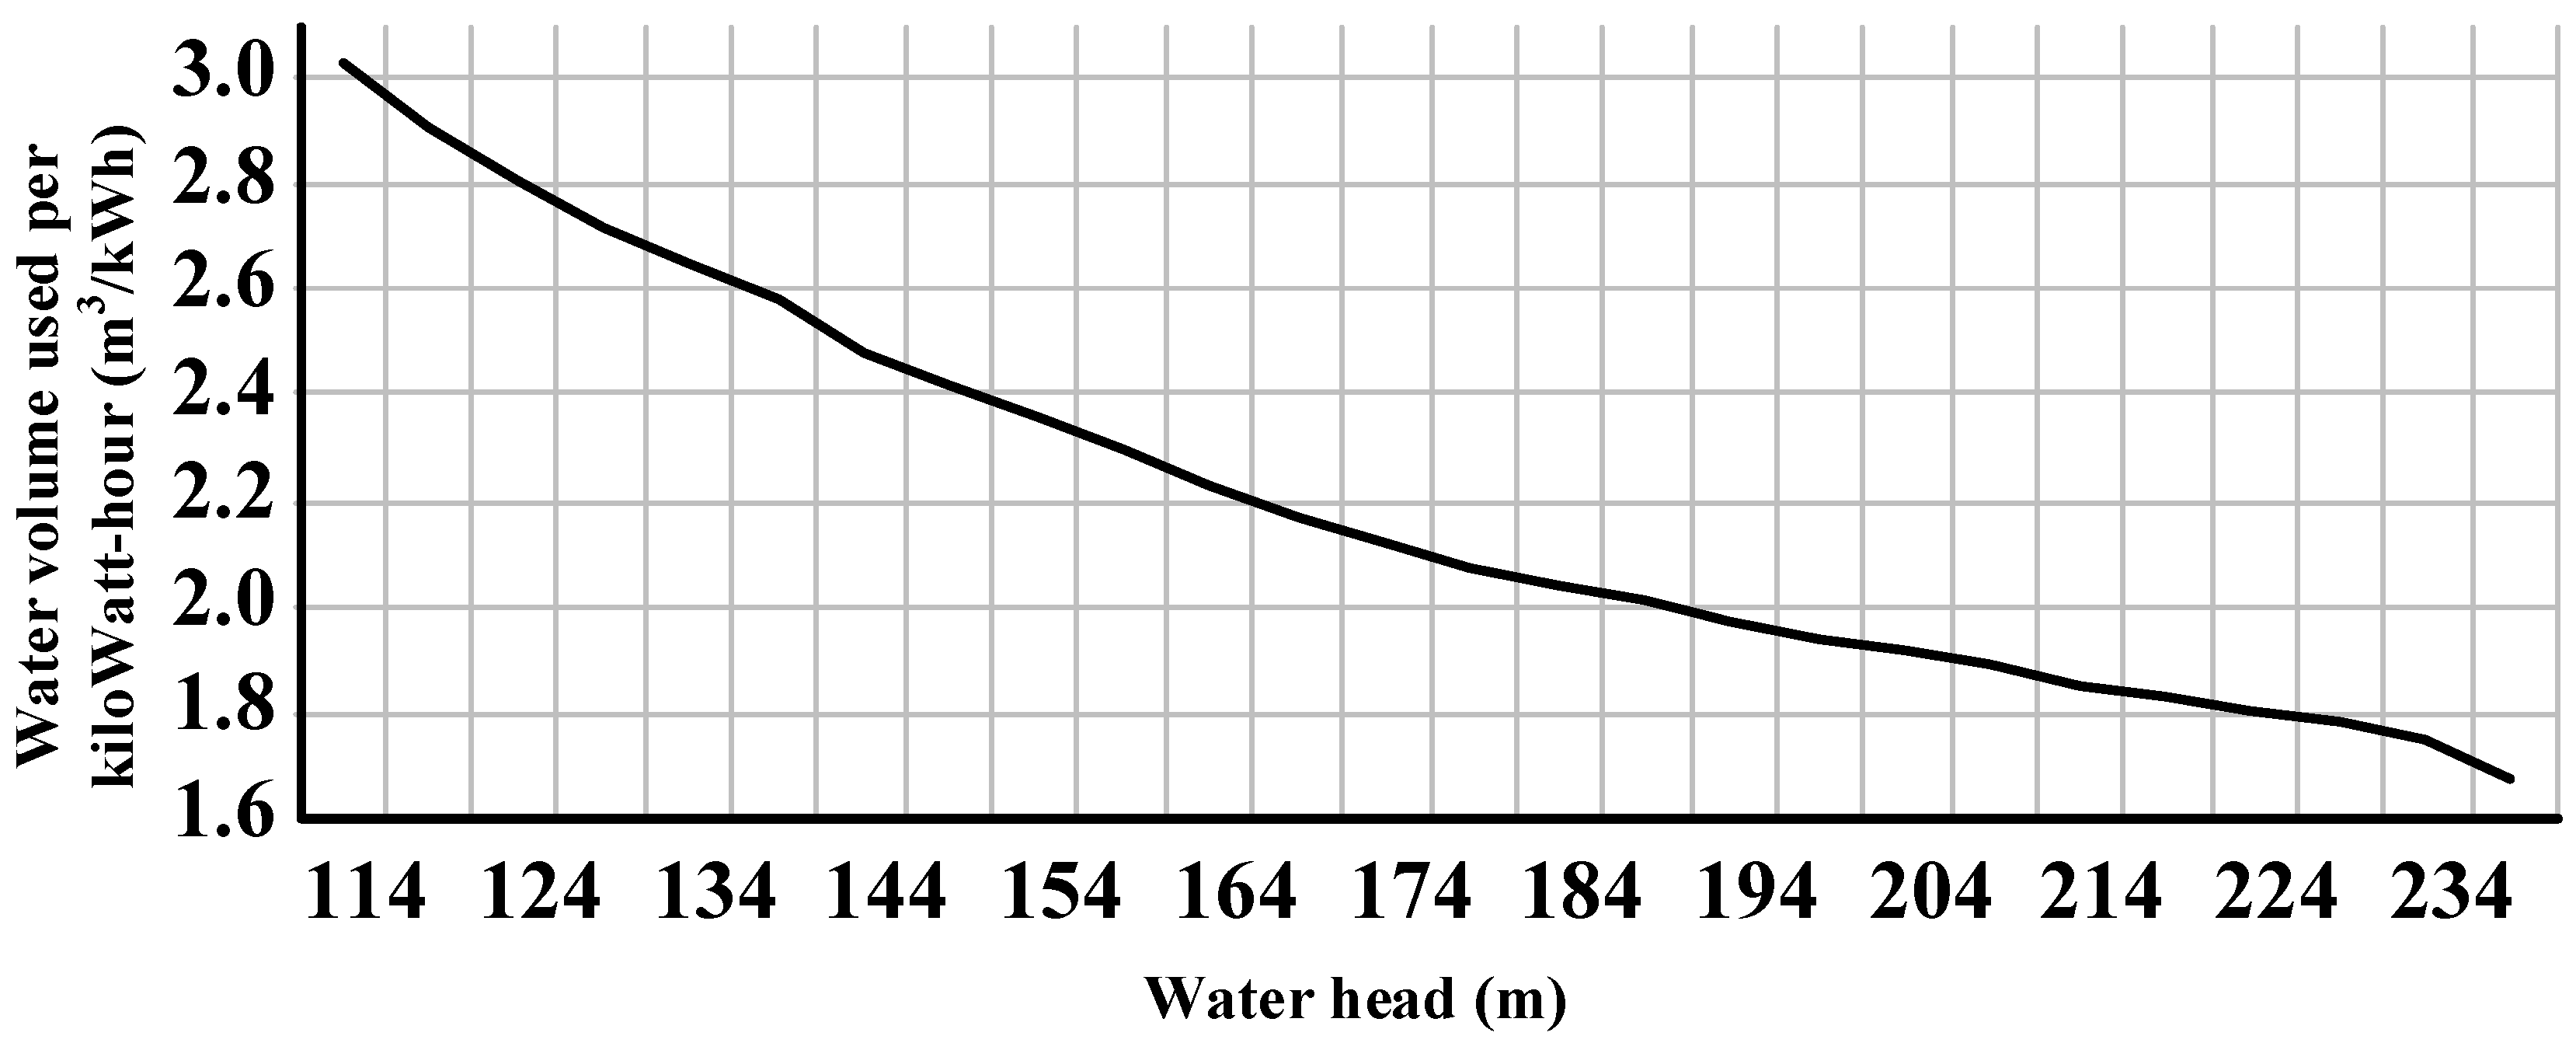
Figure 4.
Multi-core parallel computing strategy.

Figure 5.
Integrated solution methodology based on a multi-core parallel tabu genetic algorithm (MPTGA).
Figure 5.
Integrated solution methodology based on a multi-core parallel tabu genetic algorithm (MPTGA).

Figure 6.
Locations of the giant cascaded hydropower stations and the thermal power stations in Yunnan.
Figure 6.
Locations of the giant cascaded hydropower stations and the thermal power stations in Yunnan.

Figure 7.
Impacts of the Comprehensive Indicator of Market Operation Situation (CI) coefficient on the average market clearing price and electricity consumption.
Figure 7.
Impacts of the Comprehensive Indicator of Market Operation Situation (CI) coefficient on the average market clearing price and electricity consumption.

Figure 8.
Optimal levels of bilateral contracts and the corresponding operation schedules of giant cascaded hydropower stations.
Figure 8.
Optimal levels of bilateral contracts and the corresponding operation schedules of giant cascaded hydropower stations.

Figure 9.
Generating schedules of Xiaowan and Nuozhadu under different regulation scenarios: (a) power output at each trading period of Xiaowan; (b) water level at each trading period of Xiaowan; (c) power output at each trading period of Nuozhadu; (d) water level at each trading period of Nuozhadu.

Figure 10.
The monthly electricity consumption and market clearing price under different regulation scenarios: (a) electricity price of each trading period; (b) electricity consumption of each trading period.
Figure 10.
The monthly electricity consumption and market clearing price under different regulation scenarios: (a) electricity price of each trading period; (b) electricity consumption of each trading period.


Table 1.
The main attributes of the stations as power suppliers.
| Hydropower Plant | Power Supplier | Regulation Ability | Installed Capacity | Normal High Water Level (m) | Dead Water Level (m) | Regulating Storage (108 m3) |
|---|---|---|---|---|---|---|
| Gongguoqiao | LR | Daily | 225 MW 4 | 1307 | 1303 | 0.49 |
| Xiaowan | LR | Annual | 700 MW 6 | 1240 | 1166 | 98.77 |
| Manwan | LR | Seasonal | 300 MW + 250 MW 5 + 120 MW | 994 | 982 | 2.57 |
| Dachaoshan | LR | Annual | 225 MW 6 | 899 | 882 | 3.7 |
| Nuozhadu | LR | Plurennial | 650 MW 9 | 812 | 760 | 122.24 |
| Jinghong | LR | Seasonal | 350 MW 5 | 602 | 591 | 3.09 |
| Liyuan | JR | Weekly | 600 MW 4 | 1618 | 1605 | 1.74 |
| Ahai | JR | Daily | 400 MW 5 | 1504 | 1492 | 2.38 |
| Jinanqiao | JR | Daily | 600 MW 4 | 1418 | 1398 | 3.46 |
| Longkaikou | JR | Daily | 360 MW 5 | 1298 | 1289 | 1.26 |
| Ludila | JR | Weekly | 360 MW 6 | 1223 | 1205 | 8.56 |
| Guanyinyan | JR | Weekly | 600 MW 5 | 1134 | 1122 | 5.5 |
| Xuanwei | CGC | - | 300 MW 6 | - | - | - |
| Yangzonghai | CGC | - | 200 MW 2 + 300 MW 2 | - | - | - |
| Xiaolongtan | CGC | - | 300 MW 2 | - | - | - |
Table 2.
Different regulation scenarios for comparison.
| Scenario | Description |
|---|---|
| One | 30% of each station’s average generation capacity over the same period in history |
| Two | 40% of each station’s average generation capacity over the same period in history |
| Three | 50% of each station’s average generation capacity over the same period in history |
| Four | 60% of each station’s average generation capacity over the same period in history |
| Five | 70% of each station’s average generation capacity over the same period in history |
| Optimal | Optimal level of bilateral contracts derived from the proposed method |
Table 3.
Main market operation results in different regulation scenarios.
| Scenario | EP of LR (TWh) | EP of JR (TWh) | EP of CGC (TWh) | Profit of LR (108 RMB) | Profit of JR (108 RMB) | Profit of CGC (108 RMB) | AMCP (RMB/MWh) | CI |
|---|---|---|---|---|---|---|---|---|
| One | 57.06 | 52.89 | 4.22 | 147.35 | 136.58 | 10.25 | 258.24 | 0.03 |
| Two | 57.08 | 52.89 | 4.22 | 146.59 | 135.83 | 10.21 | 256.81 | 0.05 |
| Three | 57.35 | 52.89 | 4.22 | 146.24 | 134.87 | 10.13 | 255.00 | 0.11 |
| Four | 57.91 | 52.89 | 4.22 | 147.79 | 134.98 | 10.13 | 255.21 | 0.18 |
| Five | 58.31 | 52.89 | 4.22 | 147.14 | 133.46 | 10.00 | 252.34 | 0.27 |
| Optimal | 58.65 | 52.89 | 4.22 | 142.77 | 128.74 | 9.62 | 243.42 | 0.41 |
Table 4.
Serial and parallel results of a multi-core parallel genetic algorithm (MPGA) and MPTGA.
| Method | Indice | Serial | 2-Core | 4-Core |
|---|---|---|---|---|
| MPGA | Computation time (s) | 313,125 | 158,947 | 81,331 |
| Speedup | 1 | 1.97 | 3.85 | |
| Efficiency | 1 | 0.99 | 0.96 | |
| MPTGA | Computation time (s) | 160,285 | 80,952 | 40,994 |
| Speedup | 1 | 1.98 | 3.91 | |
| Efficiency | 1 | 0.99 | 0.98 |
© 2017 by the authors. Licensee MDPI, Basel, Switzerland. This article is an open access article distributed under the terms and conditions of the Creative Commons Attribution (CC BY) license (http://creativecommons.org/licenses/by/4.0/).
Share and Cite
MDPI and ACS Style
Chen, F.; Liu, B.; Cheng, C.; Mirchi, A. Simulation and Regulation of Market Operation in Hydro-Dominated Environment: The Yunnan Case. Water 2017, 9, 623. https://doi.org/10.3390/w9080623
AMA Style
Chen F, Liu B, Cheng C, Mirchi A. Simulation and Regulation of Market Operation in Hydro-Dominated Environment: The Yunnan Case. Water. 2017; 9(8):623. https://doi.org/10.3390/w9080623
Chicago/Turabian StyleChen, Fu, Benxi Liu, Chuntian Cheng, and Ali Mirchi. 2017. "Simulation and Regulation of Market Operation in Hydro-Dominated Environment: The Yunnan Case" Water 9, no. 8: 623. https://doi.org/10.3390/w9080623
Note that from the first issue of 2016, this journal uses article numbers instead of page numbers. See further details here.