Effectiveness of Runoff Control Legislation and Active, Beautiful, Clean (ABC) Waters Design Features in Singapore


1
PUB, Singapore’s national water agency, 40 Scotts Road, Environment Building, #07-01, Singapore 228231, Singapore
2
Water Science and Engineering Department, IHE Delft Institute for Water Education, 2611 AX Delft, The Netherlands
*
Author to whom correspondence should be addressed.
Water 2017, 9(8), 627; https://doi.org/10.3390/w9080627
Submission received: 9 June 2017
/
Revised: 7 August 2017
/
Accepted: 10 August 2017
/
Published: 22 August 2017
(This article belongs to the Special Issue Sponge Cities: Emerging Approaches, Challenges and Opportunities)
Abstract
:Storm water management in Singapore has always been a challenge due to intense rainfall in a flat, low-lying and urbanised catchment. PUB’s (Singapore’s National Water Agency) recent runoff control regulation limits the runoff coefficient to 0.55 for developments larger than or equal to 0.2 ha. The use of Active, Beautiful, Clean (ABC) Waters design features are encouraged to attain peak runoff reduction. Hence the paper focuses on (i) determining the actual hydrological response regime of Singapore using the relationship between runoff coefficient (C), land use and slope; and (ii) investigating the effectiveness of ABC Waters design features in delaying and reducing peak runoff using a modelling approach. Based on a Storm Water Management Model (SWMM) model and using elevation, land use and soil data as inputs, the peak C-values were obtained for 50 m × 50 m grid cells. The results show that for the same land use, the one with steeper slope resulted in a higher runoff coefficient. Simulations were carried out in two study areas, Green Walk District and Tengah Subcatchment, where ABC Waters design features (such as porous pavements, green roofs, rain gardens) and detention tanks were incorporated to reduce C-values. Results showed that peak C-values can be reduced to less than 0.55 after increasing the green areas and constructing detention facilities. Reduction in peak discharge (22% to 63%) and a delay in peak discharge by up to 30 min were also observed. Hence, it is recommended to consider the relationship between slope and land use while determining runoff coefficients; and to incorporate ABC Waters design features in urban design to reduce the peak flow and runoff coefficient (C).
1. Introduction
Urbanisation results in hydrological changes such as increased overland runoff due to increased imperviousness [1]. The increase in runoff exacerbates the flood risk, which is expected to increase further due to climatic, land use and further changes [2]. A range of measures are being put in place to mitigate the effects of flooding or adapt to flooding [3]. Cities across the world are adapting to urban flooding using various adaptation measures comprising innovative drainage design approaches, policy measures, legislative controls, and so forth [4,5,6]. The risk of flooding is likely to affect the liveability and sustainability in densely populated cities like Singapore, which is highly urbanised but with a small land area of 718 km2 [7]. Storm water management in Singapore is a challenge due to its geographical location, climatic regime and topography. As an island state, Singapore is surrounded by the sea and parts of the drainage system are influenced by tidal conditions. Located at the equator, Singapore receives abundant rainfall throughout the year. Solar radiation coupling with sea breeze convergence bring about short but very intense bursts of rainfall. With continued urbanisation, the water balance of the island is highly modified. Increasing the conveyance capacity of the storm water network by enlarging drains is difficult due to space constraints. Therefore Singapore’s National Water Agency, PUB, adopts the multi-pronged source-pathway-receptor approach as its storm water management strategy.
Drainage design requirements and considerations in Singapore are specified in PUB’s Code of Practice (COP) on Surface Water Drainage, where the rational formula has been recommended to compute peak runoff [8]. The runoff coefficient (C) is dependent on the degree and type of development within the catchment. Classification of catchments is based on their expected general characteristics when fully developed. The C values used in the COP consider only land use of catchment and are shown in Table 1.
In 2006, PUB launched the Active, Beautiful, Clean (ABC) Waters programme [9]. The concept of ABC Waters design features is similar to sustainable drainage systems (SuDS), water-sensitive urban drainage systems (WSUD), low impact developments (LID), best management practices (BMPs) and sponge cities that are prevalent in other countries [10]. Through holistic integration of the waterways and reservoirs with the surrounding environment, the ABC Waters programme aims to improve water quality, enhance the aesthetics of living environment and control the storm water runoff.
In addition to runoff control, some of these features provide a host of additional benefits such as providing recreational space, regulating ambient temperature through reducing urban heat island (UHI) [9]. Apart from enhancing liveability by moderating urban temperatures, reducing UHI may also minimise possible increases in convective thunderstorm activities which would otherwise result in increased rainfall [11].
Through the revised requirements in COP (Clause 7.1.5), PUB adopted the source control approach to reduce and delay runoff in the catchment. In 2014, it was enforced that “industrial, commercial, institutional and residential developments greater than or equal to 0.2 hectares in size are required to control the peak runoff discharged from the development sites. The maximum allowable peak runoff to be discharged to the public drains will be calculated based on a runoff coefficient of 0.55, and for design storms with a return period of 10 years and for various storm durations of up to 4 h (inclusive)” [8]. The peak runoff reduction is achieved through the implementation of ABC Waters Design features (e.g., porous pavements, wetlands, green roofs, planter boxes, bio retention swales, bio retention basins or rain gardens); and through structural detention/retention features (e.g., detention tanks, retention/sedimentation ponds) [9].
In addition to land use, the slope of the catchment plays an important role in determining the runoff. Ascertaining the hydrological response regime only with the land use without considering the slope is not ideal. This might lead to ineffective or inefficient design of drainage systems such as oversizing or under sizing of ABC Waters design features. The expert panel on drainage design and flood protection in Singapore also recommends—recommendation 4B-further research on C value [12]. Hence, this paper focuses on determining the actual hydrological response regime of Singapore using the relationship between coefficient value, slope and land use.
The combined effect and relationship between the land use and slope in Singapore are being ascertained through a hydrological response regime map. Furthermore, this paper also explores the effectiveness of using ABC Waters design features to reduce C values in Singapore.
2. Methodology
2.1. Hydrological Response Regime Map for Singapore
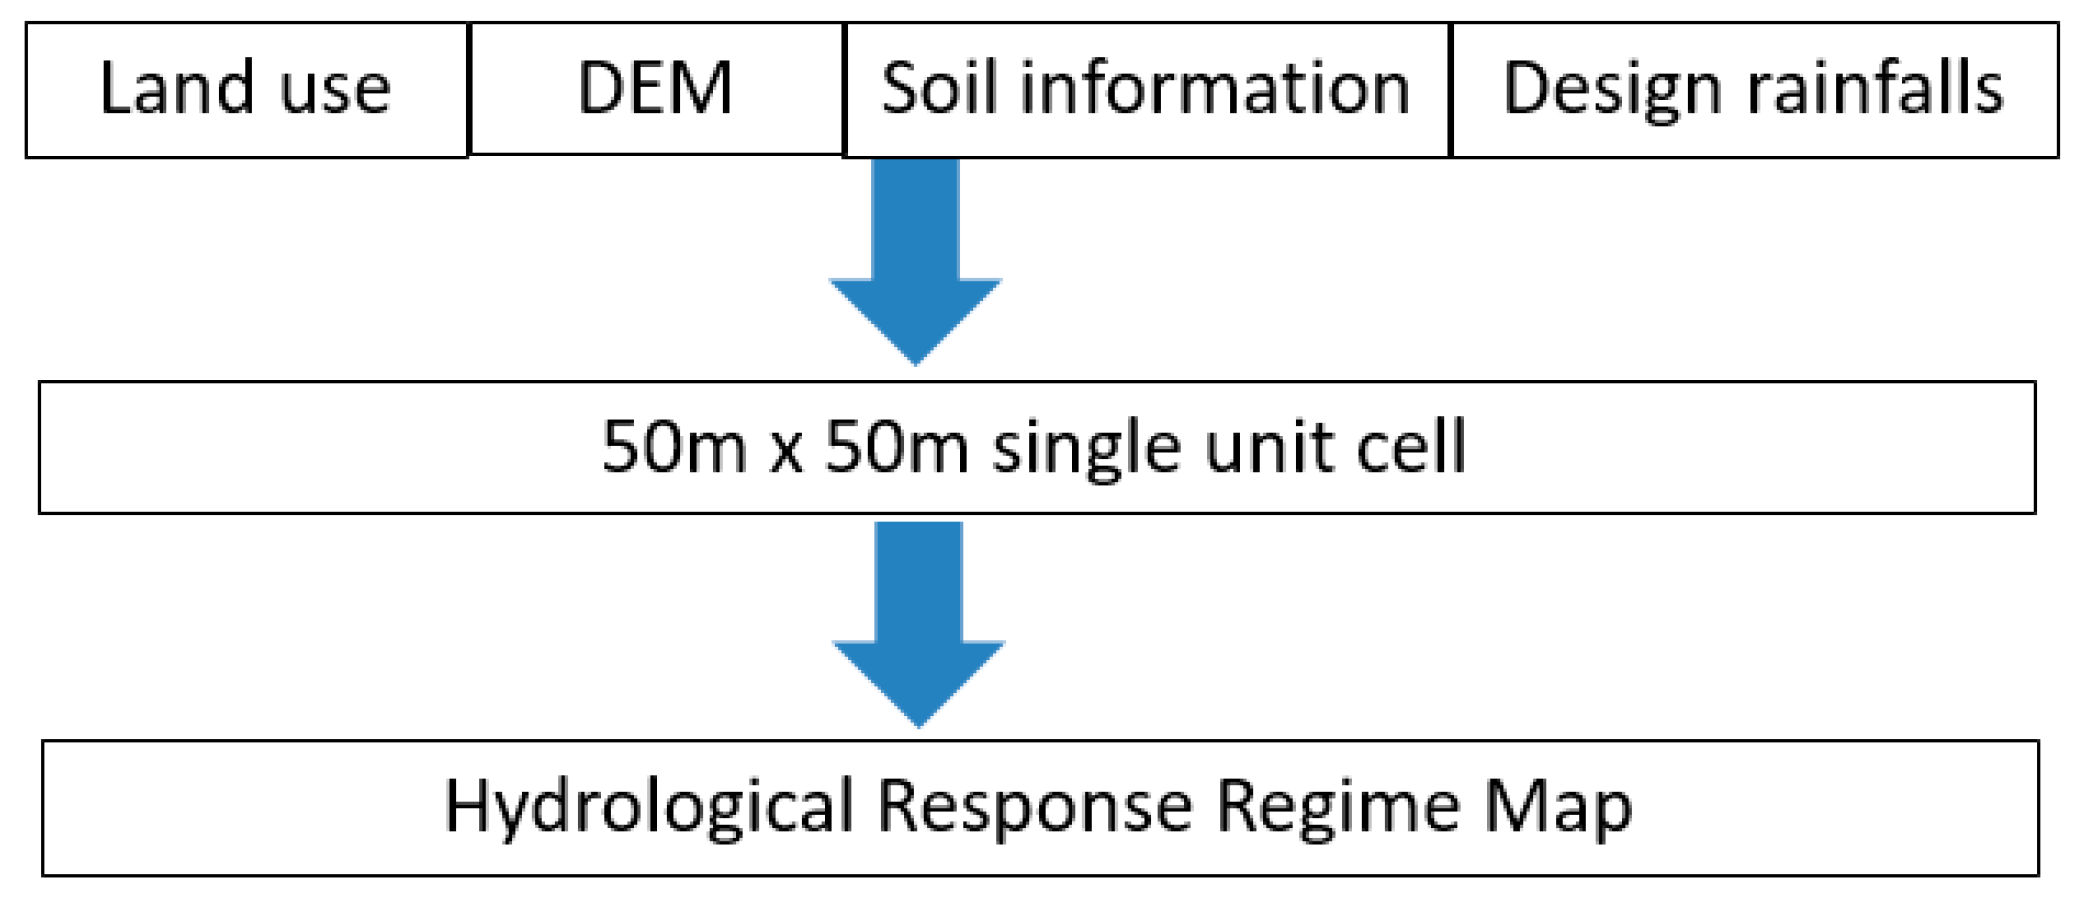
The presented research is divided into two stages. In the first stage, summarised in Figure 1, a hydrological response regime map for Singapore was determined. In the second stage the effectiveness of using ABC Waters design features to reduce C values was explored.
As seen in Figure 1, the high resolution (0.25 m × 0.25 m) digital elevation model (DEM) was resampled to a 50 × 50 m percent slope map. The resampled resolution of 50 m × 50 m was selected to be consistent with the 0.2 ha development size indicated in PUB’s regulation. The 32 land uses defined by Singapore’s Master Plan 2014 was reclassified into 10 broader categories, such as agriculture, beach, cemetery, port/airport, road, water body, greens, business, residential and special reserve sites. Land use parameters for each land use type were identified based on literature review as well as the author’s understanding of Singapore [13,14,15,16]. Soil properties in Singapore was assumed to be homogenous and belonged to hydrological soil group (HSG) D due to its small land area [16].
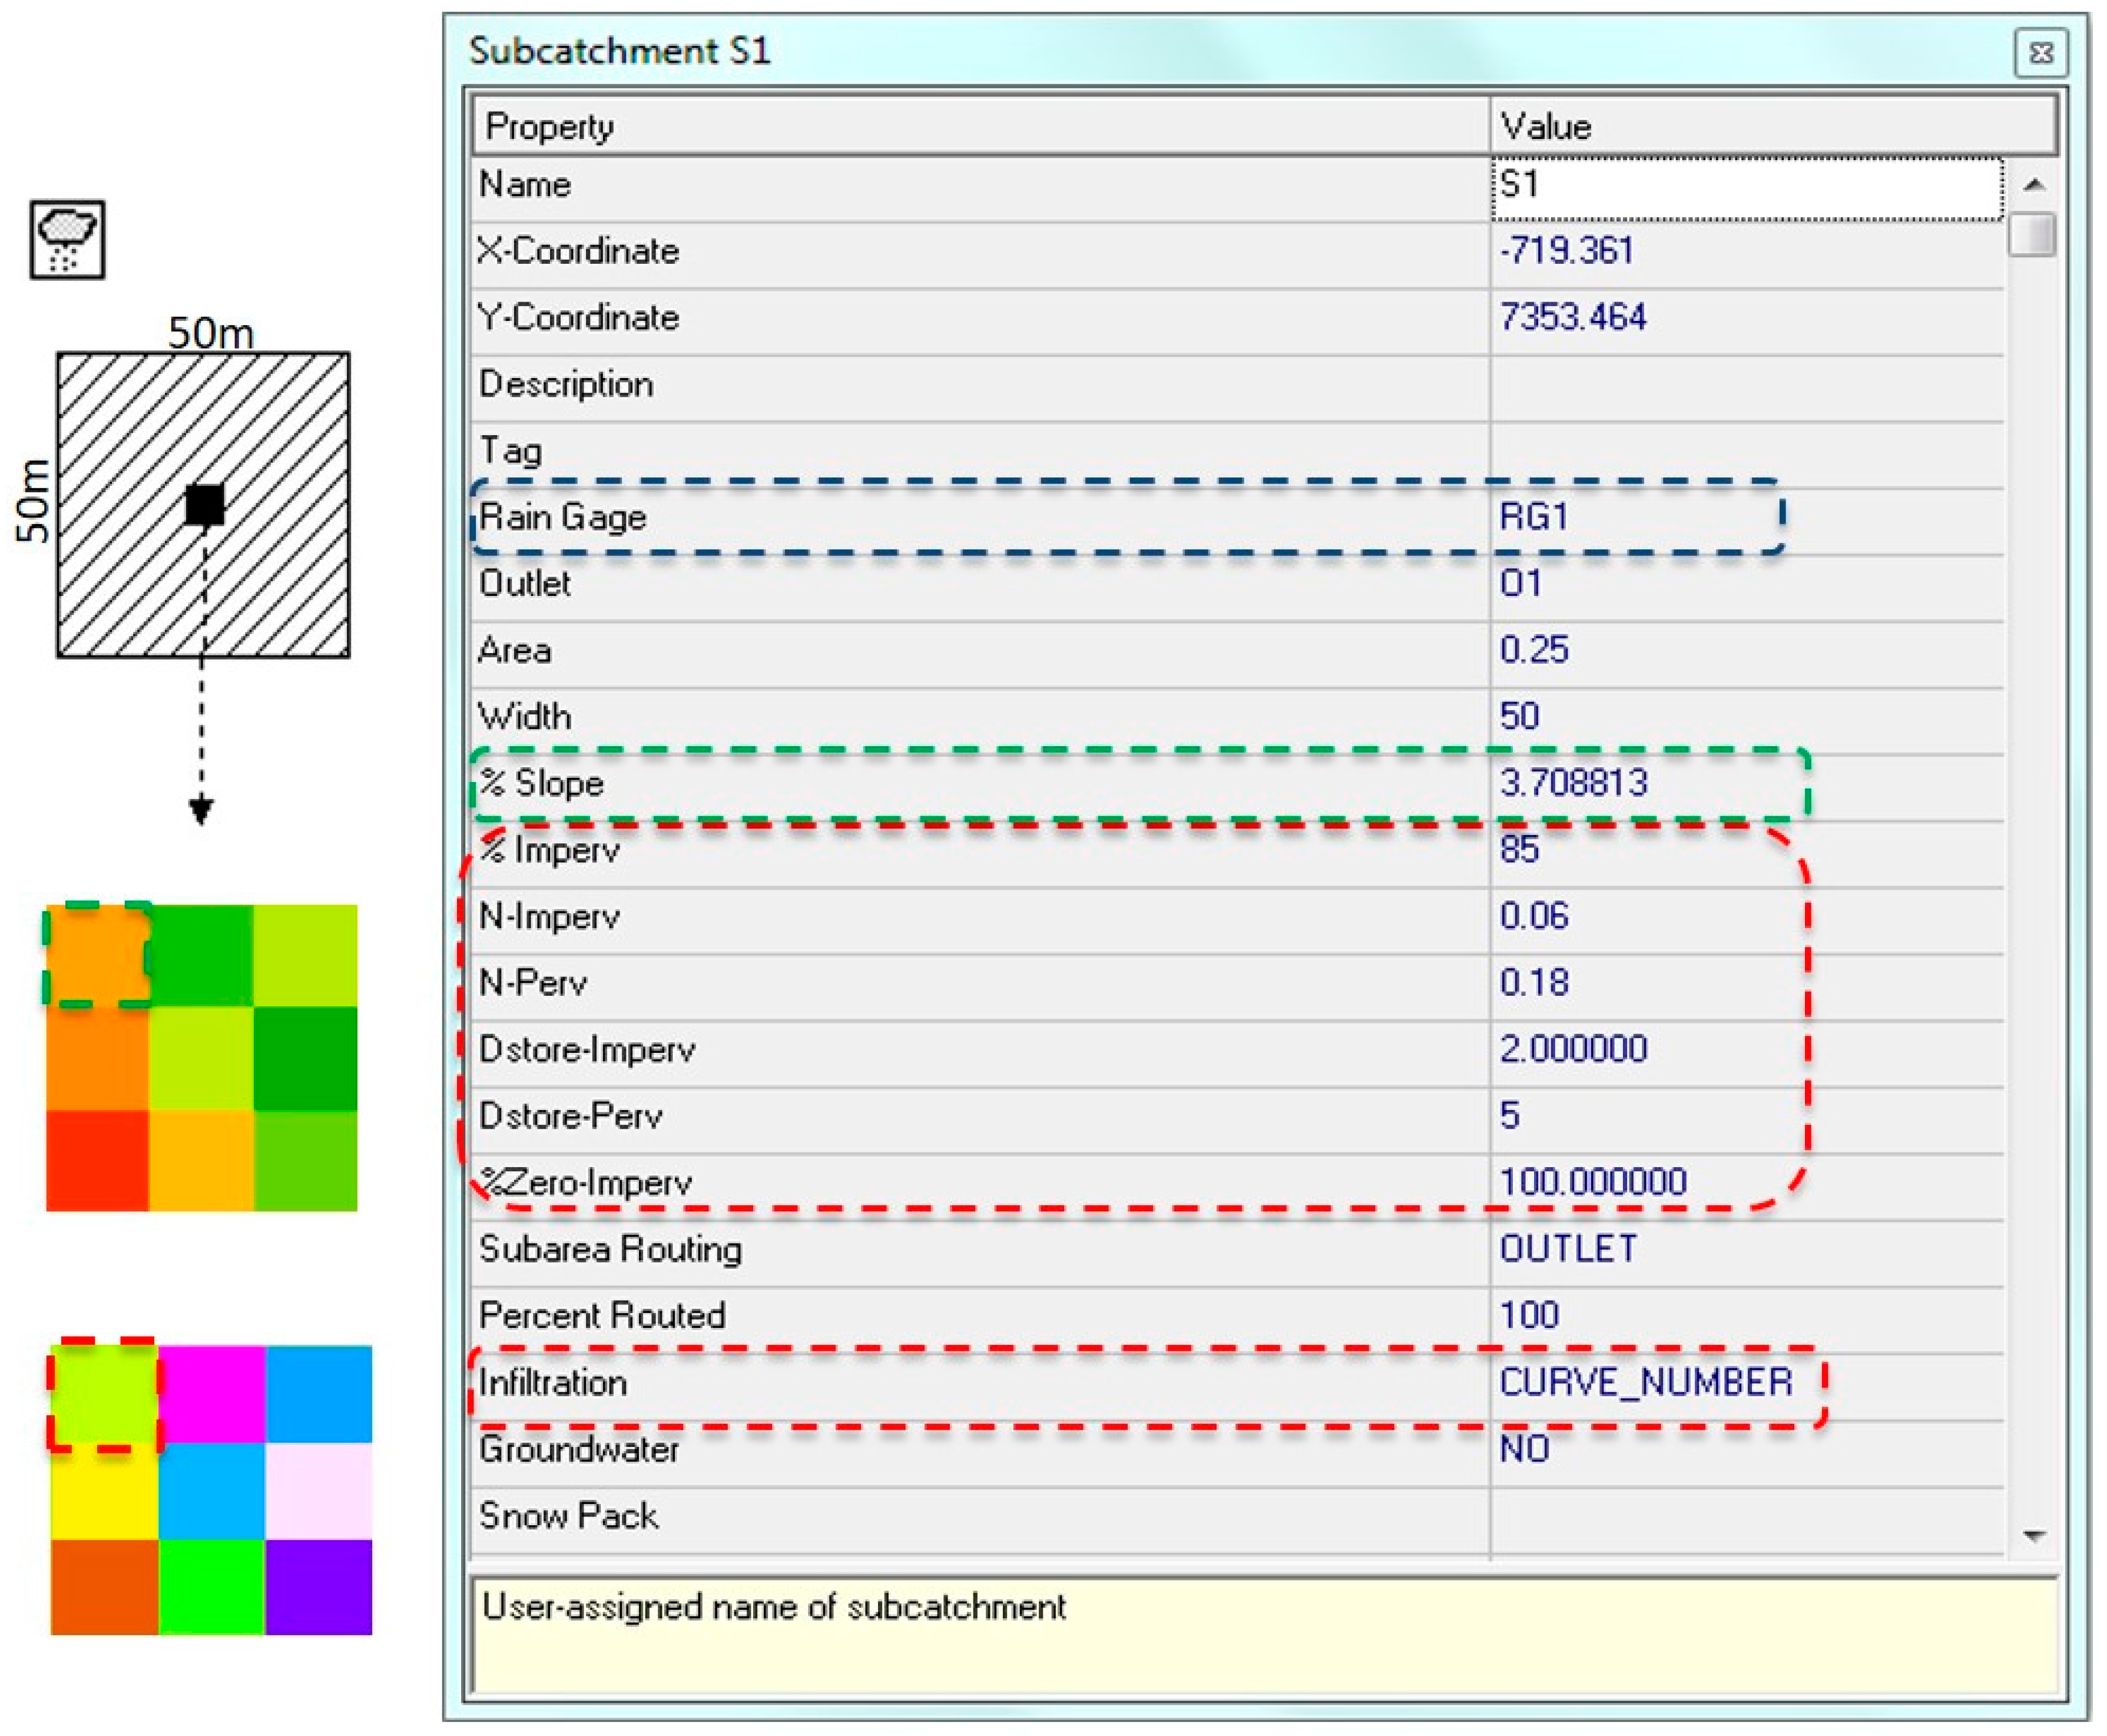
Based on the Singapore’s rainfall intensity-duration-frequency (IDF) curves [17] and Chicago hyetograph method, 10 design rainfall time series (for durations 15, 20, 30, 60, 90, 120, 150, 180, 210, 240 min) of a 10-year return period were obtained. The accuracy of the results can be improved by adopting a shorter rainfall duration such as 2 or 5 min. As Singapore’s COP allowed for a 15 min rainfall duration, the least rainfall duration was fixed at 15 min [8]. The hydrological modelling aspect of this research was carried out using version 5.0 of Storm Water Management Model (SWMM), an open source hydraulic model, developed and freely distributed online, by USEPA [18]. SWMM conceptualizes the subcatchment as a rectangular surface with uniform slope and calculates the flow based on non-linear reservoir routing method, with resistance formulated by manning’s equation [19]. An example of inputs necessary to compute the runoff in a 50 m × 50 m single unit subcatchment on a SWMM interface is shown in Figure 2.The percent slope of a single unit subcatchment (indicated by the green dotted box in Figure 2) was computed from the DEM using ArcGIS 10.1, a commercial GIS software developed and supplied by ESRI, US. Land use parameters of the subcatchment—such as percent imperviousness, Manning’s n of overland flow, depression storage depth and curve number (indicated by the red dotted boxes in Figure 2)—were determined based on the dominating land use of the single unit subcatchment. In addition to using the typical C values suggested by SWMM 5.0, design practices from different countries were also reviewed to identify the most representative C value for each land use parameter in Singapore. The following design practices were reviewed: (i) recommended percentage imperviousness values [13]; (ii) overland texture factor N [14], and; (iii) runoff curve numbers for urban areas [15,16]. With the 10 rainfall time series as upper boundary conditions, each single unit subcatchment produced 10 runoff values. The highest of the 10 runoff values, that is, the peak runoff (m3/s), was selected. The corresponding rainfall intensity at which this peak runoff occurred was termed the peak rainfall intensity (mm/h).
To calculate the peak C value of each single unit subcatchment, the following equations were used.
Every 50 × 50 m grid cell was then simulated for 10-year design rainstorms with varying durations. The maximum C value from these simulations were selected for further processing. In total, 554,441 single unit subcatchment cells are modelled to obtain peak runoff coefficients of the various land uses in entire Singapore’s main island.
2.2. Effectiveness of ABC Features in Reducing C Value
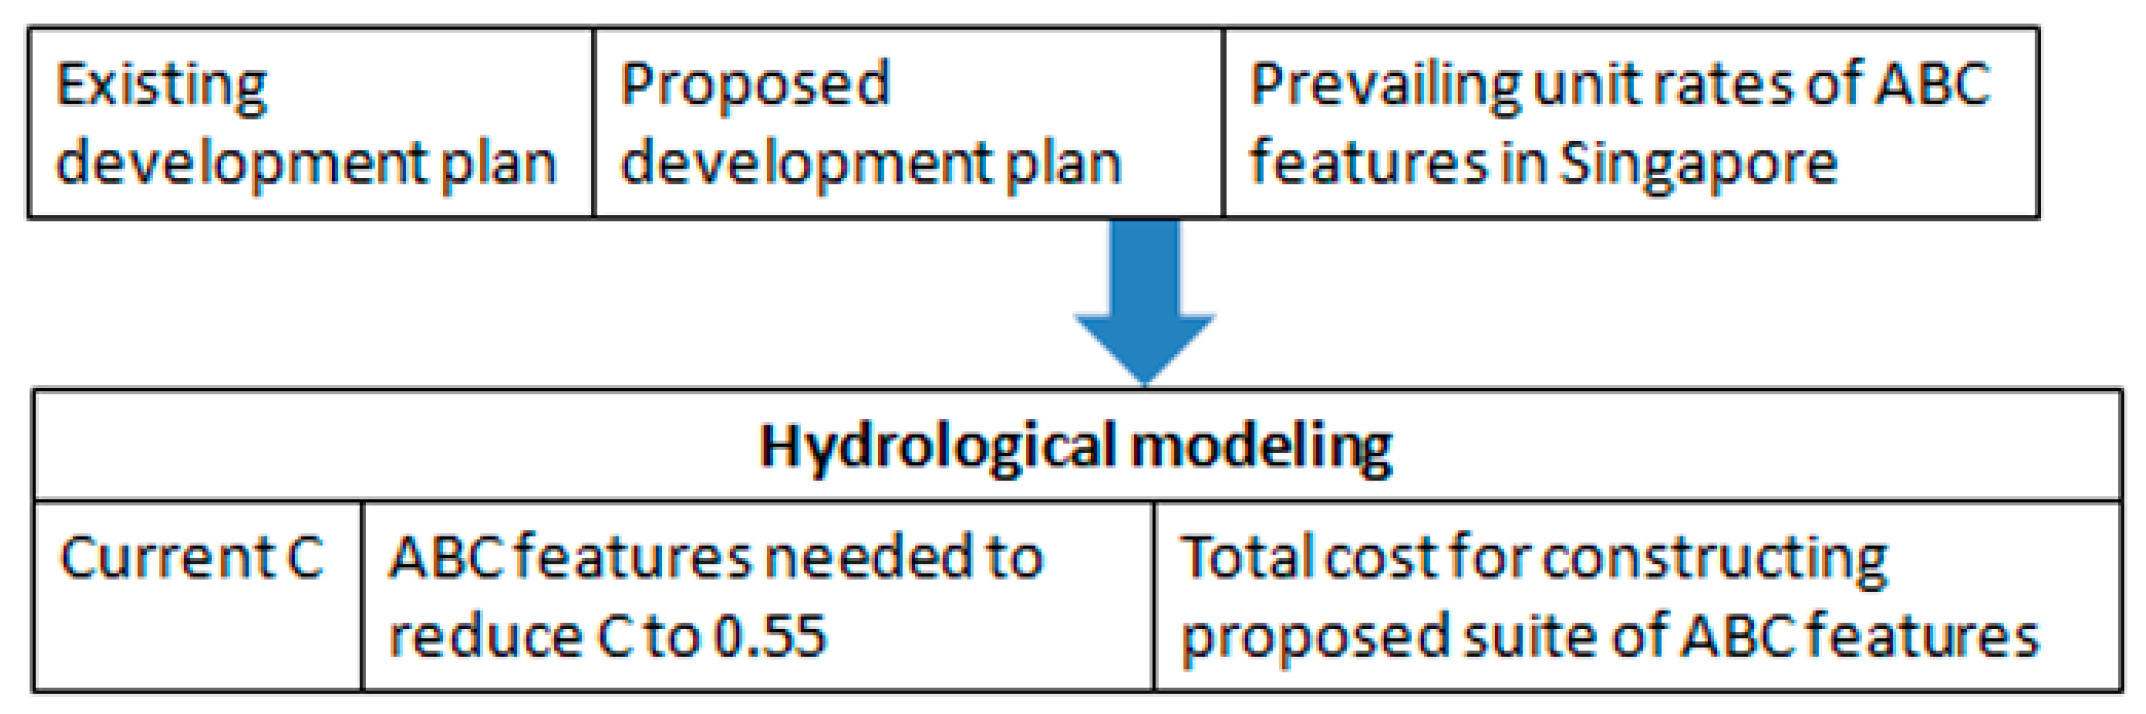
Residential areas form the largest land use in Singapore and the urban town planners’ emphasis for more green spaces housing estates. Hence, residential areas are ideal locations for testing the extensive use of ABC Waters design features as runoff control measures. Two hypothetical study areas, Green Walk District (GWD) in Tampines North New Town and Tengah Subcatchment (TSC) in Tengah New Town, were identified for Stage 2 of the study. Figure 3 summarises the methodology for Stage 2, which aimed at determining the amount of ABC Waters design features needed to reduce C values to the stipulated 0.55.
In Tampines North New Town a ‘leaf concept’ design has been planned, where a comprehensive network of green spaces in the estate are designed using features such as green canyons, elevated roof garden links, extensive landscaped decks and community living rooms [20,21]. However, this, study focussed only on GWD, which is adjacent Sungei Api Api channel (Figure 4).
The second study area identified for application of ABC Waters design features in this research was a 10 ha subcatchment in Tengah New Town (TSC-Tengah Subcatchment), which is currently undeveloped but has the potential to become a high-income residential area. Hence an increase in paved areas is expected in TSC. In addition to the usual civic amenities—such as schools, residential and commercial building—urban farming has been planned in Tengah New Town [22].
In Stage 2 of the study, three ABC Waters design features (green roofs, rain gardens and porous pavements) and detention tanks were used to reduce the C values. Green roof is a low-maintenance vegetated roof system that uses a lightweight plant growing medium with shallow drainage/storage layer to store storm water. The shallow storage layer of the green roof helps in reducing and delaying the peak storm water runoff as compared to conventional rooftops. Rain garden is a vegetated land depression designed to detain and treat storm water runoff. Typically, subsoil pipes are installed in the drainage layer to discharge the filtered water to a nearby drain, thus reducing flow velocities and increasing the catchment’s time of concentration. Due to similar design features such as storage layer and overflow drains, green infrastructure and green roofs were modelled as shallow bio retention cells in SWMM. Porous pavement allows storm water to pass through the voids of the paved surfaces and infiltrate into the subbase. The infiltrated water can be drained via full exfiltration, partial exfiltration or tanked systems. This helps to increase infiltration and reduce peak discharge into the public drainage system. Detention tanks are structural measures that temporarily store surface overflow during a heavy rainfall event and discharge the runoff via pumping after the rain event.
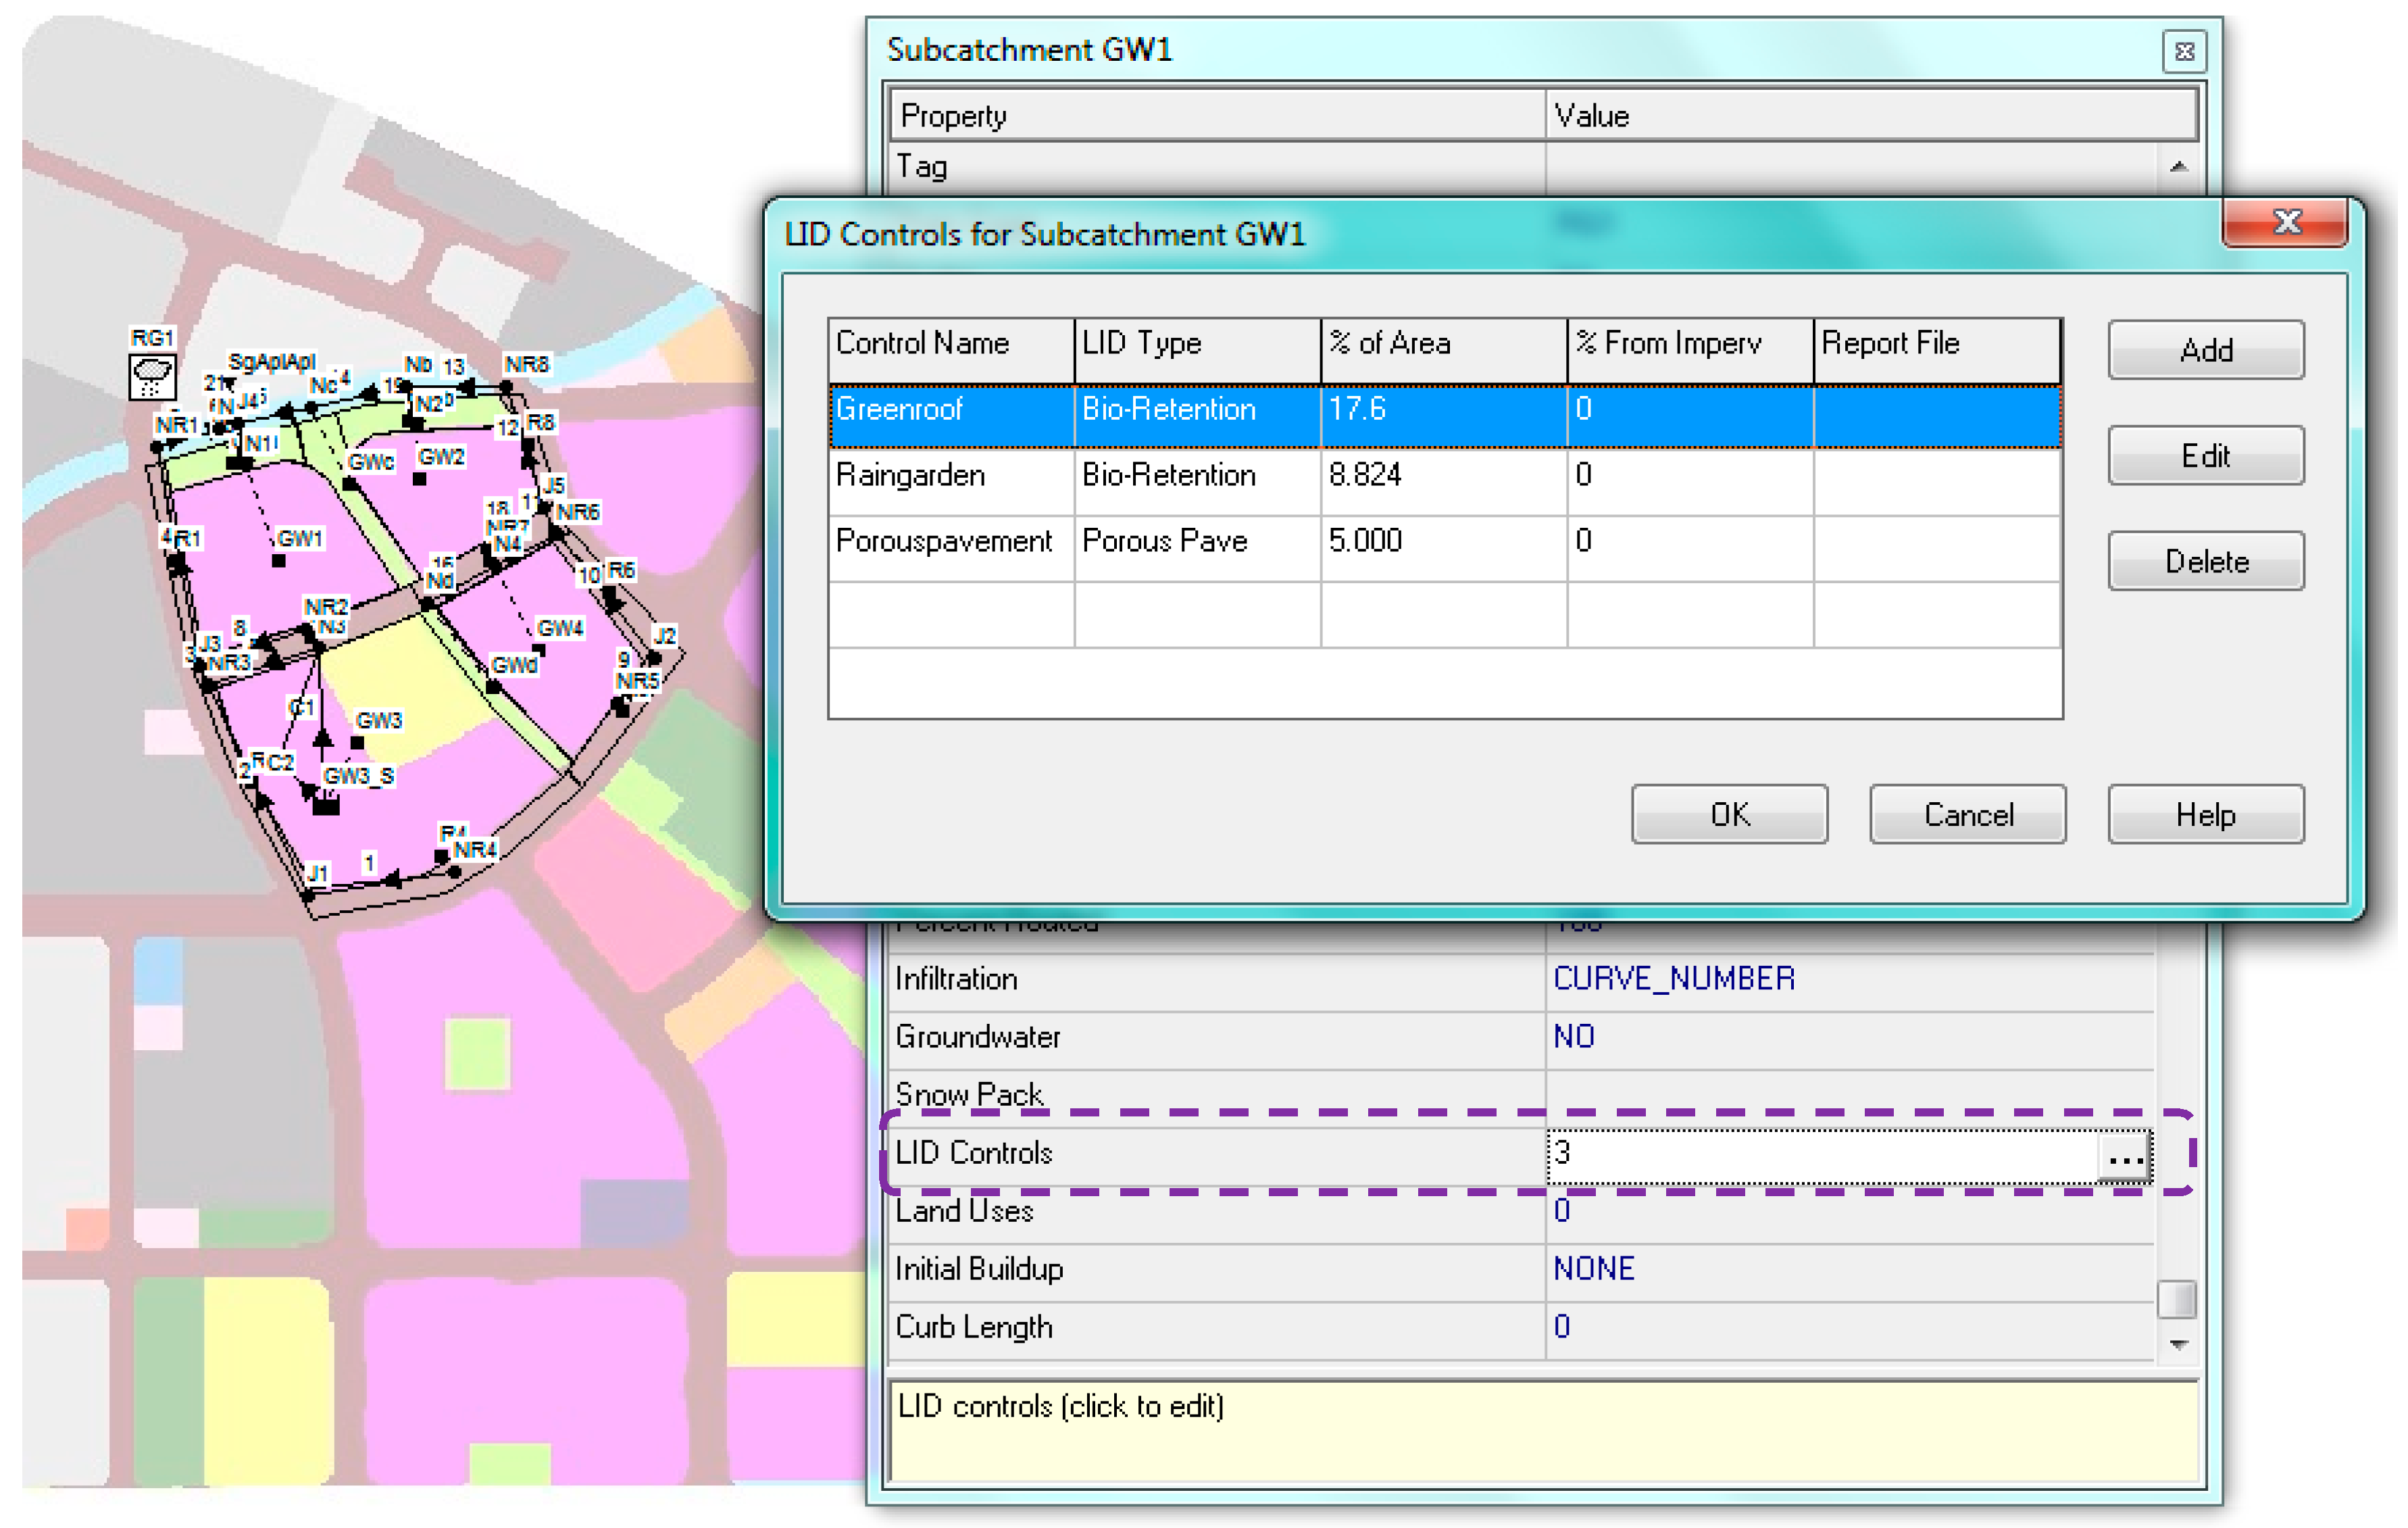
As the focus of this research was on overland runoff from subcatchments (including roads), the first priority of the conveyance system in the model was to drain the overland flow from the subcatchment through an outfall using open concrete channels. Actual site constraints were not considered when sizing the channels. ABC Waters design features were modelled using the low impact development (LID) controls module in SWMM (Figure 5). The ABC Waters design features were added into the model in the following sequence: green roofs, rain gardens, porous pavements and, lastly, detention tanks until each subcatchment’s C value was reduced to 0.55 or lower. Detention tanks were the last to be added as the preference was to have more green features as there is a preference for green space compared to hard concrete structures. The coverage of each feature was maximised based on the permissible site condition and this varied by subcatchment. Additional details about the representation of ABC Waters design features as LID modules in SWMM is presented in Figure A1, Figure A2 and Figure A3 in Appendix A. The simulations were run for a 240 min duration rainfall with a peak intensity of 108.7 mm/h. This storm event was assumed as the worst-case scenario, where the prolonged rain would have saturated the soil, hence generating the maximum overland runoff.
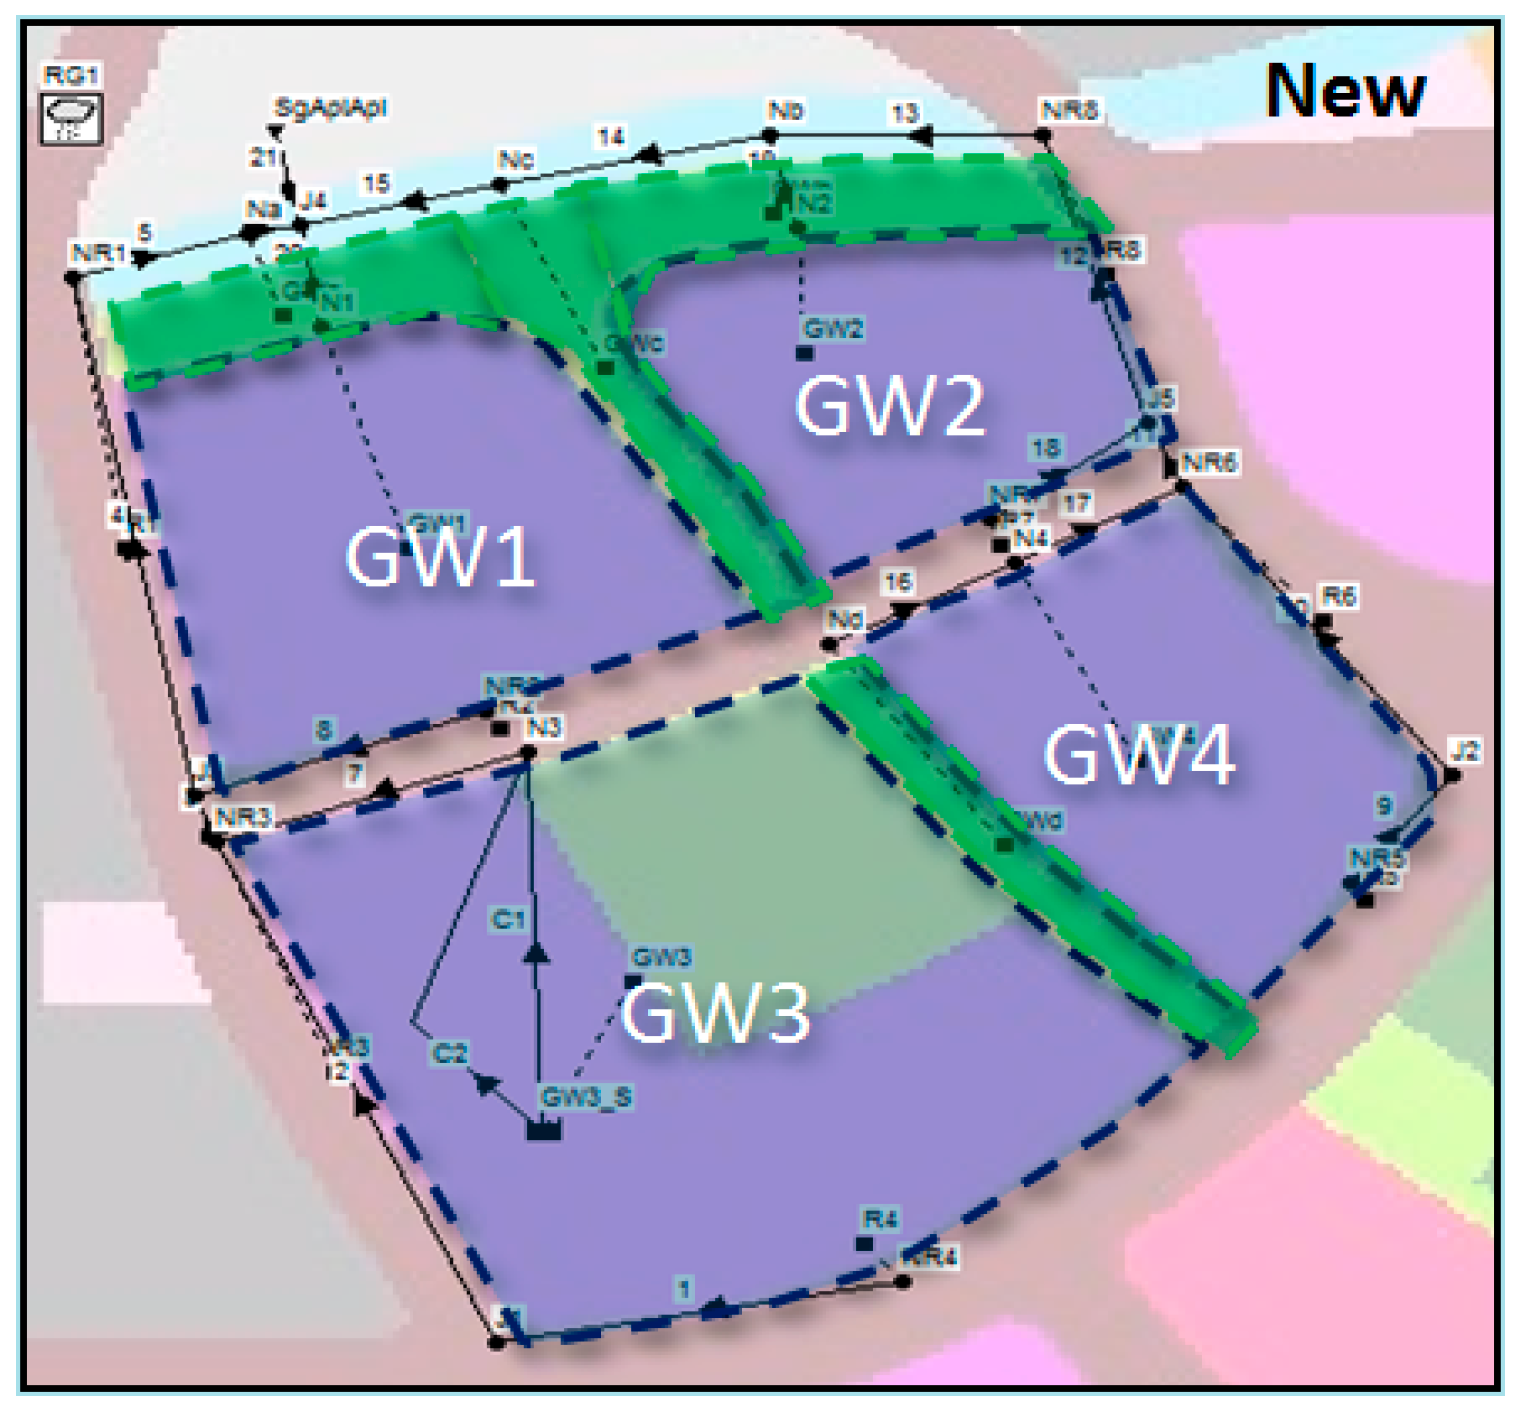
Assuming that GWD would be a traditional urban development, that has a lesser green area, an average peak C value of 0.78 was assumed to establish a baseline for comparison. Based on the leaf concept design (Figure 6), green roofs were included at all residential blocks and in low-storey car parks. Also the green canyons, elevated roof garden links and extensive landscape decks suggested in leaf concept were represented as rain gardens in the SWMM model of GWD catchment. New parks (green patches in Figure 6) separate the subcatchments in GWD catchment. Walkways between blocks, playground turf and open parts of the communal areas are designed as porous pavements to enhance runoff control. Also the presence of an educational institution in subcatchment GW3 made it an ideal location for an underground storage tank to be built beneath the school field.
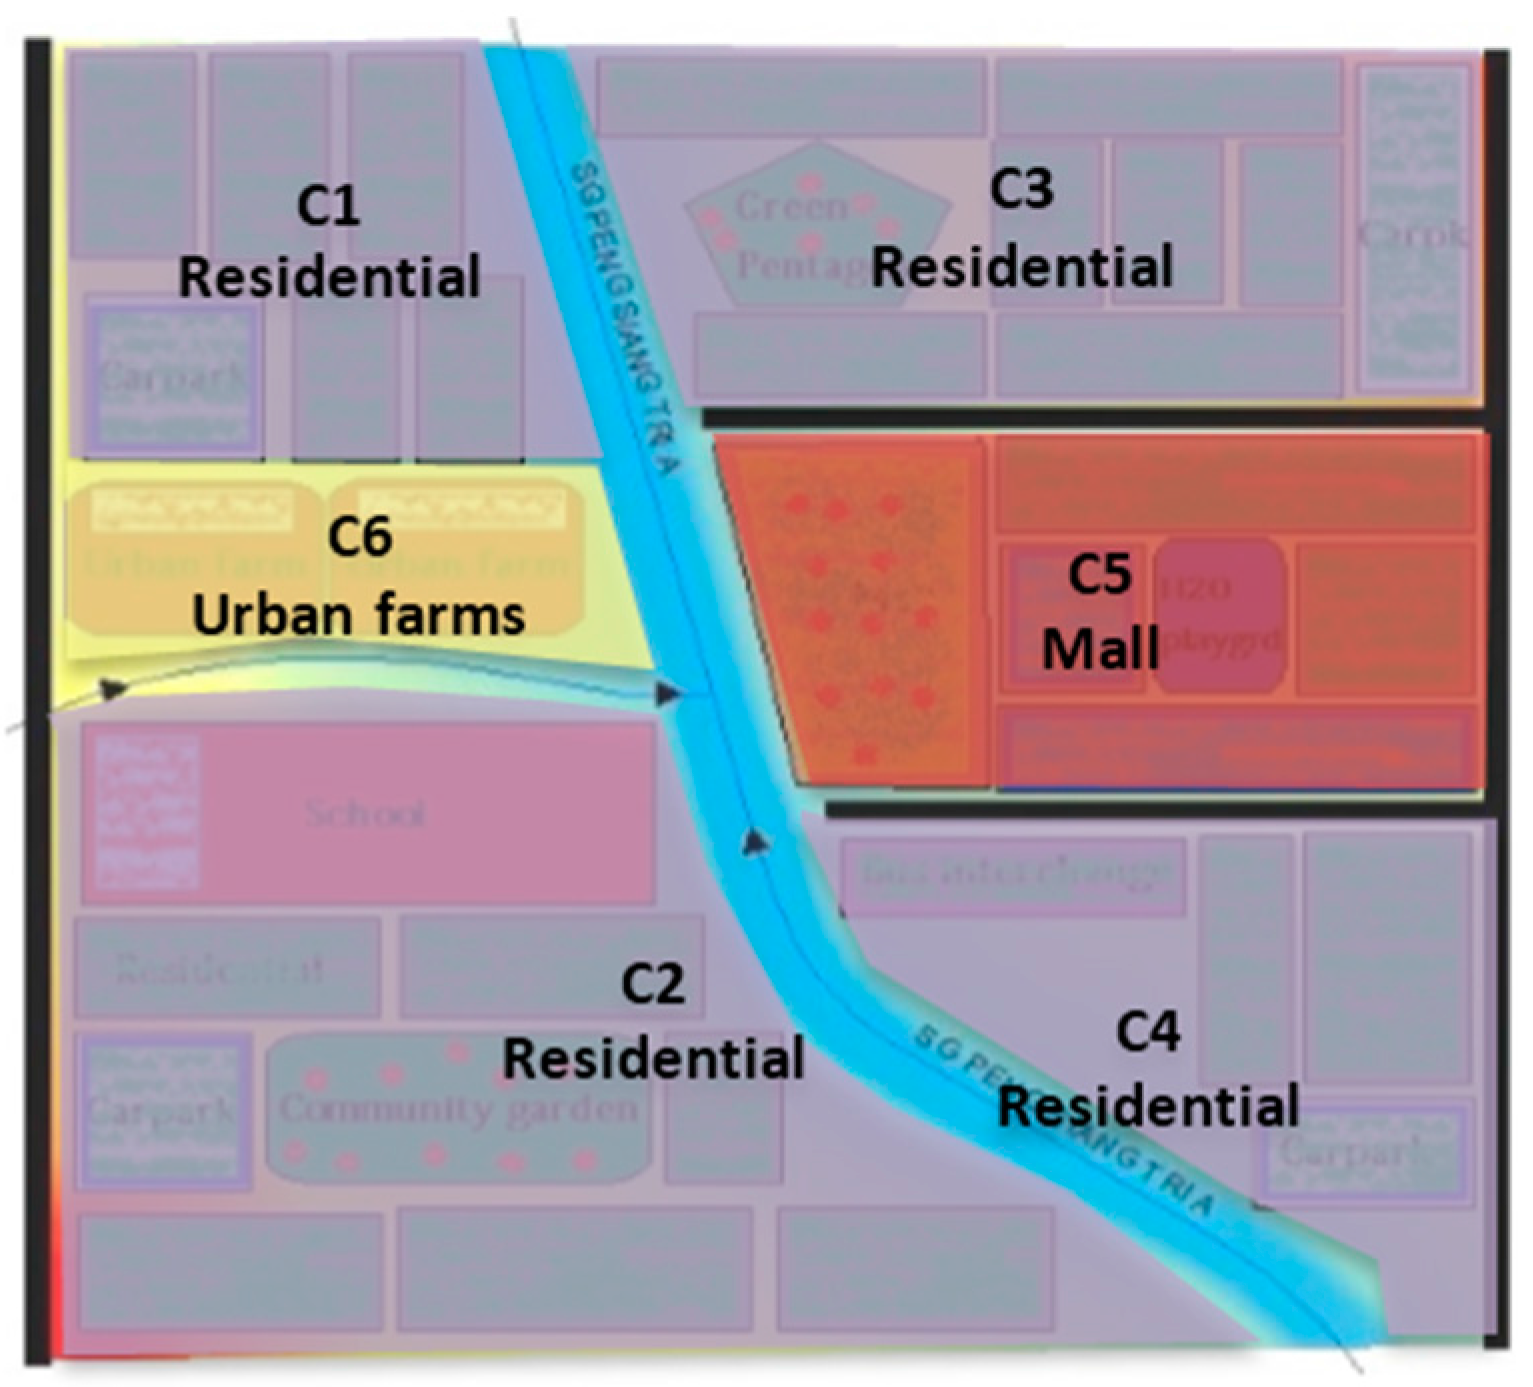
Based on traditional urban development scenario, which is heavily paved, the average peak C value of TSC, the study area, was fixed at 0.9. The planned shopping mall in TSC provided opportunity for including rain gardens as well as a shallow water roof in the design. The water roof, in addition to marginal runoff detention, is expected to improve the aesthetics and cool the building. Decentralised detention tanks are proposed beneath the low-storey car parks and the mall. The 23 m trapezoidal concrete channel known as Sungei Peng Siang, which runs through TSC, was modelled as a naturalised channel similar to Singapore’s Kallang River at Bishan-Ang Mo Kio Park ABC Waters project. Similar to GWD, the ABC Waters design features—comprising green roofs, green canyons, elevated roof garden links and extensive landscape decks—are represented in the form of raingardens in SWMM and the porous pavements were implemented in TSC (Figure 7). Also, a community garden and an open community space (represented as rain gardens in SWMM) were included.
TSC was modelled as six smaller subcatchments (C1 to C6) in SWMM as shown in Figure 8. Based on the leaf concept design, a total of 3.9 ha of ABC Waters design features were incorporated, which constituted to about 39% increase in ABC Waters design features.
3. Results
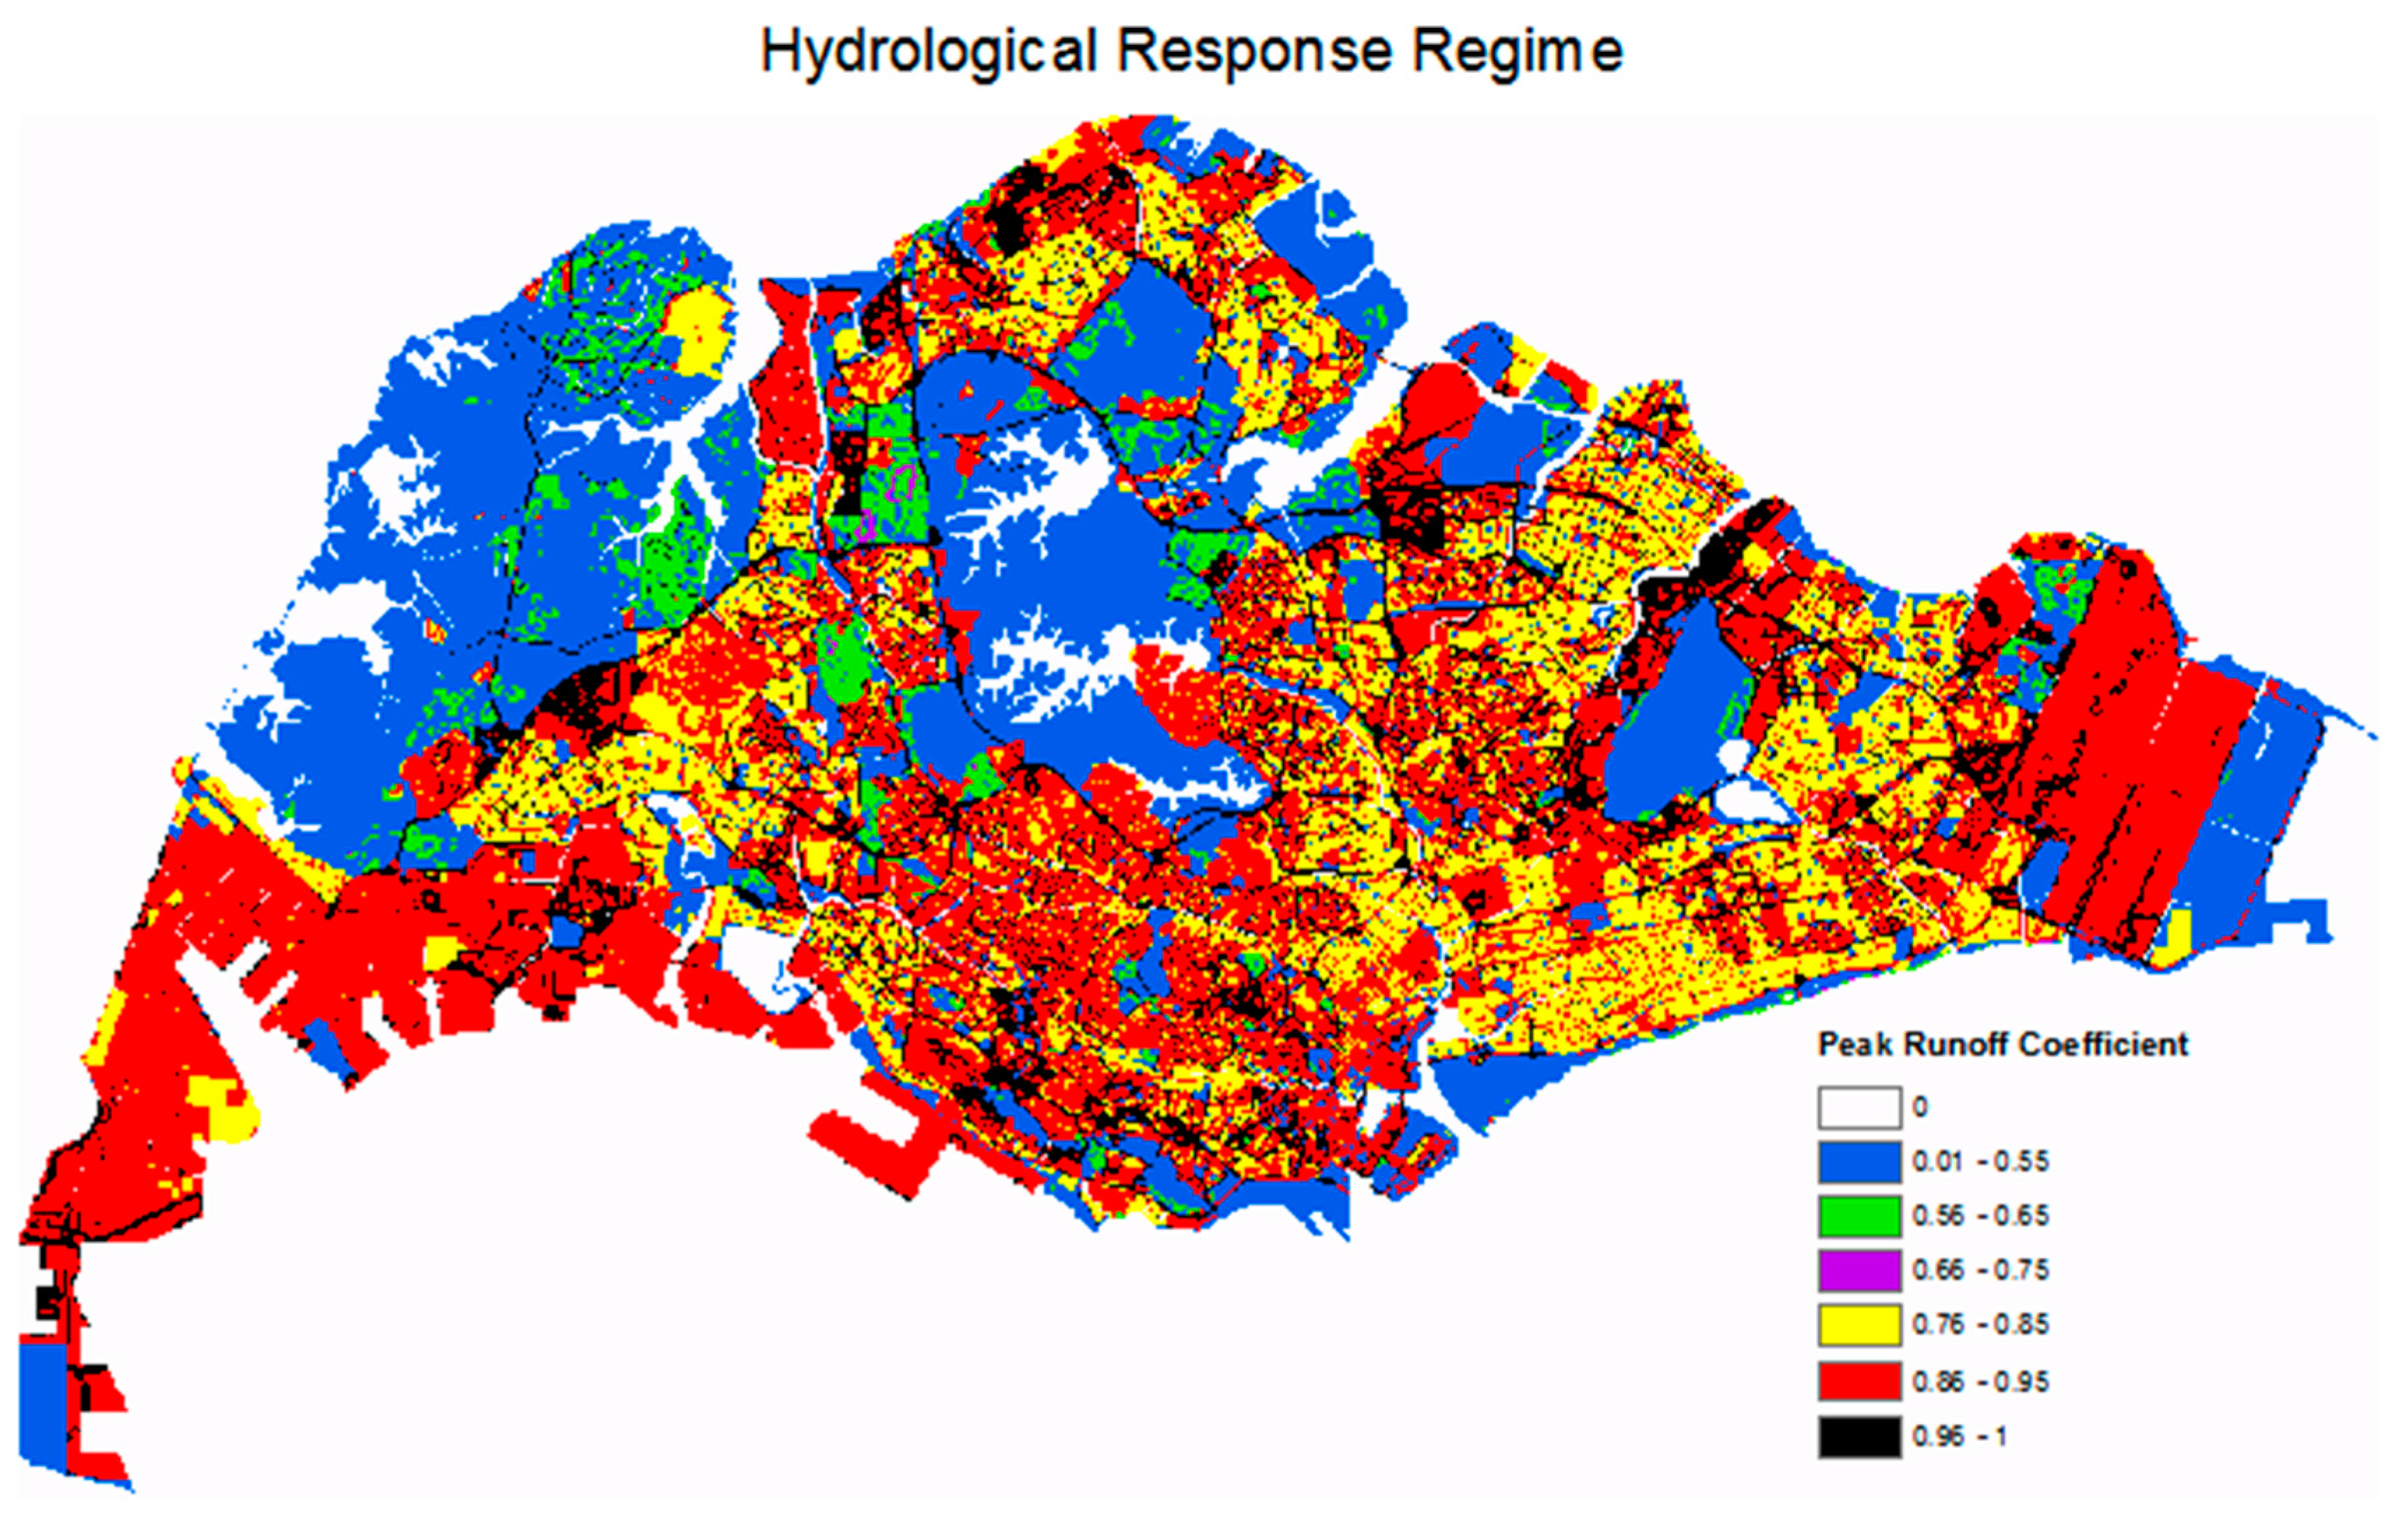
The hydrological response regime map (Figure 9) based on the peak C value of each cell modelled shows that the 70% of Singapore’s land surface has C value above 0.55. The areas with zero C values in Figure 9 are the water bodies such as reservoirs and sea.
Through the simulations, it was noted that C values were affected not just by land use, but also had an intuitive relationship with the slope of terrain. While steeper terrains generated more runoff, gentler terrains allowed for more infiltration which resulted in lower runoff coefficient [23]. To gauge the impact of slopes on C values, sensitivity analyses were carried out for every land use type across a range of slopes from 0 to 100%. Though rare, steeps slopes of 100% exist in Singapore’s urbanised catchments, as there are hilly nature reserves within the city. Figure 10 showed the C value vs. slope percent plots for different land uses.
The plots in Figure 10 depict the magnitude of variation in C values for the same land use with different slopes. It can be observed that steeper the slope higher the C value. It can also be observed that for all land uses, C value is more sensitive to slope changes at gentler terrain but with increasing steepness, the sensitivity is reduced. This shows that the slope in a catchment need to be considered when determining the C value for drainage design. The C values obtained from the hydrological modelling in this research are presented in Table 2. Compared to the C values indicated in PUB’s existing COP [8], the C values presented in Table 2 are true representation of ground reality as it is based on both land use and slope. Hence the computation of discharge (Q) with these C values using Rational Formula will be more accurate than using the C values in Singapore’s code of practice.
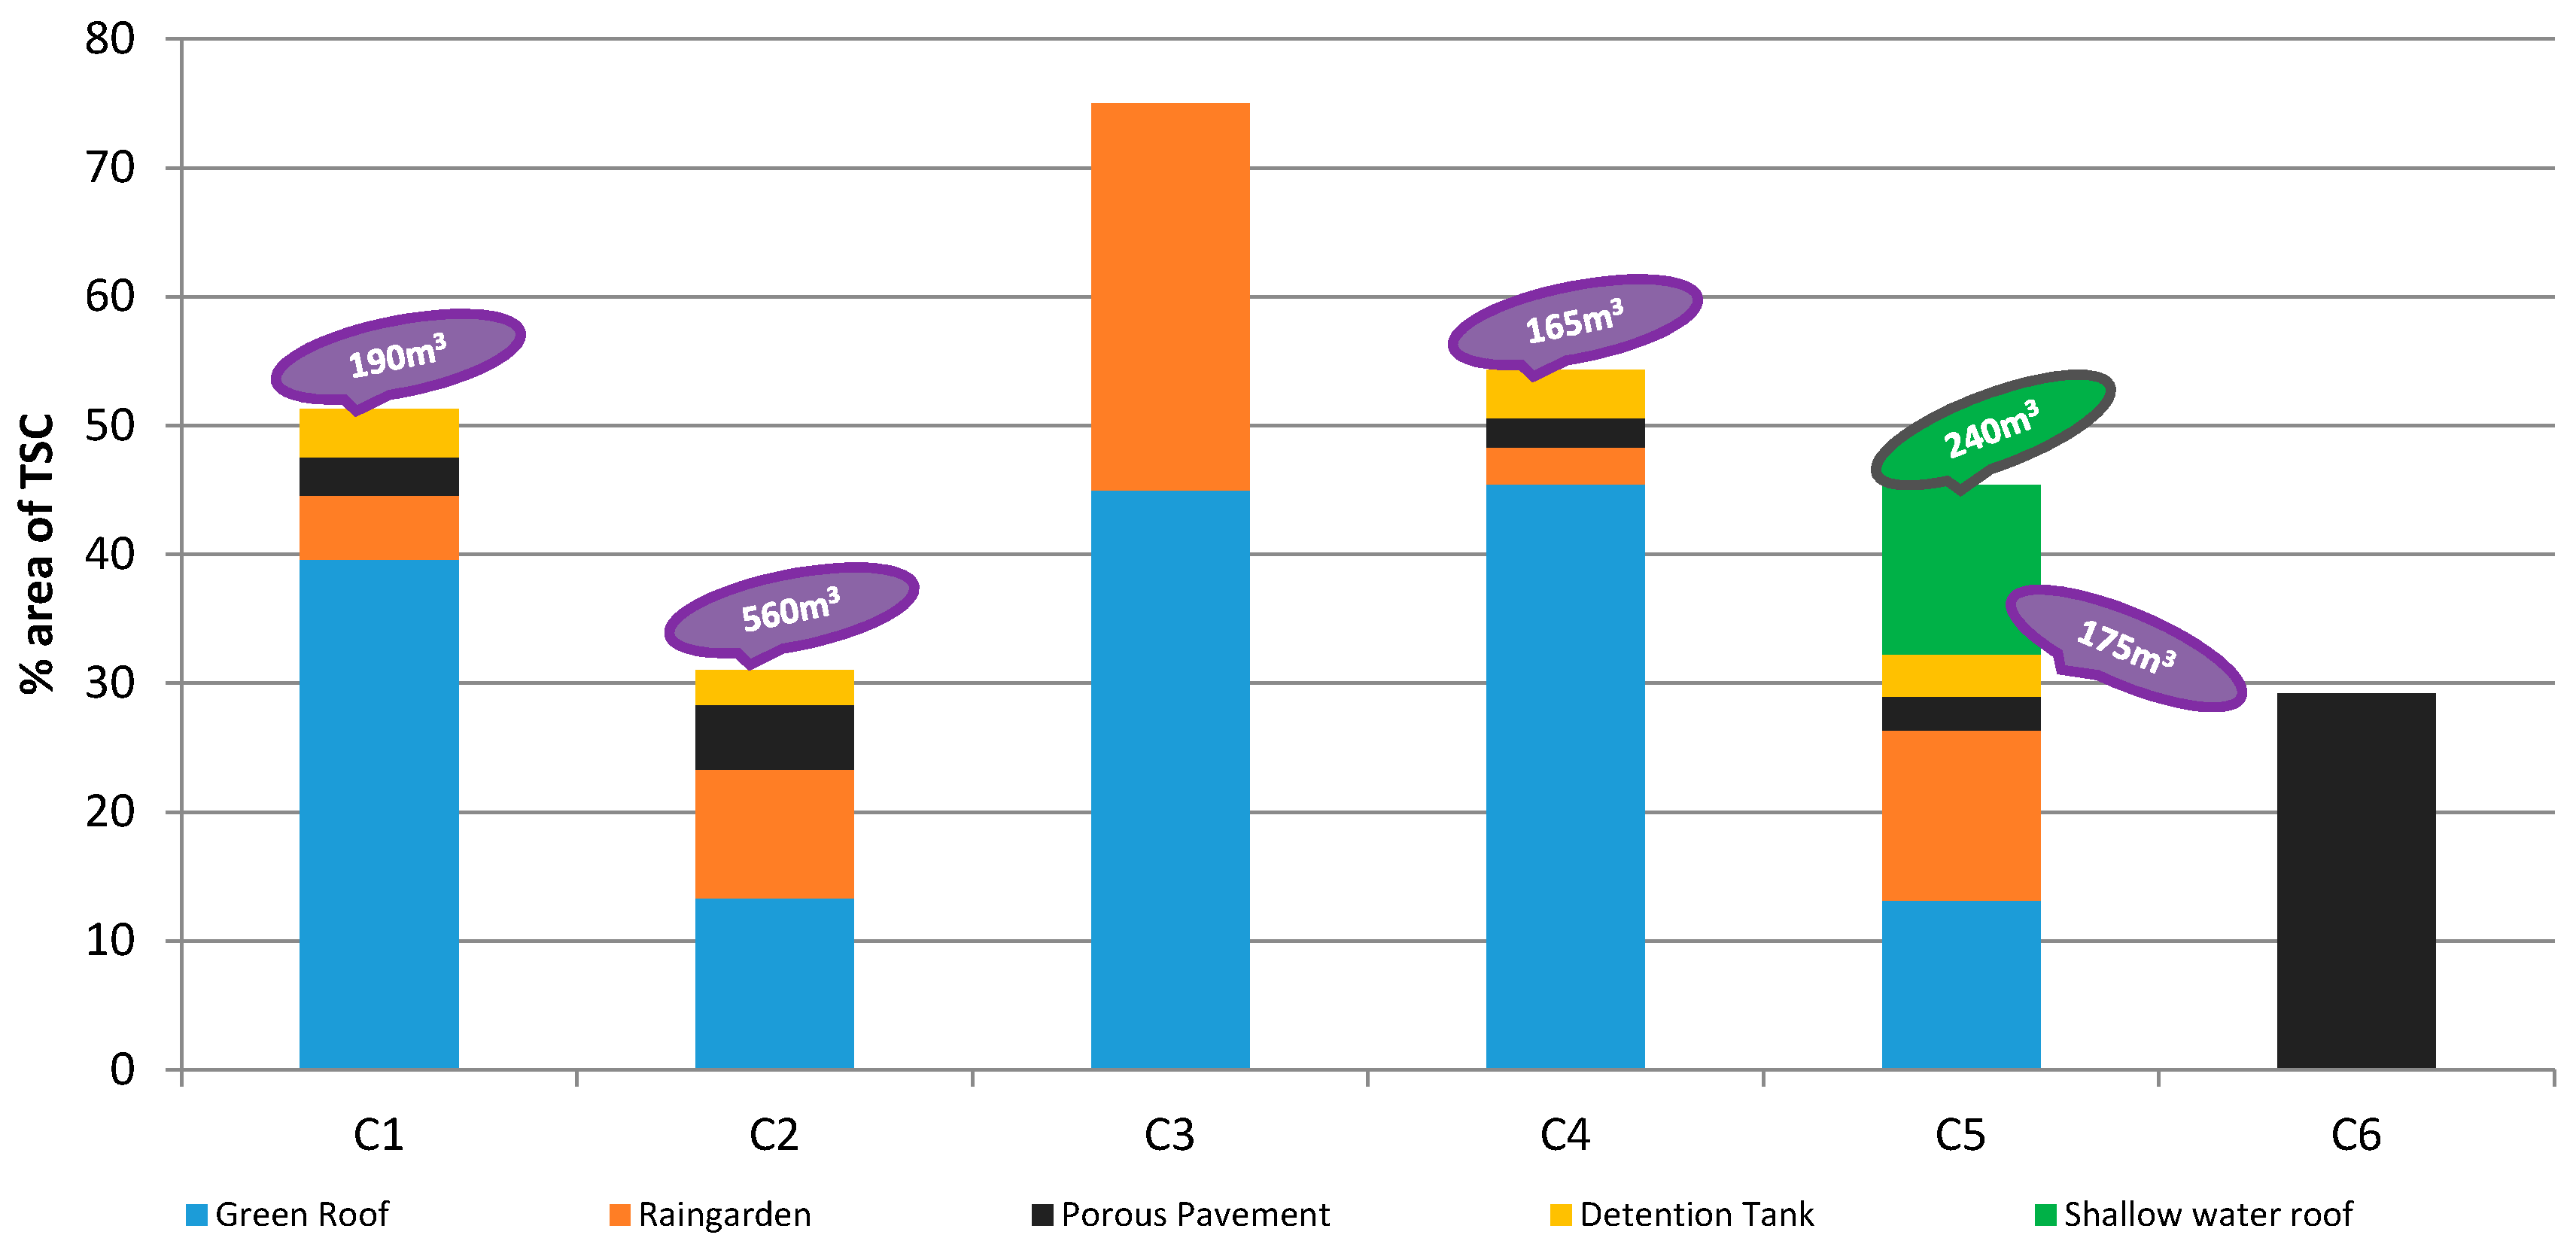
The area-wise implementation of ABC Waters design features and detention facilities in GWD and TSC are summarised in Figure 11 and Figure 12, respectively. In GWD, 5.7 ha (i.e., 26% of GWD’s total area) of ABC Waters design features and a 1200 m3 detention tank reduced the C value from 0.78 to below 0.55. In TSC, 3.9 ha (i.e., 39% of TSC’s total area) of ABC Waters design features and a 1330 m3 detention facility reduced the C values from 0.9 to below 0.55.
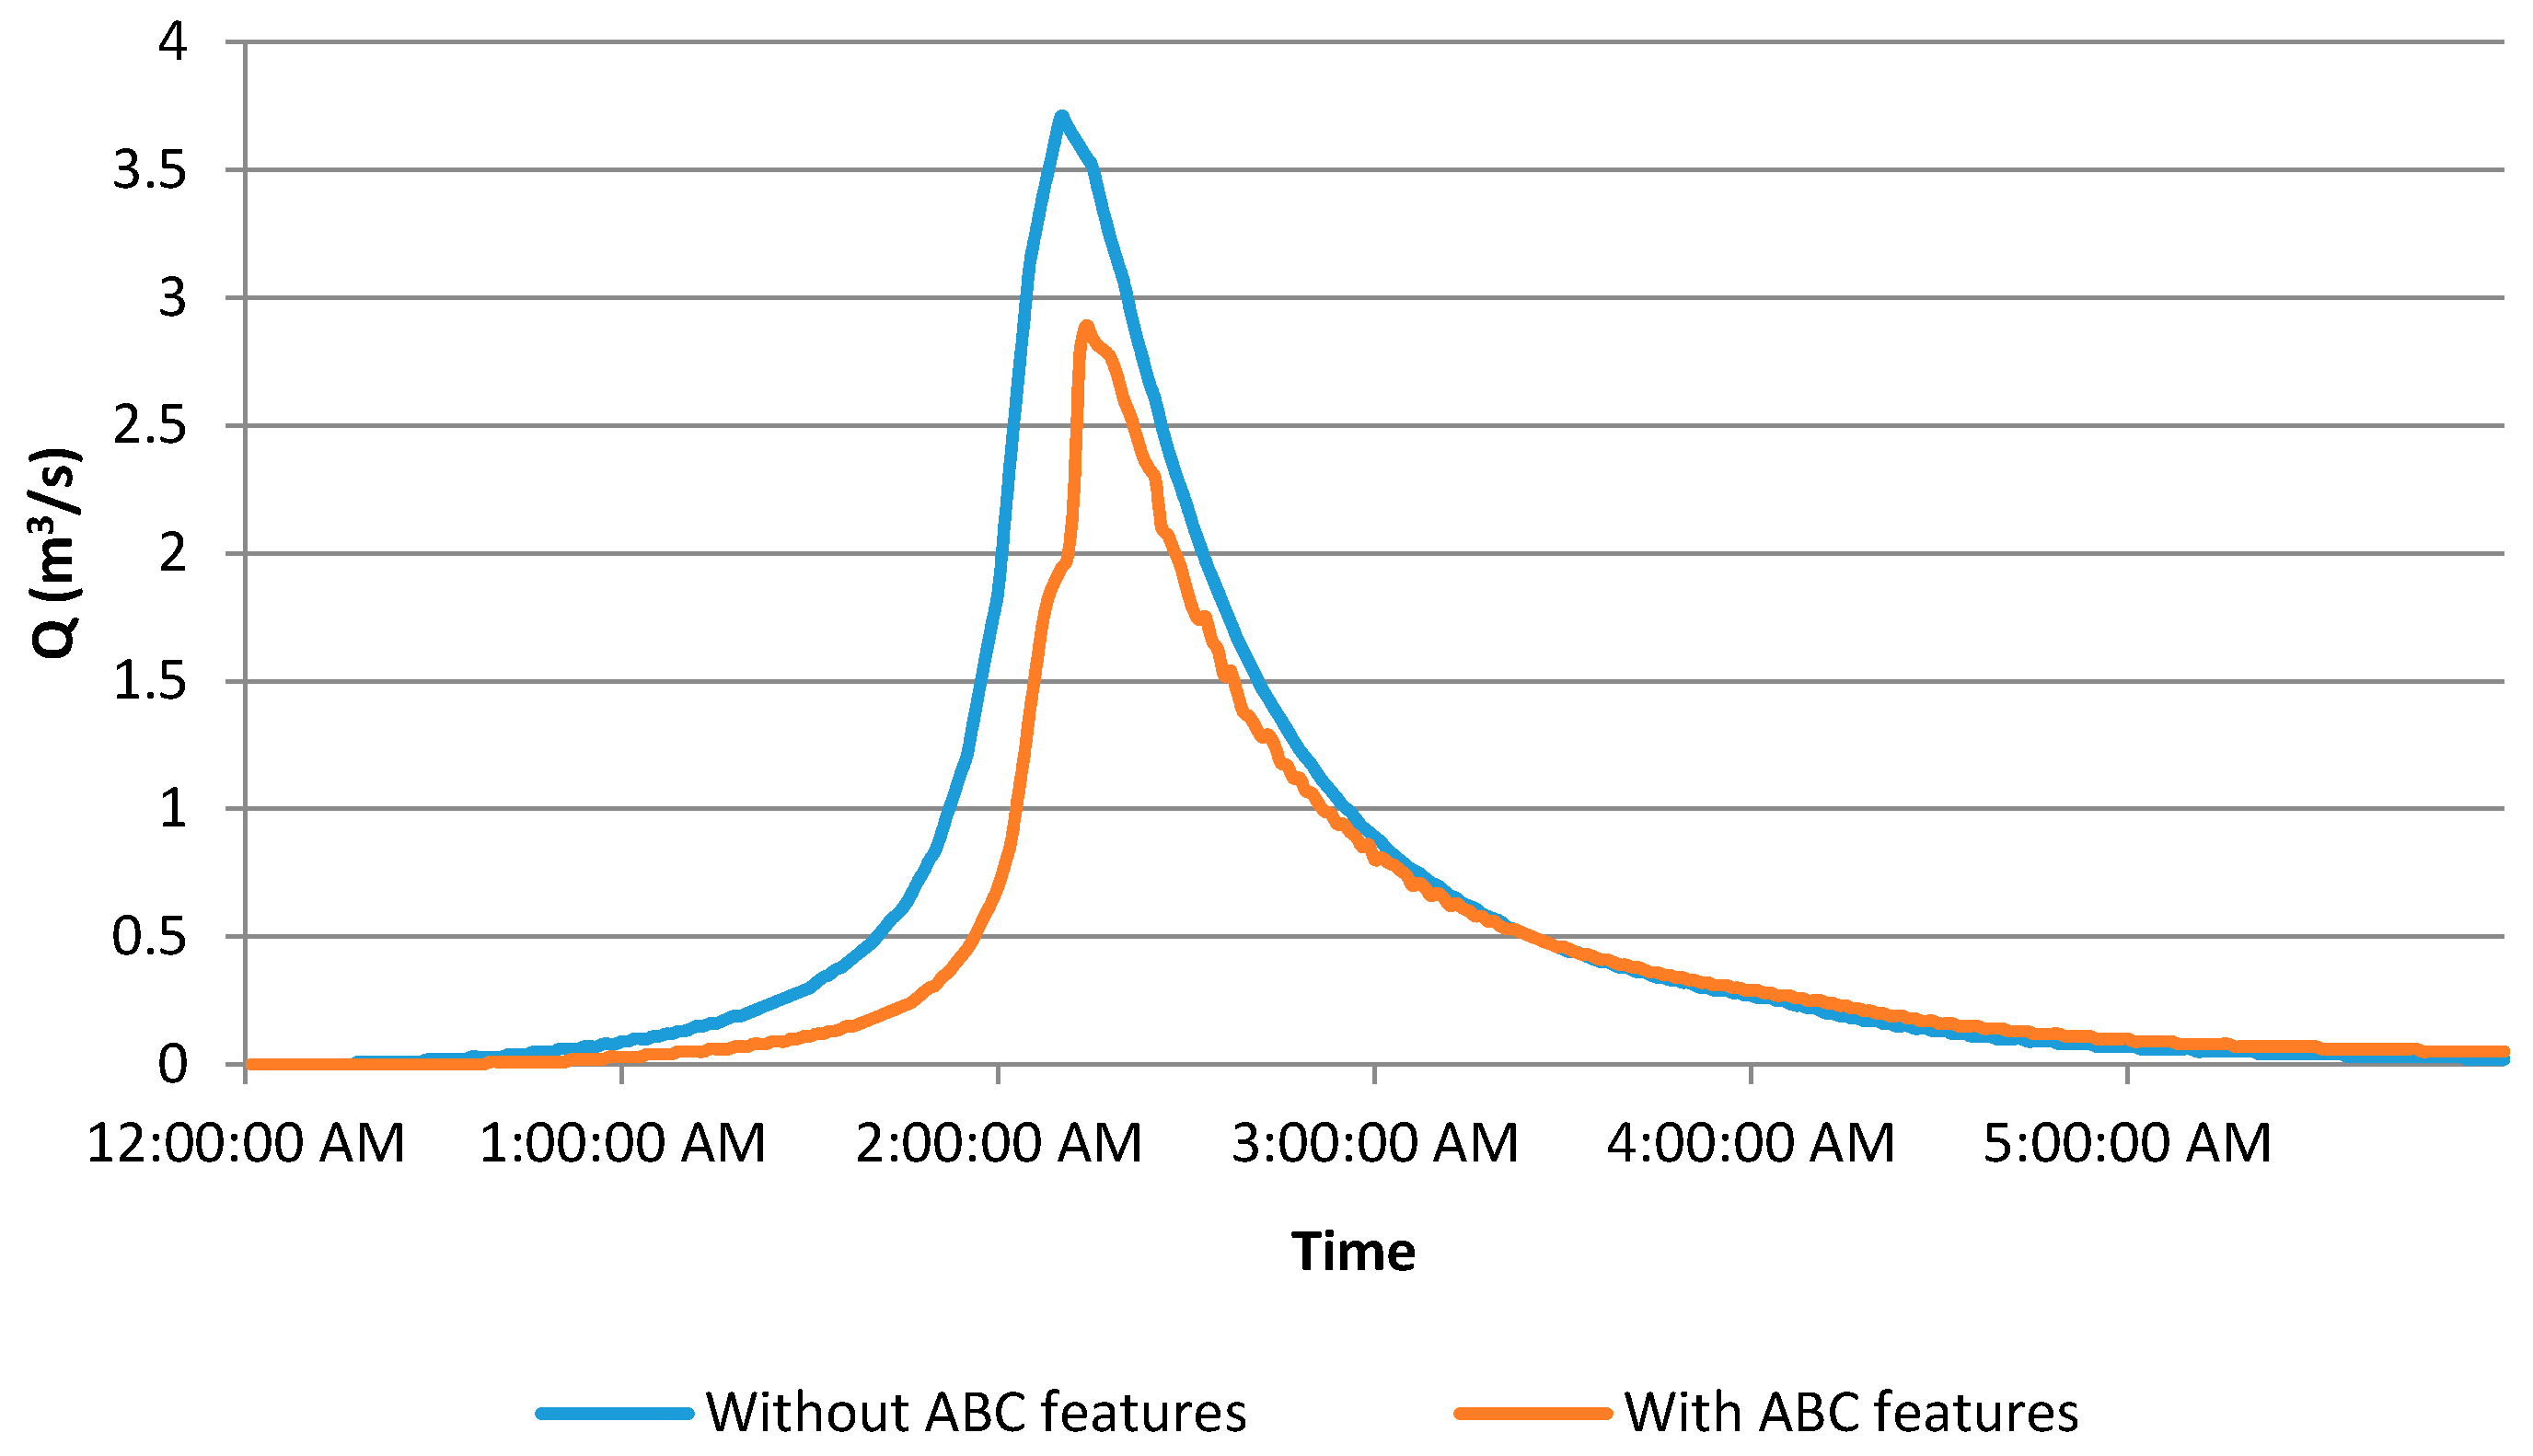
In addition to reduction in C values, the incorporation of ABC Waters design features and detention facilities in GWD also caused four minutes of delay in peak discharge occurrence and a reduction of peak discharge (22% reduction) in Sungei Api Api (Figure 13). For TSC, there was a significant reduction in peak discharge (63% reduction) at Sungei Peng Siang, and about 30 min delay in the occurrence of the peak discharge as shown in Figure 14.
A sensitivity analysis conducted using the simulation results from TSC gives an indication on the effectiveness of individual ABC Waters design (and detention) feature in reducing C values. Three set of values were extracted from the simulation results of TSC: (i) the reduction in C values by each ABC Waters design feature; (ii) the area occupied by each ABC Waters design feature, and; (iii) the volume of the detention facility included. The reduction in C values reduced per m2 of ABC Waters design feature and reduction per m3 of detention facility is presented in Table 3. In the TSC catchment, 45% of the total area of the catchments is assumed to be covered by a green roof, an ambitious aim which is yet be achieved in Singapore. However, with the ongoing efforts of the Housing and Development Board (HDB) to intensify greening in Singapore’s residential estates, there is a possibility for such an extensive green roof coverage in residential land use [24,25,26,27].
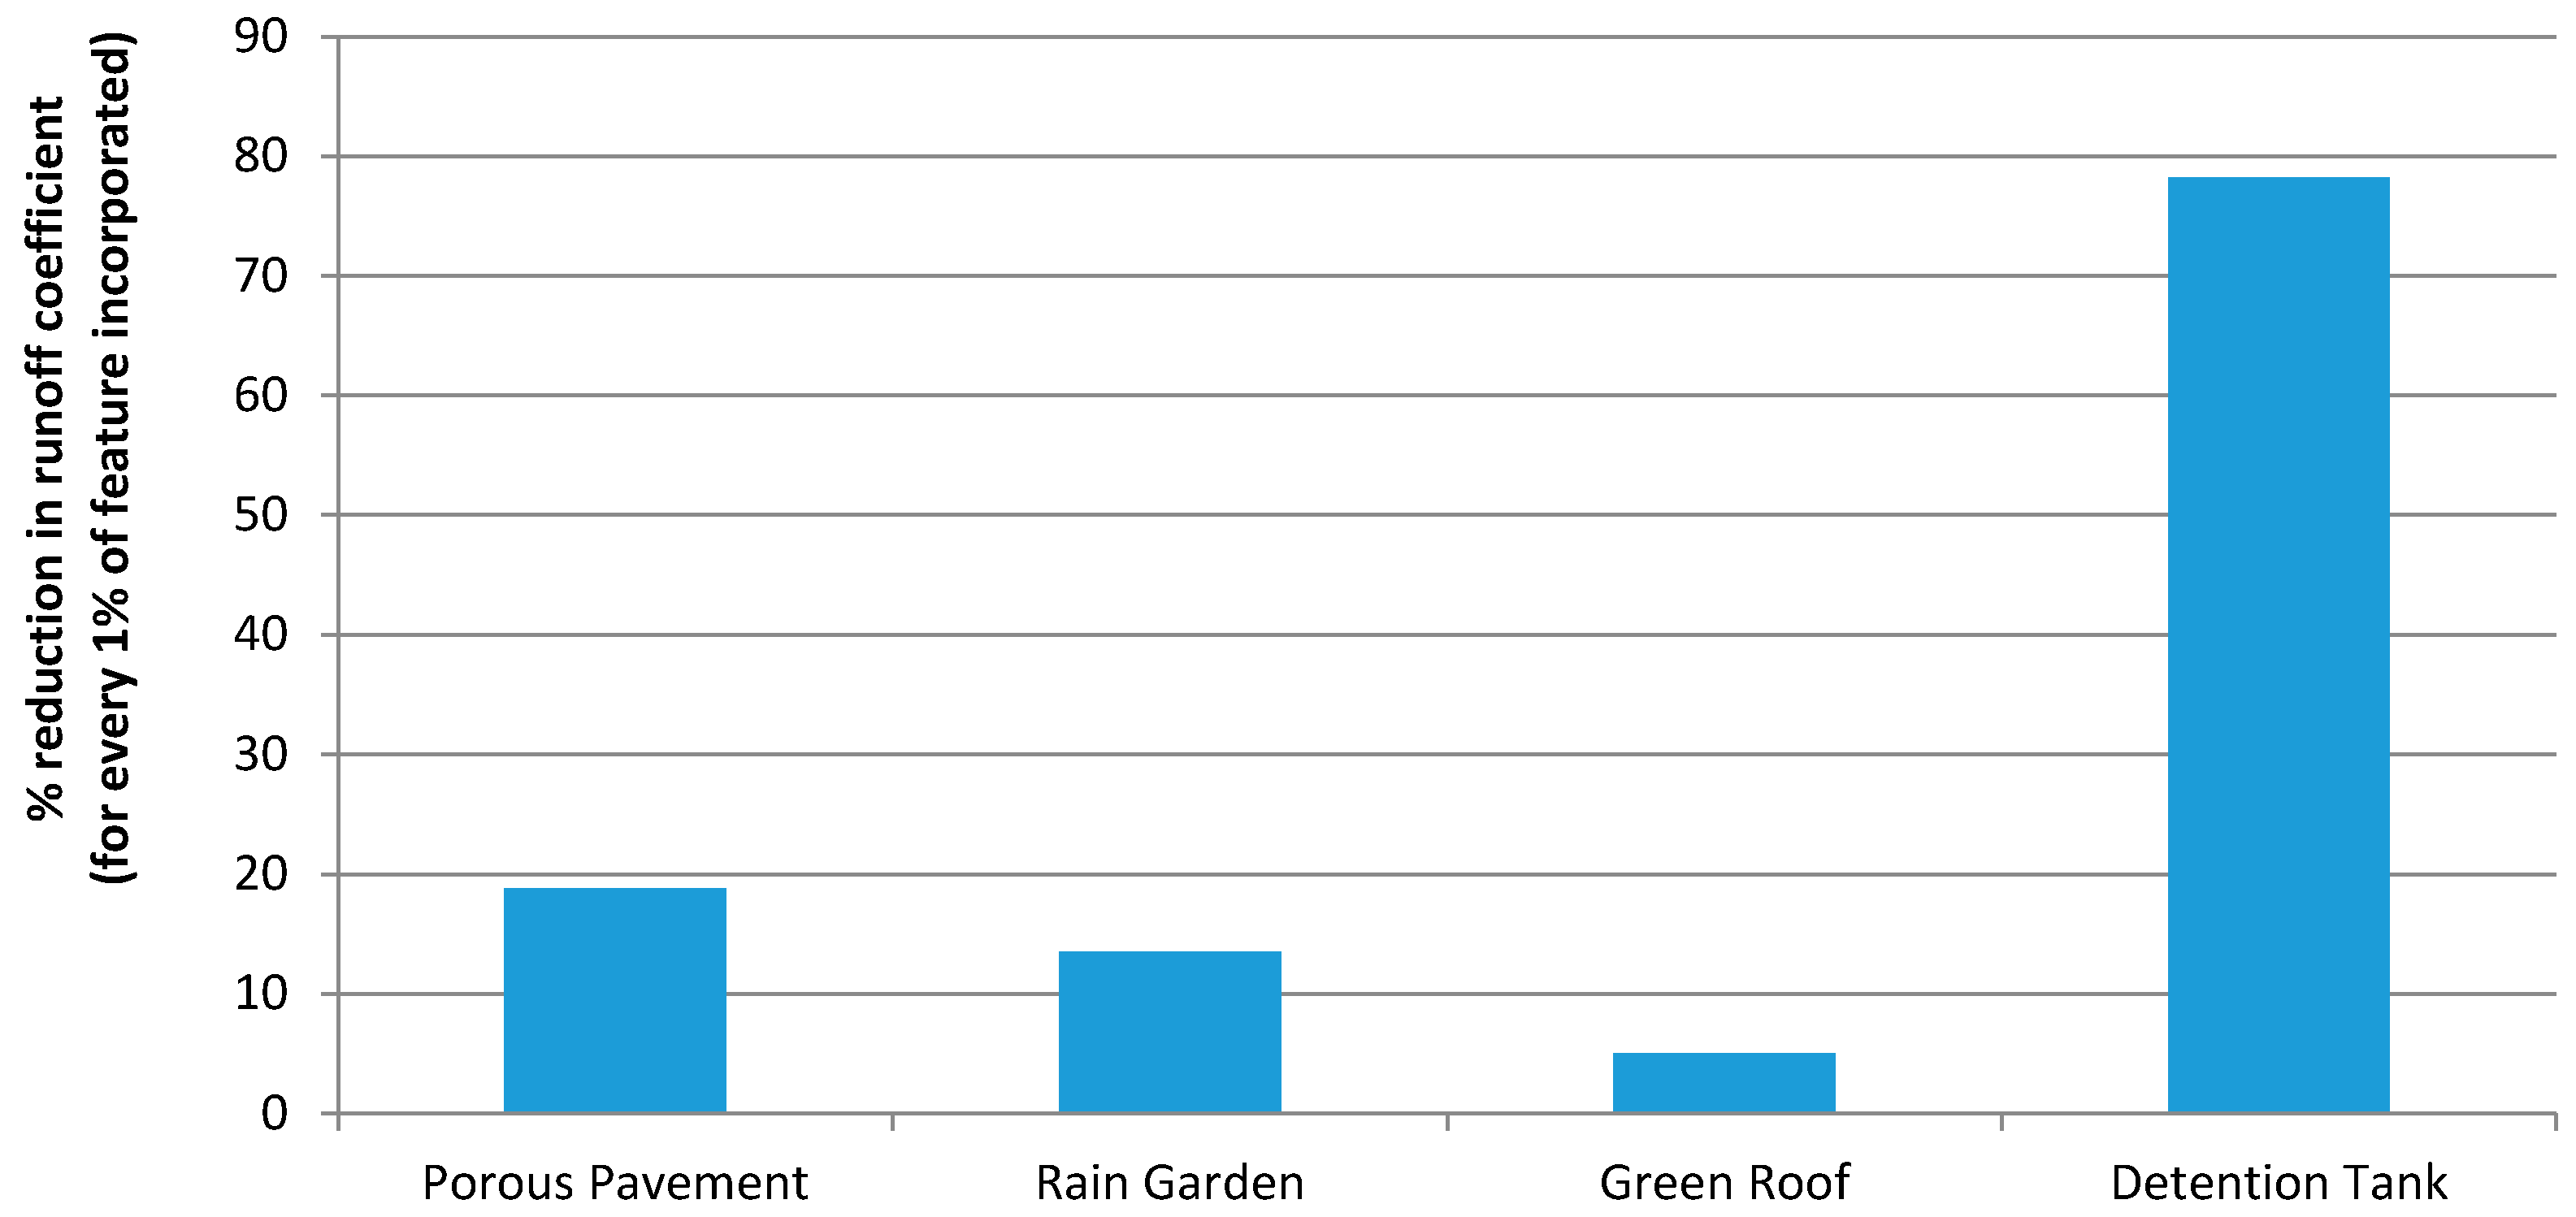
From Figure 15 it can be concluded that the detention tank is the most effective feature in reducing C values. For every 1% of detention tank (with 1 m depth) C value was reduced by about 80%, whereas the green roof was the least effective feature, as for every 1% of green roof incorporated the C value was reduced by 5%. The performance of rain gardens and porous pavements were similar, reducing C values by 14% and 19%, respectively, for every 1% of feature incorporated. However, it is important to realise that these conclusions were drawn based on the results from a single urban catchment in Tengah Subcatchment, which had its unique conditions and characteristics. These conclusion should not be taken as universal conclusions which is applicable for all kinds of catchments across Singapore.
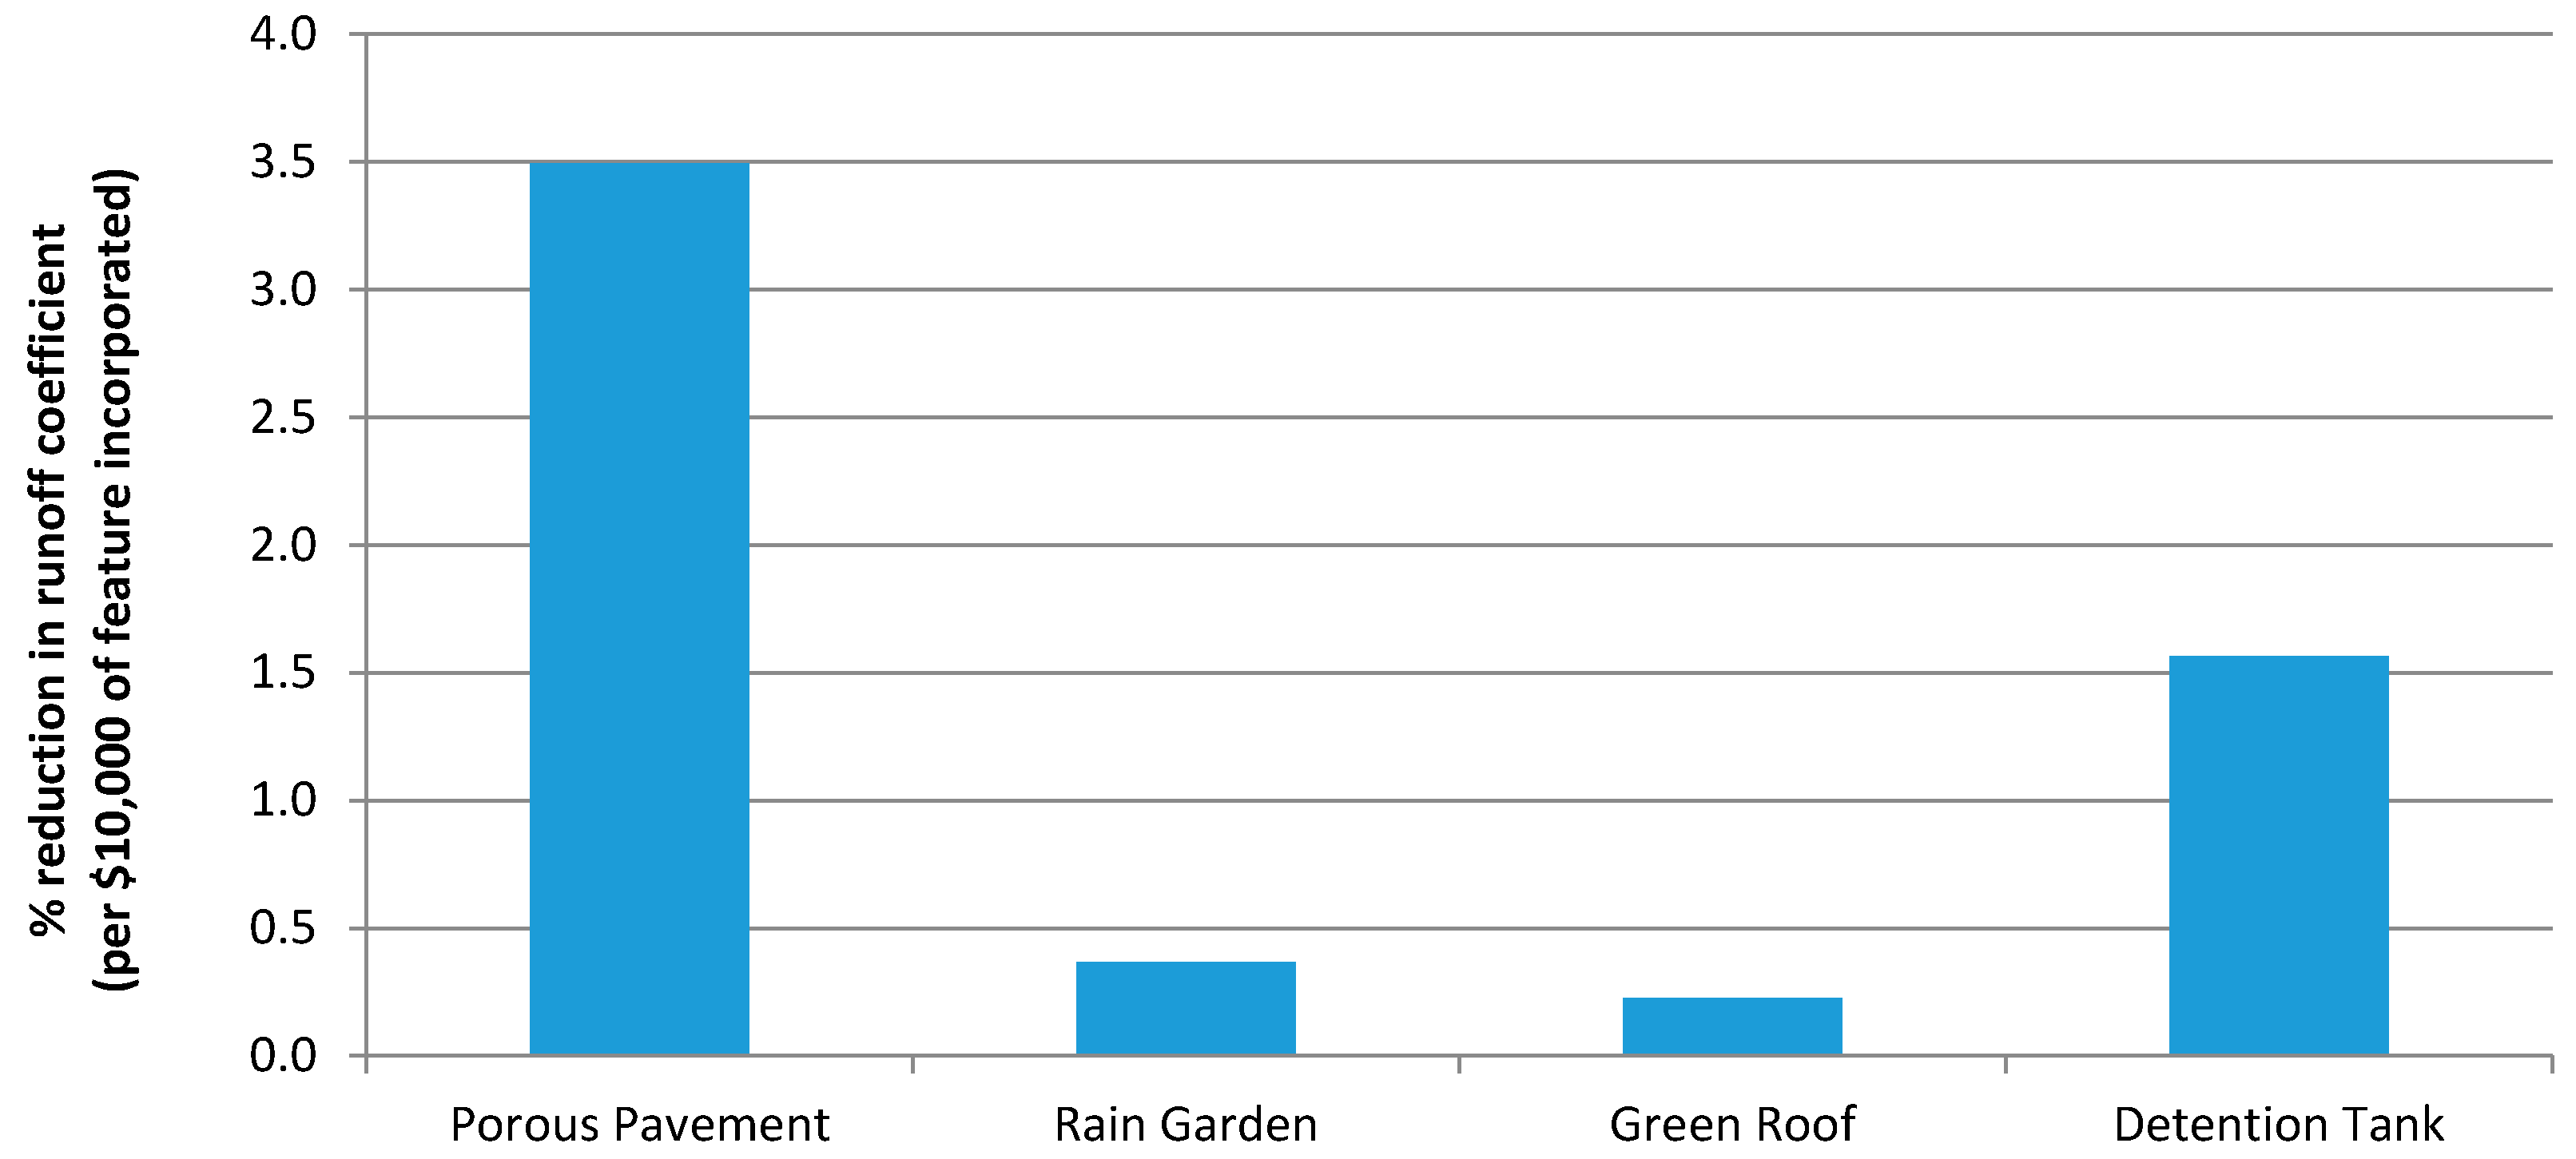
The effectiveness of each feature was also quantified based on the percentage reduction in C values for every SGD$10,000 of feature incorporated in TSC. As seen from Figure 16, porous pavements fared as the most cost effective feature in terms of C values reduction. The cost reflected here is based solely on construction. Maintenance and operational cost were not included in the current calculations, consideration of which would have resulted in a different outcome.
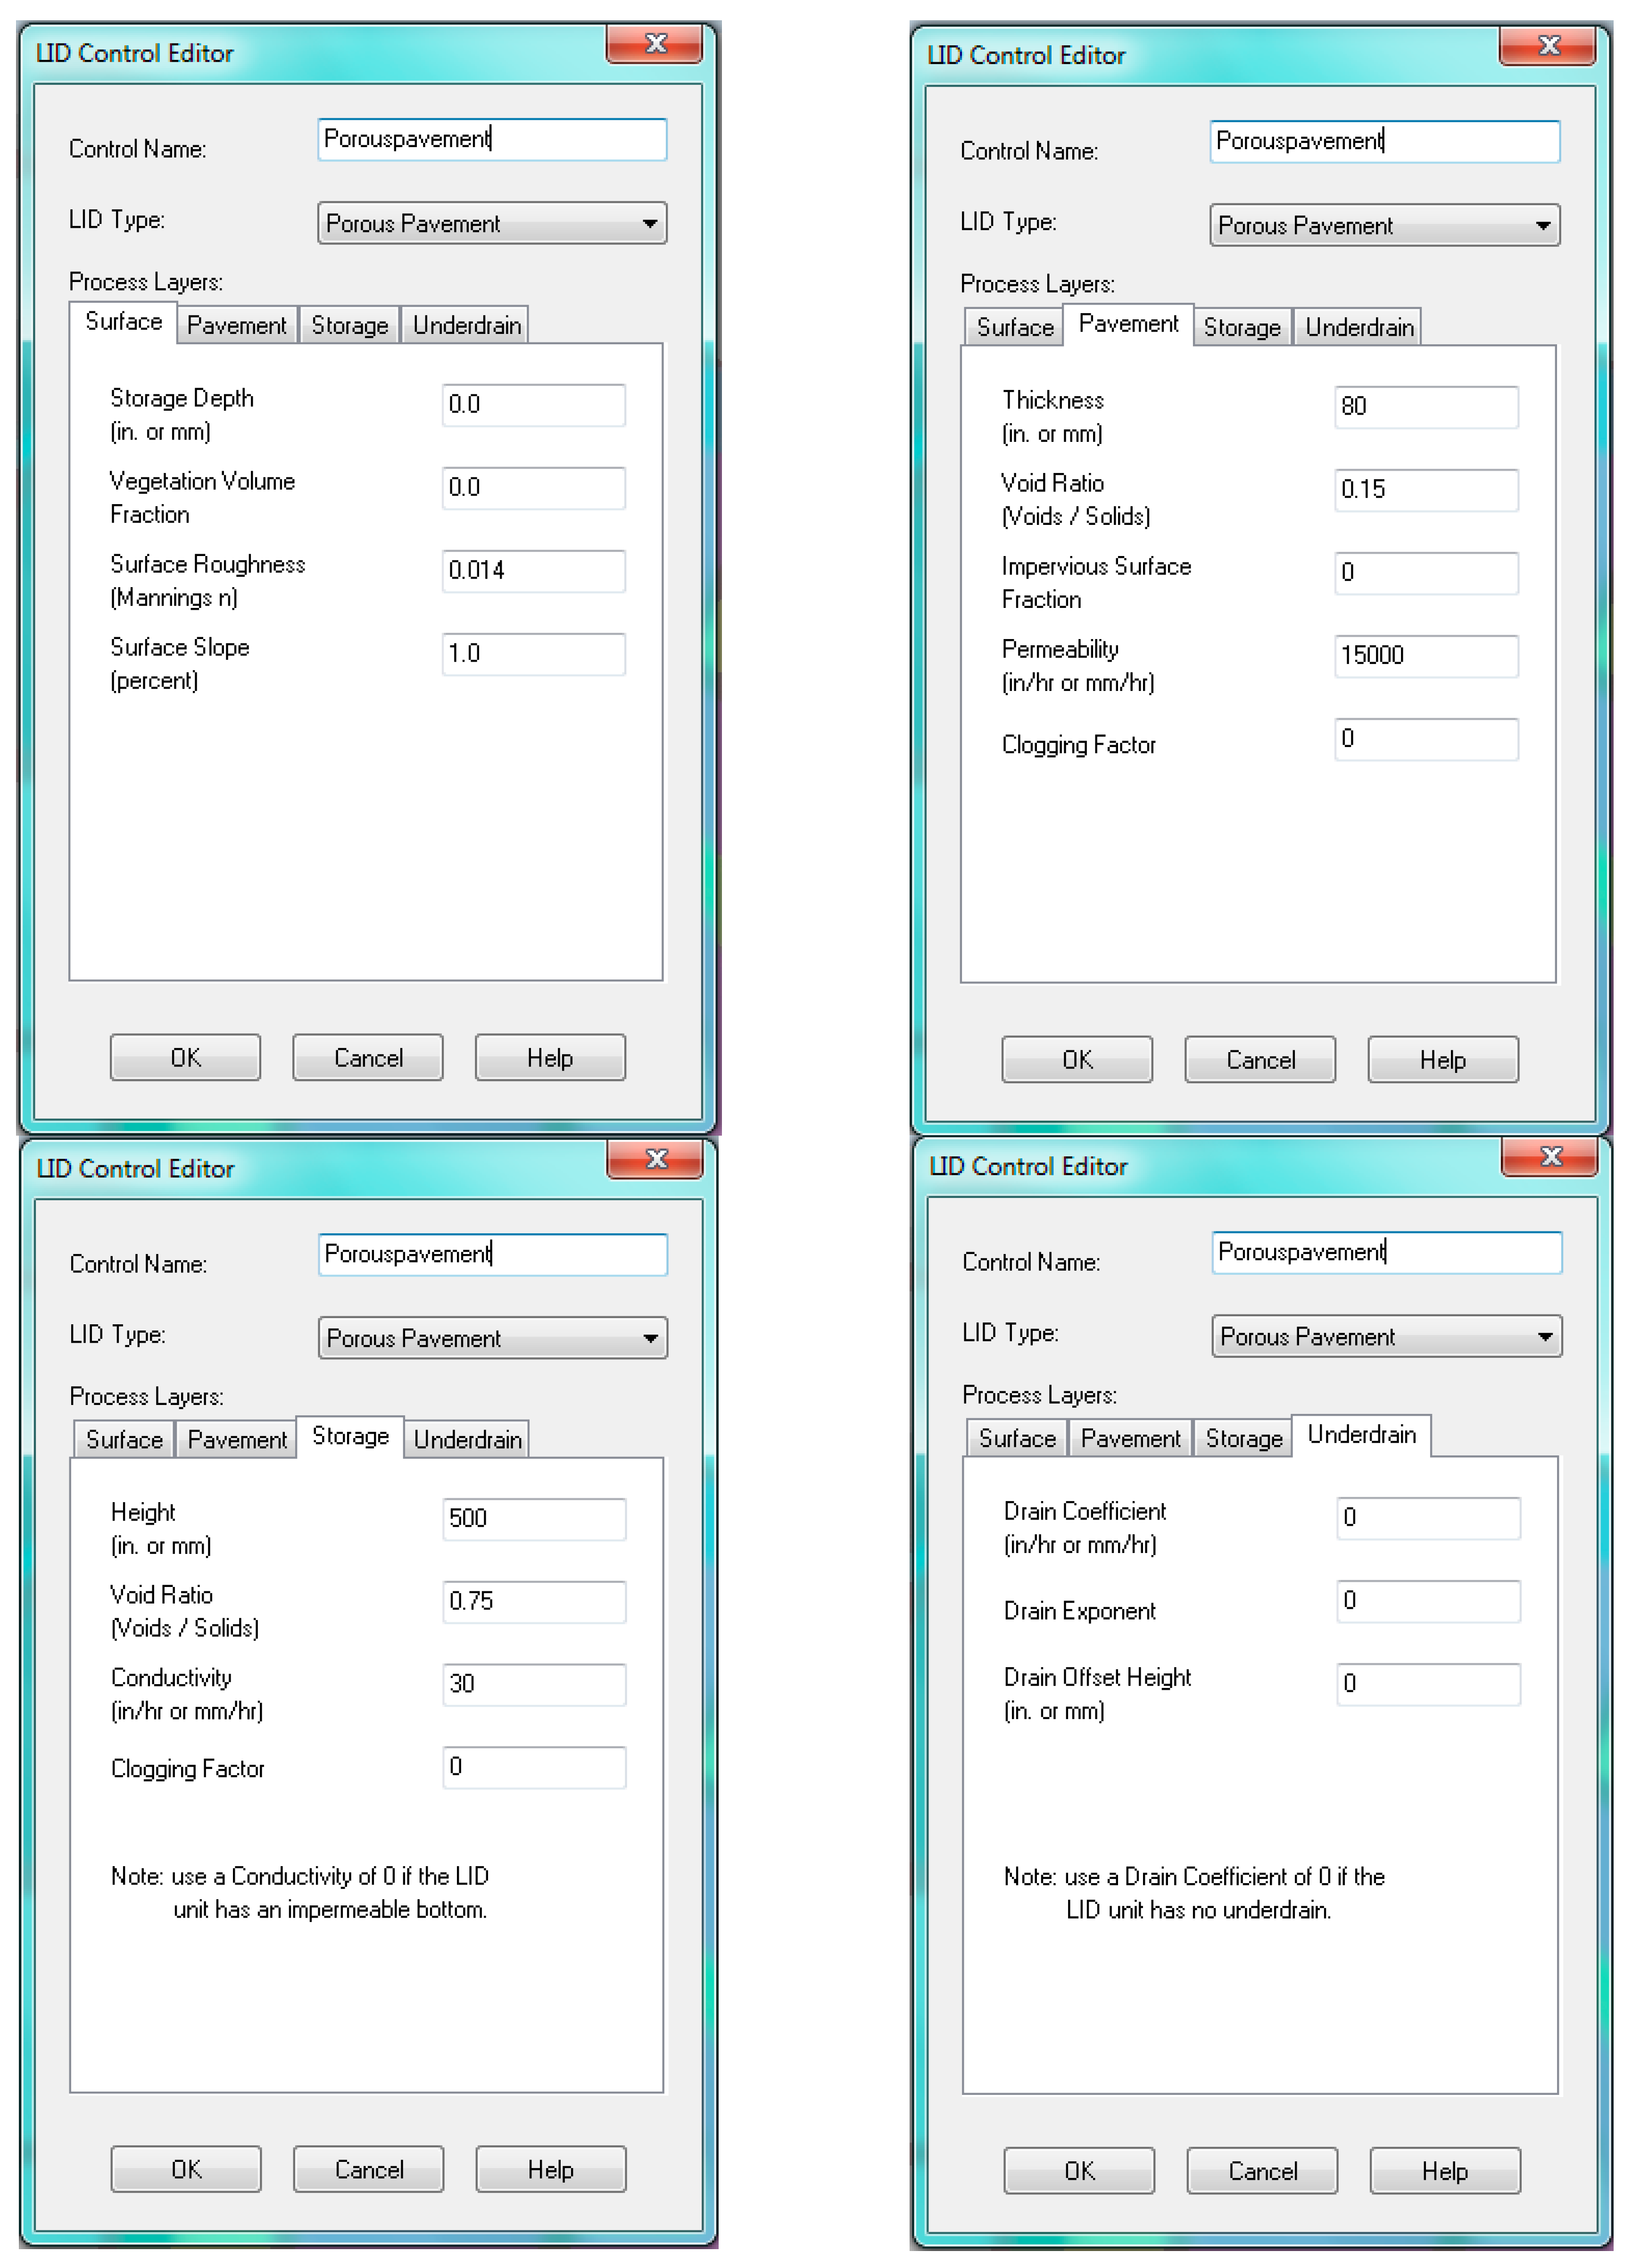
This research highlighted the importance of available storage capacity in reducing C values. This can be seen from detention tanks which (i) have the capacity to store large volume of runoff to be detained; and, (ii) flexibility to control the release of detained water after rainfall event contributed largely to its effectiveness in runoff control. Green roofs, on the other hand, were expected to have the lowest reduction in C values as they have very limited detention capacity. The green roofs modelled in this research have available storage of 70 mm as compared to 500 and 400 mm in porous pavement and rain garden, respectively [28]. The storage layer for porous pavement is in the range of 6 to 36 inches (i.e., 152–914 mm) [29], hence the storage of porous pavement was assumed to be 500 mm in this study. The porous pavements have been incorporated in carparks, walkways, open plazas and playgrounds. While the porous pavements in carparks and walkways are usually shallower, deeper porous pavements can be built in open plazas and playground, hence an average depth of 500 mm was assumed in this study. The under-drain system in porous pavements and rain gardens implies that water stored in these features infiltrated instead of draining in to the conveyance system. It could be inferred that infiltration is an effective mechanism in reducing surface runoff. The runoff reduction potential of raingardens in Singapore is found to increase upon considering the slope of the raingarden.
4. Discussion
This research is a first attempt to determine C values based on land use and slope (Table 2) and quantify the hydrological response regime of Singapore based on its C values (Figure 9). Though computation of C values based on land use and slope is currently not adopted in Singapore, it is common in other cities. For example, the Florida Department of Transportation (FDOT) has adopted a range of C values based on slope in addition to the C values based on land use [30]. Similarly, in Section 7.5.2 (b) of the Storm Water Drainage Manual prepared by the Drainage Services Department (DSD) in Hong Kong, surface characteristics and slope (two categories, “flat” and “steep”) of the area are considered in computing C value [31]. Also a recent study by HR Wallingford in UK also states that, the runoff at the site scales are gradient dependent and current practices are inappropriate in predicting the site runoff [32]. Hence there is enough evidence and need to revise the C values table (i.e., Section 7.1.2 of PUB’s COP on Surface Water Drainage [8]) to be used in Singapore, which is the motivation behind this research.
Additionally, there is scope to improve the research findings reported here. The first recommendation is with regard to improving the accuracy of Singapore’s hydrological response regime map as shown in Figure 9. In this research, land use parameters such as percentage imperviousness, Manning’s N and depression storage values, have been determined with reference to guidelines by other countries. Though conscientious efforts have been made to represent each land use parameter as accurately as possible based on the author’s understanding of Singapore, calibration against actual rainfall and discharge data have to be carried out at the subcatchment level to adjust these land use parameters values for better representation of the onsite situation. In addition, soil properties across the entire island have been assumed to be homogenous and belong to soil group D in the HSG classification. This aspect can be refined with detailed borehole information from various agencies and complemented with the borehole investigation works for the missing areas. With resources, time and effort invested in this data collection process, a complete soil map can be consolidated and more accurate curve number inputs can be used for the SWMM simulations.
The second recommendation is to improve the hydraulics of the simulations. In this study, emphasis has not been placed on the hydraulics effects of the channels and drainage networks. The two study areas have been designed based on the general slope direction of the terrain as no internal drainage plans were available. It has been assumed in this research that all overland flow generated form the subcatchments will be channelled to the outflow completely and quickly. This is sufficient for this research which aims to test the hydrological feasibility of the new runoff control regulation. However, for a more reliable hydrological and hydraulics analysis of a catchment, it is better to update the model with actual internal drainage plans that will address practical constraints, if any.
The hydrological response regime map of Singapore if complemented by information such as the expected end of lifespan of buildings, will project the duration needed for all urban pockets in Singapore to be renewed/retrofitted and finally have C values within PUB’s limits of 0.55. With this projection, flood hotspots that do not have short term renewal or retrofitting opportunities can be identified. Alternative flood management strategies can be explored to alleviate the situation in these areas. This recommendation will allow prioritization of focus areas and identify mainstreaming opportunities, thus allowing PUB to constantly review the robustness of Singapore’s storm water management plans.
The ABC Waters programme may have limited effectiveness in reducing C values. However there are several other attractive benefits such as UHI mitigation, increasing land and property values, psychological and social benefits and encouraging biodiversity [9]. This research has further highlighted that there is no one solution fits all approach when dealing with C values reduction in Singapore. Even though Singapore is small, each piece of development on the island is unique. A feature that is highly cost effective in a development may not be suitable for another due to varying site conditions and operational regimes. The need to consider land availability, construction, maintenance, operational and end of life cycle cost remains prudent when determining the most suitable suite of features for each development site.
With the knowledge gained from the more in-depth researches proposed above, PUB will be able to establish a set of guidelines for consultants and developers to follow when identifying the best combination of features to reduce C values and reap decent cost savings as suggested by the expert panel [12]. Also, this research outcomes can be used by PUB to further explore the possibility of including slope in runoff coefficient table in Section 7.1.2 of PUB’s Code of Practice for Surface Water Drainage [8].
5. Conclusions
In Singapore, the policy decision of reduction in runoff has translated into a legislative requirement such as runoff control regulation restricting C value of developments to below 0.55. This paper focused on establishing the actual hydrological response regime of Singapore and the relationship between runoff coefficient, slope and land use. This resulted in an elaborate hydrologic response map for Singapore, which comprises a range of C values for the land use based on varying slopes. This might lead to optimal design of drainage systems such as ABC Waters design features. Additionally, the findings from the two study areas have shown that ABC Waters design features have the capacity to reduce C values. Hence, ABC Waters design features in its many forms can be incorporated into new developments or retrofitted onto existing buildings as a means of complying with the new regulatory requirement, without occupying excessive space. Hence, it is recommended to consider the relationship between slope and land use while determining runoff coefficients, and to incorporate ABC Waters design features in urban design to improve runoff coefficient (C), which can reduce the peak flow and delay the occurrence of peak discharge.
Acknowledgments
The authors would like to thank PUB, Singapore’s National Water Agency, IHE Delft Institute for Water Education and CRC for Water Sensitive Cities, Australia for supporting the research.
Author Contributions
The paper was written by Xue Ping Goh based on the results obtained from her research which was done for the partial fulfilment of requirements for the Master of Science degree (2013–2015) at the IHE Delft Institute for Water Education, under the close supervision of Assela Pathirana and Chris Zevenbergen. Mohanasundar Radhakrishnan provided timely feedback on the research throughout the research study and contributed to the development of the model. All co-authors also helped to review and improve the paper.
Conflicts of Interest
The authors declare no conflict of interest.
Appendix A
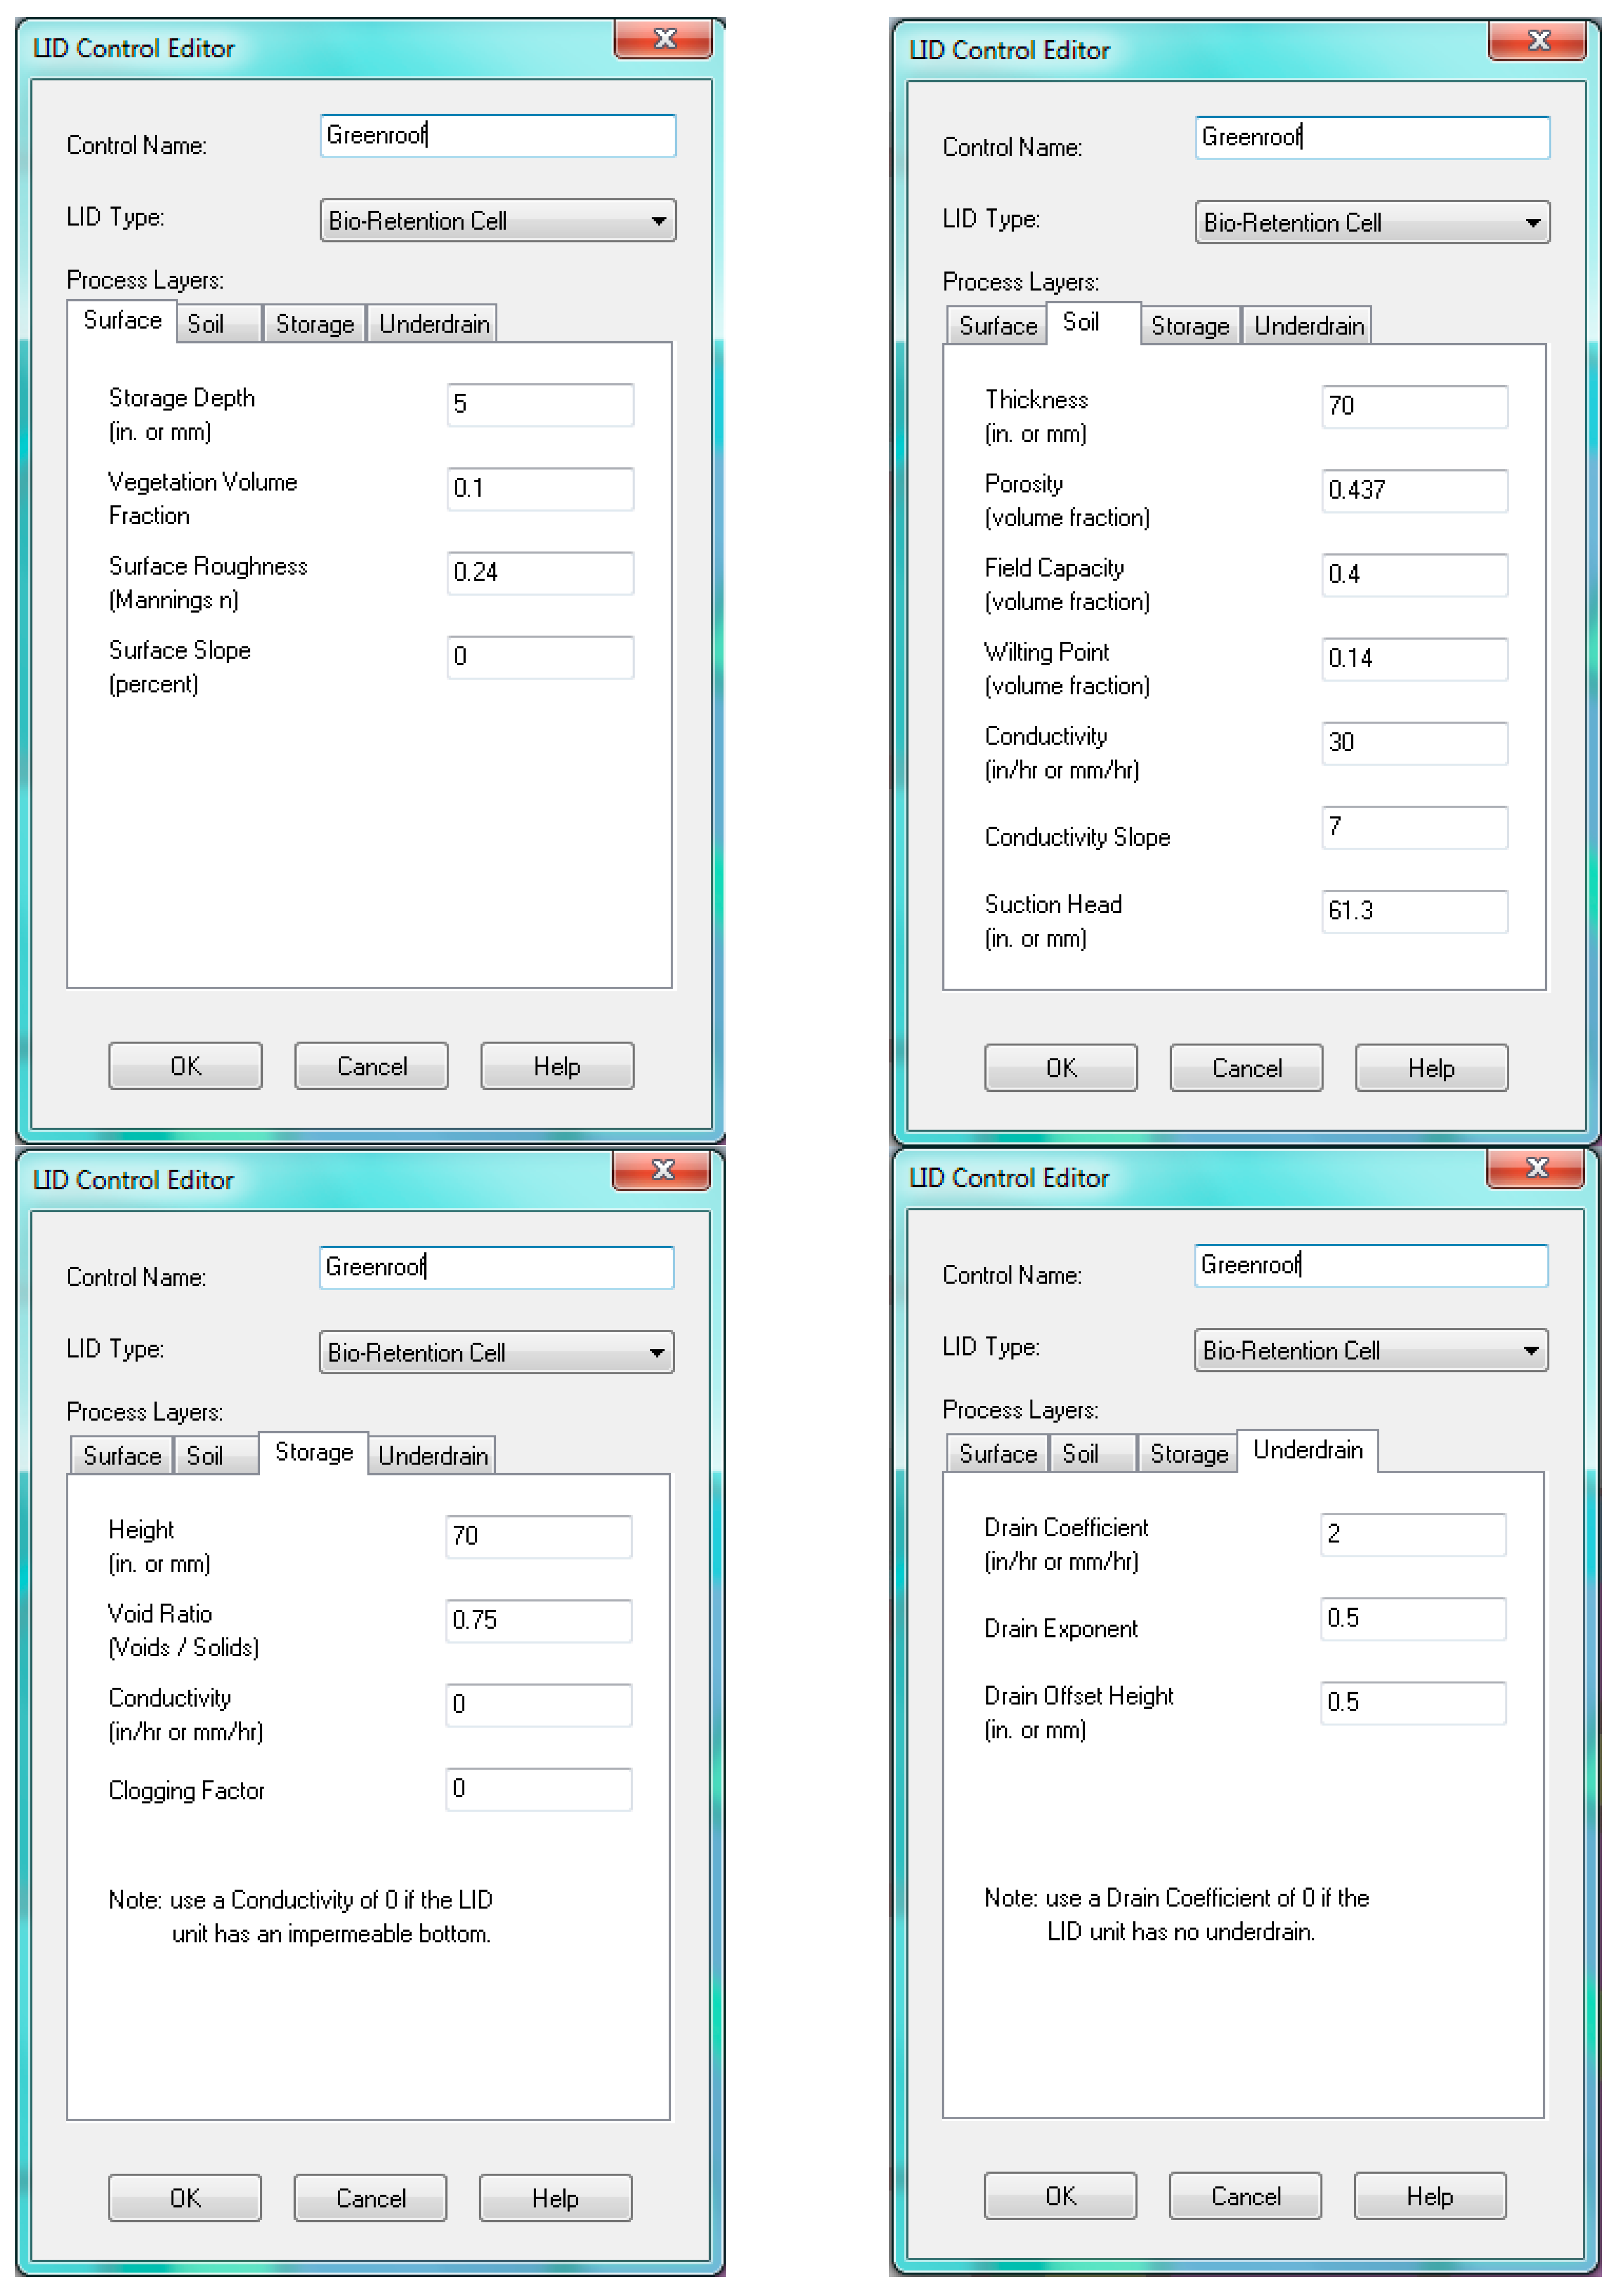
Figure A1.
Representation of green roof in SWMM and design parameters used.

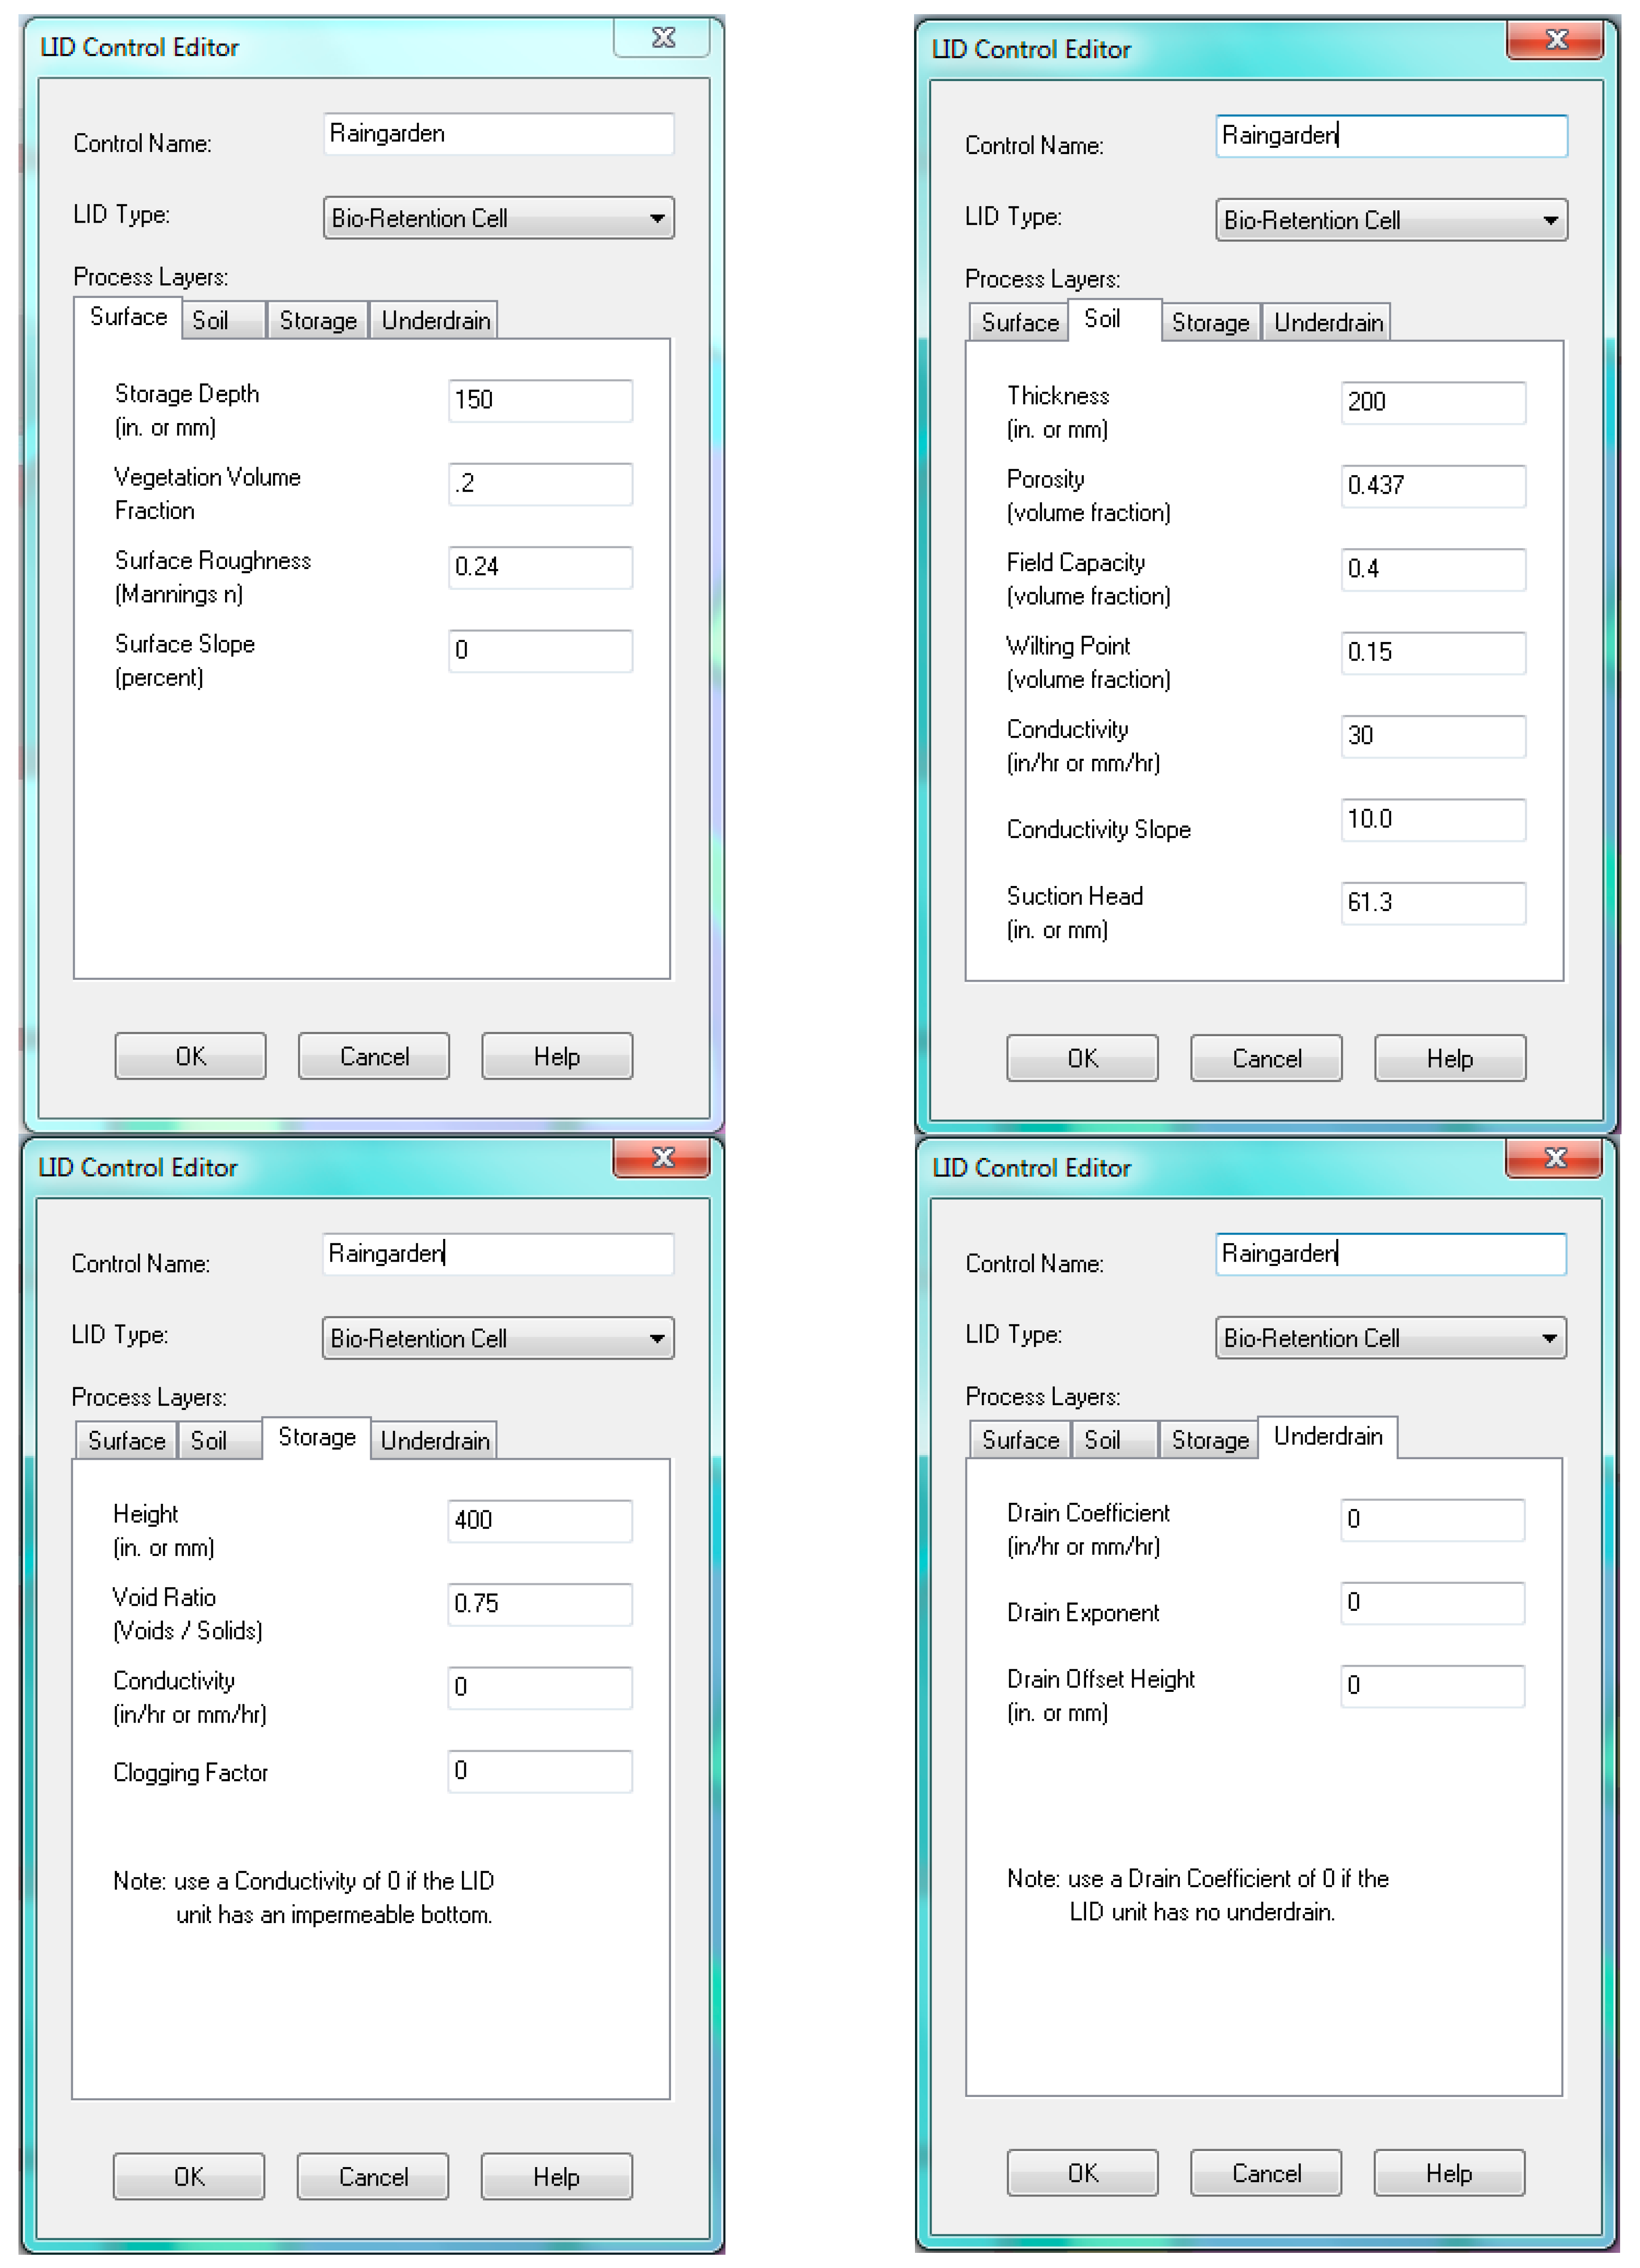
Figure A2.
Representation of rain gardens in SWMM and design parameters used.

Figure A3.
Representation of porous pavement in SWMM and design parameters used.
References
- Dietz, M.E. Low impact development practices: A review of current research and recommendations for future directions. Water Air Soil Pollut. 2007, 186, 351–363. [Google Scholar] [CrossRef]
- Chinh, D.; Dung, N.; Gain, A.; Kreibich, H. Flood loss models and risk analysis for private households in Can Tho City, Vietnam. Water 2017, 9, 313. [Google Scholar] [CrossRef]
- Radhakrishnan, M.; Pathirana, A.; Ashley, R.; Zevenbergen, C. Structuring climate adaptation through multiple perspectives: Framework and case study on flood risk management. Water 2017, 9, 129. [Google Scholar] [CrossRef]
- European Environment Agency. Urban Adaptation to Climate Change in Europe: Transforming Cities in a Changing Climate; European Environment Agency: Copenhagen, Denmark, 2016; p. 135. [Google Scholar]
- City of Melbourne. Resilient Melbourne; City of Melbourne: Melbourne, Australian, 2016. [Google Scholar]
- HM Government. National Flood Resilience Review. Crown Copyright: 2016. Available online: https://www.gov.uk/government/publications/national-flood-resilience-review (accessed on 16 April 2017).
- Zhang, S.X.; Babovic, V. A real options approach to the design and architecture of water supply systems using innovative water technologies under uncertainty. J. Hydroinform. 2012, 14, 13–29. [Google Scholar] [CrossRef]
- PUB Singapore’s National Water Agency. Code of Practice on Surface Water Drainage (Sixth Edition-December 2011, Addendum No. 1 Junuary 2013); Public Utilties Board: Singapore, 7 June 2017. Available online: https://www.pub.gov.sg/Documents/COP_Final.pdf (accessed on 7 June 2017).
- PUB Singapore’s National Water Agency. Active Beautiful Clean Waters Design Guidelines; Board, P.U., Ed.; Public Utilties Board: Singapore, 2014.
- Fletcher, T.D.; Shuster, W.; Hunt, W.F.; Ashley, R.; Butler, D.; Arthur, S.; Trowsdale, S.; Barraud, S.; Semadeni-Davies, A.; Bertrand-Krajewski, J.-L.; et al. SUDS, LID, BMPs, WSUD and more—The evolution and application of terminology surrounding urban drainage. Urban Water J. 2015, 12, 525–542. [Google Scholar] [CrossRef]
- Pathirana, A.; Denekew, H.B.; Veerbeek, W.; Zevenbergen, C.; Banda, A.T. Impact of urban growth-driven landuse change on microclimate and extreme precipitation—A sensitivity study. Atmos. Res. 2014, 138, 59–72. [Google Scholar] [CrossRef]
- PUB Singapore’s national water agency. Report on Key Conclusions and Recommendations of the Expert Panel on Drainage Design and Flood Protection Measures; PUB Singapore’s National Water Agency, Ed.; PUB Singapore’s National Water Agency: Singapore, 2012.
- Urban Drainage and Flood Control District. Urban Storm Drainage Criteria Manual; Urban Drainage and Flood Control District, Ed.; Urban Drainage and Flood Control District (UDFCD): Denver, CO, USA, 2016. [Google Scholar]
- Nicklow, J.W.; Boulos, P.F.; Muleta, M.K. Comprehensive Urban Hydrologic Modeling Handbook for Engineers and Planners; MWH Soft, Inc. Publ.: Pasadena, CA, USA, 2006. [Google Scholar]
- Voogt, J.A. Urban heat islands: Hotter cities. Action Biosci. 2004. Available online: http://www.actionbioscience.org/environment/voogt.html?newwindow=true (accessed on 12 August 2017).
- United States Department of Agriculture. Urban Hydrology for Small Watersheds TR-55. In US Soil Conservation Service. Technical Release; Conservation Engineering Division, Natural Resource Conservation Service, United States Department of Agriculture: Washigton, DC, USA, 1986. [Google Scholar]
- National Environment Agency. Weather Statistics, 2014. Available online: http://www.nea.gov.sg/weather-climate/climate/historical-daily-records (accessed on 2 October 2014).
- Environmental Protection Agency, United States. Storm Water Management Model (SWMM). 2014. Available online: http://www2.epa.gov/water-research/storm-water-management-model-swmm (accessed on 3 March 2015).
- Rossman, L.A.; Huber, W.C. Stormwater Management model—Reference Manual—Volume I Hydrology (Revised); USEPA Agency, Ed.; USEPA: Cincinnati, OH, USA, 2016.
- Housing and Development Board of Singapore. HDB Homes of the Future: Green & Sustainable. 2014. Available online: http://www20.hdb.gov.sg/fi10/fi10296p.nsf/PressReleases/18994D97FB6D475F48257D4E0023DA3F?OpenDocument (accessed on 30 June 2017).
- Urban Redevelopment Authority of Singapore. Master Plan—Eastern Region. 2014. Available online: https://www.ura.gov.sg/uol/master-plan/View-Master-Plan/master-plan-2014/master-plan/Regional-highlights/east-region/east-region (accessed on 30 June 2017).
- Housing and Development Board of Singapore. Unveiling the Masterplan for Tengah: At Home with Nature. 2016. Available online: http://www.hdb.gov.sg/cs/infoweb/press-releases/corporate-pr-unveiling-the-masterplan-for-tengah-08092016 (accessed on 30 June 2017).
- Liu, Y.B.; Gebremeskel, S.; de Smedt, F.; Hoffmann, L.; Pfister, L. Predicting storm runoff from different land-use classes using a geographical information system-based distributed model. Hydrol. Process. 2006, 20, 533–548. [Google Scholar] [CrossRef]
- Housing and Development Board of Singapore. HDB Greenprint Brings Sustainable & Green Living to 5800 Households in Teck Ghee. 2015. Available online: http://www.hdb.gov.sg/cs/infoweb/press-releases/hdb-greenprint-brings-sustainable-and-green-living (accessed on 30 June 2017).
- Housing and Development Board of Singapore. Greenery. Undated. Available online: http://www.hdb.gov.sg/cs/infoweb/about-us/our-role/smart-and-sustainable-living/hdb-greenprint/greenery (accessed on 30 June 2017).
- Housing and Development Board of Singapore. Yuhua Residents First to Benefit from Sustainable Features with Completion of HDB Greenprint. 2015. Available online: http://www.hdb.gov.sg/cs/infoweb/press-release/yuhua-residents-first-to-benefit-from-sustainable-features (accessed on 30 June 2017).
- Greenroofs.com. Casa Clementi. 2012. Available online: http://www.greenroofs.com/projects/pview.php?id=1711 (accessed on 4 July 2017).
- Yau, W.K. Effectiveness of ABC Waters Design Features for Runoff Quantity Control in Urban Singapore, in Water Science and Engineering; IHE Delft Institute for Water Education: Delft, The Netherlands, 2017. [Google Scholar]
- Dickinson, R. Porous Pavement LID Control In #SWMM5, #InfoSWMM Sustain. Blogs about SWMM 5, InfoSWMM, InfoSewer, Stormwater Management Model and (Future) SWMM. Available online: https://swmm5.org/2017/02/01/porous-pavement-lid-control-in-swmm5-infoswmm-sustain/ (accessed on 4 July 2017).
- Poullain, J. Estimating Storm Water Runoff; PDH Centre: Fairfax, VA, USA, 2012. [Google Scholar]
- Hong Kong Drainage Services Department. Stormwater Drainage Manual—Planning Design and Management; Drainage Services Department, Ed.; Drainage Services Department, Government of the Hong Kong Special Administrative Region: Hong Kong, China, 2013.
- HR Wallingford. Greenfield Runoff Rates for Developments—Use of 2D Modelling and the Influence of Site Gradient; HR Wallingford: Wallingford, UK, 2016. [Google Scholar]
Figure 1.
Methodology for determining the hydrological response regime. Digital elevation model (DEM).
Figure 1.
Methodology for determining the hydrological response regime. Digital elevation model (DEM).

Figure 2.
Inputs for a single unit subcatchment in the Storm Water Management Model (SWMM).

Figure 3.
Methodology for assessing the effectiveness of Active, Beautiful, Clean (ABC) features.

Figure 4.
Proposed development of Tampines North New Town.
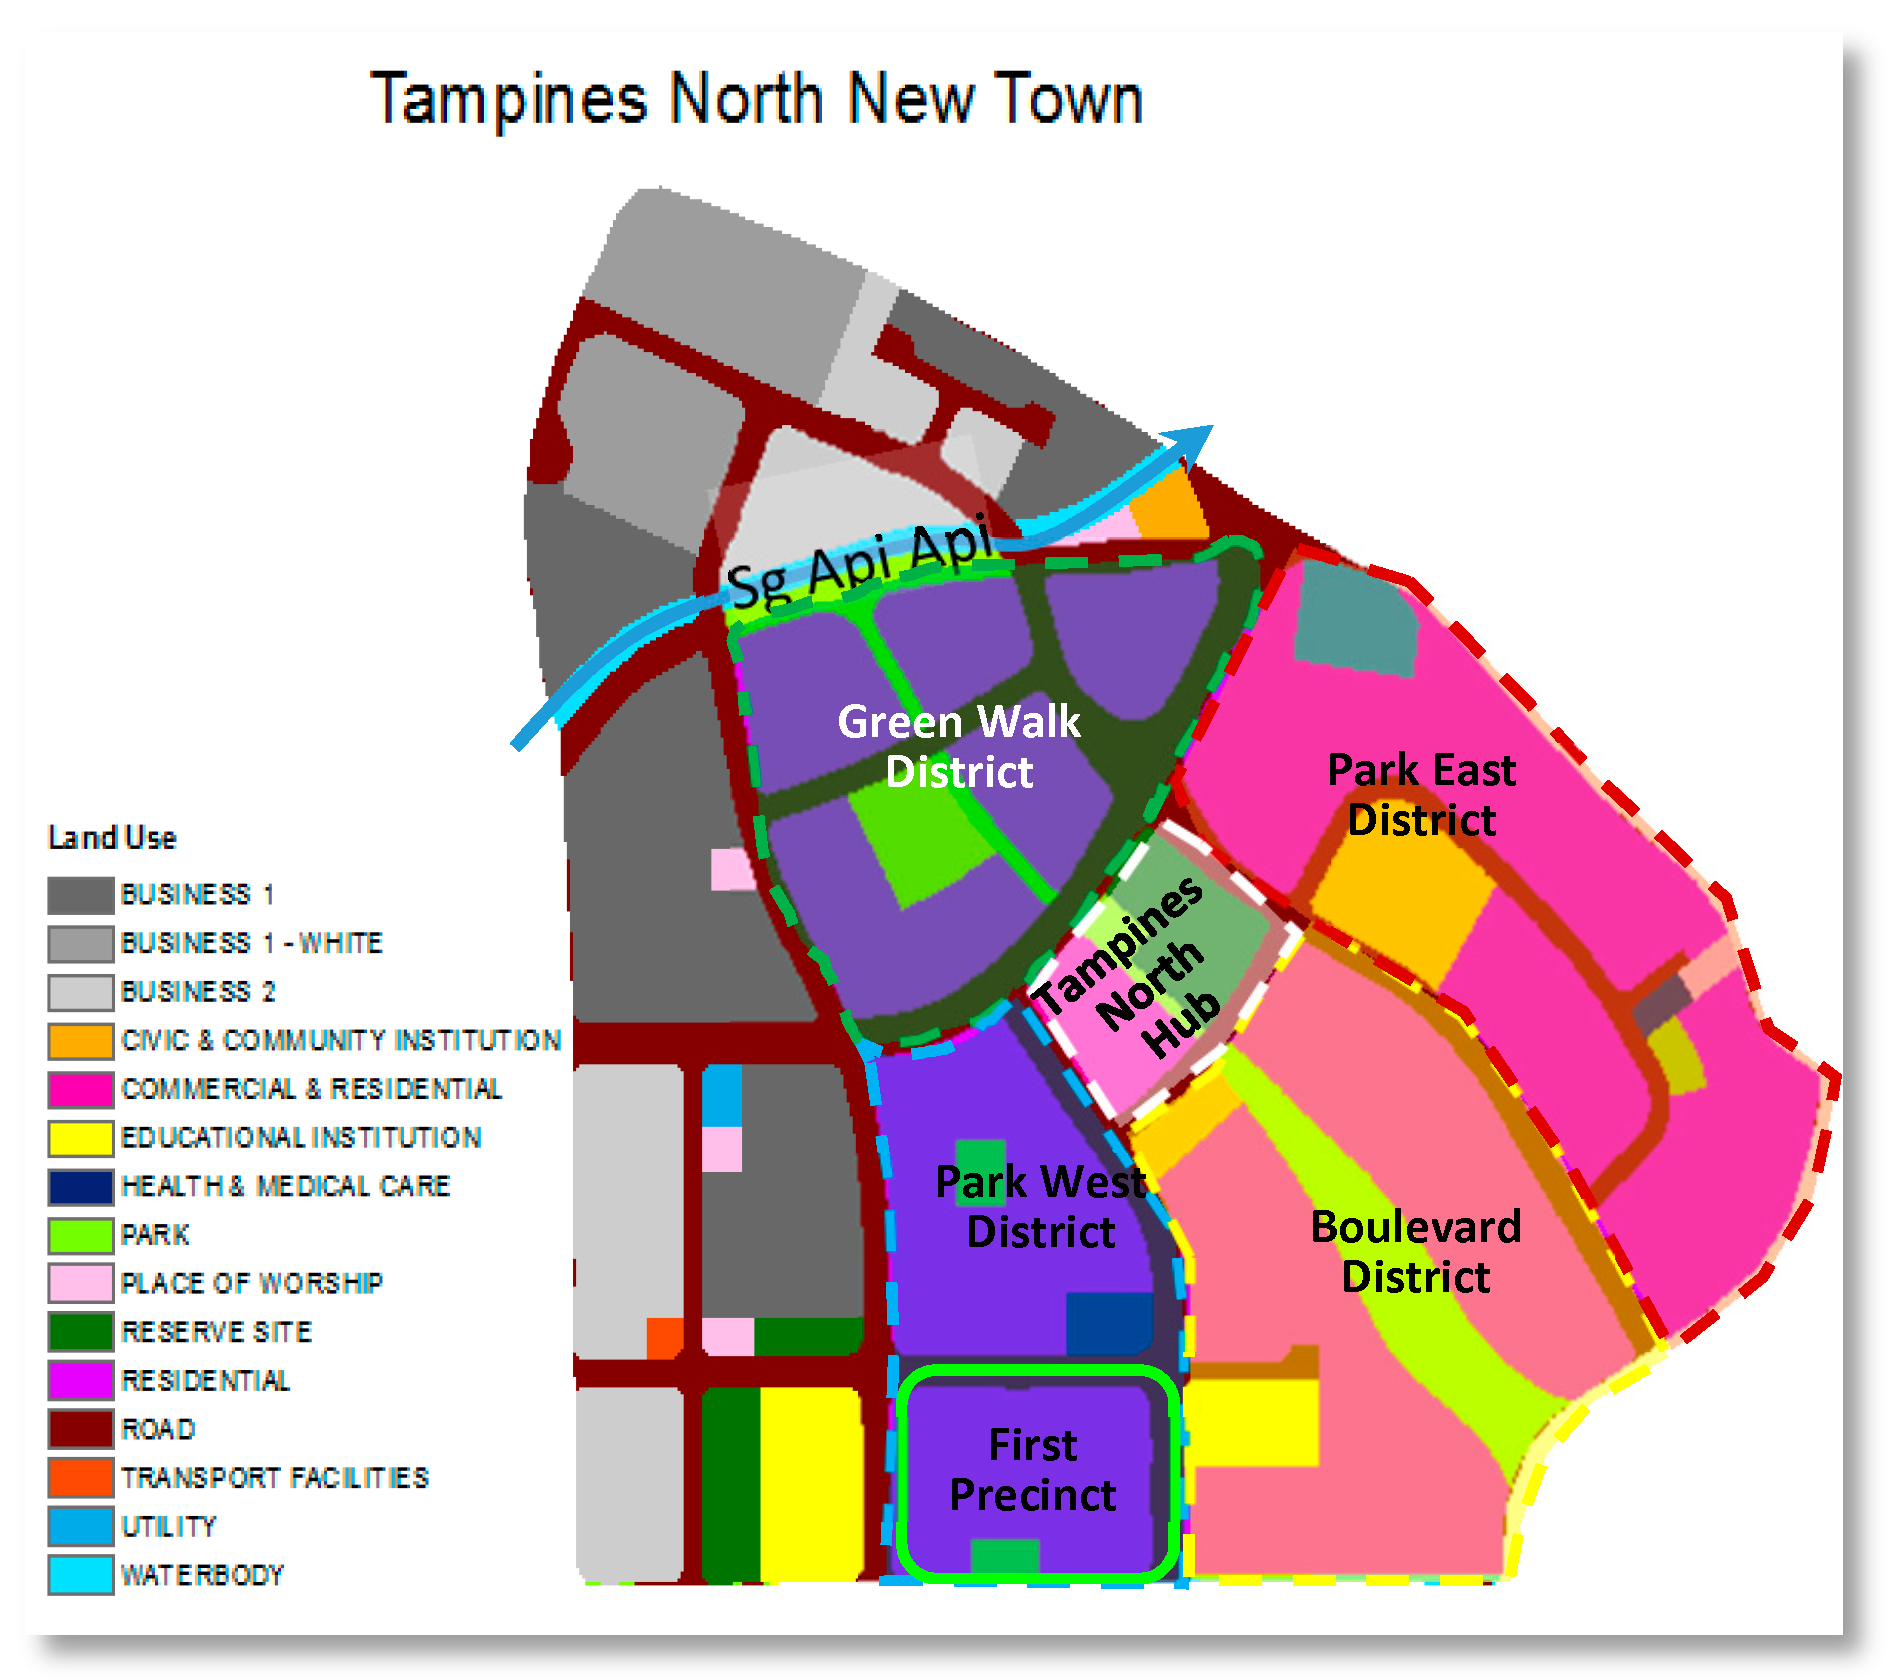
Figure 5.
Modelling of low impact development (LID) in SWMM.

Figure 6.
SWMM setup of the leaf concept design in Green Walk District (GWD).

Figure 7.
SWMM set up of Tengah Subcatchment (TSC) with ABC Waters design features incorporated.
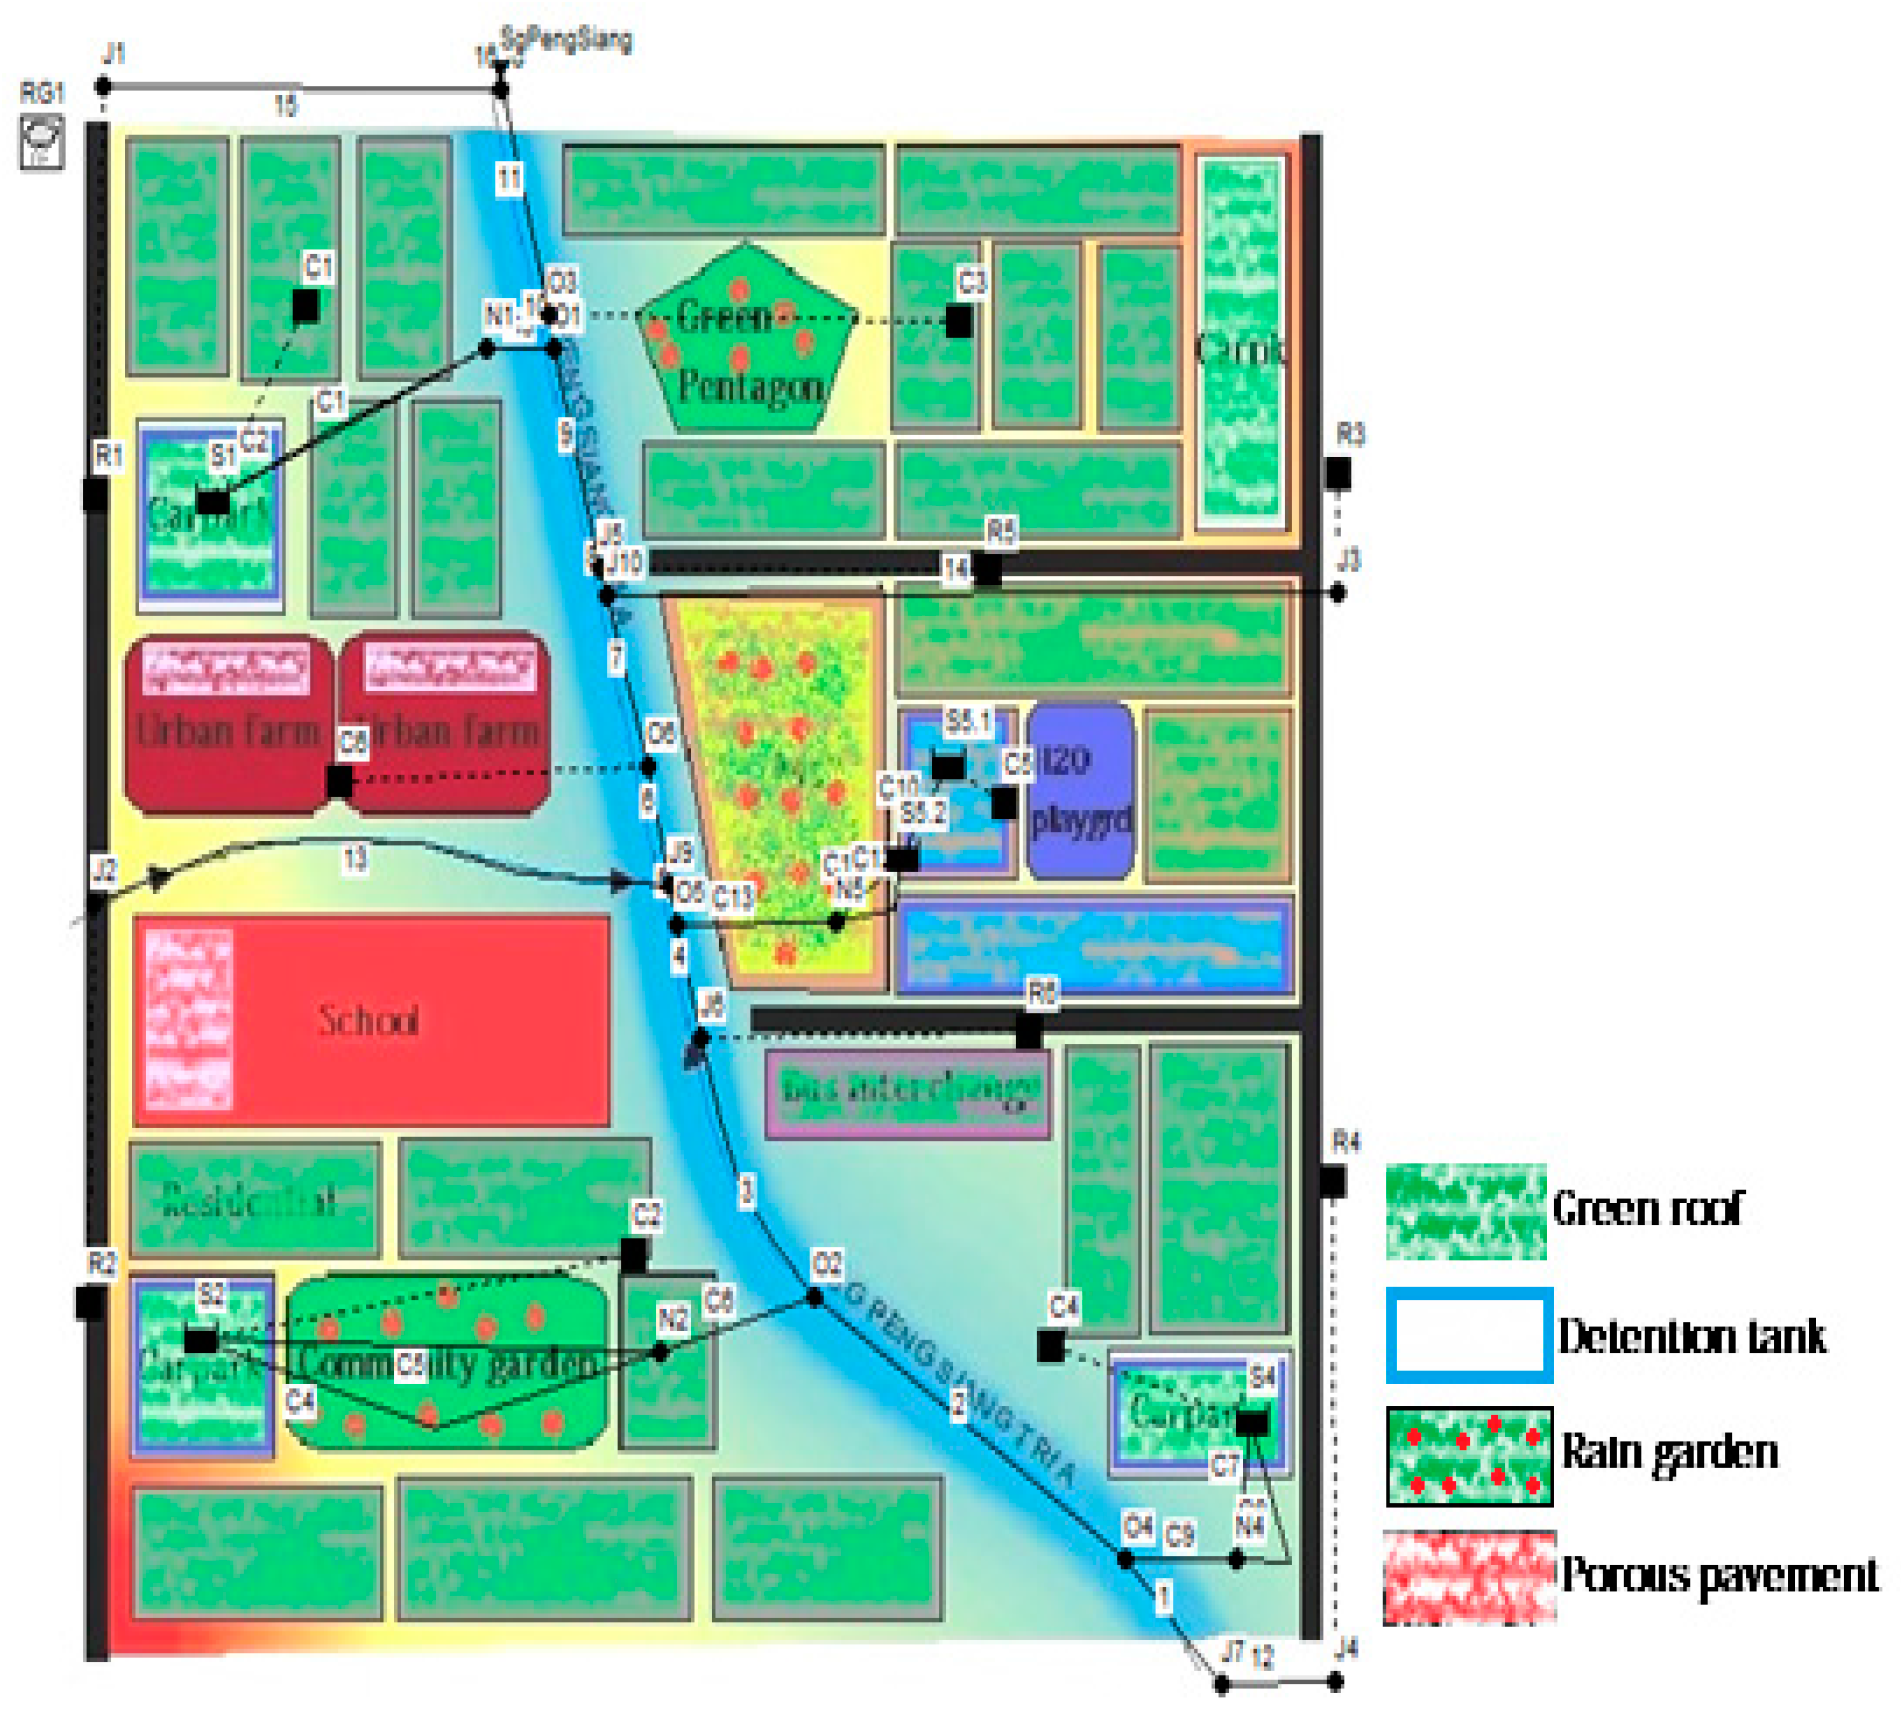
Figure 8.
TSC Subcatchments in SWMM.

Figure 9.
Hydrological response regime of Singapore (Peak C values) for current land use without any ABC Waters design features.
Figure 9.
Hydrological response regime of Singapore (Peak C values) for current land use without any ABC Waters design features.

Figure 10.
Runoff coefficient vs. percent slope plots for different land uses in Singapore.
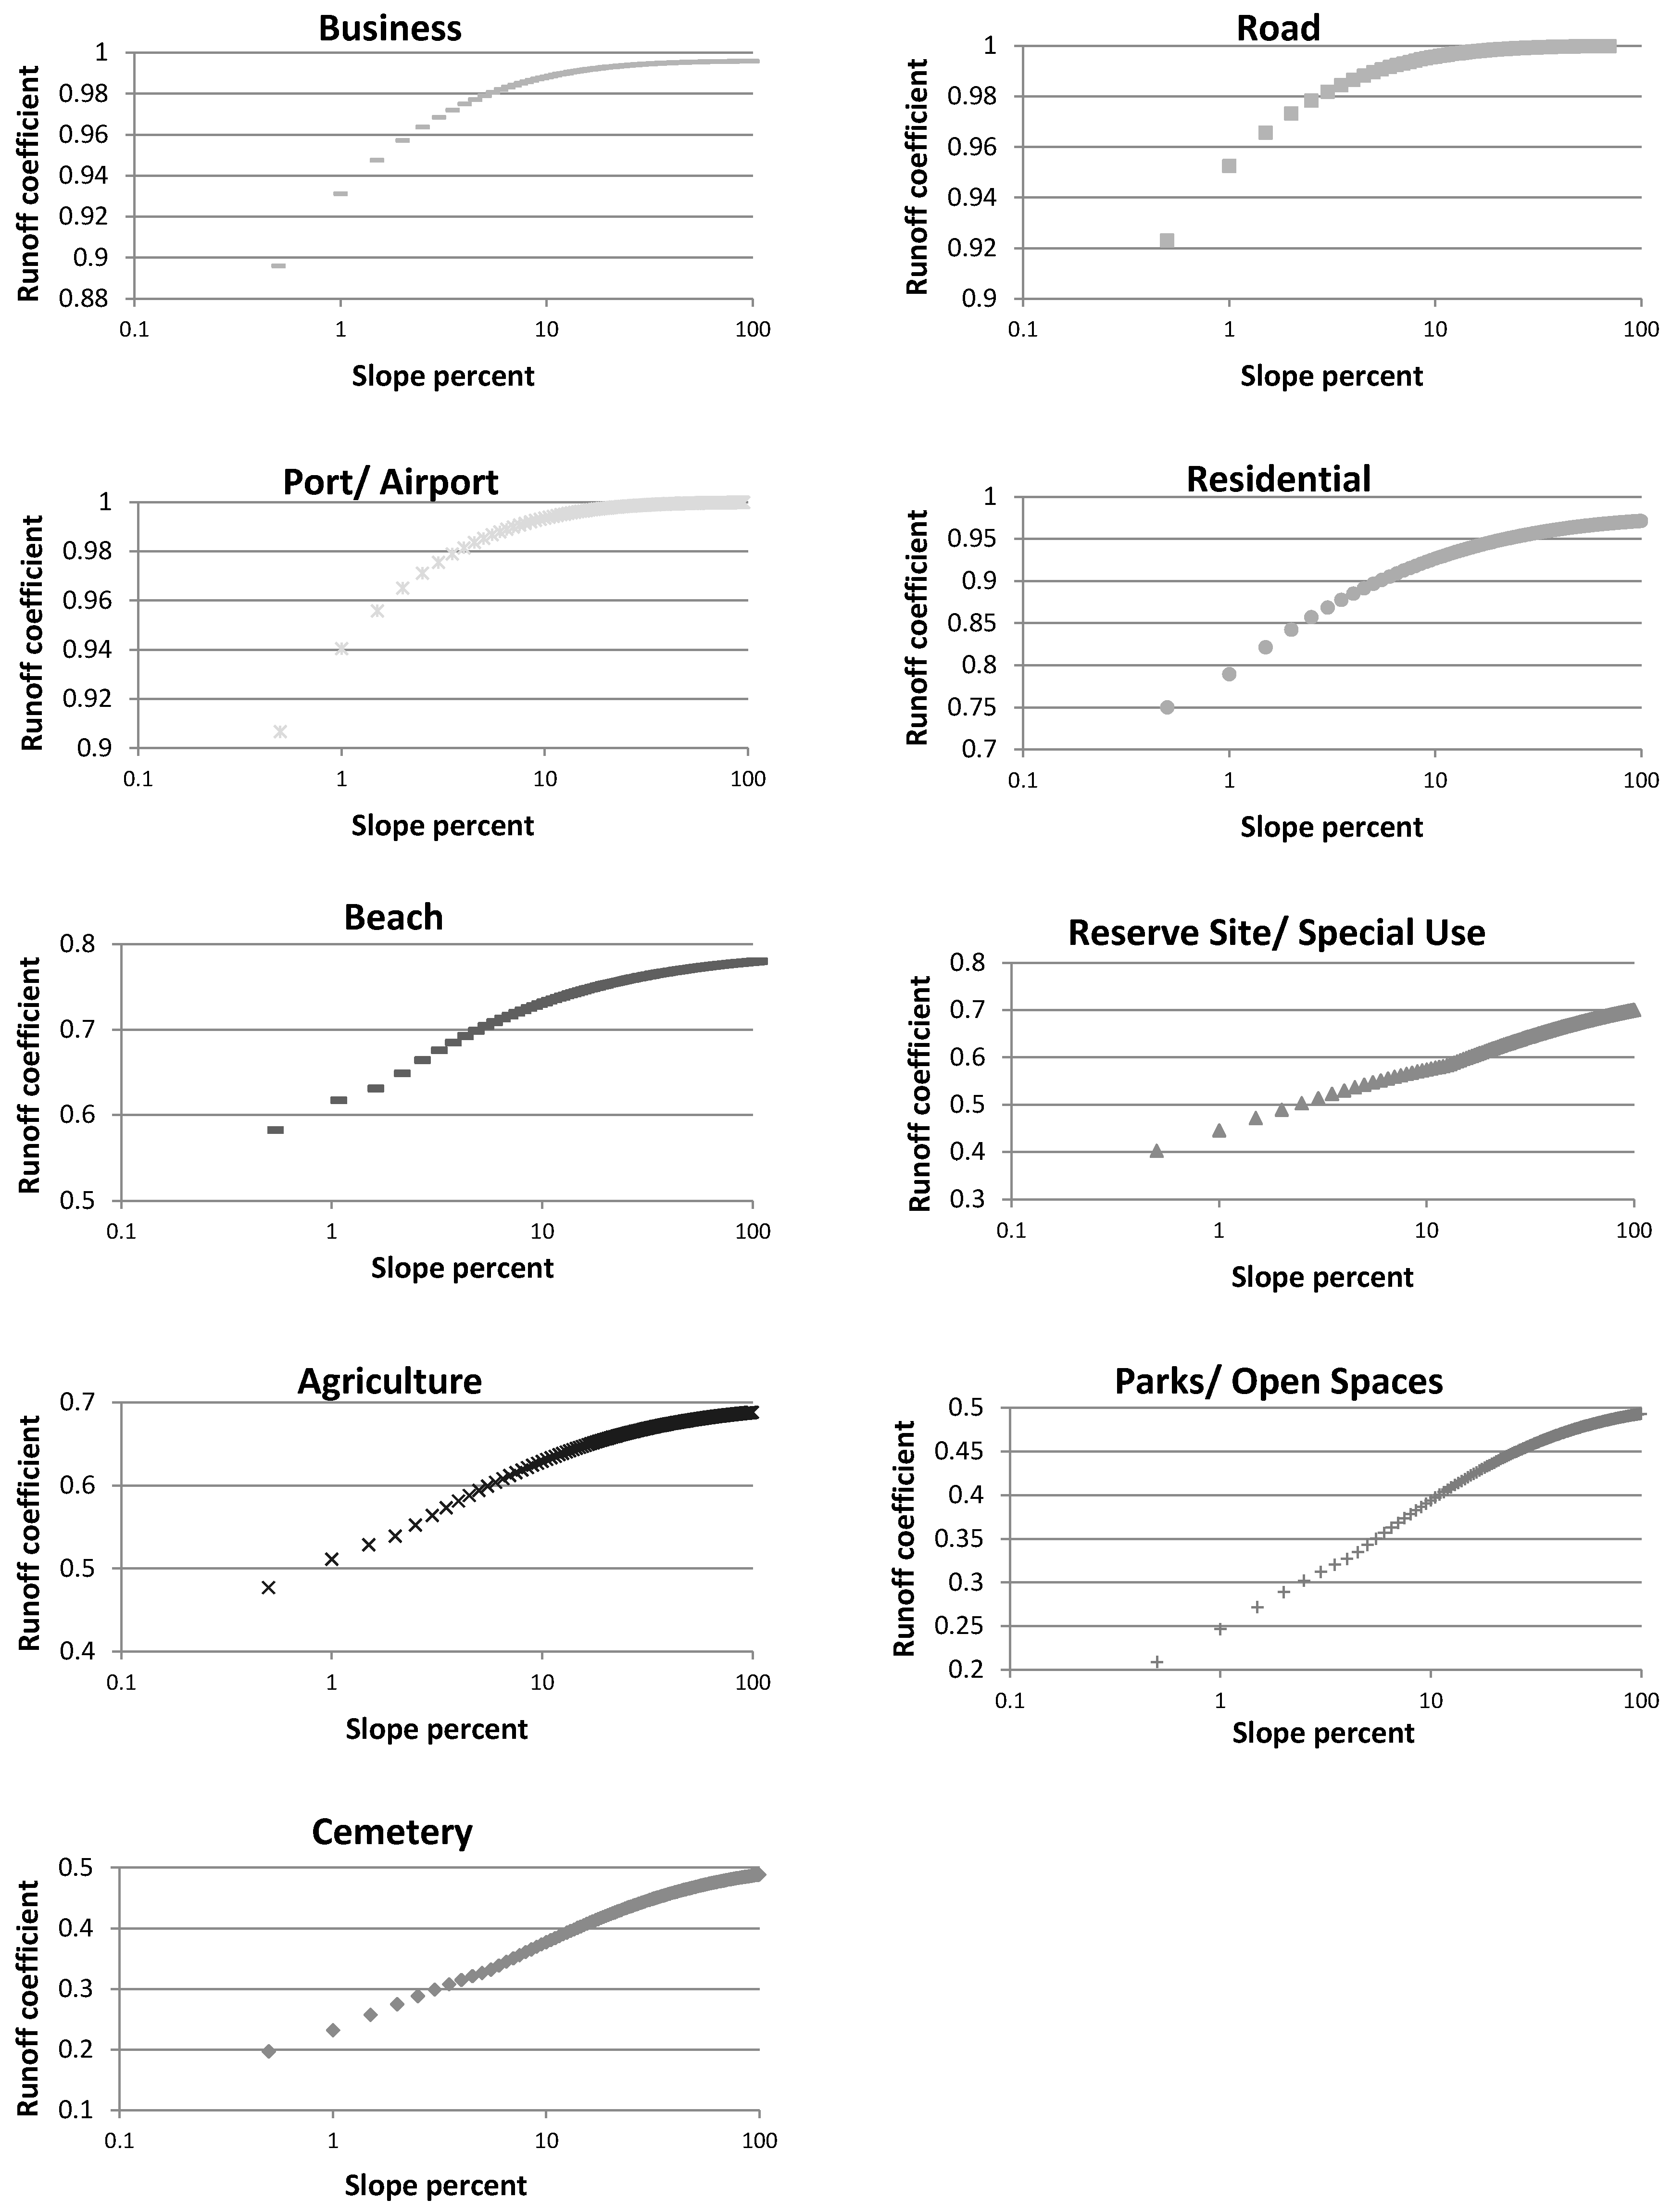
Figure 11.
ABC Waters design features and detention facilities implemented in GWD.
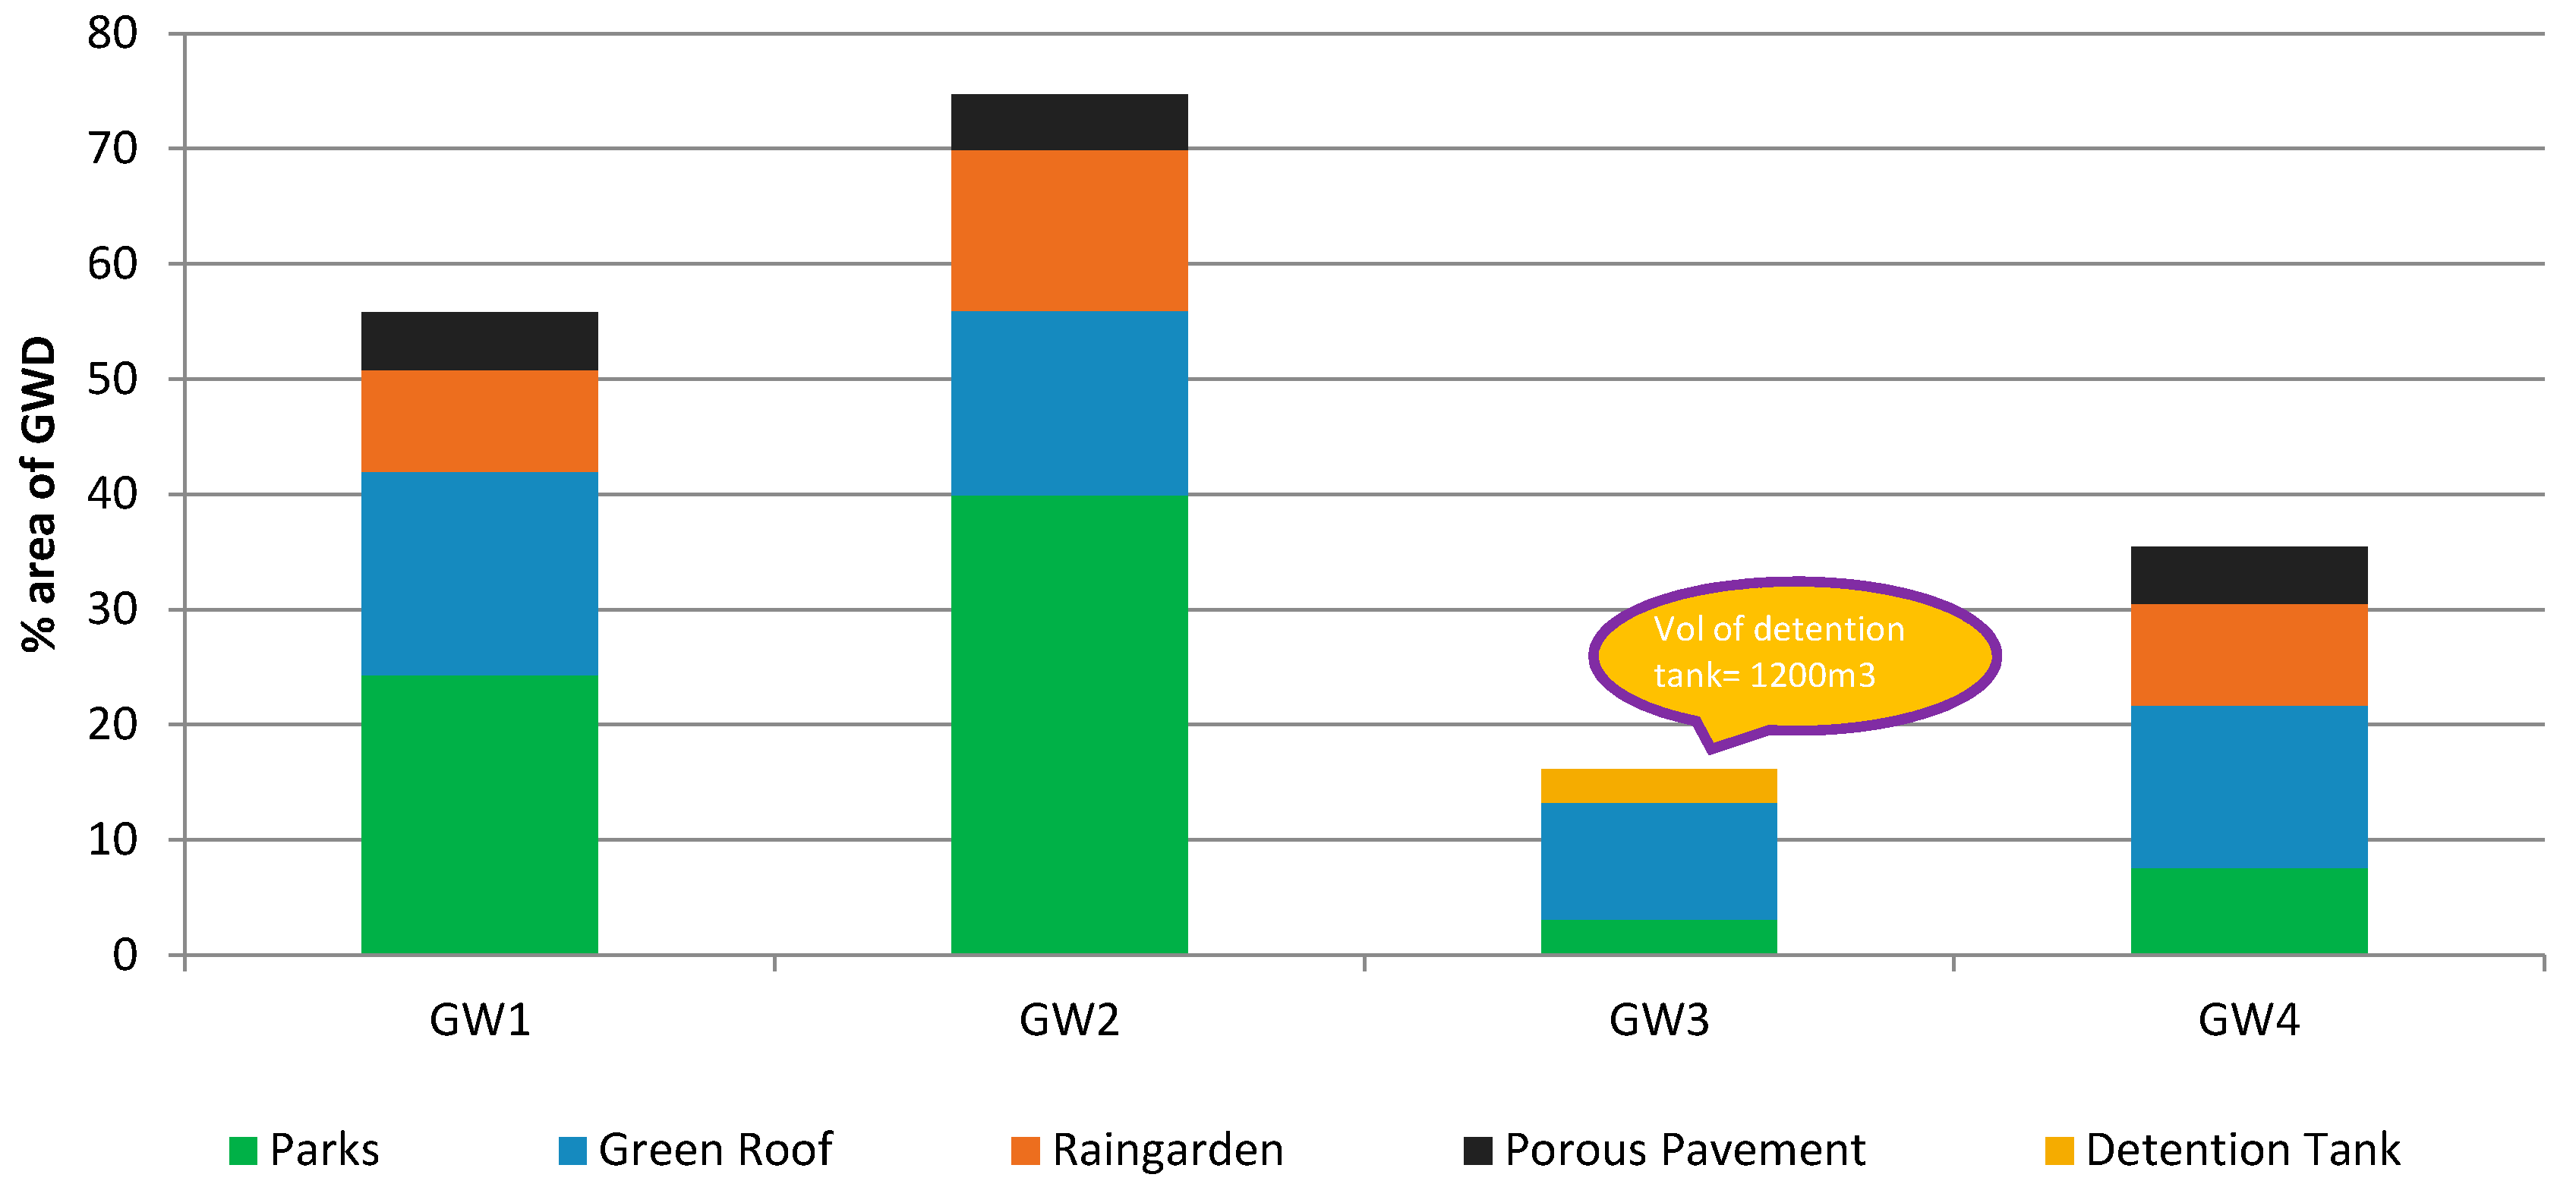
Figure 12.
ABC Waters design features and detention facilities implemented in TSC.

Figure 13.
Discharge at Sungei Api Api outfall.

Figure 14.
Discharge at Sungei Peng Siang outfall.
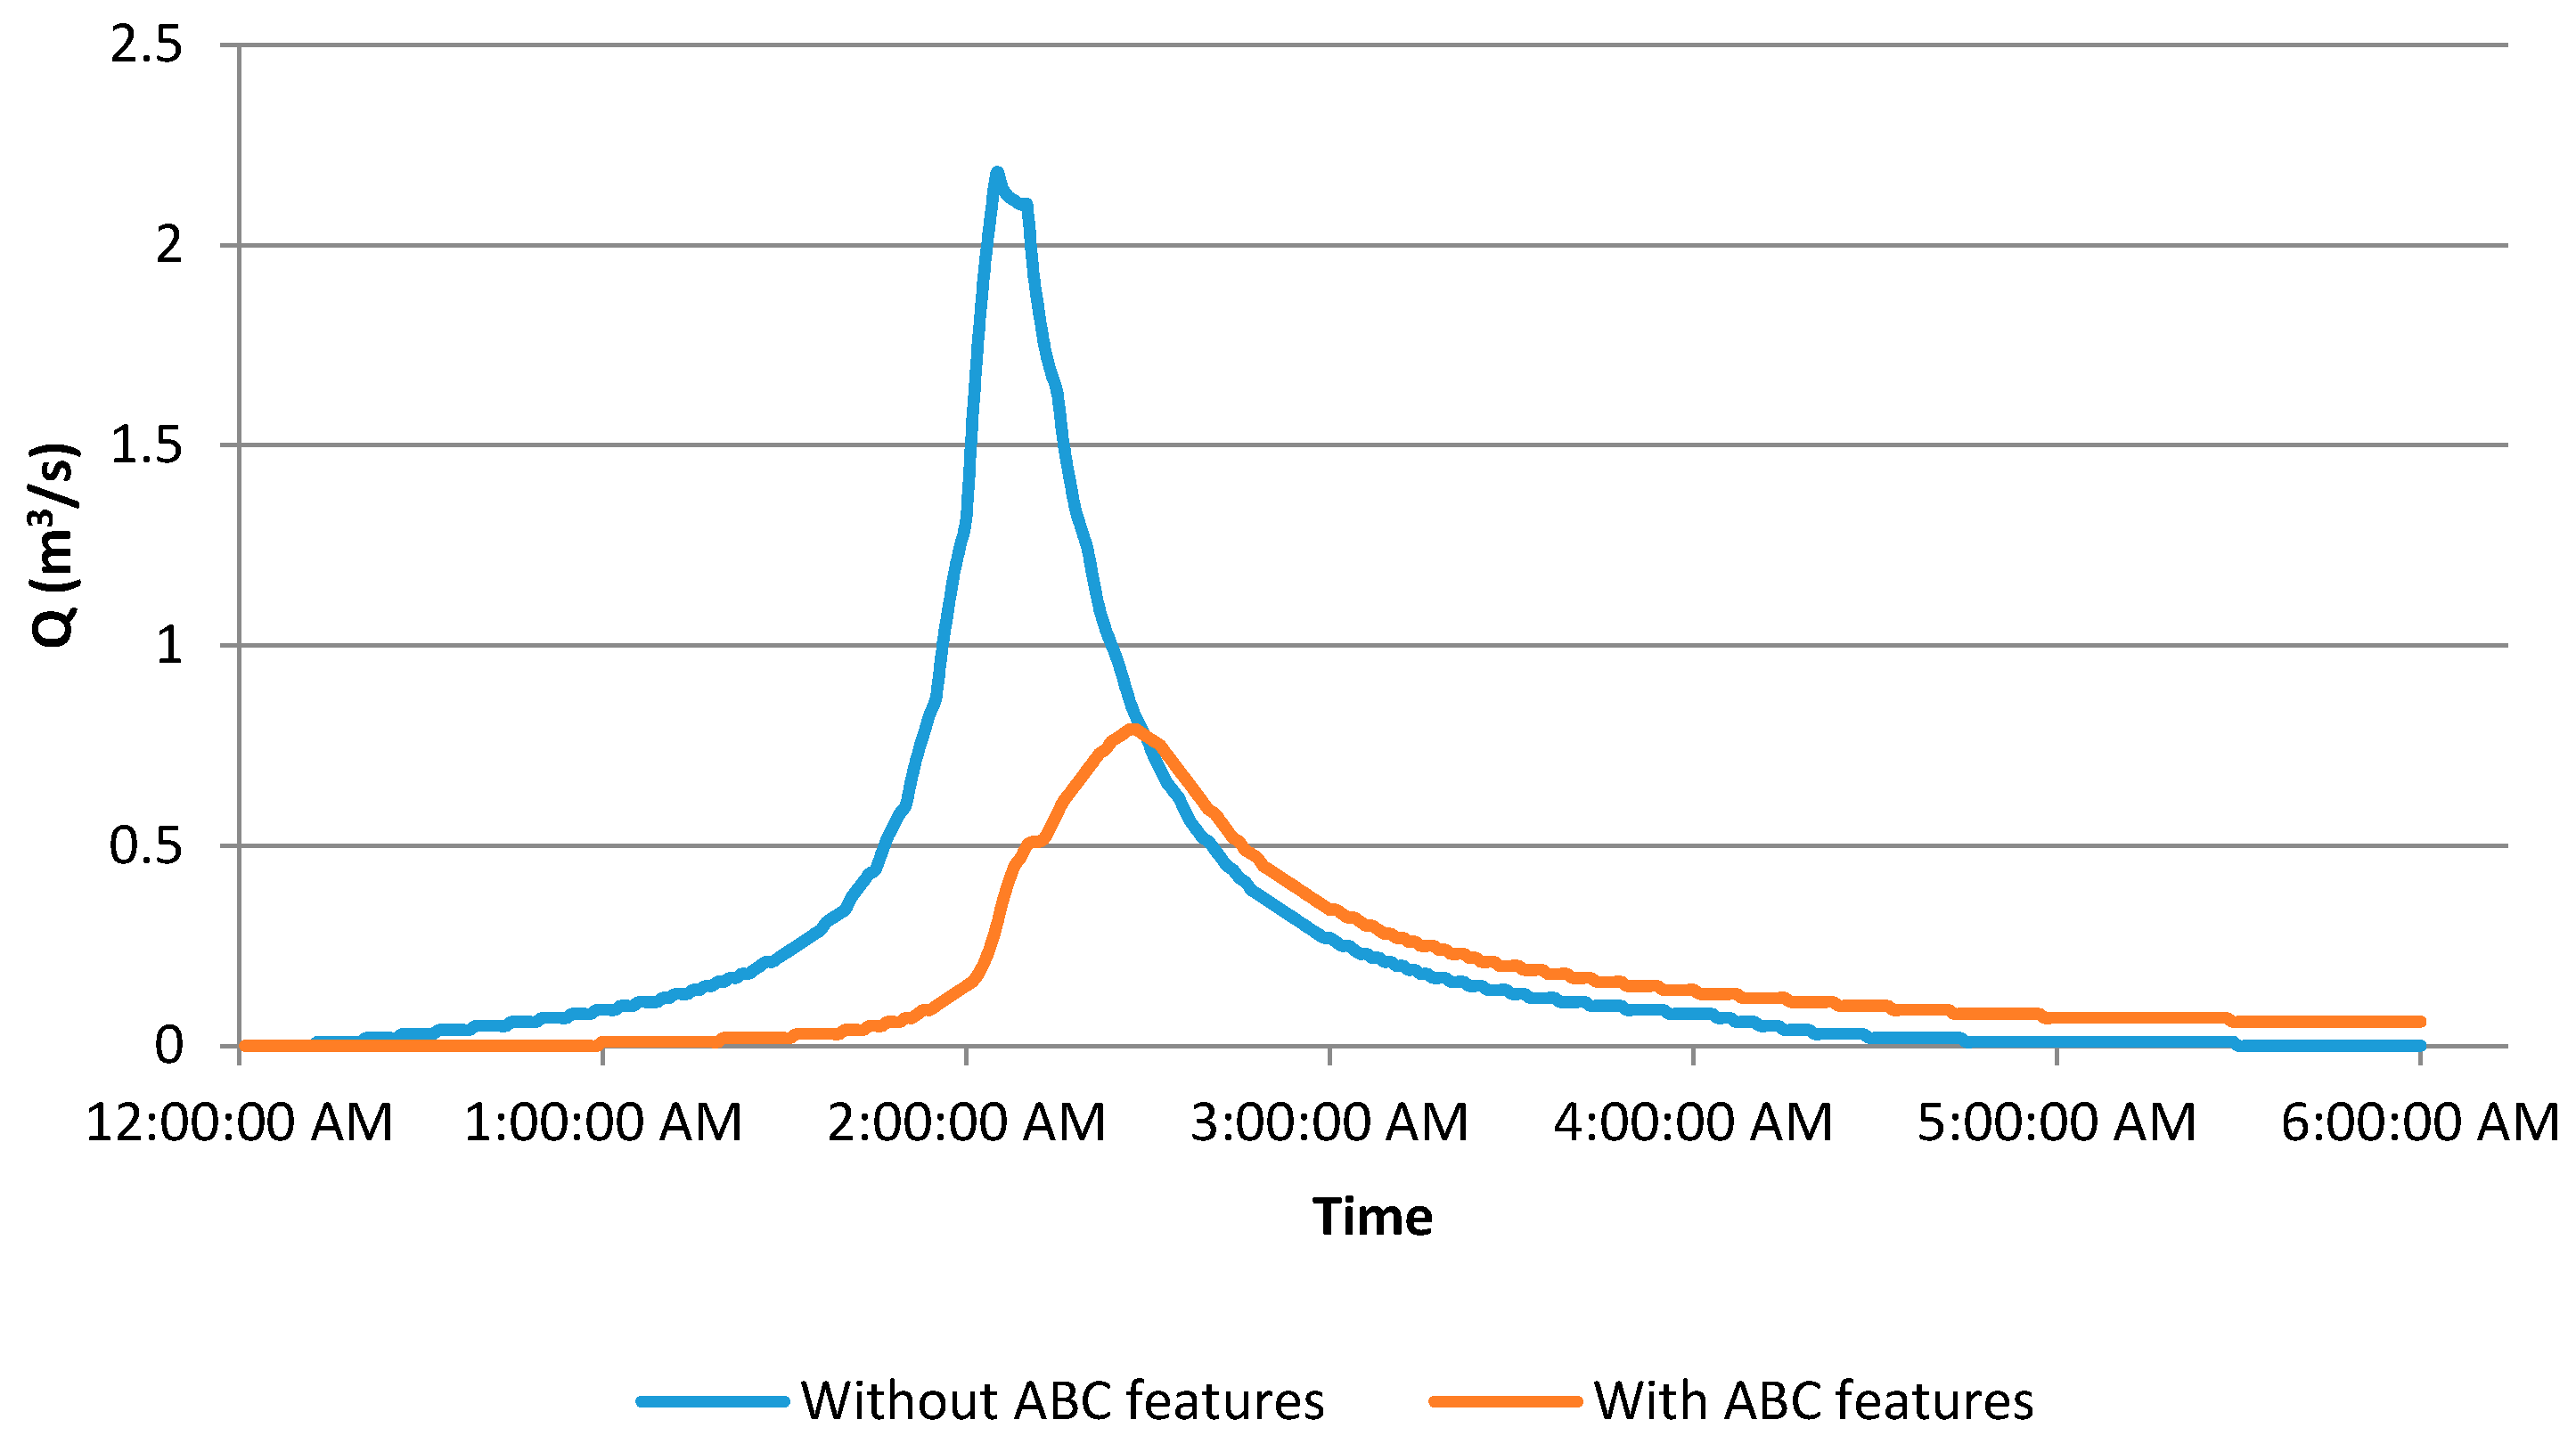
Figure 15.
Reduction in runoff coefficient vs. amount of features incorporated.

Figure 16.
Percentage reduction in C for every SGD$10,000 of features incorporated.

Table 1.
C-values indicated in PUB’s Code of Practice on Surface Water Drainage [8].
Table 1.
C-values indicated in PUB’s Code of Practice on Surface Water Drainage [8].
| Characteristics of Catchment When Fully Developed | Runoff Coefficient (C) |
|---|---|
| Roads, highways, airport runways, paved areas | 1.00 |
| Urban areas fully and closely built up | 0.90 |
| Residential/industrial areas densely built up | 0.80 |
| Residential/industrial areas not densely built up | 0.65 |
| Rural areas with fish ponds and vegetable gardens | 0.45 |
Note: For catchments with composite land use or surface characteristics, a weighted value of C may be adopted. Singapore’s National Water Agency (PUB).
Table 2.
C values for different land uses and slopes in Singapore.
| Road | Port/Airport | Business | Residential | Beach | Agriculture | Reserve Site/Special Use | Parks/Open Spaces | Cemetery | |||||||||
|---|---|---|---|---|---|---|---|---|---|---|---|---|---|---|---|---|---|
| Slope % | C | Slope % | C | Slope % | C | Slope % | C | Slope % | C | Slope % | C | Slope % | C | Slope % | C | Slope % | C |
| 0 to 0.5 | 0.92 | 0 to 0.5 | 0.91 | 0 to 0.5 | 0.90 | 0 to 0.5 | 0.75 | 0 to 0.5 | 0.58 | 0 to 0.5 | 0.48 | 0 to 0.5 | 0.40 | 0 to 0.5 | 0.21 | 0 to 0.5 | 0.20 |
| 0.5 to 1 | 0.95 | 0.5 to 1 | 0.94 | 0.5 to 1 | 0.93 | 0.5 to 1 | 0.79 | 0.5 to 1 | 0.62 | 0.5 to 1 | 0.51 | 0.5 to 1 | 0.45 | 0.5 to 1 | 0.25 | 0.5 to 1 | 0.23 |
| 1 to 2 | 0.97 | 1 to 1.5 | 0.96 | 1 to 1.5 | 0.95 | 1 to 1.5 | 0.82 | 1 to 1.5 | 0.63 | 1 to 1.5 | 0.53 | 1 to 1.5 | 0.47 | 1 to 1.5 | 0.27 | 1 to 1.5 | 0.26 |
| 2 to 3.5 | 0.98 | 1.5 to 2.5 | 0.97 | 1.5 to 2.5 | 0.96 | 1.5 to 2 | 0.84 | 1.5 to 2 | 0.65 | 1.5 to 2 | 0.54 | 1.5 to 2 | 0.49 | 1.5 to 2 | 0.29 | 1.5 to 2 | 0.27 |
| 3.5 to 8 | 0.99 | 2.5 to 4.5 | 0.98 | 2.5 to 4 | 0.97 | 2 to 2.5 | 0.86 | 2 to 2.5 | 0.66 | 2 to 2.5 | 0.55 | 2 to 2.5 | 0.50 | 2 to 2.5 | 0.30 | 2 to 2.5 | 0.29 |
| 8 to 100 | 1.00 | 4.5 to 10 | 0.99 | 4 to 7 | 0.98 | 2.5 to 3 | 0.87 | 2.5 to 3.5 | 0.68 | 2.5 to 3 | 0.56 | 2.5 to 3 | 0.51 | 2.5 to 3 | 0.31 | 2.5 to 3 | 0.30 |
| 10 to 100 | 1 | 7 to 35 | 0.99 | 3 to 3.5 | 0.88 | 3.5 to 4 | 0.69 | 3 to 3.5 | 0.57 | 3 to 3.5 | 0.52 | 3 to 3.5 | 0.32 | 3 to 4 | 0.31 | ||
| 35 to 100 | 1 | 3.5 to 4.5 | 0.89 | 4 to 5 | 0.70 | 3.5 to 4 | 0.58 | 3.5 to 4 | 0.53 | 3.5 to 4.5 | 0.33 | 4 to 4.5 | 0.32 | ||||
| 4.5 to 5 | 0.90 | 5 to 6 | 0.71 | 4 to 5 | 0.59 | 4 to 5 | 0.54 | 4.5 to 5 | 0.34 | 4.5 to 5 | 0.33 | ||||||
| 5 to 7 | 0.91 | 6 to 7 | 0.72 | 5 to 6 | 0.60 | 5 to 6 | 0.55 | 5 to 6 | 0.36 | 5 to 6 | 0.34 | ||||||
| 7 to 9 | 0.92 | 7 to 10 | 0.73 | 6 to 7 | 0.61 | 6 to 7 | 0.56 | 6 to 7 | 0.37 | 6 to 7 | 0.35 | ||||||
| 9 to 10 | 0.93 | 10 to 20 | 0.75 | 7 to 9 | 0.62 | 7 to 10 | 0.57 | 7 to 8 | 0.38 | 7 to 8 | 0.36 | ||||||
| 10 to 15 | 0.94 | 20 to 30 | 0.76 | 9 to 10 | 0.63 | 10 to 15 | 0.60 | 8 to 10 | 0.39 | 8 to 9 | 0.37 | ||||||
| 15 to 25 | 0.95 | 30 to 50 | 0.77 | 10 to 15 | 0.65 | 15 to 20 | 0.62 | 10 to 15 | 0.42 | 9 to 10 | 0.38 | ||||||
| 25 to 50 | 0.96 | 50 to 100 | 0.78 | 15 to 25 | 0.66 | 20 to 25 | 0.63 | 15 to 20 | 0.44 | 10 to 15 | 0.41 | ||||||
| 50 to 100 | 0.97 | 25 to 40 | 0.67 | 25 to 30 | 0.64 | 20 to 25 | 0.45 | 15 to 20 | 0.42 | ||||||||
| 40 to 50 | 0.68 | 30 to 35 | 0.65 | 25 to 35 | 0.46 | 20 to 25 | 0.44 | ||||||||||
| 50 to 100 | 0.69 | 35 to 40 | 0.66 | 35 to 40 | 0.47 | 25 to 35 | 0.45 | ||||||||||
| 40 to 50 | 0.67 | 40 to 50 | 0.48 | 35 to 40 | 0.46 | ||||||||||||
| 50 to 100 | 0.70 | 50 to 100 | 0.49 | 40 to 50 | 0.47 | ||||||||||||
| 50 to 100 | 0.49 | ||||||||||||||||
Table 3.
Effectiveness of ABC Waters features and detention facilities in reducing C values in Green Walk District and Tengah Subcatchment.
Table 3.
Effectiveness of ABC Waters features and detention facilities in reducing C values in Green Walk District and Tengah Subcatchment.
| Subcatchment ID | Area of Subcatchment (ha) | Initial C Value | Area of Green Roof (% Area of Subcatchment) | % Reduction in C Values (Green Roofs) | Area of Rain Gardens (% Area of Subcatchment) | % Reduction in C Values (Rain Gardens) | Area of Porous Pavement (% Area of Subcatchment) | % Reduction in C Values (Porous Pavements) | Area of Detention Tanks (% Area of Subcatchment) | % Reduction in C Values (Detention Tanks) |
|---|---|---|---|---|---|---|---|---|---|---|
| GW1 | 3.4 | 0.67 | 17.7 | 3 | 8.8 | 9.2 | 5 | 5.1 | - | - |
| GW2 | 2.5 | 0.72 | 16 | 4.2 | 14 | 13 | 4.8 | 6.7 | - | - |
| GW3 | 6.9 | 0.60 | 10.1 | 0 | 0 | 0 | 0 | 0 | 2.9 (1200 m3) | 8.3 |
| GW4 | 2.83 | 0.66 | 14.1 | 3 | 8.83 | 7.8 | 5 | 6.8 | - | - |
| C1 | 1.01 | 0.9 | 39.6 | 8.9 | 5 | 8.9 | 3 | 3.7 | 2.8 (190 m3) | 38.9 |
| C2 | 3 | 0.9 | 13.3 | 17.8 | 10 | 10.8 | 5 | 4.5 | 2.7 (560 m3) | 11.1 |
| C3 | 2 | 0.9 | 45 | 10 | 30 | 32 | - | - | - | - |
| C4 | 0.88 | 0.9 | 45.5 | 7.8 | 2.8 | 4.8 | 2.3 | 5.1 | 3.8 (165 m3) | 32 |
| C5 | 1.52 | 0.9 | 13.2 | 0 | 13.2 | 13.8 | 3.3 | 3.7 | 16.5 (175 m3) (240 m3—water roof) | 30.8 |
| C6 | 0.65 | 0.9 | - | - | - | - | 29.2 | 46.7 | - | - |
© 2017 by the authors. Licensee MDPI, Basel, Switzerland. This article is an open access article distributed under the terms and conditions of the Creative Commons Attribution (CC BY) license (http://creativecommons.org/licenses/by/4.0/).
Share and Cite
MDPI and ACS Style
Goh, X.P.; Radhakrishnan, M.; Zevenbergen, C.; Pathirana, A. Effectiveness of Runoff Control Legislation and Active, Beautiful, Clean (ABC) Waters Design Features in Singapore. Water 2017, 9, 627. https://doi.org/10.3390/w9080627
AMA Style
Goh XP, Radhakrishnan M, Zevenbergen C, Pathirana A. Effectiveness of Runoff Control Legislation and Active, Beautiful, Clean (ABC) Waters Design Features in Singapore. Water. 2017; 9(8):627. https://doi.org/10.3390/w9080627
Chicago/Turabian StyleGoh, Xue Ping, Mohanasundar Radhakrishnan, Chris Zevenbergen, and Assela Pathirana. 2017. "Effectiveness of Runoff Control Legislation and Active, Beautiful, Clean (ABC) Waters Design Features in Singapore" Water 9, no. 8: 627. https://doi.org/10.3390/w9080627
Note that from the first issue of 2016, this journal uses article numbers instead of page numbers. See further details here.