
Delineation of Salt Water Intrusion through Use of Electromagnetic-Induction Logging: A Case Study in Southern Manhattan Island, New York


U.S. Geological Survey, New York Water Science Center, 2045 Route 112, Coram, NY 11727, USA
*
Author to whom correspondence should be addressed.
Water 2017, 9(9), 631; https://doi.org/10.3390/w9090631
Submission received: 12 May 2017
/
Revised: 17 August 2017
/
Accepted: 19 August 2017
/
Published: 23 August 2017
(This article belongs to the Special Issue Groundwater Resources and Salt Water Intrusion in a Changing Environment)
Abstract
:Groundwater with chloride concentrations up to 15,000 mg/L has intruded the freshwater aquifer underlying southern Manhattan Island, New York. Historical (1940–1950) chloride concentration data of glacial aquifer wells in the study area indicate the presence of four wedges of saltwater intrusion that may have been caused by industrial pumpage. The limited recharge capability of the aquifer, due to impervious surfaces and the 22.7 million liters per day (mld) of reported industrial pumpage early in the 20th Century was probably the cause for the saltwater intrusion and the persistence of the historical saltwater intrusion wedges over time. Recent drilling of wells provided new information on the hydrogeology and extent of saltwater intrusion of the glacial aquifer overlying bedrock. The new observation wells provided ground-water level, chloride concentration, hydraulic conductivity, and borehole geophysical data of the glacial aquifer. The glacial sediments range in thickness from less than 0.3 m to more than 76.2 m within the study area. A linear relation between Electromagnetic-induction (EM) conductivity log response and measured chloride concentration was determined. Using this relation, chloride concentration was estimated in parts of the glacial aquifer where sampling was not possible. EM logging is an effective tool to monitor changes in saltwater intrusion wedges.
1. Introduction
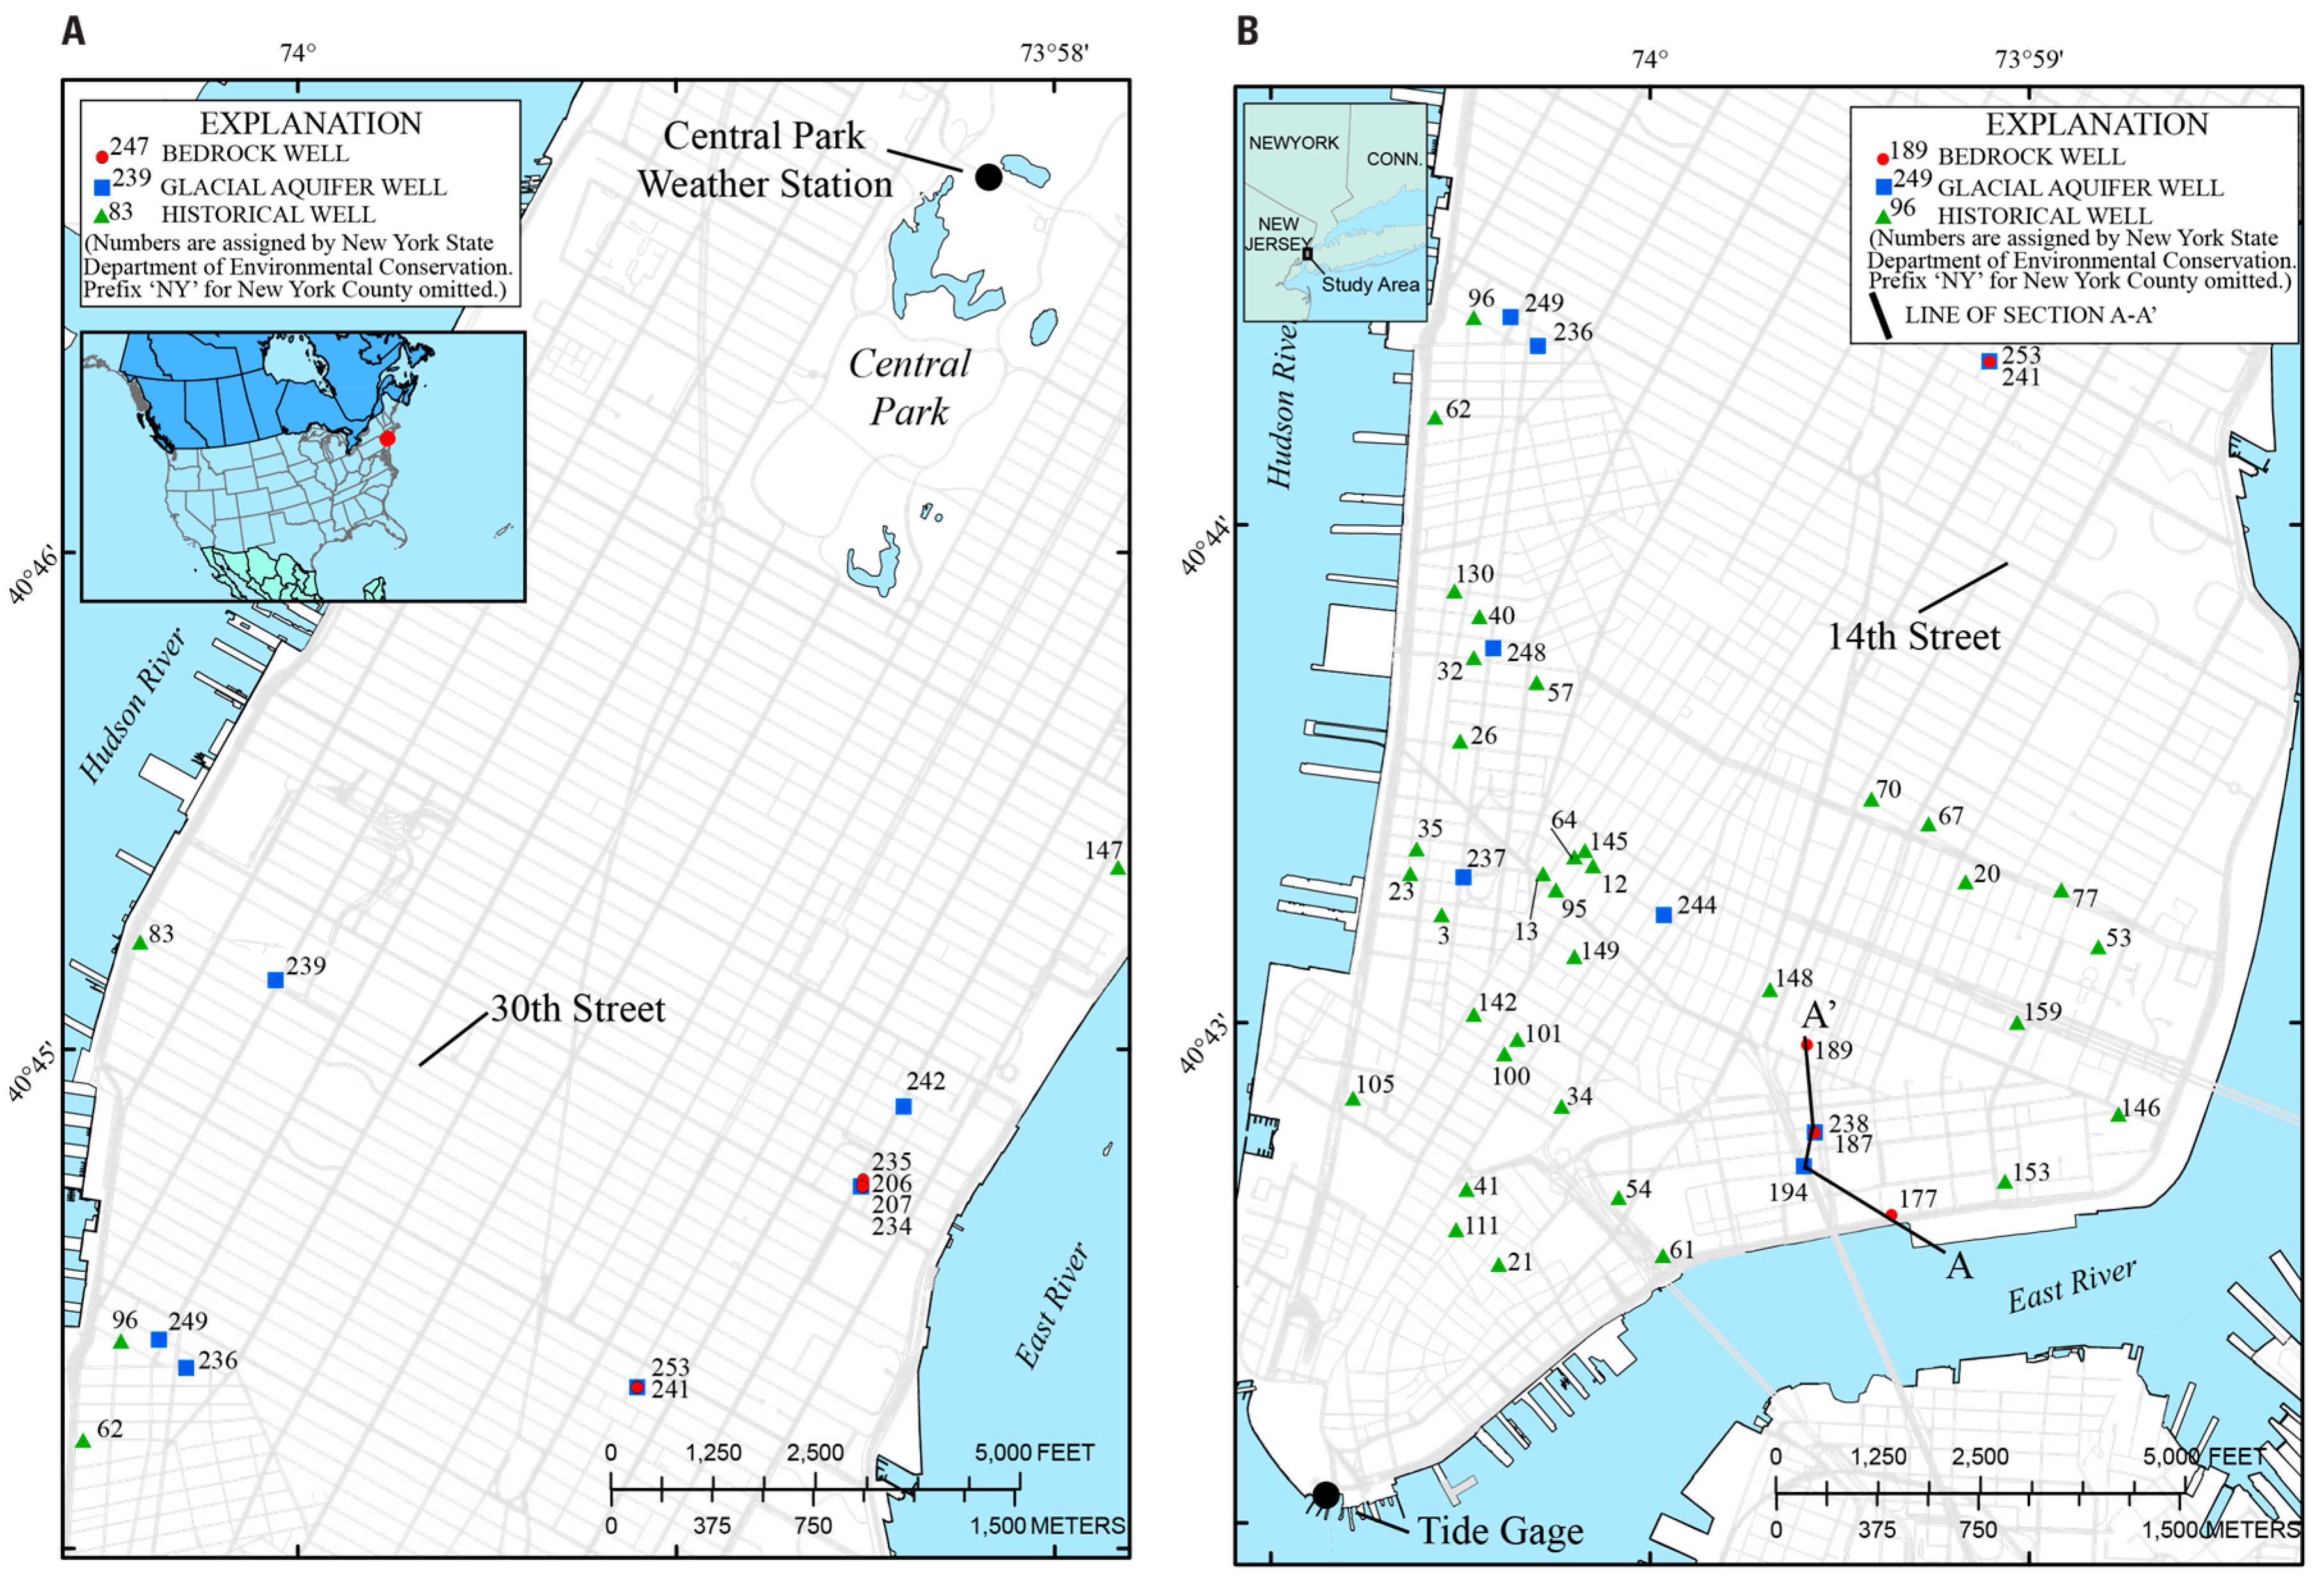
Manhattan Island is about 20.1 km long and 3.2 km wide and consists of unconsolidated deposits ranging from less than 0.3 m thick to more than 76 m thick overlying high-grade metamorphic bedrock in southern Manhattan (Figure 1). The lack of published water-table maps, unknown glacial aquifer characteristics, unknown extent of saltwater intrusion, and the need for a relation to estimate chloride concentration from EM conductivity log response prompted this research. The study area is south of Central Park (Figure 1). Manhattan is bounded on the west by the Hudson River, on the east by the East River, and on the south by New York Harbor (each of these tidal embayments contain saltwater). Industrial pumpage of the aquifer underlying southern Manhattan Island in New York City may have caused the chloride concentration to exceed the U.S. Environmental Protection Agency Secondary Maximum Contaminant Level (SMCL) of 250 mg/L in private-supply wells beginning in 1940–1950 and its effect was observed recently (2004–2006). Perlmutter and Arnow [1] indicate industrial pumpage was as high as 22.7 million liters per day (mld) in 1940–1950. Chloride concentrations in groundwater underlying southern Manhattan Island have remained unchanged, except in some areas where it has increased since the 1940s.
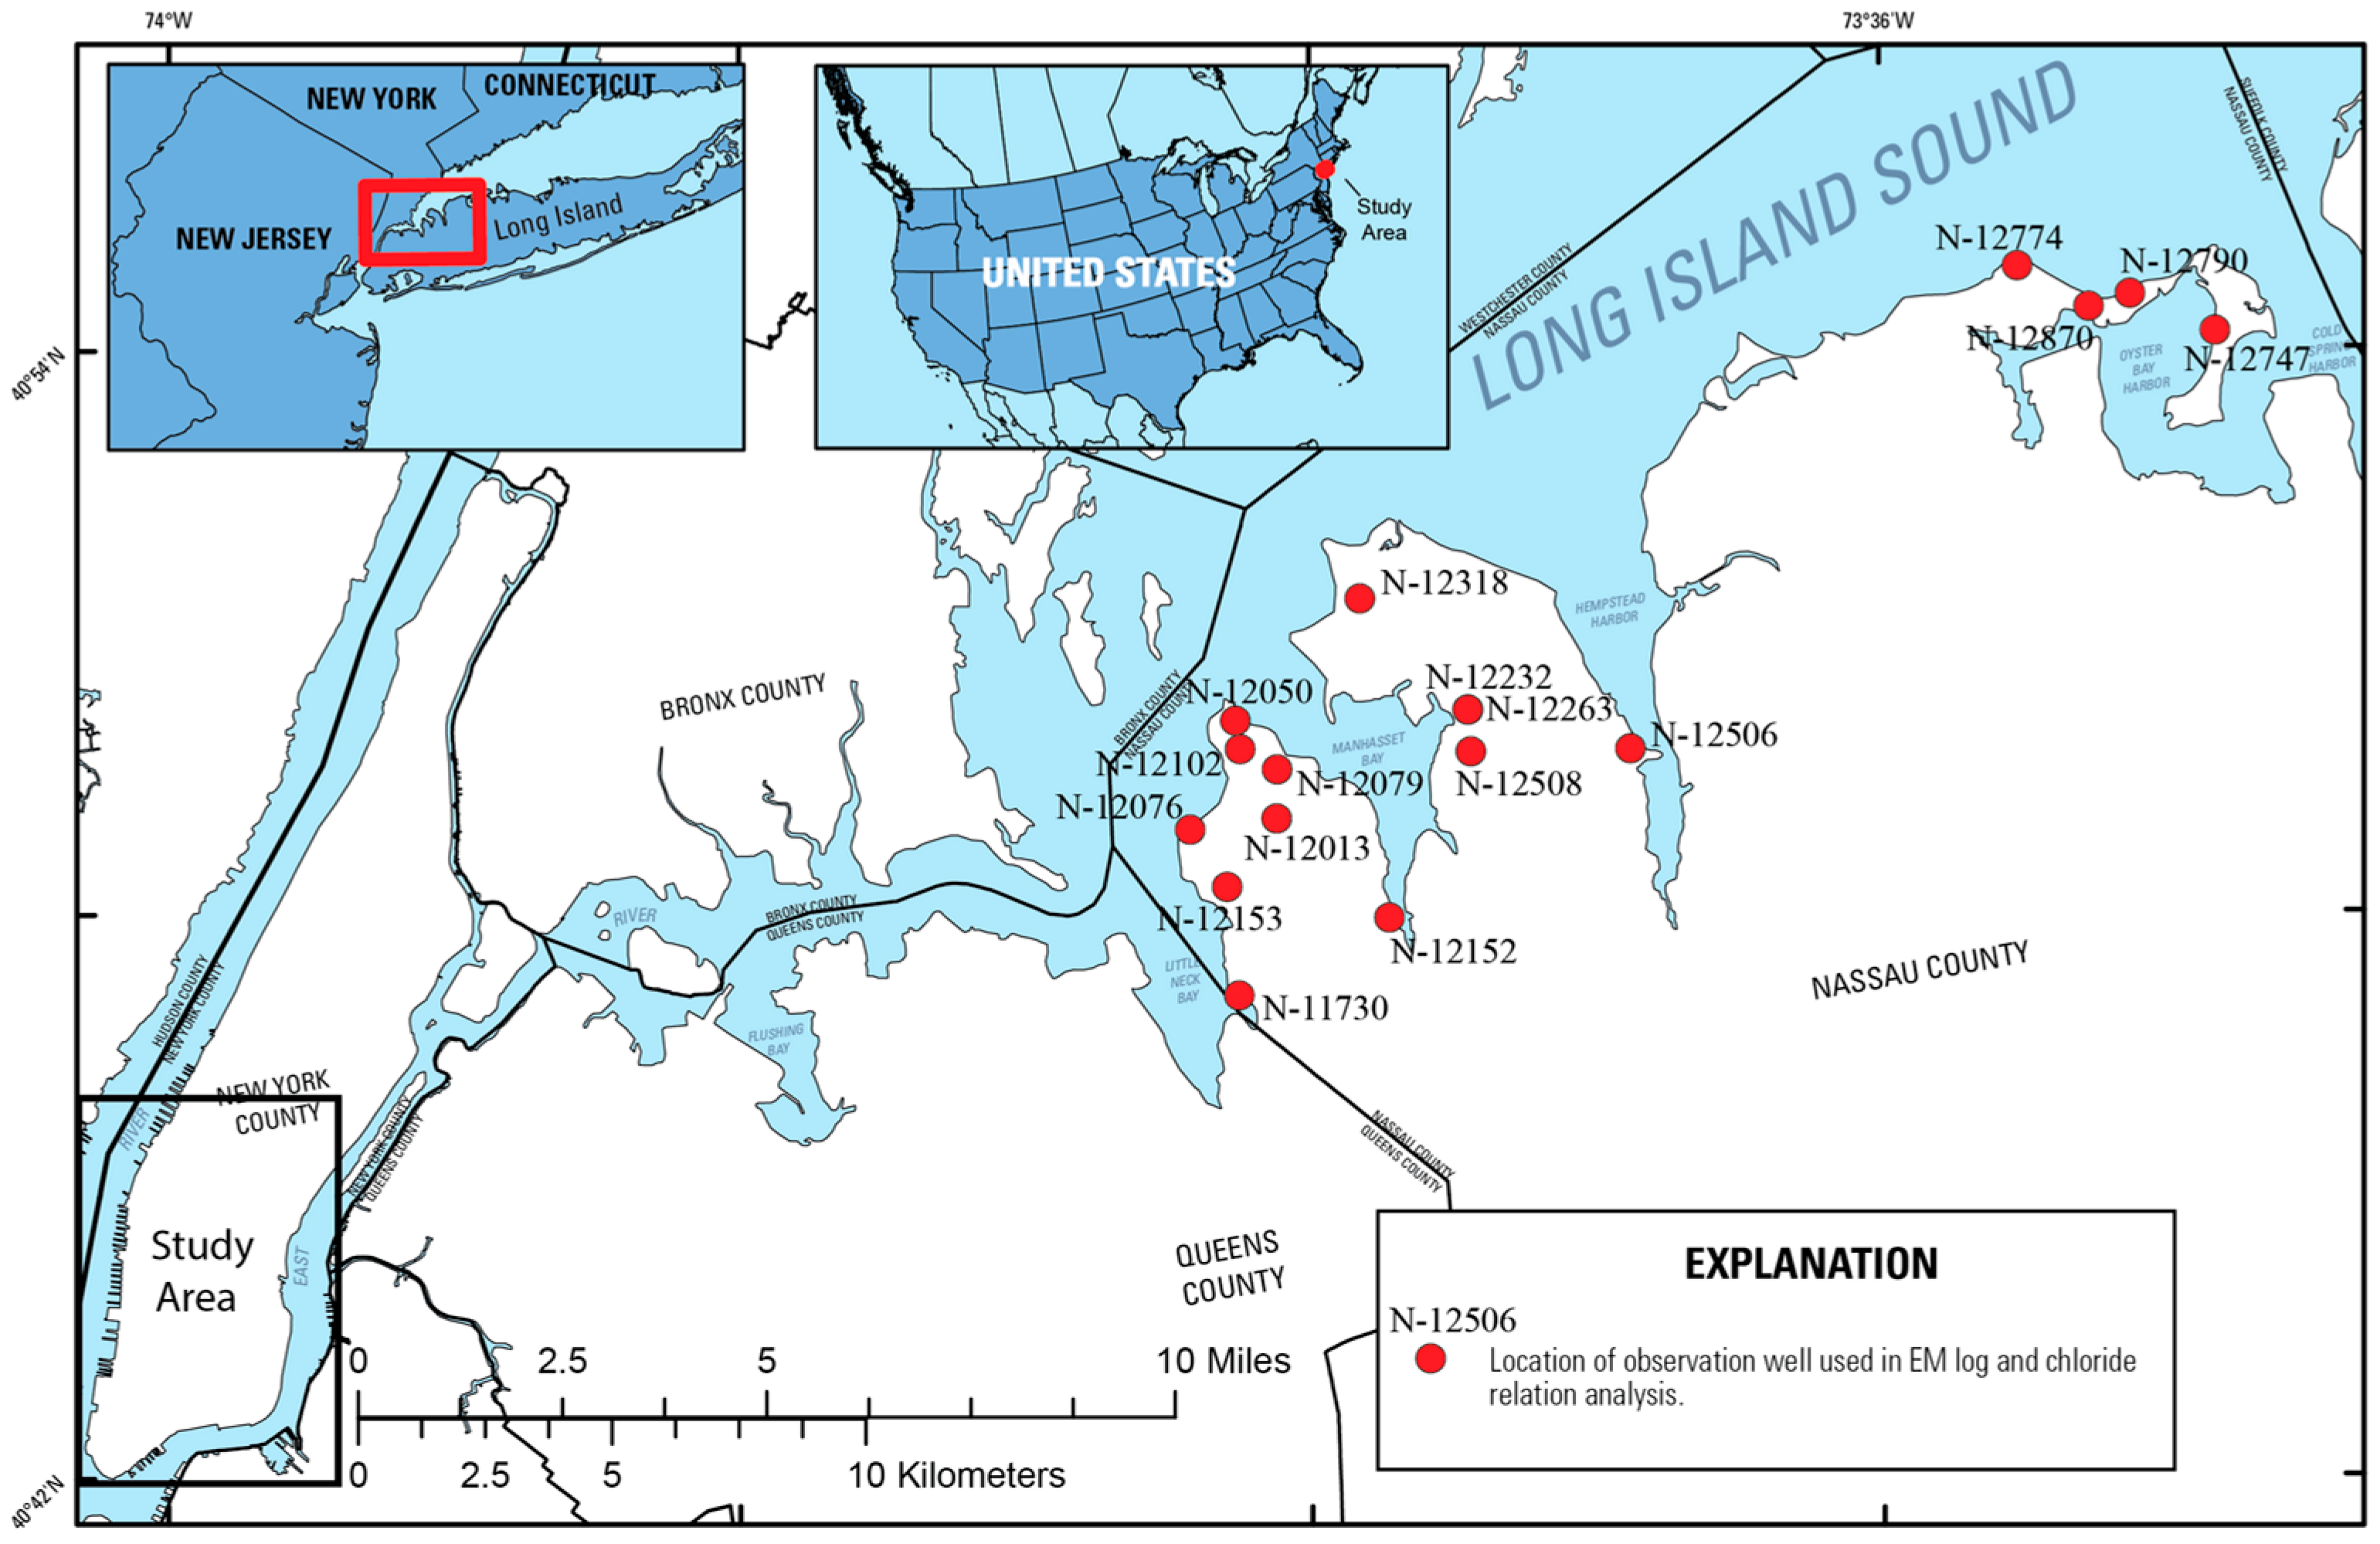
Electromagnetic-induction (EM) logging was completed on a set of observation wells along the southeastern coast of the study area to determine the thickness and extent of saltwater intrusion where screen samples were not possible. A set of polyvinyl-chloride (PVC) cased observation wells in nearby Long Island, New York was used to determine the relation between EM log response and sampled chloride concentration (Figure 2).
2. Historical Background
In 1865, a topographic and hydrographic map of Manhattan Island was completed with the modern street grid superimposed [2]. The Viele [2] map shows flowing streams and wetland areas within the study area indicating a shallow depth to water in the unconsolidated aquifer system. Since that time, intensive urbanization has filled in and covered over most of the recharge areas and surface water expressions, severely reducing recharge to this groundwater flow system in Manhattan Island. Analysis using a Geographic Information System (GIS) indicates more than 90% impervious surfaces within the study area. Examination of extensive wetland areas and numerous flowing streams in the Viele [2] map suggests a much higher water table must have existed in 1865 before the installation of impervious surfaces in the early part of the 20th century. A geologic map with cross sections based upon test borings for several subway tunnels describes the unconsolidated sediments underlying Manhattan as consisting of sand and gravel deposits [3]. In 1905, a compilation of drill core data from various projects in Manhattan Island were used to map the elevation of the bedrock and describe the overlying unconsolidated sediments along several sections [4]. Hobbs describes the sediments in southern Manhattan as consisting of sand, fine sand, and gravels with some of the thickest deposits on Manhattan Island. Perlmutter and Arnow [1] describe the unconsolidated sediments in Manhattan Island as consisting of till and ground moraine in the northern part of the study area and stratified drift in the southern part of the study area. These deposits consist mainly of sand and gravel with localized deposits of silt and clay. Perlmutter and Arnow [1] also list the chloride concentrations of industrial wells screened in the glacial aquifer within the study area. Public-supply of drinking water is supplied via pressurized water tunnels beginning around 1910. The only published records of industrial pumping of the glacial aquifer are not very precise and appear to begin around the beginning of the 20th century and end sometime after 1953 [1]. It appears that within thirty years saltwater intrusion had occurred [1].
Recent drilling (2004–2006) indicates the saturated part of the glacial aquifer in southern Manhattan only extends as far north as about 30th Street, with small localized exceptions in stream channels (small buried valleys) of Pleistocene age to the north (Figure 1). A large deeply eroded channel in southern Manhattan Island dominates the study area and is infilled with saturated sediment that can produce significant quantities of groundwater [1]. Baskerville [5] included these Pleistocene stream channels in his engineering maps of the study area.
3. Methods
Data collected during this study included ground-water levels, chloride concentrations, and EM logs which are available at https://waterdata.usgs.gov/ny/nwis/gw, https://waterdata.usgs.gov/ny/nwis/qw, and https://webapps.usgs.gov/GeoLogLocator/, respectively. In addition, this study utilizes a nearby network of sixteen PVC cased wells on Long Island, New York to collect groundwater samples for chloride concentration measurement from well screens and core samples, and electromagnetic induction log responses from those zones to produce an equation that describes the relation between EM conductivity log response and chloride concentration (Figure 2). This equation was used to estimate chloride concentrations in several PVC cased wells within the study area that did not have screens and groundwater samples for chloride concentration measurement. The aquifers underlying Manhattan Island and nearby Long Island are similar (coastal plain aquifers) in that they are quartz-rich and have very low percentages of fine materials (silts and clays) [6].
3.1. Manhattan Island Well Network
Fourteen wells were used for the collection of ground-water levels, chloride-concentrations, aquifer-test data, and borehole geophysical logs (Figure 1, Table 1). Eleven of the fourteen wells, installed during 2004–2006 in southern Manhattan, were cased with PVC and screened in the glacial aquifer. Three of the eleven PVC wells were deep NX-sized (76 cm-diameter) wells (NY-177, NY-187, and NY-189) drilled by the mud-rotary method in the glacial aquifer and then drilled in bedrock by the diamond-core method to obtain continuous rock core samples (Figure 1, Table 1). These three wells had the unconsolidated sediment portion of the well cased off in PVC material with no screen. A fourth deep PVC cased and screened glacial well (NY-194) was also used (Figure 1). Geophysical log analyses were used on these wells to estimate chloride concentrations in the unconsolidated glacial aquifer. Additional lithologic and thickness data on the glacial aquifer were collected from drilling and gamma logs of 64 bedrock wells drilled throughout southern Manhattan [7].
3.2. Groundwater Levels and Hydraulic Testing
Groundwater levels were measured during borehole-geophysical logging, water-level synoptics, and aquifer tests at the wells (Table 1). Two wells (NY-253 and NY-241) had a continuous digital recorder installed during the study to determine possible hydraulic interconnection with the underlying bedrock flow system at that location (Figure 1). Daily precipitation data were collected by the National Weather Service at the Central Park weather station (Figure 1) [8]. Tidal elevation data were collected by the National Oceanographic and Atmospheric Administration every six minutes at The Battery Park tidal station (Figure 1) [9]. A total of 10 wells had aquifer tests completed using a submersible pump that pumped the wells until the drawdowns stabilized at a constant rate for up to three hours. During the aquifer tests, drawdown was measured and the pumping rate was measured periodically using a calibrated bucket and stopwatch. The time-drawdown and pumping rate data were entered into a computer program for aquifer-test analysis [10].
3.3. Chloride Concentrations
During the drilling of the sixteen Long Island observation wells, samples of groundwater were collected from core samples using the filter-press method using nitrogen gas to force pore-fluids from portions of core material that were uninvaded by drilling mud into sealed test tubes [14]. A calibrated chloride probe was inserted into the samples to obtain a chloride concentration in milligrams per liter. A Thermo-Scientific chloride ion probe calibrated to laboratory standard solutions with an accuracy of 10% was used to measure the concentration of chloride in the ground-water samples at room temperature [15]. Eleven of the Manhattan observation wells had been installed prior to this study and only pumping of groundwater through their screen zones were possible to obtain representative samples for chloride concentration measurement of the glacial aquifer. Pumping usually lasted from two to three hours after hydraulic equilibrium and field water quality parameter data indicated equilibrium was achieved, a representative sample was obtained according to protocols outlined by Koterba and others [16] and analyzed for major inorganic analysis including chloride concentrations at the USGS water quality laboratory [17] (Table 1).
3.4. Borehole-Geophysical Logging
Borehole-geophysical logs used for this study included natural gamma and focused electromagnetic induction (EM conductivity). The logging methods have been described by Archie, 1942, Keys and MacCary, 1971; Serra, 1984; Keys, 1990; McNeill and others, 1996; and Williams and Lane, 1998 [18,19,20,21,22,23]. Gamma logs were used for lithologic and stratigraphic correlation. Gamma log response is generally low in the quartz-rich sand aquifers of Pleistocene and Cretaceous age found within New York City and Long Island coastal plain deposits. The exception was the Raritan clay, a Cretaceous aged clay unit underlying nearby Long Island that exhibits significant gamma responses [6,24]. The unconsolidated sediments underlying Manhattan Island are of Pleistocene age based upon core analysis and previous work [1]. EM conductivity logs provided an electrical conductivity profile of the formation, from which ground-water conductivity and chloride concentrations can be inferred [25,26].
Electromagnetic induction (EM) conductivity logs were collected using a Geonics model EM-39 tool that employs coaxial coil geometry with an intercoil spacing of 50 cm to allow substantial radius of measurement into the formation with excellent vertical resolution [27,28]. Measurement is unaffected by conductive borehole fluid or the presence of plastic casing. The combination of a large conductivity range, high sensitivity and very low noise and drift, allows accurate measurement of subsurface conditions [27].
In the NYC and Long Island area the EM log responses for brackish to saltwater saturated materials are tens to hundreds of times higher than lithologic changes in the regional sediments [29]. EM logs were used to delineate saltwater intrusion in other earlier studies in Florida, and California [30,31]. In the California study, a relation between bulk EM resistivity and pore-fluid conductance was determined for predictive studies [32]. Within the New York City and Long Island regional area, the aquifers and groundwater are highly resistive, therefore EM conductivity log response is very sensitive to slight increases in groundwater conductivity due to increased dissolved solids [29]. A nearby network of sixteen PVC cased wells in the coastal plain sediments on Long Island, NY similar to those encountered on Manhattan Island were used to collect calibrated EM conductivity logs of sections where groundwater samples for chloride concentration measurement were obtained (Table S1 in Supplementary Materials). Gamma log and EM conductivity log responses are typically low in the region’s aquifers due to the high quartz content (Figure 3). Well N-12506, one of the sixteen Long Island observation wells used in this study to produce the EM log response to chloride concentration relation, was used to show how gamma and EM conductivity logs relate to changes in chloride concentration and geology (Figure 3). The chloride concentrations and EM log response from sixteen Long Island observation wells were used to determine the relation between chloride concentration in milligrams per liter (mg/L) and measured EM log response in millisiemens per meter (mS/m) (Figure 4). The main purpose of using the relation between EM conductivity log response and chloride concentration is to allow the conversion of EM log response in wells where chloride sampling is not possible to estimate the chloride concentrations in the aquifer. A similar technique was used in California in PVC cased wells where groundwater samples for chloride concentration measurement were available with EM conductivity logs, and in Florida to map the saltwater interface using surface and borehole EM methods to produce logarithmic equations relating EM response to chloride concentration [25,33].
A linear relation was observed in the data from Long Island wells between EM conductivity log response and chloride concentration collected from screen zones in the well and pore fluid samples obtained from cores during drilling (filter-press) (Figure 4). A least-squares regression was developed to relate changes in EM conductivity to changes in chloride concentration in groundwater from 16 wells using 43 samples (Table S1):
where Cl is the chloride concentration (milligrams per liter) in groundwater from screen zones of wells and filter press samples from cores, and EM is the peak electromagnetic conductivity (millisiemens per meter) from the EM conductivity geophysical log over the screen zone length (6 m) and core sample length.
Cl = 25.26 (EM) + 10.1
The relation between these two variables is significant with an R2 of 0.96 (Figure 4). A p-value of <2.2 × 10⁻¹⁶ indicates significant differences between the two datasets and a t-test value of 33.3 indicates a strong relation [34]. The reason for the strong correlation was due to the consistent EM conductivity log field calibration, and the region’s aquifers that typically consist of high quartz content and low silt and clay concentrations providing minor EM conductivity response from the geology compared to the primary EM conductivity response that was very sensitive to minor increases in chloride concentrations of the groundwater.
4. Hydrogeology of the Glacial Aquifer in Manhattan Island
Analyses of drilling logs, ground-water levels, aquifer-test data, chloride concentrations, and borehole-geophysical logs provide new insight on the hydrogeologic properties of the glacial aquifer in southern Manhattan Island. The term glacial aquifer is introduced in this paper to represent a sequence of unconsolidated Pleistocene-age glacial sediments that overlie the bedrock in southern Manhattan. The sediments consist of gravel, sand, silt, and clay underlain by crystalline bedrock of Proterozoic and Paleozoic age [1,3,4,35,36,37].
4.1. Extent and Thickness of the Glacial Aquifer
The southern Manhattan study area is underlain by unconsolidated glacial drift and till deposits of Pleistocene age throughout most of the study area, except in a few areas in the northern part (near Central Park) where bedrock outcrops are present (Figure 1).
The topography of the northern part of the study area is dominated by the bedrock outcrops and a veneer of soils above them. Drilling data indicate the sediment thins to less than 6 m in a large part of the northern study area north of 30th Street (Figure 1). The sediment thickness increases to 15.2 m or more in very narrow buried valleys in the northern part of the study area (north of 30th Street). In contrast, an extensive buried valley containing over 76 m of sediment was delineated in most of the southernmost part of Manhattan [1,3,4,35,36]. Split-spoon core analysis of a monitoring well (NY-194) near the East River within the southern buried valley indicates stratified-drift deposits consisting of sand and gravel (Figure 1). The gravels are composed of sandstone and diabase transported by glacial action from New Jersey (Figure 1).
4.2. Water-Table Map of the Glacial Aquifer
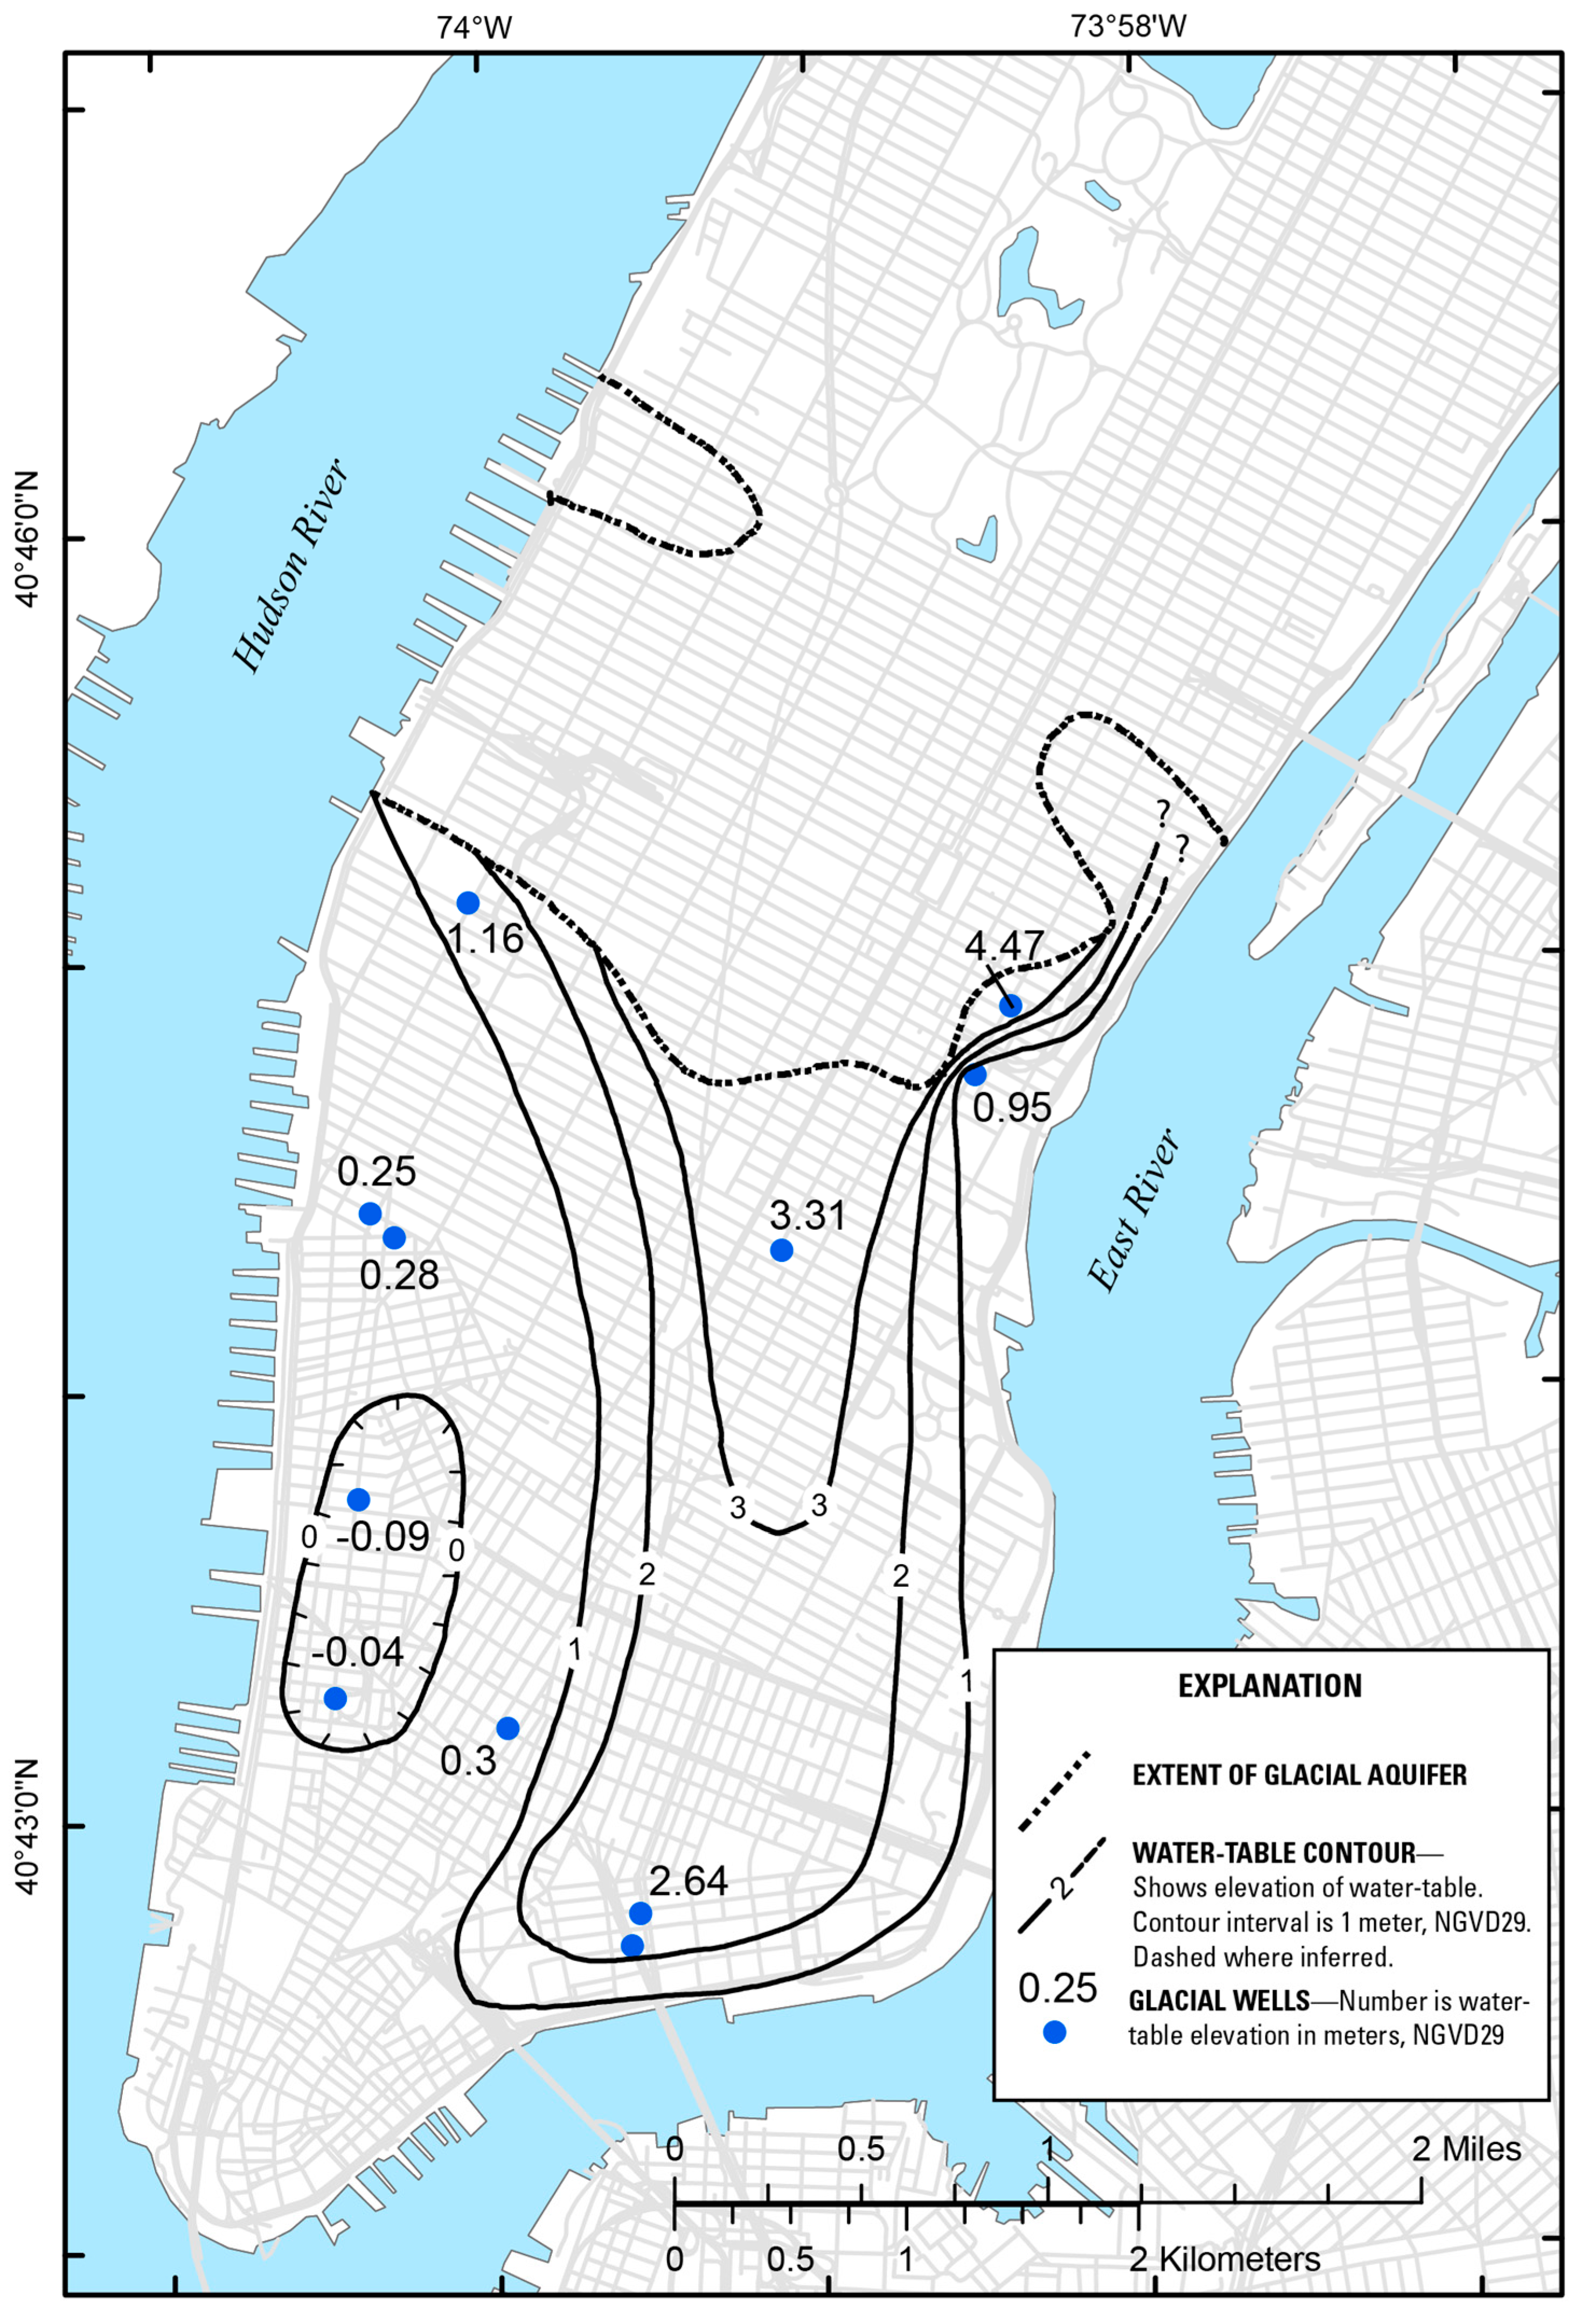
This paper presents the first comprehensive water-table map constructed for the unconsolidated glacial aquifer in southern Manhattan (Figure 5). The presence of a clay unit was indicated in the southwestern-most part of Manhattan and may partially confine groundwater locally at depth. Water-level elevation (hydraulic head) ranged from 4.5 m above National Geodetic Vertical Datum of 1929 (NGVD 29) at NY-242 to −0.09 m (below NGVD 29) at NY-248 (Figure 5, Table 1). The highest water levels occur in the central part of the study area, which appears to be the recharge zone for the glacial aquifer (Figure 5). Groundwater flows from the central part of the study area toward the southern, western, and eastern coastal discharge zones. The ground-water divide in the glacial aquifer appears to follow the central topographic ridge of the island, but is slightly shifted towards the east probably due to the effect of dewatering operations in subway and rail stations located in the southwestern part of the study area (Figure 5). A cone of depression along the southwest part of the study area was indicated in the water-table map and includes wells NY-248 and NY-237 due to the dewatering of the glacial aquifer in the area for subway stations (Figure 1 and Figure 5). The bedrock potentiometric-surface below this area is also depressed suggesting a possible hydraulic interconnection between the glacial aquifer and the bedrock in this area. Leakage from water mains and sewers probably contributes some recharge to the glacial aquifer which is mostly covered by impervious surfaces except in small neighborhood parks.
Water levels digitally recorded in two wells at E22nd Street in the central part of the study area (one screened at 14 m in the glacial aquifer (NY-253), and the other open in fractured-bedrock from 15.2 m to 183 m (NY-241)) indicate similar aquifer responses in both ground-water flow systems to precipitation events (Figure 1, Figure 5 and Figure 6). Both the glacial aquifer and bedrock water levels indicate this area is a recharge area. The glacial aquifer well (NY-253) shows a slight delay in recharge from precipitation as compared to the bedrock well (NY-241) (Figure 1 and Figure 6). The bedrock aquifer well had a slightly higher water elevation (hydraulic head) (0.1 m) than the glacial aquifer well (Figure 6). The slightly higher water level elevation in the bedrock, the faster recharge response to precipitation compared the glacial aquifer at this location, and the large amount of impervious surfaces within the study area suggests the bedrock aquifer may be a source of recharge to the glacial aquifer in this part of Manhattan Island (Figure 1, Figure 5 and Figure 6). The glacial aquifer well (NY-253) does not show clear indications of a tidal influence while the bedrock well (NY-241) does show a small delayed influence (Figure 1 and Figure 6).
Pumping of two bedrock wells, NY-207 and NY-234, along the eastern side of the study area during aquifer testing had no effect on water levels in an adjacent glacial aquifer well NY-235 (Figure 1) [7]. The glacial aquifer appears to be not hydraulically connected to the transmissive bedrock fractures in this area.
4.3. Hydraulic Properties of the Glacial Aquifer
Aquifer tests of the 10 glacial aquifer wells indicate a wide range of aquifer hydraulic conductivity. The estimated hydraulic conductivity of the glacial aquifer ranges from 0.04 to 550 m per day at wells NY-242 and NY-248, respectively (Figure 1 and Table 1). The hydraulic conductivity data of the glacial aquifer in southern Manhattan indicate lower permeable sediments were present along the eastern extent of the aquifer, and the highest were measured in the western part of the study area. The highest values of hydraulic conductivity in the glacial aquifer were also present within the northwestern end of the deep southern buried valley.
The wide range in hydraulic conductivity may be due to the glacial origin of deposition with ground moraine and stratified drift.
5. Extent of Saltwater Intrusion of the Glacial Aquifer in Southern Manhattan Island
Industrial pumpage more than 70 years ago that may have caused significant saltwater intrusion into the glacial aquifer. On nearby Long Island, similar saltwater intrusion wedges were formed due to excessive pumpage of groundwater near coastal saltwater embayments [26,38]. Contouring of historical and current chloride concentration data indicates several wedges of saltwater intrusion in the study area. Borehole-geophysical logging using EM conductivity logs delineated the thickness and provided estimates of chloride concentrations in the most severely intruded saltwater wedge.
5.1. Chloride Concentrations in the Glacial Aquifer in 1940–1950
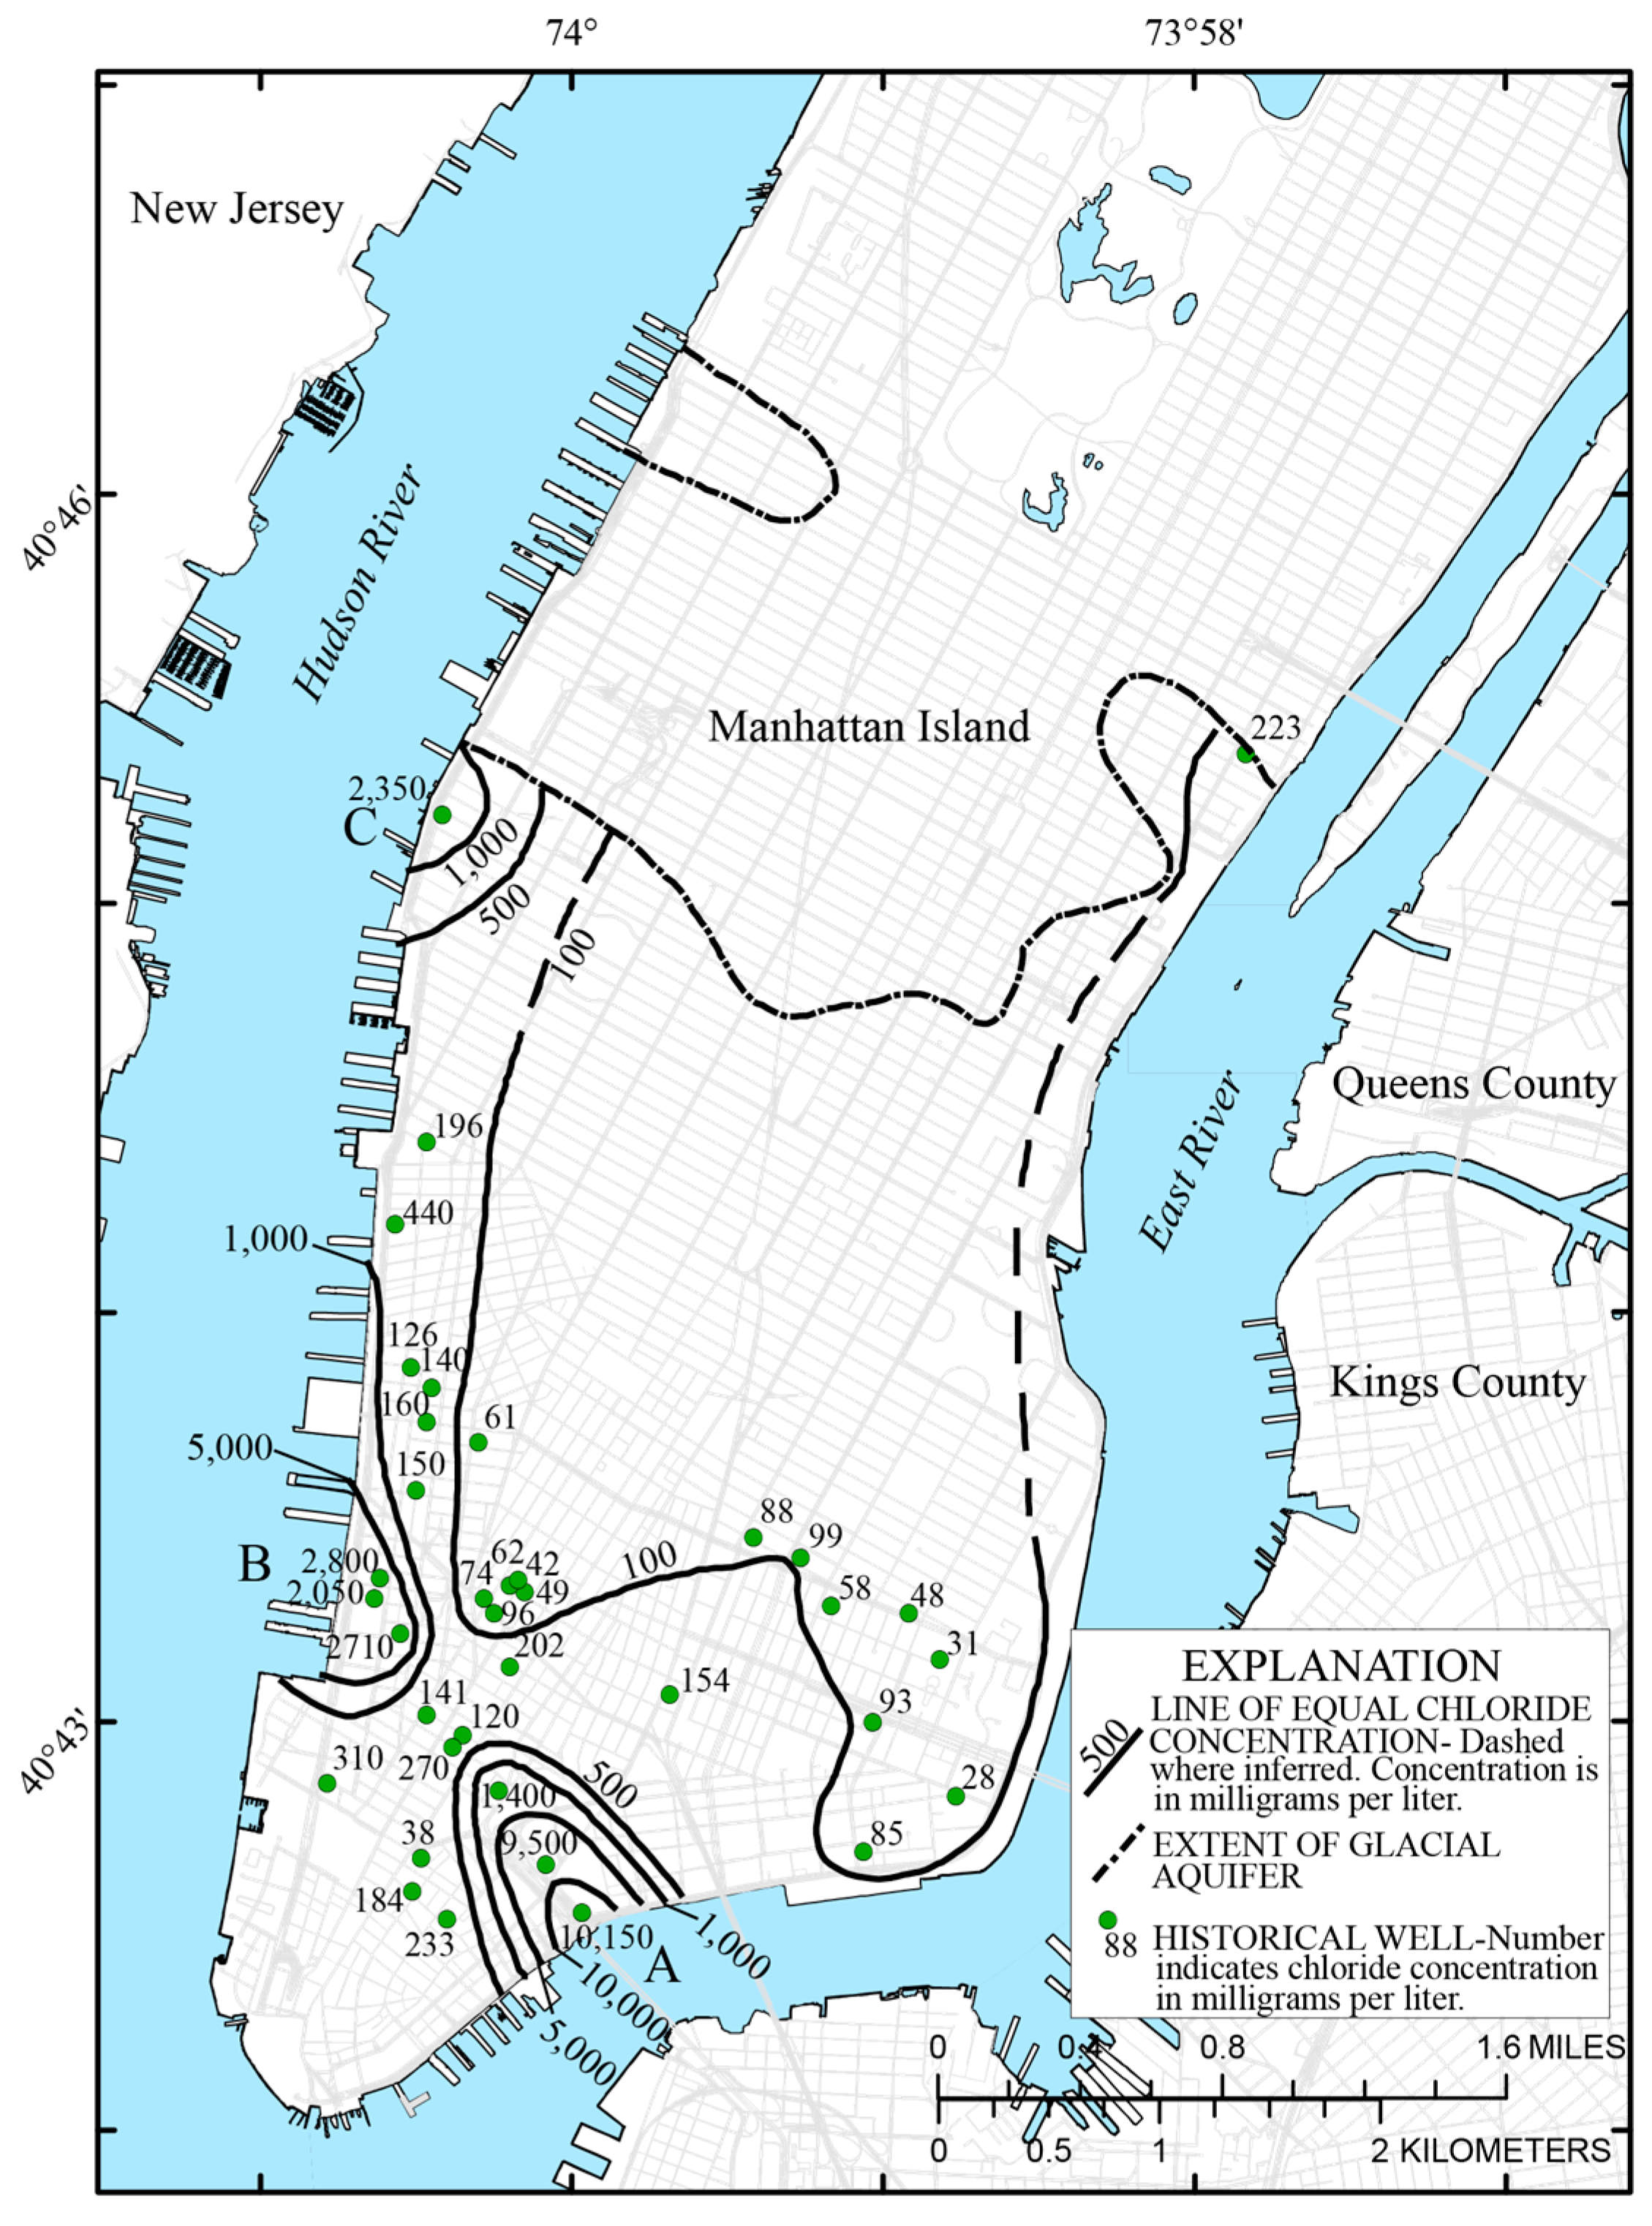
Perlmutter and Arnow [1] reported the location, depth, and chloride concentration of private wells on Manhattan Island, but did not contour the data. Examination of the historical data indicates 37 glacial aquifer wells used for private supply were sampled for chloride concentration from 1940 to 1950 within the study area (Figure 1). When these data are plotted, several wedges of saltwater intrusion are indicated in the first chloride concentration (isochlor map) of the glacial aquifer in southern Manhattan (Figure 7). Industrial pumpage in southern Manhattan during the 1940s–1950s was documented to be as high as 22.7 mld [1]. The limited recharge capability of this aquifer due to impervious surfaces and the extreme industrial pumpage created a severe stress on this system and is the probable mechanism for saltwater intrusion at that time.
Three areas of historical saltwater intrusion are indicated and designated wedges A, B, and C (Figure 7). Historic saltwater wedge A in the southernmost part of the study area had a peak chloride concentration of 10,150 mg/L in well NY-61 and extended to well NY-101 (Figure 1 and Figure 7). Saltwater wedge B is northwest of saltwater wedge A along the Hudson River coastline with a peak chloride concentration of 2800 mg/L at well NY-35. A third wedge of saltwater intrusion, wedge C, was indicated along the northwestern-most part of the glacial aquifer with a peak chloride concentration at well NY-83 of 2350 mg/L (Figure 1 and Figure 7). Significant industrial pumpage from the glacial aquifer decreased after the 1950s [1].
5.2. Present Chloride Concentrations in the Glacial Aquifer
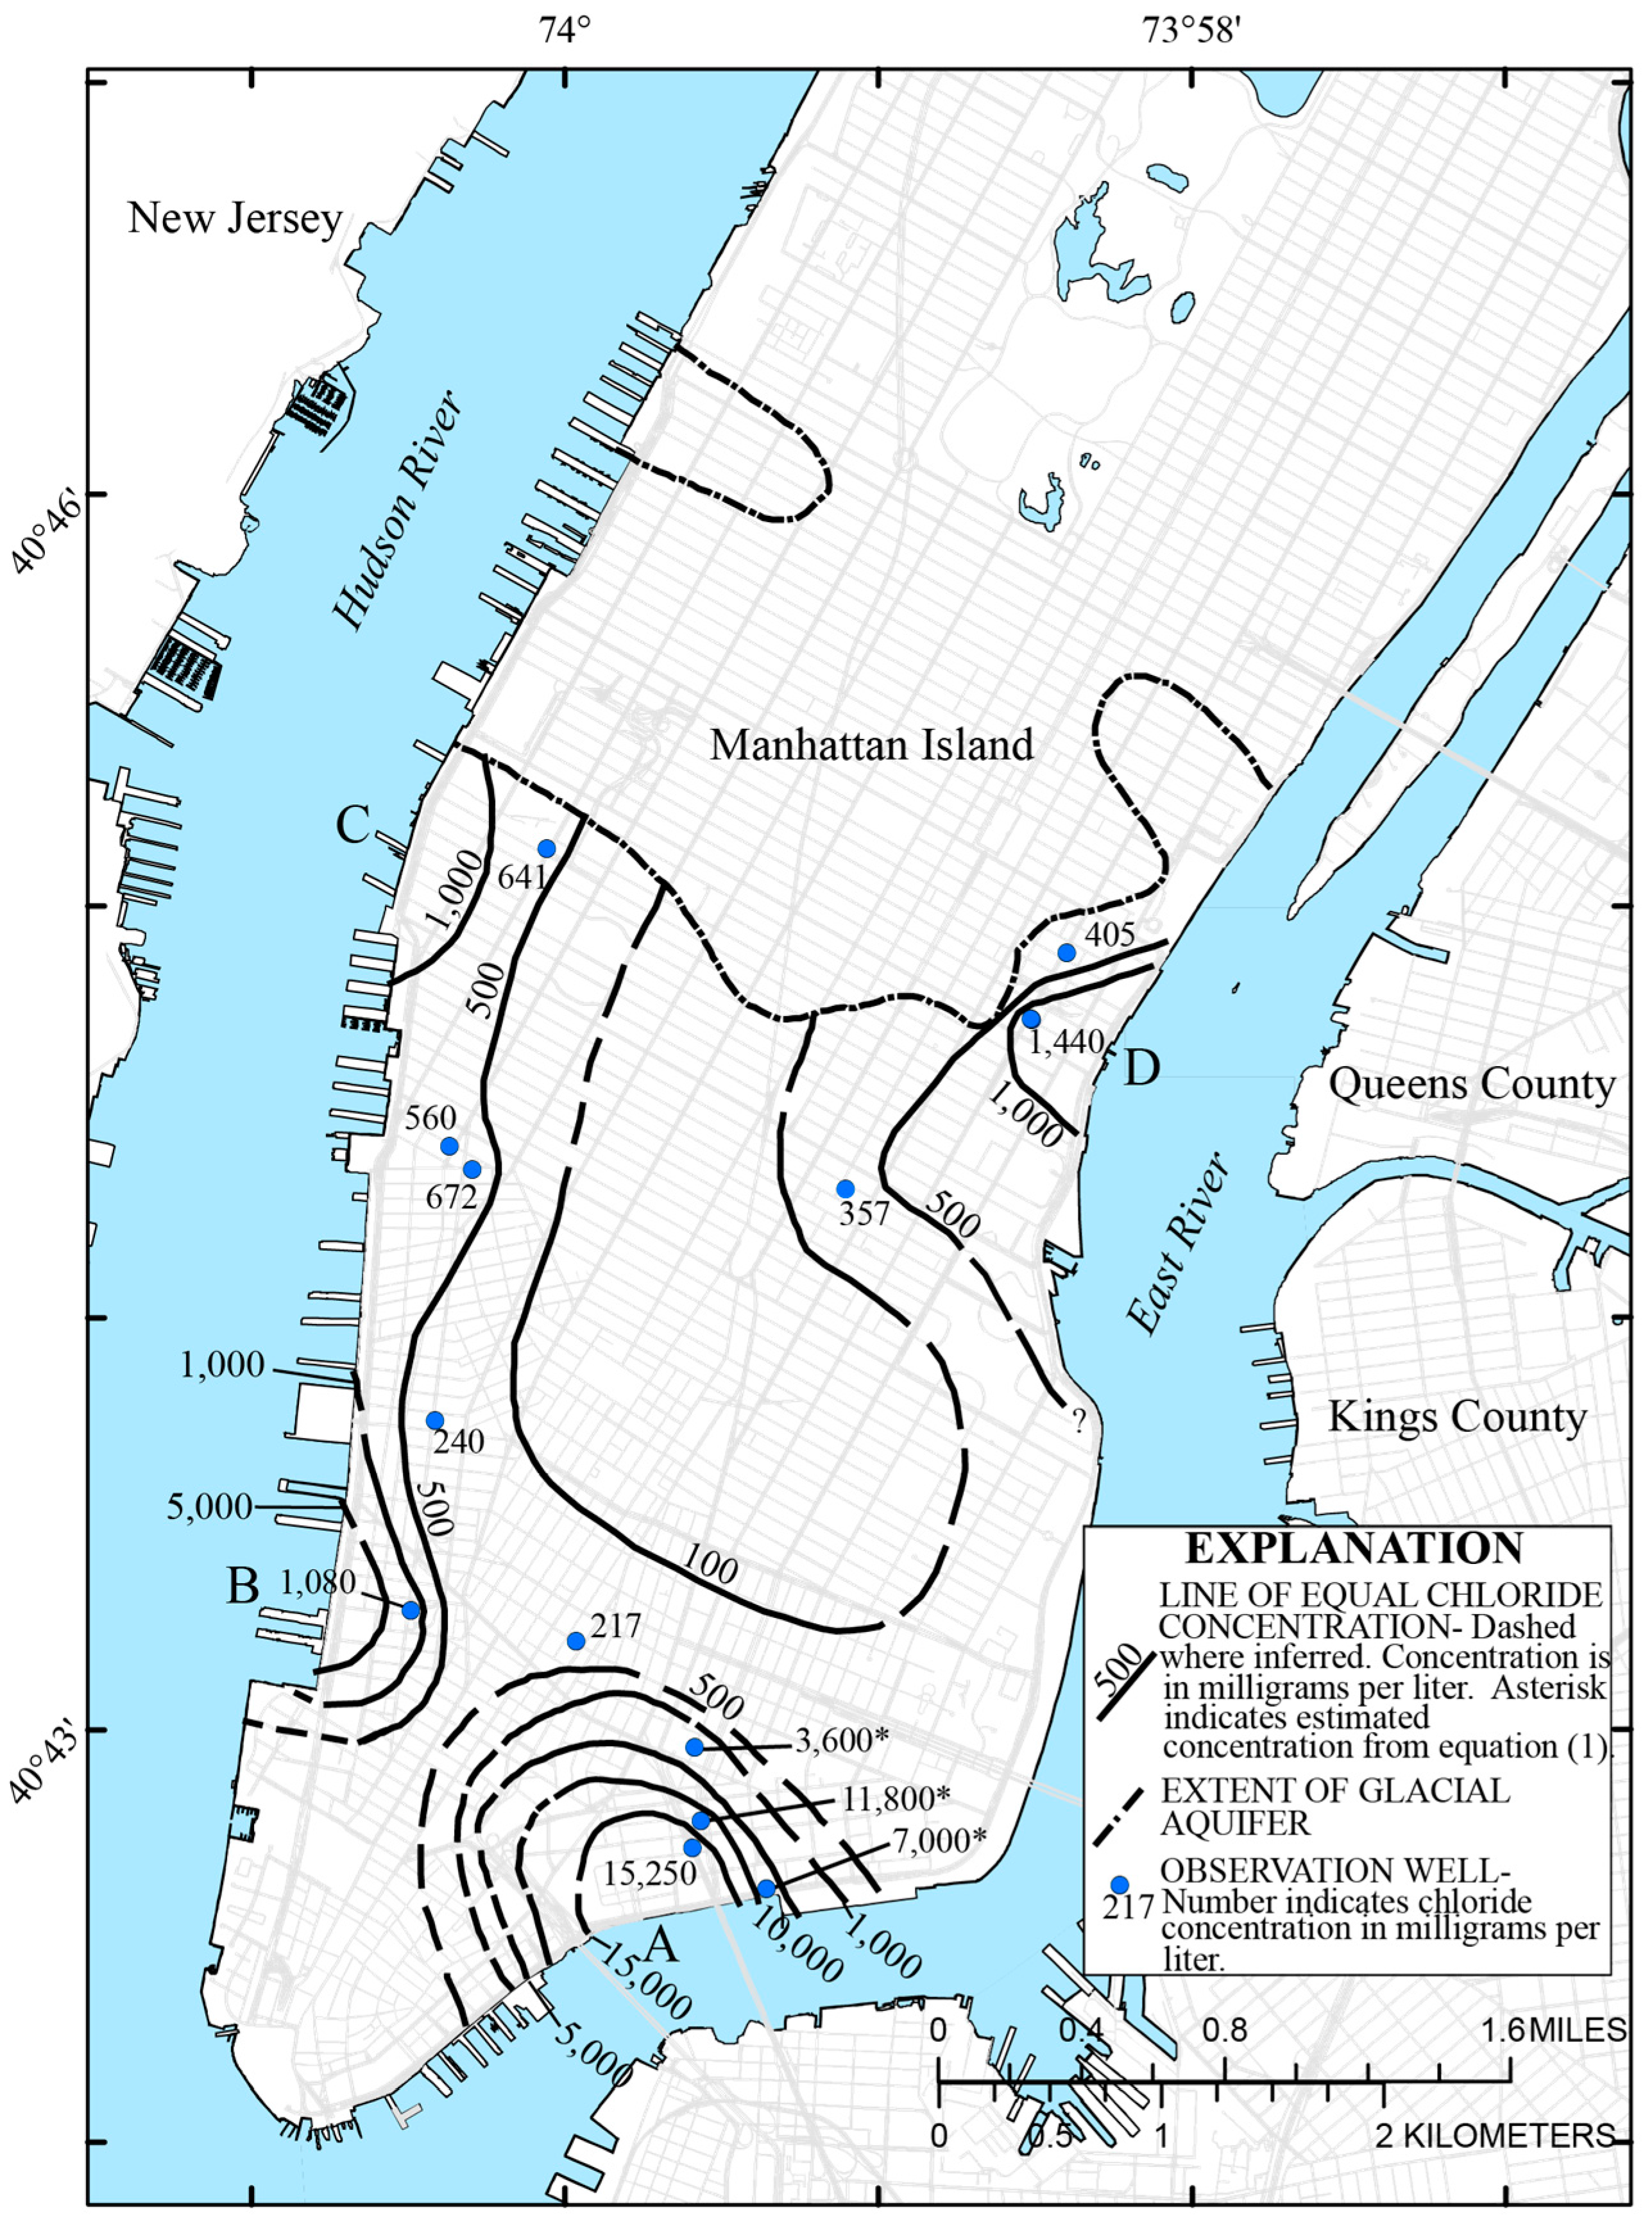
All of the wells sampled during 1940–1950 have either been destroyed or abandoned [1]. Samples of groundwater were collected from the 11 recently installed observation wells screened in the glacial aquifer during aquifer testing in 2004 and ground-water quality sampling in 2006. Chloride concentrations in the glacial aquifer range from 217 mg/L at well NY-244 to 15,250 mg/L at well NY-194 in 2004–2006 (Figure 1 and Figure 8, Table 1). Most of the central part of the glacial aquifer appears to have chloride concentrations less than 100 mg/L. Four areas of saltwater intrusion are indicated and designated saltwater wedges A, B, C, and D (Figure 8).
5.2.1. Saltwater Wedge A
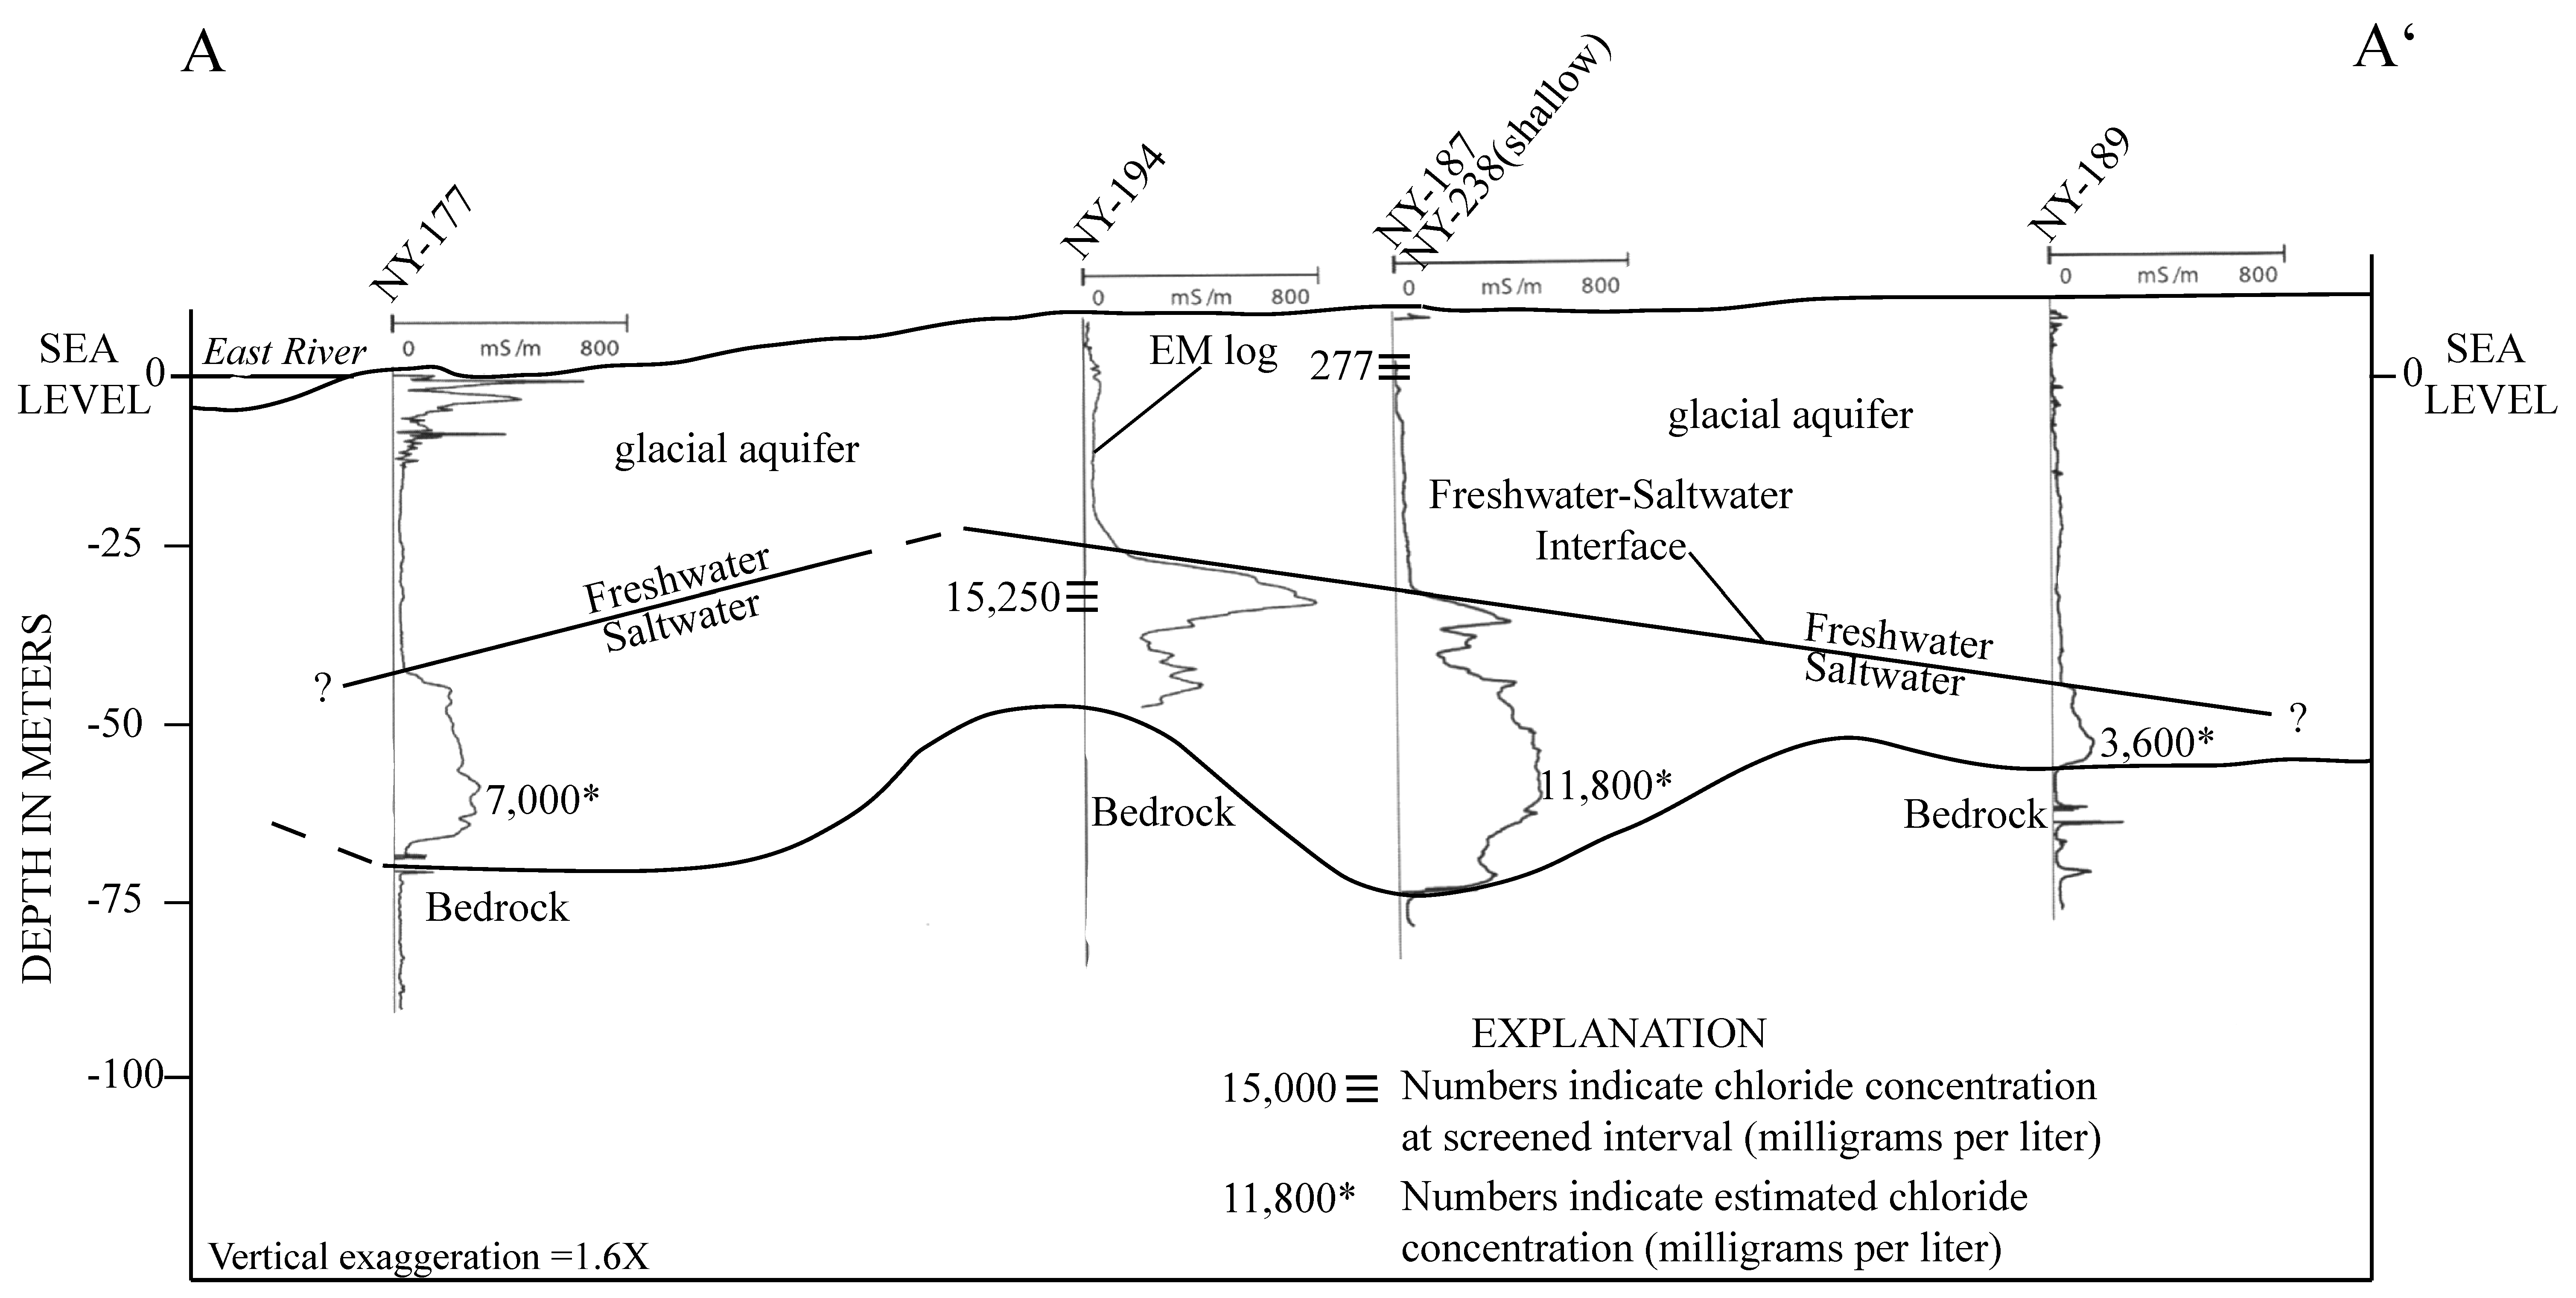
EM logs of three bedrock wells (NY-177, NY-187, and NY-189) that had PVC casings in the unconsolidated overburden (glacial aquifer above bedrock) and one glacial aquifer well (NY-194) cased and screened in PVC facilitated the delineation of saltwater wedge A at the base of the glacial aquifer (Figure 1, Figure 8 and Figure 9). Similar methods were used to delineate the saltwater–freshwater interface on Long Island using EM conductivity logs [26,29]. EM conductivity logs of these wells indicate the highest conductivity was in wells NY-194 and NY-187 (Figure 1 and Figure 9). Using Equation (1), the peak measured EM conductivity log responses were converted to estimated chloride concentrations in mg/L in the deeper parts of the glacial aquifer.
Well NY-194 had a sampled chloride concentration of 15,250 mg/L (Figure 1 and Figure 9). The saltwater wedge is 25.6 m thick with a freshwater–saltwater interface at 27.7 m below land surface (−18.9 m elevation) at NY-194 (Figure 9). Further inland, at well NY-187, the wedge is 42 m thick, had a sharp (narrow) interface, and the peak EM log response was 470 mS/m, which correlates to an estimated chloride concentration of 11,800 mg/L using Equation (1) (Figure 1, Figure 8 and Figure 9). Adjacent to deep well NY-187 is a shallow well NY-238 with a depth of 11 m (Figure 1, Figure 8 and Figure 9). The water-table elevation at this well is 2.65 m above sea level which indicates an estimated depth of the saltwater interface of nearly 106 m below sea level under natural conditions using the Ghyben-Herzberg relation where the depth of the saltwater interface below sea level is about 40 times the freshwater elevation above sea level [39,40].
This supports the interpretation that the saltwater wedges in southern Manhattan Island were probably caused by industrial pumpage and are not natural. The sharp or narrow interfaces indicated by the EM logs are indicative of areas where active saltwater intrusion is due to pumpage, similar wedges are seen on nearby Long Island [26,29].
Well NY-177 is closest to the coastline; the saltwater wedge is 22.9 m thick, has a sharp (narrow) interface, and the peak EM response was 280 mS/m, which correlates to an estimated chloride concentration of 7000 mg/L (Figure 9). This indicates that this well is at the northeastern edge of saltwater wedge A (Figure 1, Figure 8 and Figure 9).
NY-189 was the farthest inland well where borehole EM logs were used (Figure 1 and Figure 9). The saltwater wedge was 11.6 m thick with a sharp (narrow) interface and peak EM response was 143 mS/m, which correlated to an estimated peak chloride concentration of 3600 mg/L. This indicates that well NY-189 is at the toe of saltwater wedge A (Figure 1, Figure 8 and Figure 9). This wedge is a remnant of the historical saltwater wedge A indicated in 1940 to 1950 (Figure 7 and Figure 8).
5.2.2. Saltwater Wedges B, C, and D Under Current Conditions
Saltwater wedge B is on the southwestern coastal part of the study area (Figure 8) and appears to be another remnant of a historical saltwater wedge documented in that area from 1940 to 1950 [4] (Figure 7). Well NY-237 is in this saltwater wedge and had a sampled chloride concentration of 1080 mg/L (Figure 1 and Figure 8). Saltwater wedge C is a remnant of a historical saltwater wedge (Figure 1, Figure 7 and Figure 8). It is unclear if saltwater wedge C may be part of saltwater wedge B or a separate wedge unto itself. Another saltwater wedge D is indicated along the central-eastern coastline (Figure 8). Wells NY-235 and NY-242 had sampled chloride concentrations of 1440 and 405 mg/L, respectively. This wedge may have existed in 1940–1950 as indicated by well NY-147 with a chloride concentration of 223 mg/L (Figure 1, Figure 7 and Figure 8).
6. Discussion
The results of this study indicate a strong linear relation exists between bulk measured EM conductivity log response and chloride concentration in pore water of coastal plain aquifers. The use of this relation correlated very well with sampled results for saltwater that intruded coastal aquifers. The high correlation in the relation between chloride and EM log response suggests negligible influence of aquifer geology on the EM conductivity log response as opposed to elevated chloride concentrations from saltwater intrusion. Application of this relation was used to estimate chloride concentrations outside of PVC cased wells where no screen zones are present that would allow groundwater samples for chloride concentration measurement to be taken.
The existence of nearly identical saltwater intrusion wedges in southern Manhattan Island during 1940–1950 and 2004–2006 indicates little movement of the saltwater interface in over 70 years. EM log responses from several wells within one of the saltwater wedges indicate sharp interfaces. The limited recharge capability of the aquifer, due to impervious surfaces and the 22.7 mld of reported industrial pumpage early in the 20th Century was probably the cause for the saltwater intrusion into the glacial aquifer and the persistence of the historical saltwater intrusion wedges over time. A similar situation was observed in nearby Kings County on Long Island across the East River from the study area. EM logs collected in Kings County decades after the cessation of groundwater pumpage infer that limited recharge potential for the area due to urbanization and low water elevations allowed the persistence of historical saltwater intrusion wedges to be preserved [41].
7. Conclusions
The use of filter-press samples obtained from core samples and screen zone groundwater samples to measure chloride concentrations indicate good agreement between to these two methods within the margin of instrument drift. Using a nearby network of sixteen PVC cased wells, forty-three data points were used to generate a relation equation between EM log response and chloride concentrations. The equation has a strong correlation coefficient. Application of the relation equation will provide valuable estimation of the chloride concentration in this coastal plain aquifer where no screen zone exists and will help delineate zones of chloride concentrations that exceed the SMCL. In contrast to screen zone water samples that represent only a small portion of a borehole, EM logs can provide a complete cross-sectional measurement of the variation in saltwater intrusion with depth in a PVC cased well. The equation was used to estimate the chloride concentration within saltwater intrusion wedges in southern Manhattan Island.
Analysis of the geophysical logs, chloride concentration, and aquifer test data provided information on the glacial aquifer in southern Manhattan. The water-table map and water-level data for the glacial aquifer indicate a recharge zone in the central-northern part of the study area with discharge zones along the southern, western, and eastern coastal areas.
Historical chloride data from 1940 to 1950 in 37 glacial aquifer wells used for private supply were contoured. Three wedges of saltwater intrusion were indicated in the glacial aquifer at that time. The highest chloride concentrations were present in saltwater wedge A in the southernmost part of the study area.
During 2004–2006, chloride concentrations from 14 glacial aquifer wells indicated four saltwater wedges. Three of the saltwater wedges, designated A, B, and C, are probably remnants of the historical saltwater intrusion wedges delineated earlier. Current chloride concentrations in the glacial aquifer range from 217 mg/L in well NY-244 to 15,250 mg/L in well NY-194. EM logs of three bedrock wells (NY-177, NY-187, and NY-189) and one glacial aquifer well (NY-194) cased in PVC were used to delineate saltwater wedge A in the glacial aquifer.
EM logs provided a unique opportunity to delineate the thickness and concentration of saltwater wedge A. The EM logs indicate the freshwater–saltwater interface is still very sharp. Despite the cessation of industrial pumpage more than 70 years ago, the freshwater flow in the glacial aquifer has been unable to push the saltwater interface to any measurable degree back to its source. The limited recharge capability of the aquifer, due to impervious surfaces and the 22.7 mld of reported industrial pumpage early in the 20th Century was probably the cause for the saltwater intrusion and the persistence of the historical saltwater intrusion wedges over time. This suggests that the glacial aquifer has had only a limited recovery from the past industrial pumpage.
Supplementary Materials
The following are available online at www.mdpi.com/2073-4441/9/9/631/s1, Table S1: Peak EM log response and chloride concentration values for wells in Nassau County, NY.
Acknowledgments
The authors thank the personnel of the New York City Department of Environmental Protection and the New York City Department of Design and Construction for technical assistance, support, and access to their records and wells. The authors acknowledge the technical assistance of Anthony Chu and others of the USGS New York Water Science Center in Coram, New York. Any use of trade, firm, or product names is for descriptive purposes only and does not imply endorsement by the U.S. Government.
Author Contributions
Frederick Stumm conceived and designed the study; Frederick Stumm collected and analyzed field data; Michael D. Como analyzed aquifer test data; Frederick Stumm wrote the paper with the assistance of Michael D. Como.
Conflicts of Interest
The authors declare no conflict of interest.
References
- Perlmutter, N.M.; Arnow, T. Ground Water in Bronx, New York, and Richmond Counties with Summary Data on Kings and Queens Counties, New York City, New York; Bulletin GW-32; New York State Water Power and Control Commission: Albany, NY, USA, 1953; 86p.
- Viele, E.L. Sanitary and Topographical Map of the City and Island of New York; NYC Council of Hygiene and Public Health, 1 Sheet, Scale 1:10,000; Ferd. Mayer & Co., Lithographers: New York, NY, USA, 1865. [Google Scholar]
- Graether, L.F. Geologic Map and Sections of Manhattan Island, New York; 2 Sheets, Scale 1:20,000; Leonard F. Graether: New York, NY, USA, 1898. [Google Scholar]
- Hobbs, W.H. The Configuration of the Rock Floor of Greater New York; U.S. Geological Survey Bulletin 270; US Government Printing Office: Washington, DC, USA, 1905; 96p.
- Baskerville, C.A. Bedrock and Engineering Geologic Maps of New York County and Parts of Kings and Queens Counties, New York; U.S. Geological Survey Miscellaneous Investigations Series, Map I-2306, 2 Sheets, Scale 1:24,000; U.S. Geological Survey: Reston, VA, USA, 1994.
- Suter, R.; de Laguna, W.; Perlmutter, N.M. Mapping of Geologic Formations and Aquifers of Long Island, New York; Groundwater Bulletin 18; New York State Water Power and Control Commission: Albany, NY, USA, 1949; 212p.
- Stumm, F.; Chu, A.; Monti, J., Jr. Delineation of Faults, Fractures, Foliation, and Ground-Water-Flow Zones in Fractured-Rock, on the Southern part of Manhattan, New York, through Use of Advanced Borehole Geophysical Techniques; U.S. Geological Survey Open-File Report 04-1232; USGS New York Water Science Center: Reston, VA, USA, 2004; 212p.
- National Oceanic and Atmospheric Administration. Monthly and Annual Precipitation at Central Park, Manhattan, New York. 2010. Available online: https://www.ncdc.noaa.gov/IPS/lcd/lcd.html?_page=1&state=NY&stationID=94728&_target2=Next+%3E (accessed on 23 August 2017).
- National Oceanic and Atmospheric Administration. Tides and Water Levels at the Battery, Manhattan, New York. 2017. Available online: https://tidesandcurrents.noaa.gov/waterlevels.html?id=8518750 (accessed on 21 August 2017).
- Duffield, G.M. AQTESOLV for Windows Version 4.5 User's Guide; HydroSOLVE, Inc.: Reston, VA, USA, 2007. [Google Scholar]
- Neuman, S.P. Effect of partial penetration on flow in unconfined aquifers considering delayed gravity response. Water Resour. Res. 1974, 10, 303–312. [Google Scholar] [CrossRef]
- Theis, C.V. The relation between the lowering of the piezometric surface and the rate and duration of discharge of a borehole using groundwater storage. Eos Trans. Am. Geophys. Union 1935, 16, 519–524. [Google Scholar] [CrossRef]
- Moench, A.F. Flow to a borehole of finite diameter in a homogeneous, anisotropic water-table aquifer. Water Resour. Res. 1997, 33, 1397–1407. [Google Scholar] [CrossRef]
- Lusczynski, N.J. Filter-Press Method of Extracting Water Samples for Chloride Analysis; Water-Supply Paper 1544-A; U.S. Geological Survey: Washington, DC, USA, 1961; 13p.
- Thermo Fisher Scientific. User Guide—Chloride Ion Selective Electrode; Thermo FisherS cientific Inc.: Waltham, MA, USA, 2008; 39p. [Google Scholar]
- Koterba, M.T.; Wide, F.D.; Lapham, W.W. Groundwater Data-Collection Protocols and Procedures for the National Water-Quality Assessment Program—Collection and Documentation of Water-Quality Samples and Related Data; Open-File Report 95-399; U.S. Geological Survey: Reston, VA, USA, 1995; 113p.
- Fishman, M.L. Methods of Analysis by the U.S. Geological Survey National Water Quality Laboratory—Determination of Inorganic and Organic Constituents in Water and Fluvial Sediments; Open File Report 93-125; U.S. Geological Survey: Reston, VA, USA, 1993; 217p.
- Archie, G.E. The electrical resistivity log as an aid in determining some reservoir characteristics. Trans. AIME 1942, 146, 54–62. [Google Scholar] [CrossRef]
- Keys, W.S.; MacCary, L.M. Application of borehole geophysics to water-resources investigations. In U.S. Geological Survey Techniques of Water-Resources Investigations; U.S. Geological Survey: Washington, DC, USA, 1971; 126p. [Google Scholar]
- Serra, O. Fundamentals of Well-Log Interpretation; Elsevier: New York, NY, USA, 1984; 423p. [Google Scholar]
- Keys, W.S. Borehole geophysics applied to water-resources investigations. In U.S. Geological Survey Techniques of Water-Resources Investigations; U.S. Geological Survey: Reston, VA, USA, 1990; 150p. [Google Scholar]
- McNeill, J.D.; Hunter, J.A.; Bosner, M. Application of a borehole induction magnetic susceptibility logger to shallow lithological mapping. J. Environ. Eng. Geophys. 1996, 1, 77–90. [Google Scholar] [CrossRef]
- Williams, J.H.; Lane, J.W. Advances in Borehole Geophysics for Ground-Water Investigations; Fact Sheet 002-98; U.S. Geological Survey: Reston, VA, USA, 1998; 4p.
- Buxton, H.T.; Soren, J.; Posner, A.; Shernoff, P.K. Reconnaissance of the Ground-Water Resources of Kings and Queens Counties, New York; Open-File Report 81-1186; U.S. Geological Survey: Reston, VA, USA, 1981; 64p.
- Metzger, L.F.; Izbicki, J.A. Electromagnetic-induction logging to monitor changing chloride concentrations. Ground Water 2013, 51, 108–121. [Google Scholar] [CrossRef] [PubMed]
- Stumm, F. Hydrogeology and Extent of Saltwater Intrusion of the Great Neck Peninsula, Great Neck, Long Island, New York; U.S. Geological Survey Water-Resources Investigations Report 99-4280; U.S. Geological Survey: Reston, VA, USA, 2001; 41p.
- Taylor, K.C.; Hess, J.W.; Mazzela, A. Field evaluation of a slim-hole borehole induction tool. Ground Water Monit. Remediat. 1989, 9, 100–104. [Google Scholar] [CrossRef]
- McNeill, J.D. Technical Note 20 Geonics EM39 Borehole Conductivity Meter Theory of Operation; Geonics Limited: Mississauga, ON, Canada, 1986; 18p. [Google Scholar]
- Stumm, F. Use of focused electromagnetic induction borehole geophysics to delineate the saltwater-freshwater interface in Great Neck, Long Island, New York. In Symposium on the Application of Geophysics to Engineering and Environmental Problems; Bell, R.S., Lepper, C.M., Eds.; Environmental and Engineering Geophysical Society: San Diego, CA, USA, 1993; Volume 2, pp. 513–525. [Google Scholar]
- Paillet, F.; Hite, L.; Carlson, M. Integrating surface and borehole geophysics in ground water studies—An example using electromagnetic soundings in South Florida. J. Environ. Eng. Geophys. 1999, 4, 45–55. [Google Scholar] [CrossRef]
- Hanson, R.T. Geohydrologic Framework of Recharge and Seawater Intrusion in the Pajaro Valley, Santa Cruz and Monterey Counties, California; U.S. Geological Survey Water-Resources Investigations Report 03-4096. Available online: http://pubs.usgs.gov/wri/wri034096 (accessed on 21 August 2017).
- Land, M.; Reichard, E.G.; Crawford, S.M.; Everett, R.R.; Newhouse, M.W.; Williams, C.F. Ground-Water Quality of Coastal Aquifer Systems in the West Coast Basin, Los Angeles County, California, 1999–2002. U.S. Geological Survey Scientific Investigations Report 2004-5067. Available online: http://pubs.usgs.gov/sir/2004/5067 (accessed on 21 August 2017).
- Fitterman, D.V.; Deszcz-Pan, M. Geophysical mapping of saltwater intrusion in Everglades National Park. In Proceedings of the 3rd International Symposium on Ecohydraulics, Salt Lake, UT, USA, 12–16 July 1999. [Google Scholar]
- Zuwaylif, F.H. General Applied Statistics; Addison-Wesley: Boston, MA, USA, 1979; 434p. [Google Scholar]
- Kemp, J.F. The geology of Manhattan Island [N.Y.]. N. Y. Acad. Sci. Trans. 1887, 7, 49–64. [Google Scholar]
- Murphy, J.J.; Fluhr, T.W. The Subsoil and Bedrock of the Borough of Manhattan as Related to Foundations; Fourth Issue, Paper 212; Municipal Engineers Journal: New York City, NY, USA, 1944; pp. 119–157. [Google Scholar]
- Merguerian, C.; Baskerville, C.A. The geology of Manhattan Island and the Bronx, New York City, New York. In Northeastern Section of the Geological Society of America, Centennial Fieldguide; Roy, D.C., Ed.; The Geological Society of America, Inc.: Boulder, CO, USA, 1987; Volume 5, 481p. [Google Scholar]
- Lusczynski, N.J.; Swarzenski, W.V. Salt-Water Encroachment in Southern Nassau and Southeastern Queens Counties, Long Island, New York; Water-Supply Paper 1613-F; U.S. Geological Survey: Washington, DC, USA, 1966; 76p.
- Ghyben, B.W. Nota in verband met de voorgenomen putboring nabij Amsterdam. Tijdschr. Kon. Inst. Ing. 1888, 9, 8–22. [Google Scholar]
- Herzberg, A. Die Wasserversorgung Einiger Nordseebäder; J. Gasbeleucht. Wasserversorg: München, Germany, 1901; Volume 44, pp. 815–819, 842–844. [Google Scholar]
- Chu, A.; Stumm, F. Delineation of the saltwater-freshwater interface at selected locations in Kings and Queens Counties, Long Island, New York, through use of borehole geophysical techniques. In Proceedings of the 2nd Geology of Long Island and Metropolitan New York Conference, Stony Brook, NY, USA, 15 April 1995. [Google Scholar]
Figure 1.
Locations of bedrock, glacial, and historical (glacial) wells within the (A) northern, and (B) southern parts of the study area in Manhattan, NY.
Figure 1.
Locations of bedrock, glacial, and historical (glacial) wells within the (A) northern, and (B) southern parts of the study area in Manhattan, NY.

Figure 2.
Locations of 16 observation wells with Electromagnetic induction (EM) conductivity logs and chloride concentrations used to calculate a relation between measured EM conductivity log response and chloride concentration in Nassau County, Long Island, NY. The southern Manhattan study area is shown.

Figure 3.
Generalized geology, natural gamma log, EM conductivity log, and chloride concentrations (milligrams per liter) in observation well N-12506 Long Island, NY (location shown in Figure 2).
Figure 3.
Generalized geology, natural gamma log, EM conductivity log, and chloride concentrations (milligrams per liter) in observation well N-12506 Long Island, NY (location shown in Figure 2).
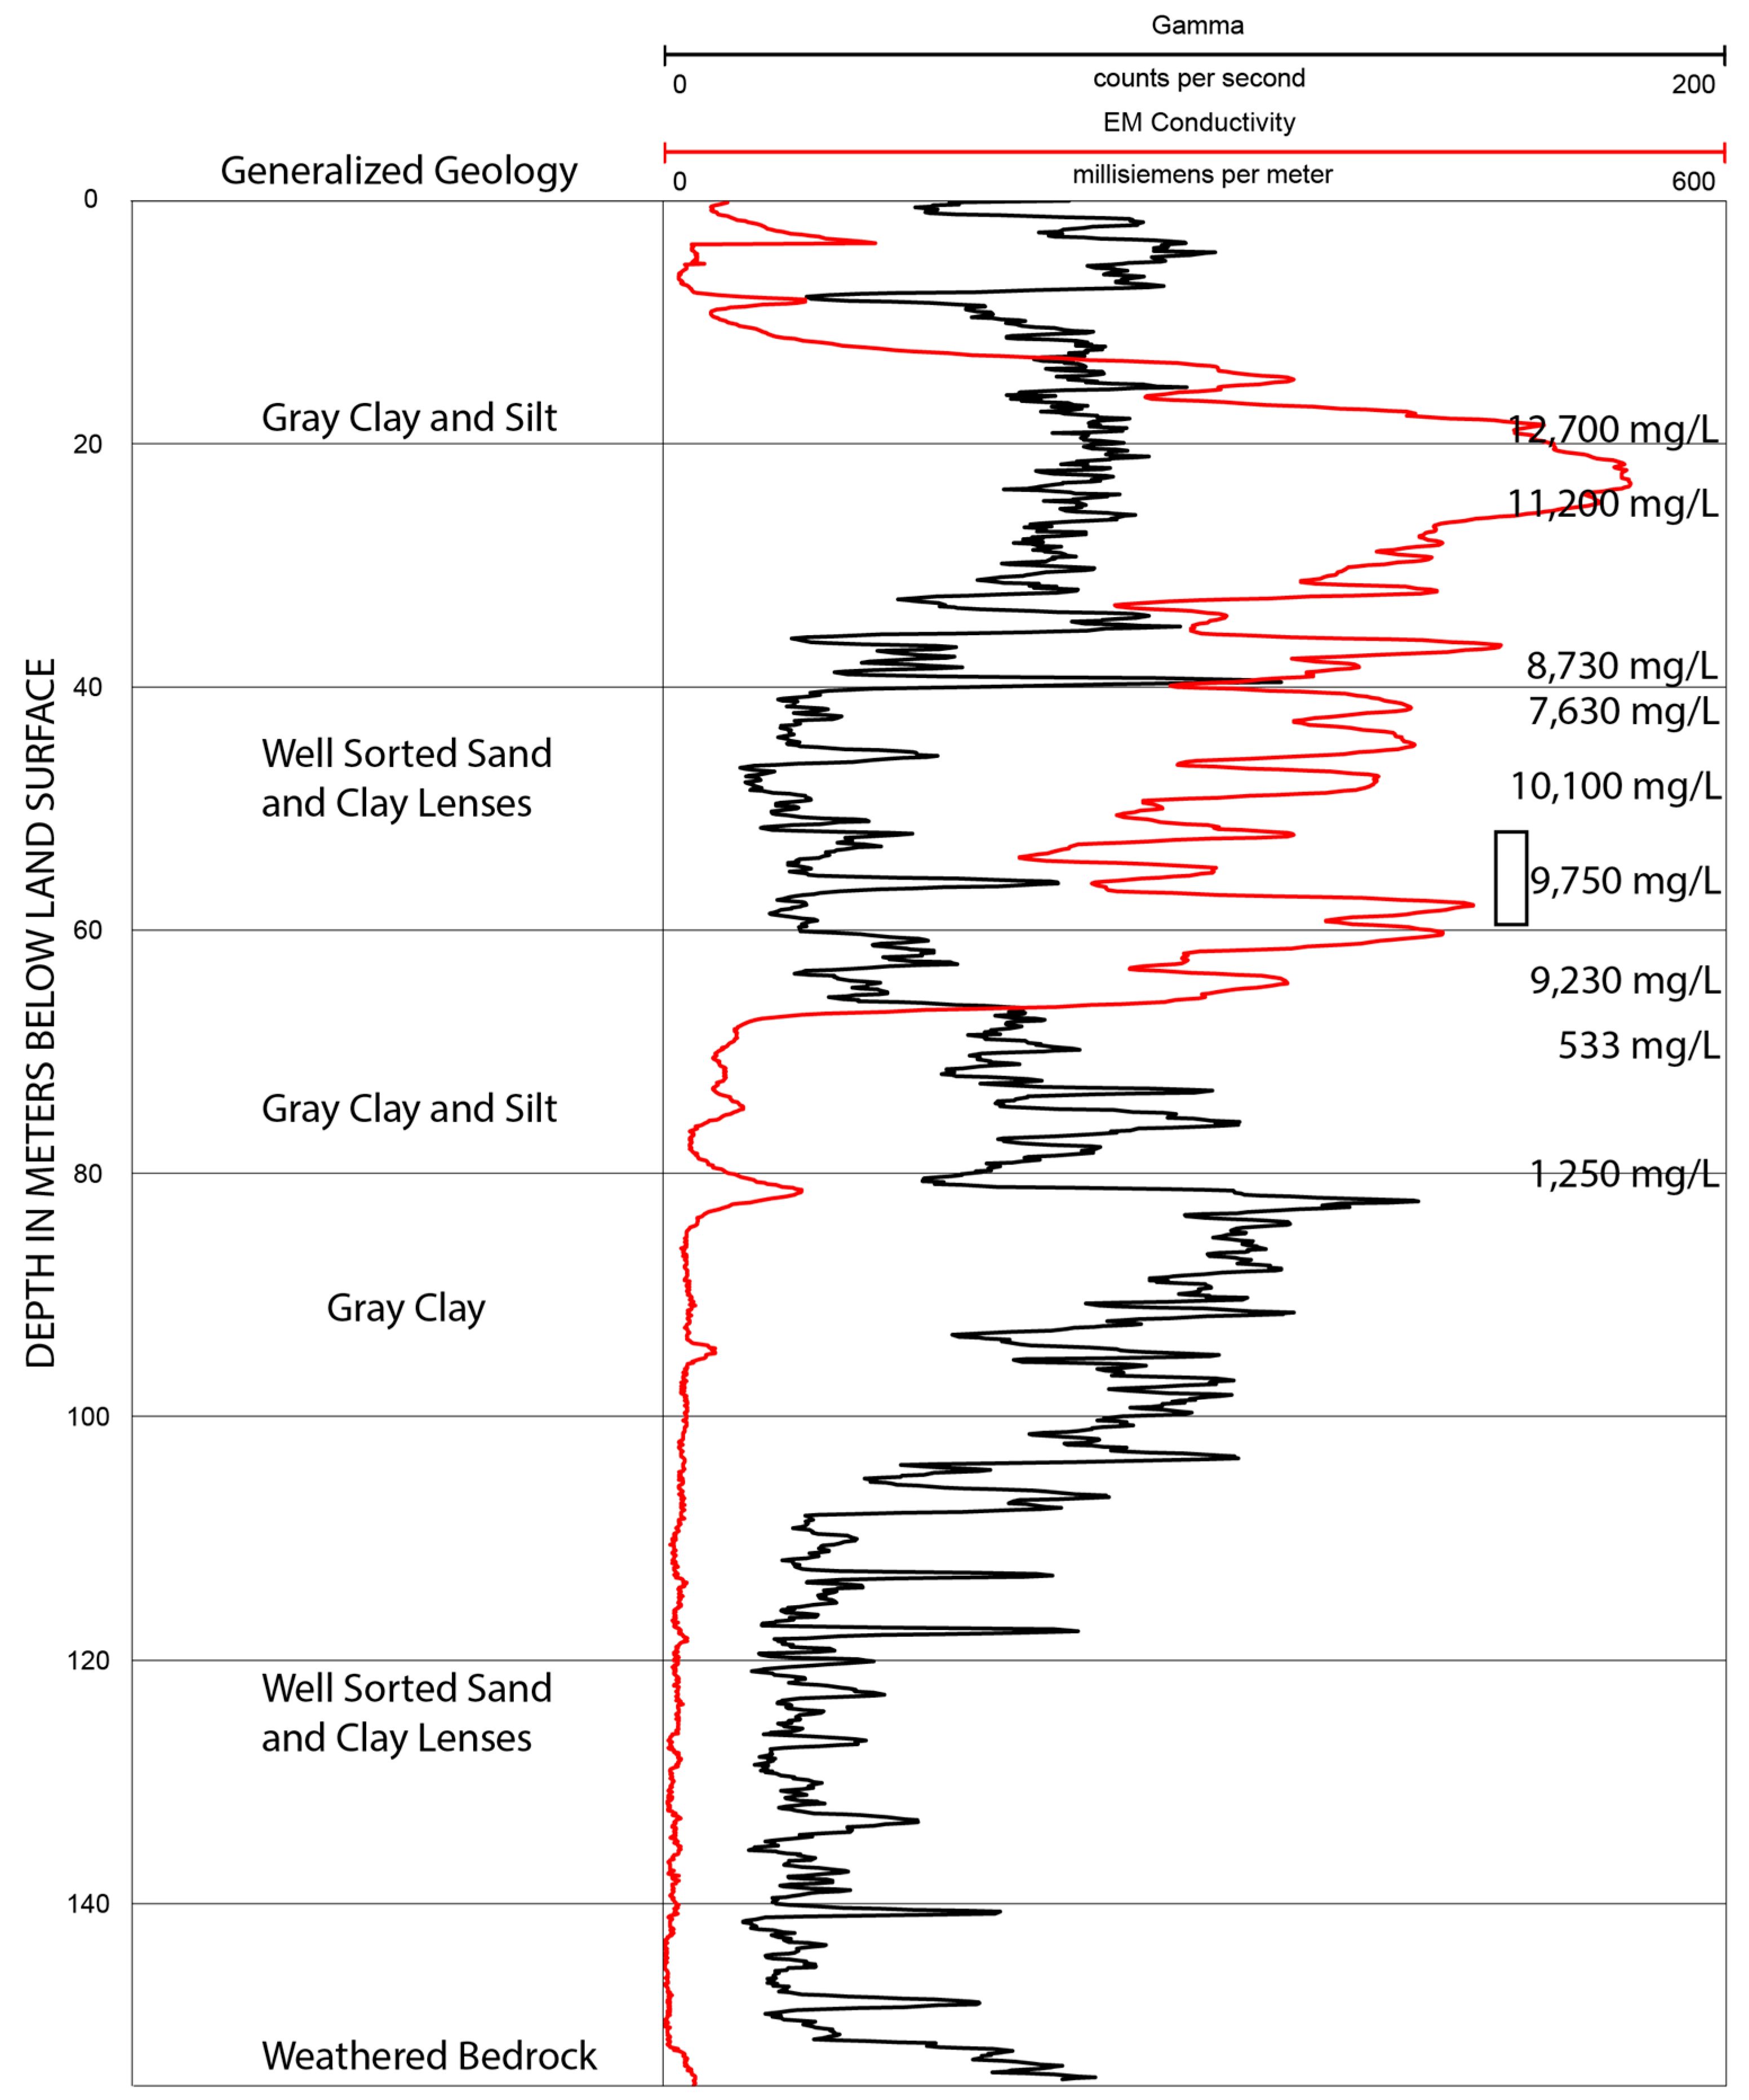
Figure 4.
Chloride concentration (milligrams per liter) in ground water as a function of electromagnetic induction (EM) conductivity log response (millisiemens per meter) in 16 wells shown in Figure 2 in Nassau County, Long Island, NY.
Figure 4.
Chloride concentration (milligrams per liter) in ground water as a function of electromagnetic induction (EM) conductivity log response (millisiemens per meter) in 16 wells shown in Figure 2 in Nassau County, Long Island, NY.
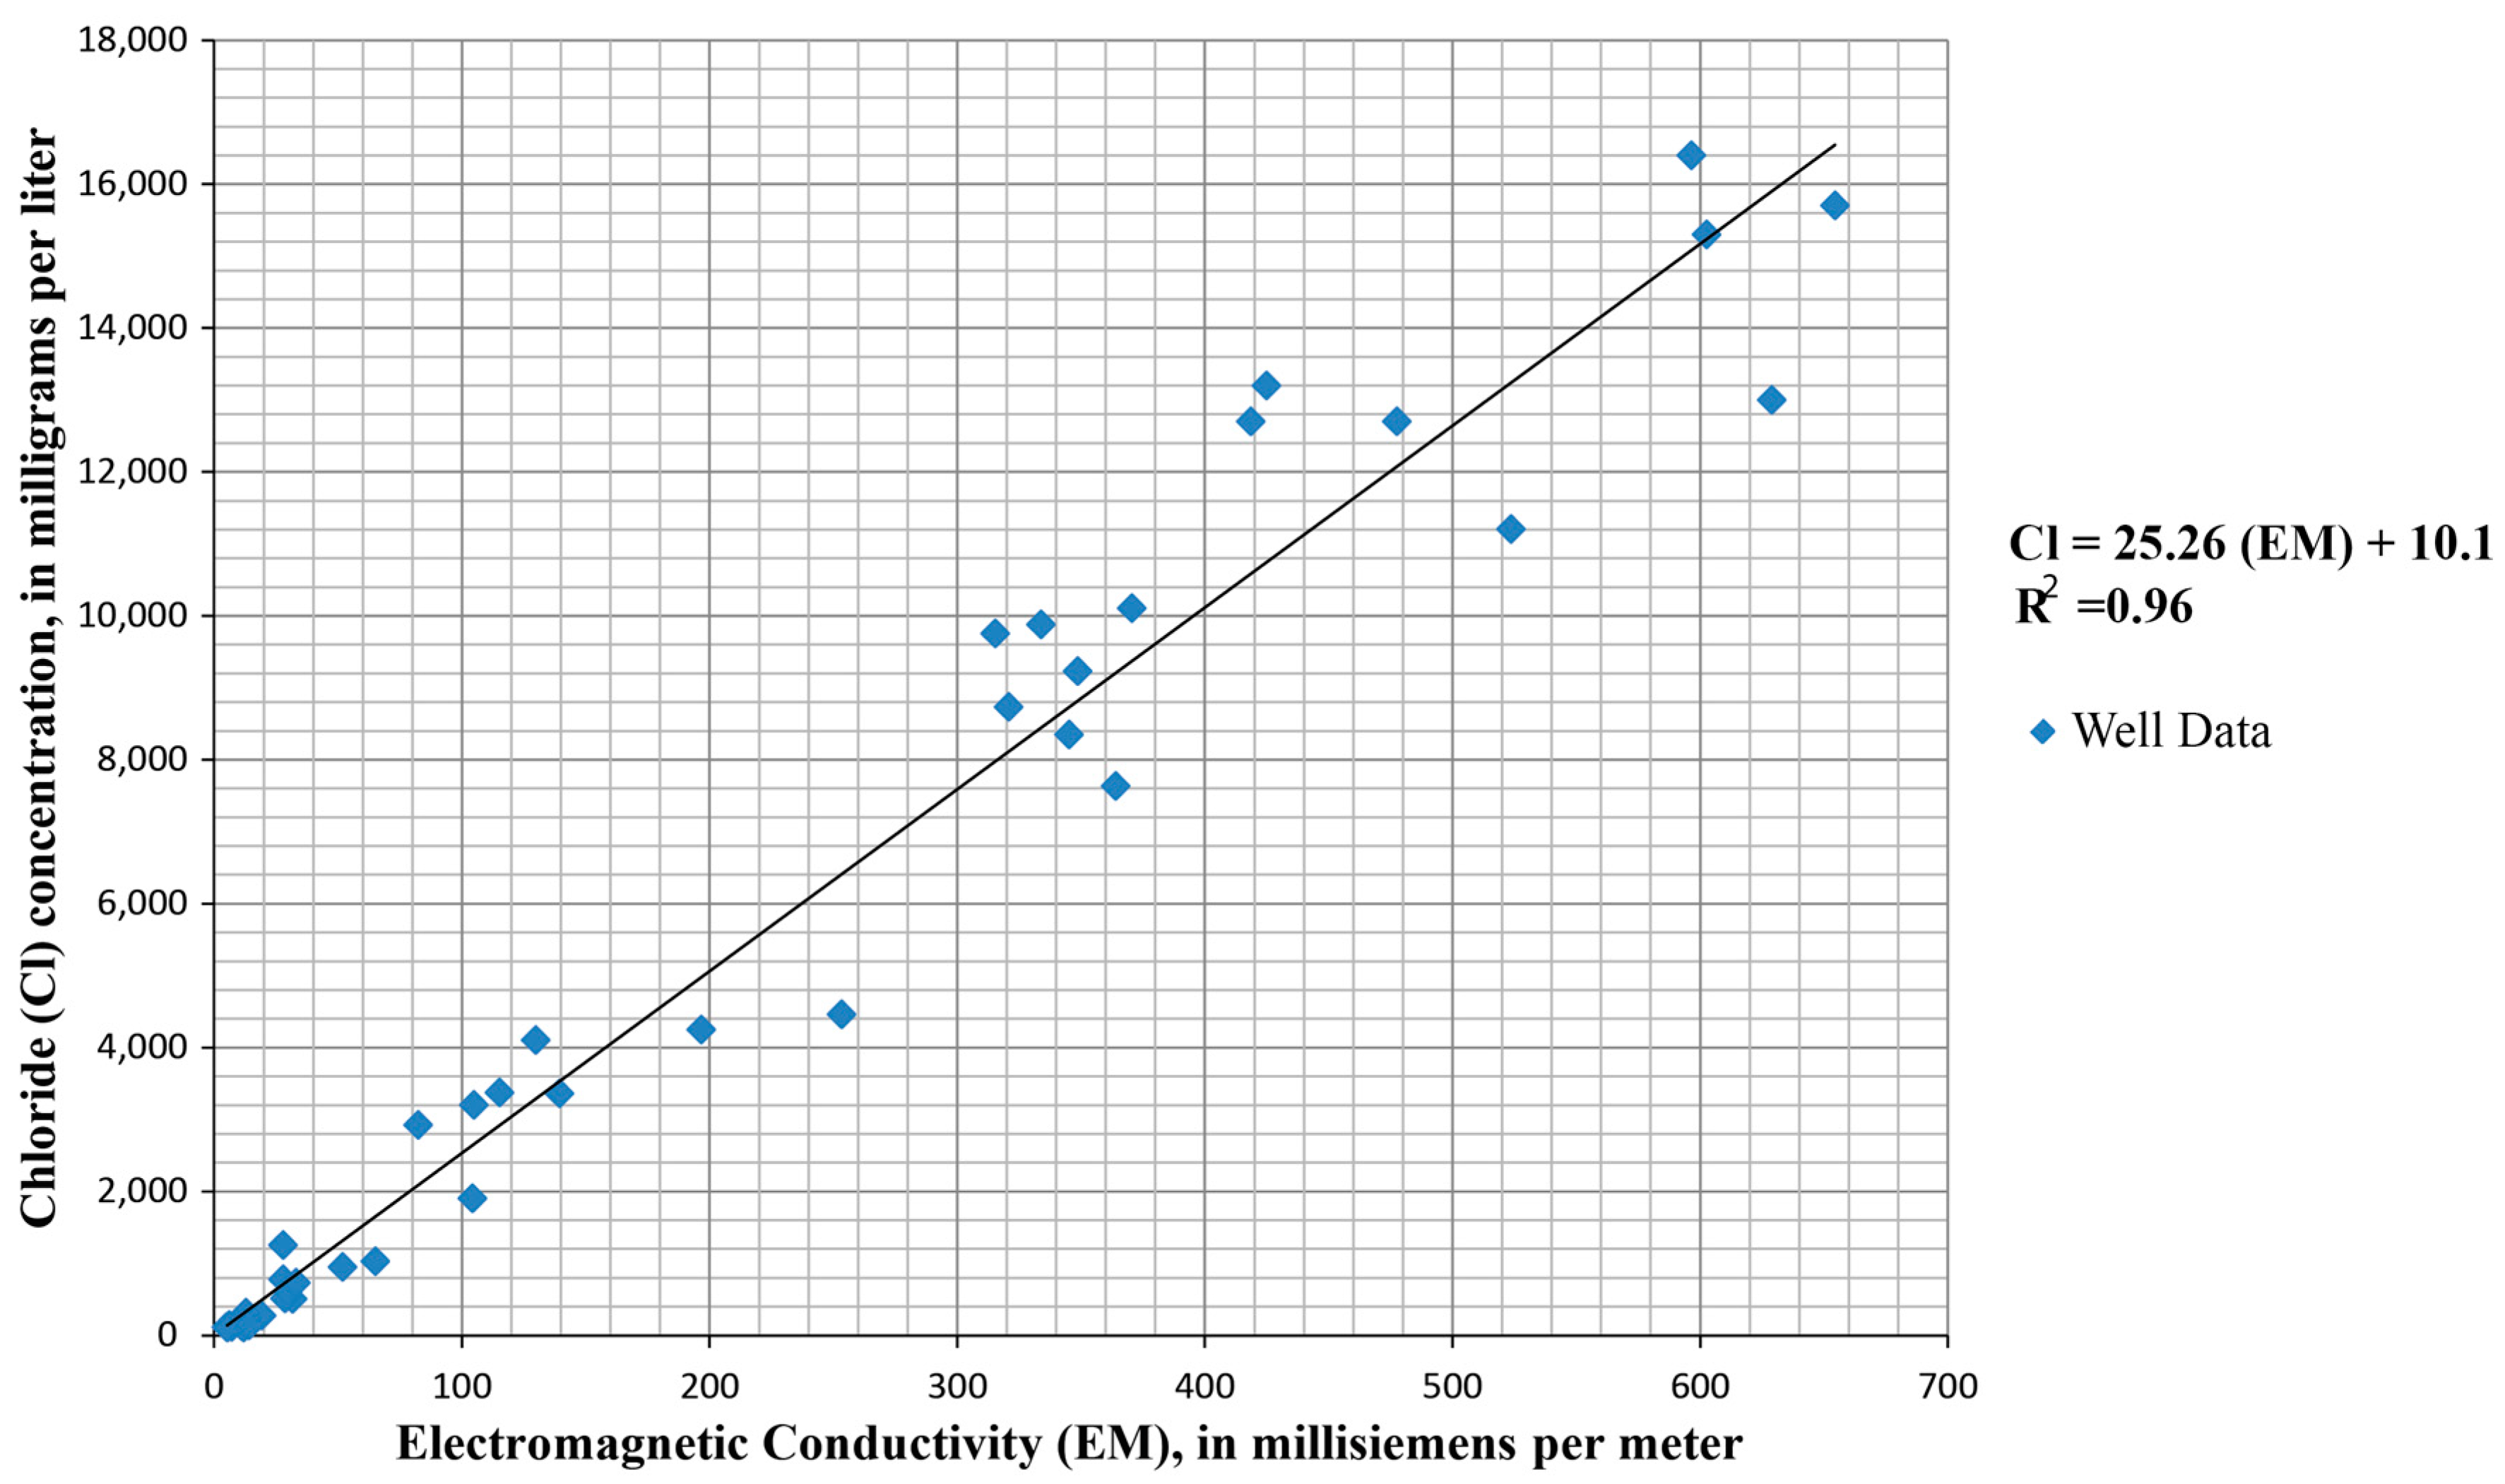
Figure 5.
Composite water-table elevation map in the glacial aquifer in Manhattan Island, NY (2004–2006).
Figure 5.
Composite water-table elevation map in the glacial aquifer in Manhattan Island, NY (2004–2006).

Figure 6.
Precipitation, tidal data, and water levels in the fractured bedrock and glacial aquifer on the south part of Manhattan, NY for the periods of: (A) 1 July–30 September 2006; and (B) 15 August–15 September 2006 (locations of wells, precipitation and tidal stations shown in Figure 1).
Figure 6.
Precipitation, tidal data, and water levels in the fractured bedrock and glacial aquifer on the south part of Manhattan, NY for the periods of: (A) 1 July–30 September 2006; and (B) 15 August–15 September 2006 (locations of wells, precipitation and tidal stations shown in Figure 1).
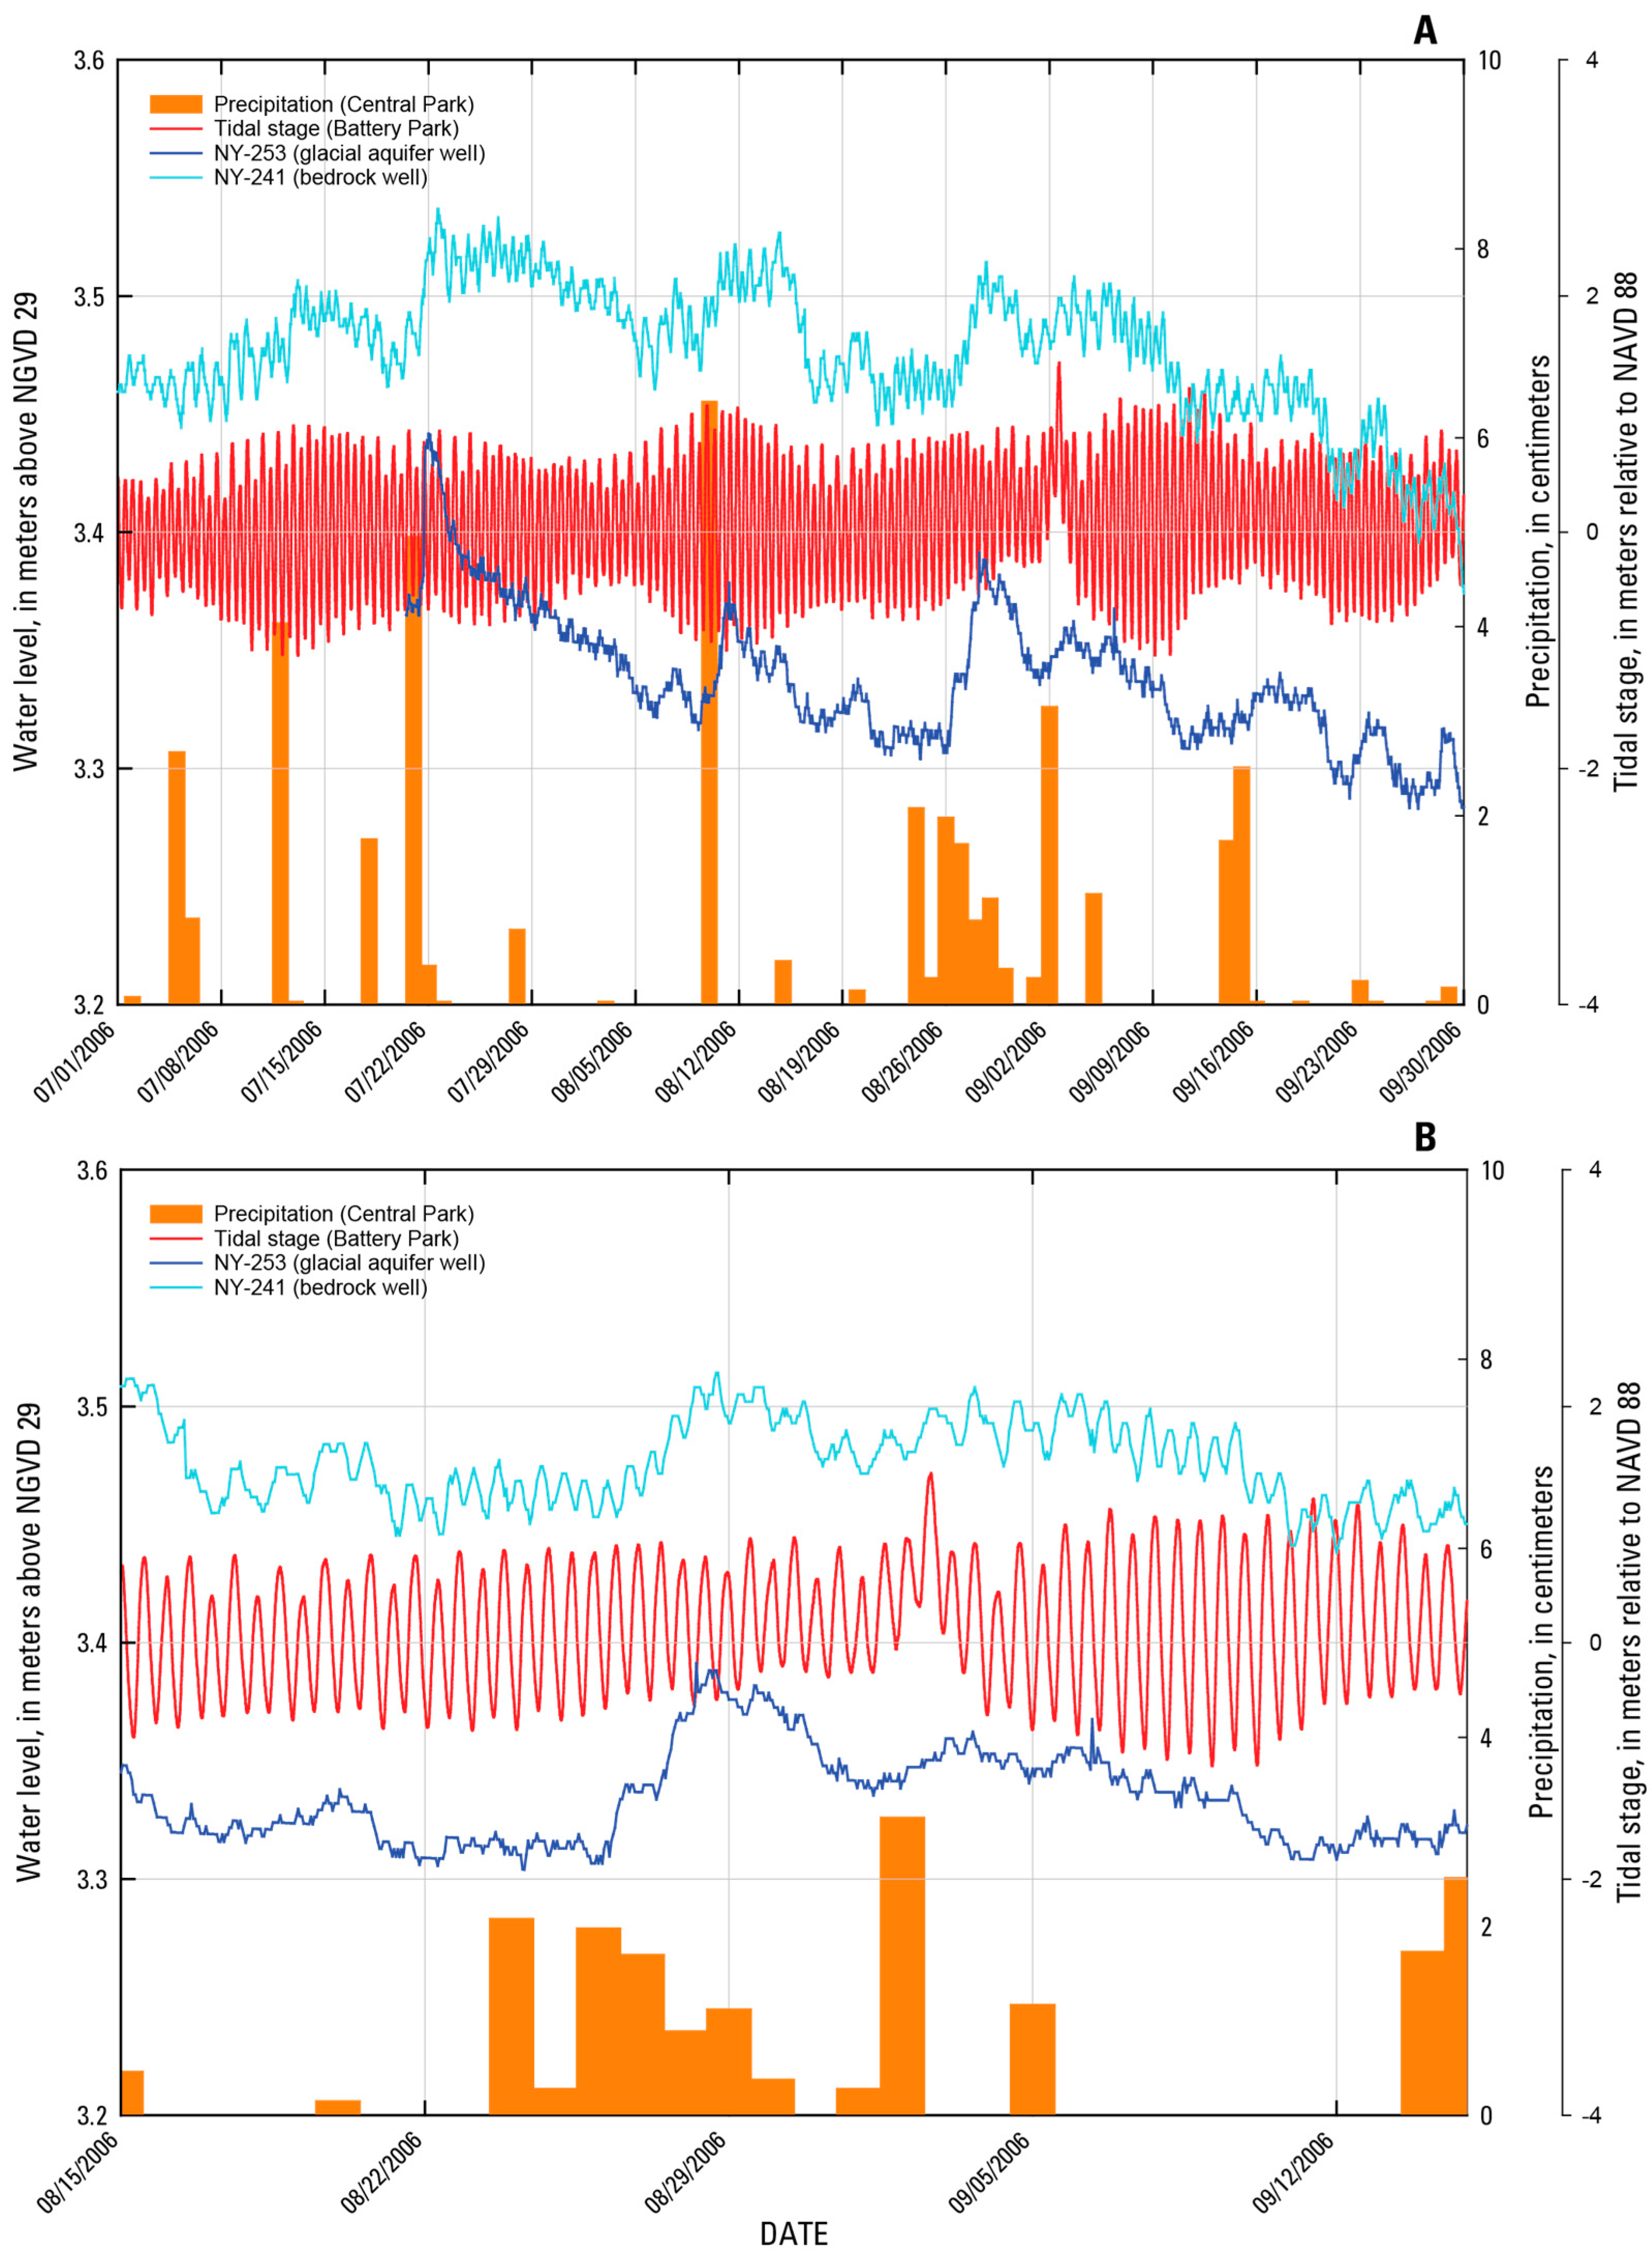
Figure 7.
Chloride concentrations in the glacial aquifer during 1940–1950, Manhattan Island, NY (saltwater wedges A, B and C shown) (chloride data [1]).
Figure 7.
Chloride concentrations in the glacial aquifer during 1940–1950, Manhattan Island, NY (saltwater wedges A, B and C shown) (chloride data [1]).

Figure 8.
Chloride concentrations in the glacial aquifer during 2004–2006, Manhattan Island, NY (saltwater wedges A, B, C and D shown).
Figure 8.
Chloride concentrations in the glacial aquifer during 2004–2006, Manhattan Island, NY (saltwater wedges A, B, C and D shown).

Figure 9.
Hydrogeologic section showing the extent of saltwater wedge A, Manhattan Island, NY (location shown in Figure 1 and Figure 8).

Table 1.
Well completion information and hydrogeologic data from observation wells referenced to NGVD 29.
Table 1.
Well completion information and hydrogeologic data from observation wells referenced to NGVD 29.
| Hydrogeologic Unit | New York State ID Number | Land Surface Elevation (m) | Bottom Depth of Well (m) | Casing Length (m) | Water Level (m) above Mean Sea Level | Chloride in Glacial Aquifer (mg/L) | Hydraulic Conductivity (m/Day) | Transmissivity (m2/Day) |
|---|---|---|---|---|---|---|---|---|
| bedrock | NY 241 | 8 | 183 | 15 | 3.41 | NA | NA | NA |
| NY 206 | 6 | 155 | 7 | NA | NA | NA | NA | |
| NY 207 | 6 | 183 | 8 | NA | NA | NA | NA | |
| NY 234 | 6 | 162 | 9 | NA | NA | NA | NA | |
| NY 189 | 13 | 183 | 71 | NA | NA | NA | NA | |
| NY 187 | 11 | 171 | 88 | NA | 11,800 ** | NA | NA | |
| NY 177 | 2 | 182 | 69 | NA | 7000 ** | NA | NA | |
| glacial aquifer | NY 239 | 6 | 8 | 6 | 1.16 | 641 | 6 | 48 |
| NY 248 | 5 | 12 | 11 | −0.09 | 240 | 550 | 13,470 | |
| NY 237 | 5 | 12 | 11 | −0.04 | 1080 * | 12 | 297 | |
| NY 253 | 8 | 18 | 14 | 3.31 | 357 | NA | NA | |
| NY 235 | 6 | 8 | 6 | 0.95 | 1440 * | 0.05 | 0.10 | |
| NY 242 | 11 | 20 | 18 | 4.47 | 405 | 0.04 | 0.20 | |
| NY 236 | 6 | 25 | 24 | 0.28 | 672 * | 39 | 660 | |
| NY 244 | 8 | 20 | 19 | 0.30 | 217 | 52 | 670 | |
| NY 194 | 9 | 65 | 62 | NA | 15,250 * | 0.9 | 53 | |
| NY 238 | 11 | 11 | 9 | 2.64 | 277 | 22 | 1660 | |
| NY 249 | 5 | 9 | 8 | 0.25 | 560 | 92 | 409 |
Notes: NA indicates the data are either not available or not applicable. * Indicates aquifer test grab samples analyzed with Cl probe. ** Indicates Cl value in the glacial aquifer estimated by EM log through PVC casing. Data available at http://waterdata.usgs.gov/nwis/si.
This article is a U.S. Government work and is in the public domain in the USA; licensee MDPI, Basel, Switzerland. This article is an open access article distributed under the terms and conditions of the Creative Commons Attribution (CC BY) license (http://creativecommons.org/licenses/by/4.0/).
Share and Cite
MDPI and ACS Style
Stumm, F.; Como, M.D. Delineation of Salt Water Intrusion through Use of Electromagnetic-Induction Logging: A Case Study in Southern Manhattan Island, New York. Water 2017, 9, 631. https://doi.org/10.3390/w9090631
AMA Style
Stumm F, Como MD. Delineation of Salt Water Intrusion through Use of Electromagnetic-Induction Logging: A Case Study in Southern Manhattan Island, New York. Water. 2017; 9(9):631. https://doi.org/10.3390/w9090631
Chicago/Turabian StyleStumm, Frederick, and Michael D. Como. 2017. "Delineation of Salt Water Intrusion through Use of Electromagnetic-Induction Logging: A Case Study in Southern Manhattan Island, New York" Water 9, no. 9: 631. https://doi.org/10.3390/w9090631
Note that from the first issue of 2016, this journal uses article numbers instead of page numbers. See further details here.