PEPSO: Reducing Electricity Usage and Associated Pollution Emissions of Water Pumps

1
CDM Smith Inc., Detroit, MI 48226, USA
2
Department of Civil and Environmental Engineering, Wayne State University, Detroit, MI 48202, USA
*
Author to whom correspondence should be addressed.
Water 2017, 9(9), 640; https://doi.org/10.3390/w9090640
Submission received: 1 July 2017
/
Revised: 20 August 2017
/
Accepted: 21 August 2017
/
Published: 26 August 2017
(This article belongs to the Special Issue Advanced Hydroinformatic Techniques for the Simulation and Analysis of Water Supply and Distribution Systems)
Abstract
:Using metaheuristic optimization methods has enabled researchers to reduce the electricity consumption cost of small water distribution systems (WDSs). However, dealing with complicated WDSs and reducing their environmental footprint remains a challenge. In this study a multi-objective version of Pollution Emission Pump Station Optimization tool (PEPSO) is introduced that can reduce the electricity cost and pollution emissions (associated with the energy consumption) of pumps of WDSs. PEPSO includes a user-friendly graphical interface and a customized version of the non-dominated sorting genetic algorithm. A measure that is called “Undesirability Index” (UI) is defined to assist the search for a promising optimization path. The UI also ensures that the final results are desirable and practical. The various features of PEPSO are tested under six scenarios for optimizing the WDS of Monroe City, MI, and Richmond, UK. The test results indicate that in a reasonable amount of time, PEPSO can optimize and provide practical results for both WDSs.
1. Introduction
In the modern world, many systems are designed based on scientific analysis and engineering techniques, but it does not mean that these systems are developed and operated in an optimal way. In recent decades, due to improvement in the computational power of machines and development of new optimization techniques, engineers have focused more on using computer models and deterministic or meta heuristic optimization techniques to optimize the design and operation of systems. There are many optimization efforts related to water systems including piping design optimization, pump operation optimization, sensor placement improvement, model calibration, leakage detection and reduction, system reliability, etc. [1].
About 4% of electricity usage in the US is attributed to the supply, conveyance, and treatment of water and wastewater at the cost of approximately 4 billion US dollars per year. Moreover, due to increasing urban and industrial water demands and a decrease in access to high-quality water resources, it is predicted that the energy consumption of this sector will increase more than 50% by 2050 [2]. According to the US Department of Energy, approximately 75% of the operating costs of municipal water supply, treatment and distribution facilities is attributed to electricity demand [3]. As noted by several researchers, optimizing pump operation has a considerable effect on the water industries, which can offer a reduction of up to 10% in the annual expenditure of energy and other related costs [4,5]. Using hydraulic models to investigate the potential of energy usage and associated pollution emission reduction in water systems has been studied by different researchers. For instance, Perez-Sanchez and his colleagues, by using EPANET model of an irrigation system, showed that theoretically 188.23 MWh/year energy-equivalent to 137.4 ton CO2/year-can be recovered from the system [6,7]. León-Celi, C et al. also used EPANET toolkit and two optimization algorithms to find the optimum flowrate distribution in water systems with multiple pump stations and minimize energy usage and potential leakage [8].
Time-of-use tariff and change in sources of energy in time may increase or decrease the electricity cost or pollution emissions (associated with the generation of energy) of the system, even if the total energy consumption of the system does not change. Elevated storage tanks in the system provide flexibility for operators to shift energy usage of the system. Shifting energy consumption may allow the operator to take advantage of cheaper energy and less polluting generator sources.
Uncertainties in demand of the system and complexity of the possible combination of pump status that can potentially answer operational requirements of the WDS, increase the tendency of operators to maintain water pressure in the system higher than the minimum required pressure. This increases energy usage, water leakage and consequently water and energy waste. Therefore, developing an optimization tool that can automatically react to changes in various inputs and generate a near optimum pump schedule may decrease electricity cost and the environmental footprint of the system.
2. Literature Review
About four decades ago, when researchers started to work on optimization of WDSs, most of them focused on construction cost (reducing the cost of piping) and operation cost (minimizing the cost of energy usage and the power demand of the pump station). However, after a while, other objectives such as increasing reliability and water quality or decreasing environmental footprint were included in the optimization process. In the last decade, the attention toward the environmental effect of energy usage and sustainability of WDSs increased due to increase in public and scientific awareness of climate change and the effect of pollutant emissions from power generation [9]. At first, most researchers considered the WDS optimization problem as a single objective problem. However, some researchers adopt multi-objective methods for optimization of the operation of the WDS [10].
One of the main objectives of the pump operation optimization is reducing the operation cost of pumps. The real electricity tariffs, in many cases, include a peak power demand charge ($/kW) in addition to the energy consumption charge ($/kWh). So, it is evident that a useful optimization tool should be able to use complicated electricity tariffs including both energy consumption and peak power demand costs. There are different examples in previous research of energy consumption charge and peak power demand charge being used. Wang et al. used a time-of-use electricity tariff in their optimization study [10]. Baran et al. also used a time-dependent electricity tariff that was defined based on on-peak and off-peak hours [11]. Shamir and Salomon used a more complicated electricity tariff. They used the real and complex electricity tariff of Haifa city, Israel, which includes three time periods, representing high, medium, and low energy costs. The tariff was different for the weekend and holidays and the various seasons of the year [12]. Working multiple pumps at the same time may cause an increase in required power. This may increase the total electricity cost of the system. There are some examples of researchers taking the power demand charge into account. For instance, Fracasso and Barnes included the amount of peak power demand (kW) as an objective of the optimization process [13].
In addition to the electricity cost, pollutant emissions associated with the electricity consumption is another objective that needs to be optimized to have a sustainable WDS. Wu et al. included the effect of variable emission rates and electricity tariffs in their WDS design optimization study [14]. Stokes et al. also suggested a framework for the modeling and optimization of Greenhouse Gases (GHG) emissions associated with energy usage and pump operation [15]. In most of these efforts, the emission rate of energy usage was considered as a constant value and was linearly related to the amount of consumed energy. However, most of the time, the source of electrical energy is a mix of various types of power generators. As this combination of generators may change in time, the emitted amount of pollutants per unit of consumed energy may change. Researchers at Wayne State University developed the LEEM methodology to calculate the amount of pollutant emissions associated with energy generation at different points in space and time. LEEM is an acronym for Locational Emissions Estimation Methodology and provides real-time and predicted marginal emission factors (kg/MWh) based on location and time of energy consumption [16].
Besides the two above-mentioned objectives, some constraints help to direct the algorithm to solutions that satisfy operational requirements of the WDS. For instance, frequent pump starts can increase the maintenance costs of the system [17]. Some researchers placed some limits on the maximum number of pump starts. Similarly, water pressures at junctions or water flow rate in pipes can be bounded. Constraints can be handled explicitly or can be converted to objectives and handled implicitly during the optimization process. One of the common methods of converting a constraint to an objective is using penalty formula. By this approach, violation from a constraint can be converted to a penalty value and reducing the penalty can be considered as an objective. Zecchin et al. used the pressure penalty to add a pressure constraint to the objective function of the ant colony (AC) algorithm that they used for WDS design optimization [18]. Lopez-Ibanez investigated the effect of constraint on the maximum number of pump starts. He found that a lower limit of the maximum number of pump starts that does not hinder the search for an optimum solution is related to characteristics of the network [19].
In addition to the maximum number of pump starts, other constraints such as minimum and maximum allowed water level in tanks, maximum and minimum allowed pressure at different points of the water network and maximum and minimum allowed velocity of water in different pipes can be considered during optimization. The effect of all of these constraints can be translated to penalty values. Reducing total penalties of a pump operation schedule can be formulated as an objective of optimization. So, reducing electricity usage cost, pollution emissions (associated with electricity usage) and penalties can be considered as three objectives of a pump operation optimization problem.
A multi-objective optimization problem can be solved with multi-objective methods or can be converted to a single objective problem and solved with a single objective optimization algorithm. For instance, Wu and Behandish calculated the amount of the objective function by the total weighted cost of energy and amount of three penalties [20]. Abiodun and Ismail completed a bi-objective optimization that aimed to reduce the electricity cost and maintenance problems [5]. In other studies, researchers used the multi-objective optimization method to solve a multi-objective problem directly and find the Pareto frontier of solutions. For instance, Fu and Kapelan used a multi-objective optimization method for finding the best WDS design based on pipe cost and system robustness [21]. Pollutant Emission Pump Station Optimization (PEPSO) is a platform developed by the water research team at Wayne State University for optimizing the pump schedule of the WDS [16]. The initial version of PEPSO used weighting factors to calculate a single combined objective from electricity usage, pollutant emissions and penalties [22]. However, the newer version of this tool is equipped with a multi-objective optimization algorithm to optimize each objective independent of others and find the Pareto frontiers of solutions.
Converting the multi-objective problem to a single objective problem increases the simplicity of the optimization algorithm. Also, the optimum result is a single solution that can be used directly. On the other hand, by using multi-objective methods, finding optimum solutions with respect to one objective does not have any effect on the process of finding the optimum value of other objectives. Also, there is not any need for normalizing and weighting operations. Defining a meaningful method to combine different objectives such as the cost of electricity usage and weight of pollution emissions and coming up with a single objective is a challenging process. Additionally, the multi-objective approach creates a range optimal solutions as a Pareto frontier that provides some flexibilities for users to select the preferred solution based on their requirements. Finally, a multi-objective algorithm can search the solution space of a multi-objective optimization problem with more freedom. This cannot be achieved with a single objective algorithm and when the effect of one objective on the combined objective is much more considerable than the effect of other objectives.
In the last two decades, many researchers have shifted the focus of WDS optimization from traditional and deterministic techniques, based on linear and nonlinear programming, to the implementation of methods that were generally based on heuristics derived from nature [18,23]. In recent years, Evolutionary Computation has proven to be a powerful tool to solve optimal pump-scheduling problems [11]. The great advantage of metaheuristic algorithms over deterministic methods is that they can be used for almost all types of optimization problems without considering the linearity or convexity of the problem. However, while using metaheuristic algorithms, constraints related to the hydraulic behavior of the solution must be checked separately or should be converted to an objective [24].
Genetic Algorithm (GA) is one of the most used algorithms in the optimization field and especially in water-related problems [25,26]. At first, Simpson et al. suggested using GA in the mid-90s for WDS optimization [27]. Lopez-Ibanez investigated various representations of pump schedule in his thesis and suggested that time-controlled trigger-based representation can lead to a better result and ensure maximum limit of switches per pump in comparison with level-controlled trigger representation. However, his result also showed that time-controlled trigger-based representation did not have considerable advantages on the common binary representation [19]. In this study, we used a customized version of the multi-objective Non-Dominated Sorting Genetic Algorithm (NSGA II) with the binary representation of solutions to develop that WDS or water transmission lines. These networks have a handful of pipes, junctions, pumps and occasionally one or two optimization tool.
One of the most famous free and publicly available software for modeling the WDS is EPANET2 that is published by the US EPA [7]. Lopez-Ibanez reviewed about 20 articles from 1995 to 2004 and reported that most of the researchers used complete hydraulic simulation to evaluate the effect of decision variables on the status of the hydraulic network [19]. We also used EPANET 2.00.12 as the hydraulic solver of the optimizer tool [7].
Most of the previous studies focused on a small-scale elevated tanks [5,10,28]. A small portion of real systems are similar to small test networks of these researches, but most of the time we face large networks with a couple of hundred pipes, junctions, and a considerable number of pumps, valves, tanks, etc. There are a few studies that tried to optimize a real and large-size WDS [4,29,30]. Most of the systems that were used in WDS optimization studies do not have variable speed pumps. The WDS of Monroe City, MI, previously used for comparing three pump operation optimization tools, has both fixed and variable speed pumps [31]. The WDS of Richmond, UK, is also used in several types of research. This model is publicly available for the researcher and is suggested to be used for operation optimization studies of WDSs [32]. In this study, we used both Monroe and Richmond WDS models to test the developed optimization tool.
3. Tool Development and Methodology
3.1. Transition from the First Version of PEPSO to the Second Version
The optimization tool that is introduced in this article is the second version of PEPSO [33]. The first version of PEPSO was the only tool in this field which was able to optimize the pump schedule of a WDS to reduce pollution emissions of the system based on location and time of energy consumption.
The first version of PEPSO was compared with other optimization methods, including the Markov Decision Process (MDP) and Darwin Scheduler (DS) [31]. This comparison showed that PEPSO was as good as other tools on the market and its unique emission optimization capability made it an exceptional tool. However, using a single objective optimization technique limited the capability of this tool for searching a wide area of the solution space. Besides, the first version of PEPSO did not have enough options to control the water level in tanks of the WDS effectively. It could use a time-of-use electricity tariff for the whole system, but it was not able to use separate tariffs for different electricity meters and calculate peak power demand cost. Also, this tool could not effectively control the number of pump starts during an operation cycle.
Despite all unique features of the first version of PEPSO, all of the limitations mentioned above prevent its use for optimizing the pump schedule of the WDS outside of the research environment. The second version of PEPSO that is introduced in this article was developed to alleviate all of these shortages. Also, some fundamental changes in the optimization algorithm of PEPSO increased the efficiency of the optimization process, resulting in the generation of a more practical solution in a shorter period.
3.2. Introducing the New PEPSO
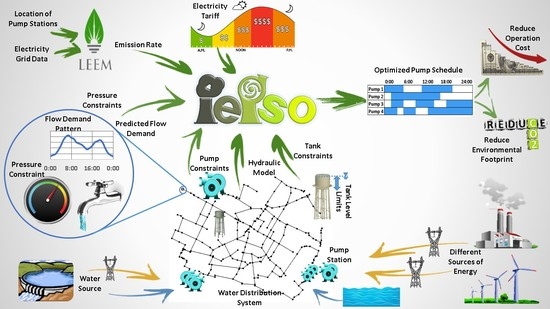
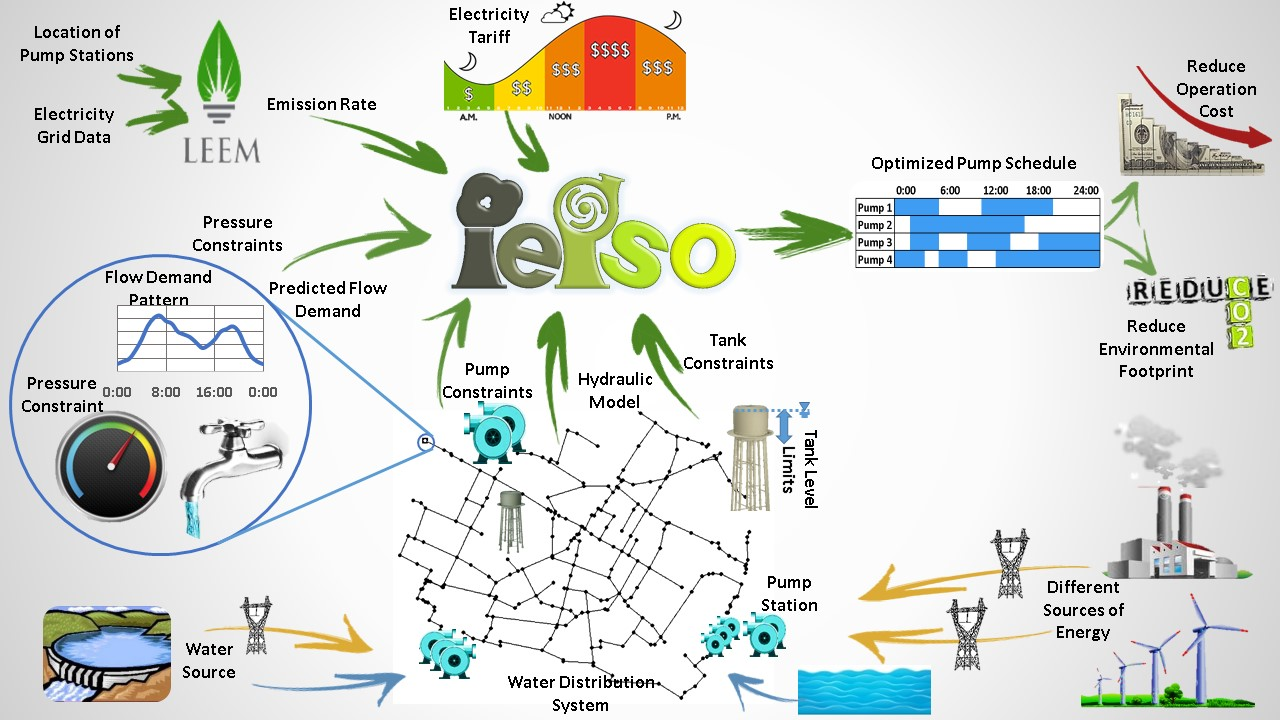
PEPSO is a free and publicly available modular optimization program with a graphical interface that uses a customized NSGA II algorithm for optimization. Different qualities and characteristics, including clarity, familiarity, responsiveness, efficiency, consistency, aesthetics and forgiveness were integrated into the graphical user interface of PEPSO. Users can define a detailed electricity tariff for each pump including time-of-use energy consumption charge ($/kWh) and power demand charge ($/kW). They can also select a desired pollution level or a combination of pollution levels for optimization. PEPSO can connect to the LEEM server or use offline data to get the location and time-dependent emission factors (kg/MWh) that are required for pollution emission optimization. Various types of hard and soft constraints can be imposed on pumps, tanks, junctions and pipes of the WDS. In PEPSO, a wide range of optimization options including five different stopping criteria, exploration and exploitation rates, initial conditions, etc., can be defined. Users can also select any combination of three objectives (electricity cost, pollutant emissions, total penalty) for optimization. Finally, this tool provides a broad range of reports in the format of text (tabular data) and/or 2D and 3D graphics (charts and plots). All of these features can be accessed through the Graphical User Interface (GUI) or can be defined and edited directly on the PEPSO project file by using a simple text editor [33].
It was mentioned that PEPSO uses a binary coding scheme for storing pump schedules. It means that the pump schedule is stored as a table, each row of which shows the operational status of a pump and each column corresponds to a time block (usually a one-hour block). For fixed speed pumps (FSP), each cell of the pump schedule table can store the value of 0 or 1 which refer to the OFF or ON status of the pump. For variable speed pumps (VSP), the value of the cell can be 0 (OFF) or a number between the minimum relative rotational speed and 1.
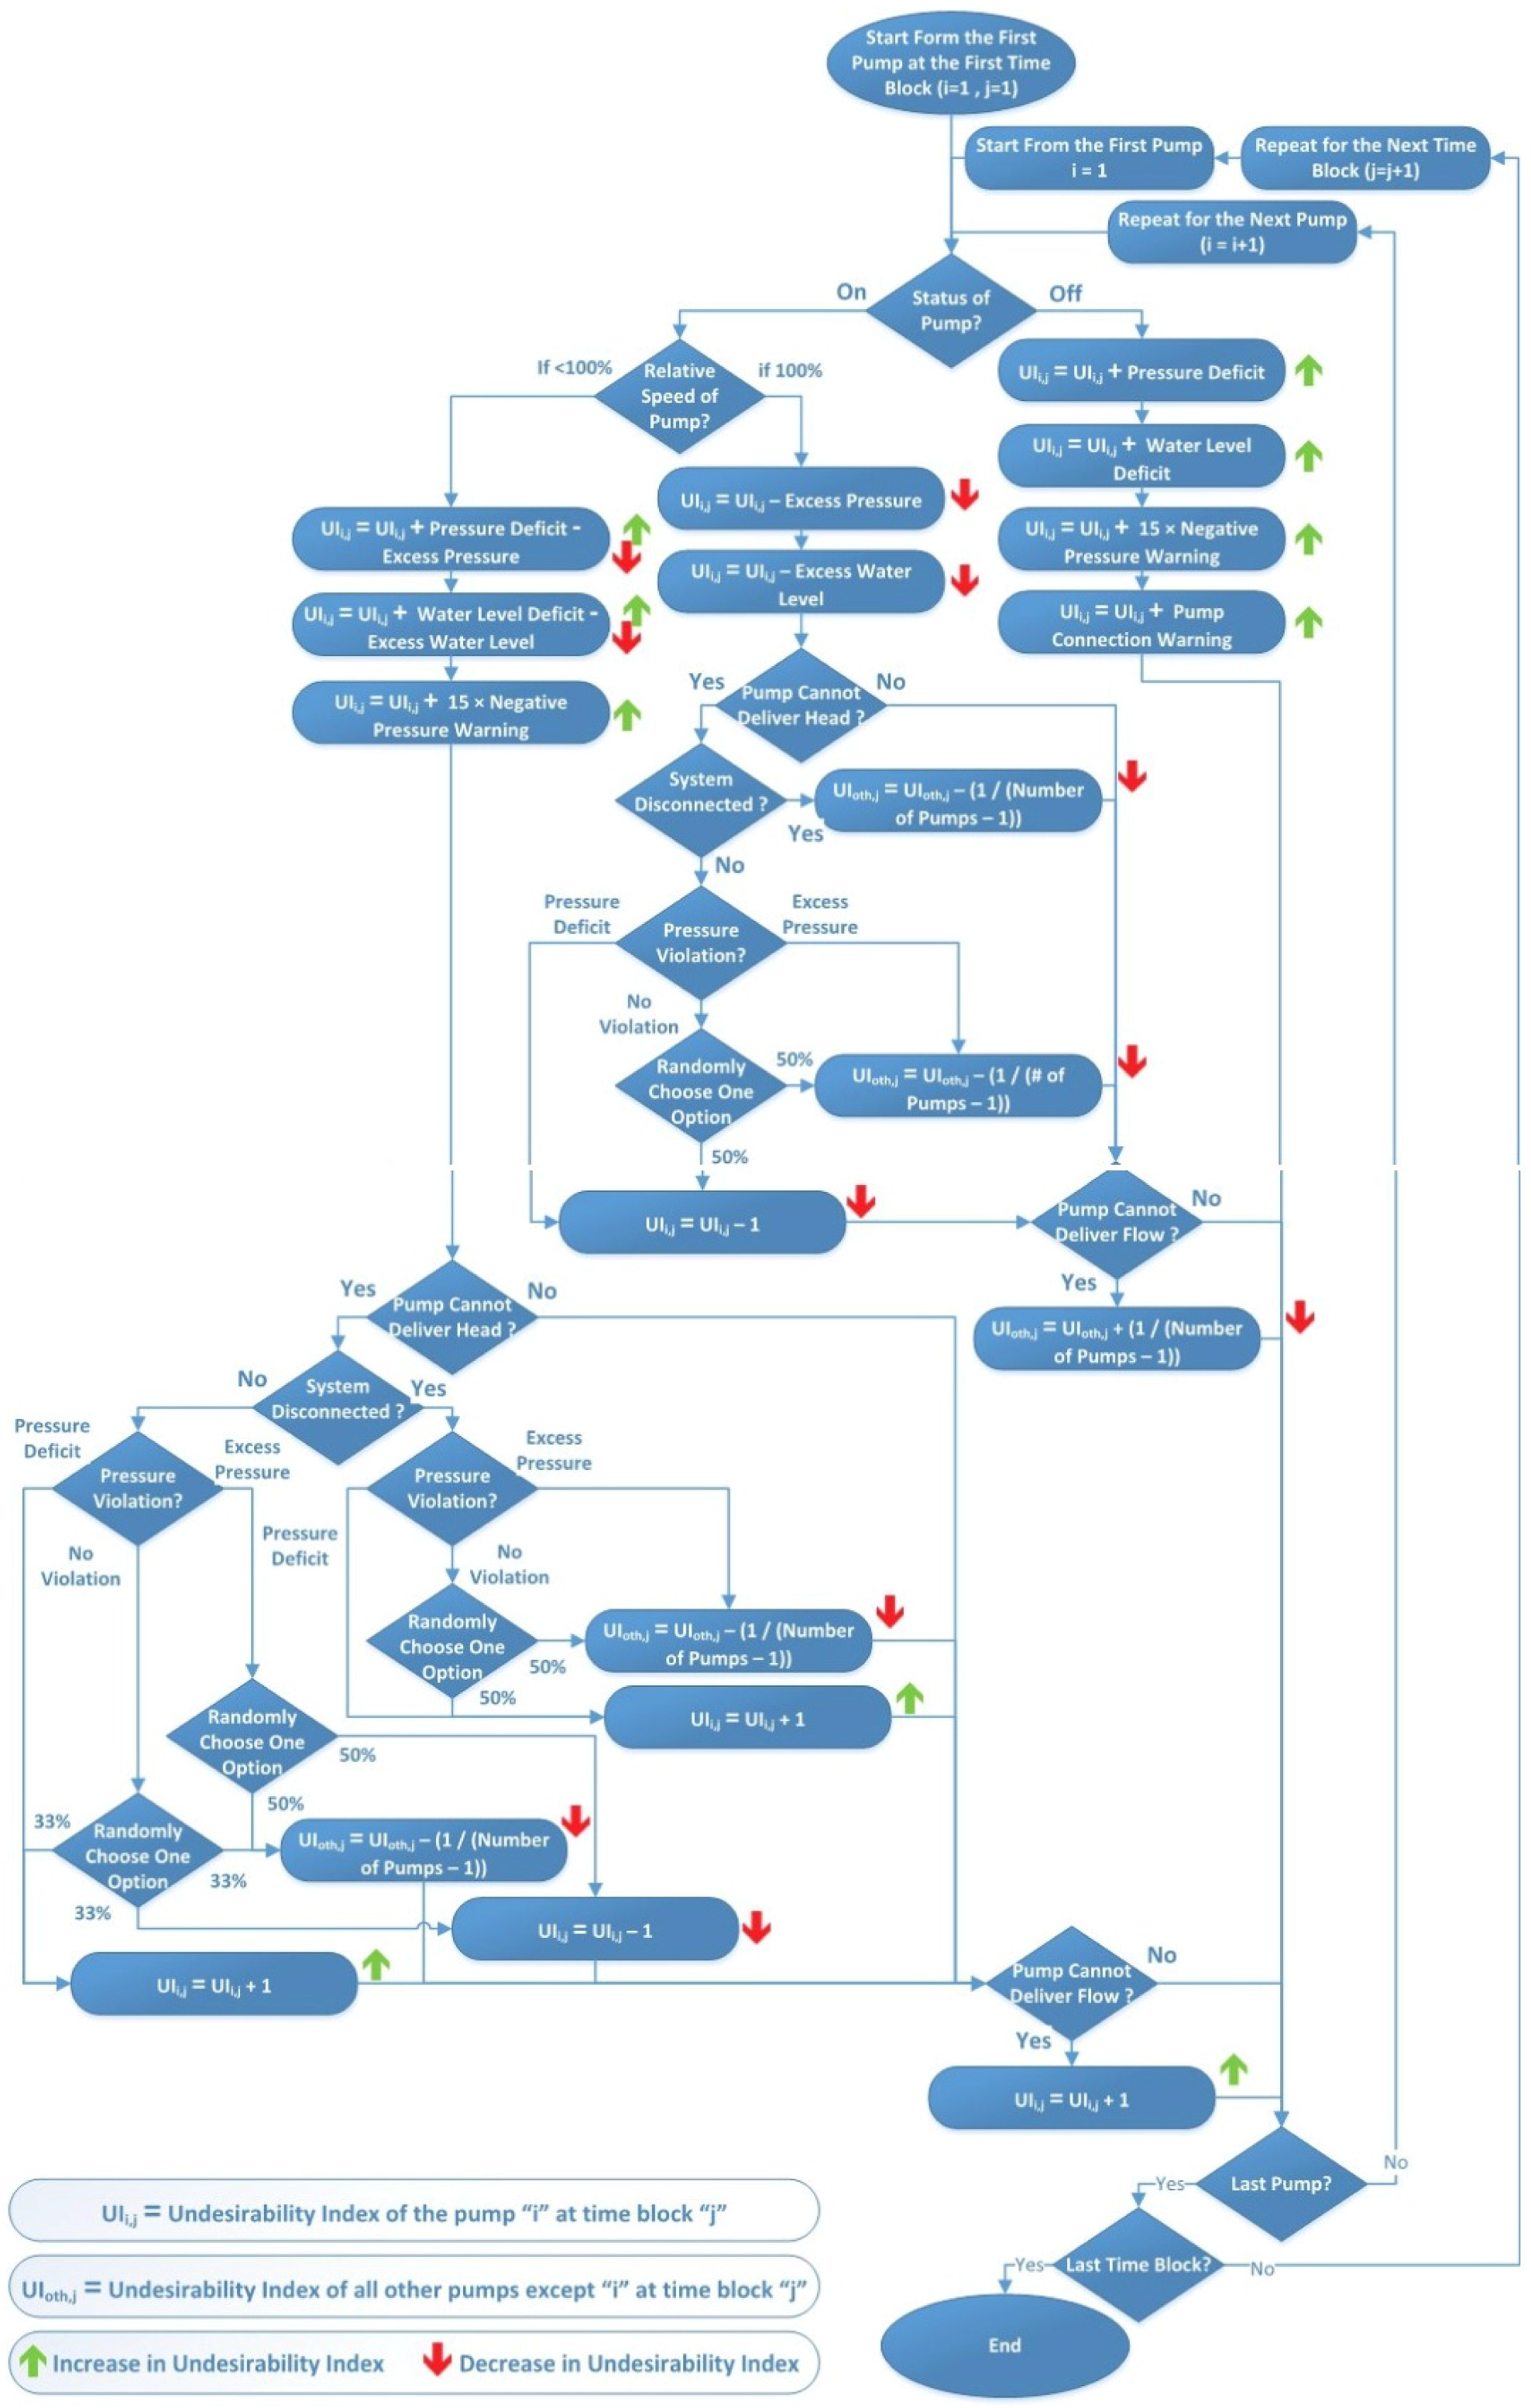
The new PEPSO introduces the Undesirability Index (UI) to improve the crossover and mutation operations of GA. The UI is a measure which shows the relative level of the undesirability of the operational status of a pump at a time block. So, pump operation with a high UI are good candidates for modification, and changing them may help to get closer to the optimum pump schedule and get more practical solutions. The UI of a pump schedule is stored in a table similar to the pump operation schedule table. PEPSO solves the hydraulic model of the WDS based on a proposed pump schedule. Then, for each cell of the UI table, PEPSO checks if the pump operation status causes excess or deficit pressure at junctions or water level in tanks. It also checks if the pump operation status caused “negative pressure warning”, “pump cannot deliver head or flow warning” and “system disconnected warning”. All of this information will be used to calculate the UI of a pump at a time block. For instance, if at a time block, the program sees that there is some excess pressure at junctions and a high level of water in tanks, it shows that energy in the system is probably more than the minimum required level. Therefore, some pumps that are ON during that time block can be turned OFF. Here, PEPSO increases the UI of the ON pumps at that time block, during which the mutation process helps to identify suitable mutation candidates (pumps that can be turned OFF) and generate a better pump schedule. So, instead of randomly changing the pump operation status at each iteration, PEPSO uses the UI values and finds a promising part of the pump operation schedule that can be changed to create a better pump schedule in a more efficient way. The process of calculating the UI is shown by a flowchart in Figure 1. Up and down arrows in the algorithm show operations that change the UI value of a pump at a time step in a way that increases or decreases the probability of turning on the pump, respectively (or increase/decrease the rotational speed in the case of variable speed pump). More details about calculating the UI and its usage during crossover, mutation and the elitism process is beyond the scope of this article and can be found in Sadatiyan’s thesis [34].
To produce a new generation during the optimization process, at first a user-defined portion of the population is selected as parents for crossover and mutation steps. PEPSO uses the roulette wheel sampling method [35] for this purpose, and the probability of choosing a pumping schedule for crossover, mutation and elitism steps is proportional to its non-dominated rank. The customized crossover operator of PEPSO acts on a whole time block of the selected pump schedule instead of an individual pump status at a time block (a single gene). After choosing a pump schedule as the primary parent, Time Step Undesirability Indexes (TSUIs) of the parent will be calculated. The TSUI of a time step is the total absolute values of the UI of all pumps at the time step. A time block with a high TSUI indicates that the combined effect of the operational status of all pumps at the time block is not desirable. It indicates that the time block is a suitable candidate to be changed and create a better pump schedule. Therefore, the operational status of all pumps at the selected time block will be replaced with the operational status of all pumps from the same time block of another solution with a lower TSUI.
After the crossover step, a user-defined portion of the population is selected for mutation. During mutation, a user-defined portion of the pump status at different time blocks (genes) is selected to be changed. For constant speed pumps, the status of the selected gene is modified from ON to OFF and vice versa. For variable speed pumps, the UI is used to determine if it is better to increase the relative rotation speed of the pump or decrease it to make the UI value closer to zero. The probability of selecting a cell or a time block of a pump schedule in mutation or crossover steps is proportional to their TSUI and UI respectively. Before using the roulette wheel method, PEPSO adjusts the selection probability values of all pump schedules. The amount of water level deficit in tanks at the end of the operation cycle and the number of times that the proposed schedule causes negative pressure warning in the system are used to reduce the probability of selecting a pump schedule. This adjustment reduces the probability of selecting a pump schedule which is not practically acceptable for mutation, crossover and elitism steps [35].
All generated children are added to the previous generation. The combined population is ranked and sorted. By using the roulette wheel sampling method, the required number of pump schedules is selected to create the next generation.
PEPSO uses a wide variety of stopping criteria to determine when to stop the optimization process and report the final result. The optimization process can be stopped based on (1) the maximum time of optimization, (2) the maximum number of iterations, (3) the maximum number of solution evaluations, (4) the maximum number of stagnant iterations, and (5) reaching a goal for each optimization objective. The stagnant term relates to the change in the value of the objectives of the solution. If during an iteration, the value of objectives of the best solution does not change more than a defined minimum amount, the iteration will be considered as a stagnant iteration.
It was explained that PEPSO is a multi-objective optimizer, so the final result of the optimization process is a Pareto frontier of non-dominated solutions (pump schedules) [36]. However, in practice, we can use just one schedule for operating pumps. Here, PEPSO is equipped with an algorithm which helps users to select the final pump schedule among the solutions of the Pareto frontier. PEPSO, at first, solves the hydraulic model of the WDS by using all pump schedules in the Pareto frontier. If a pump schedule causes negative pressure warning, then that pump schedule will be filtered out. Similarly, if the water level in tanks or the pressure at junctions of the WDS goes beyond the hard constraints, that pump schedule will be filtered out. The remaining pump schedules are non-dominated solutions which are feasible and practical. So, by using weighting factors that are defined by users, the final solution will be selected. It should be noted that the weighting factors are not used during the optimization process and are just used as an indicator of user preference for selecting the desired solution among the solutions of the final Pareto frontier.
4. Experimental Demonstration
Multiple optimization scenarios were considered for two networks to evaluate the performance of the developed optimizer tool. These test cases, scenarios, and the result are explained in the following sections.
Design of Experiment
The EPANET hydraulic model of two WDSs is used for the optimization test. The first case is the detailed model of the Monroe WDS in Michigan and the second case is the skeletonized model of the Richmond WDS, UK [37,38]. The information summary of both models is presented in Table 1. The WDS of Monroe has more components, and its hydraulic simulation is more computationally intensive than the Richmond WDS. In this research, a Lenovo ThinkPad W520 workstation was used for conducting the tests [39]. The CPU time of a 24 h hydraulic simulation of the Monroe WDS with this computer is 14.95 milliseconds. This time for the skeletonized version of the Richmond network is 5.54 milliseconds. In addition to the complexity of the hydraulic model, the Monroe WDS has six more pumps than the Richmond WDS. This considerably increases the number of possible pump combinations and size of solution space of the Monroe WDS. The water storage capacity of the Monroe WDS is considerably lower than the storage capacity of the Richmond WDS. So, the Richmond WDS has more flexibility regarding shifting energy consumption of the system by storing water in elevated tanks.
Constraint on the water level in tanks and pressure at junctions of both the Monroe and Richmond WDS are defined in Table 2 and Table 3. Some strategic junctions are selected in both networks, and the upper and lower bound of their desired water pressure ranges are shown in Table 2. In addition, minimum and maximum allowed pressure of 0 and 200 m are respectively defined as hard constraints and allowed pressure limits for all junctions. Similarly, for all tanks of both WDSs, the upper and lower bound of the desirable range of water level are presented in Table 3. These limits are soft constraints and violating them increases the total penalty associated with the pump schedule. For calculating penalties, at first, the amount of violation from the upper and lower limits is calculated and then the calculated violation is raised to the power of 1.5. Penalty calculation formulae that are implemented in the PEPSO algorithm are listed below.
where
- Penalty associated with water pressure violation at junctions
- Penalty associated with water level violation at tanks
- Time step index starts from the 1st time block and goes to the Ith time block
- Junction index starts from the 1st junction and goes to the Jth junction
- Tank index starts from the 1st tank and goes to the Kth tank
- A power defined to increase the penalty by increasing the amount of violation. x = 1.5 is used.
- Water pressure of junction j at time block i
- Maximum allowed water pressure of junction j
- Minimum allowed water pressure of junction j
- Water level of tank k at time block i
- Maximum allowed water level of tank k
- Minimum allowed water level of tank k
The energy consumption charge component of an electricity tariff of the Monroe WDS is time dependent and has two off-peak and on-peak rates. The on-peak period starts from 11:00 and finishes by 19:00 and its energy charge is 0.04408 ($/kWh). The Energy charge of other Off-peak hours is 0.04108 ($/kWh). Daily peak power demand charge of this system is 0.48 ($/kW). The Richmond WDS has six electricity tariffs for six pump stations (see Table 4). These are also time-of-use tariffs and just have the energy charge component (not peak power demand charge). The on-peak hours start from 07:00 and ends by 24:00 for all tariffs.
Emission factors (kg/MWh) that are needed for the calculating pollution emissions of each solution are obtained from the LEEM server. Table 5 shows emission factor of CO2 that was employed in all optimization tests of this study [40]. Based on the hydraulic models, duration of an optimization run is 24 h with one-hour time step. The same set of values for parameters of optimization algorithm was used for all tests that are listed in Table 6. The crossover and mutation percentage define the portion of the population which should be selected for crossover and mutation steps respectively. The Crossover and mutation rate shows the portion of selected solution which should be modified during crossover and mutation steps.
Six optimization scenarios were defined to test different aspects of the optimization process. In the base scenario (S0), WDSs were optimized based on the electricity cost and total penalties (penalties of water level in tanks and pressure at junctions). The result of an optimization run may change based on the initial population and stochastic characteristics of the optimization operators. So, each scenario was repeated five times and the average results of five repeated tests of each scenario and its standard error of means (SEM) are reported. In the first scenario (S1), WDSs were optimized to reduce all three objectives (electricity cost, CO2 emissions, and total penalty). The next scenario (S2) is defined to evaluate the effect of optimizing based on the electricity cost and CO2 emissions, so it is just optimized based on penalties. This scenario is similar to the base scenario, but it uses the total penalty as the only optimization objective.
The third scenario (S3) was defined to test the effect of using the UI in the optimization process. So, this scenario (S3) is similar to the base scenario without calculating and using the UI. The fourth scenario (S4) is defined to investigate the effect of water level constraints on the final results. This scenario does not have any water level constraint in the tanks. Finally, the fifth scenario (S5) is defined to see the effect of time-of-use electricity. This scenario is like the base scenario but uses a fixed rate electricity charge ($/kWh) for the whole period of operation and does not include the peak power demand charge ($/kW).
5. Results and Discussion
In total, 60 optimization runs have been done on two WDS models. The required time for completing an optimization run of the Monroe WDS is 02:14:44 ± 00:03:43. This time, for the skeletonized version of the Richmond WDS model, is 00:35:38 ± 00:01:36. PEPSO reports the electricity cost of the final solution. However, before comparing the electricity cost of different solutions, we should consider that the final volume of stored water in the system might not be equal in all solutions. Although the final level of water was in the acceptable range from a system operation point of view, filling or draining an elevated tank can be regarded as storing energy into or draining energy from the system. Therefore, the net energy consumption of the system is calculated considering the change in volume of stored water. Similarly, the net electricity cost and net CO2 emissions of each solution is calculated before comparing the results. It is assumed that a long-run deficit or surplus water volume at the end of each day will be balanced by the change of operation in different hours of upcoming days. Therefore, the average electricity charge ($/kWh) and CO2 emission factor (kg/MWh) were used to take into account the effect of this deficit or surplus water volume and calculate the net electricity cost and net CO2 emissions.
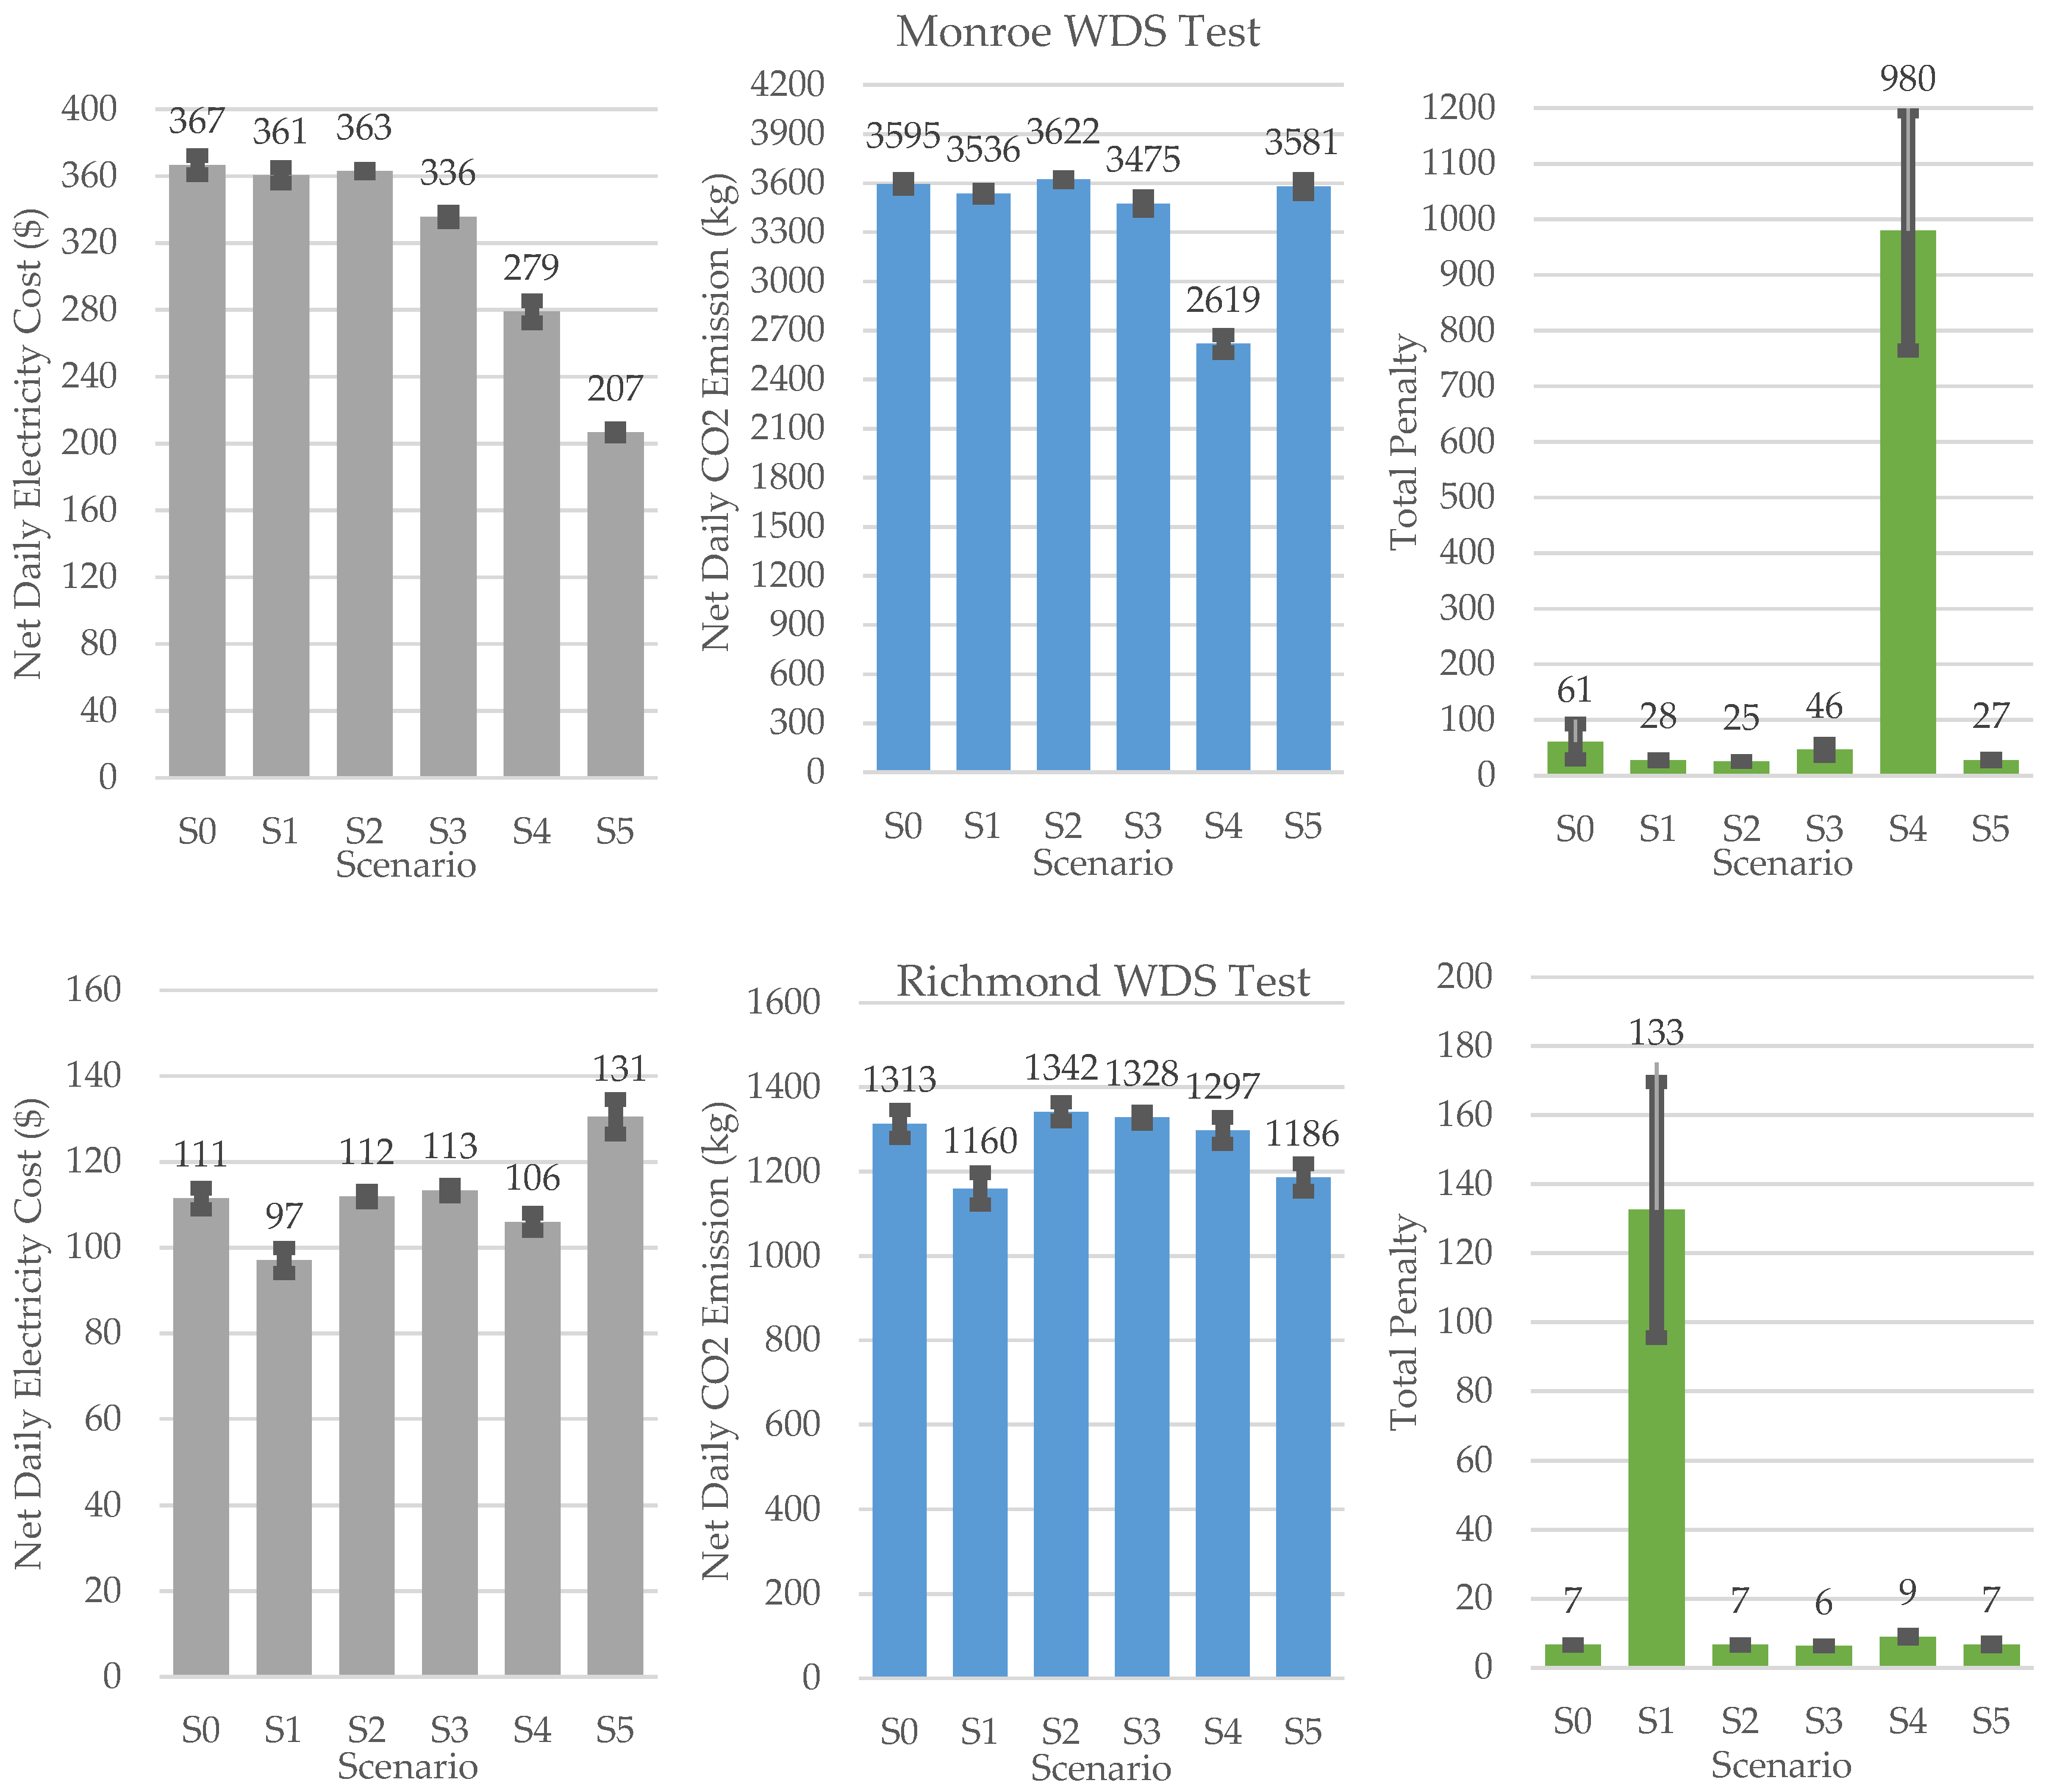
Net electricity cost ($) (left), net CO2 emissions (kg) (middle) and total penalty (right) of all five scenarios of the Monroe WDS (top) and the Richmond skeletonized WDS (bottom) tests are displayed in bar charts in Figure 2. Each column shows the average result of five repeated tests and the error bar on top of it displays the SEM value. Except for columns that show high total penalty values, the SEMs of all the other results are relatively small. This shows the consistency in the outcome of PEPSO runs. Since penalty values are related to the amount of violation raised to the power of 1.5, it is expected to see that the moderate change in violation value results in a more severe change in penalty values.
Comparing results of scenarios S0, S1 and S2 showed, in both WDSs, optimizing based on three objectives (S1) is the most effective strategy for reducing objectives and obtaining a practical result. Theoretically, we expect to see the lowest amount of electricity cost in the result of the S0 scenario, but the result showed that in the majority of tests, both the electricity cost and CO2 emissions of the S1 scenario are less than S0. On average, the electricity cost and CO2 emissions of S1 scenarios are 12.9% and 11.7% in Richmond tests and 1.7% and 1.7% in Monroe tests less than S0 results respectively. Since, in most cases, reducing energy usage decreases both the electricity cost and pollution emissions, optimizing based on all three objectives (S1) helps PEPSO to better explore the solution space. So, despite our theoretical expectation to see the minimum electricity cost in the result of the S0 scenario, in practice, the S1 scenario is more efficient at finding low energy consumption solutions in a limited amount of time.
As expected, optimizing just based on total penalty (S2) results in less penalty with respect to the outcome of both S0 and S1 scenarios. The total penalty of the S1 scenario of the Richmond test was considerably higher than the S0 and S2 scenarios. Investigating the detailed results, in this case, showed that there are two solution groups that can be selected as the optimum solution. In the first group, pumps are using more energy and pressure at junctions and water levels in tanks are slightly below the upper boundary of the desirable range. So, total penalties of this solution group are low. The second solution group has considerably less energy consumption and correspondingly less CO2 emissions. However, in these solutions, pressure at a couple of junctions and water level at some tanks are below the desired level which increases the total penalty of these solutions. Although the violations in these cases are not beyond the acceptable range, from the optimizer perspective, these are dominated solutions when there is only one objective (total penalty). So, PEPSO does not choose the final solution from the second group. However, in the S1 scenario, when all three objectives are considered, a solution from the second group, which has some penalties but has a considerably lower electricity cost and CO2 emissions, is reported as the optimum solution.
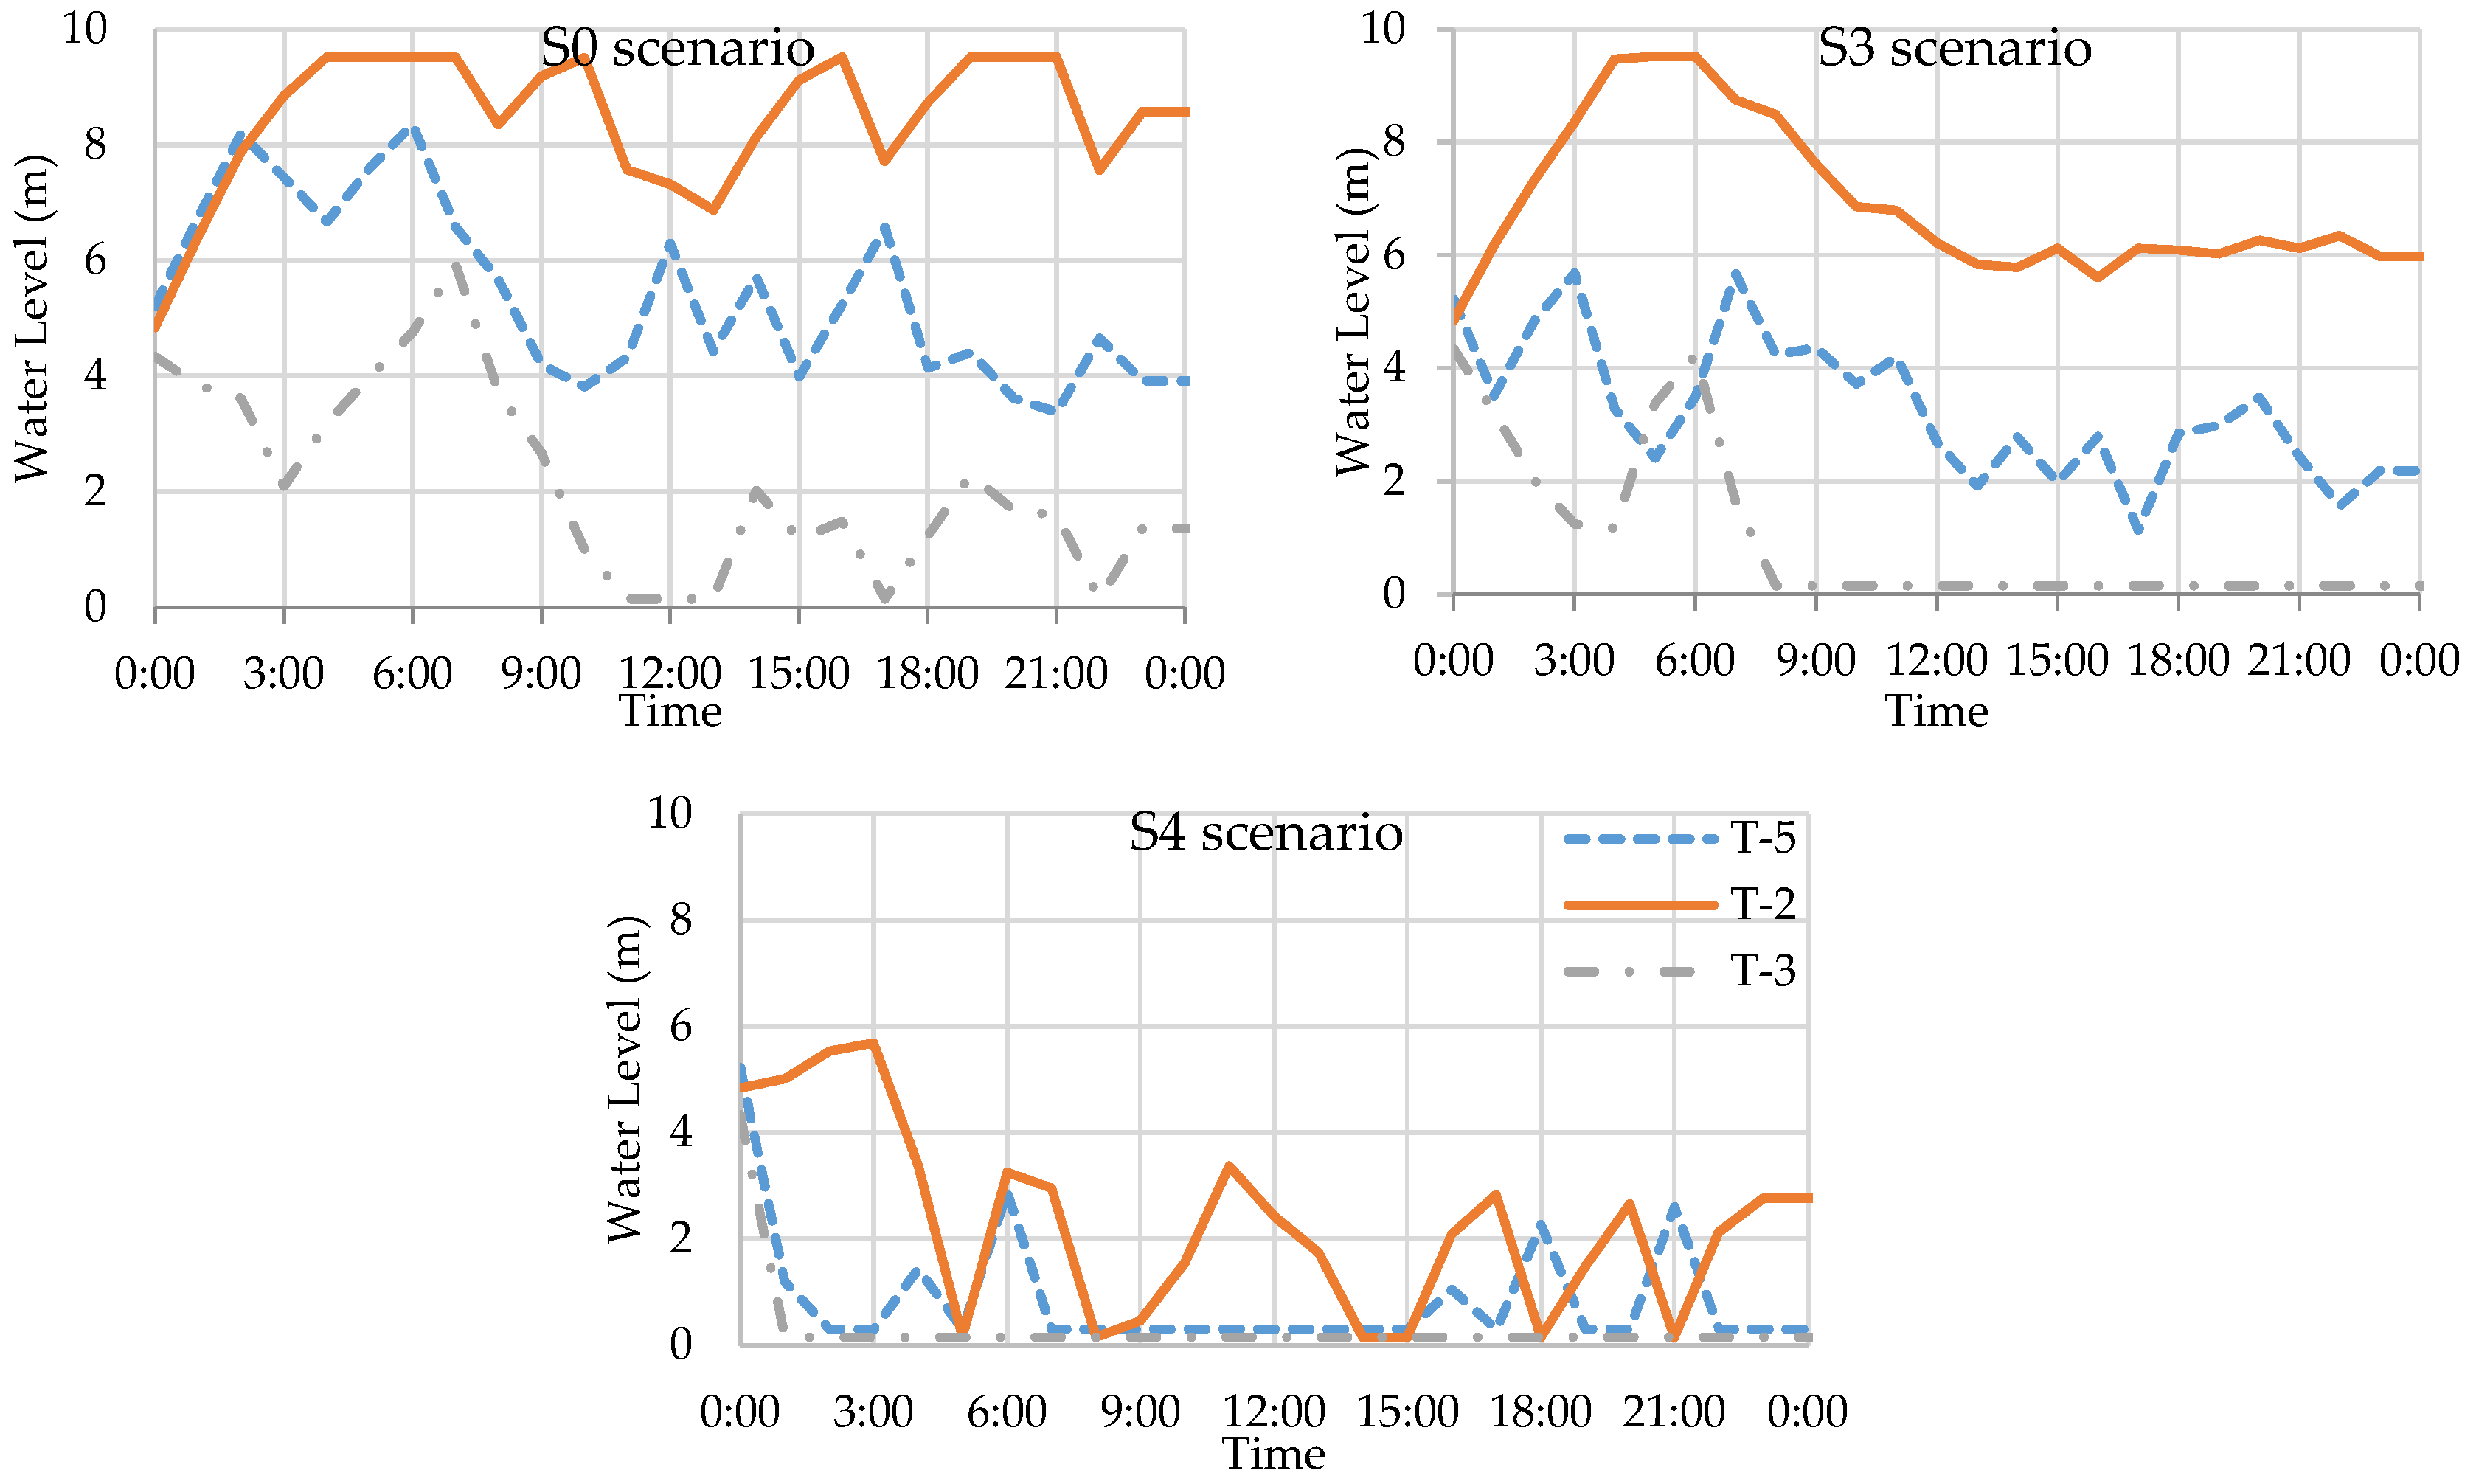
Comparing results of the S0 scenario with those of the S3 scenario showed that, when the UI is used in the optimization run of the Monroe WDS, on average, the net electricity cost is reduced by 8.5%. Although, at first sight, it seems that using the UI reduced the effectivity of the optimization algorithm, a closer look at the results revealed that the result of the S0 scenario is more practical than the S3 scenario. During the whole operation period, the stored volume of water in tanks in the S3 scenario is, on average, 5.6% lower than S0. The final volume of stored water in tanks for the S3 scenario is 10.9% lower than the final volume of stored water in the S0 scenario. Also, solutions of the S0 scenario, on average, have less than two warnings about pumps that cannot deliver head, but S3 results, on average, have about four and one warnings for pumps that cannot deliver head and flow respectively. Figure 3 displays the water level pattern in tanks of typical results of S0 (top left) and S3 (top right) scenarios. It can be seen that the solution of S3 tends to drain tanks more than that of S0.
The hydraulic model of the skeletonized version of the Richmond WDS was simpler than the Monroe WDS. So, in this case, optimizing with or without the undesirability calculation did not considerably change the results. Results of both S0 and S3 scenarios are close with respect to total penalty, electricity cost and the number of warnings. It seems that the undesirability calculation helped a little bit to find solutions with slightly lower CO2 emissions (2.2%). However, it should be considered that calculating undesirability is an additional computation load on the optimization process. On average, calculating and using the UI in the optimization process of the Monroe WDS increased the required time for the optimization run by 8.9%. Based on these results, we can say that calculating the UI increased the required time for 16,600 solution evaluations in an optimization run. However, the final result was more practical and of higher quality. Obtaining a final solution with the same level of quality without using the UI needs more iterations and solution evaluations that increase the length of the optimization process. We expected that using the UI, by quantifying positive and negative effects of pump statuses on hydraulic responses of the water network, adds some intelligence to the process of producing the next generation and makes possible more purposeful crossover, mutation and elitism steps. Although calculating the UI increases the computational load of each iteration, we expected to see that within the same number of iterations, using the UI can provide better results. The outcome of these tests showed promising results regarding the use of the UI. However, this area still needs further research. More studies on complicated networks with vast solution space can help to show and quantify the level of effectiveness of the UI. It is possible that, in the case of a complex system with multiple pumps and vast solution space, traditional blind crossover, mutation and elitism steps (without using UI) cannot find an acceptable solution within a reasonable number of iterations. Results of the S4 scenario showed that giving PEPSO the possibility to operate pumps without tank level constraints, on average, reduces the electricity cost and CO2 emissions of the system by 24.0% and 27.2%.
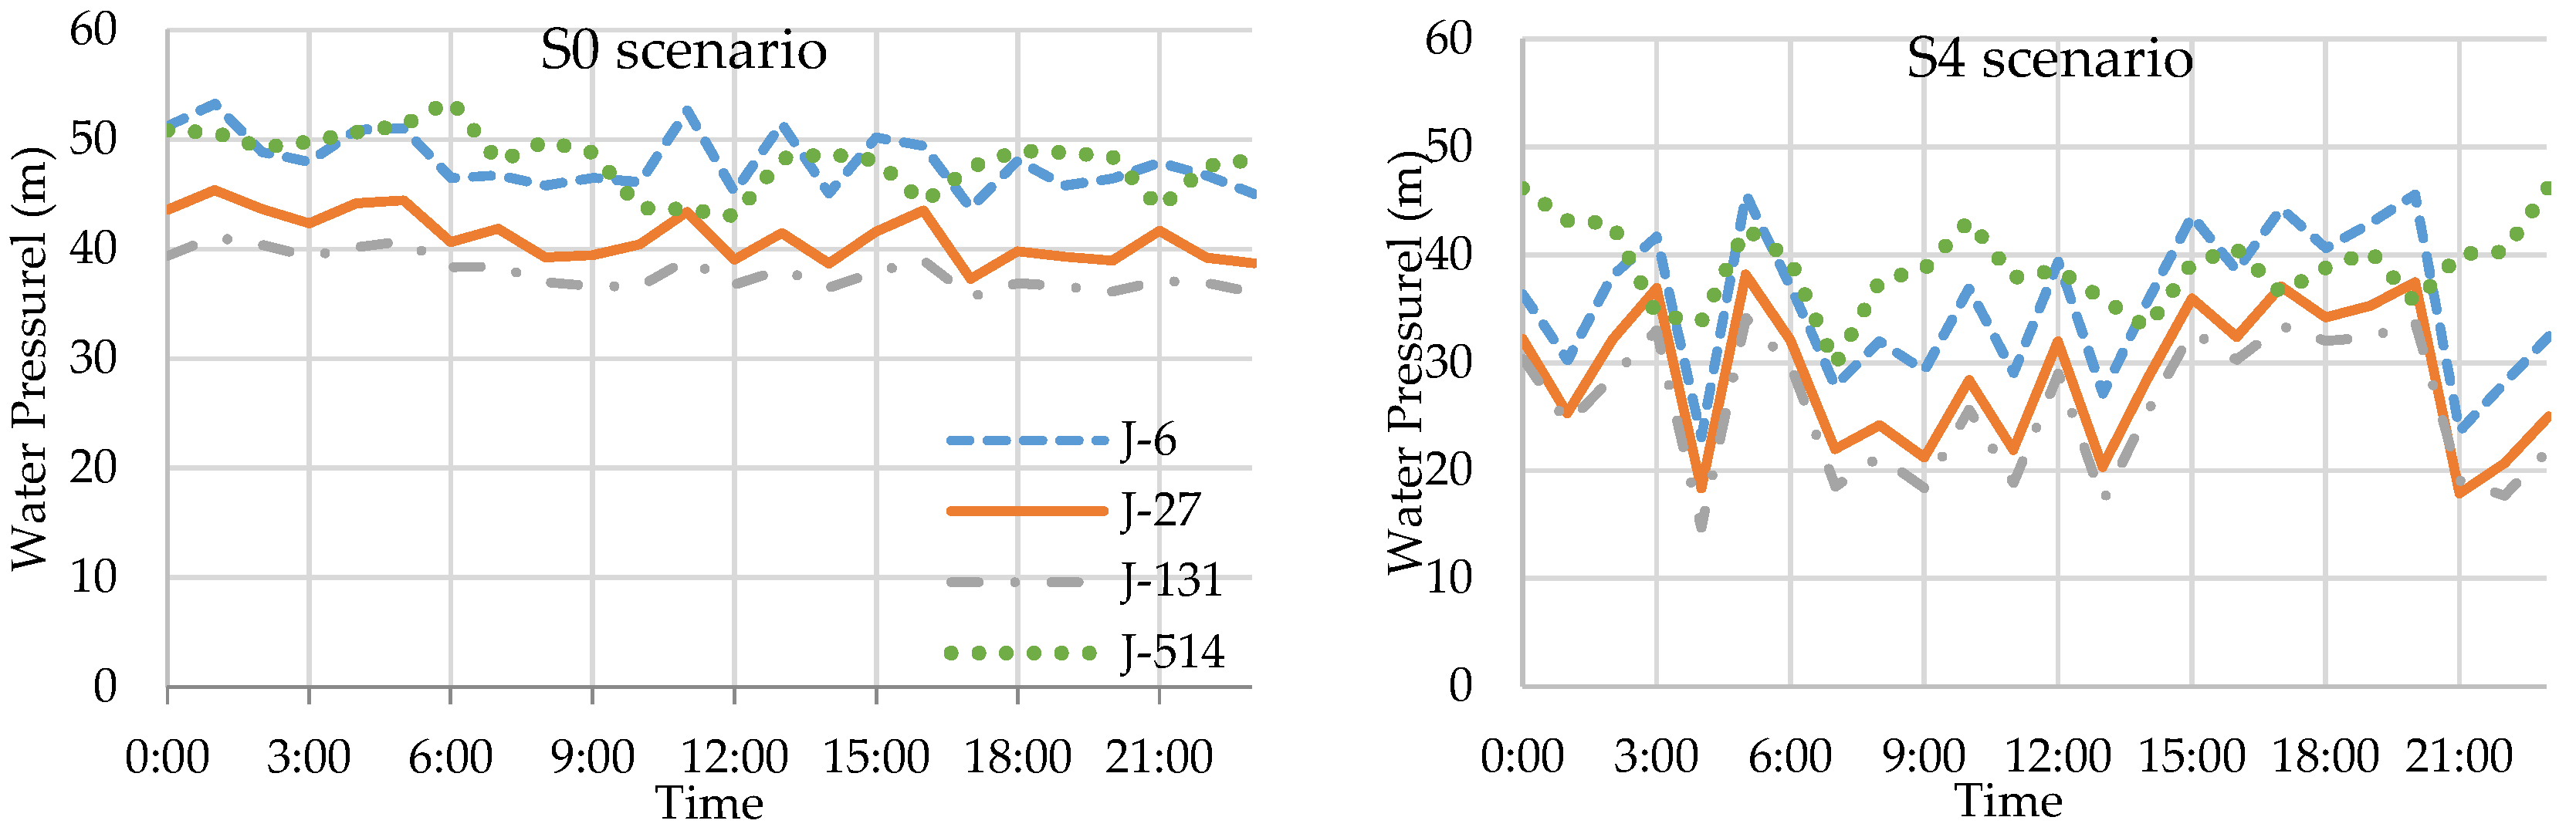
Despite the fact that removing water level constraints reduces the electricity cost and CO2 emissions, it considerably increased the water level violation of tanks and water pressure violation at strategic junctions. In the S4 scenario, the pressure of junctions has some fluctuations that caused considerable low and high-pressure penalties. The water level penalty of tanks of the S4 scenario is four times more than for the S0 scenario. Comparing patterns of the water level in tanks (see Figure 3) and water pressure at junctions (see Figure 4) of the S4 and S0 scenarios can clearly show these differences.
On average, constraining the water levels of tanks during the operation cycle led to a reduction of more than 32% in the final volume of stored water. Monroe test results indicate that water level constraint effectively helps to keep the final tank level balanced and prevents tanks from draining during the whole operation period. Similarly, optimizing the pump operation of the Richmond WDS without water level constraints for tanks (S4), on average, reduces the net electricity cost and CO2 emissions by 4.8% and 1.2% respectively. However, this increases the total penalty by 35.1%.
Results of the test on the Monroe WDS showed that having a flat rate electricity tariff, on average, can lead to a 9.7% increase in peak power demand (kW) while the total consumed energy (kWh) is almost unchanged. Although the total energy consumption in both S0 and S5 scenarios is almost unchanged, 2.1% of the total energy consumption in the S5 scenario shifted from off-peak hours to on-peak hours. These results confirm that the power demand charge and time-of-use electricity tariffs will force PEPSO to find an optimized solution with more energy consumption during off-peak times and with a reduced peak power demand.
The overall electricity cost in the Richmond system is related to the time-dependent energy consumption charge. However, in the S5 requirement of the system. PEPSO uses a customized version of the NSGA II to find the Pareto frontier and then select the best solution as the optimum pump scenario, the flat rate electricity tariff, on average, reduced the total energy use (kWh) from the off-peak hours by 3%and added half of that to the on-peak hours. By this change, the remaining 1.5% of energy is saved. Previously, due to the use of a time-of-use electricity tariff, PEPSO needed to shift energy usage to reduce the electricity cost of the system. This shift of energy usage caused a 1.5% energy loss due to head losses while filling and draining tanks. It is interesting to see that the solution of the S0 scenario drained 21.6% of the stored volume of water in tanks of the Richmond WDS. While the S5 scenario just drained 12.0% of this volume.
6. Conclusions
The new version of PEPSO, which is introduced in this article, is a multi-objective optimization tool. It can be used to find a pump schedule for the WDS to reduce the electricity cost and corresponding pollution emissions while satisfying the required operational schedule. It uses EPANET toolkit for hydraulic stimulation. The Undesirability Index is a measure that enables PEPSO to find promising ways of modifying the solution to get closer to the global optimum solution and create practical solutions. Test results on the Monroe WDS and skeletonized version of the Richmond WDS model showed that PEPSO could optimize the detailed model of the Monroe WDS effectively with 13 pumps in about 2 h with a computer system that can be found in a typical WDS design or operation offices (for more detail, see Section 5). The time required to optimize the skeletonized version of the Richmond WDS model was about half an hour.
- Optimizing based on all three objectives (S1) reduces the CO2 emissions of the Monroe and Richmond WDSs by 1.3–3.4%. Optimizing based on all three objectives at the same time is more effective than optimizing based on only the electricity cost or total penalty.
- Optimizing based on just penalty (S2 scenario) reduced the total penalty on Monroe and Richmond WDSs by 10 and 5.8% respectively.
- Calculating the Undesirability Index helped PEPSO to find more practical optimized solutions with fewer EPANET warnings and less tank drainage. However, on average, the undesirability calculation increased the required optimization time by 8.9%. The effect of the UI on finding high-quality solutions for a complex system with vast solution space needs to be evaluated.
- In the S4 scenario, the Monroe WDS was optimized without tank level constraints. The water level penalty of tanks of the S4 scenario is more than four times the water level penalties of the base scenario (S0). Like the Monroe WDS, optimizing without tank level constraints reduced the electricity cost and CO2 emissions of the Richmond WDS. However, it considerably increases the water level penalty of tanks (35.1%). Removing water level constraints increases both water level and water pressure penalties and led to impractical and unacceptable solutions.
- The time-of-use electricity tariff forces PEPSO to shift 1.7% of energy consumption from on-peak hours to off-peak hours. Including the power demand charge in the electricity tariff also, on average, reduces the peak power demand of the Monroe WDS by 9.7%. In the Richmond test, using a flat rate energy consumption charge enables PEPSO to consume energy at the time of high demand. This eliminated the need to store more water during off-peak hours which was causing 1.5% energy losses. In addition, by this method, PEPSO reduced tank drainage by about 10%.
- PEPSO used a multi-objective optimization algorithm to optimize three objectives independent of each other and report the final Pareto frontier that can be used in system studies and research. However, for practical use, one of the solutions among the Pareto frontier should be selected for operation. This selection is made by considering user preference based on user-defined weighting factors and also by removing impractical solution from the Pareto frontier (e.g., a solution with zero energy usage but high penalties). Defining different weighting factors can change the selected solution. Weighting factors are dependent on geographical, social, economic, etc., characteristics of the water system, defined constraints and practical preferences of operators. This area needs to be studied further to create a guideline that can help users to define weighting factors in such a way that results in the selection of the most desirable solution from the Pareto frontier.
- In this study, the net electricity cost and net CO2 emissions are calculated to take into account the effect of deficit or surplus water volume of tanks within the acceptable range. However, using the average electricity charge ($/kWh) and CO2 emission factor (kg/MWh) might not match real operation conditions. Therefore, we suggest running tests and simulations for a longer period (e.g., a week instead of 24 h) or using better calculation methods to take into account the effect of tank level changes at the end of simulation in a more accurate way.
Acknowledgments
This study was made possible through the support of Great Lake Protection Fund. The GLPF did not influence the study design, interpretation of data, or preparation of this article. We would like to thank the LEEM team and water research teams of Wayne State and Dayton Universities. We also want to express our gratitude to Barry LaRoy from the water department of City of Monroe and the Yorkshire Water for sharing hydraulic model of their water networks.
Author Contributions
Mohsen Sadatiyan and Carol Miller conceived and designed the research plan and experiments; Mohsen Sadatiyan developed the required software and performed the experiments; Mohsen Sadatiyan and Carol Miller analyzed the data; Mohsen Sadatiyan wrote the paper and Carol Miller reviewed and edited its content.
Conflicts of Interest
The authors declare no conflict of interest. The founding sponsors had no role in the design of the study; in the collection, analyses, or interpretation of data; in the writing of the manuscript, and in the decision to publish the results.
References
- Nicklow, J.; Reed, P.; Savic, D.; Dessalegne, T.; Harrell, L.; Chan-Hilton, A.; Karamouz, M.; Minsker, B.; Ostfeld, A.; Singh, A.; Zechman, E. State of the Art for Genetic Algorithms and Beyond in Water Resources Planning and Management. J. Water Res. Pl-Asce 2010, 136, 412–432. [Google Scholar] [CrossRef]
- Giacomello, C.; Kapelan, C.; Nicolini, M. Fast hybrid optimization method for effective pump scheduling. J. Water Res. Pl-Asce 2013, 139, 175–183. [Google Scholar] [CrossRef]
- U.S. Department of Energy. Energy Demands on Water Resources: Report to Congress on the Interdependency of Energy and Water; U.S. Department of Energy: Washington, DC, USA, 2006.
- Jamieson, D.G.; Shamir, U.; Martinez, F.; Franchini, M. Conceptual design of a generic, real-time, near-optimal control system for water-distribution networks. J. Hydroinform. 2007, 9, 3–14. [Google Scholar] [CrossRef]
- Abiodun, F.T.; Ismail, F.S. Pump Scheduling Optimization Model for Water Supply System Using AWGA. In Proceedings of the 2013 IEEE Symposium on Computers & Informatics (ISCI), Langkawi, Malaysia, 7–9 April 2013; IEEE: Langkawi, Malaysia. [Google Scholar] [CrossRef]
- Pérez-Sánchez, M.; Sánchez-Romero, F.; Ramos, H.; López-Jiménez, P. Modeling Irrigation Networks for the Quantification of Potential Energy Recovering: A Case Study. Water 2016, 8, 234. [Google Scholar] [CrossRef]
- Rossman, L.A. Water Supply and Water Resources Division; United States Environmental Protection Agency: Cincinnati, OH, USA, 2000.
- León-Celi, C.; Iglesias-Rey, P.L.; Martínez-Solano, F.J.; Mora-Melia, D. A Methodology for the Optimization of Flow Rate Injection to Looped Water Distribution Networks through Multiple Pumping Stations. Water 2016, 8, 575. [Google Scholar] [CrossRef]
- Wu, W.Y.; Maier, H.R.; Simpson, A.R. Multi-objective optimization of water distribution systems accounting for economic cost, hydraulic reliability, and greenhouse gas emissions. Water Resour. Res. 2013, 49, 1211–1225. [Google Scholar] [CrossRef] [Green Version]
- Wang, J.Y.; Chen, F.G.; Chen, J.S. A green pump scheduling algorithm for minimizing power consumption and land depletion. Concurr. Eng-Res. A 2013, 21, 121–128. [Google Scholar] [CrossRef]
- Barán, B.; Lücken, C.; Sotelo, A. Multi-objective pump scheduling optimization using evolutionary strategies. Adv. Eng. Softw. 2005, 36, 39–47. [Google Scholar] [CrossRef]
- Shamir, U.; Salomons, E. Optimal Real-Time Operation of Urban Water Distribution Systems Using Reduced Models. J. Water Res. Pl-Asce 2008, 134, 181–185. [Google Scholar] [CrossRef]
- Fracasso, P.T.; Barnes, F.S.; Costa, A.H.R. Optimized Control for Water Utilities. Procedia Eng. 2014, 70, 678–687. [Google Scholar] [CrossRef]
- Wu, W.Y.; Simpson, A.R.; Maier, H.R. Sensitivity of Optimal Tradeoffs between Cost and Greenhouse Gas Emissions for Water Distribution Systems to Electricity Tariff and Generation. J. Water Res. Pl-Asce 2012, 138, 182–186. [Google Scholar] [CrossRef]
- Stokes, C.S.; Simpson, A.R.; Maier, H.R. An Improved Framework for the Modeling and Optimization of Greenhouse Gas Emissions Associated With Water Distribution Systems. 2012. Available online: http://www.iemss.org/sites/iemss2012//proceedings/C3_0560_Maier_et_al.pdf (accessed on 26 August 2017).
- Rogers, M.M.; Wang, Y.; Wang, C.S.; McElmurry, S.P.; Miller, C.J. Evaluation of a rapid LMP-based approach for calculating marginal unit emissions. Appl. Energy 2013, 111, 812–820. [Google Scholar] [CrossRef]
- Wang, J.Y.; Chang, T.P.; Chen, J.S. An enhanced genetic algorithm for bi-objective pump scheduling in water supply. Expert Syst. Appl. 2009, 36, 10249–10258. [Google Scholar] [CrossRef]
- Zecchin, A.C.; Maier, H.R.; Simpson, A.R.; Leonard, M.; Nixon, J.B. Ant Colony Optimization Applied to Water Distribution System Design: Comparative Study of Five Algorithms. J. Water Res. Pl-Asce 2007, 133, 87–92. [Google Scholar] [CrossRef]
- Lopez-Ibanez, M. Operational Optimisation of Water Distribution Networks. Ph.D. Thesis, Edinburgh Napier University, Scotland, UK, November 2009. [Google Scholar]
- Zheng, Y.W.; Behandish, M. Comparing methods of parallel genetic optimization for pump scheduling using hydraulic model and GPU-based ANN meta-model. In Proceedings of the 14th Water Distribution Systems Analysis Conference, Adelaide, Austrilia, 24–27 September 2012; pp. 233–248. [Google Scholar]
- Fu, G.T.; Kapelan, Z. Embedding Neural Networks in Multi-objective Genetic Algorithms for Water Distribution System Design. In Water Distribution Systems Analysis 2010; American Society of Civil Engineers: San Francisco, CA, USA, 2011; pp. 888–898. [Google Scholar]
- Sadatiyan Abkenar, S.M.; Stanley, S.D.; Miller, C.J.; Chase, D.V.; McElmurry, S.P. Evaluation of genetic algorithms using discrete and continuous methods for pump optimization of water distribution systems. Sustain. Comput. Inform. Syst. 2015, 8, 18–23. [Google Scholar] [CrossRef]
- Bi, W.; Dandy, G.C. Optimization of Water Distribution Systems Using Online Retrained Metamodels. J. Water Res. Pl-Asce 2014, 140, 04014032. [Google Scholar] [CrossRef]
- Marchi, A.; Dandy, G.; Wilkins, A.; Rohrlach, H. Methodology for Comparing Evolutionary Algorithms for Optimization of Water Distribution Systems. J. Water Res. Pl-Asce 2014, 140, 22–31. [Google Scholar] [CrossRef]
- Zheng, F.F. Advanced Hybrid Approaches Based on Graph Theory Decomposition, Modified Evolutionary Algorithms and Deterministic Optimization Techniques for the Design of Water Distribution Systems. Ph.D. Thesis, University of Adelaide, Adelaide, Australia, 2013. [Google Scholar]
- Wang, H.H.; Liu, S.M.; Meng, F.L.; Li, M.M. Gene Expression Programming Algorithms for Optimization of Water Distribution Networks. Procedia Eng. 2012, 37, 359–364. [Google Scholar] [CrossRef]
- Simpson, A.R.; Dandy, G.C.; Murphy, L.J. Genetic Algorithms Compared to Other Techniques for Pipe Optimization. J. Water Res. Pl-Asce 1994, 120, 423–443. [Google Scholar] [CrossRef] [Green Version]
- Rao, Z.F.; Alvarruiz, F. Use of an artificial neural network to capture the domain knowledge of a conventional hydraulic simulation model. J. Hydroinform. 2007, 9, 15–24. [Google Scholar] [CrossRef]
- Martínez, F.; Hernández, V.; Alonso, J.M.; Rao, Z.F.; Alvisi, S. Optimizing the operation of the Valencia water-distribution network. J. Hydroinform. 2007, 9, 65–78. [Google Scholar] [CrossRef]
- Zheng, Y.W.; Morad, B. Real-time pump scheduling using genetic algorithm and artificial neural network based on graphics processing unit. In Proceedings of the 14th Water Distribution Systems Analysis Conference, Adelaide, Austrilia, 24–27 September 2012; pp. 1088–1099. [Google Scholar]
- Alighalehbabakhani, F.; Miller, C.J.; Sadatiyan Abkenar, S.M.; Fracasso, P.T.; Jin, S.X.; McElmurry, S.P. Comparative evaluation of three distinct energy optimization tools applied to real water network (Monroe). Sustain. Comput. Inform. Syst. 2015, 8, 29–35. [Google Scholar] [CrossRef]
- Centre for Water Systems, 2014, Benchmarks. Available online: http://emps.exeter.ac.uk/engineering/research/cws/resources/benchmarks/ (accessed on 8 June 2014).
- Sadatiyan, S.M.; Miller, C.J. PEPSO II User Manual. W. S. University: Detroit, MI, USA, 2016; p. 85. Available online: http://engineering.wayne.edu/wsuwater/hydraulics/pepso.php (accessed on 15 June 2016).
- Sadatiyan, S.M. Enhanced Pump Schedule Optimization for Large Water Distribution Networks to Maximize Environmental and Economic Benefits. Ph.D. Thesis, Wayne State University, Detroit, MI, USA, January 2016. [Google Scholar]
- Deb, K. Multi-Objective Optimization Using Evolutionary Algorithms; John Wiley & Sons: New York, NY, USA, 2001. [Google Scholar]
- Narzisi, G. Multi-Objective Optimization, A Quick Introduction. Courant Institute of Mathematical Sciences, New York University: New York, NY, USA, 2008; p. 35. Available online: http://cims.nyu.edu/~gn387/glp/lec1.pdf (accessed on 8 August 2017).
- Alighalehbabakhani, F.; McElmurry, S.; Miller, C.J.; Sadatiyan Abkenar, S.M. A Case Study of Energy Cost Optimization in Monroe Water Distribution System. Proceeding of the 2013 International Green Computing Conference (IGCC), Arlington, VA, USA, 27–29 June 2013; 5, pp. 1–5. [Google Scholar] [CrossRef]
- Van Zyl, J.E. A Methodology for Improved Operational Optimization of Water Distribution Systems. Ph.D. Thesis, School of Engineering and Computer Science, University of Exeter, England, UK, September 2001. [Google Scholar]
- ThinkPad W520, Lenovo, Document ID: PD015361, Last Updated: 2011/8/24. Available online: https://pcsupport.lenovo.com/us/en/products/laptops-and-netbooks/thinkpad-w-series-laptops/thinkpad-w520/parts/PD015361 (accessed on 24 August 2017).
- LEEM Server. Available online: http://leem.today/ (accessed on 20 July 2017).
Figure 1.
Undesirability Index (UI) calculation algorithm of Pollutant Emission Pump Station Optimization (PEPSO) [34].
Figure 1.
Undesirability Index (UI) calculation algorithm of Pollutant Emission Pump Station Optimization (PEPSO) [34].

Figure 2.
Electricity cost (left), CO2 emissions (middle) and total penalty (right) results of five scenarios of Monroe WDS (top) and Richmond skeletonized WDS (bottom) tests.
Figure 2.
Electricity cost (left), CO2 emissions (middle) and total penalty (right) results of five scenarios of Monroe WDS (top) and Richmond skeletonized WDS (bottom) tests.

Figure 3.
Typical water level pattern in tanks of S0 (top left), S3 (top right) and S4 (bottom) scenarios of the Monroe WDS.
Figure 3.
Typical water level pattern in tanks of S0 (top left), S3 (top right) and S4 (bottom) scenarios of the Monroe WDS.

Figure 4.
Typical water pressure pattern at junctions of S0 (left) and S4 (right) scenarios of the Monroe WDS.
Figure 4.
Typical water pressure pattern at junctions of S0 (left) and S4 (right) scenarios of the Monroe WDS.

Table 1.
Summary of the detailed model of Monroe and Skeletonized model of Richmond water distribution systems (WDSs).
Table 1.
Summary of the detailed model of Monroe and Skeletonized model of Richmond water distribution systems (WDSs).
| Item | Monroe | Richmond Skeletonized |
|---|---|---|
| No. of Fixed Speed Pumps | 11 | 7 |
| No. of Variable Speed Pumps | 2 | 0 |
| No. of Pump Stations | 2 | 6 |
| No. of Tanks | 3 | 6 |
| No. of Water Sources | 1 | 2 |
| No. of Pipes | 1945 | 44 |
| No. of Junctions | 1531 | 41 |
| Total Length of Pipes (km) | 450 | 22.69 |
| Pipe Size Range (mm) | 50–910 | 76–300 |
| Total Demand (m3/day) | 36,500 | 3921 |
| Storage volume (m3) | 3974 | 2598 |
| Storage to Daily Demand Ratio | 11/100 | 66/100 |
| Range of Power of Pumps (kW) | 36–220 | 3–60 |
| Max. Static Water Head (m) | 60 | 199 |
| Demand Pattern Duration (hr) | 24 | 24 |
| Demand Pattern Time Step (hr) | 1 | 1 |
| Min and Max. Demand Multiplier | 0.67–1.19 | 0.39–1.53 |
Table 2.
Water pressure constraints for strategic junctions of Monroe and Richmond WDS models.
| Test Case | Strategic Junction ID | Min. Water Pressure (psi) | Max. Water Pressure (psi) |
|---|---|---|---|
| Monroe | J-6 | 42 | 52 |
| J-27 | 32 | 46 | |
| J-131 | 28 | 42 | |
| J-514 | 42 | 56 | |
| Richmond | 42 | 20 | 140 |
| 1302 | 0 | 100 | |
| 10 | 0 | 100 | |
| 312 | 0 | 100 | |
| 325 | 0 | 100 | |
| 701 | 0 | 100 | |
| 745 | 20 | 100 | |
| 249 | 20 | 100 | |
| 753 | 20 | 100 | |
| 637 | 20 | 140 |
Table 3.
Water level constraints for tanks of Monroe and Richmond WDS models.
| Test Case | Tank ID | Min. Water Level (m) | Max. Water Level (m) |
|---|---|---|---|
| Monroe | T-2 | 1.56 | 8.12 |
| T-3 | 1.41 | 7.28 | |
| T-5 | 1.78 | 8.66 | |
| Richmond | A | 0.30 | 1.70 |
| B | 0.50 | 2.86 | |
| C | 0.32 | 1.79 | |
| D | 0.55 | 3.10 | |
| E | 0.44 | 2.29 | |
| F | 0.33 | 1.86 |
Table 4.
Electricity tariffs of the Richmond WDS.
| Pump Station | On-Peak Rate ($/kWh) | Off-Peak Rate ($/kWh) |
|---|---|---|
| A | 0.0679 | 0.0241 |
| B | 0.0754 | 0.0241 |
| C | 0.1234 | 0.0246 |
| D | 0.0987 | 0.0246 |
| E | 0.1122 | 0.0246 |
| F | 0.1194 | 0.0244 |
Table 5.
Emission factors of CO2 obtained from the Locational Emission Estimation Methodology (LEEM) server.
Table 5.
Emission factors of CO2 obtained from the Locational Emission Estimation Methodology (LEEM) server.
| Time | CO2 Emission Factor (kg/MWh) | Time | CO2 Emission Factor (kg/MWh) |
|---|---|---|---|
| 00:00 | 767.771 | 12:00 | 662.793 |
| 01:00 | 738.324 | 13:00 | 630.703 |
| 02:00 | 702.904 | 14:00 | 630.531 |
| 03:00 | 702.904 | 15:00 | 628.591 |
| 04:00 | 702.904 | 16:00 | 628.882 |
| 05:00 | 767.771 | 17:00 | 666.549 |
| 06:00 | 781.469 | 18:00 | 693.607 |
| 07:00 | 808.212 | 19:00 | 665.274 |
| 08:00 | 764.333 | 20:00 | 730.766 |
| 09:00 | 719.768 | 21:00 | 790.628 |
| 10:00 | 719.768 | 22:00 | 808.212 |
| 11:00 | 695.334 | 23:00 | 780.477 |
Table 6.
The optimization parameters used for all tests.
| Parameter | Value |
|---|---|
| Max. No. of Solution Evaluations | 16,600 |
| Population Size | 100 |
| Percentage of Elite Solution | 20% |
| Crossover Percentage | 50% |
| Crossover Rate | 50% |
| Mutation Percentage | 5% |
| Mutation Rate | 10% |
© 2017 by the authors. Licensee MDPI, Basel, Switzerland. This article is an open access article distributed under the terms and conditions of the Creative Commons Attribution (CC BY) license (http://creativecommons.org/licenses/by/4.0/).
Share and Cite
MDPI and ACS Style
Sadatiyan A., S.M.; Miller, C.J. PEPSO: Reducing Electricity Usage and Associated Pollution Emissions of Water Pumps. Water 2017, 9, 640. https://doi.org/10.3390/w9090640
AMA Style
Sadatiyan A. SM, Miller CJ. PEPSO: Reducing Electricity Usage and Associated Pollution Emissions of Water Pumps. Water. 2017; 9(9):640. https://doi.org/10.3390/w9090640
Chicago/Turabian StyleSadatiyan A., S. Mohsen, and Carol J. Miller. 2017. "PEPSO: Reducing Electricity Usage and Associated Pollution Emissions of Water Pumps" Water 9, no. 9: 640. https://doi.org/10.3390/w9090640
Note that from the first issue of 2016, this journal uses article numbers instead of page numbers. See further details here.