Computational Modeling of Flow and Scour around Two Cylinders in Staggered Array


1
Hydro Science and Engineering Research Institute, Korea Institute of Civil Engineering and Building Technology, Goyang-si 10223, Korea
2
Deltares Software Centre, Deltares, Delft 2629 HV, The Netherlands
*
Author to whom correspondence should be addressed.
Water 2017, 9(9), 654; https://doi.org/10.3390/w9090654
Submission received: 26 July 2017
/
Revised: 24 August 2017
/
Accepted: 28 August 2017
/
Published: 31 August 2017
Abstract
:This paper presents a numerical study on flow and local scour around two identical cylinders with diverse spacing ratios (s/D) and alignment angles (α). The spacing ratio of center-to-center distance between cylinders (s) to the cylinder diameter (D) varied from 1.25 to 5.0, including five alignment angles ranged from 0° to 90°. The detailed scour processes and information were obtained in a physics-based way by using large eddy simulation coupled with sediment transport in a Lagrangian framework and a morphodynamic model. Turbulent flow properties around two cylinders in staggered array are significantly concerned by the spacing ratio and the alignment angle which reflect complex features of evolution of scour and scour depth. The computed results exhibited the scour depth is associated with the spacing ratio and alignment angles especially at the rear cylinder. For small alignment angles, the growth rate at the rear cylinder increased as the spacing ratio increased, due to a decrease in shielding effect. As the alignment angle increased, the scour depth around the rear cylinder increased until the angle reached approximately 45°–60°. Subsequently, the scour depth decreased with the alignment angle. It also revealed that the spacing ratio was more sensitive to the maximum scour than that of the alignment angle. For (s-D)/D > 2.0, the maximum scour depth only depended on the spacing ratio.
1. Introduction
One of the typical hydraulic structures in rivers and streams is circular pile. When a vertical circular pile is placed in a natural channel, the flow experiences significant changes and produces complex turbulence structures [1]. There is a downflow in front of the pile and horseshoe vortices are generated around the pile. Flow acceleration occurs at the sides of the pile and vortex shedding is formed downstream of the pile. If the circular pile consists of groups in close proximity, this complicates the physical process due to the interaction of vortices and contraction flow. The simplest case of group piles is two identical piles with a variety of arrays, and flow characteristics with various spacing ratios and angles of approaching flow have been studied in last decades.
Various experimental and numerical studies on the interaction of shear layers, and vortex shedding downstream of two circular cylinders have been carried out. Igarashi [2,3] reported eight different flow regimes for flow patterns through two cylinders in a tandem array. Later, some studies were categorized into three different flow regimes: (i) extended-body regimes where two cylinders are regarded as a single bluff-body (1 < s/D < 2); (ii) reattachment regimes where the separated shear layers from the front cylinder reattach to the rear cylinder (2 < s/D < 5); (iii) co-shedding regimes where Kármán vortices are formed from individual cylinders (5 < s/D) [4,5]. Sumer [4] identified that three types of flow may occur in the presence of two side-by-side cylinders. When the spacing ratio between two cylinders is small, the flow behaves as a single-bluff-body like the tandem array. For intermediate spacing ratio, a biased flow pattern occurs so that a gap flow biased towards one of the two cylinders. As the spacing ratio is large, parallel vortex streets are presented downstream of two cylinders where symmetric Kármán vortices are generated. Numerical studies of flow patterns around two staggered array have been also conducted using two and three dimensional (2D, 3D) models. Most numerical works have focused on flow characteristics through two cylinders in the tandem and side-by-side array, and have investigated the effect of spacing ratios in transverse and streamwise directions [6,7]. It is confirmed that more complicated flow patterns and structures are identified at two cylinders in staggered array than an isolated cylinder.
As the bed is movable, the complex flow interacts with sediment and increases the sediment transport capacity, resulting in local scour around piles. The local scour around piles is a major issue because it is one of the key factors that undermine the stability of structures and lead to failure of the piles. For instance, Briaud et al. [8] reported that until 1999, approximately 60% of bridge failures in the United States was because of the local scouring around the piles and Hunt [9] documented more than 1502 bridge failure occurred from 1996 to 2005 in the United States. Numerous studies on local scour around circular pile groups have been conducted by laboratory experiments [10,11,12,13]. The objective of those works was an estimation of maximum scour depth around pile groups for safe and economic designs. In addition to the estimation of scour depth, some studies deal with proposing scour countermeasures at pier groups [14,15]. Thus, some semi-empirical equations for maximum scour depth have been proposed [10,11,13]. However, most of these equations overestimated the maximum scour depth due to the scaling effect [16,17].
Since 1990s, three-dimensional numerical models have been developed to calculate local scour around cylinders. There are no scale effects in those numerical approaches. Khosronejad et al. [18] proposed the Reynolds averaged Navier-Stokes (RANS) model closed with the k-ω turbulence model. They adopted a curvilinear immersed boundary method in order to deal with hydraulic structures and a movable bed. They simulated the local scouring process around three kinds of piers with cylindrical, square and diamond shapes. They presented that the growth rate of scour was overestimated and those simulations failed to capture the local scouring correctly at the upstream base for the cylindrical and square shapes. On the other hand, scour shape and time evolution of scour were represented for the diamond shape case. They inferred that dynamics of turbulent horseshoe vortices at the upstream base were not predicted well by RANS model. Nagata et al. [19] developed a 3D numerical model for simulating flow and bed changes around hydraulic structures. The flow model was based on RANS equation with a non-linear k-ε turbulence model on moving boundary-fitted coordinate system. The bed change model incorporated the effect of non-equilibrium sediment transport by employing a stochastic model of sediment pickup and deposition using the momentum equation of particles. The model was applied to local scour around a spur dike and a circular cylinder. The results were compared with experimental data and showed reasonable agreement with a sufficient accuracy. Roulund et al. [20] carried out RANS with a k-ω turbulence model coupled with a morphodynamic model for the calculation of flow and scour around a circular cylinder under live bed condition. The model accurately reproduced the development of scour hole and ripple formation, whereas the equilibrium scour depth was under-predicted by approximately 15–30%. They mentioned that this was because the suspended sediment process was not considered. Zhao et al. [21] developed a 3D RANS model coupled with a bed morphological model applied to flow and scour around a submerged cylinder on a non-cohesive sediment bed. Both bed load and suspended load were taken into account. The mechanisms of the scour were reasonably predicted by the numerical model but the maximum scour depth was about 10–20% smaller than observed data.
In order to overcome the inherent limitations of RANS model, the large eddy simulation (LES) or detached eddy simulation (DES) models coupled with a morphodynamic model have been developed [22,23,24]. Escauriaza and Sotiropoulos [22] who developed the DES model, investigated the initial stage of scour in the vicinity of a circular cylinder. The result showed that all the dynamics of erosion with the emergence of ripples, were mainly produced by turbulent horseshoe vortices. However, the only initial development of scour was simulated because the objective of this work was the investigation of erosion and bed form dynamics at the initial stage. Kim et al. [23] proposed LES coupled with sediment transport and morphodynamic models. The model was validated on the basis of comparison with experimental data [11,18] and presented that temporal evolution and shape of local scour around a circular cylinder were captured more accurately than those of the RANS model. It is evident from the above literatures that most available numerical studies have been carried out on scour depth and process around a single cylinder. To date, Kim et al. [23] have only investigated local scour processes and maximum scour depth around two cylinders in tandem and side-by-side array. They provided the understanding of the underlying physical process of local scouring. However, these are very special cases of staggered array. Numerical studies addressing the effect of various spacing ratios and alignment angles on local scour around two cylinders in staggered array have not been conducted extensively and there still remains poor understanding of the processes.
This study presents numerical simulations on scour process around two identical cylinders in staggered array. LES combined with a ghost-cell immersed boundary method was adopted to simulate turbulent flow around two cylinders, and detailed scour phenomena were calculated by coupling sophisticated sediment transport in a Lagrangian framework and with morphodyanmic models. To investigate the effect of spacing ratio (s/D) of center-to-center cylinder spacing (s) and the diameter of the cylinder (D), and alignment angle (α) around two cylinders, a total of four spacing ratio (1.25D, 2.5D, 3.75D and 5.0D) and five alignment angles were considered. The scour and deposition patterns, temporal evolution of local scour, and scour depth were examined. In addition, the simulated maximum scour depth was compared with available experimental data of two cylinder cases in staggered array.
2. Numerical Model
We employed our previously developed LES model, combined with sediment transport and morphodyanmic models [23,24,25,26] to simulate the coupled hydrodynamic and morphodynamic processes around two circular cylinders in a staggered array. The numerical model was composed of three submodels including hydrodynamic, sediment transport, and morphodynamic models. These submodels were coupled to simulate the local scouring process around the two cylinders in a physics-based manner. As the details of the numerical model have already been documented [23,24,25,26], only a brief description of the submodel is given here.
2.1. Hydrodynamic
This submodel described an eddy-resolving model, using LES. This was solved by a finite volume method (FVM) integrated on an isotropic multi-level Cartesian grid. The equations governing the three-dimensional unsteady resolved flow field for incompressible turbulent flow were the spatially-filtered continuity and Navier-Stokes equations:
where xi, xj are the coordinates, t is the time, is the modified pressure, ρ is the density of the fluid, ui and uj are the filtered velocity components, υ is the kinematic viscosity, and Sij is the resolved strain rate tensor:
The filtered Navier-Stokes equations are obtained by decomposing flow variables into resolved and unresolved components, and sub-grid stress (SGS) terms appear by filtering Navier-Stokes equations, which are modeled using the Smagorinsky model [27]:
where υt is the turbulent viscosity, Cs is the Smagorinsky constant (=0.16), and Δ is the filter size given as follows:
The bed surface was treated by a wall function technique for rough bed, which was a reasonable approach for sediment bed and morphodynamic simulations:
where up is the flow velocity parallel to the bed at the distance of yp from the bed and κ is the von Kármán constant, u* is the local shear velocity, y0 = ks/30. Here, ks is the roughness height and is evaluated by ks = 2.5d where d is the diameter of sand particle.
Equations (1) and (2) were discretized on a staggered grid and solved with a two-step fractional step method with a spatial second-order accuracy. The solution was advanced in time using an Adams-Bashforth-Crank-Nicolson method ensuring a second order accuracy in time. To deal with complex geometries, a ghost-cell immersed boundary method was adopted for the cells intersecting immersed boundaries. It is expensive to simulate turbulent flows and morphodynamics on a Cartesian grid with uniform grids. Here, the grid was locally refined using an adaptive multi-level structure grid, and this is applied to the circular cylinder and bed surface.
2.2. Sediment Transport
We briefly described the submodel of sediment transport, involving the sediment pickup, transport in suspension, and sliding. The sediment particles were modeled as small rigid spheres in the fluid. In this submodel, the motion of sediment particles was taken into account by instantaneous properties, which improved the level of physical mechanism of the sediment behavior.
The sediment velocity of individual particles in the water was determined by momentum equation accounting for drag, lift, gravity, the effect of a pressure force, and added mass [28]:
where is the velocity of sediment particle, is the fluid velocity at the particle location, CD is the drag coefficient evaluated by the relations proposed by Morsi and Alexander [29], is the gravity vector, is the unit normal vector, Vp is a particle volume, and D/Dt is a material derivative (=). The lift force term on the right-hand side of Equation (9) is replaced by the theoretical and experimental relationships proposed by McLaughlin [30] and Mei [31]. It is also possible to estimate sediment transport rate within a scour hole through an empirical equation. For example, Dodaro et al. [32] and Dodaro et al. [33] modified the Einstein sediment transport model to simulate local scour evolution downstream of a rigid bed.
The trajectory of individual particles is determined by displacement equation as:
Equation (10) is calculated until the sediment particles reach on the bed. When the particles interact with the bed, two different mechanisms (viscous damping or elastic rebound) occur. Schmeekle et al. [34] suggested a suitable physical scaling of these behaviors based on the Stokes number. If elastic collision takes place, the new velocities are determined as:
where vn and vt are the normal and tangential velocities, respectively. The coefficients of βn and βt are set to 0.65 and 1.0 [34].
The sediment on the bed can be approximated by spherical particles interlocking in the form of layers. If the shear stress of the fluid on the bed exceeds a certain value, the particles start to rotate and probably move from their position. The incipient motion of sediment particles is calculated by the vector summation of drag, lift and gravity forces, and the particles begin to move if the moment is greater than its threshold value. In our model, the pickup rate formula proposed by De Ruiter [35] was incorporated to estimate the pickup rate:
where φ is an empirical constant as 0.016, τ is the shear stress which is evaluated by the tangential force of the projection on the bed, and τc is the critical shear stress based on the criterion of initial rotation of the particle.
The instantaneous volume of the sediment pickup from an area A is estimated by:
The number of particles from each cell can be determined by:
2.3. Morphodynamic
This submodel described the instantaneous bed elevation by implicating erosion and deposition of the volume of sediment. In addition, the volume of sediment transported by sliding was also taken into account. The bed elevation for each cell during time step is calculated as:
where λ is the sediment porosity, and A2 and A3 are the shape coefficient for spherical particles, which are π/4 and π/6, respectively. ndepo and npickup are the number of particles of deposition and pickup, respectively. The second term of right-hand side represents the effect of sliding. The bed elevation was defined in the cell center and was interpolated across other points by bilinear interpolation with second order accuracy.
3. Numerical Conditions
The diameter of the two identical cylinders was D = 0.16 m, which were mounted at the bottom in a rectangular open channel 10 m (62.5D) long and 2.4 m (15D) wide (Figure 1).
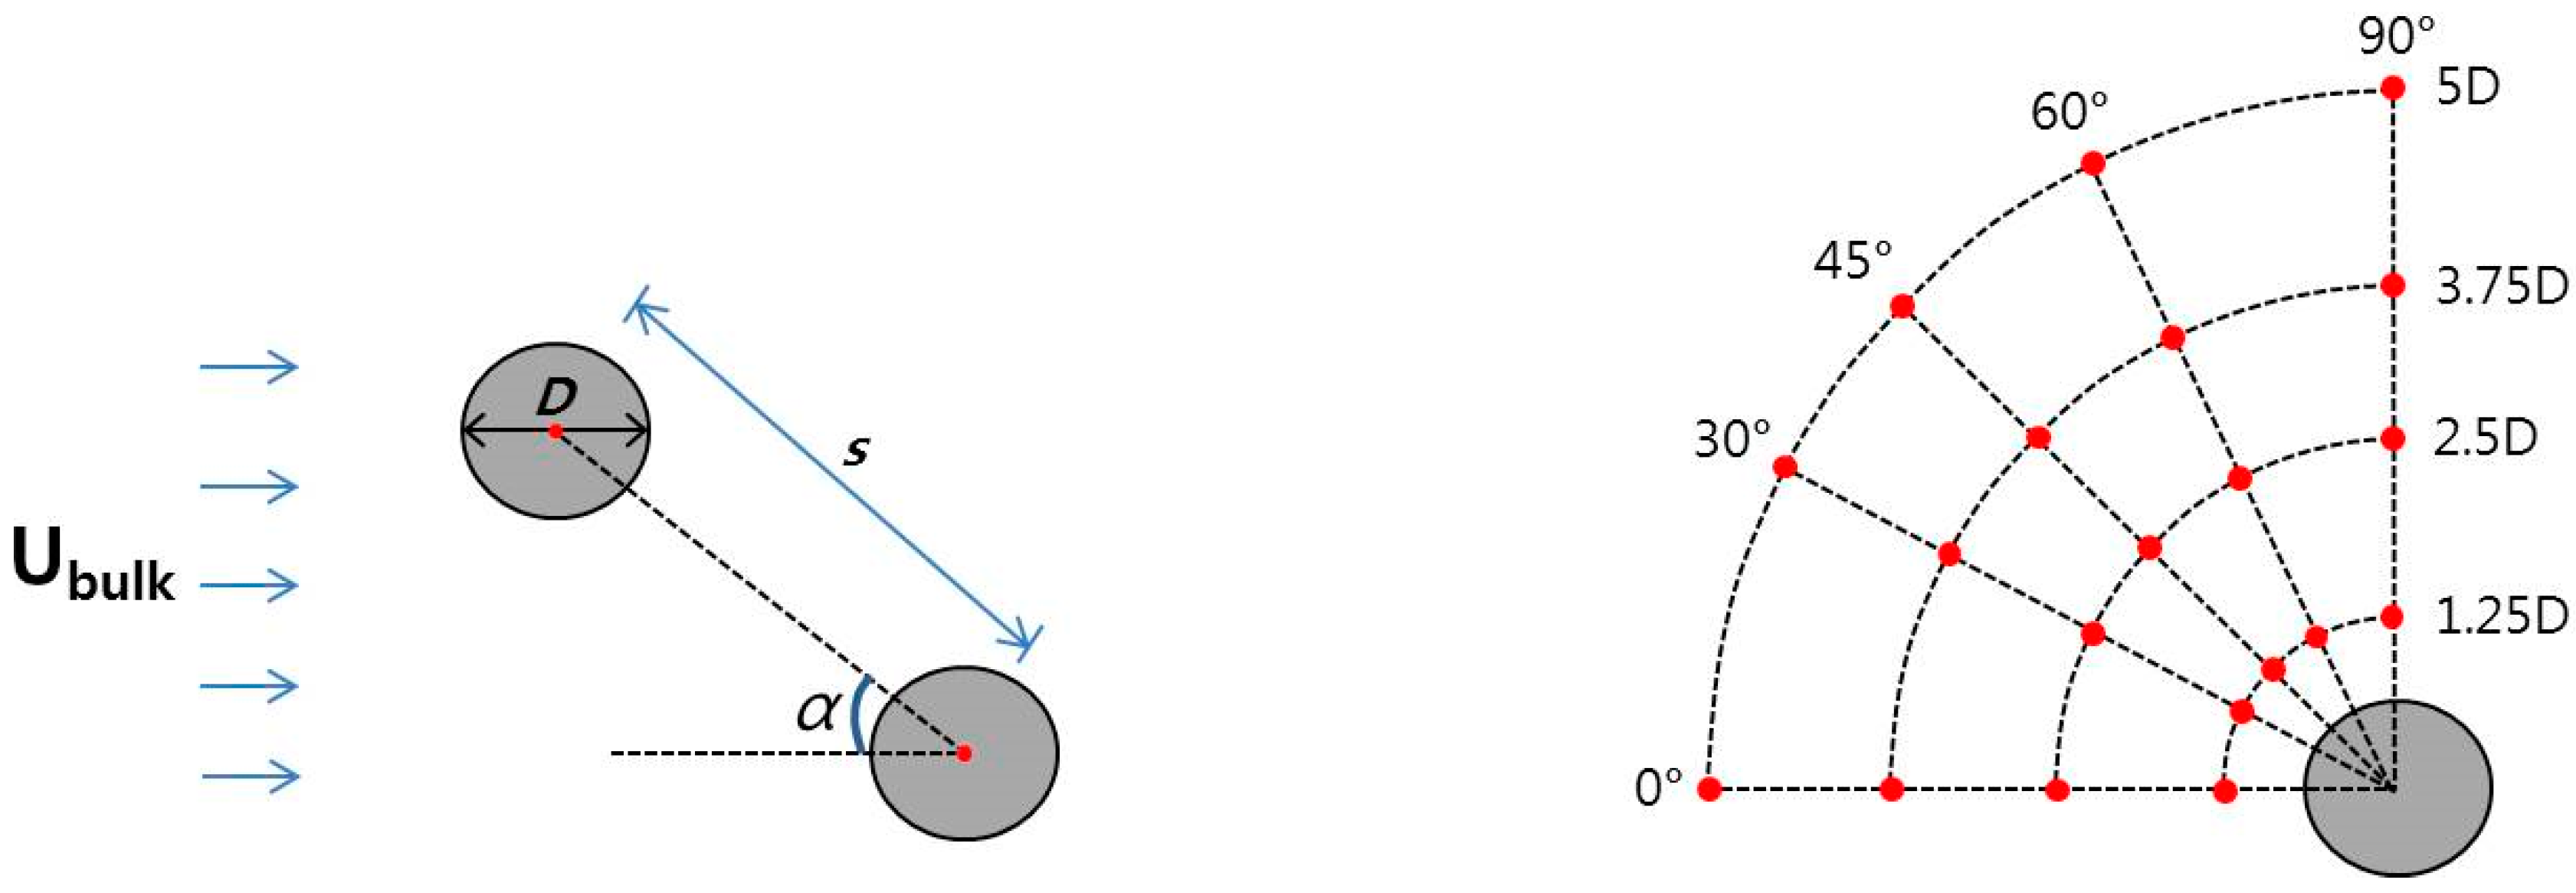
The two cylinders were placed at a distance of 4.0 m (25D) from inlet of the channel. The water depth was 0.15 m and the bulk velocity (Ubulk) was 0.25 m/s. In order to achieve the desired bulk velocity containing turbulent fluctuations at the upstream, a fringe region with periodic boundary conditions was placed at the upstream. The fully developed turbulence yielding from this region flowed into the main domain. The corresponding Reynolds and Froude numbers were 41,500 and 0.23, respectively. The bed consisted of non-cohesive fine sand materials with a uniform size of d = 0.85 mm. Figure 2 shows a sketch of two cylinders and present simulation cases. To investigate the effect of spacing ratio and alignment angle of the cylinders, a total of four spacing ratios (s/D = 1.25, 2.5, 3.75 and 5.0) and five alignment angles (α = 0°, 30°, 45°, 60°, 90°) were considered.
A multi-level Cartesian grid with local refinement was employed with a base grid of 512 × 128 × 32 in streamwise, transverse, and vertical directions, respectively. The grid was refined by three levels, and the finer grids were located close to the cylinders, bed, and side walls (Figure 3). For more details, we refer to Nabi et al. [25]. A no-slip condition was used at the solid walls, and the free surface was imposed as a rigid lid plane with zero friction in the horizontal direction. In present simulations, the flow field in the open channel with two cylinders was simulated on a flat rigid bed for more than 300 s to obtain fully-developed turbulent flow, after which the submodels of sediment transport and morphodynamic models began to act. The local scouring around two cylinders was simulated until the maximum scour depth reached an equilibrium state, assuming that its rate of increase did not exceed 3% of the cylinder diameter.
4. Numerical Results
4.1. Flow Field
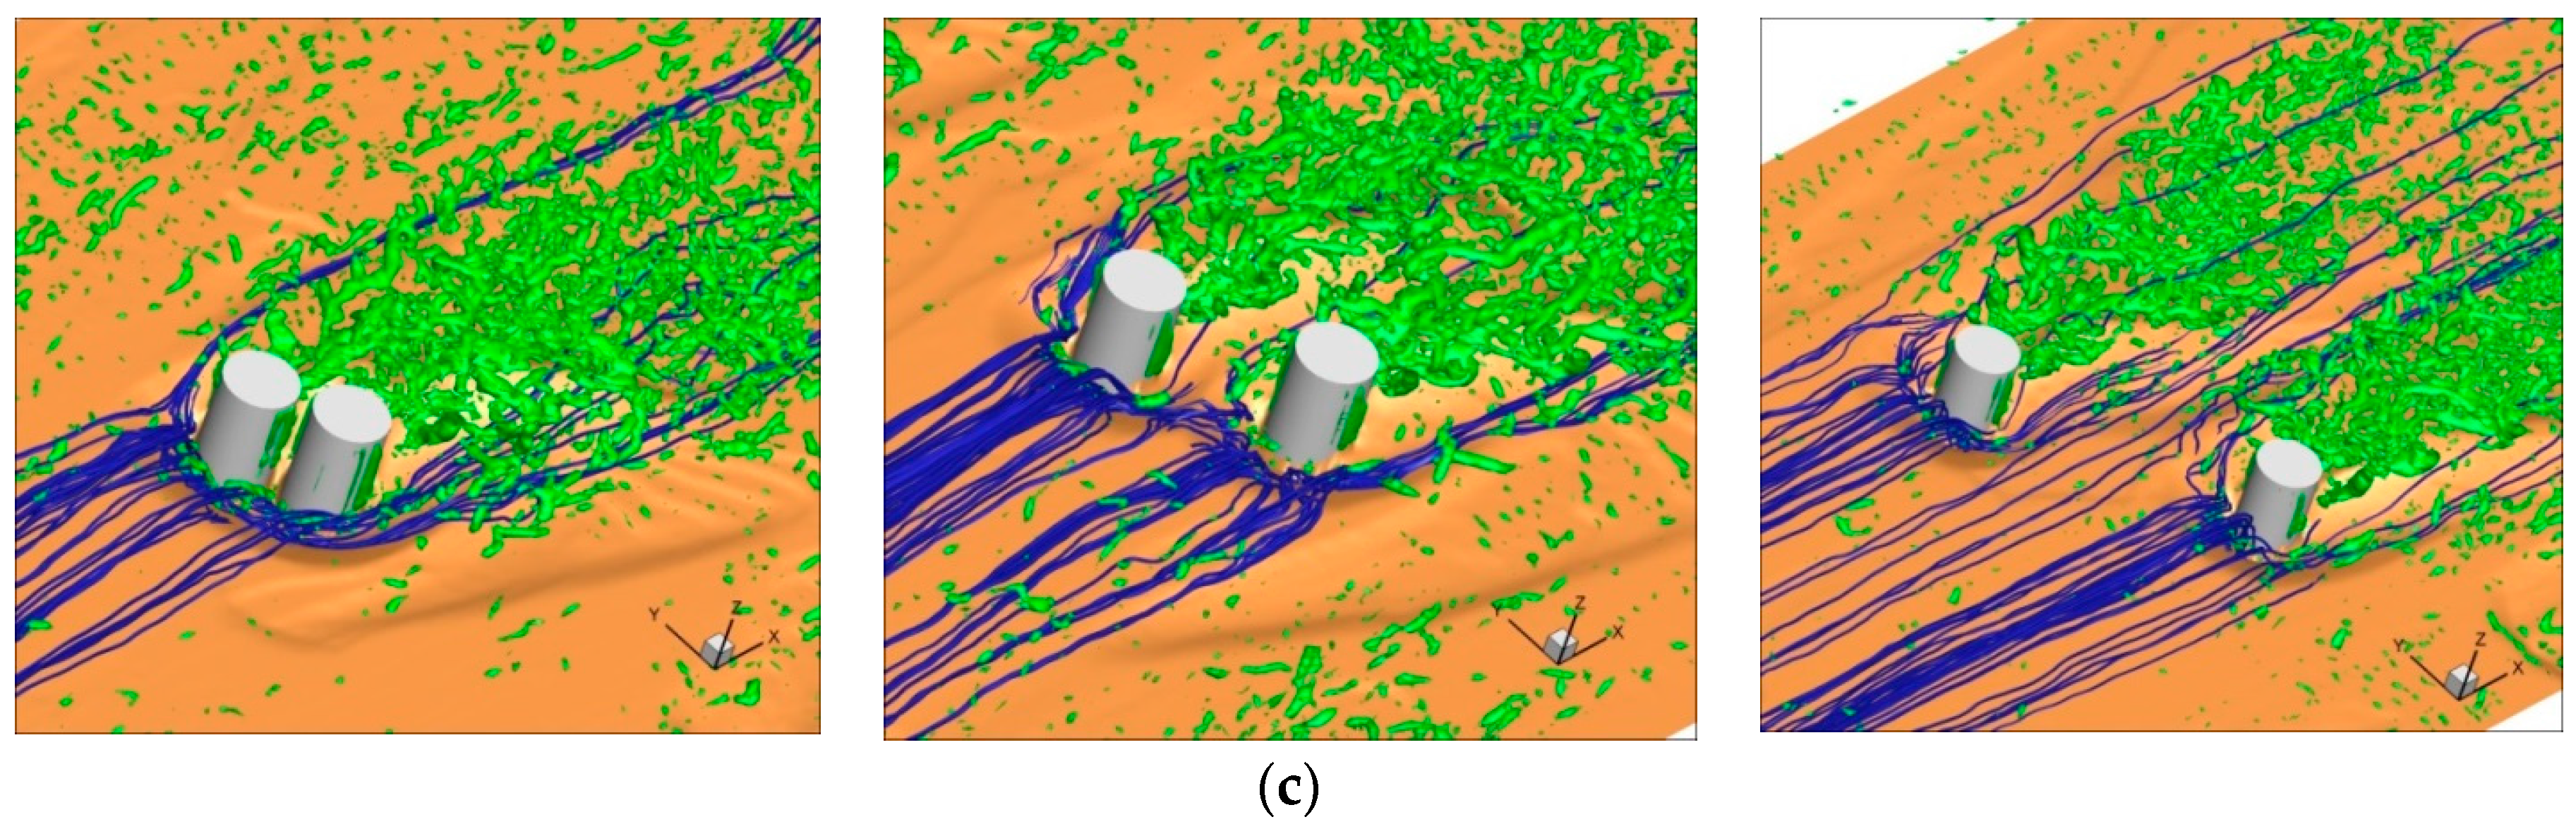
The instantaneous flow fields at the equilibrium state were visualized by showing a Q-isosurface and streamlines for different spacing ratios under the influence of three alignment angles in Figure 4. In all cases, the turbulent horseshoe vortices and local concentration of flow were visible around upstream base of the front cylinders, which led to the entrainment of sediment. On the other hand, vortex structures were more complex than that of an isolated cylinder, and there are significant variations under the impact of spacing ratios and alignment angles.
When the cylinder spacing ratio was s/D = 1.25, the two cylinders behaved like a single-bluff body, and a single wake is formed downstream of the cylinders. For α = 0°, the separated shear layers from the front cylinder were affected by the rear cylinder, but similar vortex flow structures around the isolated cylinder were seen, which indicates that very few vortices were observed within the gap, and the generation of horseshoe vortices was almost dissipated due to the shielding effect, indicating that bed scouring can be weak. As the alignment angle increased, the vortex formation region in a lateral direction increased and local concentration of flow was amplified within the gap because of contraction flow, leading to higher momentum fluid through the gap. For the spacing ratio of s/D = 2.5, the shear layers from the front cylinder reattached the rear cylinder at α = 0°, which implies that flow pattern was similar to the reattachment regime [4]. Even though the vortex shedding from the front cylinder was observed, the intensity of the vortices was still weak. The wake vortices from the front cylinder impinged on the rear cylinder, and these entered into the inner side of the rear cylinder, after which they merged with the vortices that shed from the rear cylinder. When the alignment angle increased, the gap flow was more evident. At α = 30°, the vortices that had separated from the front cylinder influenced the left side of the rear cylinder, and irregular flow structures appeared, due to interaction of large-scale eddies. For α = 60°, two wakes were clearly seen downstream of individual cylinders, and they were convected with a strong interaction in the downstream direction. As the spacing ratio was s/D = 5.0, more vortices were located in the gap at α = 0°, which means that the turbulent horseshoe vortex around the rear cylinder and wake vortex shedding were relatively strong. At a larger alignment angle, there was no interference effect, and the upstream flow and the wake were very similar to that of an isolated cylinder. The alignment angles with the spacing ratio significantly changed the three-dimensional flow fields, including the horseshoe vortices and the interaction of wake vortices responsible for various erosion mechanisms associated with the development of scour holes.
The time series of the instantaneous shear velocity for three locations are shown in Figure 5. The instantaneous shear velocity was obtained by applying log-law. Variability of the shear velocity on sediment bed is very important because its quantity dominates the sediment entrainment. P1 and P2 are the locations where the scour depth was the deepest at 45° from the front and rear cylinders, respectively, and the location of P3 is the center point between two cylinders.
Instantaneous shear velocity is highly influenced by the alignment angle with spacing ratio. For the small spacing ratio (s/D = 1.25), high temporal variability of the shear velocity was observed at P1, whereas a very low quantity of the same was shown in P2 and P3, due to the shielding effect. The variability of this quantity at P1 was relatively low for the alignment angles of α = 30 and 60°. On the contrary, this quantity at P2 increased with an increase in the alignment angle, due to the local acceleration effect driven by the flow to pass at the side of the rear cylinder. The feature of variability in the shear velocity at P3 was similar to that of P2. As the alignment angle increased, acceleration of flow along with turbulent horseshoe vortices driven by the contraction effect resulted in a high turbulent stress, which was amplified. Thus, the value and temporal variability of the shear velocity increased with an increase in the alignment angle. When the cylinder spacing ratio increased, this quantity showed different features. For α = 0° with s/D = 5.0, high temporal variability of the shear velocity was observed at P2 because the vortices shed from the front cylinder impinged on the flow around the upstream of the rear cylinder, and then the interference effect amplified turbulent stress. For α = 30°, the time series of the shear velocity was similar to that of s/D = 1.25. As the alignment angle is α = 60°, there was no difference of the value and variability of the shear velocity between P1 and P2, which implies that there was no interaction effect, and the flow was independent in both streamwise and lateral directions.
4.2. Scour Process
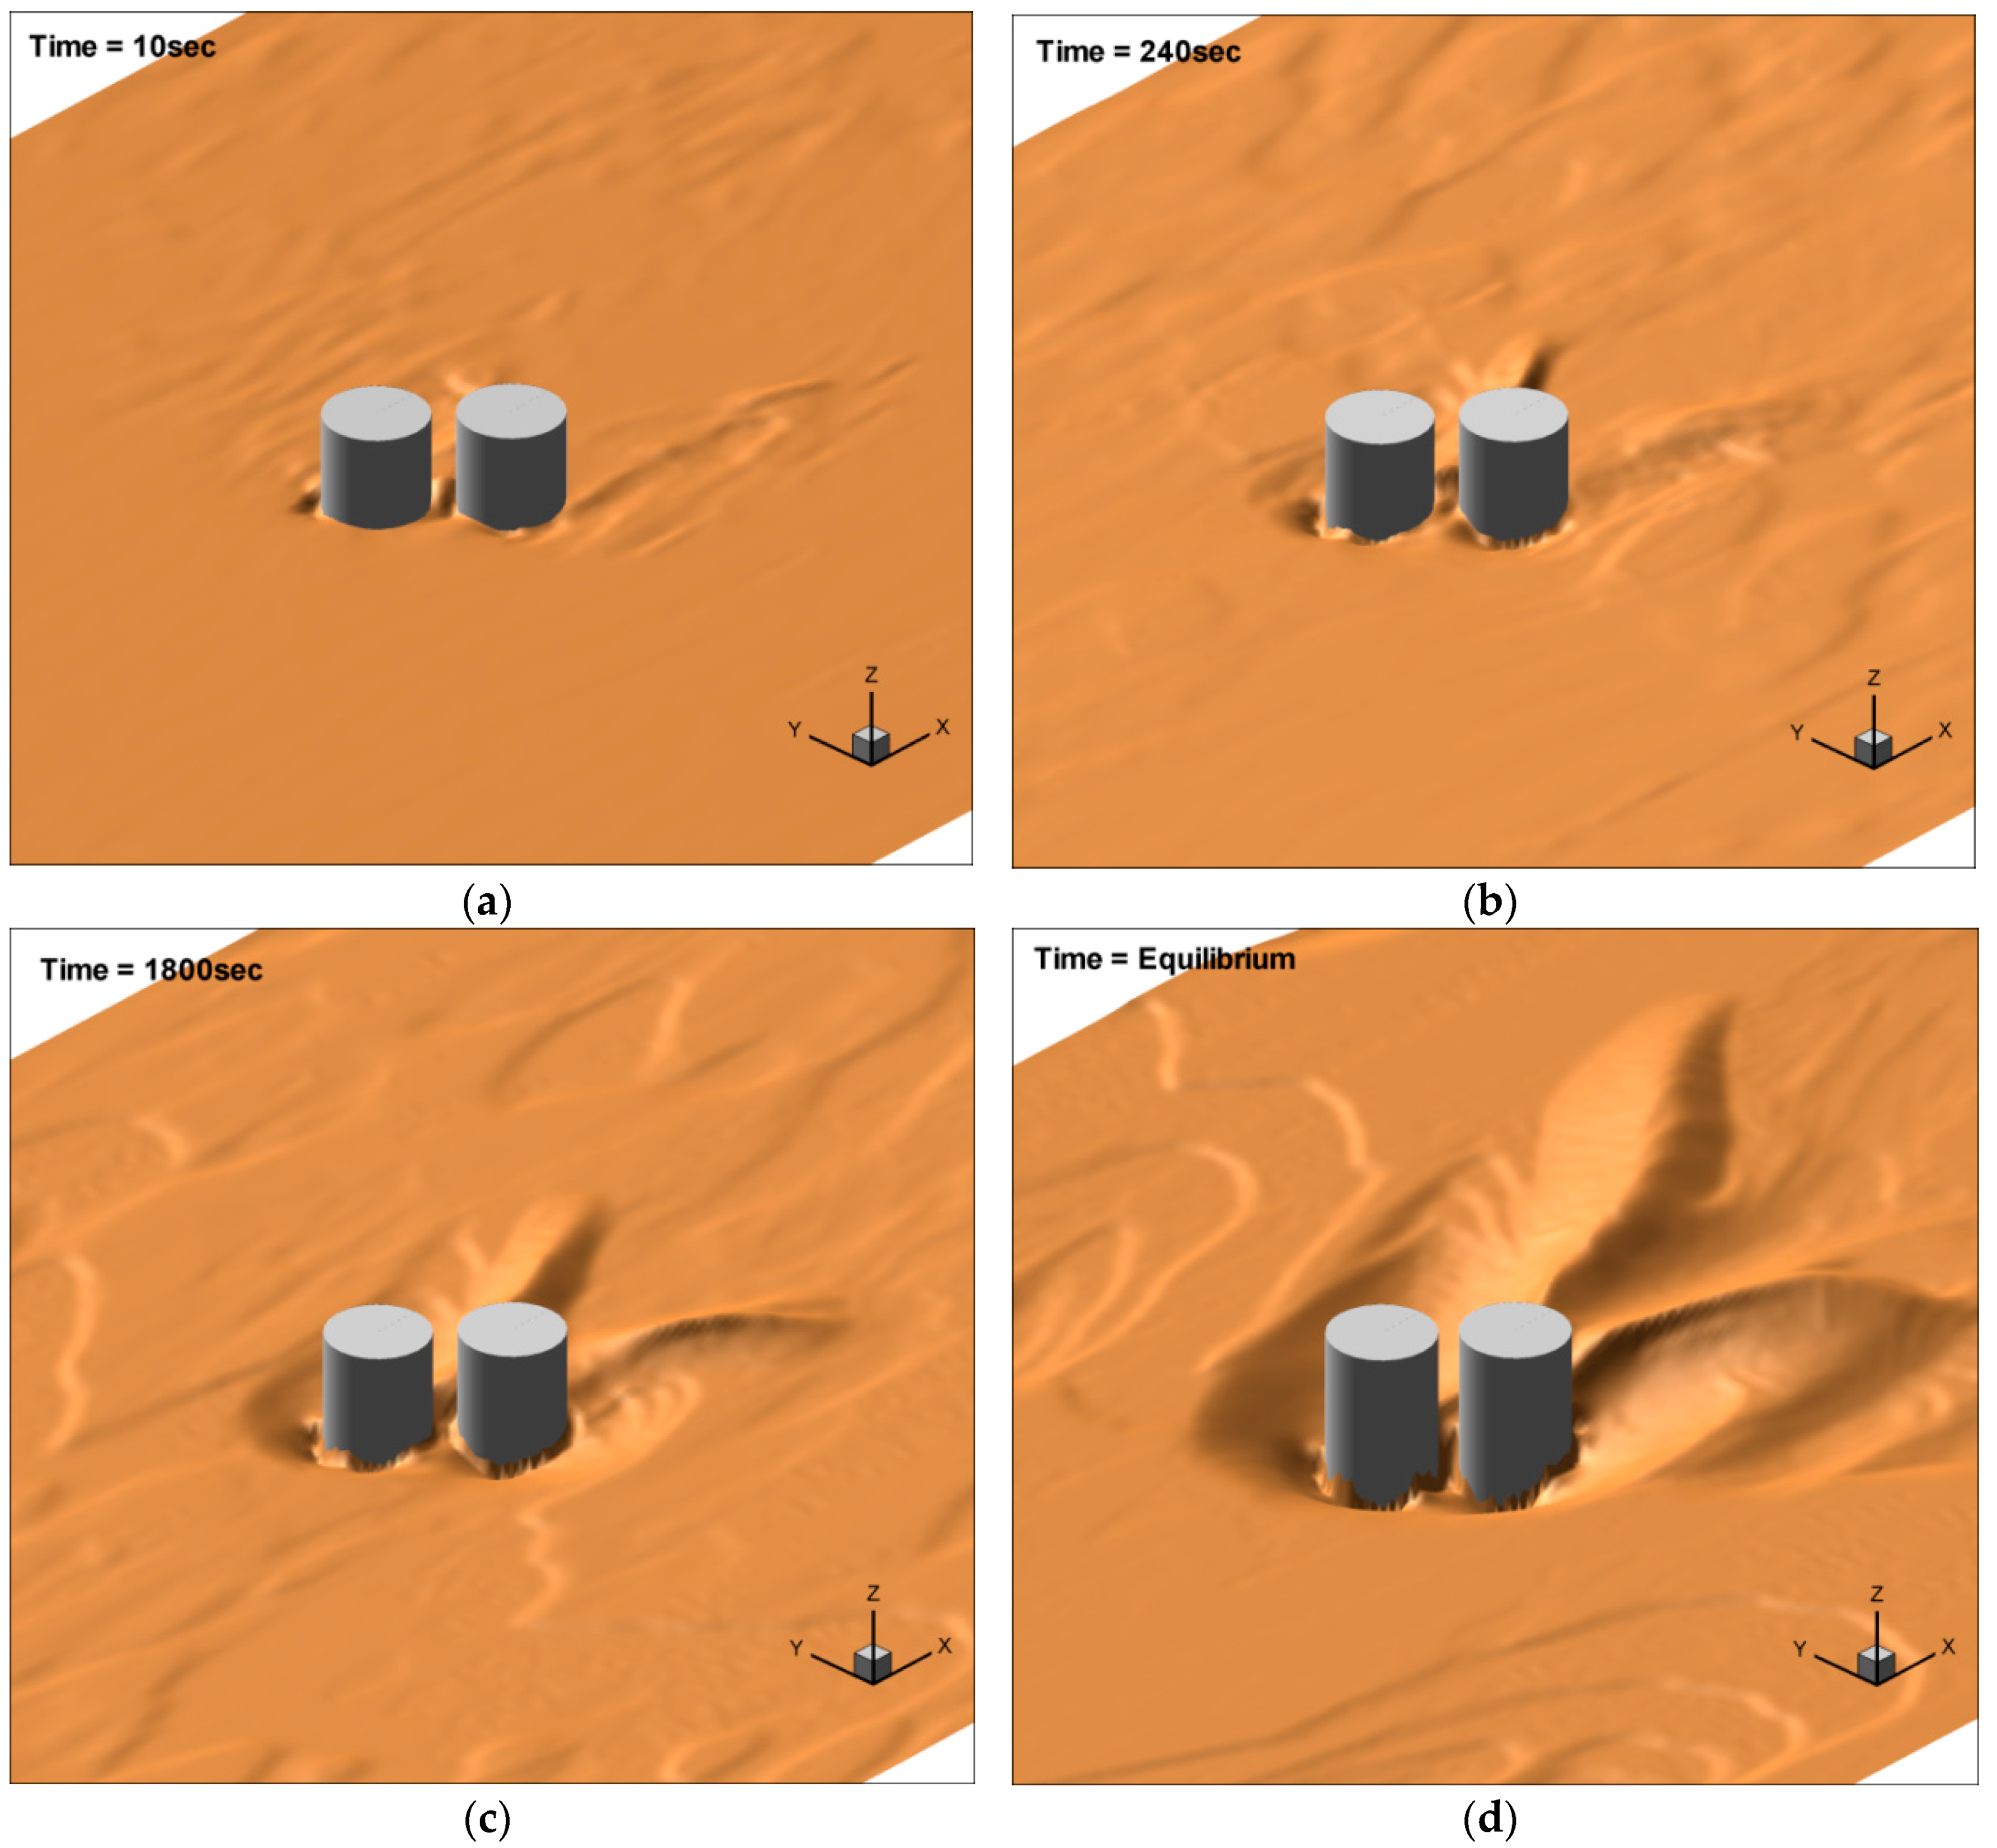
The numerical result of development processes of the bed elevation around two cylinders for an alignment angle of 45° with s/D = 1.25 is shown at the four instances in time (t = 10 s, 240 s, 1800 s and equilibrium) in Figure 6. This provides a global overview of the detailed scour and deposition processes around the cylinders, triggered by the rich dynamics of turbulent flow.
At 10 s, the bed scouring started at the sides of two cylinders (30°–90° from the symmetric plane of each cylinder) driven by increase in bed shear stress. In addition, local scour was observed at the gap due to the acceleration of flow. At 240 s, in the area surrounding the cylinders, local scour regions were extended because of erosion at the sides of the cylinders increases and it merged with scouring upstream of the base of the cylinders. After 1800 s, the bed was continuously scoured around the two cylinders, and the bed elevation descended gradually. On the other hand, local scour depth at the gap was relatively low. This infers that the separated flow from the front cylinder was directed to the right side of the rear cylinder rather than the gap region. Thus, the local acceleration effect at contraction area was weakened. At later times, the local scouring persisted around the cylinders with turbulent horseshoe vortices and the deepening of the bed taking place continuously. The scoured regions around the cylinders were overlapped and expanded due to high dynamics of flow resulting from the interference effect. A single scour hole and deposition finally developed around the cylinders.
Figure 7 shows the numerical result of instantaneous views of the bed elevation around two cylinders for an alignment angle of 45° with s/D = 5.0 (t = 10 s, 240 s, 1800 s and equilibrium). After 10 s, the scouring of the bed initiated at the sides of each cylinder at about 40° at a symmetric plane of the individual cylinders, which was the region of larger magnitude of bed shear stress. During 240 s, local scour was observed at the sides and upstream of the base of the cylinders, which indicates that the horseshoe vortex system dynamics began to dominate. During 1800 s, the simulation exhibited the steady growth of bed scouring around the cylinders, which indicates that the acceleration effect, along with dynamics of horseshoe vortices, was a significant contribution to entrainment of sediment on the bed. Until the equilibrium, sediment scoured from the bed around the cylinders was deposited downstream of each cylinder and it slowly migrated due to periodic shedding of large scale vortex in the wake regions. The growth of local scour around individual cylinders continued with time and the bed reaches the equilibrium. The scour and deposition patterns were almost identical between the front and rear cylinders, and there was no local scour at the gap, due to an increase in spacing ratio. This demonstrates that the interference effect from the cylinders was almost negligible at s/D = 5.0.
To have a better understanding of the characteristics of local scouring around two cylinders with a staggered array, it is worth exploring the profiles of local scour depth around each cylinder with the alignment angle and spacing ratio. Figure 8 presents the numerical results of maximum scour profiles around each cylinder for s/D = 1.25, 2.5, 5.0 with the alignment angle.
The maximum scour depth (ds) at each cylinder was normalized by the maximum scour depth of a single cylinder (ds1) [23]. For scour depth at the front cylinder, the bed rapidly evolved during tUbulk/D < 25, and the growth rate of the scour slowed down with time. Over time, the bed reached the equilibrium. The trend of maximum scour depth around the front cylinder was similar for each other, regardless of the alignment angle and spacing ratio. However, the scour depth and the growth rate of scour depended on them. For example, the growth rate of scour increased with an increase in the alignment angle for s/D = 1.25 at the initial stage (tUbulk/D < 25). In this time, the intense shear layers shed from sides of the cylinder generated an acceleration of flow at approximately 45° from the plane of the cylinder, which contributed to a rapid increase in local scour depth. In addition, the interference of flow was highly dominated due to an increase in the projected area, and thus it could result in high dynamic interactions between the turbulent flow and the bed. Such mechanisms were responsible for the bed scouring at the initial stage. At the later stage, the growth rate of scour was similar to each other, even though the scour depths at the equilibrium were estimated to be ds/ds1 = 1.08, 1.08, 1.13, 1.15, 1.16 in α = 0°, 30°, 45°, 60°, 90°. For s/D = 2.5, the time evolution of scour for α = 0°, 90° was relatively faster than that of α = 30°, 45°, 60° which indicated that the turbulent stress near the bed was higher due to interference effect for α = 0°, 90°. During later stage, the deepening of the bed occurred gradually, and the growth rate of scour becomes slow. The temporal evolution of maximum scour was almost identical for s/D = 5.0, due to significant decrease in the interference effect. Unlike the local scouring around the front cylinder, the rate of scour growth around the rear cylinder was significantly affected by both the alignment angle and spacing ratio. In particular, apparent difference depended on the alignment angle appears in s/D = 1.25. For an alignment angle of α = 60° and 90°, the rate of scour growth increased rapidly in the initial time (tUbulk/D < 10). However, the scouring rate of α = 90° evolved much slower than that of α = 60°, and its value of the final scour depth at the equilibrium became lower. The maximum scouring regions were placed near the side, and the gap for α = 60° and 90°, respectively. For α = 90°, the maximum scoured region was located at the gap between two cylinders, resulting from local acceleration of flow at the contraction area. We speculate that the shear layer from the front cylinder for α = 60° drove much higher momentum to the side of the rear cylinder than that of α = 90°, which could contribute to an increase in turbulent stress near the bed. The growth rate and scour depth decreased with a decrease in the alignment angle. For α = 0°, the two cylinders were regarded as a single structure elongated to the downstream direction, and the growth rate of scour declined considerably, due to the shielding effect which interrupted the horseshoe vortices. Thus, the scouring at the nose of the rear cylinder was almost not observed, and scour appeared only at the sides of the rear cylinder. The local scour depth was estimated to be ds/ds1 = 0.77. For s/D = 2.5, the rate of growth scour for α = 45°, 60°, 90° showed a similar trend while it slowed down, and scour depth decreased for α = 0° and 30°. This demonstrates that the shielding effect due to the front cylinder was still valid for s/D ≤ 2.5, with α ≤ 30° corresponding to the reattachment regime. As the spacing ratio increased, the shielding effect decreased and the growth rate of scour around the rear cylinder in s/D = 5.0 was similar except for α = 0°.
4.3. Equilibrium Bed Topography
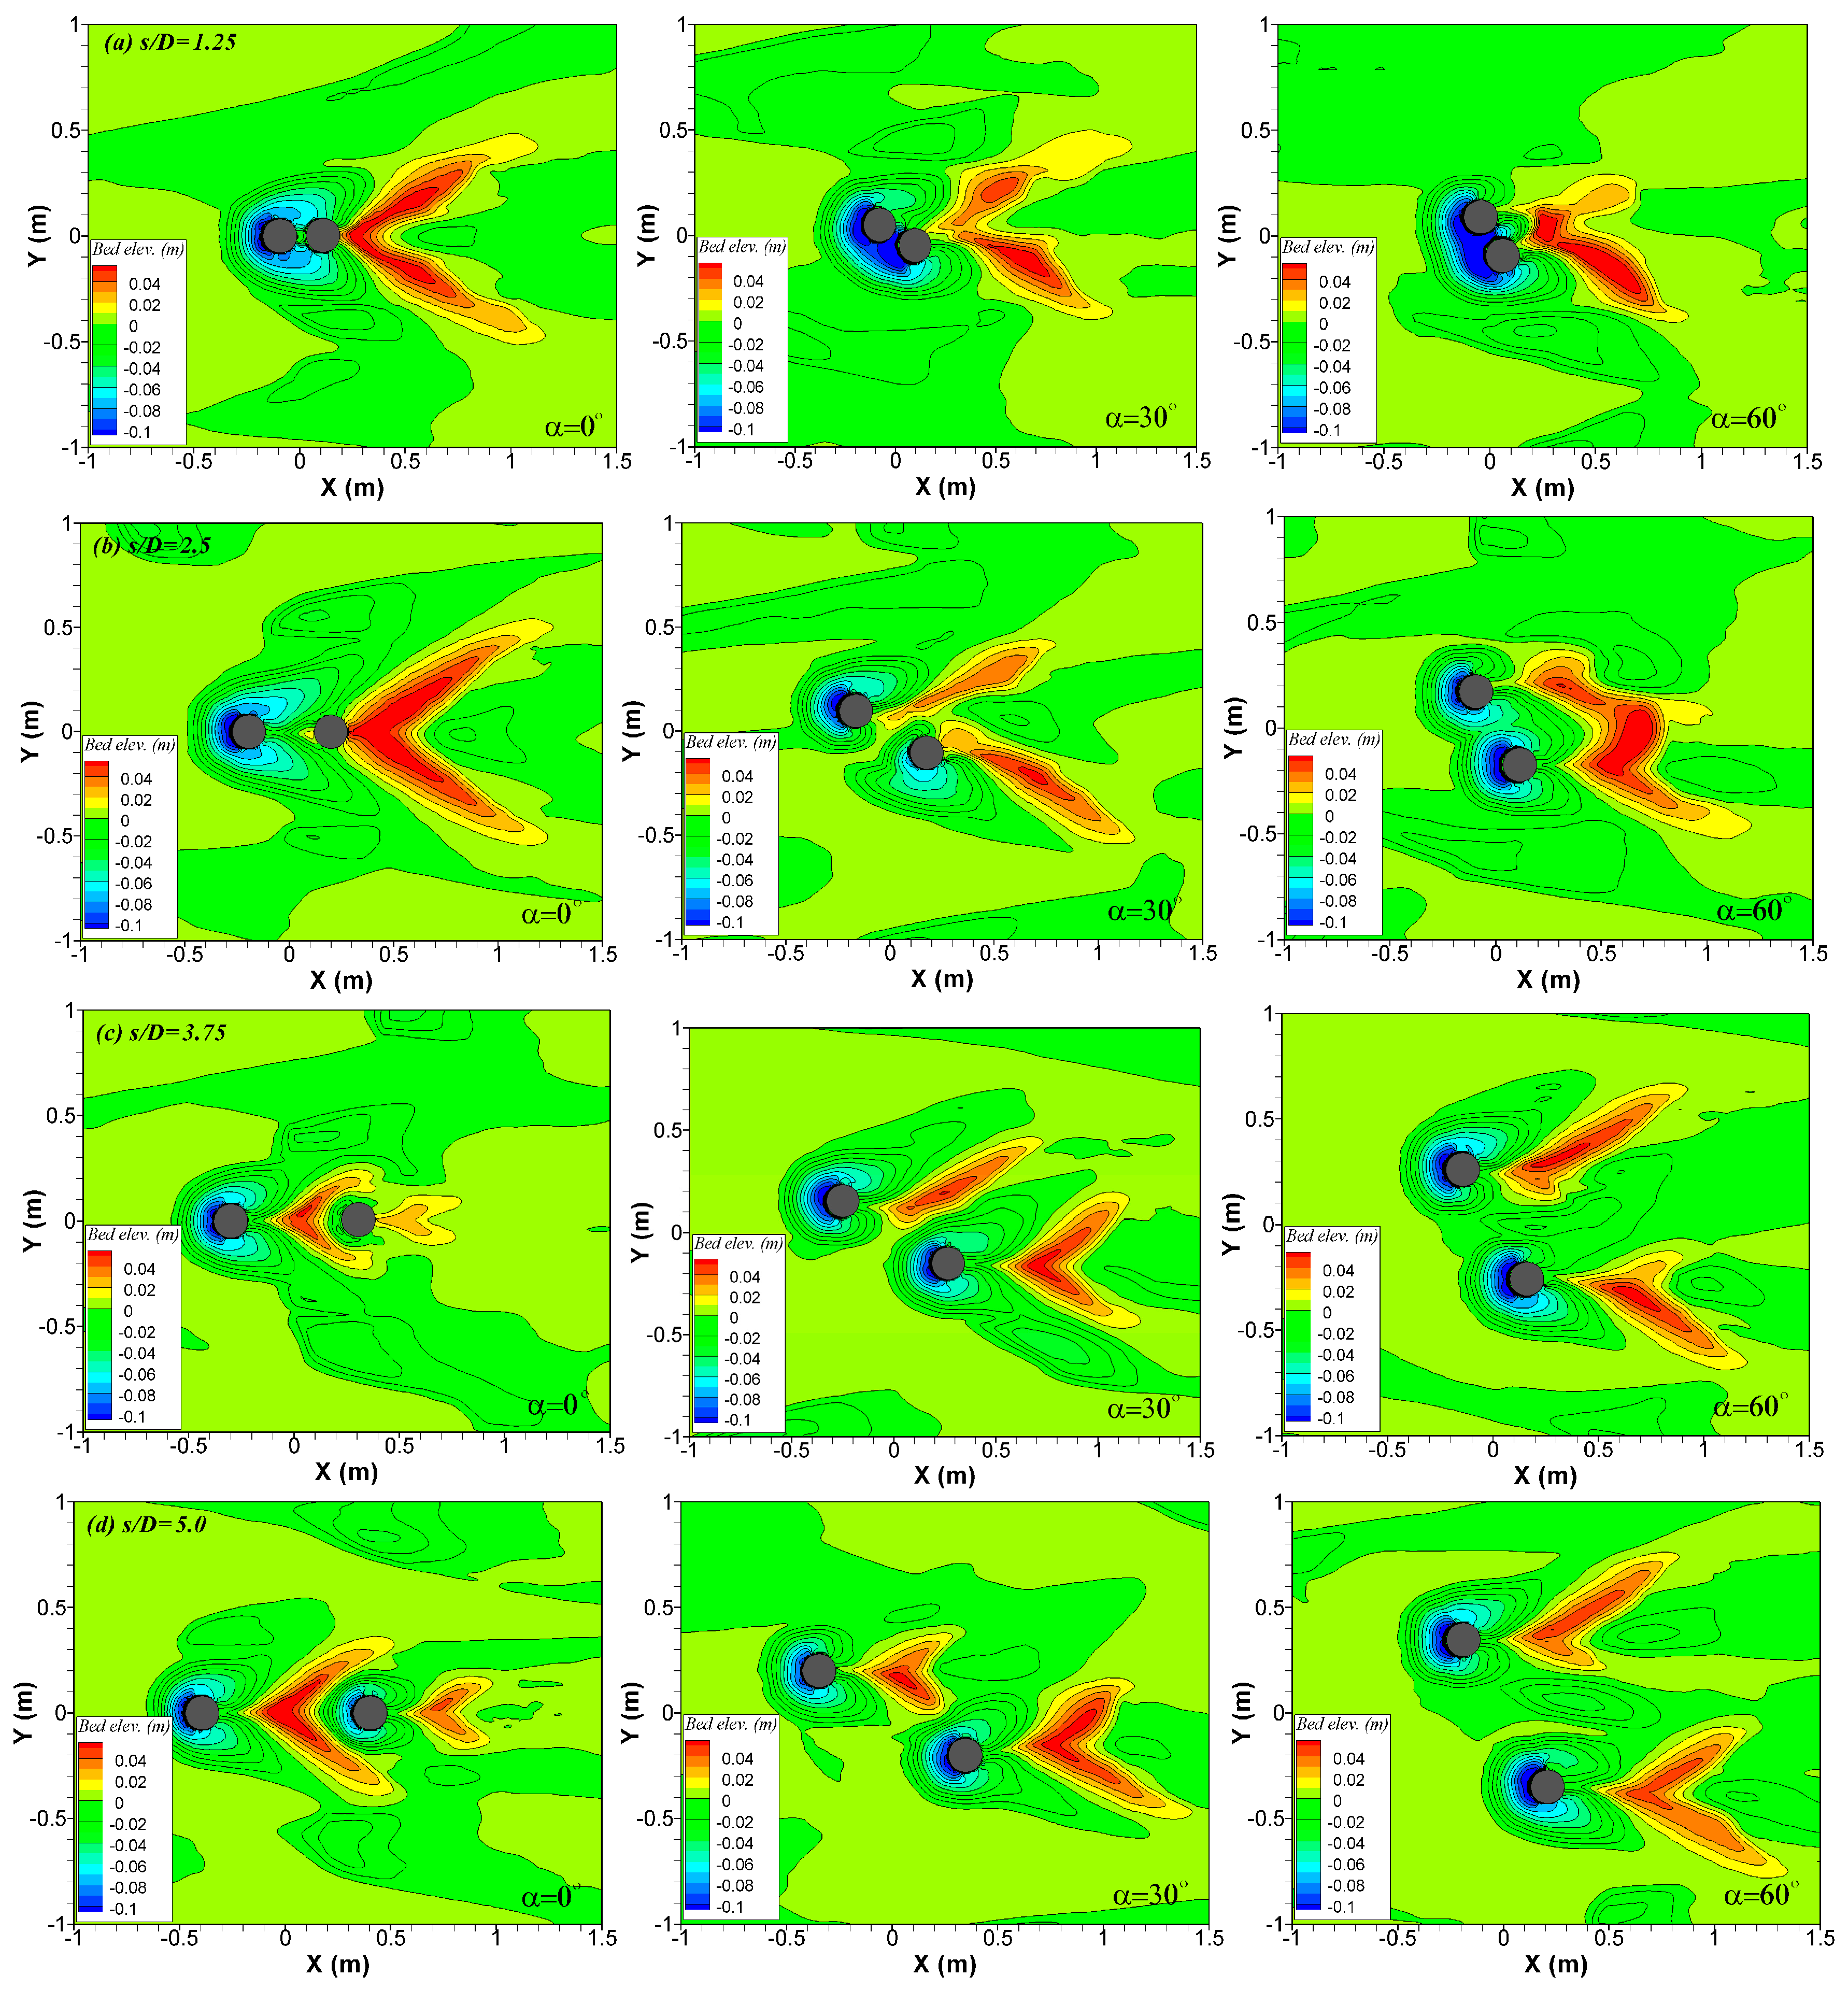
Figure 9 shows the simulated bed topography at the equilibrium. The spacing ratio with alignment angles impinged significantly on scour and deposition patterns. A single scour hole developed around two cylinders, as the cylinder spacing ratio was less than s/D = 2.5. However, the scour holes were separated for α = 30° of s/D = 2.5 (Figure 9b). This is attributed to a relatively small alignment angle which reflected the low dynamics of the turbulent horseshoe vortices along with an acceleration effect. For s/D = 1.25, as the alignment angle increased, the projected area and the exposure of the gap to approach flow increased. As a result, local scour depth increased and the contraction scour began to appear. A single deposition mound was observed downstream of the cylinders. For s/D = 2.5 of α = 0°, it still appeared a single scour hole around two cylinders with a deposition region. The accumulated sediment downstream of the cylinders increased, whereas its region was close to the rear cylinder, which indicated that the impact of large-scale vortex shedding behind the rear cylinder was weakened. For s/D = 2.5, the local scour was separately developed around each cylinder as the alignment angle increased while the scour holes were overlapped and global scour was seen for α = 60°. For α = 0°, when the spacing ratio of the cylinders was larger than s/D = 2.5, the local scour hole was developed around the rear cylinder, and its depth and area increased with increasing spacing ratio. For α = 30°, the scour holes grew separately with s/D ≥ 2.5, and the interference effect vanished as the spacing ratio became s/D = 5.0. Similar features of scour and deposition were seen in α = 60°. The global scour disappeared as s/D > 2.5, which reflected a decrease in turbulence intensity due to interference. The scour and deposition were observed around individual cylinders, and they showed a symmetric pattern at s/D = 5.0, which confirms that the interplay of flow and bed change was independent.
4.4. Scour Depth
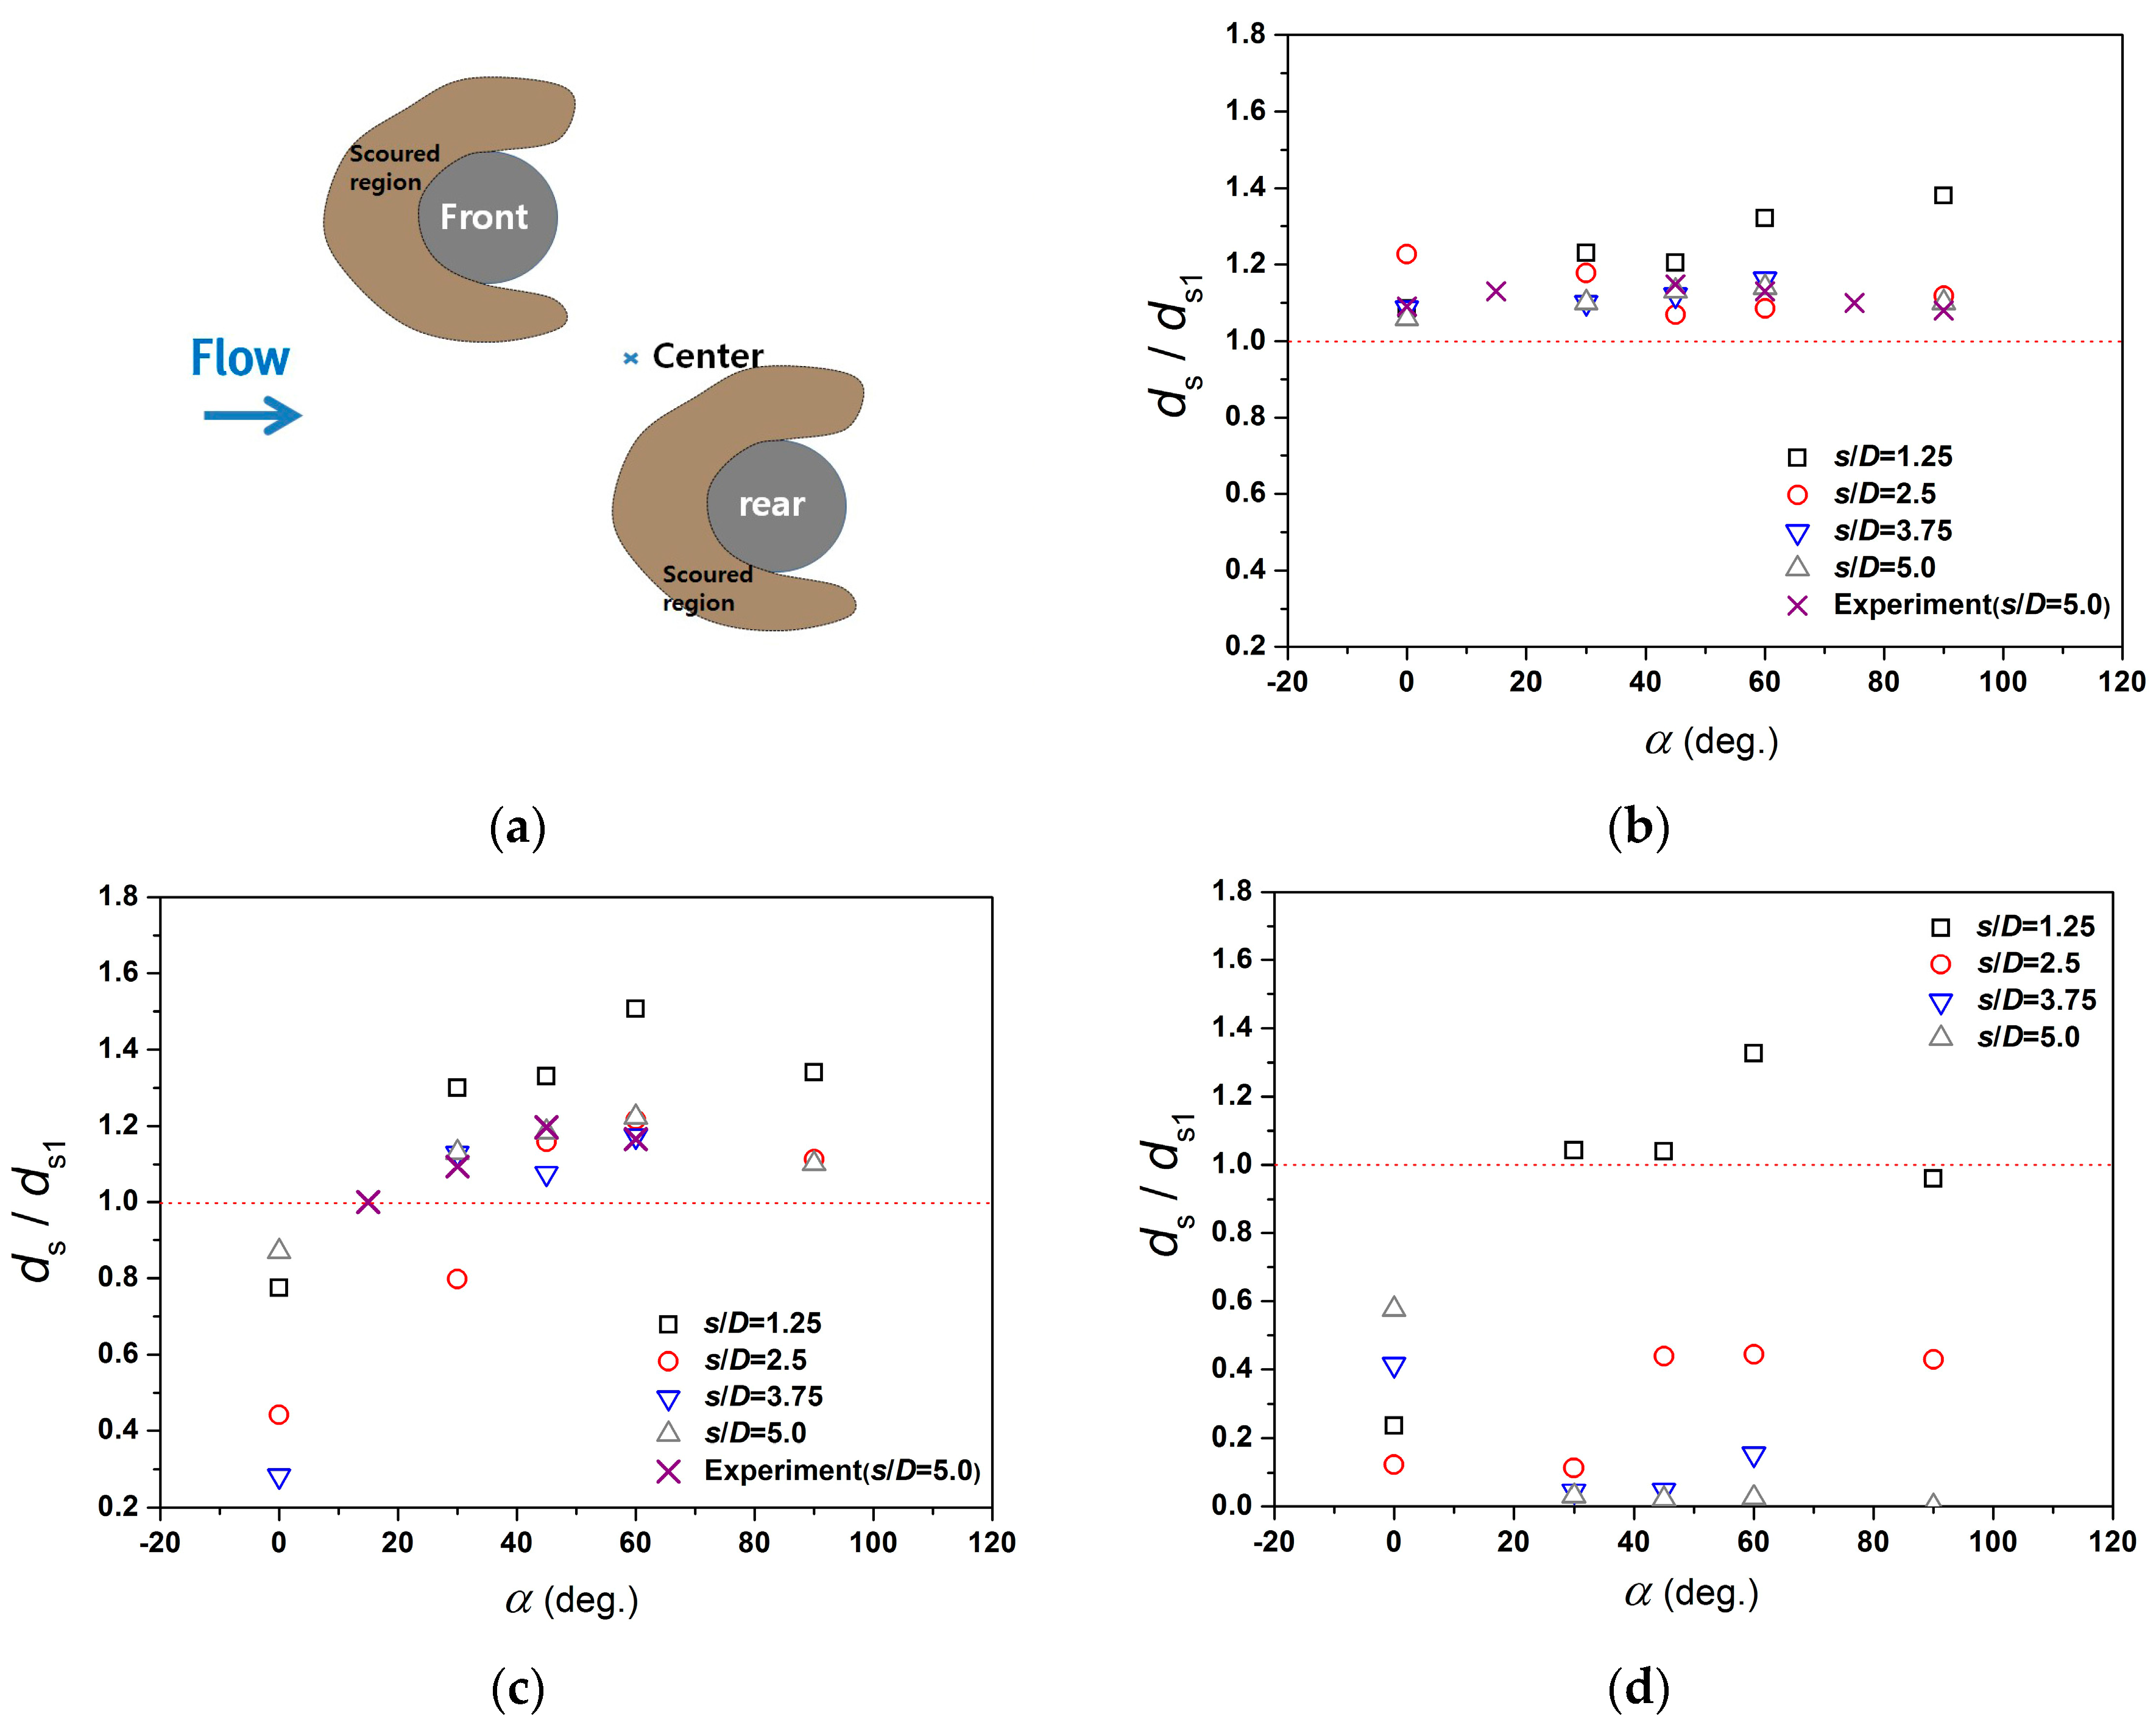
In previous studies, studies have mainly been conducted on the estimation of maximum scour depth, but there are very few studies on local scour depth around each cylinder in the presence of two cylinders. The maximum scour depths around each cylinder and scour depth at the center location between two cylinders according to the alignment angle are shown in Figure 10. For a comparison between present numerical predictions and laboratory experiments, experimental data of Hannah [36] for s/D = 5.0 is presented.
As it can be seen from Figure 10b, the maximum local scour of the front cylinder increased with an increase in the alignment angle, and subsequently it decreased for s/D = 5.0. The every scour depth for s/D = 5.0 was deeper than that of a single cylinder, and there was a variation in the range of ds/ds1 = 1.06 to 1.14. The computed scour depth was in good agreement with experimental data [36]. For s/D = 1.25, the scour depth increased as the alignment angle increased, and it reached a maximum value of ds/ds1 = 1.37 at α = 90°. This trend demonstrates that when the alignment angle becomes larger, the contraction effect and the size of turbulent horseshoe vortices increase due to an increase in the projected area of the cylinders. For s/D = 2.5, the scour depth decreased first with increasing alignment angle, and subsequently it increased slightly. When the spacing ratio was larger than s/D = 2.5, the trend of scour depth versus the alignment angle became similar. Even though the scour depth around the front cylinder was affected by the alignment angle, the scour depth varied with a range of ds/ds1 = 1.06 to 1.37.
For local scouring of the rear cylinder in Figure 10c, the scour depth varied dramatically with the alignment angle. The scour depth increased as the alignment angle increased, for all cases. This is attributed to a decrease in the shielding effect at the rear cylinder with increasing the alignment angle. Thus, it can be confirmed that the impact of turbulent stress associated with dynamics of horseshoe vortices and acceleration of flow at the side of the cylinder increases. On the other hand, the scour depth continued to increase until the alignment angle reached approximately α = 60°. Subsequently, scour depth began to diminish. This trend coincided with experimental data [36]. The scour depth was smaller than that of a single cylinder when the alignment angle was α = 0°. However, as the alignment angle increased, the scour depth around the rear cylinder was mostly ds/ds1 > 1.0. From the computed result, the behavior of bed scouring around the rear cylinder was significantly linked to the shielding effect.
Unlike the scour around a single cylinder, a global scour was observed around two cylinders due to enhanced flow and turbulence resulting from the interference effect. The scour depth at the center between two cylinders is depicted in Figure 10d. The global scour depth was highly influenced by the spacing ratio. When the spacing ratio was s/D ≥ 2.5, the scour depth was smaller than that of a single cylinder. For s/D = 1.25 with α ≥ 30°, the scour depth was larger than ds/ds1 = 1.0.
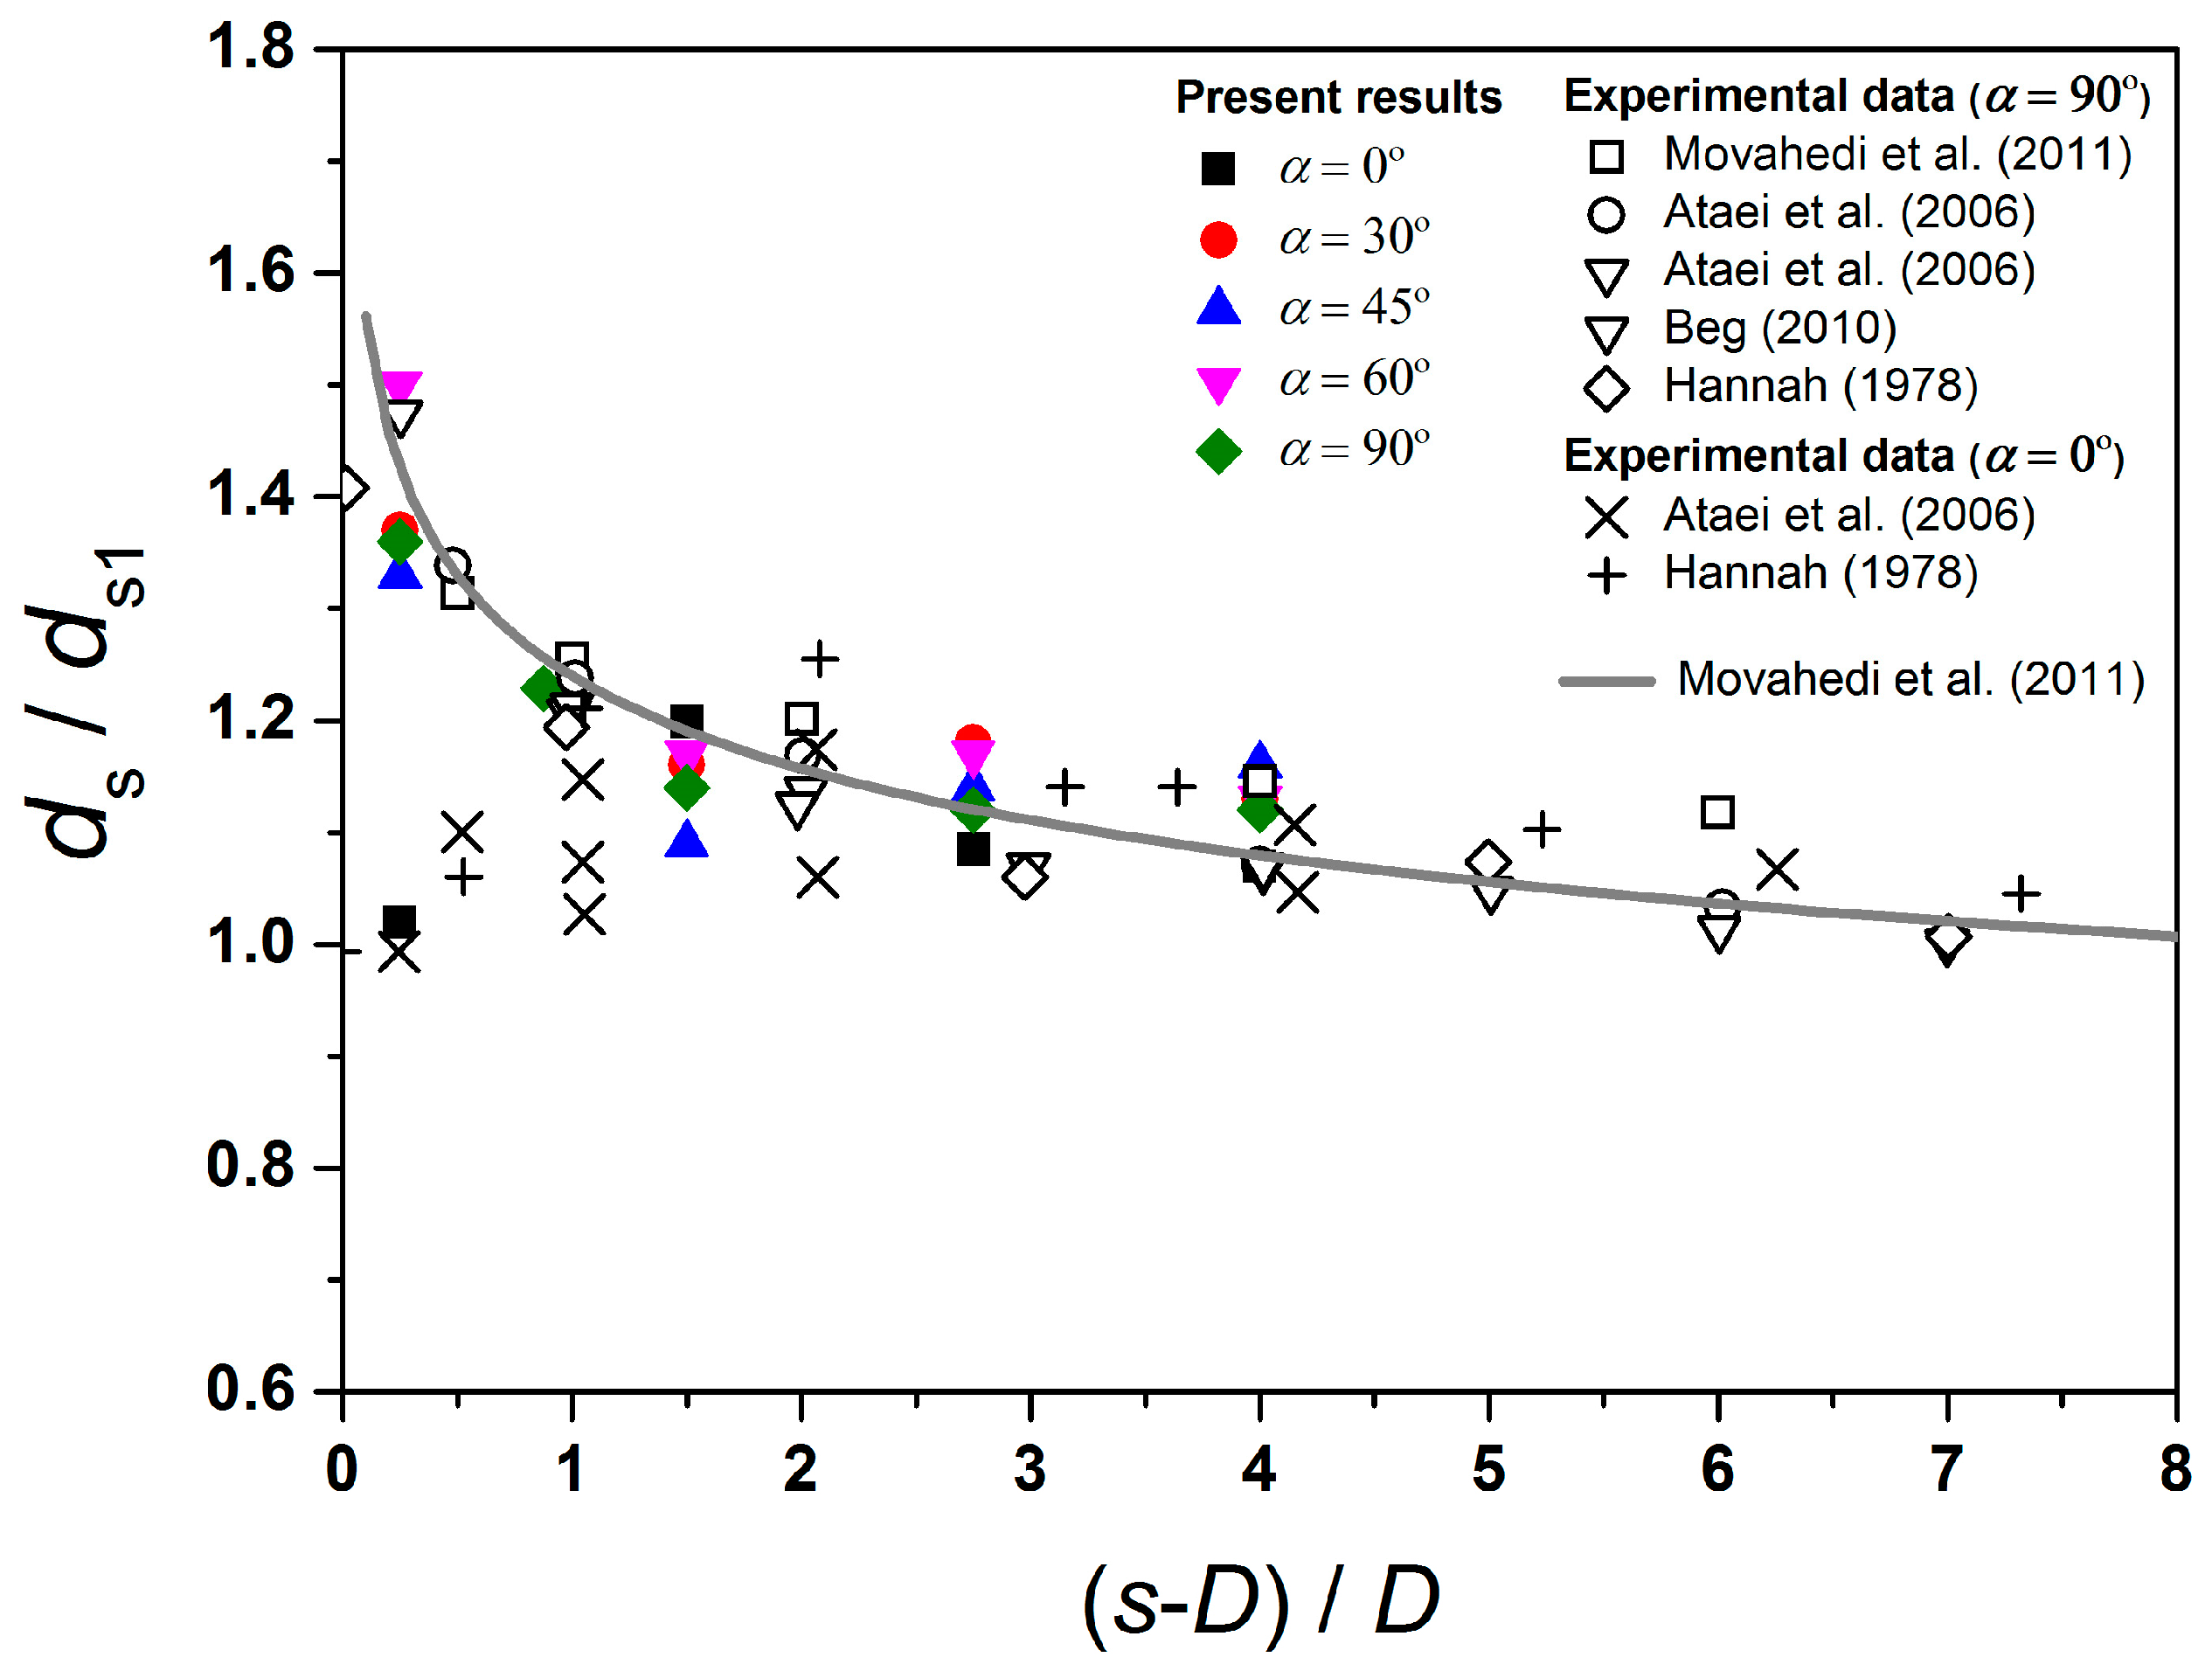
The maximum scour depth around two cylinders in staggered array versus the ratio of the separation interval (s-D)/D is shown in Figure 11. The computed scour depth fell sharply as the ratio of the separation interval decreased until a certain value of (s-D)/D = 1.5 was reached. This was due to a decrease in the intensity of the horseshoe vortices and a weak acceleration in the flow at the gap, along with a reduction in the projected area of the cylinders. Subsequently, it decreased slowly with the ratio of the separation interval, which implies that the interference effect was not considerable. For α ≥ 30°, the maximum scour depth was less sensitive to the alignment angle but was closely related to the ratio of the separation interval. The apparent trend of scour depth according to the ratio of the separation interval appeared and the computed data was in reasonable agreement with available literature data and empirical equations [11,12,36,37]. For α = 0°, however, the scour depth increased first with increasing ratio of the separation interval and it reached a maximum value at (s-D)/D = 2.0. In sequence, the scour depth decreased with an increase in the ratio of the separation interval, and it converged to that of a single cylinder. The computed scour depth were compared with experimental data [11,12,36,37] and it showed good agreement. It is important to note that a discrepancy in a tendency for the scour depth appeared as (s-D)/D ≤ 2.0, due to different mechanisms of scouring. For (s-D)/D > 2.0, on the other hand, the maximum scour depth showed a similar trend and similar quantitative values, irrespective of the alignment angle and the ratio of the separation interval. The computed result demonstrates that coupling LES with sediment transport and morphodynamic models in a physics-based way can simulate complex scour processes and accurately estimate the maximum scour depth around two cylinders in a staggered array.
5. Conclusions
This paper presents the effect of the spacing ratio and the alignment angle of two cylinders on the flow field and the scouring process. The spacing ratio of center-to-center distance between cylinders to the cylinder diameter was varied from 1.25 to 5.0, including five alignment angles ranged from 0° to 90°. LES was combined with an adaptive multi-level Cartesian grid with a ghost-cell immersed boundary method to resolve the bed shear stress (around the cylinders) under turbulent flow. To compute scouring, the flow was coupled with a sediment transport model and a morphodynamic model. This led to a direct coupling between the instantaneous flow properties, sediment motions, and the bed morphology.
The scouring process was characterized by the spacing ratio and the alignment angle. For small spacing ratio, the scour holes were overlapped around two cylinders and a deposition mound was observed due the fact that the cylinders behaved as a single body. As the alignment angle increased, the magnitude of contraction flow at the gap increased, leading to local scouring. When the spacing ratio became larger, the interference effect decreased and scour holes around two cylinders were developed separately. The growth rate of scour and local scour depth were influenced by the spacing ratio and alignment angle, and particular features of scouring were found at the rear cylinder. For small alignment angles, the flow, approached the rear cylinder, was interrupted by the front cylinder, and the scour development slowed down. The growth rate of scour increased with an increase in the spacing ratio, because of a reduction in the shielding effect. As the alignment angle increased, the scour depth around the rear cylinder increased until the angle reached approximately 45°–60°. Subsequently, the scour depth decreased with the alignment angle. However, relatively small variations of growth rate and scour depth appeared around the front cylinder. The computed maximum scour depth and trend were in reasonable agreement with the available experimental data and the empirical equation. A big difference between the maximum scour depths was observed at (s-D)/D ≤ 2.0. Here, a different trend was shown between α = 0° and the others. For (s-D)/D > 2.0, on the other hand, the maximum scour depth showed similar trends and values, regardless of the alignment angle and the spacing ratio. This revealed that the spacing ratio is more sensitive to the maximum scour than that of the alignment.
Acknowledgments
This research was supported by a grant (17CTAP-C133019-01) from Technology Advancement research Program funded by Ministry of Land, Infrastructure and Transport of Korean government.
Author Contributions
Hyung Suk Kim, Min Roh and Mohamed Nabi conceived and designed numerical simulations; Hyung Suk Kim performed the simulation and analyzed the data; Min Roh conducted an analysis of results; Mohamed Nabi provided motivation and contributed to the interpretation of results; Hyung Suk Kim wrote the paper; and all authors participated in final review and editing of the paper.
Conflicts of Interest
The authors declare no conflict of interest.
References
- Kirkil, G.; Constantinescu, G.; Ettema, R. Coherent structures in the flow field around a circular cylinder with scour hole. J. Hydraul. Eng. 2008, 134, 572–587. [Google Scholar] [CrossRef]
- Igarashi, T. Characteristics of the flow round two circular cylinders arranged in tandem (1st Report). Bull. JSME 1981, 24, 323–331. [Google Scholar] [CrossRef]
- Igarashi, T. Characteristics of the flow round two circular cylinders arranged in tandem (2nd Report). Bull. JSME 1984, 27, 2380–2387. [Google Scholar] [CrossRef]
- Sumner, D. Two circular cylinders in cross-flow: A review. J. Fluid Struct. 2010, 26, 849–899. [Google Scholar] [CrossRef]
- Zu, G.; Zhou, Y. Stroul numbers in the wake of two inline cylinders. Exp. Fluids 2004, 37, 248–256. [Google Scholar]
- Kitagawa, T.; Ohta, H. Numerical investigation on flow around circular cylinders in tandem arrangement at a subcritical Reynolds number. J. Fluids Struct. 2008, 24, 680–699. [Google Scholar] [CrossRef]
- Shao, J.; Zhang, C. Large eddy simulations of the flow past two side-by-side circular cylinders. Int. J. Comput. Fluid Dyn. 2008, 22, 393–404. [Google Scholar] [CrossRef]
- Briaud, J.L.; Ting, F.; Chen, H.; Cao, Y.; Gudavalli, R.; Perugu, S. Prediction of scour rate in cohesive soils at bridge piers. J. Geotech. Geoenviron. Eng. 1999, 125, 237–246. [Google Scholar] [CrossRef]
- Hunt, B.E. Monitoring Scour Critical Bridges; Transportation Research Board: Washington, DC, USA, 2009. [Google Scholar]
- Amini, A.; Melville, B.W.; Ali, T.M.; Ghazli, A.H. Clear water local scour around pile groups in shallow-water flow. J. Hydraul. Eng. 2012, 138, 177–185. [Google Scholar] [CrossRef]
- Ataie-Ashtiani, B.; Beheshti, A.A. Experimental investigation of clear-water local scour at pile groups. J. Hydraul. Eng. 2006, 132, 1100–1104. [Google Scholar] [CrossRef]
- Beg, M. Characteristics of developing scour holes around two piers placed in transverse arrangement. In Proceedings of the 5th International Conference on Scour and Erosion, San Francisco, CA, USA, 7–10 November 2010. [Google Scholar]
- Lanca, R.; Fael, C.; Maia, R.; Pego, J.P.; Cardoso, A.H. Clear-water scour at pile groups. J. Hydraul. Eng. 2013, 139, 1089–1098. [Google Scholar] [CrossRef]
- Tafarojnoruz, A.; Gaudio, R.; Calomino, F. Bridge pier scour mitigation under steady and unsteady flow conditions. Acta Geophys. 2012, 60, 1076–1097. [Google Scholar] [CrossRef]
- Zarrati, A.R.; Nazariha, M.; Mashahir, M.B. Reduction of local scour in the vicinity of bridge pier groups using collars and riprap. J. Hydraul. Eng. 2006, 132, 154–162. [Google Scholar] [CrossRef]
- Ettema, R.; Melville, B.W.; Barkdoll, B. Scale effect in pier-scour experiments. J. Hydraul. Eng. 1998, 124, 639–642. [Google Scholar] [CrossRef]
- Lee, S.O.; Sturm, T. Scaling issues for laboratory modeling of bridge pier scour. In Proceedings of the 4th International Conference on Scour and Erosion, Tokyo, Japan, 5–7 November 2008. [Google Scholar]
- Khosronejad, A.; Kang, S.; Sotiropoulos, F. Experimental and computational investigation of local scour around bridge piers. Adv. Water Resour. 2012, 37, 73–85. [Google Scholar] [CrossRef]
- Nagata, N.; Hosoda, T.; Nakato, T.; Muramoto, Y. Three-dimensional numerical model for flow and bed deformation around river hydraulic structures. J. Hydraul. Eng. 2005, 131, 1074–1087. [Google Scholar] [CrossRef]
- Roulund, A.; Sumer, B.M.; Fredsoe, J.; Michelsen, J. Numerical and experimental investigation of flow and scour around a circular pile. J. Fluid Mech. 2005, 534, 351–401. [Google Scholar] [CrossRef]
- Zhao, M.; Cheng, L.; Zang, Z. Experimental and numerical investigation of local scour around a submerged vertical circular cylinder in steady currents. Coast. Eng. 2010, 27, 709–721. [Google Scholar] [CrossRef]
- Escauriaza, C.; Sotiropoulos, F. Initial stages of erosion and bed form development in a turbulent flow around a cylindrical pier. J. Geophys. Res. 2011, 116, F03007. [Google Scholar] [CrossRef]
- Kim, H.S.; Nabi, N.; Kimura, I.; Shimizu, Y. Numerical investigation of local scour at two adjacent cylinders. Adv. Water Resour. 2014, 70, 131–147. [Google Scholar] [CrossRef]
- Nabi, M.; de Vriend, H.J.; Mosselman, E.; Sloff, C.J.; Shimizu, Y. Detailed simulation of morphodynamics: 3. Ripple and dunes. Water Resour. Res. 2013, 49, 5930–5943. [Google Scholar] [CrossRef]
- Nabi, M.; de Vriend, H.J.; Mosselman, E.; Sloff, C.J.; Shimizu, Y. Detailed simulation of morphodynamics: 1. Hydrodynamic model. Water Resour. Res. 2012, 48, W12523. [Google Scholar] [CrossRef]
- Nabi, M.; de Vriend, H.J.; Mosselman, E.; Sloff, C.J.; Shimizu, Y. Detailed simulation of morphodynamics: 2. Sediment pick-up, transport and deposition. Water Resour. Res. 2013, 49, 4775–4791. [Google Scholar] [CrossRef]
- Smagorinsky, J.S. General circulation experiments with the primitive equations. Mon. Weather Rev. 1963, 91, 99–164. [Google Scholar] [CrossRef]
- Maxey, M.R.; Riley, J.J. Equation of motion for a small rigid sphere in a nonuniform flow. Phys. Fluids 1983, 26, 883–889. [Google Scholar] [CrossRef]
- Morsi, S.A.; Alexander, A.J. An investigation of particle trajectories in two-phase flow systems. J. Fluid Mech. 1972, 55, 193–208. [Google Scholar] [CrossRef]
- McLaughlin, J.B. Inertial migration of a small sphere in linear shear flows. J. Fluid Mech. 1991, 224, 261–274. [Google Scholar] [CrossRef]
- Mei, R. An approximate expression for the shear lift force on a spherical particle at finite Reynolds number. Int. J. Multiph. Flow 1992, 18, 145–147. [Google Scholar] [CrossRef]
- Dodaro, G.; Tafarojnoruz, A.; Stefanucii, F.; Adduce, C.; Calomino, F.; Gaudio, R.; Sciortino, G. An experimental and numerical study on the spatial and temporal evolution of a scour hole downstream of a rigid bed. In Proceedings of the International Conference on Fluvial Hydraulics, River Flow, Lausanne, Switzerland, 3–5 September 2014; pp. 1415–1422. [Google Scholar]
- Dodaro, G.; Tafarojnoruz, A.; Sciortino, G.; Adduce, C.; Calomino, F.; Gaudio, R. Modified Einstein sediment transport method to simulate the local Scour evolution downstream of a rigid bed. J. Hydraul. Eng. 2016, 142. [Google Scholar] [CrossRef]
- Schmeeckle, M.W.; Nelson, J.M.; Pitlick, J.; Bennett, J.P. Interparticle collision of natural sediment grains in water. Water Resour. Res. 2001, 37, 2377–2391. [Google Scholar] [CrossRef]
- De Ruiter, J.J.C. Incipient Motion and Pick-up of Sediment as Function of Local Variables; Technical Report R 657-XI; Delft Hydraulics Laboratory: Delft, The Netherlands, 1983. [Google Scholar]
- Hannah, C.R. Scour at Pile Groups; Research report No. 28-3; Civil engineering Dept. Univ. of Canterbury: Christchurch, New Zealand, 1978. [Google Scholar]
- Movahedi, N.; Dehahani, A.A.; Aarabi, M.J.; Zahiri, A.R. Temporal evolution of local scour depth around side-by-side piers. JCEU 2013, 3, 82–86. [Google Scholar]
Figure 1.
Numerical domain for two cylinders in a staggered array.
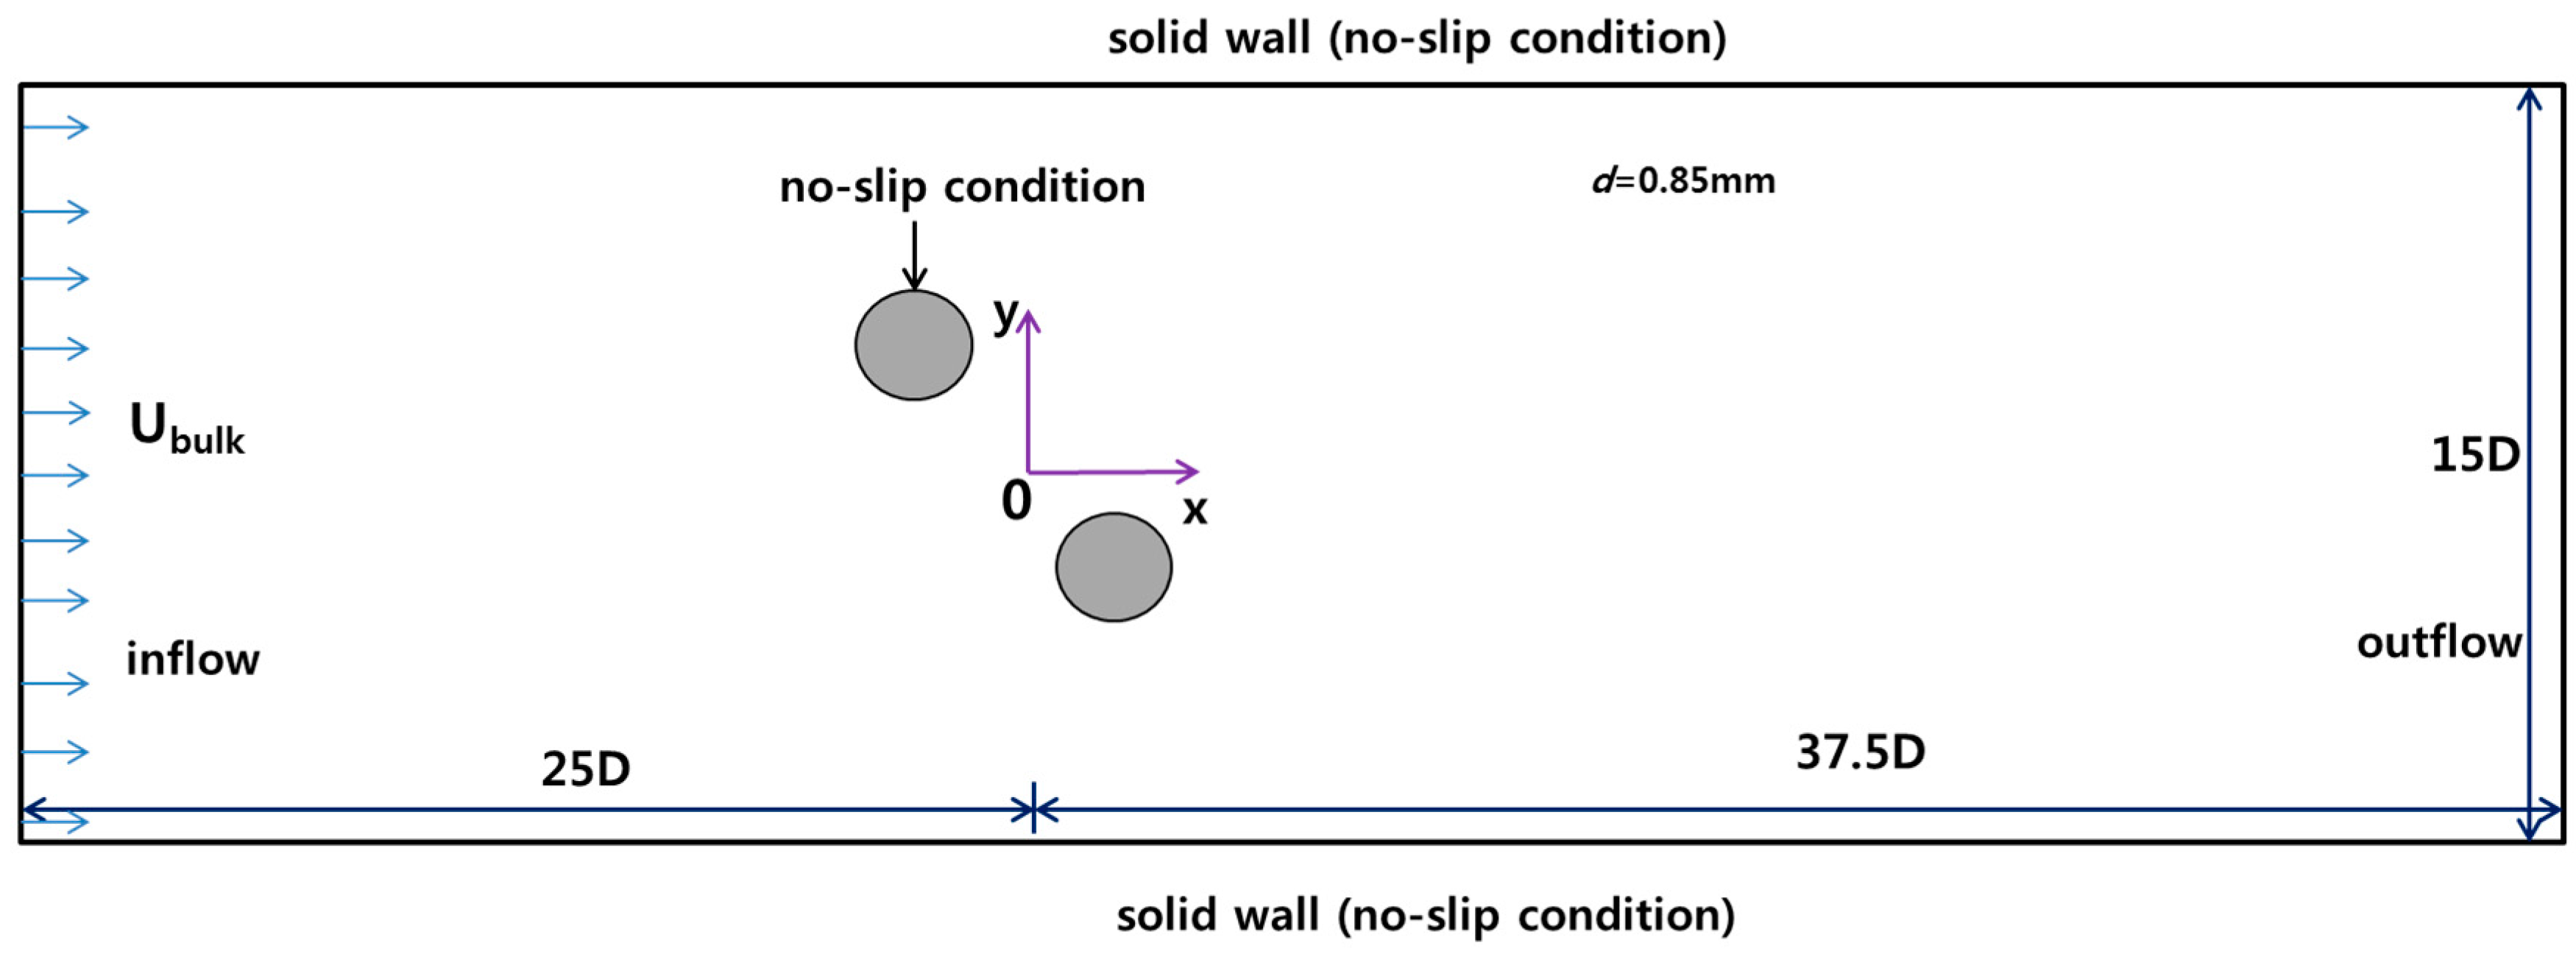
Figure 2.
Schematic representation of flow around two cylinders and simulation cases with staggered array: The approaching velocity Ubulk is from left to right. The α is the alignment angle between two cylinders and the dot represent the center location of another cylinder.
Figure 2.
Schematic representation of flow around two cylinders and simulation cases with staggered array: The approaching velocity Ubulk is from left to right. The α is the alignment angle between two cylinders and the dot represent the center location of another cylinder.

Figure 3.
Computational grids around two cylinders with an alignment angle of 45°: (a) s/D = 1.25; (b) s/D = 5.0.
Figure 3.
Computational grids around two cylinders with an alignment angle of 45°: (a) s/D = 1.25; (b) s/D = 5.0.
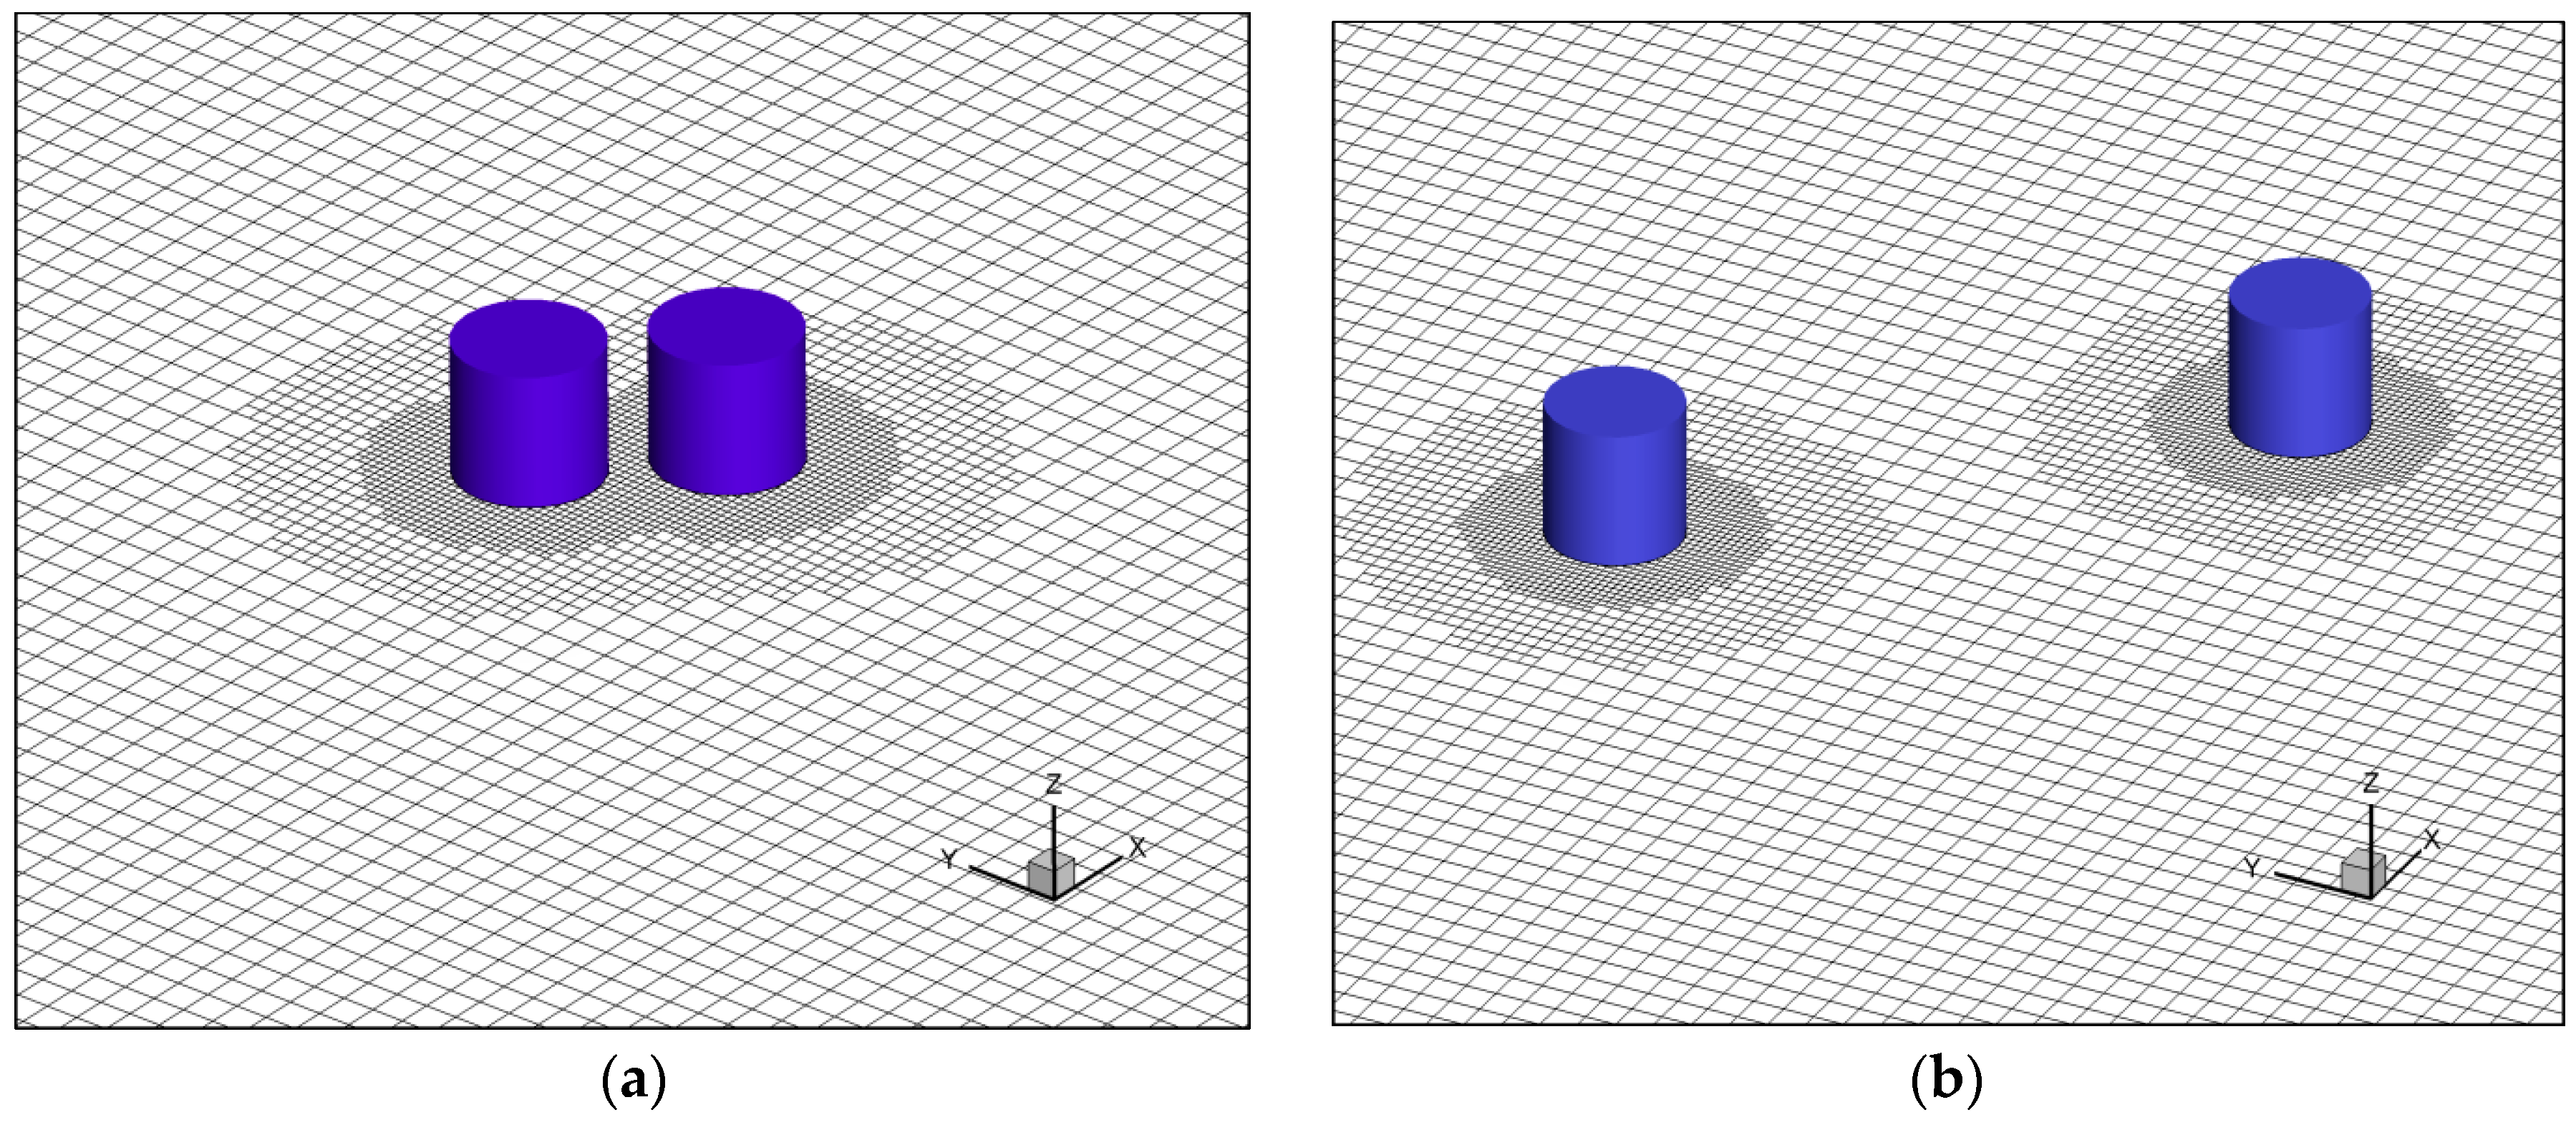
Figure 4.
Instantaneous isosurface of Q-criterion on equilibrium bed at different alignment angles of two cylinders with three spacing ratio (s/D = 1.25 (Left); s/D = 2.5 (Middle); s/D = 1.25 (Right)): (a) α = 0°; (b) α = 30°; (c) α = 60°.
Figure 4.
Instantaneous isosurface of Q-criterion on equilibrium bed at different alignment angles of two cylinders with three spacing ratio (s/D = 1.25 (Left); s/D = 2.5 (Middle); s/D = 1.25 (Right)): (a) α = 0°; (b) α = 30°; (c) α = 60°.
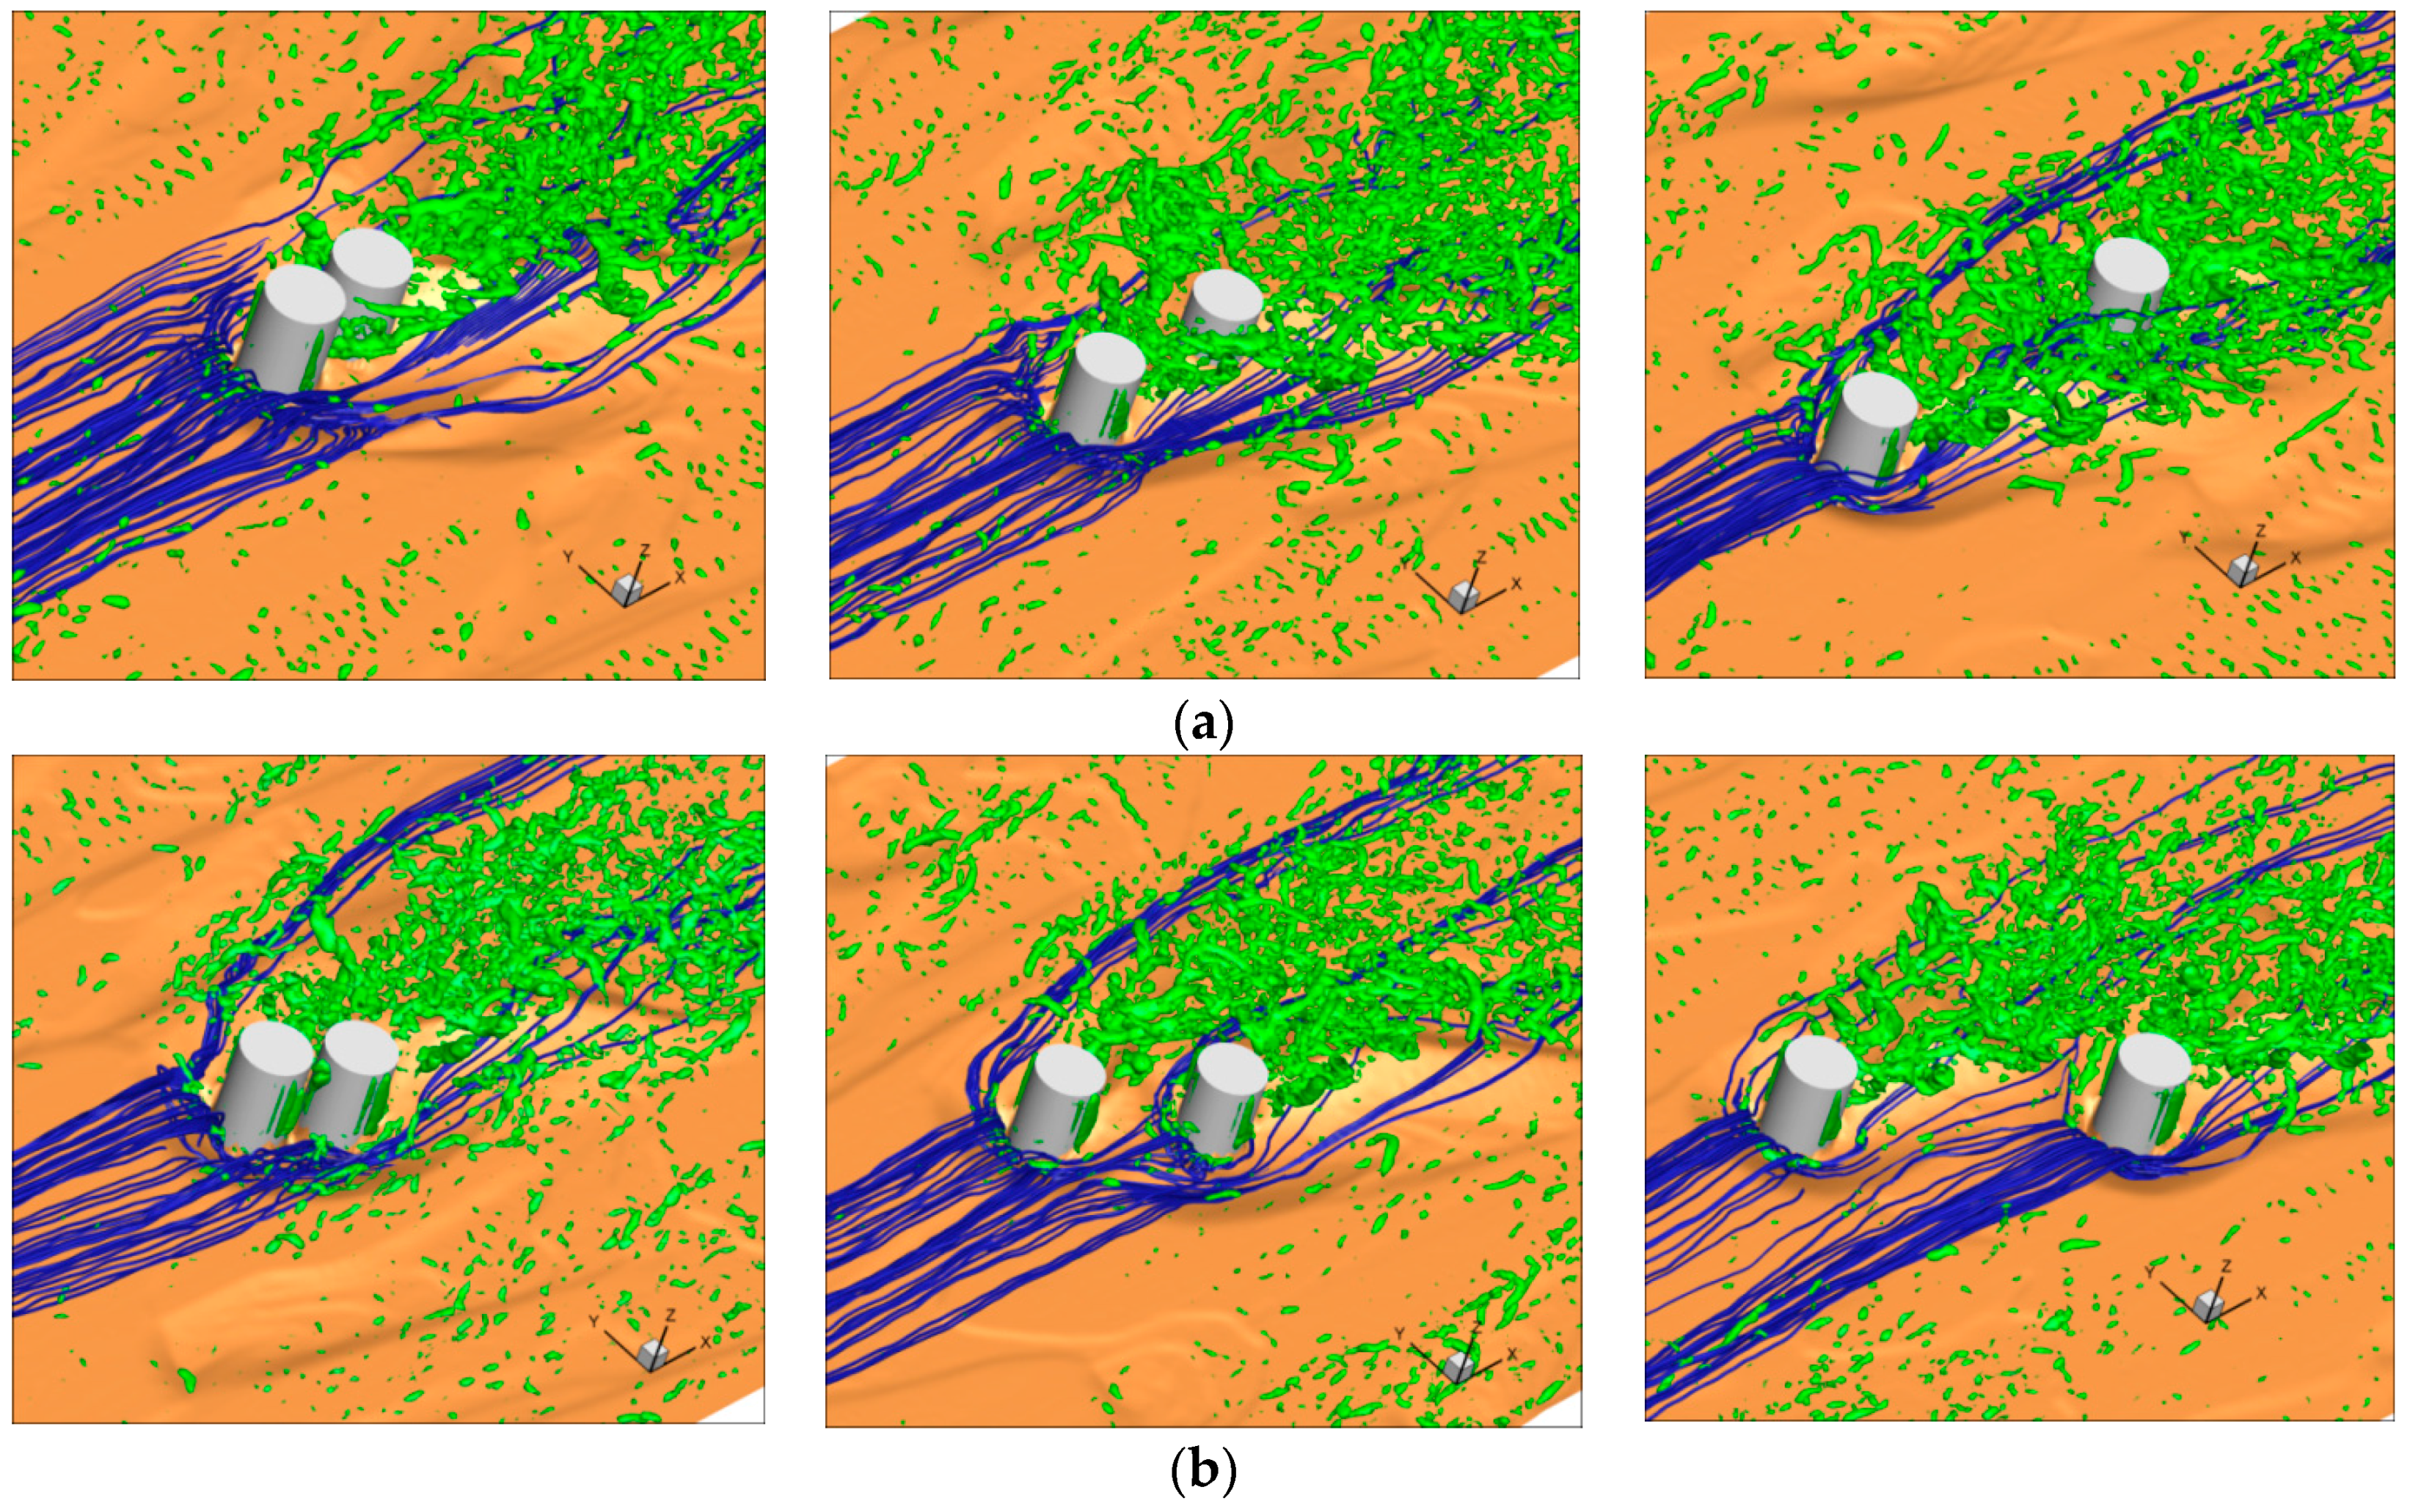

Figure 5.
Time series of instantaneous shear velocity (α = 0° (Left); α = 30° (Middle); α = 60° (Right)): (a) s/D=1.25 and (b) s/D=5.0.
Figure 5.
Time series of instantaneous shear velocity (α = 0° (Left); α = 30° (Middle); α = 60° (Right)): (a) s/D=1.25 and (b) s/D=5.0.
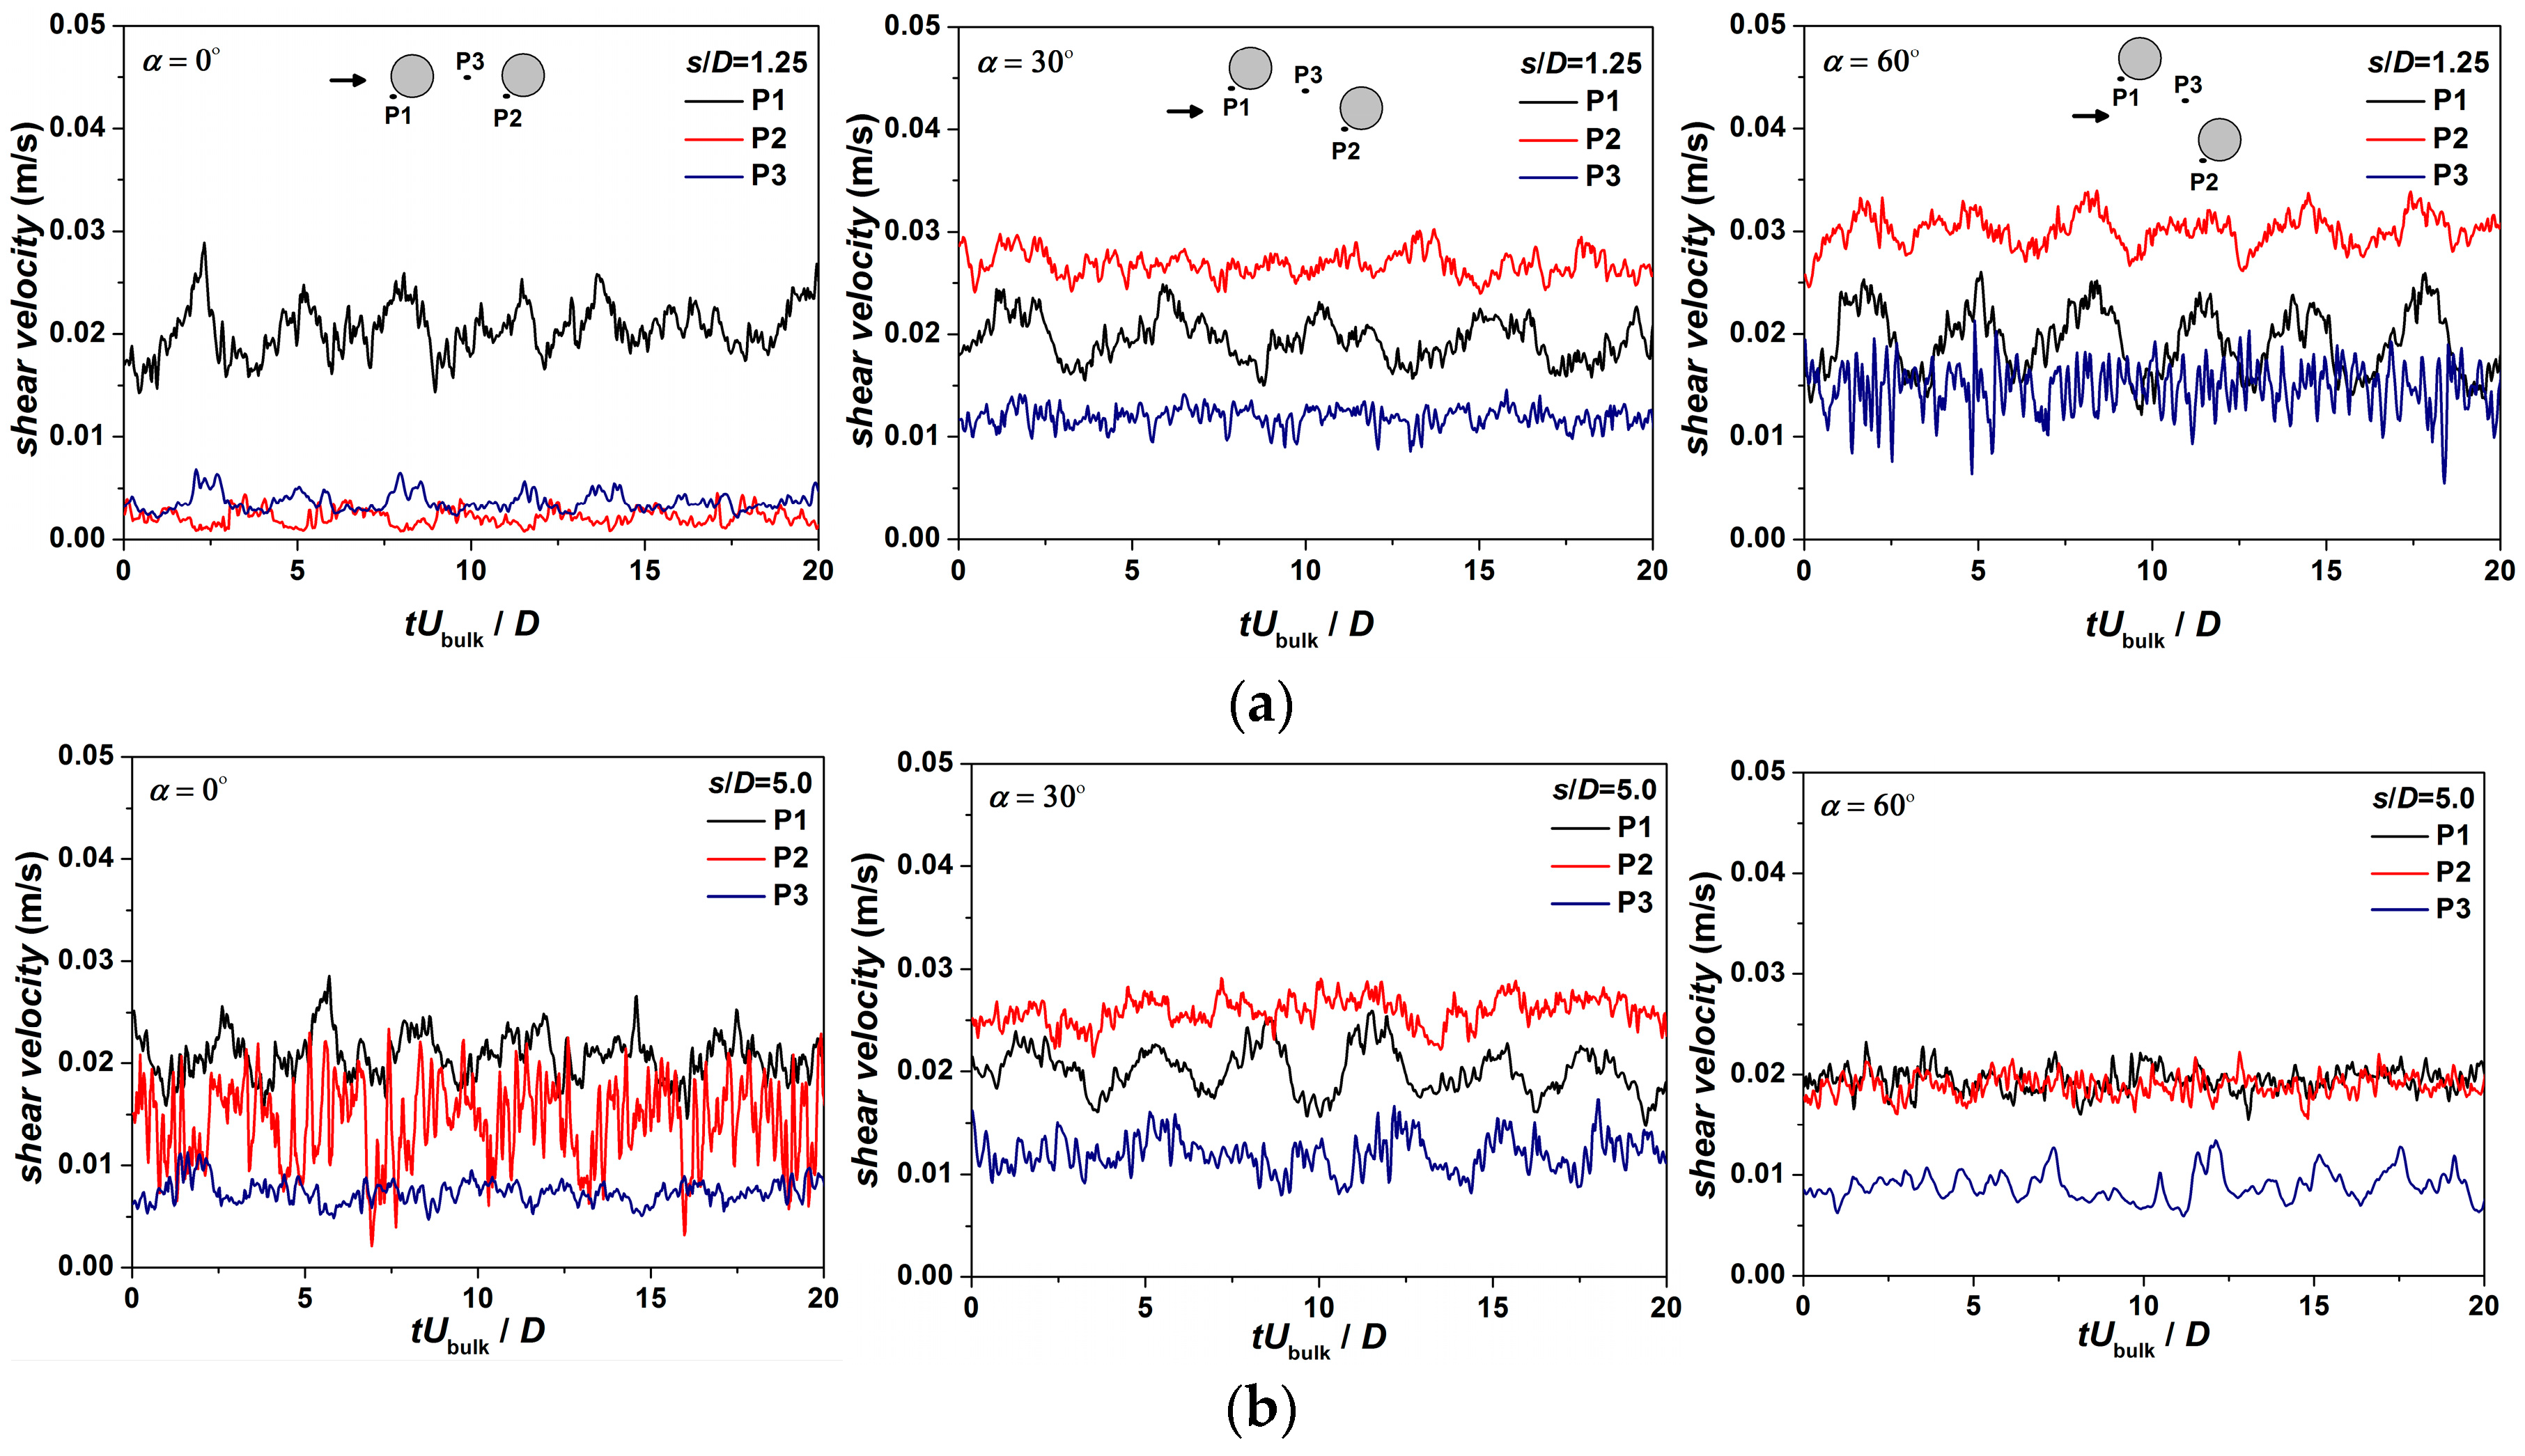
Figure 6.
Instantaneous views of the bed elevation for an alignment angle of 45° with s/D = 1.25 at 10 s, 240 s, 1800 s and equilibrium: (a) Time = 10 s; (b) Time = 240 s; (c) Time = 1800 s; (d) Time = Equilibrium.
Figure 6.
Instantaneous views of the bed elevation for an alignment angle of 45° with s/D = 1.25 at 10 s, 240 s, 1800 s and equilibrium: (a) Time = 10 s; (b) Time = 240 s; (c) Time = 1800 s; (d) Time = Equilibrium.

Figure 7.
Instantaneous views of the bed elevation for an alignment angle of 45° with s/D = 5.0 at 10 s, 240 s, 1800 s and final time: (a) Time = 10 s; (b) Time = 240 s; (c) Time = 1800 s; (d) Time = Equilibrium.
Figure 7.
Instantaneous views of the bed elevation for an alignment angle of 45° with s/D = 5.0 at 10 s, 240 s, 1800 s and final time: (a) Time = 10 s; (b) Time = 240 s; (c) Time = 1800 s; (d) Time = Equilibrium.
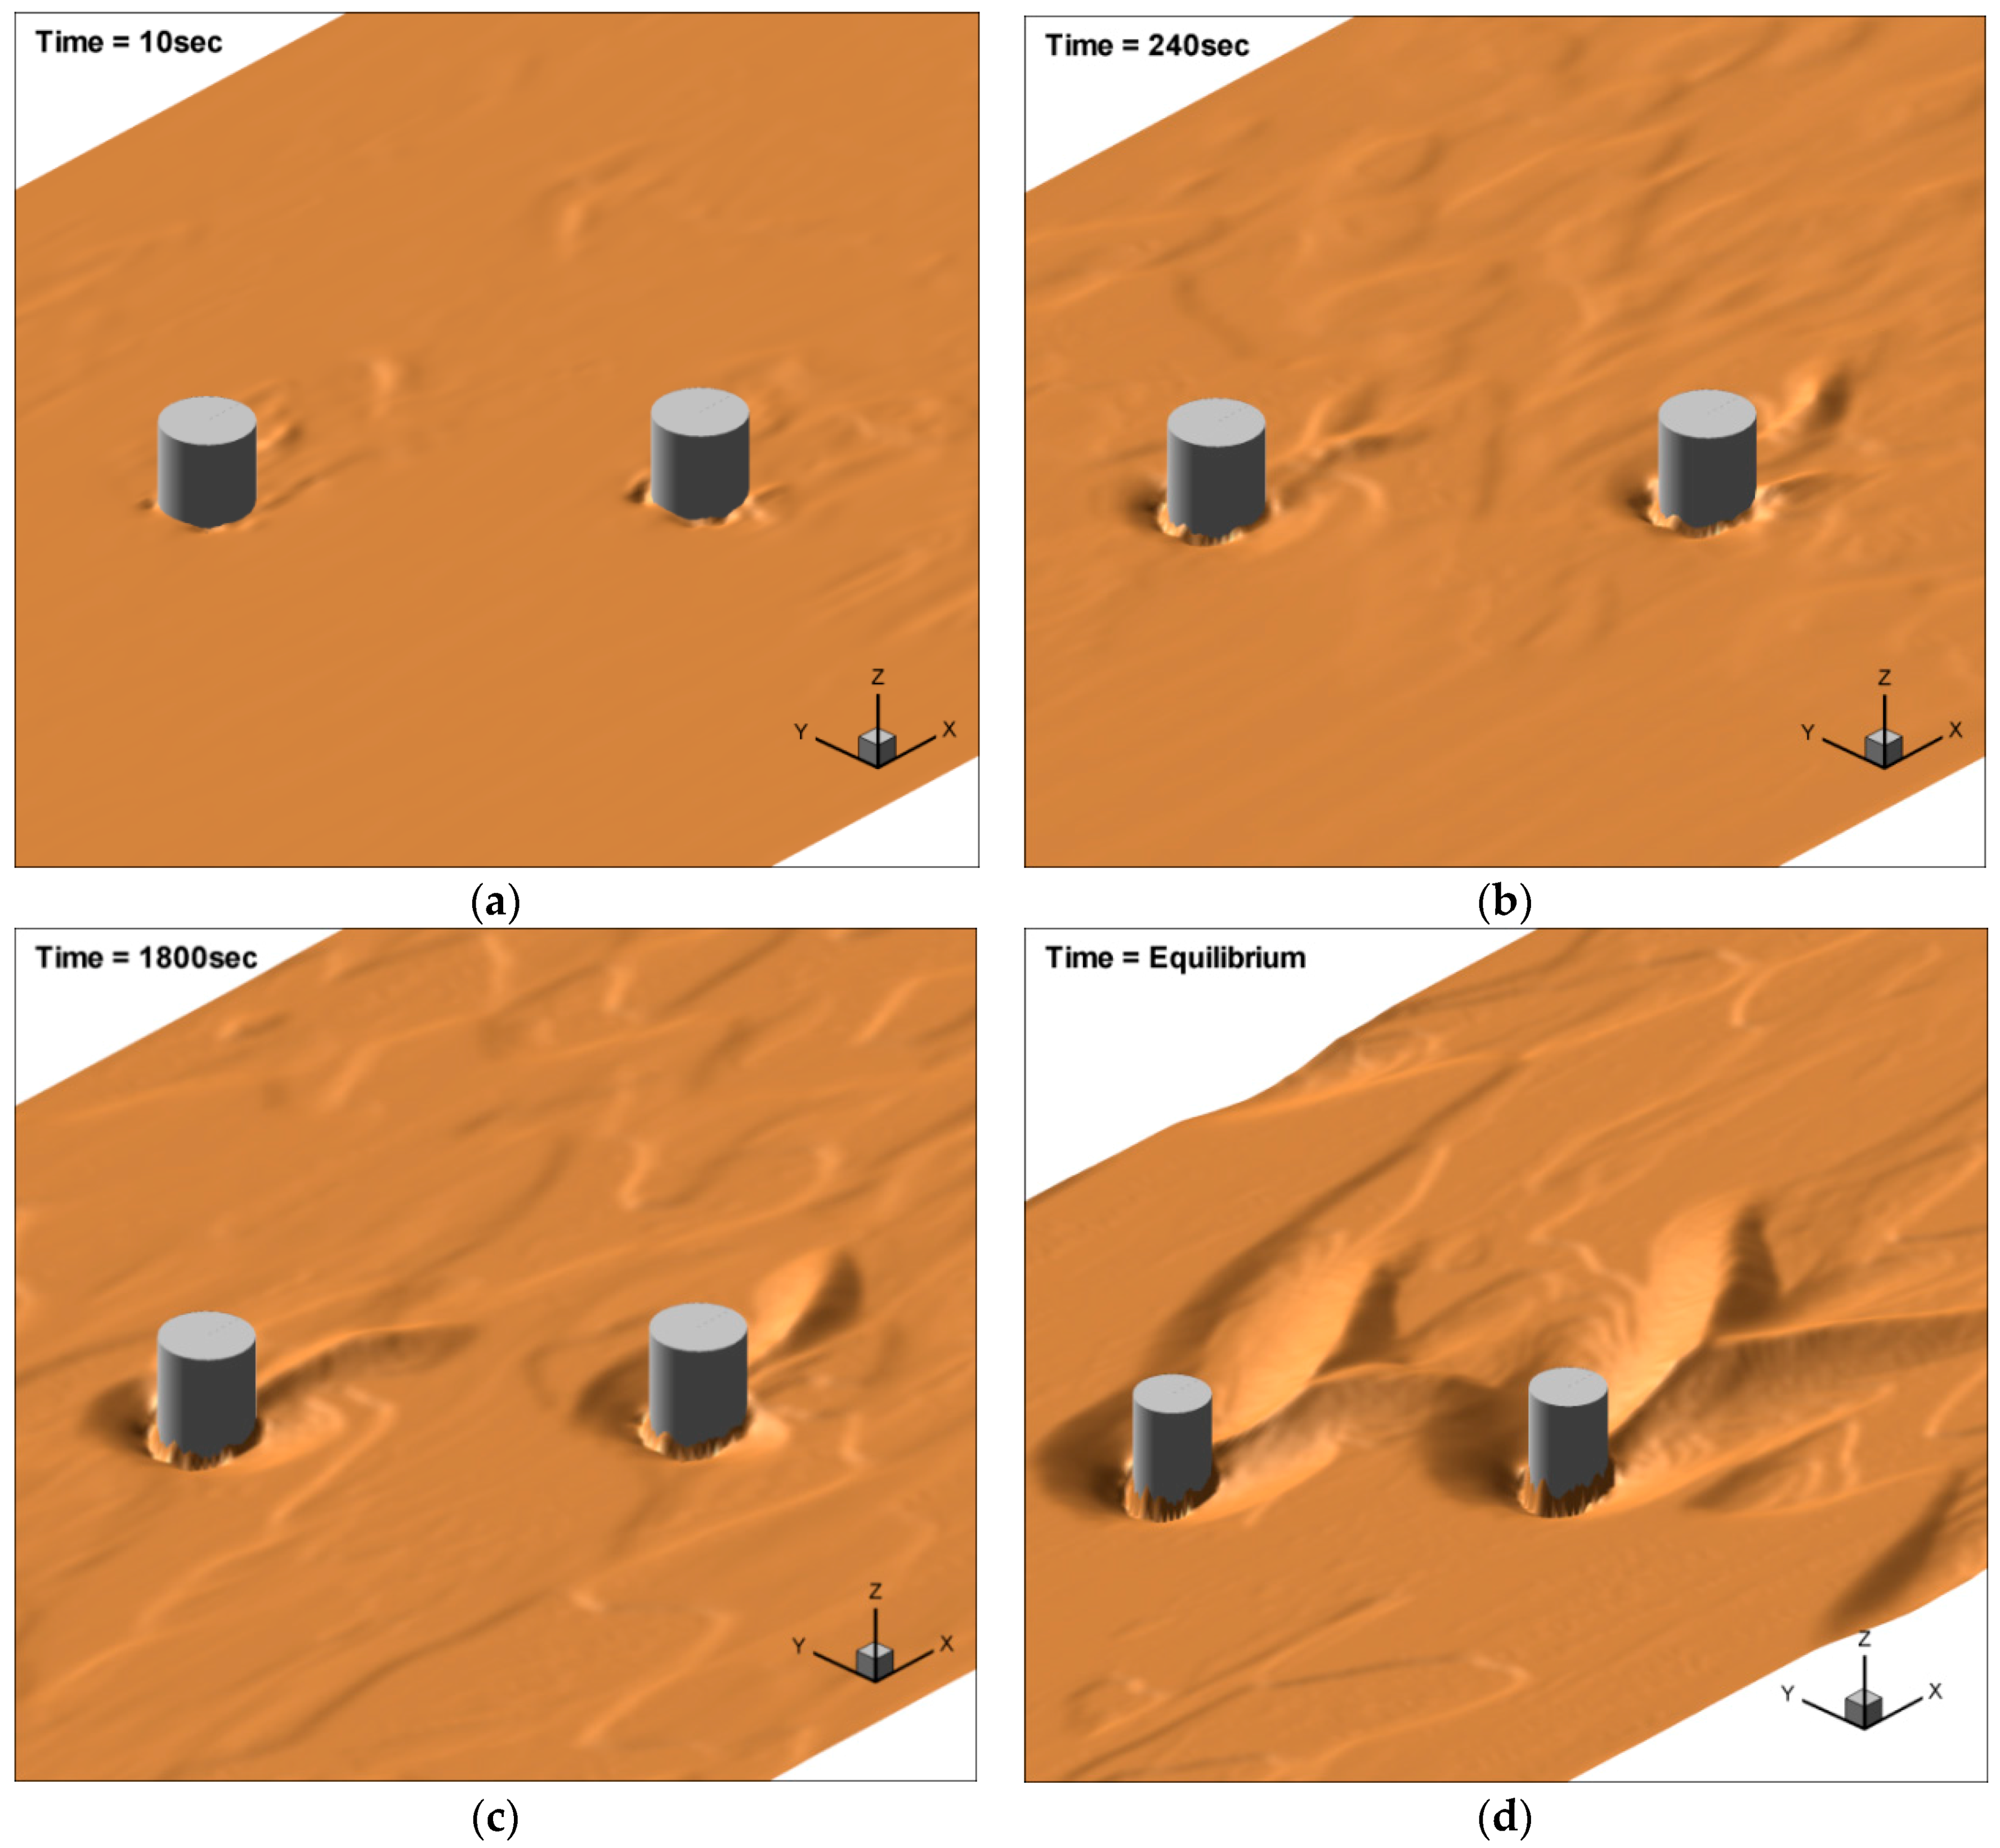
Figure 8.
Maximum scour profiles around each cylinder for s/D = 1.25 (Upper), s/D = 2.5 (Middle), s/D = 5.0 (Lower): (a) Front cylinder; (b) Rear cylinder.
Figure 8.
Maximum scour profiles around each cylinder for s/D = 1.25 (Upper), s/D = 2.5 (Middle), s/D = 5.0 (Lower): (a) Front cylinder; (b) Rear cylinder.
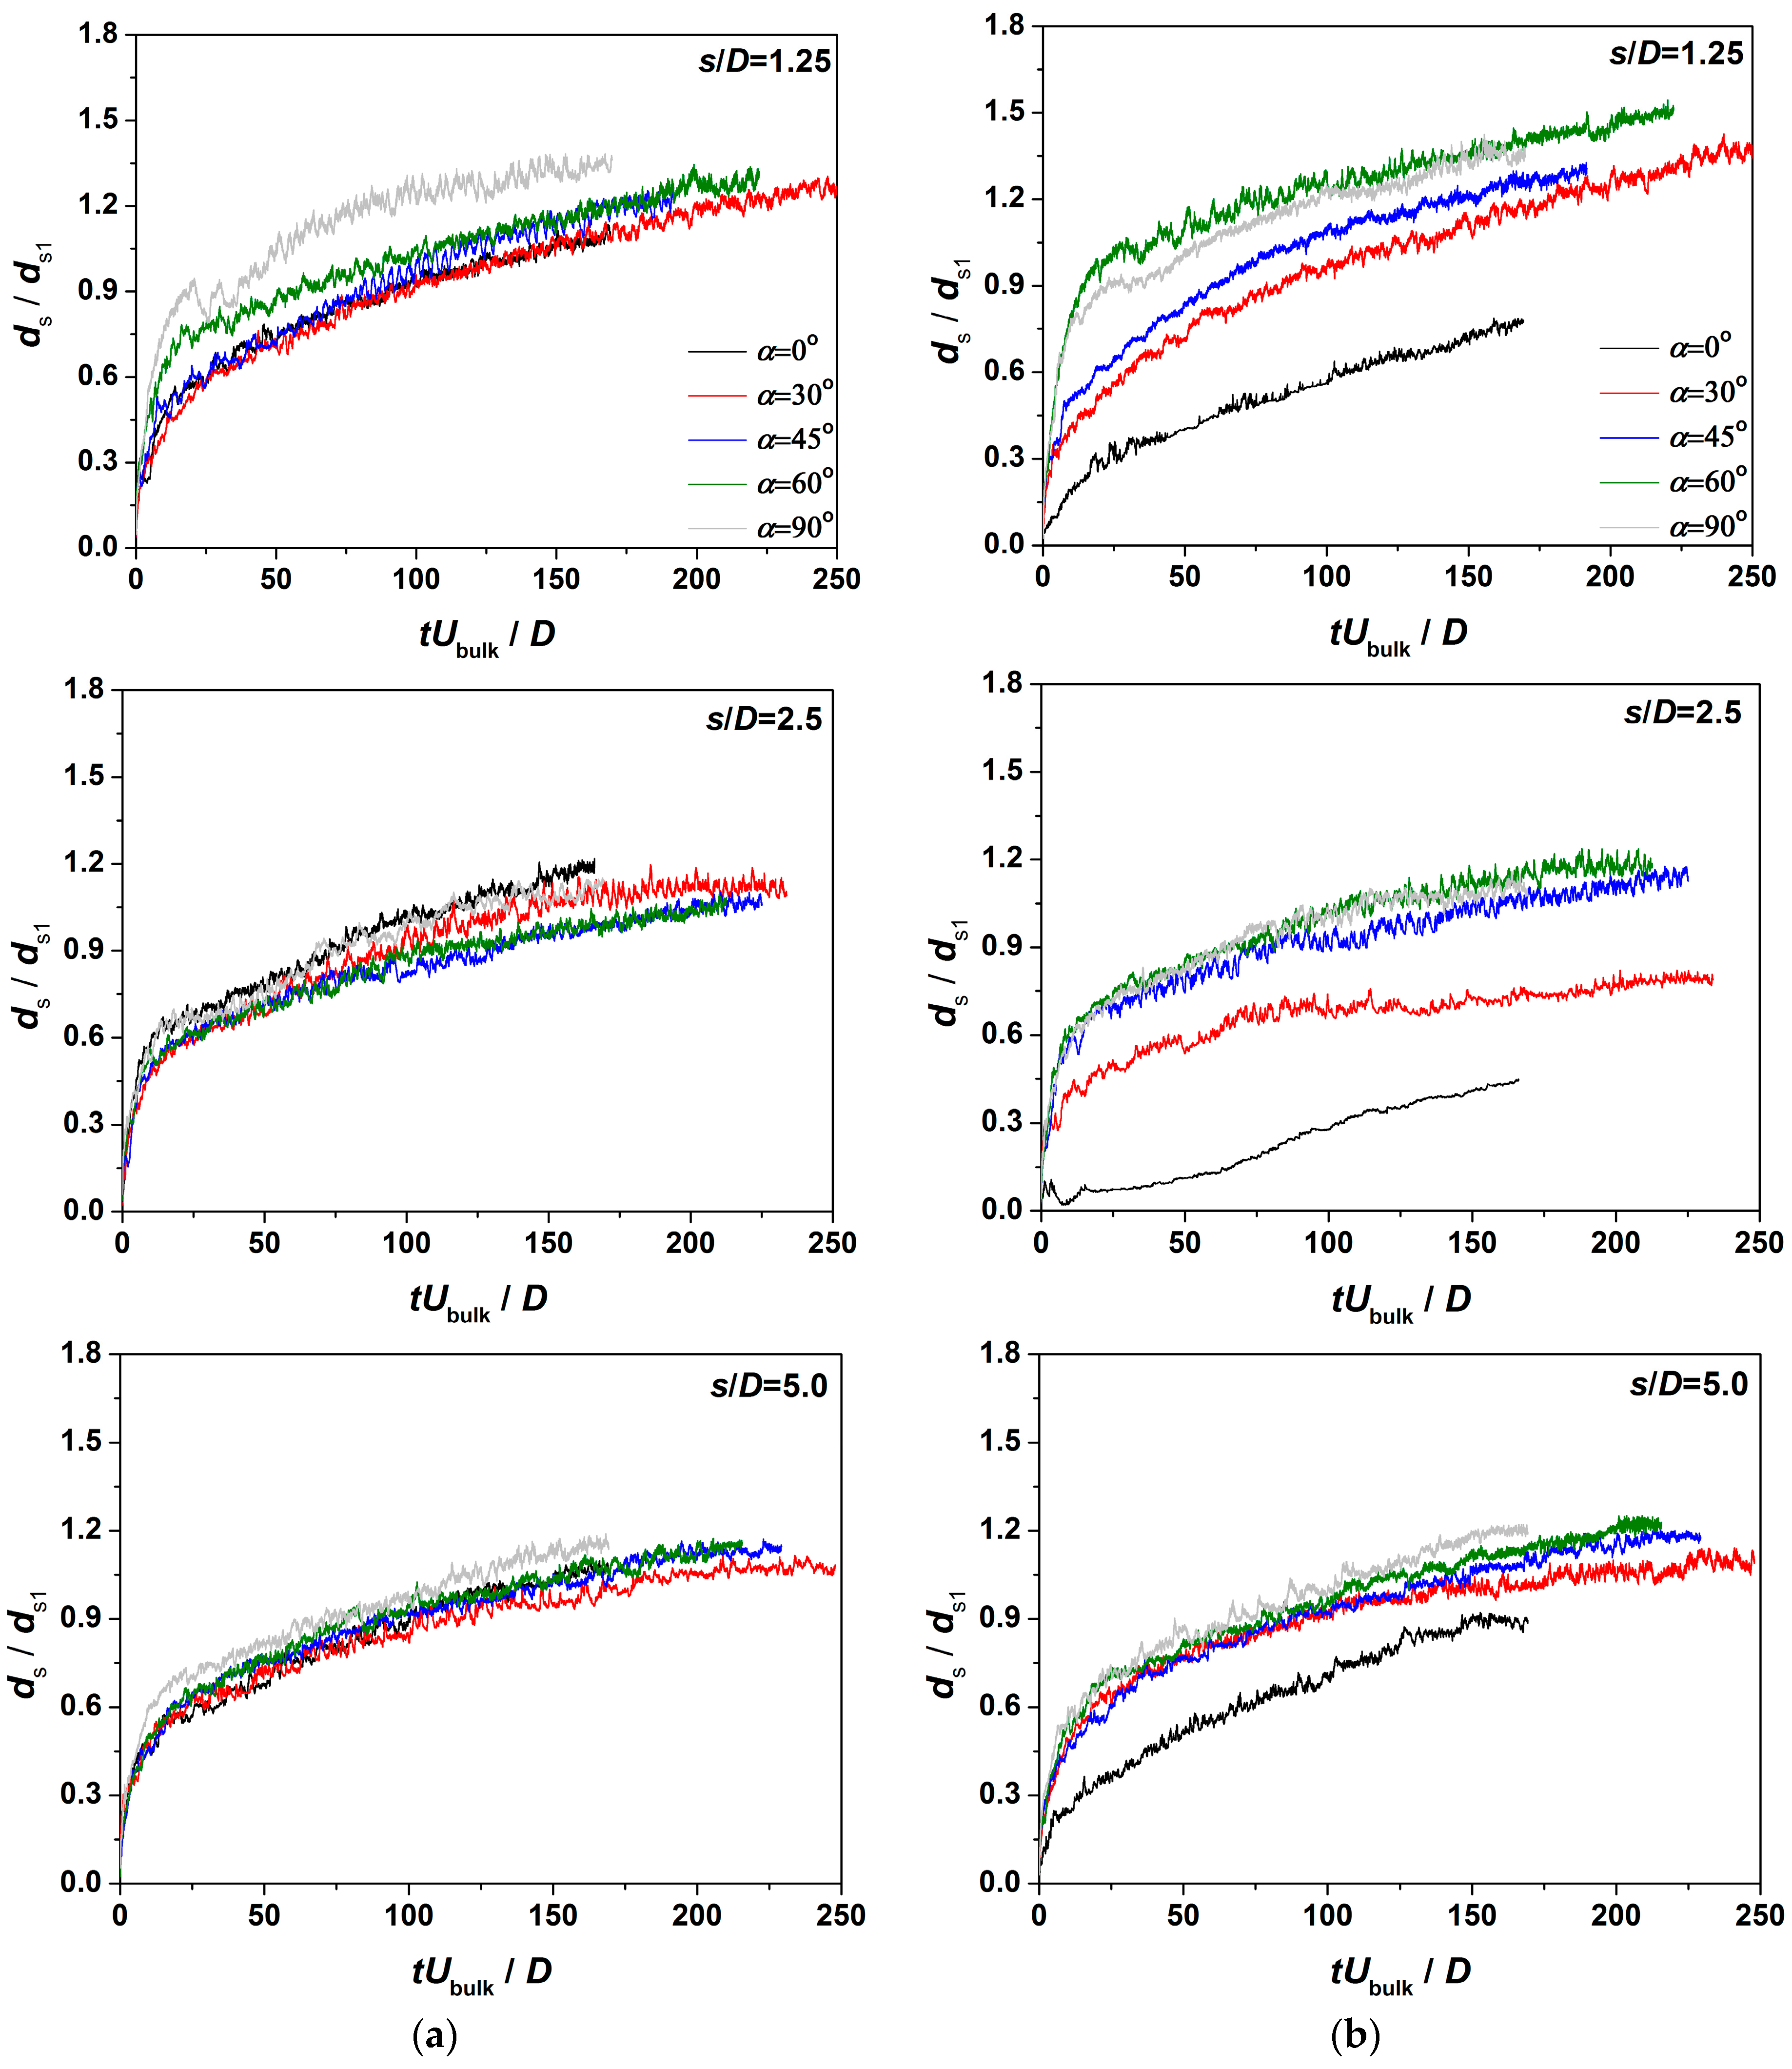
Figure 9.
Bed topography at the equilibrium for alignment angles of α = 0°, 30°, 60°: (a) s/D = 1.25; (b) s/D = 2.5; (c) s/D = 3.75; (d) s/D = 5.0.
Figure 9.
Bed topography at the equilibrium for alignment angles of α = 0°, 30°, 60°: (a) s/D = 1.25; (b) s/D = 2.5; (c) s/D = 3.75; (d) s/D = 5.0.

Figure 10.
Local scour depth: (a) Schematic view of maximum scour areas around two cylinders; (b) Maximum scour depth at the front cylinder; (c) Maximum scour depth at the rear cylinder; (d) Local scour depth at the center location between two cylinders.
Figure 10.
Local scour depth: (a) Schematic view of maximum scour areas around two cylinders; (b) Maximum scour depth at the front cylinder; (c) Maximum scour depth at the rear cylinder; (d) Local scour depth at the center location between two cylinders.

Figure 11.
Maximum scour depth according to the gap between two cylinders.
© 2017 by the authors. Licensee MDPI, Basel, Switzerland. This article is an open access article distributed under the terms and conditions of the Creative Commons Attribution (CC BY) license (http://creativecommons.org/licenses/by/4.0/).
Share and Cite
MDPI and ACS Style
Kim, H.S.; Roh, M.; Nabi, M. Computational Modeling of Flow and Scour around Two Cylinders in Staggered Array. Water 2017, 9, 654. https://doi.org/10.3390/w9090654
AMA Style
Kim HS, Roh M, Nabi M. Computational Modeling of Flow and Scour around Two Cylinders in Staggered Array. Water. 2017; 9(9):654. https://doi.org/10.3390/w9090654
Chicago/Turabian StyleKim, Hyung Suk, Min Roh, and Mohamed Nabi. 2017. "Computational Modeling of Flow and Scour around Two Cylinders in Staggered Array" Water 9, no. 9: 654. https://doi.org/10.3390/w9090654
Note that from the first issue of 2016, this journal uses article numbers instead of page numbers. See further details here.