Article

Methane Emissions in Spanish Saline Lakes: Current Rates, Temperature and Salinity Responses, and Evolution under Different Climate Change Scenarios

Cavanilles Institute for Biodiversity and Evolutionary Biology, University of Valencia, E-46980 Paterna, Valencia, Spain
*
Author to whom correspondence should be addressed.
Water 2017, 9(9), 659; https://doi.org/10.3390/w9090659
Submission received: 2 August 2017 / Revised: 24 August 2017 / Accepted: 28 August 2017 / Published: 1 September 2017
(This article belongs to the Special Issue Ecological Responses of Lakes to Climate Change)

Abstract

:
Wetlands are among the most biologically active ecosystems on Earth, playing an important role in the global carbon cycle. Methane production in wetlands, resulting from anaerobic respiration of organic matter, accounts for an important part of natural sources of methane. In this work, we have evaluated the methane release rates of saline shallow lakes located in Central Spain, some of which maintain natural conditions, whereas others are hydrologically altered, with lowered salinity, or even presenting trophic alterations. We used sediment core plus water incubations to determine the release of methane from the studied lakes to the atmosphere, integrating both diffusion and ebullition processes, as well as the effects of temperature and salinity on methane production. The studied hypersaline lakes released methane at rates within the lowest range reported for temperate lakes and wetlands, whereas in hydrologically altered lakes that have dropped their salinity these rates were markedly higher. Models built with the specific response of methane release rates to temperature regarding the temperature changes expected according to the RCP climate scenarios predicted significant increases of these rates for the future, which could almost double current methane release for some of the studied lakes under the most pessimistic mitigation scenario (RCP8.5).

1. Introduction

Anthropogenic emissions of greenhouse gases (GHG) due to human activity are increasing global average surface air temperatures, thus disrupting weather patterns [1,2]. Natural sources and sinks also play a role on carbon and GHG exchanges on Earth. The main biological processes involved in the carbon cycle within aquatic ecosystems are inorganic carbon fixation (primary productivity) as well as those releasing carbon as CO2 or methane (aerobic respiration, and methanogenesis, the latter among other anaerobic respirations) [3]. The balance of these processes is closely related with the natural emissions of greenhouse gases (GHG), with lakes and wetlands being particularly relevant [4]. Inland aquatic ecosystems can make a disproportionately large contribution to GHG emissions but also to carbon burial [5,6], with shallow lakes being particular hotspots. Given their global prevalence, how GHG fluxes from shallow lakes to the atmosphere are altered by climate change may have deep implications for the global carbon cycle [7]. The balance of CH4 and CO2 exchange can provide an index of lakes and wetland’s greenhouse gas (carbon) contribution to the atmosphere [8]. Contrarily, the world’s wetlands, despite being only about 7% of the terrestrial landscape or <2% of the globe [9], could be net sinks for a significant portion (as much as 1 Pg/year) of the carbon released by fossil fuel combustion [10], and must be considered in strategies to mitigate climate change [11]. However, wetlands can be both sources and sinks of carbon, depending on their age, operation, and the environmental boundary conditions such as location and climate [5].
Saline lakes are spread over the world, though mostly located in semiarid and arid areas [12]. Most of them are located in endorheic areas, and their salinity could vary along the flooding period depending on the seasonal hydrological balance. According to their salinity, they can be sorted along the series subsaline-hyposaline–mesosaline–hypersaline, with the latter having higher salt content than the sea [13].
Saline endorheic lakes from “La Mancha Húmeda Biosphere Reserve” (Central Spain) are among the most important wetlands in the western Mediterranean [14]. These saline inland lakes (“Lagunas”) are small or medium sized (less than a few hundred hectares, at the most), shallow temporary systems with strongly fluctuating water level, where an intense recycling of nutrients and organic matter occurs [15,16]. The metabolism of these lakes is mostly unknown, since the more advanced studies mostly focus on their distinct microbial communities [17,18], but so far have not investigated lake biogeochemistry. Furthermore, no studies exist devoted to the methane production of this type of lakes neither in the area nor in the rest of Europe [19].
Multiple interrelated factors may drive C fluxes in shallow lakes and wetlands (e.g., the length of the flooding period, salinity, temperature, and trophic status), in such a way that the biological processes can result in the net capture or release of carbon to/from the water into the sediments and/or, mediated by physical and chemical processes, also from/to the atmosphere. On the other hand, the Global Warming Potential (GWP) and residence time in the atmosphere of the main GHGs differ [1]. Although its average residence time in the atmosphere is lower, the radiative effect and, consequently, the short and medium term Global Warming Potential (GWP) of methane, are much higher than that of CO2 [20]. Thus, aerobic and different anaerobic respiratory processes contribute differentially in intensity and time window to the greenhouse effect [1].
Chiefly, all the metabolic processes involved in GHG emissions are closely tied to the hydrologic regime, not only the aerobic pathways but also methane emissions [21], because microbial activity is modulated by the availability of water [22]. Temporary hypersaline lakes, when not altered, show a negative water balance during part of the year and, consequently, the length of their flooding period and higher biological activity, though quite variable, usually spans not much more than half a year in the studied area [23]. Anthropogenic impacts in lakes and wetlands from La Mancha Húmeda Biosphere Reserve usually involve alterations of the length of the flooding period, desalinization, and nutrients spills [14,16]. Lakes and wetlands may change their C budget and related processes dramatically as they become polluted with nutrients, and shifts in their salinity conditions also change their capacity to hold vegetation [24]. Because of the temporality of these lakes, methane fluxes are expected to vary substantially over the annual cycle. Therefore, to properly assess these fluxes, it is essential to address temporal patterns that cover the hydrological cycle, as well as the effect of the main ecological factors that can vary seasonally and thus influence methane production rates [25].
The temperature dependence of processes driving the C budget is a major issue. Among these, methane fluxes from freshwater ecosystems are clearly influenced by temperature [26], though there is a lack of information for saline lakes. Since respiration processes, such as methanogenesis, are exponentially related to temperature, an exponential function is often used to determine the Q10 of these processes. This shows how methanogenesis increases when temperature rises by 10 °C [27]. On the other hand, the high salt content may inhibit methane production [28], particularly when high concentrations of sulfate occur enabling more energetic anaerobic respiratory processes alternative to methanogenesis, such as sulfate reduction. In these cases, salinity increases could mask the enhancing effect of temperature on methane production rates.
Since methane production rates are enhanced by temperature, and temperature will vary because of climate change, a positive feedback effect could occur, as temperature would enhance methane production rates and the additional methane release would, in turn, enhance climate change. However, the warming balance would depend not only on methane emissions, but also on how the emissions of other GHG would change as well as on the global balance of carbon sequestration/release of the involved ecosystems.
Additionally, other factors could covariate with temperature as a consequence of climate change. Among these, the hydrological balance of the lakes and wetlands, mainly related to temperature through evapotranspiration, and the direct and indirect changes in salinity [29], are the most suitable to influence methane emissions. The hydrological balance of the lakes varies seasonally depending on the seasonal climate, and thus determines the extent of the flooded area. Water availability determines, in turn, most biological activities, including methane production, whereas salinity also influences this activity [22]. Hypothetically, the increase in salt concentration is linked to increased evapotranspiration in the warmer periods, giving an antagonistic effect of temperature, which directly increases the rates of methane production but indirectly would reduce them because of increased salinity and decreased length of the flooding period.
Climate predictions use possible scenarios linked to mitigation efforts [30,31,32]. This establishes the physical basis for climate change mitigation, such as that of limiting the increase of global-mean temperatures below 2 °C [33,34] as agreed in the Conference of Parts COP21 2015 driving to the Paris Agreement of the UN-FCCC (United Nations—Framework Convention on Climate Change). The new generation scenarios, superseding the SRES (Special Report on Emissions Scenarios) [20], are the Representative Concentration Pathways (RCPs), which are defined by their total radiative forcing (cumulative measure of human emissions of GHGs from all sources expressed in Watts per square meter), leading to a stabilization of radiative forcing at a certain level by 2100 [35]. These pathways describe trends in long-term global emissions of greenhouse gases (GHGs), short-lived species, and land-use/land-cover change in a global economic framework [36,37]. Each RCP could result from different combinations of economic, technological, demographic, policy, and institutional futures. The RCPs were chosen to represent a broad range of climate outcomes, based on a literature review, and are neither political forecasts nor policy recommendations [1]. Meinshausen et al. [38] describe the harmonization and calculation procedures of the emission projections of long-lived greenhouse gases used to estimate concentration trajectories for these gases by 2100 (RCP) and beyond (ECPs, Extended Concentration Pathways, from 2100 to 2300). Four scenarios are currently given by Fifth Evaluation Report of the IPCC (AR5), RCP2.6, RCP4.5, RCP6.0 and RCP8.5 [39]. Projected global-mean temperatures increase by 2100 range from 1.5 °C for the lowest of the four RCPs to 4.5 °C for the highest one (RCP8.5) relative to pre-industrial levels [38,40,41], whereas the stabilization scenarios RCP4.5 [37] and RCP6 [36] drive to intermediate temperature increases. Each of these scenarios comprises different mitigation efforts; e.g., RCP2.6, which is representative of the literature on mitigation scenarios aiming to limit the increase of global mean temperature to 2 °C, requires cumulative emissions of greenhouse gases from 2010 to 2100 to be reduced by 70% (often showing negative emissions from energy use in the second half of the 21st century) compared to a baseline scenario, with substantial changes in energy use and emissions of non-CO2 gases, such as methane [34].
In this study, five saline endorheic lakes from “La Mancha Húmeda Biosphere Reserve” (Central Spain), with contrasting hydroperiods, salinity, and trophic status, were surveyed by in situ and laboratory measurements of methane emission rates, and the main driving factors were studied. We tried to evaluate the sensitivity of methane emissions to the ongoing warming associated to climate change. Temperature sensitivity (Q10) of CH4 emissions was estimated through temperature-controlled experiments. Non-CO2 GHG, such as methane, can have a high importance for the achievement of climate mitigation efforts. Thus, we jointly used the different RCP scenarios and related temperature change forecasts with our models of temperature-dependent response of methane emission rates to predict the increase in methane emission rates, by considering the temperature increases under the different scenarios within two time frameworks, 2050 and 2070. Additionally, we used these models to estimate the absolute increases in methane release by the hypersaline lakes of La Mancha region.

2. Materials and Methods
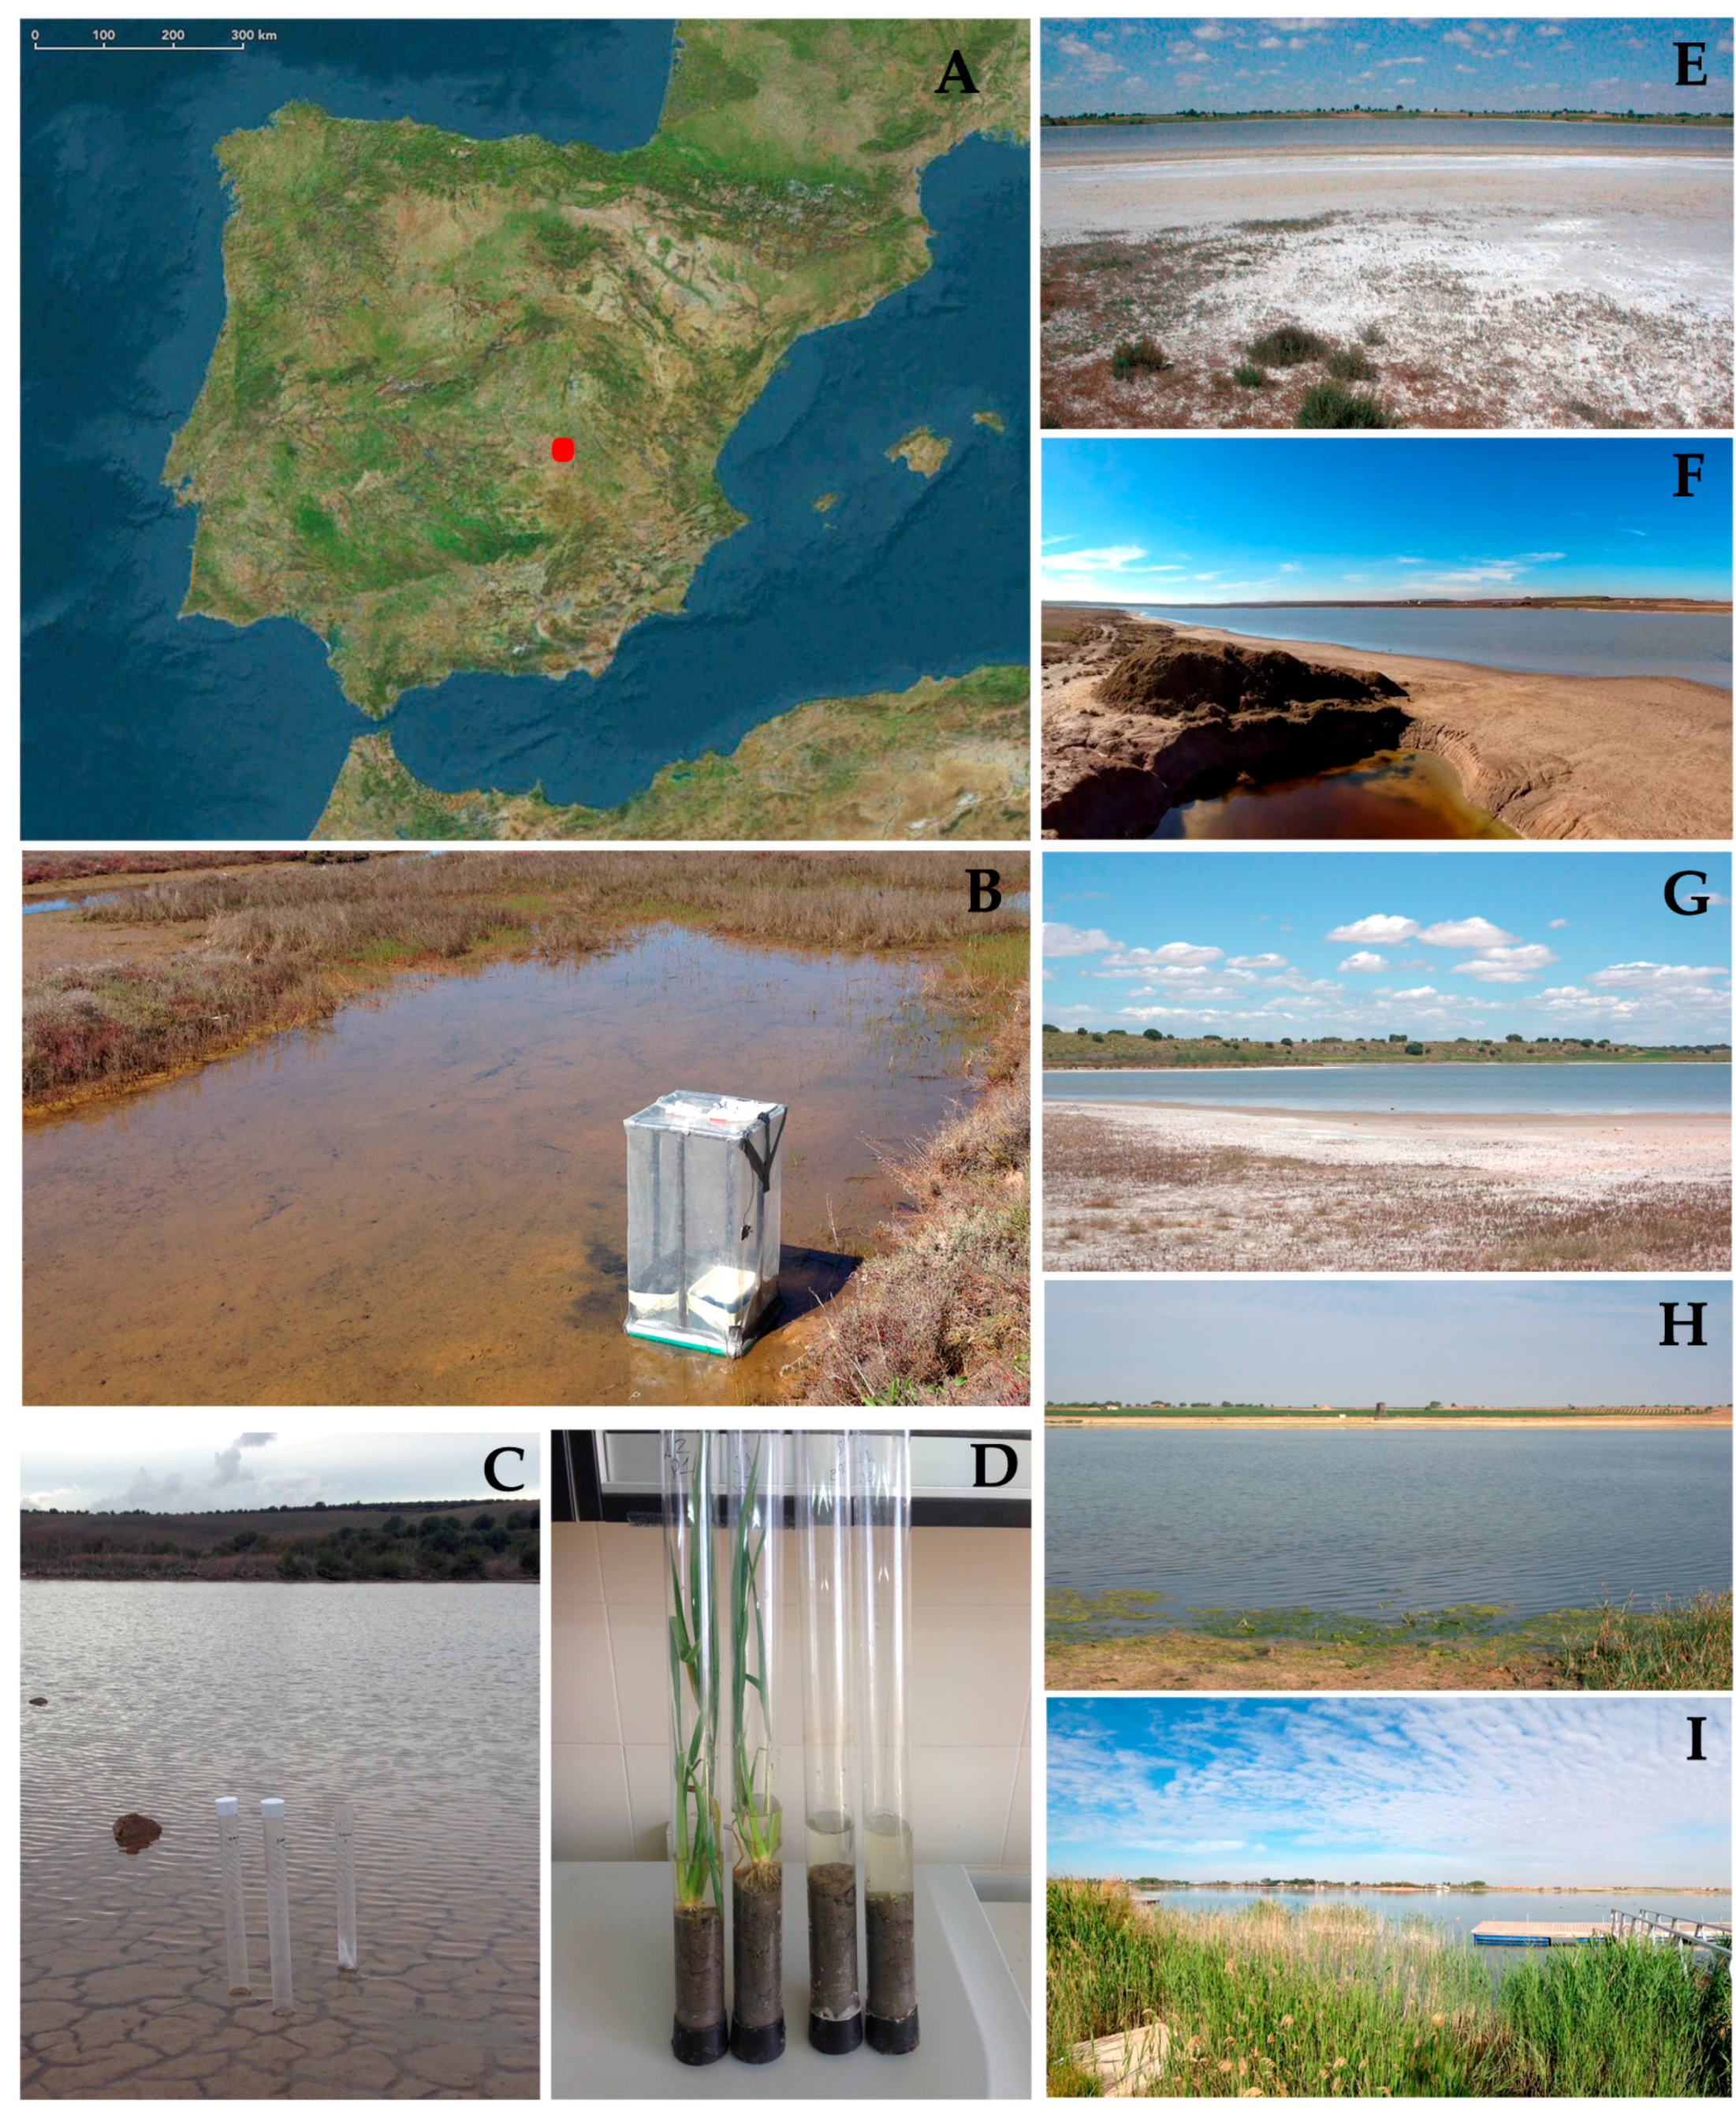
2.1. Study Site

The studied lakes (Figure 1) are located in “La Mancha Húmeda” Biosphere Reserve, one of the most important semiarid wetland districts in Europe, within the Central Spanish Plateau (~600 m above sea level). This region shows a quite flat topography. Climate is temperate continental, with annual rainfall between 400 and 500 mm, cold winters and warm summers. The geographical coordinates of the lakes are shown in Table 1.
The studied lakes present contrasting ecological characteristics (Table 1), being the different lengths of their flooding periods [23] the most remarkable feature driving other ecological characteristics, such as salinity [42,43], as well as lake metabolism. All of them are shallow, with maximum depths ranging from a few cms to around 1 m. They are mainly feed by surface waters and direct rainfall, and hold very small surface catchments. These lakes are endorheic, with no surface outlets, and their water balance is determined by the surface feeding vs. evaporation trade-offs, leading to salt accumulation in the lake basin. Their waters are from slightly to moderately alkaline, with pH ranging 7.6–9.1, and alkalinity ranging 2.5–33.7 meq/L.
A first group of lakes, the most ephemeral (Tirez, Salicor and Alcahozo, in decreasing order of salinity) are relatively well-preserved shallow temporary lakes, showing maximum depths of up to 30–40 cm on regular years. Its undisturbed flooding period barely extends more than 6–8 months, and salinity ranges from mesosaline (at maximum flooding) to hypersaline conditions (sensu Hammer, [13]), using water electrical conductivity as proxy of salinity), with extremely high saline content in periods close to desiccation. Except occasionally, they present low concentrations of soluble reactive phosphorus, whereas inorganic nitrogen, mostly oxidized forms (nitrate), is much more abundant. Despite the relatively limiting nutrient concentrations in water, easy sediment disturbance linked to the shallowness allows nutrient pulses supporting moderate phytoplankton (and tycoplankton, which are suspended benthic microalgae) growth, resulting in moderate Chl-a concentrations (Table 1). These lakes lack submerged macrophytes and helophytes.
Semipermanent lakes, with flooding period covering most of the year (none or a few months of total lake desiccation), are represented in the study by Laguna de Manjavacas. This was originally a temporary saline lake that starting some decades ago receives wastewater inputs (now treated) from a town (Mota del Cuervo, near 9000 inhabitants) located several kilometers way. These prolong the natural flooding period, reduce salinity, and increase nutrient availability compared to pristine conditions. Thus, at present, the lake ranges from hyposaline in the winter period to hypersaline in periods close to the regular summer desiccation, though mesosaline conditions dominate most of the annual cycle. The increased trophic level is shown by commonly high nutrient and Chl-a concentrations (Table 1). Though submerged macrophytes are usually absent, more than 10% of the lake basin is occupied by a seasonally-developing cover of common reed (Phragmites australis) growing in the less saline area close to the wastewater inlet. Indeed, this is a representative case of both hydrologic and trophic alteration of an originally temporary saline lake.
The third studied lake type, represented by Laguna Grande de Villafranca, is a permanent, hyposaline lake, with fluctuating water depths of up to 1.1 m. Continuous flooding is allowed by its connection to other similar though smaller lake (Laguna Chica de Villafranca), which in turn is fed by freshwaters from the Gigüela River, the latter also showing strong seasonal flow variations. Soluble phosphorus concentrations are commonly low, whereas dissolved inorganic nitrogen, especially nitrate, is quite abundant, all this determining mesotrophic conditions (Table 1). As for Laguna de Manjavacas, in Laguna Grande de Villafranca submerged macrophytes are rare, but around a fourth of the lake basin is also covered by seasonally developing common reed. This is a representative case of saline lakes showing hydrological alterations driving to less saline conditions, but not to an increased trophic status.

2.2. Water Sampling and Determination of Environmental Variables

Water sampling was done bi-monthly in open waters in a central sampling station at each lake during a hydrological cycle (starting in October). For the in situ limnological characterization, measures of water electrical conductivity (a proxy to salinity) were obtained with a WTW LF-191 conductivity meter. The dissolved oxygen (DO) and temperature were determined with a WTW Oxi-3310 oxymeter with optical oxygen sensor. A salinity correction after measuring the conductivity was applied for DO measurements. Discrete samples for analytical and metabolic determinations were collected at each sampling campaign from subsurface waters over the deepest point of each lake. Samples for dissolved nutrient (N and P compounds) analyses were obtained by immediately filtering the water in the field through Whatman GF/F glass fiber filters. Analytical determinations were made following Standard Methods for Water Analyses [44]. Alkalinity was measured after titration with HCl using a pH shift indicator (phenophtalein) to the equivalence end point pH. Nitrate was measured by the second derivative UV/Visible spectroscopy method [45]. Ammonia was analyzed using the modified indophenol blue method [46]. Soluble reactive phosphorus (SRP) was determined by the phosphomolibdic acid-ascorbic method. For Chlorophyll-a (Chl-a) quantification, once in the lab, samples were filtered (not more than 8 h later than sampled) on glass fiber filters (Whatman GF/F) and pigments were extracted with 90% acetone overnight at −20 °C. The Chl-a concentrations were later determined by HPLC as described in [47].

2.3. Measurements of Methane Emissions

Measurements of methane emissions were done bi-monthly during a hydrological cycle (starting in October) from samples taken in fixed stations at each lake. The measurement of methane production rates has several available methods, among which the use of intact cores, as we used, is probably the most accurate [25,48]. The water–air exchange of C as CH4 emission was experimentally measured ex situ from undisturbed sediment cores (50 cm length and 4 cm diameter transparent methacrylate tubes hermetically closed, surface ~10 cm2) collected at each sampling event (Figure 1). In each lake, 12 replicate sediment cores (~20 cm length) were obtained from the regular sampling site from sediments representative of the entire waterbody. The collected cores were sealed by their bottom end with a hermetic plastic cap, filled with ~15 cm of lake water over the sediments, and transported in vertical position to the lab. A headspace of 15 cm length was keep with air in the top of each tube. Once in the lab, tubes were gently shaken (avoiding the sediment losing its structure) to remove CH4 accumulated in sediments until the complete efflux of bubbles occurred removing the previously accumulated methane, thus setting the zero for the measurement of CH4 emission rates. Water contained in the tubes was then purged with CH4-free air until CH4 concentrations in the headspace were below detection levels. Then, tubes were immediately sealed by their upper end with hermetic plastic caps, and incubated outdoors under the natural light and temperature regime. Tubes were partly submerged in a pool to smooth temperature variations as in the natural sites. After 2–7 days of incubation, depending of gas accumulation in each site, CH4 was sampled in the headspace of each tube. Prior to gas sampling for methane rates measurement, cores were shaken to promote methane ebullition, which is known to be important in addition to diffusion processes and can account for more than half of methane release [25]. Thus, our method for the determination of methane production rates includes methane release by both diffusion and ebullition processes. The latter was much better captured by the intact core procedure we used than with short-term in situ incubations using the flow chamber method, where the contribution of ebullition cannot be accurately estimated [48,49]. To accomplish the measurements, an air volume of 60 mL was taken from the headspace of tubes with a syringe equipped with a stopcock and quickly injected into the gas chromatograph. CH4 was measured using a gas chromatograph (Agilent 5890 Series II) equipped with a FID detector. The column and detector temperatures were set at 50 °C and 180 °C, respectively, with helium as the carrier gas at a flow rate of 20 mL min−1. The gas chromatograph was calibrated with gas standards containing 1, 5, 25 and 50 μL CH4 L−1, respectively [50]. Calculations of the fluxes are described in [51]. The calculated areal rates were made from these measurements by considering the core diameter and the incubation period. CH4 emission was assumed constant over a 24 h period for diel estimates, though, in this case, the incubation period lasted for several days and this was not an extrapolation but a real measurement. The measured rates already integrate the possible effects of changes in the day/night cycle.

2.4. Temperature and Salinity Dependence of Methane Emission Rates and Q10

The temperature dependence of CH4 emission rates in each lake was also studied. To do this, cores set as previously referred were held in different climate-controlled rooms at 4, 14, 20, 24 and 30 °C (6 replicates each temperature) and CH4 accumulation in the headspace was measured after a week under 12 h light-dark cycles at the above mentioned temperatures. The manipulation of samples and the analytical measurements of CH4 emissions were made following the same procedure described previously. Temperature coefficients (Q10) for CH4 emission rates for each lake based on the exponential function determined empirically in this study were calculated. The value of Q10 was obtained as follows: F = a × ebT, where F is the flux of methane (mg m−2 h−1), T is the air temperature and a and b (temperature reaction coefficient) are regression coefficients estimated for each lake. The Q10 value was then calculated as: Q10 = e10b [27].
For the salinity-dependence experiments, 30 cores were incubated (between 5 and 7 days) at 5 different salinity levels (6 tubes per level) under a constant temperature of 20 °C. For the hypersaline lakes (Alcahozo, Salicor and Tirez), treatments included: (i) no change in the original salinity (control); (ii) two diluted treatments with salinity dilution (1/2 and 1/10, maintaining nutrient concentrations); and (iii) two treatments with increased salinity (2× and 5×). For Laguna de Manjavacas, the treatments included: (i) a control with the original salinity; (ii) three treatments with salinity dilution (1/2, 1/10 and 1/20, maintaining nutrient concentrations); and (iii) a treatment with increased salinity (3×). Finally, for Laguna Grande de Villafranca, there was also: (i) an unaltered control; (ii) two treatments with salinity dilution (1/2 and 1/10, maintaining nutrient concentrations); and (iii) two treatments with increased salinity (3× and 30×). The salt used to increase the salinity was sodium chloride (reagent grade), as this is the salt accumulated in these lakes with respect to calcium carbonate and magnesium sulfate as salinity increases. The N and P nutrients forms used to maintain nutrient concentrations when salinity was diluted were orthophosphate and NH4Cl.
Temperature and salinity-dependence results were fitted to the best model fitting using a statistical approach (100 iterations, 10−6 of tolerance) using the software Curve ExpertBasic 1.4. Best fitting was obtained with an exponential fit for temperature-dependence (rate = a × ebT, T being temperature) and a negative power fit for salinity (rate = a × Cb, C being conductivity).

2.5. Predicting Changes of Methane Emission Rates under Different RCP Scenarios

Current average temperatures for the area where each lake is located were extracted from raster layers provided by WorldClim [52] at a spatial resolution of 2.5 min (~5 km2). Similarly, updated future average temperatures were extracted for each lake from WorldClim rasters [52] with the same resolution for the years 2050 (average for 2041–2060) and 2070 (average for 2061–2080). For each time period, we considered four scenarios or Representative Concentration Pathways (RCPs): RCP2.6, RCP4.5, RCP6.0 and RCP8.5, following the Fifth Evaluation Report of the IPCC AR5 [35,39]. Each scenario refers to one of the total radiative forcing (RF), i.e., 2.6 W m−2, 4.5 W m−2, 6.0 W m−2 and 8.5 W m−2, respectively. Therefore, we presented a gradient from more (RCP2.6) to less (RCP8.5) ambitious mitigation efforts, with two intermediate scenarios (RCP4.5 and RCP6.0). We averaged the temperature values from eleven climate models (BCC-CSM1-1, CCSM4, GISS-E2-R, HadGEM2-AO, HadGEM2-ES, IPSL-CM5A-LR, MIROC-ESM-CHEM, MIROC-ESM, MIROC5, MRI-CGCM3, and NorESM1-M) for each of the four scenarios and two time frameworks (2050 and 2070). The variation in average monthly temperature was calculated between the average monthly temperatures of each scenario/time period and the average monthly temperatures of the period 1970–2000, also obtained from WorldClim [52].
Calculation of monthly and annual increase in methane emission was done for the 2050 and 2070 time periods according to the referred scenarios (RCP: 2.6, 4.5, 6 and 8.5). Monthly forecasted temperatures obtained for the years 2050 and 2070 in the different scenarios were interpolated in the exponential fits empirically obtained in this study for the temperature-dependent rates of methane emission of in each lake, assuming these rates apply for the whole month, and then again integrated to an annual value of total emission (mg CH4 m−2 year−1). These projected methane emissions at temperatures forecasted for 2050 and 2070 in the different scenarios were compared with the emissions obtained by interpolating current monthly temperatures also obtained from WorldClim [52]. Then, the percentage of increase in the rates was calculated from the difference of total annual emission of methane in the different scenarios compared to the current emissions.
These models were used to calculate the predicted variations in methane emissions of a part of the saline lakes in La Mancha region (central Spain). The largest hypersaline lakes of the region, up to 16, accounting for most of the surface regionally covered by hypersaline lakes (with a total surface of 8.6 km2) were considered, and their current and future methane emissions were estimated

3. Results

3.1. Environmental Features of the Studied Lakes

The studied lakes were shallow (maximum depths ranging 0.2 to 1.06 m during the studied period, Table 1), with three temporary lakes (Alcahozo, Salicor and Tirez) being hypersaline (higher salinity than the sea), one lake being commonly mesosaline (the semipermanent Laguna de Manjavacas), whereas the permanent Laguna Grande de Villafranca was hyposaline. Only those lakes presenting lower salinity (Manjavacas and Grande de Villafranca) presented helophytes covering part of the marginal areas in some zones of the lake basin. Chlorophyll-a, N and P data show that the lakes are mesotrophic, except Lake Manjavacas, which receives treated wastewater inputs and consequently shows a higher trophic status. In this lake, these inputs also extend the flooding period and drop the salinity compared to the natural conditions of these saline lakes. In brief, three of the studied lakes (Alcahozo, Salicor and Tirez) mostly keep natural conditions, whereas two of them, Grande de Villafranca and Manjavacas, present hydrological alterations, the latter also showing anthropogenic eutrophication.

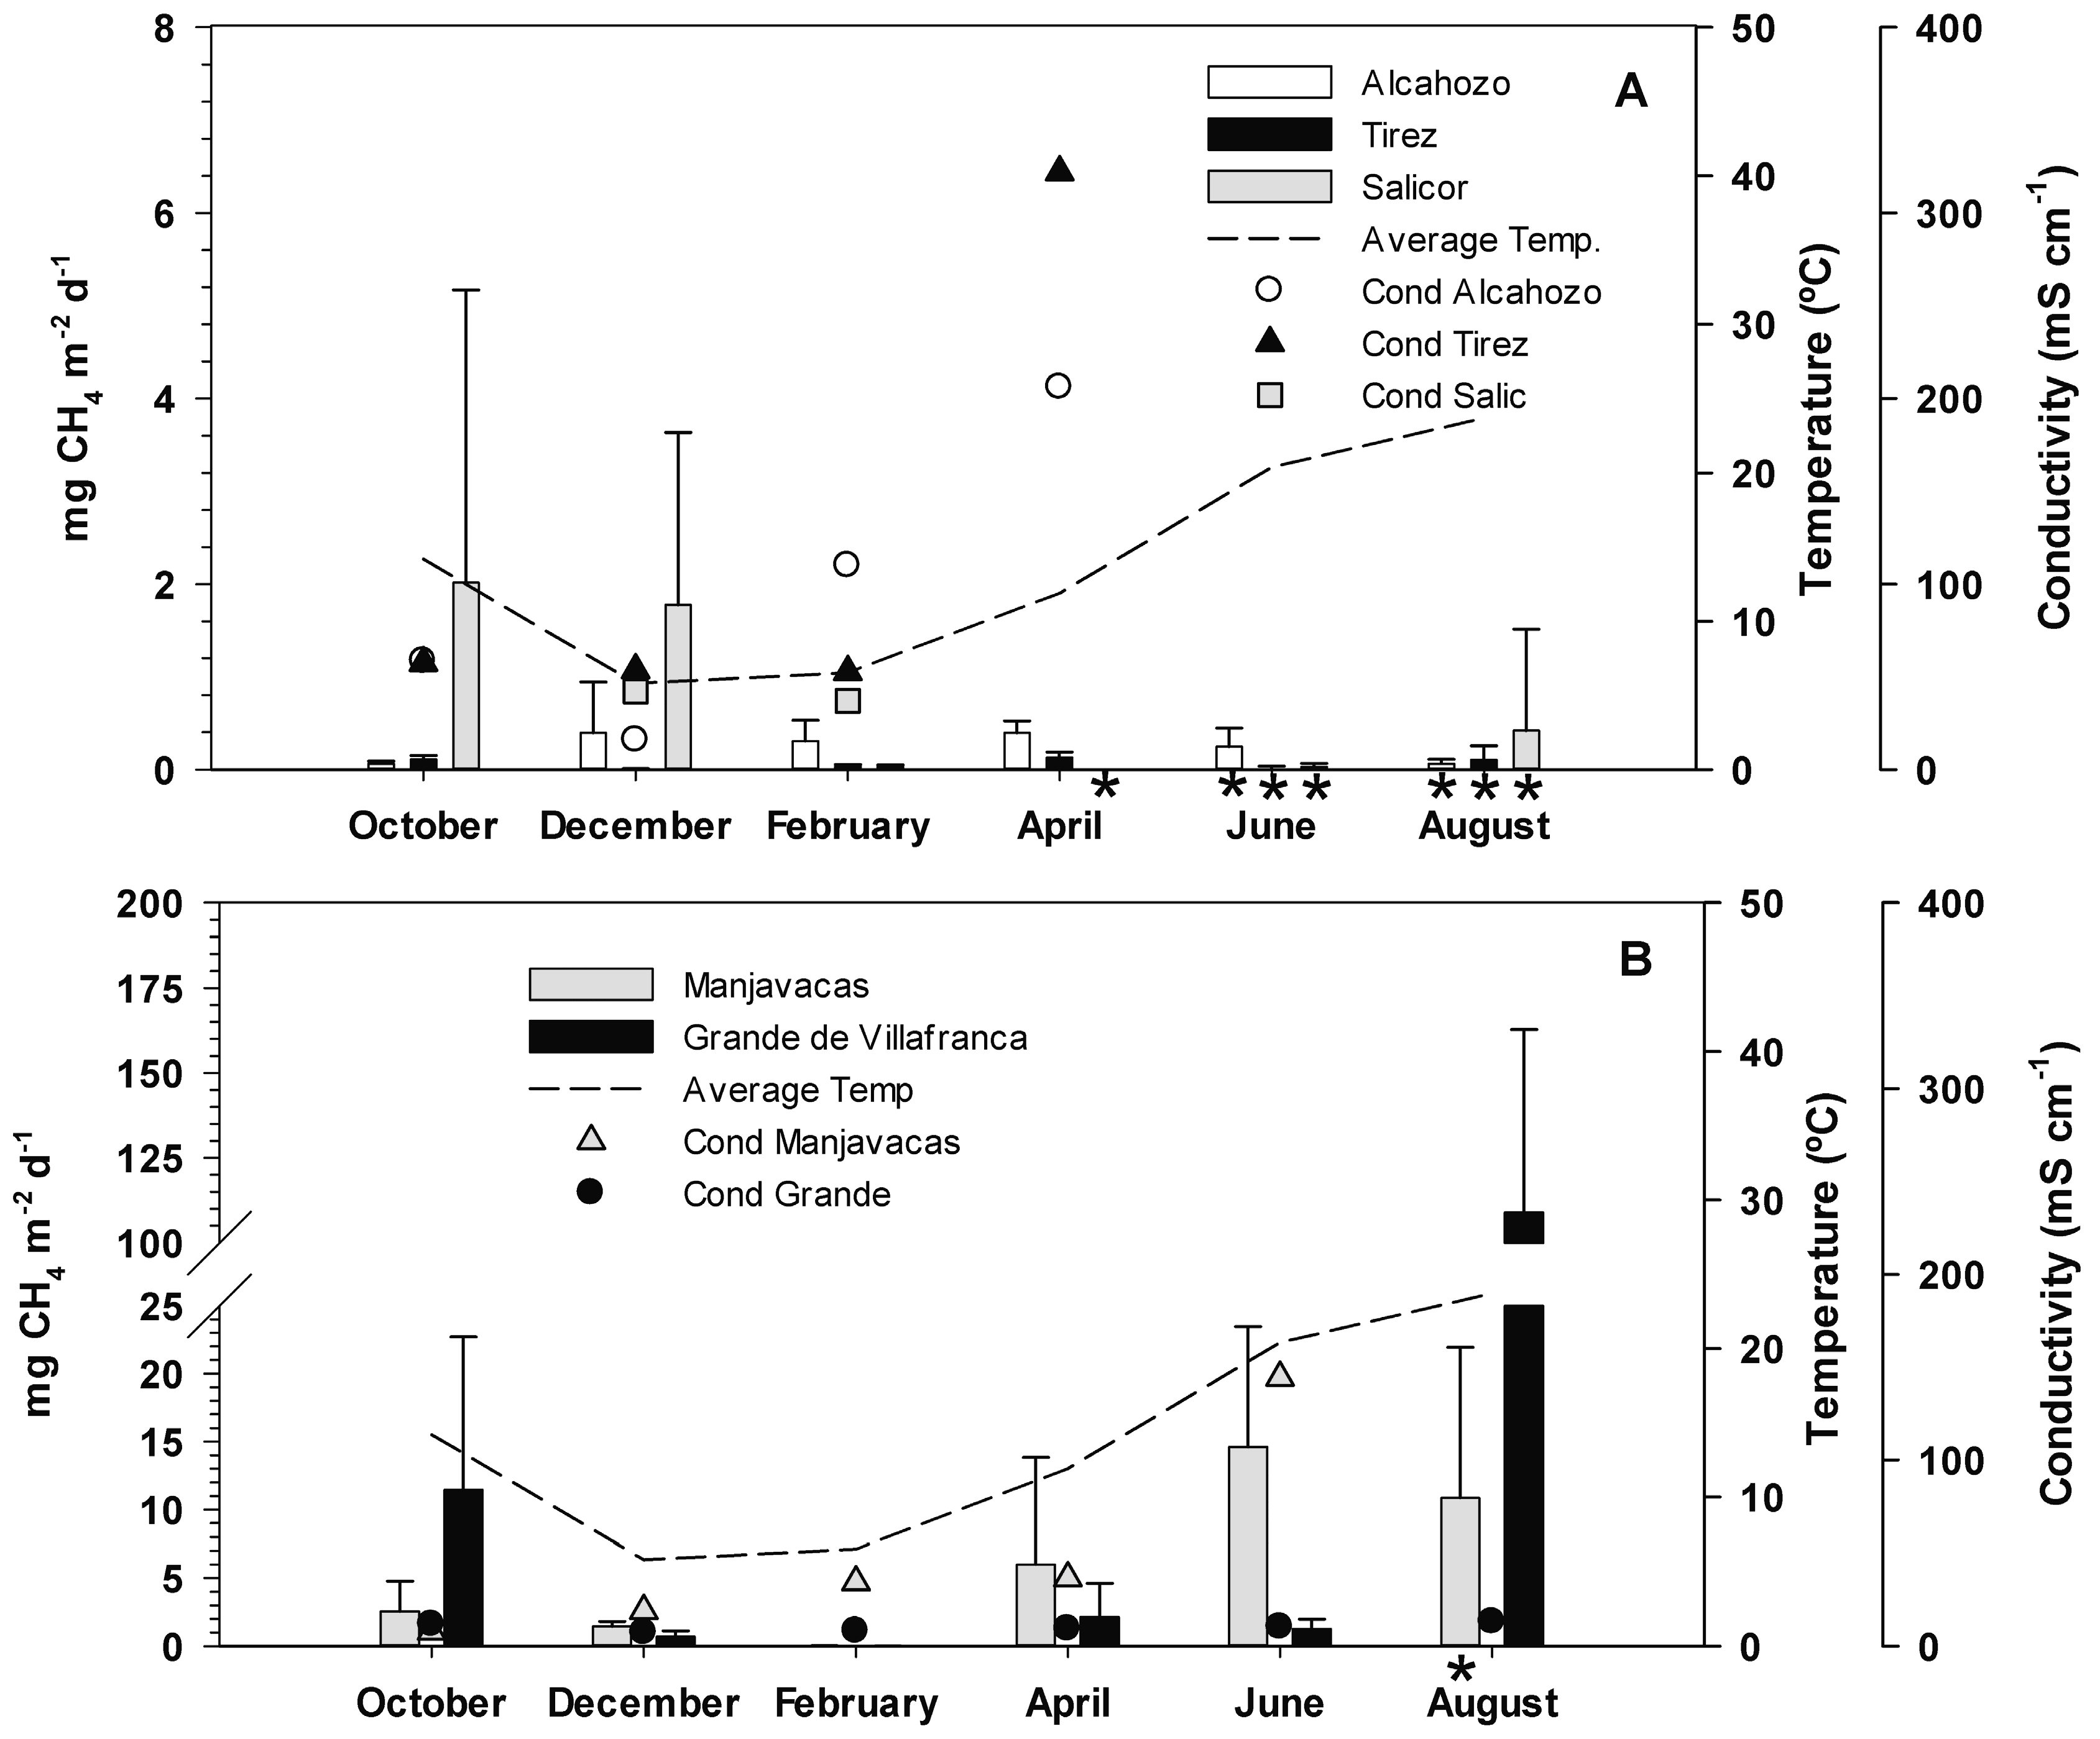
3.2. Methane Emission Rates

The different types of lakes studied showed diverse patterns and levels of methane emissions (Figure 2). The temporary hypersaline lakes (Tirez, Salicor and Alcahozo) were dry during the warmest period of the year (Table 1). When flooded (middle fall to, as much, early spring), they showed the lowest rates of methane emissions among the studied lakes, generally one order of magnitude lower compared to average rates for the less saline lakes (Manjavacas and Grande de Villafranca). These three lakes maintained a certain level of methane release when not flooded, especially when sediment rewetted after occasional rainfall like those occurring in lakes Tirez and Salicor in August (Figure 2A). Methane release rates, however, commonly decreased during the dry period compared to the flooding period, though this was modulated also by temperature. For the temporary lake with the longest flooding period, Laguna de Alcahozo, methane release was sustained at rates around 0.3–0.4 mg CH4 m−2 day−1 for most the flooding period, slowly dropping for the first part of the dry period in June, when sediments still kept wet, and further decreasing when the sediment became dryer. The other two hypersaline lakes showed a similar pattern, though with lower (average around 0.1 mg CH4 m−2 day−1) or higher (maximal values around 2 mg CH4 m−2 day−1) methane release for lakes Tirez and Salicor, respectively. In these two lakes, the effect of temperature on methane release rates was more noticeable, as these rates were higher in August when sediment was rewetted by rainfall even though the lakes were not flooded, than in February, which they experienced the lowest temperatures.
The semipermanent, though hydrologically altered, Laguna de Manjavacas is the lake with higher trophic status as a consequence of treated wastewater (earlier sewage) spills. This lake presented higher rates of methane release (Figure 2B), although with seasonal differences strongly linked to temperature. Maximum rates of 14.6 mg CH4 m−2 day−1 were recorded at the beginning of summer prior to desiccation in August. Even though the lake was not flooded by the second part of summer, sediments maintained humidity, and methane emission rates kept relatively high (around 10.6 mg CH4 m−2 day−1) when sediments were still wet in August. Contrastingly, winter emission rates were quite low, whereas, with similar temperatures, spring rates (near 6.0 mg CH4 m−2 day−1) were higher than fall rates (lower than 1.5 mg CH4 m−2 day−1).
Laguna Grande de Villafranca is indirectly connected to Gigüela River, showing a permanent hydroperiod, and its salinity is much lower than the rest of the studied lakes (Table 1 and Figure 2B). This lake showed the highest rates of methane release among those studied with maximal rates of ca. 110 mg CH4 m−2 day−1) in summer followed by those of early fall, the latter coinciding with the declining of hydrophytes and helophytes that covered part of the lake but with water temperatures much lower than in summer. Methane emission was much lower during the rest of the year, with rates ranging from 2 mg CH4 m−2 h−1 in spring to almost undetectable in winter.

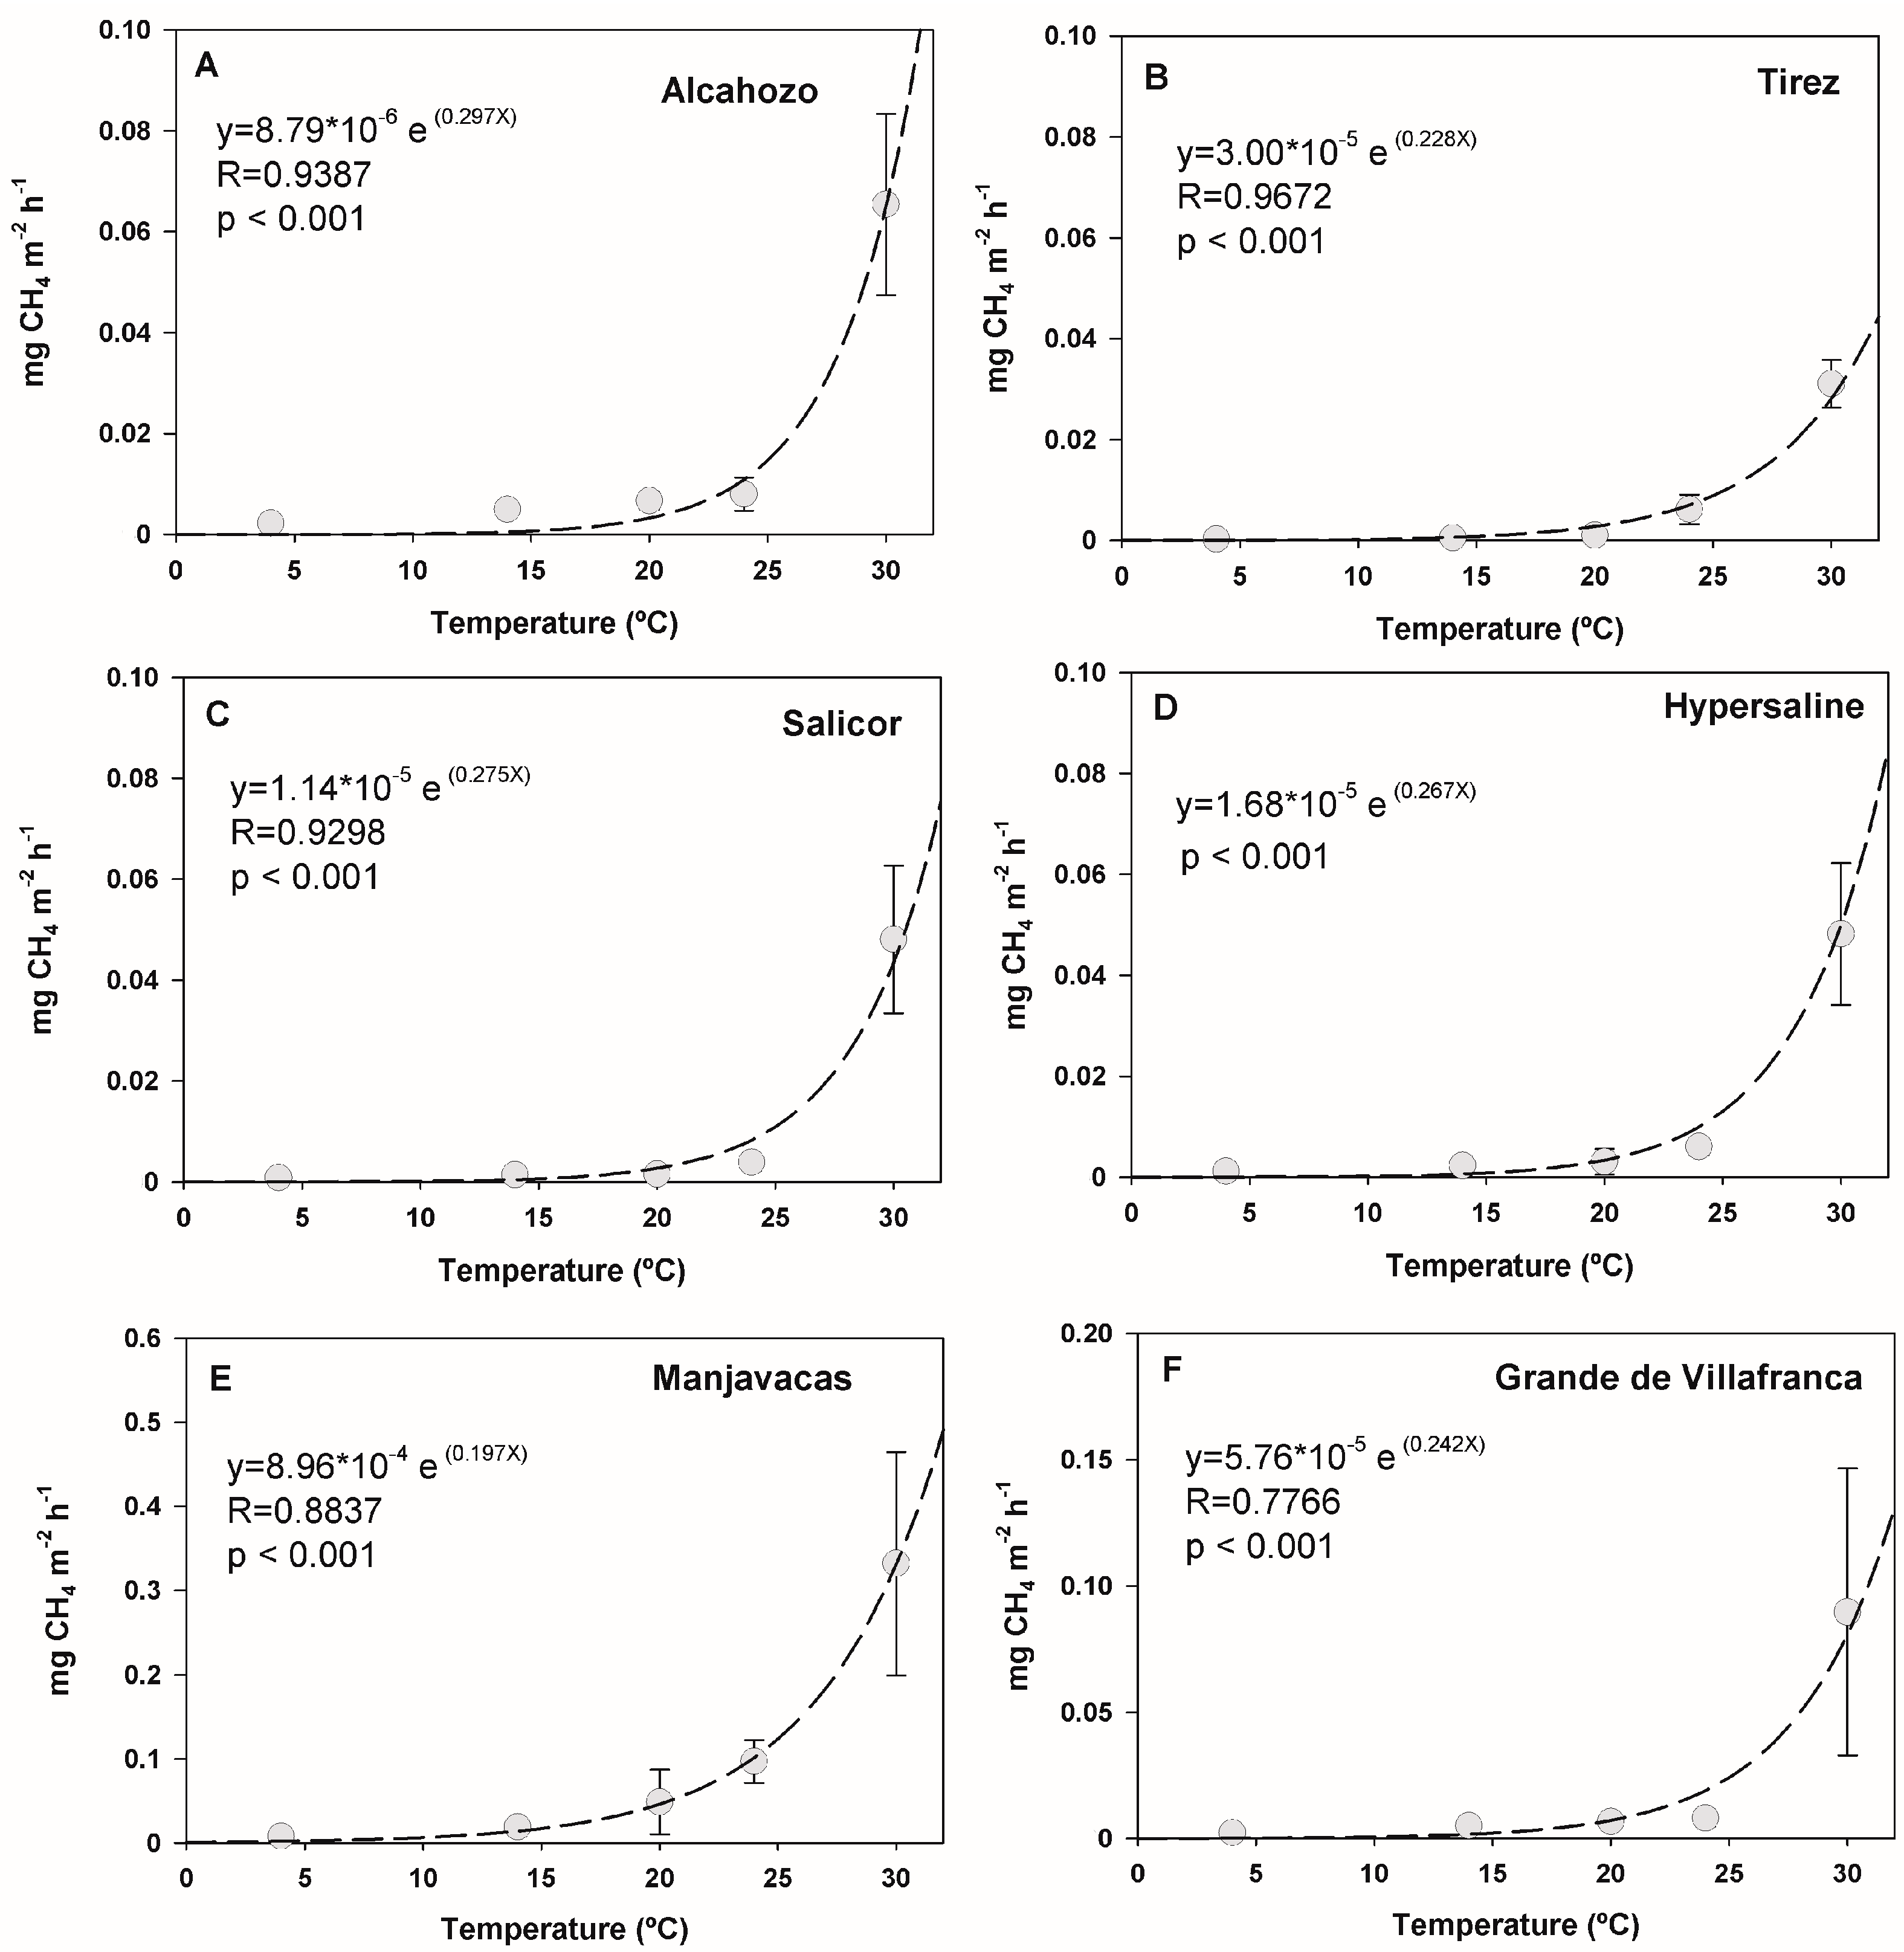
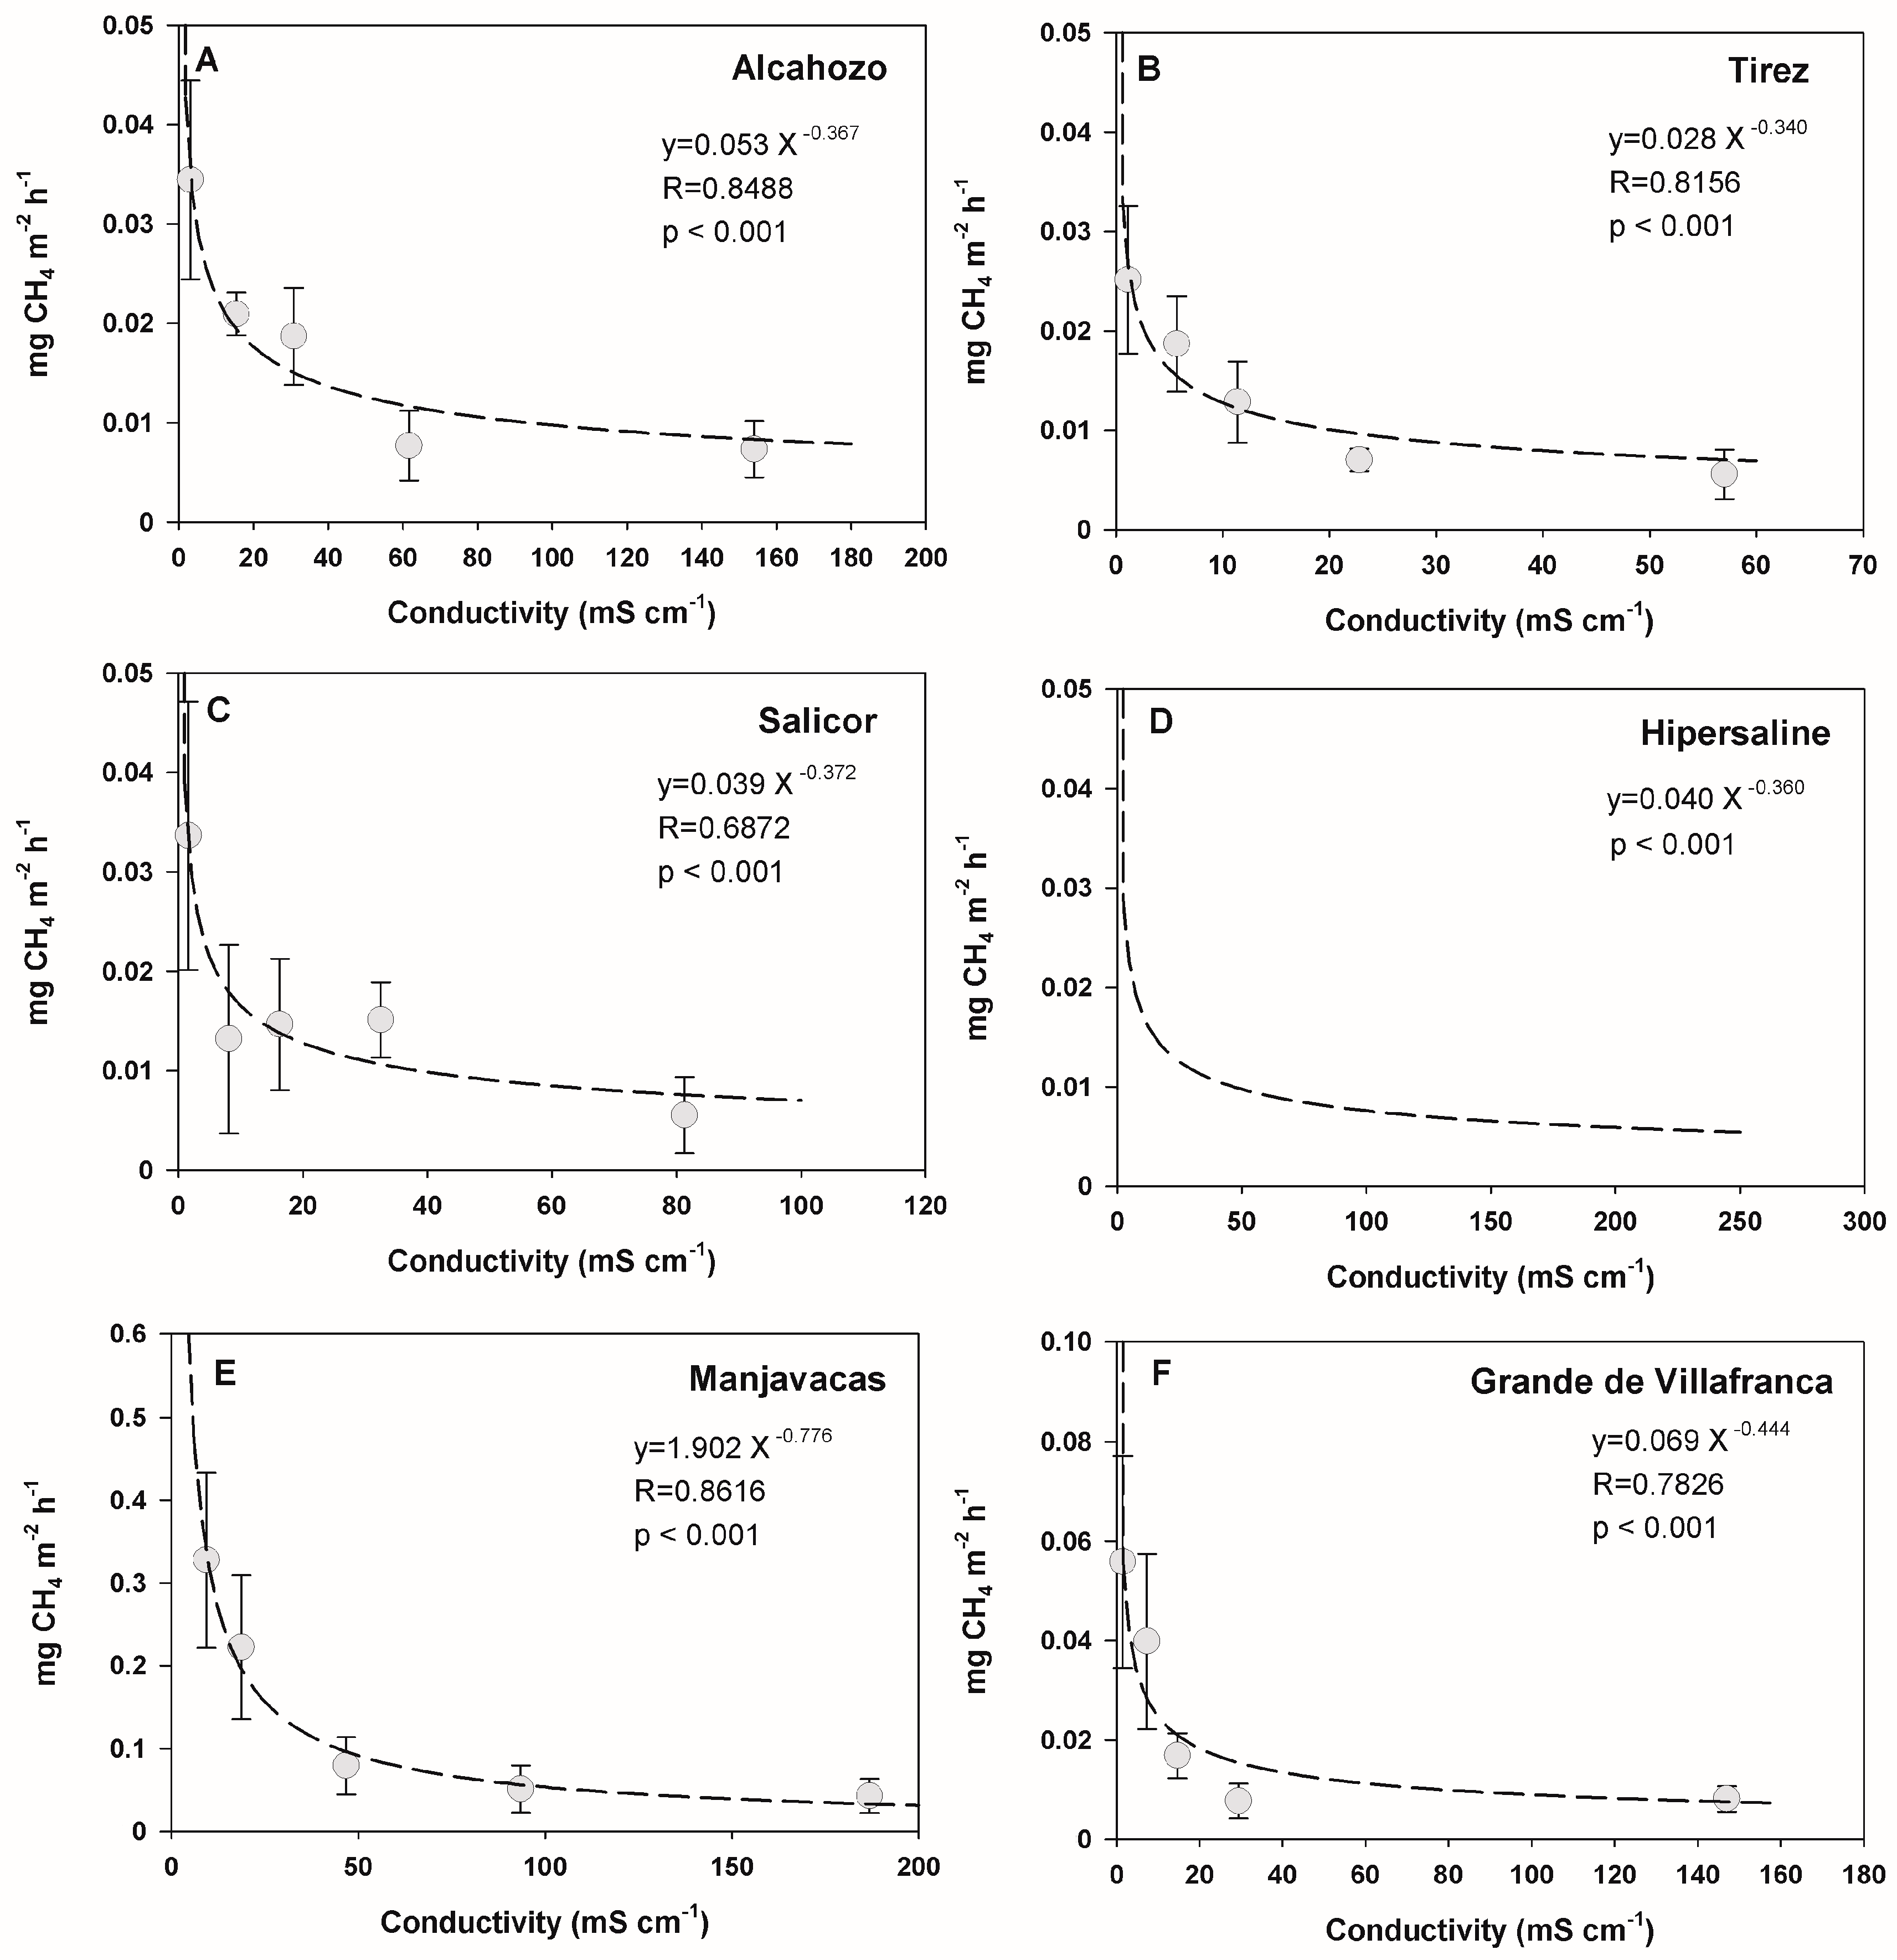
3.3. Effect of Temperature and Salinity on Methane Emission Rates

Apart of the general increasing pattern with temperature, in the studied lakes, methane emissions generally decreased with increased salinity (Figure 2). Thus, we studied the changes in methane emission rates under controlled conditions where both salinity and temperature were separately manipulated to unveil the response to these factors. Under controlled conditions, methane production exponentially increased with temperature in all tested lakes, though with different Q10 and slopes for the different lakes (Figure 3). These results were consistent with the measurements of methane release for each lake, which generally increased within the warmer months of the respective flooding periods (Figure 2). Even though they showed the lowest rates of methane release (Figure 2 and Figure 3A–C), the hypersaline lakes presented the highest slopes (slope of the aggregated fitting 0.267×, Figure 3D) and high Q10 values (Alcahozo, 19.49; Salicor, 15.60; and Tirez, 9.79, which is lower) in the response of these rates to temperature. Contrarily, Laguna de Manjavacas, which showed the highest rates of methane release (Figure 2 and Figure 3E), had the lowest slope (0.197×) and Q10 (7.18), but the highest rates compared to the rest of the studied lakes as the absolute increase was higher. The less eutrophic Laguna Grande de Villafranca showed intermediate slopes (0.242×, Figure 3F) and Q10 value (11.20).
Salinity also affected the methane emission rates of the studied lakes, as suggested by the field data (Figure 2), but this is clearly shown by the concentration/dilution experiments, where temperature differences did not interfere with these rates as they were done under temperature-controlled conditions (Figure 4). All lakes increased these rates following a power function when their waters were diluted. However, salinity increases asymptotically stabilized these rates around the lowest values already measured in the field experiments (Figure 2). Overall, the best fit for the correlation between salinity and methane release rates was a negative power function. Remarkably, Laguna de Manjavacas, which receives wastewater inputs of low salinity, was the lake showing a higher enhancement of their methane release rates when decreasing salinity (power slope = −0.776, Figure 4E), followed by Laguna Grande de Villafranca (power slope = −0.444, Figure 4F). In the hypersaline lakes, however, the increase of methane release rates as salinity was experimentally decreased was less pronounced (average power slope = −0.360, Figure 4D), with the lowest rates reached at salinities commonly observed for the lakes slightly within the hypersaline range (Figure 4A–C, Table 1). Instead, for the less saline Manjavacas and Grande de Villafranca, the usual salinity ranges commonly shown by these lakes (Table 1) correspond to the salinities at which the rates potentially increased in the curve fitting of the charts (Figure 4E,F).

3.4. Predicted Changes of the Methane Emission Rates Due to Temperature Effects under Different Climate Scenarios

As previously demonstrated for the studied lakes, under their current ecological situation, temperature, being affected by climate change, is the main ecological factor with higher influence on methane release rates. Based on the response of these rates to temperature, we elaborated some predictive models on how these rates could change with climate change. These models consider the current length of the flooding period, and consequently predict lower increases for the hypersaline lakes, since these lakes are dry during the warmest period (from June to September, at the least). Detailed results of these simulations for the four climate scenarios (RCP2.6, RCP4.5, RCP6.0 and RCP8.5) and the forecast for 2050 and 2070 are given in Figures S1–S5 (Supplementary Materials) for each of the lakes, and the predicted percentages of increase are summarized in Table 2.
The predicted increases in the methane emission rates for the studied lakes depend on the RCP scenario and temporal framework (2050 and 2070) for which it is modeled. Table 2A shows the percentage of increase for methane release rates predicted by 2050 in the four RCP scenarios for the studied lakes. The highest increases are predicted for the most pessimistic mitigation scenario (RCP8.5), with a forecasted increase compared to current rates ranging from 82% in Laguna de Tirez to 142% in Laguna Grande de Villafranca. The lowest increments come from the scenario with higher reductions in GHG release (RCP2.6), ranging from 43% in Laguna de Tirez to 73% in Laguna Grande de Villafranca. For the intermediate scenarios (RCP4.5 and RCP6.0), models show increases closer to the RCP2.6 scenario than to the RCP8.5.
Predicted increases for 2070 (Table 2B) are much higher for the low mitigation scenario (RCP8.5) compared to 2050, ranging 146% in Laguna de Tirez to 264% in Laguna Grande de Villafranca compared to current rates. However, in the strong mitigation scenario (RCP2.6), there are no significant additional predicted increases compared to 2050, with a forecast ranging from 44% of increase in Laguna de Tirez to 70% in Laguna Grande de Villafranca compared to current rates. As for 2050, the percentage of increased forecasted for intermediate scenarios is closer to the RCP2.6 than to the RCP8.5.
The differences in the monthly variations of the methane emission rates (Table 2) differently apply for the different lakes as they have different hydrological regimes or temperature enhancements (slope of the exponential curve), though the seasonal pattern of predicted increases is similar for both temporal frameworks (2050 and 2070). The percentage of variation differs through the annual cycle, thus lakes displaying a permanent or semipermanent flooding regime, which still maintain flooding during the warmest periods, are predicted to have higher overall increases computed over the year either in relative (Grande de Villafranca) or absolute terms (both Manjavacas and Grande de Villafranca). For the semipermanent or permanent lakes, predicted rates increase by two or three fold in some cases, such as in Laguna Grande de Villafranca, where the forecast for methane emission rates could be as high as 306% in July (by 2070) as a consequence of its permanent flooding remaining during the warmest months. However, among temporary lakes, those having highest slopes of the exponential fitting (Figure 3), such as Laguna de Alcahozo, are also predicted to show a strong increase, with gains of 151% and 286% for the warmest month of the normal flooding period (October) for 2050 and 2070, respectively, under the RCP8.5 scenario.
Using the forecasts based on the models of response of methane release rates to temperature, we performed an extrapolation to the complete set of 16 largest (though medium-size) hypersaline lakes catalogued in La Mancha region, which jointly cover a surface of approximately 8.6 km2 (860 ha). Even though hypersaline lakes show the lowest rates of methane release, overall annual methane emissions of these hypersaline lakes could increase in the region from the current 1.42 tones CH4 per year to 2.22 (RCP2.6) or 2.97 (RCP8.5) tones per year by 2050, and to 2.31 (RCP2.6) or 4.30 (RCP8.5) tones per year by 2070. In any case, all the predictions given in all our modeling only consider the effect of temperature on methane release rates, but factors also supposedly changing as a consequence of climate change, chiefly the salinity and the length of the flooding period, would oppose these changes as having a direct or indirect antagonistic effect with temperature

4. Discussion

The lakes studied here were selected as representative of both natural and altered conditions for southern European saline lakes. Through Europe, the Iberian Peninsula is one of the territories presenting a greater amount of saline lakes and, within Spain, the lake district of “La Mancha Húmeda Biosphere Reserve” is among the most representative and large regions rich in saline lakes [14]. These lakes are naturally temporary, as they are shallow, and commonly develop on very small catchments on endorheic basins, with a marked seasonal water stress during the warmer months [15]. All three hypersaline (sensu [13]) temporary lakes (Alcahozo, Salicor and Tirez) represent lakes showing the natural hydrological (temporary) and trophic (mesotrophic) conditions. However, some of the Iberian saline lakes present hydrological and/or trophic alterations. Laguna Grande de Villafranca is indirectly connected to a freshwater watercourse, thus receiving higher water inputs than those expected for this kind of lakes, which drops its salinity and keeps relative stable water table depth and salinity conditions, turning the lake into a permanent system. Although artificial desiccation and land reclamation for agriculture has traditionally been the main hydromorphological threat to Spanish shallow lakes, Laguna Grande de Villafranca is representative of those artificially receiving freshwater with relatively small nutrient content, which is also the case of some other saline Spanish lakes that currently receive irrigation leftovers. Nevertheless, in some cases, the freshwater inputs correspond to treated wastewater, or even sewage in the past. These have a double impact: first, a drop in salinity linked to an extension of the flooding period; and, second, an increase in the nutrient inputs that promote eutrophication in such Mediterranean shallow lakes [53]. Laguna de Manjavacas is representative of these joint hydrological and trophic alterations [16].
One of the main concerns for the determination of methane emissions in aquatic ecosystems is related to methodological issues, as different methods can offer differential results for the rates of the same environmental processes [48]. The use of medium term incubations by means of the core incubation method provides a more comprehensive view of these processes, as it integrates diffusion and ebullition processes. Ebullition is a physical phenomenon that would likely occur with time allowing the release to the atmosphere of methane bubbles accumulated in the sediments. Our preliminary experiments in which diffusion and ebullition processes were measured independently (data not shown), showed that flow chamber methods, based on short-term incubations, hardly integrated ebullition processes and, when so, methane released by bubbles strongly distorted the measurement. The medium-term core incubation method, with 12 sediment cores incubated per sample in our case, allowed integrating both diffusion and ebullition processes into a more realistic and integrative view of the methane releasing processes. Comparing methane emission rates registered with static flow chambers and with the core method, when ebullition was promoted in the latter by shaking the tubes, overall methane release increased by ca. 30–50% on average when adding ebullition to diffusion, which is in concordance with the literature [25] (though it reached up to 400% in some cases). Thus, to make extrapolations and long-term upscaling to calculate time integrated balances of methane release, the use of sediment cores and longer-termed incubations, as we did, provides more accurate estimations.
Under the current ecological conditions of each of the studied lakes (natural or altered, that is, their current hydroperiod and trophic status), temperature and salinity, both strongly modulated by the length of the flooding period, are main factors in determining the methane emissions of the studied lakes. These factors evolve seasonally [15,23], and consequently the processes they influence behave the same way. The studied temporary lakes, which are hypersaline, showed much lower rates of methane production when compared to semipermanent or permanent saline lakes, the latter with longer flooding periods and lower salinities caused by anthropogenic water inputs. The methane emission rates of the hypersaline lakes studied here are in the lowest range recorded for aquatic systems [54]. Contrastingly, the hydrologically altered lakes present higher methane emission rates but these are still lower than average values for temperate wetlands [19,55], provided they have reduced salinity compared to their natural conditions but still salinity keeps a certain inhibitory capacity on methane production (Figure 4).
Additionally, during the dry periods, which correspond to the warmest season, methane release drops in hypersaline lakes to almost undetectable levels once sediments become dry and a salt crust is formed, unless casual rainfall rewets the sediments and allows transitorily increased rates. Shorter flooding periods characteristic from temporary lakes reduce the time in which the lake is metabolically more active, as the lack of free water with drying strongly reduces the activity of all biological processes [56]. Then, methane production rates are negligible when compared with those of the flooding period. On the other hand, drying additionally allows oxygenation of the sediments and methane production is even more inhibited by the increase in redox potential [57]. Consequently, during these periods, hypersaline lakes do not significantly release methane to the atmosphere. In spite of this, casual summer thunderstorms, commonly affecting small local areas, can wet the sediments, and, when this occurs during the warmest periods, such as the case of Laguna de Salicor in August (Figure 2), methane production processes become temporarily activated. This could be an additional factor to be considered as the frequency and magnitude of precipitation events would likely change, since it could determine, either positively or negatively, the occurrence of these occasional sediment rewettings during the warmest periods. In any case, the negative water balance of warmer months causes that the flooding period of temporary lakes usually overlaps only with the relatively colder periods. Then, the enhancing effect of summer temperatures on the C-cycle activities cannot be significantly observed in ephemeral lakes, which are commonly dry during the warmer months. In the semipermanent lakes like Manjavacas, however, since the progressive drying-up coincides with the temperature rising, carbon related activities, and particularly methanogenesis, are potentiated by increased temperature during this period. Even during the dry period, which was as short as nearby one month, sediments of this lake maintained a certain humidity, and methane production process kept very active. Comparatively, permanent lakes such as Grande de Villafranca, though hyposaline, are more stable with respect to salinity, and the temperature effects enhancing the biological activities related to the C-cycle are very evident during the warmest period. Ephemeral hypersaline lakes, in turn, lack these warm phases that strongly enhance methane release.
On the other hand, longer flooding periods are usually associated to higher water supply, and this, in turn, drives to higher salt dilution, thus to lower salinities [16]. High salt content reduces biodiversity and constrains metabolic rates [13], so that rates of methane production are consequently more limited in hypersaline environments. Methane production decreases at high salinities [28], and this could be specially accentuated in systems such as the hypersaline lakes studied here, where magnesium sulfate is one of the main dissolved salts [15]. Because of their higher energy yield, sulfate reduction is favored over methanogenesis when sulfate availability is high [22], such as in the hypersaline lakes, which also explains the lower methane production rates displayed by the hypersaline lakes compared to those with lower salinity.
Although salinity is a main factor determining methane release rates, the response curves of methane release versus salinity (Figure 4) show that, over a certain level of salinity, which is characteristic of the natural conditions of the studied lakes, further salinity increases do not lead to significant decreases in methane release. Consequently, although an increase of salinity can be inferred from the more arid conditions resulting of climate change [1] affecting the area, the expected salinity increases would not have a significant restricting impact on methane release rates in the hypersaline lakes of La Mancha region. Only hydrological alterations decreasing salinity, such as those currently occurring in lakes Manjavacas and Grande de Villafranca, which are very unlikely to occur under a climate change scenario of higher aridity and lower water availability [29], would enhance methane emissions by saline lakes in the area if occurring.
Temperature, instead, will increase considerably in the region and likely will enhance methane release rates. This would occur regardless the lakes keep the original hypersaline conditions, as the three studied hypersaline lakes, or even if their salinity has drop to lower (hypo- or mesosaline) levels as a consequence of the hydrological alterations. However, since the absolute rates are much higher for the hydrologically altered lakes dropping salinity, the absolute increases in methane emissions rates would be more impacting for the altered than for the well conserved lakes. This is because they show much higher rates as well as because they remain flooded (or with wet sediments) during the warmer months. Given that a suite of environmental factors governs the overall CH4 flux, the Q10 values derived from our measurements used as an index of temperature sensitivity for methanogenesis in our studied lakes should only be considered as a semi-empirical parameter for simulating CH4 emissions [27]. For the studied lakes, we obtained Q10 values for methane release generally over the range (7.18 as the lowest value calculated for Laguna de Manjavacas) usually reported for wetlands [27], which averages 4.1 [25]. However, these Q10 are below the higher values reported for specific types of wetlands, such as oligotrophic peats [28], which may show Q10 values as high as 28. In any case, it is noteworthy that our measurements of methane emissions include ebullition processes, which are not considered in many of the reported studies, giving a more realistic picture of our data on actual methane releasing by the studied lakes and thus Q10 should be higher in our case.
Additionally to the length of the flooding period, salinity, and temperature, other factors, such as the water level, carbon supply, and the presence/productivity of vegetation [56] can modulate the methane emissions. Davidson et al. [7] used long-running shallow-lake mesocosms experiments to demonstrate that nutrient concentrations can override temperature as a control of both the total and individual GHG flux. In our case, the cross-linked effects of nutrients are well shown by the case of Laguna de Manjavacas, where the increased nutrient supply due to wastewater inputs favors primary production, thus increasing carbon fixation, but in turn this primary production and external C-inputs also provide substrates for increasing both aerobic respiration and methanogenesis, likely rising GHG release. However nutrient dynamics can also be different under different climate scenarios [58], and consequently predicting nutrient effects on GHG emission balances is not so easy. On the other hand, the dynamics of aquatic vegetation can also influence both the availability of substrates for (anaerobic) respiration, but also strongly influence methanogenesis by altering redox conditions. This would likely explain why Laguna Grande de Villafranca, with an extensive cover of helophytes that decay in October, showed high rates of methane release in this period, as helophyte’s degradation increase respiration rates thus dropping redox potential, which in turn would favor methanogenesis.
Overall, our predictions show that the effect of temperature increase would enhance methane emission rates of the studied saline lakes, and this can be extrapolated to the rest of saline lakes in the region whose rates could double or more during this century. The predicted increases in salinity as a consequence of climate change would not significantly mitigate these temperature-increased rates, as under natural conditions they would not impact on the effect of salinity on methane production because further salinity increases to current normal values do not significantly decrease methane release (Figure 4). Thus, the only antagonistic factor with the effect of temperature increasing methane release would be the reduction of the flooding period, resulting in reducing the overlap between the flooded and warm periods [59], though these effects would hardly compensate the enhancing effects of temperature on methane production. In any case, the predicted increases would be at the least, slightly lower when the decreasing effects on methane emissions of increasing salinity and reduced flooding periods are modeled.
The Representative Concentration Pathways (RCPs), a set of four new pathways developed for the climate modeling community as a basis for long-term and near-term modeling experiments [35], consider variations of temperature by all radiative forces, not only by CH4 emissions. The RCP6 scenario has a lower radiative force than the RCP4.5 scenario until 2060 [36], and this explains why, for the 2050 and 2070 forecast under the RCP6 scenario our predicted methane emissions are higher than for the RCP4.5 scenario The RCP8.5, which is the high range emission scenario, is plausible if high population development numbers and high fossil/coal use occur, and would cause a positive feedback with warming, since it also accelerates the production of methane. The low range mitigation scenario (RCP2.6), even initially representing increases in methane production of the studied lakes, stabilizes these increases by mid-21st century, and consequently its feedback effect would be much lower.
In any case, methane release is only one of the components of the carbon cycle in the interaction of lakes and wetlands and the atmosphere. The 25-fold greater infrared absorptivity of CH4 relative to CO2 (GWP) over a 100-year time horizon [20] implies that the release of methane strongly contributes to the overall greenhouse effect at short-term, though this GWP is much reduced within longer periods because of the decay of methane in the atmosphere. Thus, although most wetland can act as a net sink of carbon thus reducing the radiative force [8,10], the different greenhouse effect of CO2 and CH4 and also how it changes with time need to be considered when evaluating the role of wetlands on climate change mitigation at different temporal scales. Carbon budgets resulting from the different biological activities related to the carbon cycle (photosynthesis, aerobic respiration and methanogenesis) in terms of carbon are ultimately the key to evaluate the role of wetlands in climate change mitigation.

Supplementary Materials

The following are available online at www.mdpi.com/2073-4441/9/9/659/s1, Figure S1: (left) Monthly variations of methane release; and (right) cumulative methane release during the year, predicted for Lake Alcahozo within the four RCP scenarios and 2050 and 2070 as temporal frame, Figure S2: (left) Monthly variations of methane release; and (right) cumulative methane release during the year, predicted for Lake Tirez within the four RCP scenarios and 2050 and 2070 as temporal frame, Figure S3: (left) Monthly variations of methane release; and (right) cumulative methane release during the year, predicted for Lake Salicor within the four RCP scenarios and 2050 and 2070 as temporal frame, Figure S4: (left) Monthly variations of methane release; and (right) cumulative methane release during the year, predicted for Lake Manjavacas within the four RCP scenarios and 2050 and 2070 as temporal frame, Figure S5: (left) Monthly variations of methane release; and (right) cumulative methane release during the year, predicted for Lake Grande de Villafranca within the four RCP scenarios and 2050 and 2070 as temporal frame.

Acknowledgments

This work has been co-supported by projects CLIMAWET “Mitigation and adaptation to climate change of the main types of Mediterranean Iberian wetlands: carbon budgets and response of species and habitats, CGL2015-69557-R”, as well as by the project ECOLAKE “Ecological patterns in endorheic lakes: the keys to their conservation, CGL2012-38909”, both granted to AC and funded by the Spanish Ministry of Economy and Competitiveness, and by the European Union through the European Fund for Regional Development (FEDER) "One way to make Europe”. Financial support was also obtained by projects CARBONSINK (“Role of the main types of Spanish wetlands for climate change mitigation”), CARBONPRACTIC (“Influence of environmental factors and the conservation status on the capacity for carbon sequestering by Mediterranean wetlands: management practices for climate change adaptation and mitigation”), and CARBONNAT (“Carbon balances and climatic response of some Mediterranean Spanish wetland types within the Natura 2000 Network: Adaptation and mitigation of climate change”), all of them funded by Fundación Biodiversidad (Spanish Ministry of Agriculture, Food and Environment), all of them granted to AC. The Junta de Comunidades de Castilla–La Mancha also supported this work through a contract with Fundación La Caixa. CR is a recipient of the VALi+d postdoctoral contract of Generalitat Valenciana APOSTD/2015/088. JML and DM are recipients of FPU scholarships from the Spanish Ministry of Education. We are very indebted to other colleagues from project ECOLAKE for their help in fieldwork.

Author Contributions

A.C., A.P., C.R. and A.C.S. conceived and designed the experiments; all authors performed the experiments; A.C., A.P. and A.C.S. analyzed the data, and A.C., A.C.S. and A.P. wrote the paper. All authors approved the final version of the manuscript.

Conflicts of Interest

The authors declare no conflict of interest.

References

  1. Intergovernmental Panel on Climate Change (IPCC). Contribution of working group I to the fifth assessment report of the Intergovernmental Panel on Climate Change. In Climate Change 2013: The Physical Science Basis; Stocker, T.F., Qin, D., Plattner, G.K., Tignor, M., Allen, S.K., Boschung, J., Nauels, A., Xia, Y., Bex, B., Midgley, B., Eds.; Cambridge University Press: Cambridge, UK, 2013. [Google Scholar]
  2. Obama, B. The irreversible momentum of clean energy. Science 2017, 355, 126–129. [Google Scholar] [CrossRef] [PubMed]
  3. Cole, J.J.; Prairie, Y.T.; Caraco, N.F.; McDowell, W.H.; Tranvik, L.J.; Striegl, R.G.; Duarte, C.M.; Kortelainen, P.; Downing, J.A.; Middelburg, J.J. Plumbing the global carbon cycle: Integrating inland waters into the terrestrial carbon budget. Ecosystems 2007, 10, 172–185. [Google Scholar] [CrossRef]
  4. Tranvik, L.J.; Downing, J.A.; Cotner, J.B.; Loiselle, S.A.; Striegl, R.G.; Ballatore, T.J.; Dillon, P.; Finlay, K.; Fortino, K.; Knoll, L.B. Lakes and reservoirs as regulators of carbon cycling and climate. Limnol. Oceanogr. 2009, 54, 2298–2314. [Google Scholar] [CrossRef]
  5. Kayranli, B.; Scholz, M.; Mustafa, A.; Hedmark, Å. Carbon storage and fluxes within freshwater wetlands: A critical review. Wetlands 2010, 30, 111–124. [Google Scholar] [CrossRef]
  6. Raymond, P.A.; Hartmann, J.; Lauerwald, R.; Sobek, S.; McDonald, C.; Hoover, M.; Butman, D.; Striegl, R.; Mayorga, E.; Humborg, C. Global carbon dioxide emissions from inland waters. Nature 2013, 503, 355. [Google Scholar] [CrossRef] [PubMed]
  7. Davidson, T.A.; Audet, J.; Svenning, J.C.; Lauridsen, T.L.; Søndergaard, M.; Landkildehus, F.; Larsen, S.E.; Jeppesen, E. Eutrophication effects on greenhouse gas fluxes from shallow-lake mesocosms override those of climate warming. Glob. Chang. Biol. 2015, 21, 4449–4463. [Google Scholar] [CrossRef] [PubMed]
  8. Whiting, G.J.; Chanton, J.P. Greenhouse carbon balance of wetlands: Methane emission versus carbon sequestration. Tellus Ser. B Chem. Phys. Meteorol. 2001, 53, 521–528. [Google Scholar] [CrossRef]
  9. Mitra, S.; Wassmann, R.; Vlek, P.L. An appraisal of global wetland area and its organic carbon stock. Curr. Sci. 2005, 88, 25–35. [Google Scholar]
  10. Mitsch, W.J.; Bernal, B.; Nahlik, A.M.; Mander, Ü.; Zhang, L.; Anderson, C.J.; Jørgensen, S.E.; Brix, H. Wetlands, carbon, and climate change. Landsc. Ecol. 2013, 28, 583–597. [Google Scholar] [CrossRef]
  11. Battin, T.J.; Luyssaert, S.; Kaplan, L.A.; Aufdenkampe, A.K.; Richter, A.; Tranvik, L.J. The boundless carbon cycle. Nat. Geosci. 2009, 2, 598. [Google Scholar] [CrossRef]
  12. Wetzel, R.G. Limnology: Lake and River Ecosystems; Academic Press: Cambridge, MA, USA, 2001. [Google Scholar]
  13. Hammer, U.T. Saline Lake Ecosystems of the World; Springer Science & Business Media: Berlin, Germany, 1986; Volume 59. [Google Scholar]
  14. Florin, M.; Montes, C. Functional analysis and restoration of Mediterranean lagunas in the Mancha Húmeda Biosphere Reserve. Aquat. Conserv. Mar. Freshw. Ecosyst. 1999, 9, 97–109. [Google Scholar] [CrossRef]
  15. Camacho, A.; Miracle, M.R.; Vicente, E. Which factors determine the abundance and distribution of picocyanobacteria in inland waters? A comparison among different types of lakes and ponds. Arch. Hydrobiol. 2003, 157, 321–338. [Google Scholar] [CrossRef]
  16. García-Ferrer, I.; Camacho, A.; Armengol, X.; Miracle, M.R.; Vicente, E. Seasonal and spatial heterogeneity in the water chemistry of two sewage-affected saline shallow lakes from central Spain. Hydrobiologia 2003, 506, 101–110. [Google Scholar] [CrossRef]
  17. Montoya, L.; Vizioli, C.; Rodríguez, N.; Rastoll, M.J.; Amils, R.; Marin, I. Microbial community composition of Tirez lagoon (Spain), a highly sulfated athalassohaline environment. Aquat. Biosyst. 2013, 9, 19. [Google Scholar] [CrossRef] [PubMed]
  18. Castillo-Escrivà, A.; Valls, L.; Rochera, C.; Camacho, A.; Mesquita-Joanes, F. Metacommunity dynamics of Ostracoda in temporary lakes: Overall strong niche effects except at the onset of the flooding period. Limnol. Ecol. Manag. Inland Waters 2017, 62, 104–110. [Google Scholar] [CrossRef]
  19. Ortiz-Llorente, M.; Alvarez-Cobelas, M. Comparison of biogenic methane emissions from unmanaged estuaries, lakes, oceans, rivers and wetlands. Atmos. Environ. 2012, 59, 328–337. [Google Scholar] [CrossRef]
  20. Intergovernmental Panel on Climate Change (IPCC). Contribution of working groups I, II and III to the fourth assessment report of the Intergovernmental Panel on Climate Change. In Climate Change: Synthesis Report; IPCC: Geneva, Switzerland, 2007. [Google Scholar]
  21. Altor, A.E.; Mitsch, W.J. Methane and carbon dioxide dynamics in wetland mesocosms: Effects of hydrology and soils. Ecol. Appl. 2008, 18, 1307–1320. [Google Scholar] [CrossRef] [PubMed]
  22. Atlas, R.M.; Bartha, R. Microbial Ecology: Fundamentals and Applications, 4th ed.; Addison-Wesley Publishing Company: Boston, MA, USA, 1997. [Google Scholar]
  23. Doña, C.; Chang, N.B.; Caselles, V.; Sánchez, J.M.; Pérez-Planells, L.; Bisquert, M.D.M.; García-Santos, V.; Imen, S.; Camacho, A. Monitoring hydrological patterns of temporary lakes using remote sensing and machine learning models: Case study of la Mancha Húmeda Biosphere Reserve in central Spain. Remote Sens. 2016, 8, 618. [Google Scholar] [CrossRef]
  24. Pacheco, F.S.; Roland, F.; Downing, J.A. Eutrophication reverses whole-lake carbon budgets. Inland Waters 2014, 4, 41–48. [Google Scholar] [CrossRef]
  25. Bastviken, D. Methane. In Encyclopedia of Inland Waters; Likens, E., Ed.; Elsevier: Oxford, UK, 2009; Volume 2. [Google Scholar]
  26. Yvon-Durocher, G.; Allen, A.P.; Bastviken, D.; Conrad, R.; Gudasz, C.; St-Pierre, A.; Thanh-Duc, N.; Del Giorgio, P.A. Methane fluxes show consistent temperature dependence across microbial to ecosystem scales. Nature 2014, 507, 488. [Google Scholar] [CrossRef] [PubMed]
  27. Wang, C.; Lai, D.Y.; Tong, C.; Wang, W.; Huang, J.; Zeng, C. Variations in temperature sensitivity (Q10) of ch4 emission from a subtropical estuarine marsh in southeast china. PLoS ONE 2015, 10, e0125227. [Google Scholar] [CrossRef] [PubMed]
  28. Segers, R. Methane production and methane consumption: A review of processes underlying wetland methane fluxes. Biogeochemistry 1998, 41, 23–51. [Google Scholar] [CrossRef]
  29. Jeppesen, E.; Brucet, S.; Naselli-Flores, L.; Papastergiadou, E.; Stefanidis, K.; Noges, T.; Noges, P.; Attayde, J.L.; Zohary, T.; Coppens, J. Ecological impacts of global warming and water abstraction on lakes and reservoirs due to changes in water level and related changes in salinity. Hydrobiologia 2015, 750, 201–227. [Google Scholar] [CrossRef]
  30. Van Vuuren, D.P.; Den Elzen, M.G.; Lucas, P.L.; Eickhout, B.; Strengers, B.J.; Van Ruijven, B.; Wonink, S.; van Houdt, R. Stabilizing greenhouse gas concentrations at low levels: An assessment of reduction strategies and costs. Clim. Chang. 2007, 81, 119–159. [Google Scholar] [CrossRef]
  31. Wise, M.; Calvin, K.; Thomson, A.; Clarke, L.; Bond-Lamberty, B.; Sands, R.; Smith, S.J.; Janetos, A.; Edmonds, J. Implications of limiting CO2 concentrations for land use and energy. Science 2009, 324, 1183–1186. [Google Scholar] [CrossRef] [PubMed]
  32. Moss, R.H.; Edmonds, J.A.; Hibbard, K.A.; Manning, M.R.; Rose, S.K.; Van Vuuren, D.P.; Carter, T.R.; Emori, S.; Kainuma, M.; Kram, T. The next generation of scenarios for climate change research and assessment. Nature 2010, 463, 747. [Google Scholar] [CrossRef] [PubMed]
  33. Meinshausen, M.; Meinshausen, N.; Hare, W.; Raper, S.C.; Frieler, K.; Knutti, R.; Frame, D.J.; Allen, M.R. Greenhouse-gas emission targets for limiting global warming to 2 °C. Nature 2009, 458, 1158–1162. [Google Scholar] [CrossRef] [PubMed]
  34. Van Vuuren, D.; Stehfest, E.; Den Elzen, M.; Deetman, S.; Beltran, A.; Oostenrijk, R. Exploring the possibility to keep global mean temperature change below 2 °C. Clim. Chang. 2011, 109, 95–106. [Google Scholar] [CrossRef]
  35. Van Vuuren, D.P.; Edmonds, J.; Kainuma, M.; Riahi, K.; Thomson, A.; Hibbard, K.; Hurtt, G.C.; Kram, T.; Krey, V.; Lamarque, J.F. The representative concentration pathways: An overview. Clim. Chang. 2011, 109, 5–31. [Google Scholar] [CrossRef]
  36. Masui, T.; Matsumoto, K.; Hijioka, Y.; Kinoshita, T.; Nozawa, T.; Ishiwatari, S.; Kato, E.; Shukla, P.; Yamagata, Y.; Kainuma, M. An emission pathway for stabilization at 6 w m−2 radiative forcing. Clim. Chang. 2011, 109, 59–76. [Google Scholar] [CrossRef]
  37. Thomson, A.M.; Calvin, K.V.; Smith, S.J.; Kyle, G.P.; Volke, A.; Patel, P.; Delgado-Arias, S.; Bond-Lamberty, B.; Wise, M.A.; Clarke, L.E. Rcp 4.5: A pathway for stabilization of radiative forcing by 2100. Clim. Chang. 2011, 109, 77–94. [Google Scholar] [CrossRef]
  38. Meinshausen, M.; Smith, S.J.; Calvin, K.; Daniel, J.S.; Kainuma, M.; Lamarque, J.; Matsumoto, K.; Montzka, S.; Raper, S.; Riahi, K. The RCP greenhouse gas concentrations and their extensions from 1765 to 2300. Clim. Chang. 2011, 109, 213–248. [Google Scholar] [CrossRef]
  39. Pachauri, R.K.; Allen, M.R.; Barros, V.R.; Broome, J.; Cramer, W.; Christ, R.; Church, J.A.; Clarke, L.; Dahe, Q.; Dasgupta, P. Climate Change 2014: Synthesis Report. Contribution of Working Groups I, II and III to the Fifth Assessment Report of the Intergovernmental Panel on Climate Change; IPCC: Geneva, Switzerland, 2014. [Google Scholar]
  40. Riahi, K.; Krey, V.; Rao, S.; Chirkov, V.; Fischer, G.; Kolp, P.; Kindermann, G.; Nakicenovic, N.; Rafai, P. Rcp-8.5: Exploring the consequence of high emission trajectories. Clim. Chang. 2011, 109, 33–57. [Google Scholar] [CrossRef]
  41. Rogelj, J.; Meinshausen, M.; Knutti, R. Global warming under old and new scenarios using IPCC climate sensitivity range estimates. Nat. Clim. Chang. 2012, 2, 8–253. [Google Scholar] [CrossRef]
  42. Castillo-Escrivà, A.; Valls, L.; Rochera, C.; Camacho, A.; Mesquita-Joanes, F. Spatial and environmental analysis of an ostracod metacommunity from endorheic lakes. Aquat. Sci. 2016, 78, 707–716. [Google Scholar] [CrossRef]
  43. Castillo-Escrivà, A.; Valls, L.; Rochera, C.; Camacho, A.; Mesquita-Joanes, F. Disentangling environmental, spatial, and historical effects on ostracod communities in shallow lakes. Hydrobiologia 2017, 787, 61–72. [Google Scholar] [CrossRef]
  44. American Public Health Association; American Water Works Association; Water Environment Federation. Standard Methods for the Examination of Water and Wastewater; American Public Health Association (APHA): Washington, DC, USA, 2005. [Google Scholar]
  45. Ferree, M.A.; Shannon, R.D. Evaluation of a second derivative UV/Visible spectroscopy technique for nitrate and total nitrogen analysis of wastewater samples. Water Res. 2001, 35, 327–332. [Google Scholar] [CrossRef]
  46. Verdouw, H.; Van Echteld, C.; Dekkers, E. Ammonia determination based on indophenol formation with sodium salicylate. Water Res. 1978, 12, 399–402. [Google Scholar] [CrossRef]
  47. Picazo, A.; Rochera, C.; Vicente, E.; Miracle, M.R.; Camacho, A. Spectrophotometric methods for the determination of photosynthetic pigments in stratified lakes: A critical analysis based on comparisons with HPLC determinations in a model lake. Limnetica 2013, 32, 139–158. [Google Scholar]
  48. Bastviken, D.; Ejlertsson, J.; Tranvik, L. Measurement of methane oxidation in lakes: A comparison of methods. Environ. Sci. Technol. 2002, 36, 3354–3361. [Google Scholar] [CrossRef] [PubMed]
  49. Sander, B.O.; Wassmann, R. Common practices for manual greenhouse gas sampling in rice production: A literature study on sampling modalities of the closed chamber method. Greenh. Gas Meas. Manag. 2014, 4, 1–13. [Google Scholar] [CrossRef]
  50. Yuesi, W.; Yinghong, W. Quick measurement of CH4, CO2 and N2O emissions from a short-plant ecosystem. Adv. Atmos. Sci. 2003, 20, 842–844. [Google Scholar] [CrossRef]
  51. Lambert, M.; Fréchette, J.L. Analytical techniques for measuring fluxes of CO2 and CH4 from hydroelectric reservoirs and natural water bodies. In Greenhouse Gas Emissions—Fluxes and Processes: Hydroelectric Reservoirs and Natural Environments; Tremblay, A., Varfalvy, L., Roehm, C., Garneau, M., Eds.; Springer: Berlin, Germany, 2005; pp. 37–60. [Google Scholar]
  52. Hijmans, R.J.; Cameron, S.E.; Parra, J.L.; Jones, P.G.; Jarvis, A. Very high resolution interpolated climate surfaces for global land areas. Int. J. Climatol. 2005, 25, 1965–1978. [Google Scholar] [CrossRef]
  53. Ferriol, C.; Miracle, M.R.; Vicente, E. Effects of nutrient addition, recovery thereafter and the role of macrophytes in nutrient dynamics of a Mediterranean shallow lake: A mesocosm experiment. Mar. Freshw. Res. 2017, 68, 506–518. [Google Scholar] [CrossRef]
  54. Bartlett, K.B.; Harriss, R.C. Review and assessment of methane emissions from wetlands. Chemosphere 1993, 26, 261–320. [Google Scholar] [CrossRef]
  55. Cao, M.; Marshall, S.; Gregson, K. Global carbon exchange and methane emissions from natural wetlands: Application of a process-based model. J. Geophys. Res. Atmos. 1996, 101, 14399–14414. [Google Scholar] [CrossRef]
  56. Kang, H.; Jang, I.; Kim, S. Key processes in CH4 dynamics in wetlands and possible shifts with climate change. In Global Change and the Function and Distribution of Wetlands; Springer: Berlin, Germany, 2012; pp. 99–114. [Google Scholar]
  57. Vasilas, B.L.; Rabenhorst, M.; Fuhrmann, J.; Chirnside, A.; Inamdar, S. Wetland biogeochemistry techniques. In Wetland Techniques; Springer: Berlin, Germany, 2013; pp. 355–442. [Google Scholar]
  58. Jeppesen, E.; Meerhoff, M.; Jacobsen, B.A.; Hansen, R.S.; Søndergaard, M.; Jensen, J.P.; Lauridsen, T.L.; Mazzeo, N.; Branco, C.W.C. Restoration of shallow lakes by nutrient control and biomanipulation—The successful strategy varies with lake size and climate. Hydrobiologia 2007, 581, 269–285. [Google Scholar] [CrossRef]
  59. Bohn, T.; Lettenmaier, D.; Sathulur, K.; Bowling, L.; Podest, E.; McDonald, K.; Friborg, T. Methane emissions from western Siberian wetlands: Heterogeneity and sensitivity to climate change. Environ. Res. Lett. 2007, 2, 045015. [Google Scholar] [CrossRef]
Figure 1. (A) Location of the study area in the Iberian Peninsula; (B) incubation of a static flow chamber in one of the studied lakes; (C) incubation of sediment cores in one of the studied lakes; (D) detail of sediment cores setting for the measurement of methane release rates; (E) Lake Alcahozo; (F) Lake Tirez; (G) Lake Salicor; (H) Lake Manjavacas; and (I) Lake Grande de Villafranca.
Water 09 00659 g001
Figure 2. Methane release rates of the studied lakes during a hydrological cycle (A) Hypersaline lakes (B) Hydrologically altered lakes. Rates are average of 12 replicates. Average temperature at the nearest meteorological station, as well as the water electrical conductivity (as a proxy for salinity) for each lake at each sampling date are given. * indicates that this lake was dry at this sampling event, though the sediments could eventually be wet.
Water 09 00659 g002
Figure 3. Changes in methane release rates vs. temperature in the range 4–30 °C for the studied lakes. Bars represent the standard deviation.
Water 09 00659 g003
Figure 4. Changes in methane release rates vs. salinity (with water electrical conductivity as a proxy) for the studied lakes. Bars represent the standard deviation.
Water 09 00659 g004
Table 1. Location, environmental characteristics and range of main environmental variables in the studied lakes during the sampling period. Water variables correspond to the flooding period. Lakes are sorted from left to right according to their salinity (see Cond–water electrical conductivity).
LakeTírezSalicorAlcahozoManjavacasGrande de Villafranca
UTM coordinates (Datum WGS 84; zone 30S)469.172X484.695X510.761X511.712X470.949X
4.376.321Y4.368.329Y4.360.263Y4.362.992Y4.366.816Y
Geographic coordinates39°32′21.62″ N39°27′57.49″ N39°23′24.72″ N39°24′59.47″ N39°27′4.63″ N
3°21′24.69″ W3°10′25.81″ W2°52′38.61″ W2°51′49.83″ W3°20′13.37″ W
Length of the flooding period (months)6 (October to April)5.5 (October to March)6.5 (October to May)10 (September to July)12 (Permanent)
Maximum Area (ha)92.558.270.0230.4135.6
Helophytes cover (ha)00021.241.0
Maximum depth (cm)30203125106
Water temperature (°C)8.1–19.19.4–12.04.9–15.85.3–27.16.0–27.9
Cond (mS cm−1)52.5–322.137.0–298.215.9–206.07.8–144.47.2–12.9
pH7.6–8.48.3–8.68.0–8.68.4–9.07.6–9.1
O2 (mg L−1)8.3–9.77.7–96.7–11.06.6–12.94.7–10.8
Alkalinity (meq·L−1)3.5–29.74.9–5.62.5–19.25.6–33.72.7–3.9
Soluble reactive Phosphorus (µmol·L−1)0.95–18.900.24–0.870.15–0.460.22–15.910.30–1.72
NO3 (µmol·L−1)8.4–112.165.8–73.225.9–294.387.0–115.124.9–111.6
Ammonium (µmol·L−1)12.7–61.28.0–13.02.2–60.62.3–83.96.2–41.6
Chl-a (µg·L−1)7.1–14.88.1–13.60.3–8.60.8–73.30.2–7.3
Table 2. Percentage of yearly and monthly increase predicted for methane emissions of the studied lakes determined by the predicted changes of temperature within the different IPCC Scenarios [1]: RCP2.6, RCP4.5, RCP6 and RCP8.5 by (A) 2050, and by (B) 2070.
(A)
IPCC (2014)ScenarioLakeYearly ChangeJanuaryFebruaryMarchAprilMayJuneJulyAugustSeptemberOctoberNovemberDecember
RCP2.62050Alcahozo586331216349 817161
RCP4.52050Alcahozo836847338778 1078771
RCP62050Alcahozo725841397863 958466
RCP8.52050Alcahozo120897161113120 15111698
RCP2.62050Tirez434220195339 564435
RCP4.52050Tirez584731296958 735339
RCP62050Tirez513926316347 635338
RCP8.52050Tirez826047478985 1017158
RCP2.62050Salicor56602823 715549
RCP4.52050Salicor75644335 966955
RCP62050Salicor67553539 836653
RCP8.52050Salicor107836460 1349381
RCP2.62050Manjavacas4838191438304454 56484337
RCP4.52050Manjavacas6641292151476575 70625143
RCP62050Manjavacas5336252447385356 60565040
RCP8.52050Manjavacas965343376569101109 94846757
RCP2.62050Grande de Villafranca73452618584262837479664937
RCP4.52050Grande de Villafranca101513929766290114104104856042
RCP62050Grande de Villafranca79423232705170877987745840
RCP8.52050Grande de Villafranca14264564999921411631391361177962
(B)
IPCC (2014)ScenarioLakeYearly ChangeJanuaryFebruaryMarchAprilMayJuneJulyAugustSeptemberOctoberNovemberDecember
RCP2.62070Alcahozo626135275652 927861
RCP4.52070Alcahozo11092615811098 15112092
RCP62070Alcahozo1008963569589 13710487
RCP8.52070Alcahozo228155116123200233 286223166
RCP2.62070Tirez443923234739 634935
RCP4.52070Tirez766041448571 1017553
RCP62070Tirez706042447567 926551
RCP8.52070Tirez1461017589143158 17913898
RCP2.62070Salicor65553228 836249
RCP4.52070Salicor106865555 1349673
RCP62070Salicor95835755 1198371
RCP8.52070Salicor198141101116 249184138
RCP2.62070Manjavacas4737221734324451 54544737
RCP4.52070Manjavacas90543736645790105 92846954
RCP62070Manjavacas8253383456538294 86776051
RCP8.52070Manjavacas169866770107122168196 17614511892
RCP2.62070Grande de Villafranca70422923534260797076745437
RCP4.52070Grande de Villafranca13766494594761271661271361178356
RCP62070Grande de Villafranca12664514583721111441271271067254
RCP8.52070Grande de Villafranca2641099094160176243306260264207153106

