Identification of the Factors Influencing the Baseflow in the Permafrost Region of the Northeastern Qinghai-Tibet Plateau


1
Key Laboratory of Ecohydrology of Inland River Basin, Chinese Academy of Sciences, Lanzhou 730000, China
2
Northwest Institute of Eco-Environment and Resources, Chinese Academy of Sciences, Lanzhou 730000, China
3
State Key Laboratory of Cryospheric Science, CAREERI, Chinese Academy of Sciences, Lanzhou 730000, China
4
Dongzhan Primary School, Lanzhou 730000, China
*
Authors to whom correspondence should be addressed.
Water 2017, 9(9), 666; https://doi.org/10.3390/w9090666
Submission received: 4 August 2017
/
Revised: 1 September 2017
/
Accepted: 1 September 2017
/
Published: 6 September 2017
Abstract
:Baseflow is an essential component of river runoff. Accurate measurements and analyses of baseflow change are challenging in permafrost-covered regions. In this paper, the upper reaches of the Shule River were selected as the study area, in which to study the baseflow change regulation and causes. The variable infiltration capacity (VIC) model, based on the ARNO baseflow formulation, was used to simulate the baseflow. Simulated baseflow was validated by the isotopic baseflow separation results and measured runoff in the recession periods throughout an entire year. It was found that approximately 63.1% of the river runoff was sourced by baseflow in the study region; the baseflow change was relatively smooth throughout the year, and it lagged a few days behind the river runoff. Approximately 80% of the total baseflow was generated in the 3500–4500 m alpine regions, with mainly low-temperature and mid-temperature permafrost. Based on the climate, runoff, land use, soil temperature and moisture data of the permafrost active layer, the mechanism of baseflow change in the permafrost zone was analysed. Precipitation and temperature positively enhanced the baseflow in the permafrost region throughout a year, but the baseflow was more influenced by the temperature than precipitation. In the study area, the cold desert and alpine grassland had the largest regulation capacity for baseflow. Affected by the permafrost freeze-thaw process, a baseflow peak occurred in the spring and the baseflow recession slowed in the autumn. This lead to a more uniform distribution of baseflow and runoff throughout the year.
1. Introduction
Runoff supplies essential water for human beings and ecological systems in arid regions [1]. Baseflow is an important component of river runoff in arid basins. Baseflow can stabilize and effectively recharge river runoff and supply ecological water demands [2], especially in dry seasons. Research on baseflow characteristics is essential for surface water quality and water resource management [3]. Permafrost represents unconsolidated sediment or bedrock that remains frozen for at least two consecutive years [4]. It is widespread in the high latitudes of the Northern Hemisphere [5], but also distributes in high mountain areas where temperatures are low during all seasons [6,7]. The mountain permafrost has an important impact on flow path and runoff response in a high alpine catchment [4]. Many arid rivers in Eurasia originate from alpine mountains, some of which are always covered with a thick layer of permafrost. In these regions, special freeze-thaw processes of the active layer can change the soil infiltration, runoff process and the volume of subsurface water storage [8,9,10].
Baseflow is an essential component of the water resource, and it can be complicated and influenced by the geological conditions, land cover, precipitation, temperature, soil moisture and thermal regime of the area [11,12,13]. Baseflow response of permafrost change in high mountain areas is more complicated. Scientists have proposed many baseflow estimation methods in permafrost regions, but the accuracy of the calculated results are short of evaluation [14,15,16,17]. A number of studies have analyzed the influence of permafrost and permafrost degradation on runoff response. For example, McNamara et al. [18] have studied that the presence of permafrost can reduce subsurface storage; some other researchers have found that the disappearance of permafrost increases runoff [19], and decreases seasonal runoff variability [20].
These studies focused on runoff response of permafrost change; very little is known about baseflow characteristics and the causes of its variation during a year in permafrost regions. Many uncertainties arise when explaining the reasons for baseflow change in permafrost regions. For example, how to verify the accuracy of the calculated baseflow in a permafrost covered region, how the baseflow changes, what the contributions of the baseflow are to the total runoff, how baseflow responds to the freezing and thawing changes of the active layer, how the baseflow responds to climate change, and to what extent does each factor impact the baseflow in the permafrost region. To clearly elucidate these uncertainties, the upper reaches of the Shule River, a permafrost-covered region, was selected as the study area for this paper. The research aims to clearly understand baseflow change patterns during a year and identify the factors influencing the baseflow in permafrost regions, which can provide scientific guidelines for water management and utilization in permafrost-covered river basins.
2. The Study Area
The Shule River is one of the three largest inland rivers in the arid region of China. It originates from the Qilian Mountain and is located in the northeastern Qinghai-Tibet Plateau. The study area for this paper is the upper reaches of the Shule River, and its position is between 96°37′ E–98°59′ E and 38°12′ N–39°50′ N. The average altitude is 3972.4 m above sea level, and the total area is 1.14 × 10⁴ km2 (Figure 1). The average annual air temperature in the region is only −5 °C, and the vertical lapse rate of air temperature is 0.45 °C/100 m. In a year, the warmest month is July (the average temperature is 7.5 °C) and the coldest month is January (the average temperature is −17.5 °C). Annual precipitation in the study area is 100–300 mm, and approximately 90% of it falls from May to September. Many glaciers are distributed in the upper reaches of the Shule River, and nearly 32.8% of the total runoff is recharged by glacier meltwater [21]. Precipitation and meltwater in the study area can supply essential water for agricultural irrigation and ecological water requirement. Annual runoff is 10.83 × 10⁸ m3 (observed at the Changmabu hydrological station), and over 80% of it is produced in the summer portion of the year. Approximately 82.9% of the study area is covered by permafrost (with altitude above 3000 m), and the other area is mainly covered by seasonal frozen soil [22]. The land use types in the study area are mainly cold desert, barren, alpine grassland, alpine meadow and glacier, with some swamp meadow and brushwood.
3. Materials and Methods
There are seven meteorological stations and six rain gauges in the study area (Figure 1). Monthly precipitation data from the rain gauges were used to calculate the precipitation spatial distribution and the vertical lapse rate of precipitation. The daily temperature (maximum value, minimum value, and mean value), wind speed and precipitation from the meteorological station, as well as soil temperature and soil moisture data from the permafrost drilling, were used as model inputs and the baseflow analysis. The runoff data from 1996 to 2009, obtained from the Changmabu hydrological station (Figure 1), was used for the baseflow calculation and the accuracy evaluation of simulated baseflow. The variable infiltration capacity (VIC) model was used to simulate the baseflow change in the study area. The baseflow proportion in the total river runoff, calculated by the isotope separation method [23], was used to calibrate the VIC model and optimize the simulated baseflow modelling. Correlations between baseflow and other factors, such as precipitation, air temperature, and thermal and moisture condition of permafrost active layer, were analysed to research the factors defining the baseflow characteristics in the study area. The spatial distributions of different land cover types in the upper reaches of the Shule River were analysed using the GIS software (Figure 2), and they were applied for researching the impacts of land cover on the baseflow.
3.1. The Model Improvement and Parameter Optimization
The VIC model is a semi-distributed hydrological model, and a number of hydrological elements, such as runoff and baseflow processes, can be effectively simulated. In recent years, it has been improved and applied to cold regions [24,25]. For example, the VIC model has been successfully used for hydrological simulation and evaluation of the land use impact on runoff of the Qilian Mountain [1], where the study area is located. The entire research period was divided into two periods: the calibration period (1996–2002) and the validation period (2003–2009). Some input parameters of the VIC model, such as the vegetation, soil and meteorological elements, were obtained through field measurements in the upstream portion of the Shule River. Some key vegetation and soil parameters were obtained by calibration and sensitivity analyses [1]. Maximum air temperature at which snow can fall, minimum air temperature at which rain can fall and snow albedo are the most important parameters in snow algorithm of the VIC Model and they were set as 1.5 °C, −0.5 °C, and 0.8 respectively. The key soil parameters include b_infilt which defines the shape of the Variable Infiltration Capacity curve, Dsmax which is the maximum baseflow that can occur from the lowest soil layer and depends on hydraulic conductivity, Ds which is the fraction of Dsmax where non-linear (rapidly increasing) baseflow begins, Ws which is the fraction of the maximum soil moisture (of the lowest soil layer) where non-linear baseflow occurs and soil depth. As the VIC model has no automated optimization function, it is difficult to make parameter optimization. The best daily simulation results were obtained by manual adjustment of parameters. Simulated runoff and observed runoff were compared in 1996–2002 (7 years) and 2003–2009 (7 years) respectively to reflect the stability of optimal soil parameters. After the model adjustment, the value of b_infilt, Dsmax, Ds, and Ws was set as 0.4, 8, 0.02 and 0.7 respectively in the research.
Vegetation parameters vary in vegetation types and change with seasons [1]. Main parameters of vegetation including vegetation coverage rate (veg), leaf area index (LAI), vegetation height (hc), root depth (lr), albedo (ALB), rough (ROU), zero-plane displacement (dz) and minimum stomatal resistance (rsmin). Qin et al. [1] detailed, analyzed and obtained the values of these parameters in the same study regions. Based on these parameters, the VIC Model can calculate the canopy interception and transpiration of vegetations in the study area.
Frozen soils can affect hydrological processes, and a frozen soil module is involved in the VIC model. In this study, we used a frozen soil module originally developed by Cherkauer and Lettenmaier [26] that was subsequently improved by Troy [27], to simulated runoff and baseflow. The VIC model assumes that the transport of water in partially frozen soil is controlled by the same process as in unsaturated unfrozen soils [28]. The frozen soil module explicitly simulates soil temperature based on the flux differences in the top and bottom thermal nodes, latent heat of fusion, ice content, and heat capacity of the current thermal node at an hourly time step. When soil temperatures in one node fall below 0 °C, the soil water of that layer begins to freeze. Liquid soil moisture and ice content are updated hourly for each node. At each time step, soil thermal conductivity and soil volumetric heat capacity are also updated based on the changes of moisture content. When simulating soil heat fluxes in the study, the depth of zero-amplitude temperature fluctuation, at which there is no flux exchange, is set to be 20 m below surface according to observations in permafrost drillings; 20 thermal nodes are used to simulate heat fluxes in the soil column. The depths of the nodes are assumed to follow the exponential distributions, small spacing in the top and large spacing in the bottom, and are constant throughout the simulations. Three soil hydrological layers are employed in the model, with the total depth ranging from 2.1 to 2.5 m below surface depending on the permafrost drillings. Liquid soil moisture and ice content of each hydrological layer are interpolated from those of thermal nodes overlapping with the hydrological layers. The so-obtained liquid soil moisture is fully involved in the hydrological processes such as saturated and unsaturated water movement, runoff, and baseflow in each hydrological layer. Soil hydrology was analyzed for the three soil hydrological layers that were largely based on the observation depths. In summary, the depths were 0.04–0.1 m, 0.8–1.0 m, and 2.1–2.5 m for the first, second, and third hydrological layers, respectively.
Daily simulated runoff was compared to the measured value from the Changmabu station to assess the model results. The Nash-Sutcliff coefficient (NS), the coefficient of determination (R2) and the percentage bias (PBIAS) were used to judge the results of the simulation with the improved VIC model. The formulas of the three criteria are as follows:
Qobsi is the observed daily runoff, Qsimi is the simulated daily runoff, n represents time (days), Qobsav is the mean value of the observed runoff in the calibration/validation period, and Qsimave is the mean value of the simulated runoff in the calibration/validation period. According to the evaluation guidelines of accuracy in watershed simulations proposed by Moriasi et al. [29], the calibration/validation performance of the VIC model can be considered acceptable when R2 and NS are greater than 0.5, adequate when NS ranges from 0.54 to 0.65, and very good when NS larger than 0.65. When the absolute value of PBIAS ranges from 15 to 25, the VIC model can be rated as satisfactory; when it ranges from 10 to 15, good; and when it is smaller than 10, very good [29].
3.2. Baseflow Simulation
The baseflow of the study area was calculated by the VIC model, based on the ARNO baseflow formulation [30]:
where during time step , is the baseflow, is the loss of the soil moisture through evapotranspiration, is the percolation loss to the deep water table, is the sum of the precipitation and meltwater, is the surface runoff, is the soil moisture at the end of the time step, and is the soil moisture at the beginning of the time step. The baseflow () calculation should consider all the variables (, , , and ).
3.3. Validation of the Baseflow Simulation
In winter, the air temperature is below 0 °C, and the surface soil is frozen. Additionally, there is little precipitation and meltwater in the study area during this time. Therefore, the values of , , , and in the winter are zero. Almost all of the river runoff in the winter is recharged by the baseflow, which means that the observed winter runoff could be used to validate the results of the simulated baseflow during that period.
In the summer half of the year, the variables (, , , and ) are complex. To validate the simulation results of the baseflow in the summer, we focus on analysing the recession (drainage) part of runoff processes in the study area, since in this period, the runoff is approximately equal to the baseflow. In the recession part (baseflow part) of the hydrograph, P, R and I are zero. In summer, the water table of active layer is moving downward with the permafrost thawing, and the depth of active layer is larger. The evapotranspiration mainly consume surface water and shallow soil water. Large proportion of soil water is concentrated in lower part of layer active, which is a main source of baseflow, and evapotranspiration consumption there is little. In addition, the soil under the active layer is frozen. So we assume that the evapotranspiration is negligible for the lower part of layer active and that there is no deep percolation. Under these assumptions, Equation (4) reduces to
Under these conditions, the ARNO model formulation for is [27]:
where is a fraction between 0 and 1, is the maximum baseflow, is the moisture content threshold, and is the maximum soil moisture content. Therefore, there were four parameters to identify, and they were calculated in the study based on the optimal parameter estimation methods proposed by Abdulla et al. [30]. , , , and have values of 0.62, 243.00, 8.40, and 96.50, respectively. According to the methods above, the simulated baseflow results were validated.
4. Results
4.1. Simulation Effect of the Modified VIC Model
Figure 3 shows the comparison between the simulated daily runoff and the measured values in the calibration period (1996–2002) and validation period (2003–2009) for the study area. The simulated and measured runoff processes are very similar. To further assess the simulation effect, the values of R2, NS and PBIAS were calculated in the summer and winter halves of each year (Table 1). In the winter half of the year, the values of R2 and NS are both larger than 0.54, and the PBIAS is smaller than 15 in the calibration period; in the validation period, the R2 and NS are both larger than 0.65, and the PBIAS is smaller than 10. That means the VIC model is rated as satisfactory for the winter half of the year [29]. For the summer half of the year and the entire year, the R2 and NS are all significantly larger than 0.65, and the PBIASs are smaller than 10 in all calibration and validation periods. Therefore, the optimal VIC model could be used for further analysis in the research [29].
4.2. Baseflow Processes in the Study Area
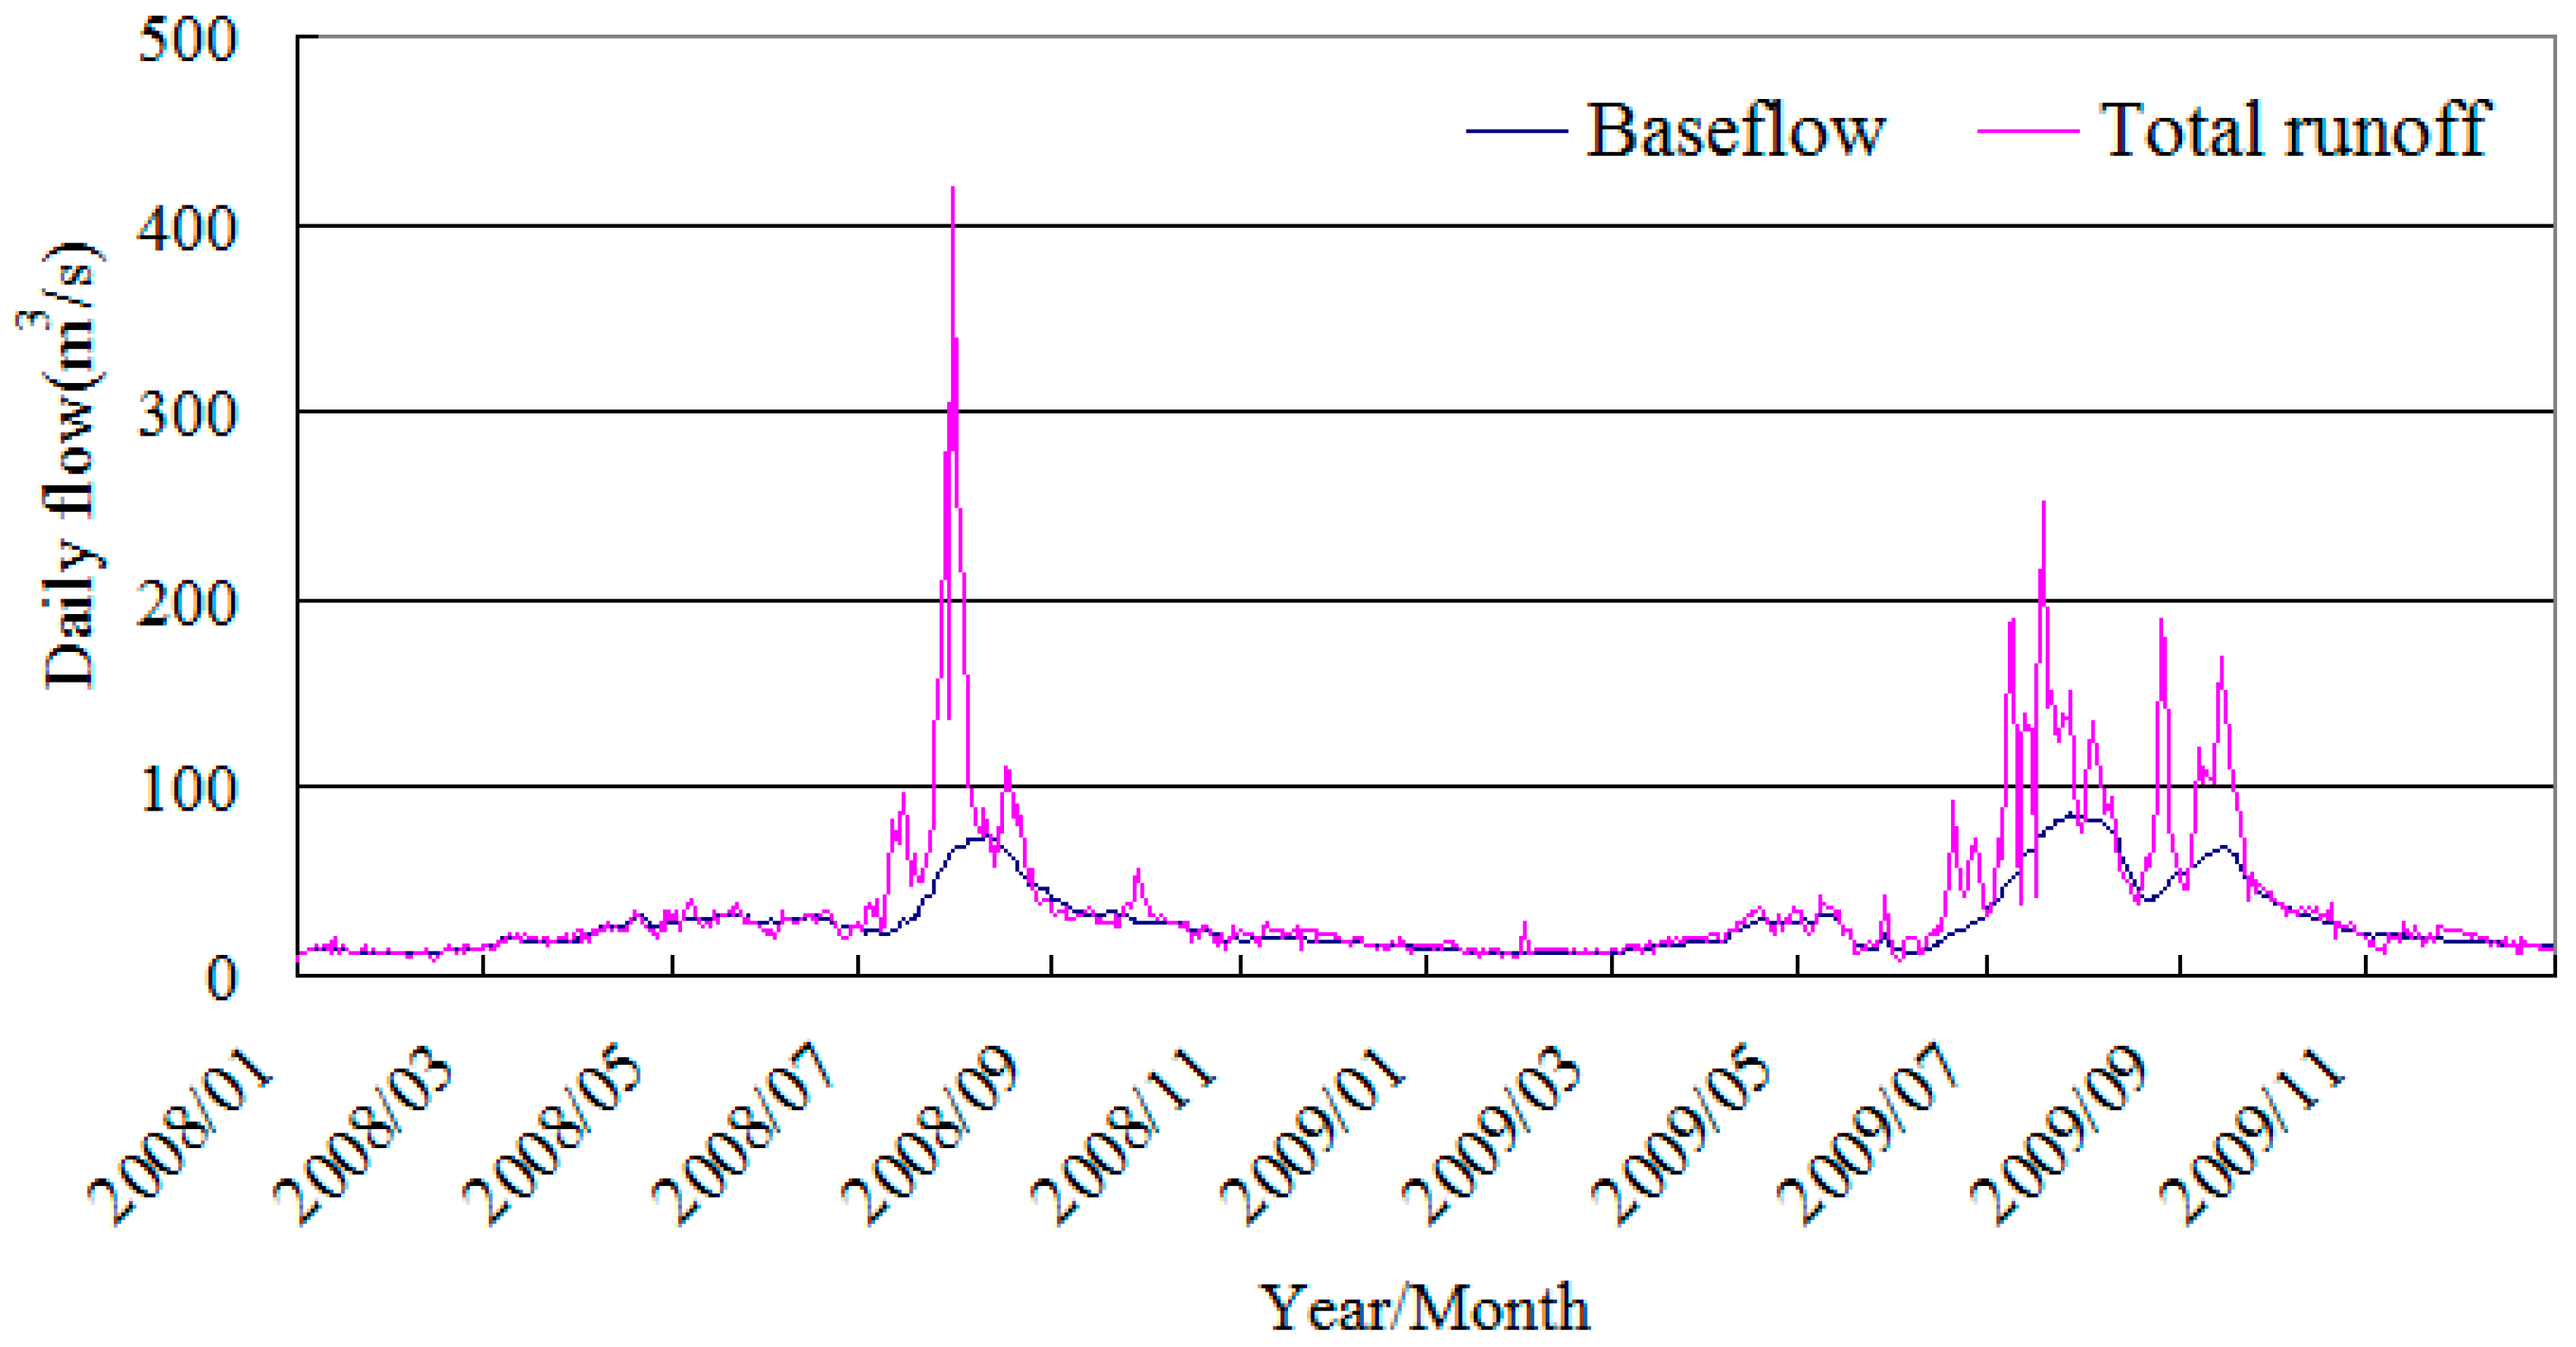
Figure 4 shows the daily simulated baseflow of the study area during 2008–2009, using the validated VIC model. To assess the simulation effect, comparative analyses were performed and are shown in Figure 5 and Figure 6. Figure 5 shows the simulated baseflow and observed runoff in the winter. In the upper reaches of the Shule River, there is little winter precipitation, and precipitation always falls as snow. Since the temperature here is extremely low, the glaciers and snow are not likely to melt and source the river runoff in the winter. Therefore, the winter runoff in the study area is mostly supplied by the baseflow. In Figure 5, the baseflow simulated by the calibrated VIC is approximately equal to the river runoff, with a high fitting degree. The simulated results could reflect the actual winter baseflow processes.
In the summer half of the year, seven recession sequences of the hydrograph (from 2008 to 2009) were chosen to validate the results of the baseflow simulation. Those recession sequences were identified using the criterion of Vogel and Kroll [31], and a sequence begins when the 10 day moving average begins to decrease and ends when a 10 day moving average begins to increase. During the recession sequences, almost all daily streamflow was recharged by baseflow [30]. The predicted and observed baseflow in the recession periods are shown in Figure 6. R2, NS and PBIAS are 0.96, 0.95 and 2.32, respectively. It can be concluded that the simulated baseflow in the summer half of the year is reasonable. In 2009, approximately 61.0% (±4.2%) of the total river runoff in the summer half of the year was recharged by the baseflow. This proportion is very close to the result (66.7% ± 6.8%) calculated by the isotope runoff separation method [23]. According to the analysis above, the baseflow simulated by the improved VIC model is believable and can be effectively used in the research.
4.3. The Temporal and Spatial Variations of the Baseflow
As shown in Figure 4, baseflow varies little in the winter half of the year, but in the summer half of the year, it has large fluctuations, and its changing processes are similar to the total runoff (Figure 4). Baseflow processes lag a few days behind the river runoff in the summer half of the year (Figure 4). Based on the simulated baseflow and measured runoff, the proportions of baseflow to total runoff were slowly increasing from 1996 to 2009, with the values ranging from 54.2 to 69.3% (63.1% on average).
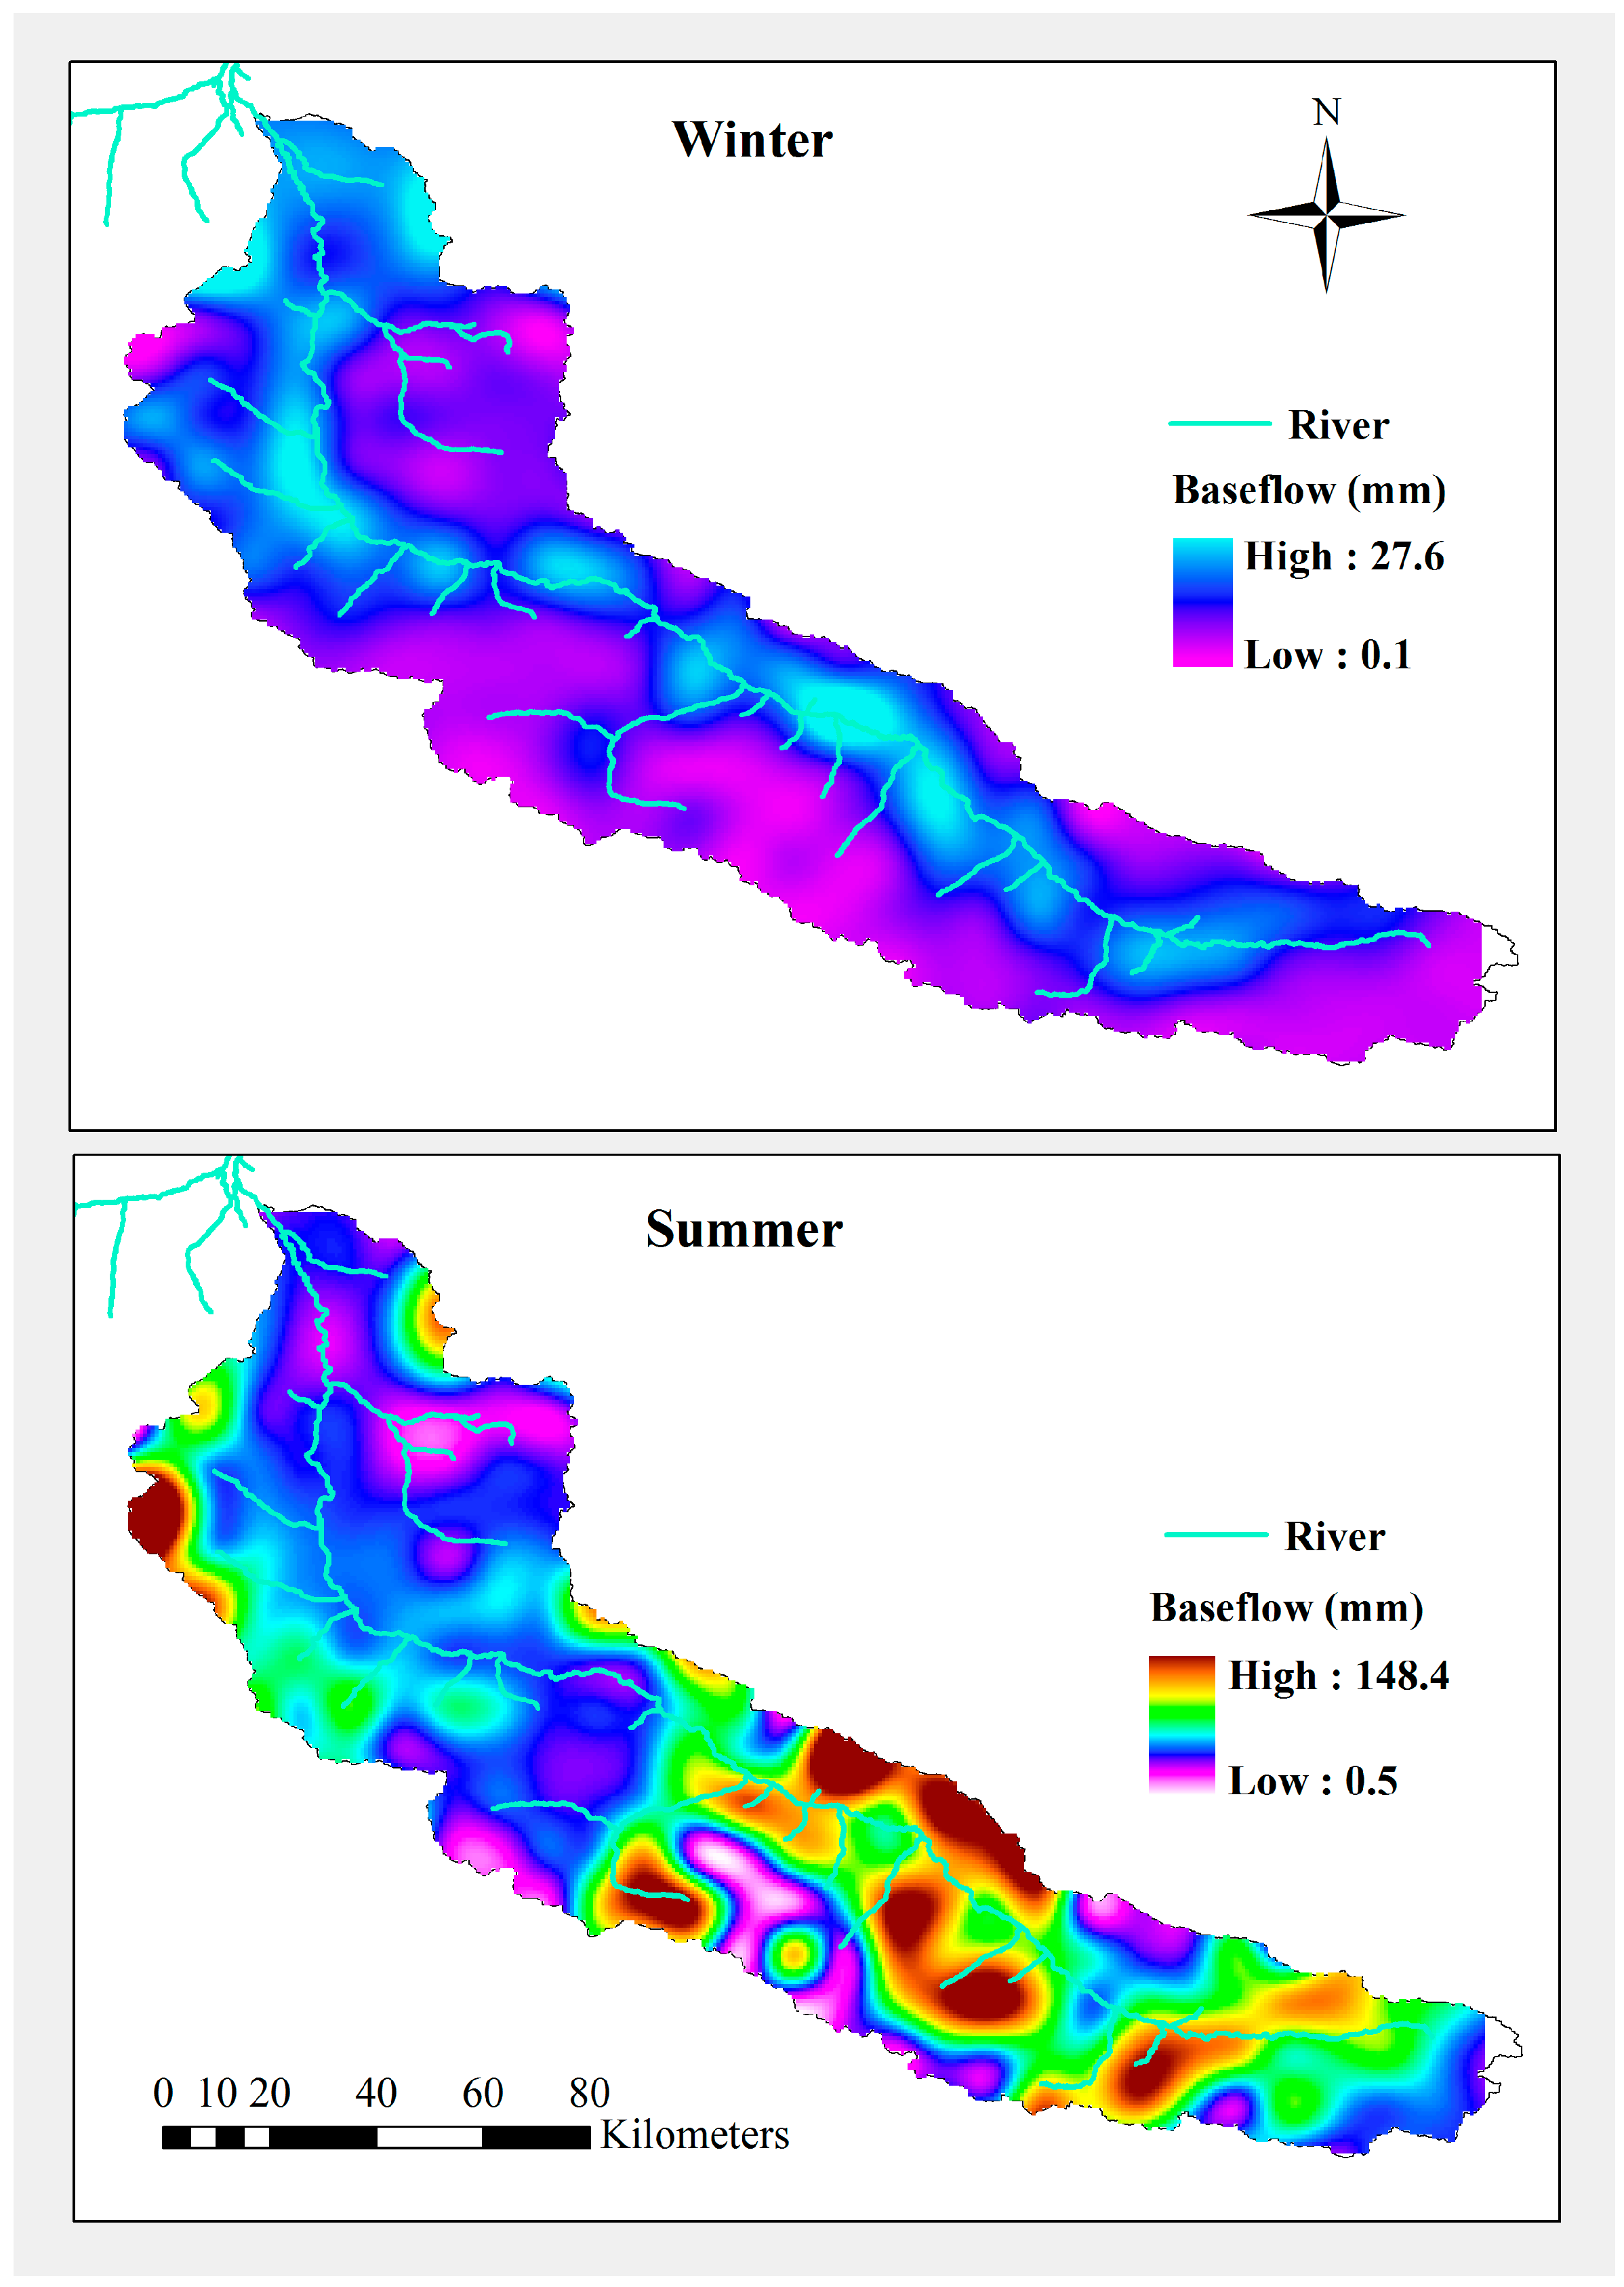
Figure 7 shows the spatial distributions of baseflow in the study area. It can be observed that baseflow distribution in the summer half of the year significantly varied with that in the winter half of the year, and most annual baseflow is generated in the summer half of the year (Figure 7). Compared with Figure 1, a large summer baseflow is formed in the permafrost regions with higher elevations, but the winter baseflow is mainly formed in shallow mountains and the regions near river channels (Figure 7). In the summer half year, baseflow in the shallow mountainous areas is much less (mostly less than 20 mm) than that in the alpine regions. Baseflow volume gradually increased with the elevation, from the river bottom to the high mountains at 4500 m. Little precipitation falls in the low altitude area and it is hard to form baseflow there. In regions with elevations above 4500 m, baseflow is very small, because these regions are mainly covered by bare rocks with little soil or humus to hold water. On the contrary, in the winter half of the year, baseflow is concentrated in regions covered by seasonal frozen soil and unfrozen soil. During winter, the subsurface at high altitudes (above 3000 m) is completely frozen, and it cannot produce baseflow. Groundwater under permafrost regions in high altitude flows out in the shallow mountains and effectively recharges baseflow in winter. Overall, most baseflow in the study area is formed in the summer half of the year, and it is mostly generated in permafrost regions with elevations ranging from 3500 m to 4500 m, which have approximately 78.1% of the total baseflow of the study area, on average (Figure 7 and Figure 8).
4.4. The Impacts of the Different Factors on the Baseflow
4.4.1. The Impacts of Climate Change on the Baseflow
The correlations of the climate factors (precipitation and temperature) with the baseflow were analysed. There exists a positive relationship between the precipitation and baseflow in the study area, using a three-year moving average, with the correlation coefficient of 0.774. The baseflow significantly correlates with the precipitation (p < 0.01) (Figure 9). Precipitation can effectively increase the baseflow in the upper reaches of the Shule River. More precipitation means larger baseflow, to some extent. Similarly, the relationship between the baseflow and temperature during 1996–2009 were analysed. This analysis found that the correlation of the annual temperature and baseflow is also significant (p < 0.05). Air temperature has an important impact on the glacier and permafrost ice melting. As temperature rises, more ice in the active layer of the permafrost regions will melt, and this will effectively recharge the baseflow. In addition, glacier and snow in the alpine regions will accelerate melting and increase the water infiltration to the soil, which can also increase the baseflow. According to Figure 9, the temperature-baseflow correlation coefficient is smaller than that of precipitation-baseflow. Annual baseflow is more influenced by precipitation than temperature in the study area. They are two positive factors for baseflow changes, and their increase can effectively promote baseflow and runoff generation in permafrost regions.
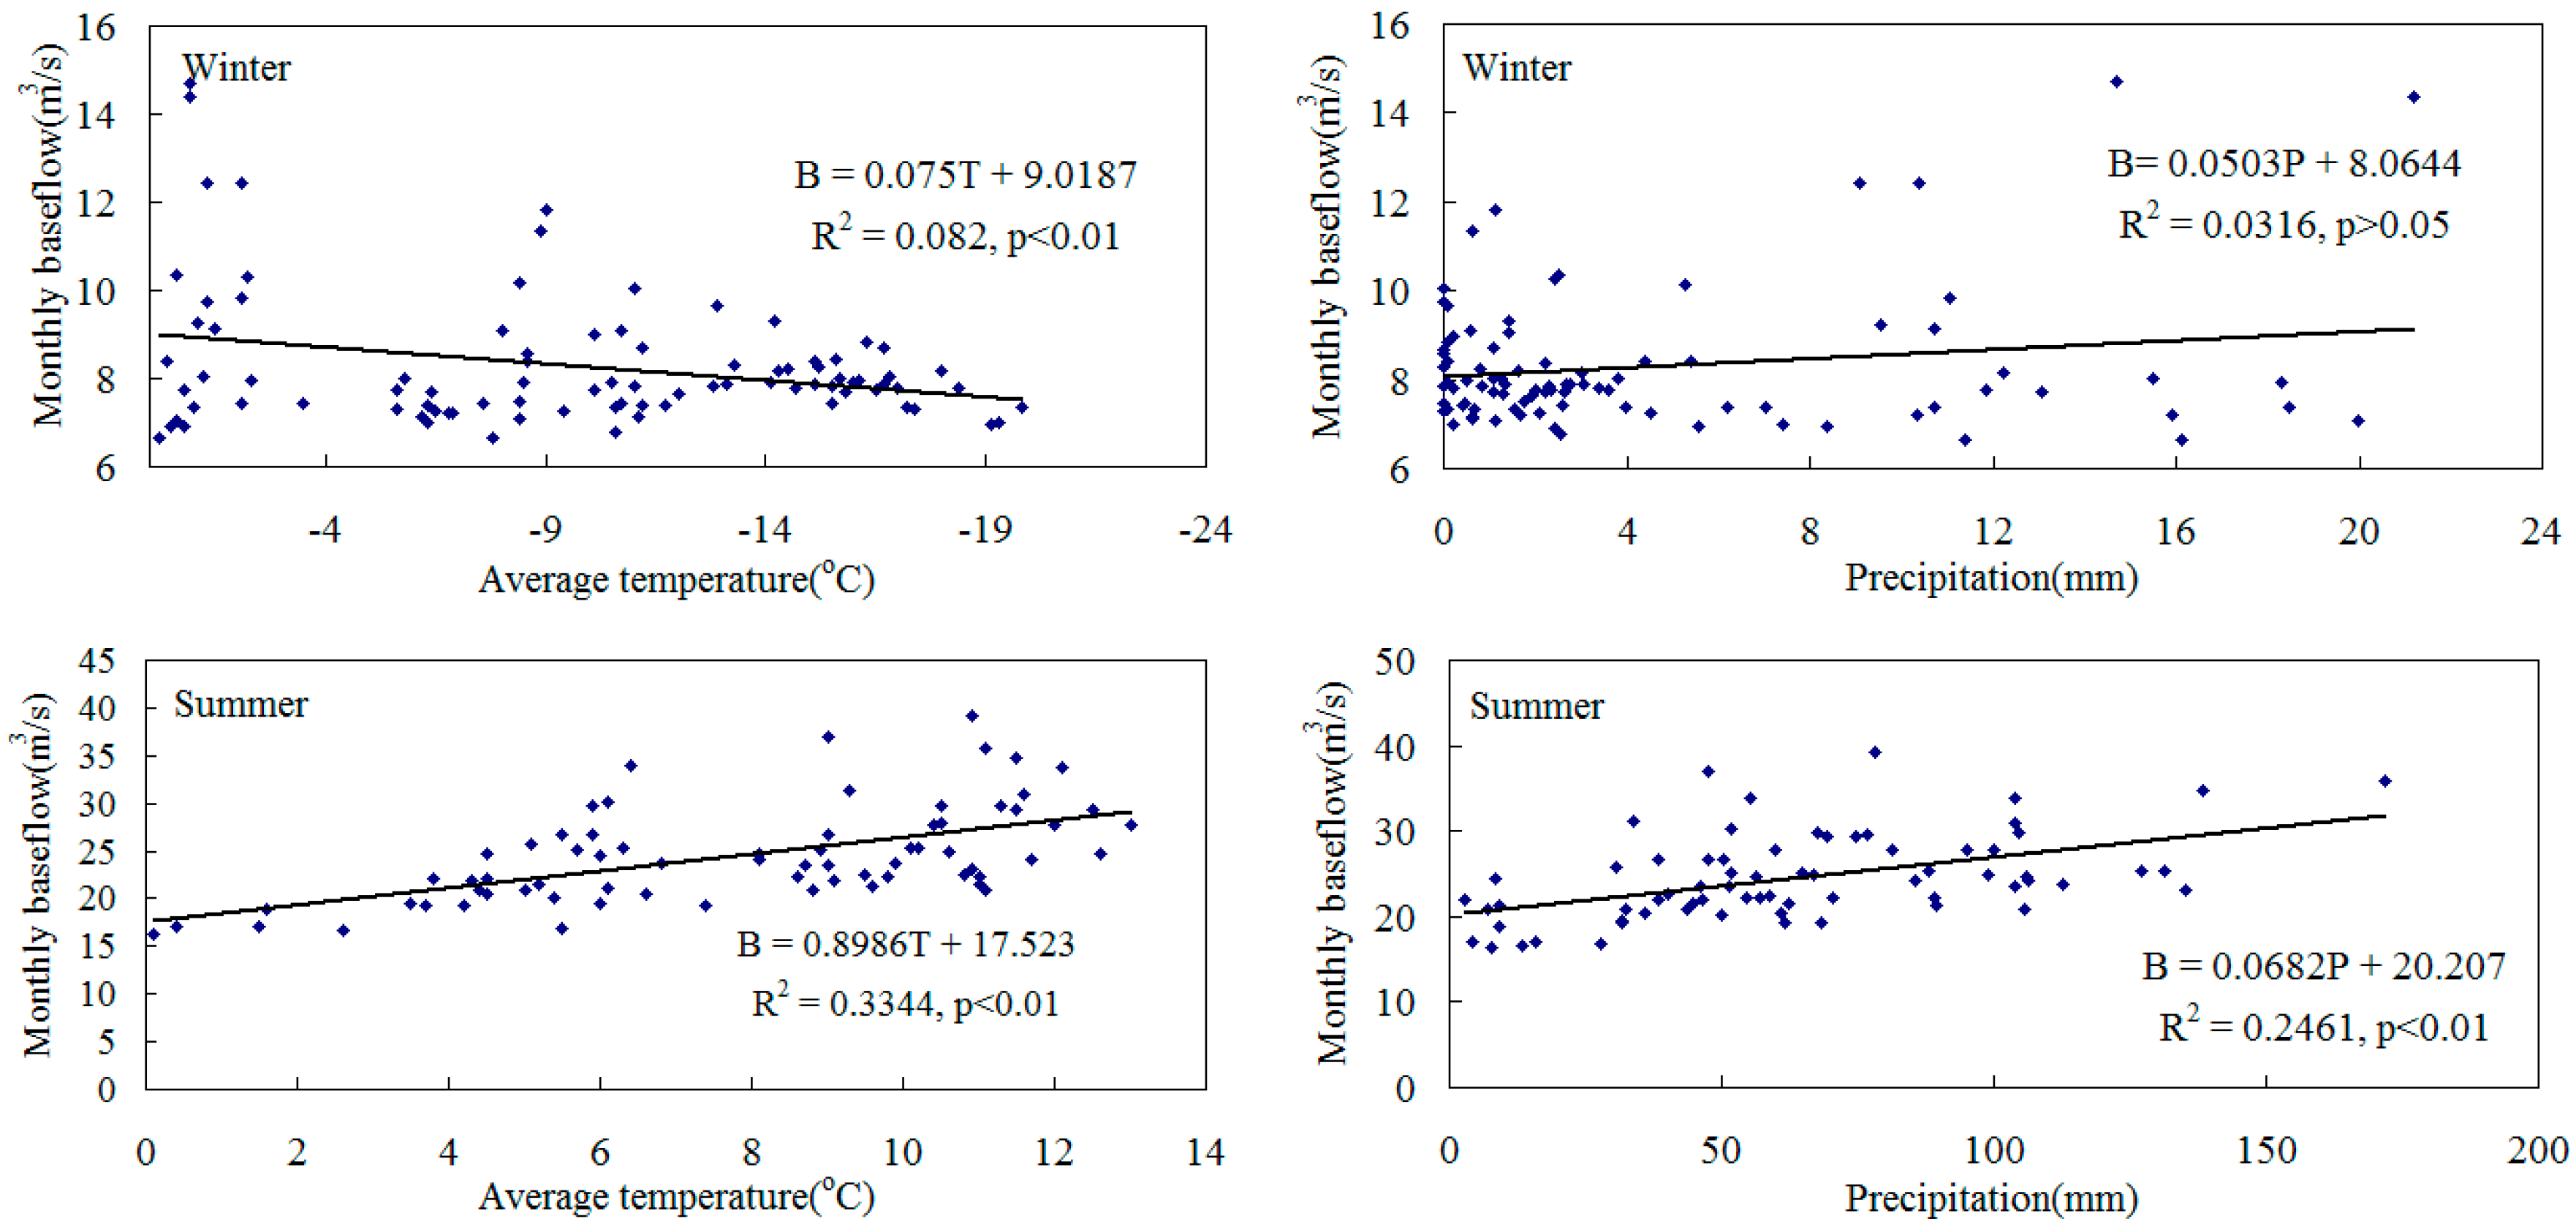
Furthermore, Figure 10 shows monthly baseflow and climate factors (precipitation and temperature) from 1996 to 2009. In the winter half of the year (October to March), the correlation of precipitation and baseflow is weak (Figure 10). This means that the precipitation had little impact on the baseflow in that period. Air temperature slightly influenced baseflow in the winter half of the year, since the correlation coefficient is very small (Figure 10). In the summer half of the year (April to September), baseflow was significantly influenced by both temperature and precipitation. The correlation coefficients of the baseflow-temperature and baseflow-precipitation relationships are both larger than 0.49 at the 0.01 significance level (Figure 10). It can be concluded that the temperature has an important impact on the baseflow throughout the year. Compared to the temperature impact, the impact of precipitation on baseflow is smaller, and it is significant in the summer half of the year. Precipitation increasing or climate warming can cause more baseflow generation in the study area, under the current conditions (Figure 9 and Figure 10).
4.4.2. The Impacts of Land Cover on the Baseflow
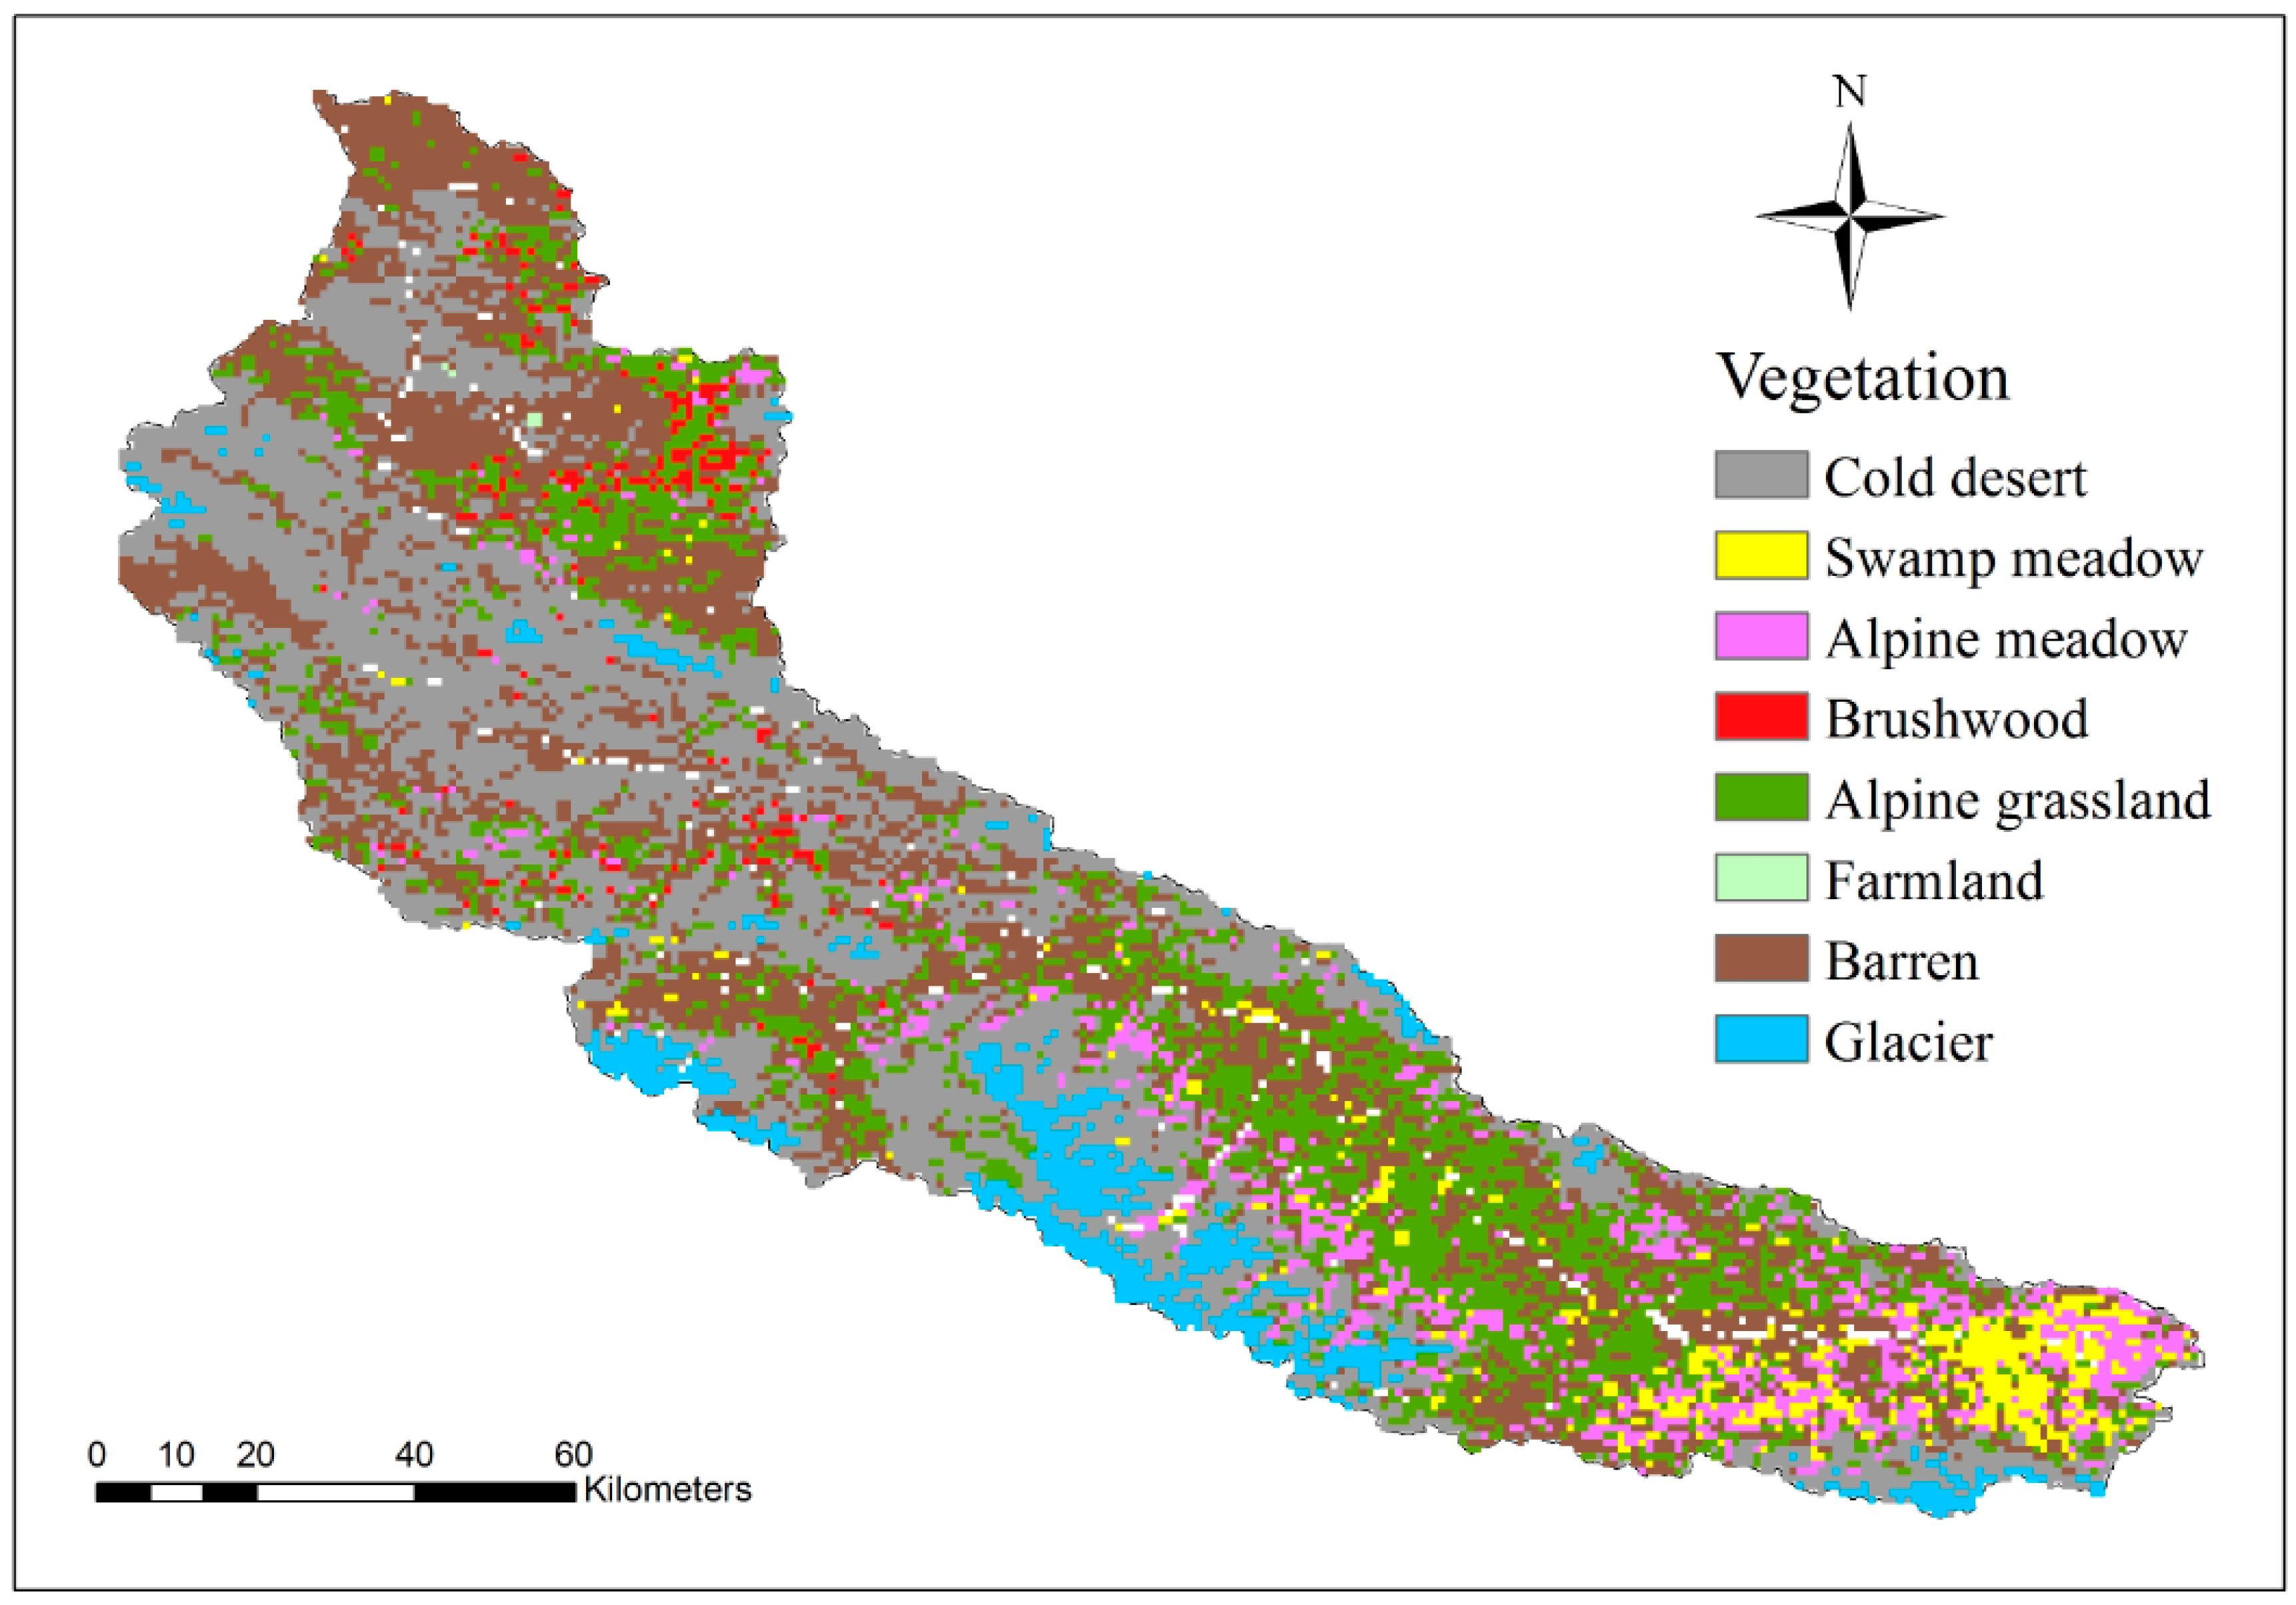
Figure 2 shows the spatial distributions of different land cover types in the upper reaches of the Shule River in the summer half of the year. Compared to the alpine grassland, cold desert and barren covered regions produced the smallest volumetric flow rates of baseflow in each unit area (Figure 2 and Figure 7). As they covered more than 50% of the basin area, the cold desert and barren areas generated larger volumetric flow rates of baseflow in the study area. Considering the area factor, the contributions of the baseflow from each type of land cover to the total baseflow in the study area are ordered as follows: cold desert (31.6%) > alpine grassland (24.6%) > barren (19.1%) > glacier (15.2%) > alpine meadow (5.3%) > swamp meadow (3.5%) > brushwood (0.6%). In recent decades, climate warming and overgrazing have led to vegetation degradation at a high rate [29]. The accelerating vegetation degradation could change the baseflow distributions. As grassland and meadow disappear, these vegetation cover regions will turn into a cold desert or bare rock. Correspondingly, the baseflow would then significantly decrease, since cold desert and bare rock have the smallest baseflow generation capacities.
4.4.3. The Impacts of Active Layer Changes on Baseflow in Permafrost Regions
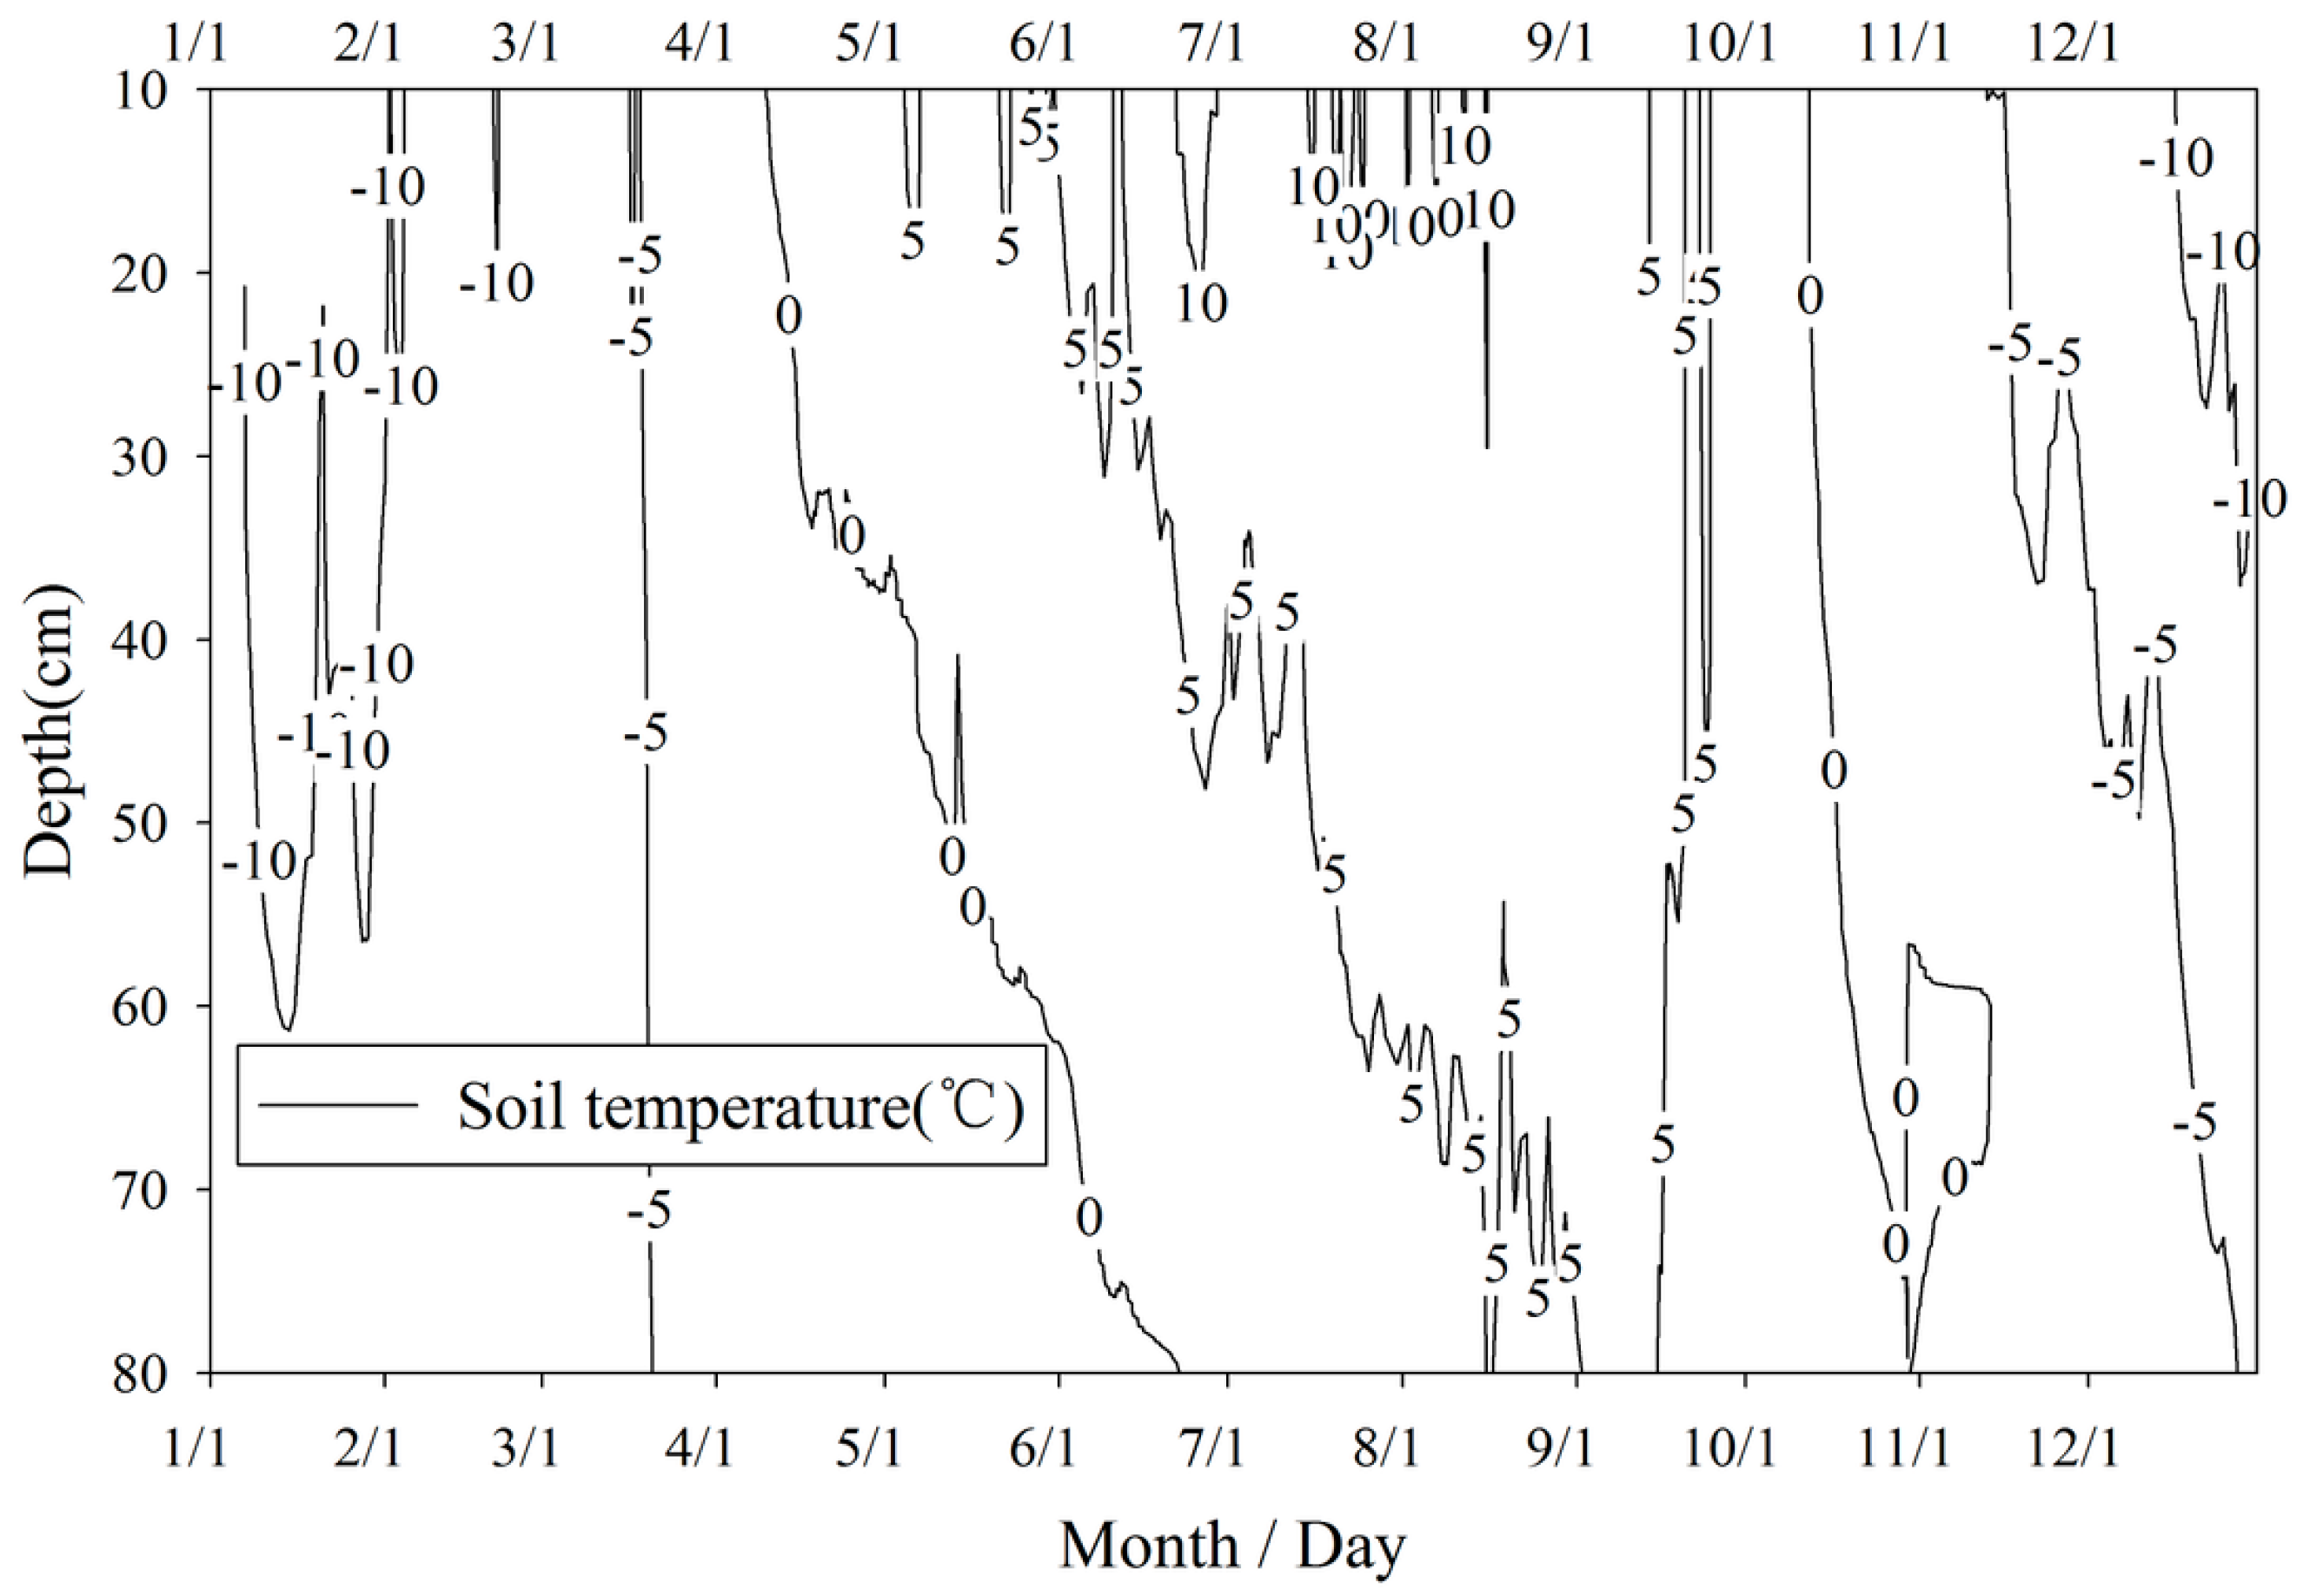
Figure 11 shows the variations of the measured soil temperatures in the active layer of the permafrost regions throughout one year. The active layer starts to thaw in April, and begins to refreeze in October (Figure 11). In addition, Figure 12 shows the analysis of the daily baseflow and volumetric water content (VWC) processes at various depths of the active layer throughout one year. According to freeze-thaw process of the active layer, four typical periods of baseflow and VWC processes are identified (Figure 12). Period I represents the thawing period in spring, II and III represent the thawing peak period in summer and early autumn, IV represents the freezing period in late autumn and early winter.
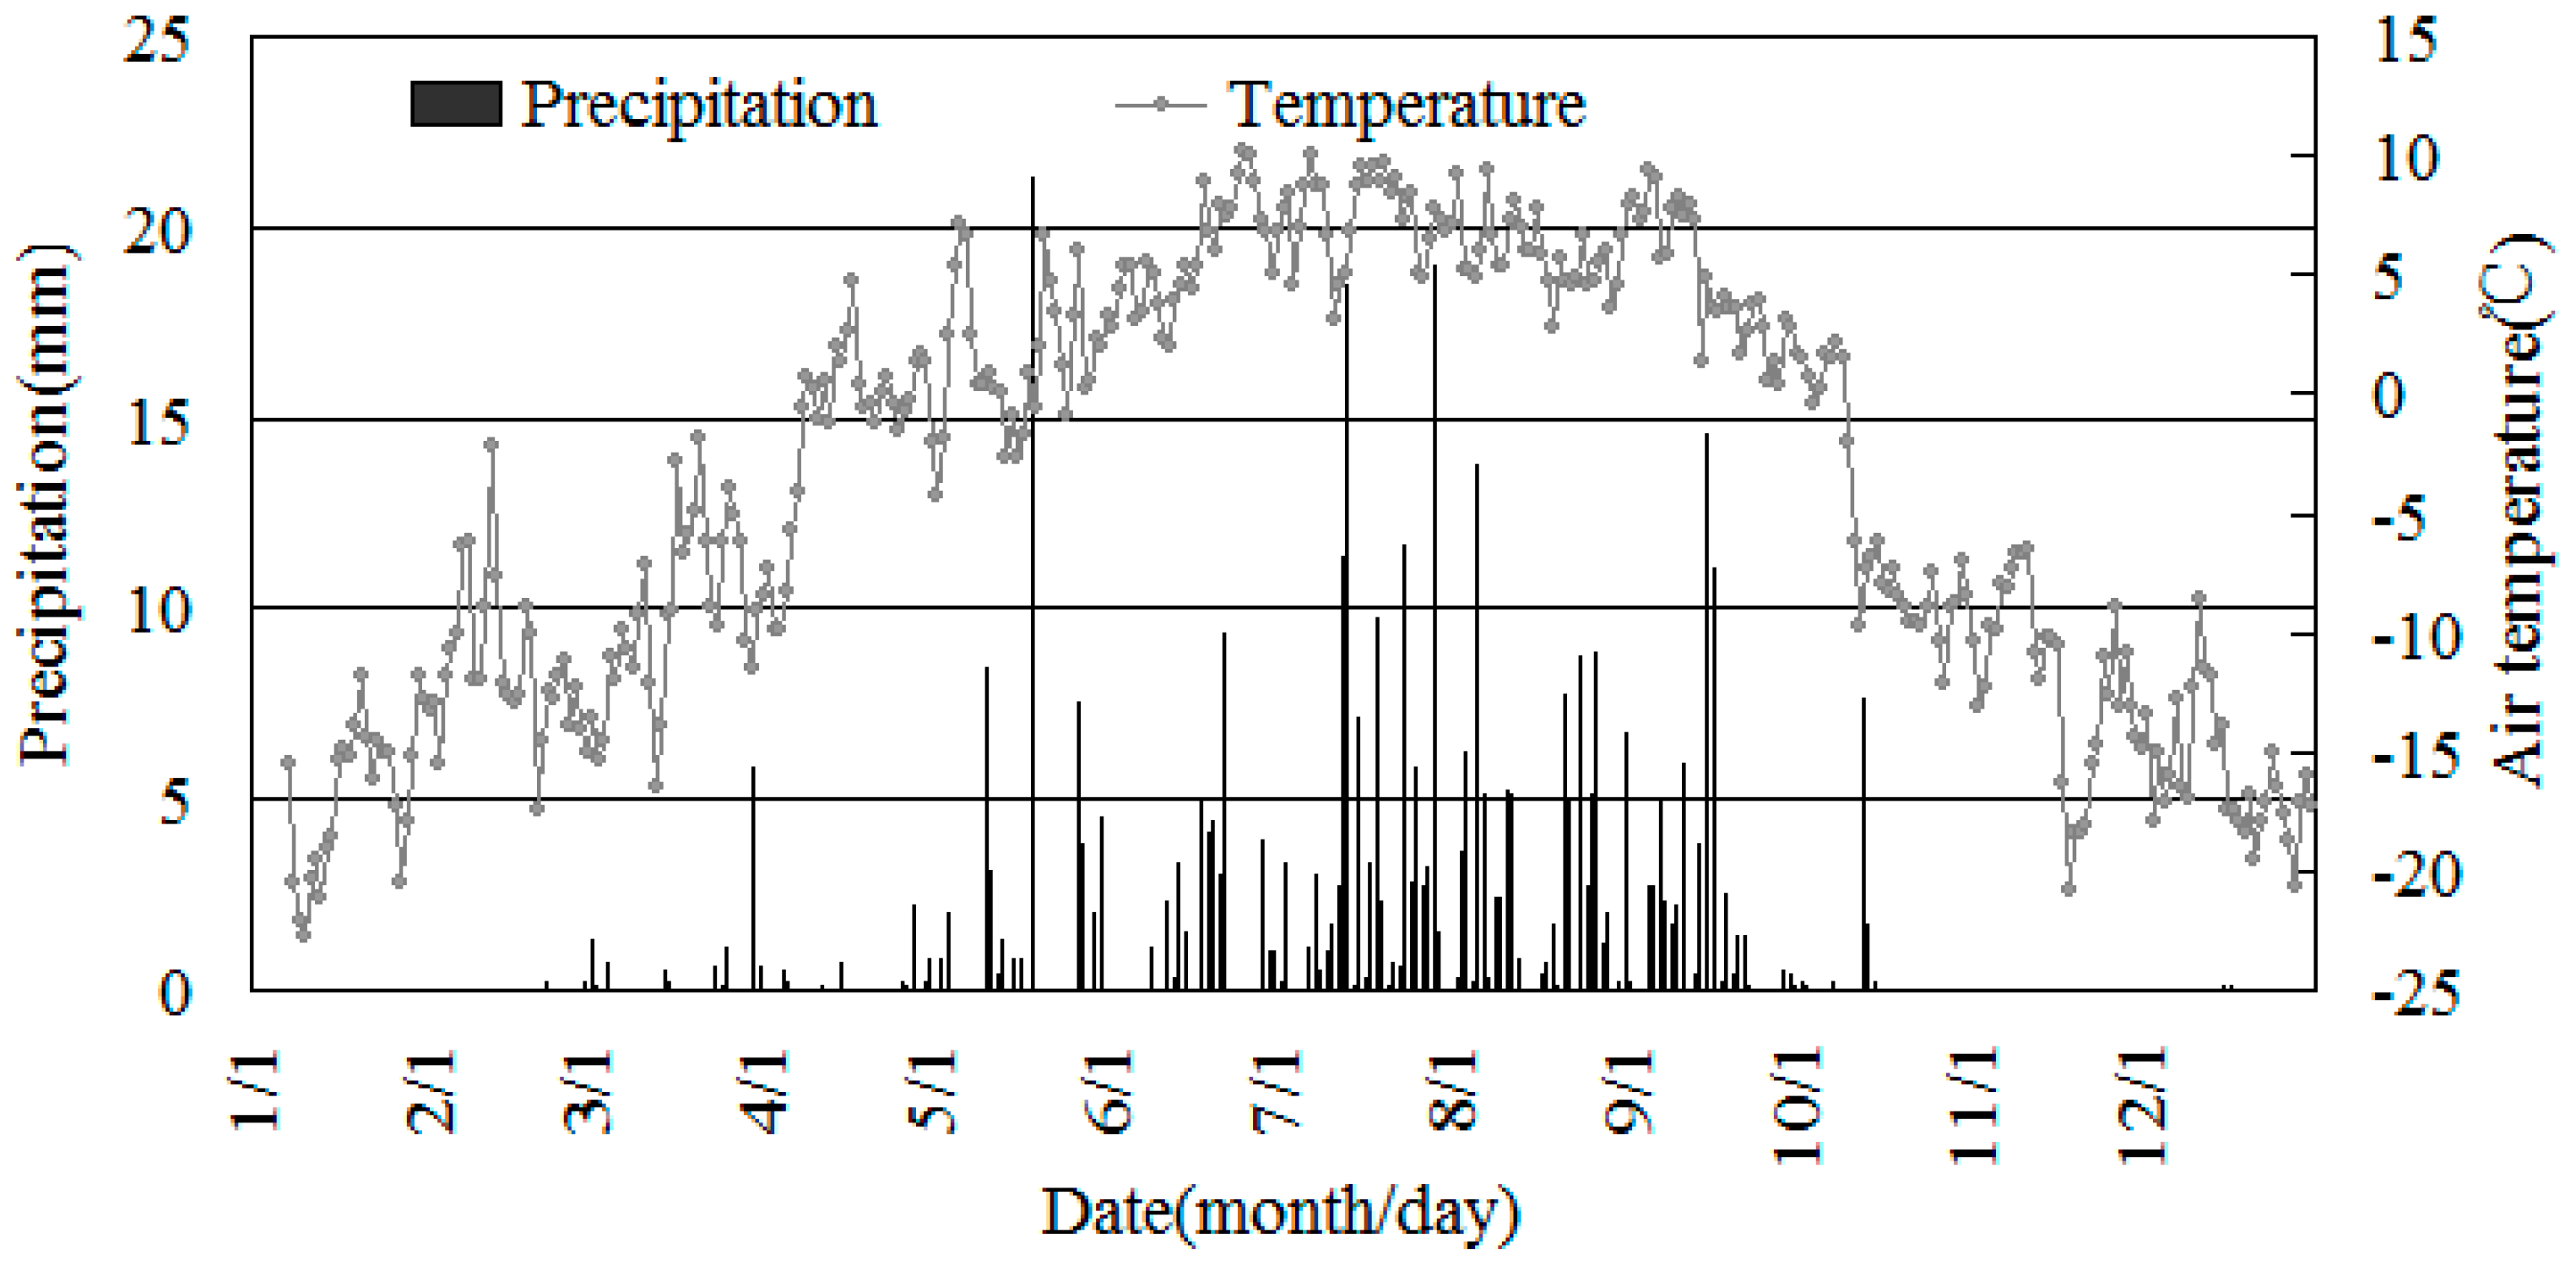
As shown in Figure 12, the change processes of the VWC in the soil layers at 10 cm and 20 cm depth are consistent with the baseflow processes during period I. This means that spring baseflow in the active layer of the permafrost regions in the study area is significantly influenced by surface soil moisture (0–20 cm), which perhaps plays an important role in baseflow recharging. Similarly, it can be concluded that the baseflow in period II is more influenced by the soil water in the 40–80 cm depth layer, where the VWC is increasing nearly at the same time as baseflow, especially in the 80 cm soil depth (Figure 12). In period III, the values of the VWC in each soil layer are all very small and change only a little, while the baseflow at that time has a significant change, with a large peak (Figure 12). It is concluded that baseflow in the early autumn has no relation with the 0–80 cm deep soil water. The frozen soil is thawing, and the depth of the active layer is increasing continuously in period II and period III (Figure 11). Water content is progressively increasing with the soil thawing. In these periods, plentiful precipitation falls (Figure 13) and infiltrates to the deeper soil and further recharges the soil water. Compared to the VWC processes and baseflow in period II, baseflow in period III is perhaps recharged by soil water deeper than 80 cm (Figure 12). In period IV, there is no precipitation and the air temperature is below 0 °C and stable (Figure 13). The VWC in each soil layer from 20 to 80 cm deep, in contrast, all have a peak, similar to the corresponding baseflow (Figure 12). Baseflow in the freezing period is significantly recharged by the soil water in the active layer. In addition, the deeper the active layer is, the slower the VWC recession rate (Figure 12). It can be concluded that the deeper soil water could more effectively recharge the baseflow in the freezing period, considering the freezing process of each layer shown in Figure 11. In spring, surface soil water recharges the baseflow directly, and the baseflow peak is mainly due to water in the 0–20 cm soil layer. In the summer half of the year, the depth of the thawed active layer increases as the temperature rises, and the baseflow is gradually recharged by the water deeper in the thawed soil.
5. Conclusions and Discussion
Based on the calibrated hydrological model, the baseflow in the permafrost-covered region was calculated. Approximately 63.1% of the runoff in the upper reaches of the Shule River is recharged by the baseflow. Compared to the runoff, the baseflow change is relative smooth within a year, and it lags a few days behind the river runoff change. In the study area, nearly 80% of the baseflow is generated in the alpine regions, with 3500–4500 m elevation, which mainly have low-temperature and mid-temperature permafrost (annual ground temperatures of permafrost below −1 °C, on average) [22].
Precipitation and air temperature have a positive effect on the baseflow in the study area. Precipitation is one main recharge source of the baseflow. Rainfall and melt water infiltration is closely related to the freezing/thawing process of the active layer in the permafrost region. According to the analysis above, the water table of the active layer is an important source region of baseflow. As permafrost thaws during a year, soil water, effectively recharged by precipitation, will move downward to water table, and then laterally flow out as baseflow. The processes of snow melt, precipitation infiltration, and soil-water saturation make the baseflow lag by a few hours, even some days, behind the precipitation. In addition, precipitation-groundwater-baseflow process will also cost a lot of time. Large proportions of precipitation cannot immediately supply water to baseflow. That is why that the daily precipitation-baseflow correlation is weaker than the monthly and annual precipitation-baseflow correlation in the study area. Air temperature rising can increase the evapotranspiration, and further decrease the precipitation infiltration and soil water [32]. However, it can also increase meltwater coming from glaciers and permafrost ice [19,22,33]. These meltwaters can effectively increase the soil water and recharge the baseflow [4]. The impact of rising temperatures on the baseflow is complicated, especially in permafrost regions.
In this research, it is concluded that the baseflow generation capacity of each land use type is different. Land covers, especially permafrost, play an important role in the redistribution of the precipitation and changing water infiltration in the surface soil. This had led to the current spatial and temporal distributions of baseflow in the study area. Baseflow generation is impacted significantly by the permafrost freeze-thaw process. In the analysis above, the baseflow varied as the thermal and moisture conditions of the permafrost active layer changed. In addition to the summer baseflow fluctuation, the spring baseflow peak and slow baseflow recession in the winter are all impacted by the permafrost freeze-thaw process. As shown in Figure 12, there is a sudden drop in soil moisture during mid-August, and this similar to the phenomenon that exists in other study areas of the Qinghai-Tibet Plateau [34,35]. The thawing speed of frozen soil in 60–100 cm depth slows down and keeps for a few days. This frozen soil layer is an “aquiclude” in the active layer, and it is hard to thaw completely. With the temperature rising, aquiclude will sudden penetrate, and soil water in upper layers will infiltrate to the deeper layer. The impacts of the active layer on baseflow were studied based on the measured data of soil temperature and moisture from two permafrost drillings (shown in Figure 1). To more accurately research the impacts of soil temperature and moisture on baseflow, observations should be expanded to a larger scale, even the whole catchment. In addition, different processes, such as the glacier and snow/ice melt should be integrated into baseflow research.
The research has improved the calculation of baseflow in permafrost regions. The positive effect of precipitation and temperature on baseflow, as well as the impacts of land cover and active layer changes on baseflow processes were also analysed. Understanding baseflow is difficult, and it is a hotspot in watershed hydrology and water resource research, especially in cold regions. The complicated geologic features, climate conditions, and underlying surfaces have made hydrological research in alpine regions very difficult. Many difficulties are still faced when trying to clearly understand the mechanism of baseflow change in cold regions. This research has analysed the impacts of the climate factors and soil freeze/thaw status on the baseflow. In the near future, other work, to collect information such as ground water observations and geological survey, needs to be done to further the research on baseflow in permafrost regions.
Acknowledgments
This work was supported by the National Natural Science Foundation of China (Nos. 41401039, 41771040, 41730751) and the National Major Scientific Research Project (No. 2013CBA01806), and the National scholarship for studying abroad of China (No. 201704910167).
Author Contributions
Jia Qin, Yongjian Ding and Tianding Han developed the idea and outline of the article. Jia Qin wrote the paper. Jia Qin and Tianding Han revised the manuscript. Jia Qin and Yuexia Liu analysed the data.
Conflicts of Interest
The authors declare no conflict of interest.
References
- Qin, J.; Ding, Y.J.; Yang, G.J. The hydrological linkage of mountains and plains in the arid region of northwest China. Chin. Sci. Bull. 2013, 58, 3140–3147. [Google Scholar] [CrossRef]
- Qian, K.; Wan, L.; Wang, X.; Lv, J.; Liang, S. Periodical characteristics of baseflow in the source region of the Yangtze River. J. Arid Land 2012, 4, 113–122. [Google Scholar] [CrossRef]
- Arnold, J.G.; Allen, P.M.; Muttiah, R.; Bernhardt, G. Automated baseflow separation and recession analysis techniques. Groundwater 1995, 33, 1011–1018. [Google Scholar] [CrossRef]
- Rogger, M.; Chirico, G.B.; Hausmann, H.; Krainer, K.; Bruckl, E.; Stadler, P.; Bloschl, G. Impact of mountain permafrost on flow path and runoff response in a high alpine catchment. Water Resour. Res. 2017, 53, 1288–1308. [Google Scholar] [CrossRef]
- Gärtner-Roer, I.; Christiansen, H.H.; Etzelmüller, B.; Farbrot, H.; Gruber, S.; Isaksen, K.; Kellerer-Pirklbauer, A.; Krainer, K.; Noetzli, J. Primary Impacts of Climate Change on the Cryosphere—Permafrost. In Impacts of Climate Change on Snow, Ice, and Permafrost in Europe: Observed Trends, Future Projections, and Socioeconomic Relevance; ETC/ACC Technical Paper 2010/13; Voigt, T., Füssel, H.-M., Gärtner-Roer, I., Huggel, C., Marty, C., Zemp, M., Eds.; European Topic Centre on Air and Climate Change: Bilthoven, The Netherlands, December 2010; pp. 66–76. [Google Scholar]
- Cremonese, E. An inventory of permafrost evidence fort the European Alps. Cryosphere 2011, 5, 651–657. [Google Scholar] [CrossRef] [Green Version]
- Boeckli, L.; Brenning, A.; Gruber, S.; Noetzli, J. A statistical approach to modelling permafrost distribution in the European Alps or similar mountain ranges. Cryosphere 2012, 6, 125–140. [Google Scholar] [CrossRef] [Green Version]
- Yinsheng, Z.; Ohata, T.; Kadota, T. Land-surface hydrological processes in the permafrost region of the eastern Tibetan Plateau. J. Hydrol. 2003, 283, 41–56. [Google Scholar]
- Smakhtin, V.U. Low flow hydrology: A review. J. Hydrol. 2001, 240, 147–186. [Google Scholar] [CrossRef]
- Chen, L.Q.; Liu, C.M.; Yang, C. Baseflow estimation of the source regions of the Yellow River. Geogr. Res. 2006, 25, 659–665. [Google Scholar]
- Wittenberg, H.; Sivapalan, M. Watershed groundwater balance estimation using streamflow recession analysis and baseflow separation. J. Hydrol. 1999, 219, 20–33. [Google Scholar] [CrossRef]
- Zhang, Y.K.; Schilling, K.E. Effects of land cover on water table, soil moisture, evapo-transpiration and groundwater recharge: A field observation and analysis. J. Hydrol. 2006, 319, 328–338. [Google Scholar] [CrossRef]
- Aksoy, H.; Wittenberg, H. Nonlinear baseflow recession analysis in watersheds with intermittent streamflows. Hydrol. Sci. J. 2011, 56, 226–237. [Google Scholar] [CrossRef]
- Liang, S.H.; Xu, D.W.; Wan, L. Periodic regularity of the baseflow in the headwater region of the Yellow river and affecting factors. Earth Sci. Front. 2008, 15, 280–289. [Google Scholar]
- Wang, Y.L.; Wang, W.K.; Qian, Y.P.; Duan, L.; Yang, Z.Y. Change Characteristics and Driving Forces of Base Flow of Yellow River Basin. J. Nat. Resour. 2008, 23, 479–486. [Google Scholar]
- Qian, Y.P.; Jin, S.Y.; Jiang, X.H.; Lin, Y.P. Influence of variation of baseflow in the upper reaches of Lanzhou on water resources of Yellow River. J. Water Resour. Water Eng. 2004, 15, 19–23. [Google Scholar]
- Quan, J.; Ma, H.L. Baseflow Separation and Its Characteristics Analysis in Shiyang River Basin. Water Resour. Power 2010, 28, 18–27. [Google Scholar]
- McNamara, J.P.; Kane, D.L.; Hinzman, L.D. An analysis of streamflow hydrology in the Kuparuk River Basin, Arctic Alaska: A nested watershed approach. J. Hydrol. 1998, 206, 39–57. [Google Scholar] [CrossRef]
- Lyon, S.W.; Destouni, G. Changes in catchment-scale recession flow properties in response to permafrost thawing in the Yukon River Basin. Int. J. Climatol. 2010, 30, 2138–2145. [Google Scholar] [CrossRef]
- Frampton, A.; Painter, S.; Lyon, S.W.; Destouni, G. Non-isothermal, three-phase simulations of near-surface flows in a model permafrost system under seasonal variability and climate change. J. Hydrol. 2011, 403, 352–359. [Google Scholar] [CrossRef]
- Yang, Z.N. Glacier Water Resources in China; Gansu Science and Technology Press: Lanzhou, China, 1991; pp. 138–139. [Google Scholar]
- Sheng, Y.; Li, J.; Wu, J.C. Distribution patterns of permafrost in the upper area of Shule River with the application of GIS technique. J. China Univ. Min. Technol. 2010, 39, 32–39. [Google Scholar]
- Zhou, J.X.; Wu, J.K.; Liu, S.W. Hydrograph Separation in the Headwaters of the Shule River Basin: Combining Water Chemistry and Stable Isotopes. Adv. Meteorol. 2015, 2, 1–10. [Google Scholar] [CrossRef]
- Qin, J.; Ding, Y.; Wu, J. Understanding the impact of mountain landscapes on water balance in the upper Heihe River watershed in northwestern China. J. Arid Land 2013, 5, 366–383. [Google Scholar] [CrossRef]
- Zhao, Q.; Zhang, S.; Ding, Y.J. Modeling hydrologic response to climate change and shrinking glaciers in the highly glacierized Kunma Like River catchment, Central Tian Shan Mountains. J. Hydrometeorol. 2015, 16, 2383–2402. [Google Scholar] [CrossRef]
- Cherkauer, K.A.; Lettenmaier, D.P. Hydrological effects of frozen soils in the upper Mississippi River basin. J. Geophys. Res. 1999, 104, 599–610. [Google Scholar] [CrossRef]
- Troy, T.J.; Sheffield, J.; Wood, E.F. Estimation of the terrestrial water budget over northern Eurasia through the use of multiple data sources. J. Clim. 2011, 24, 3272–3293. [Google Scholar] [CrossRef]
- Cuo, L.; Zhang, Y.; Bohn, T.J.; Zhao, L.; Li, J.; Liu, Q.; Zhou, B. Frozen soiled gradation and its effects on surface hydrology in the northern Tibetan Plateau. J. Geophys. Res. Atmos. 2015, 120, 8276–8298. [Google Scholar] [CrossRef]
- Moriasi, D.; Amold, J.; Van, L.M. Model evaluation guidelines for systematic quantification of accuracy in watershed simulations. Trans. Asabe 2007, 50, 885–900. [Google Scholar] [CrossRef]
- Abdulla, F.A.; Lettenmaier, D.P.; Xu, L. Estimation of the ARNO model baseflow parameters using daily streamflow data. J. Hydrol. 1999, 222, 37–54. [Google Scholar] [CrossRef]
- Vogel, R.M.; Kroll, C.N. Regional geohydrologic-geomorphic relationships for the estimation of low-flow statistics. Water Resour. Res. 1992, 28, 2451–2458. [Google Scholar] [CrossRef]
- Qin, Y.; Yi, S.; Ren, S. Responses of typical grasslands in a semi-arid basin on the Qinghai-Tibetan Plateau to climate change and disturbances. Environ. Earth Sci. 2014, 71, 1421–1431. [Google Scholar] [CrossRef]
- Haeberli, W.; Guodong, C.; Gorbunov, A.P.; Harris, S.A. Mountain permafrost and climatic change. Permafr. Periglac. Process. 1993, 4, 165–174. [Google Scholar] [CrossRef]
- Wang, G.X.; Hu, C.H.; Li, T.B. The influence of freeze-thaw cycles of active soil layer on surface runoff in a permafrost watershed. J. Hydrol. 2009, 375, 438–449. [Google Scholar] [CrossRef]
- Li, R.; Zhao, L.; Ding, Y.J.; Wang, Y.X. Impact of surface energy variation on thawing processes with active layer of permafrost. J. Glaciol. Geocryol. 2011, 33, 1235–1242. [Google Scholar]
Figure 1.
Locations of the study area and its elevation.
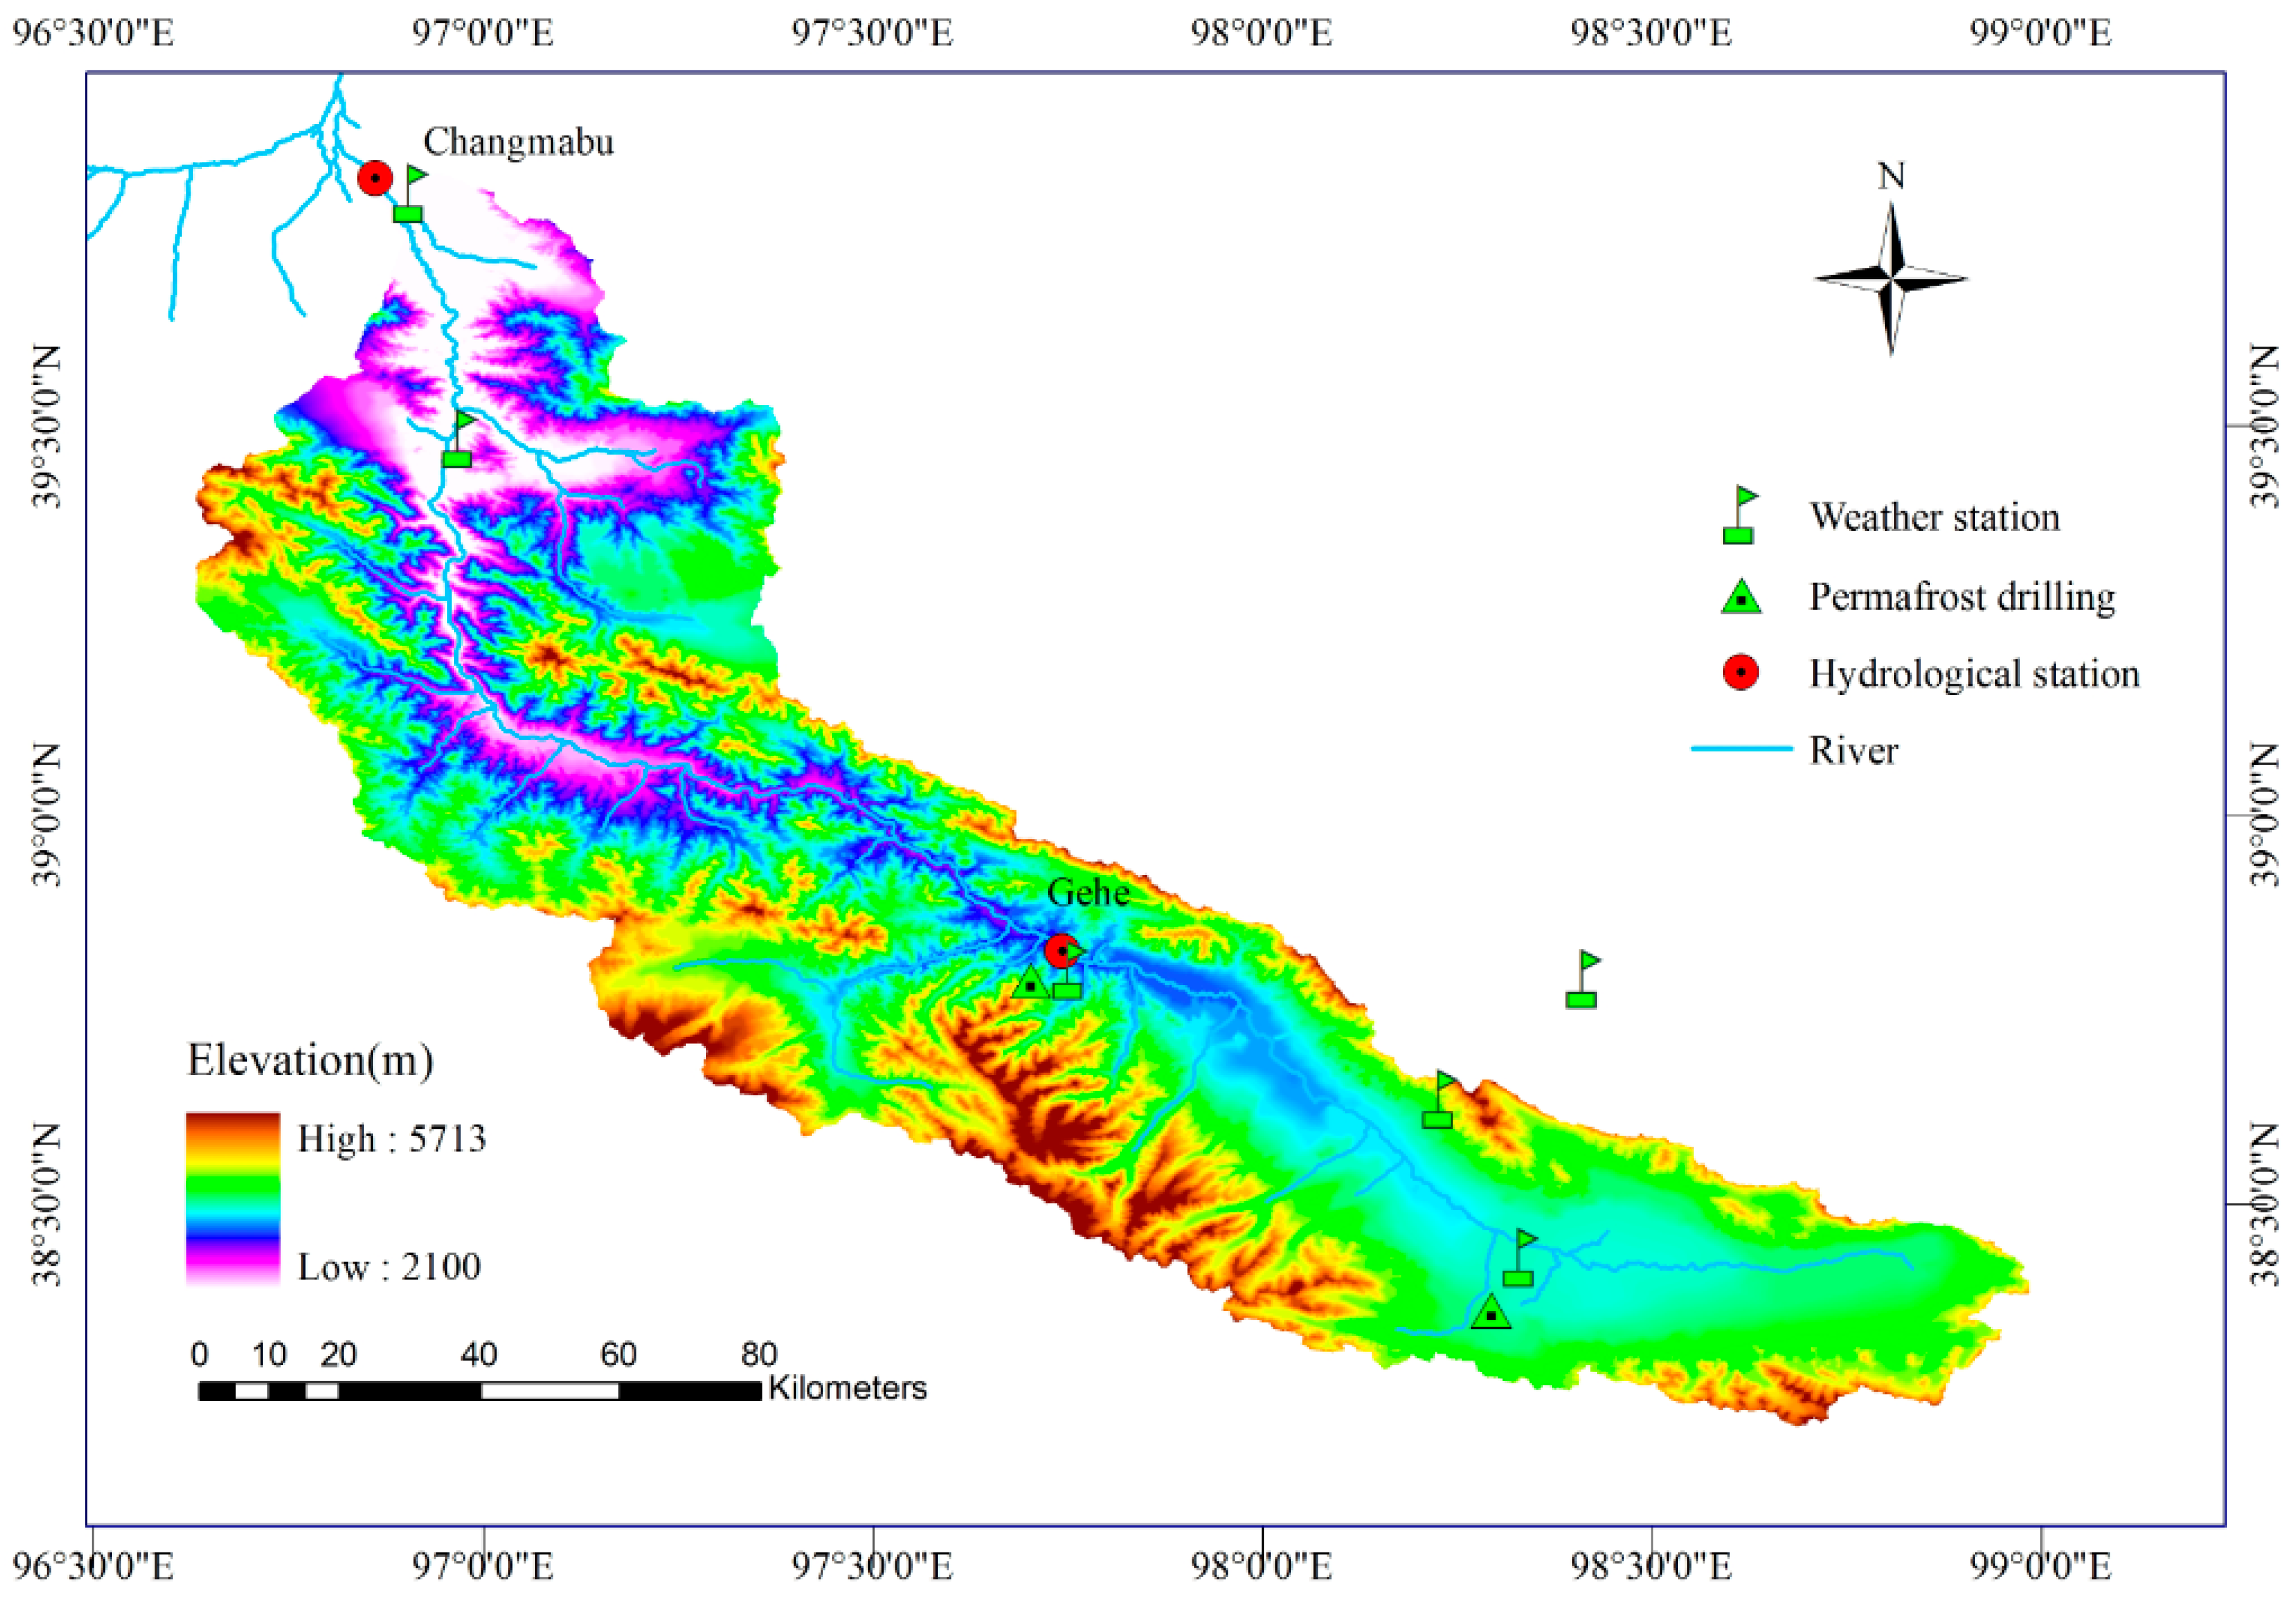
Figure 2.
The spatial distribution of each land use type in the study area.

Figure 3.
Simulated and observed runoff in the upper reaches of the Shule River.
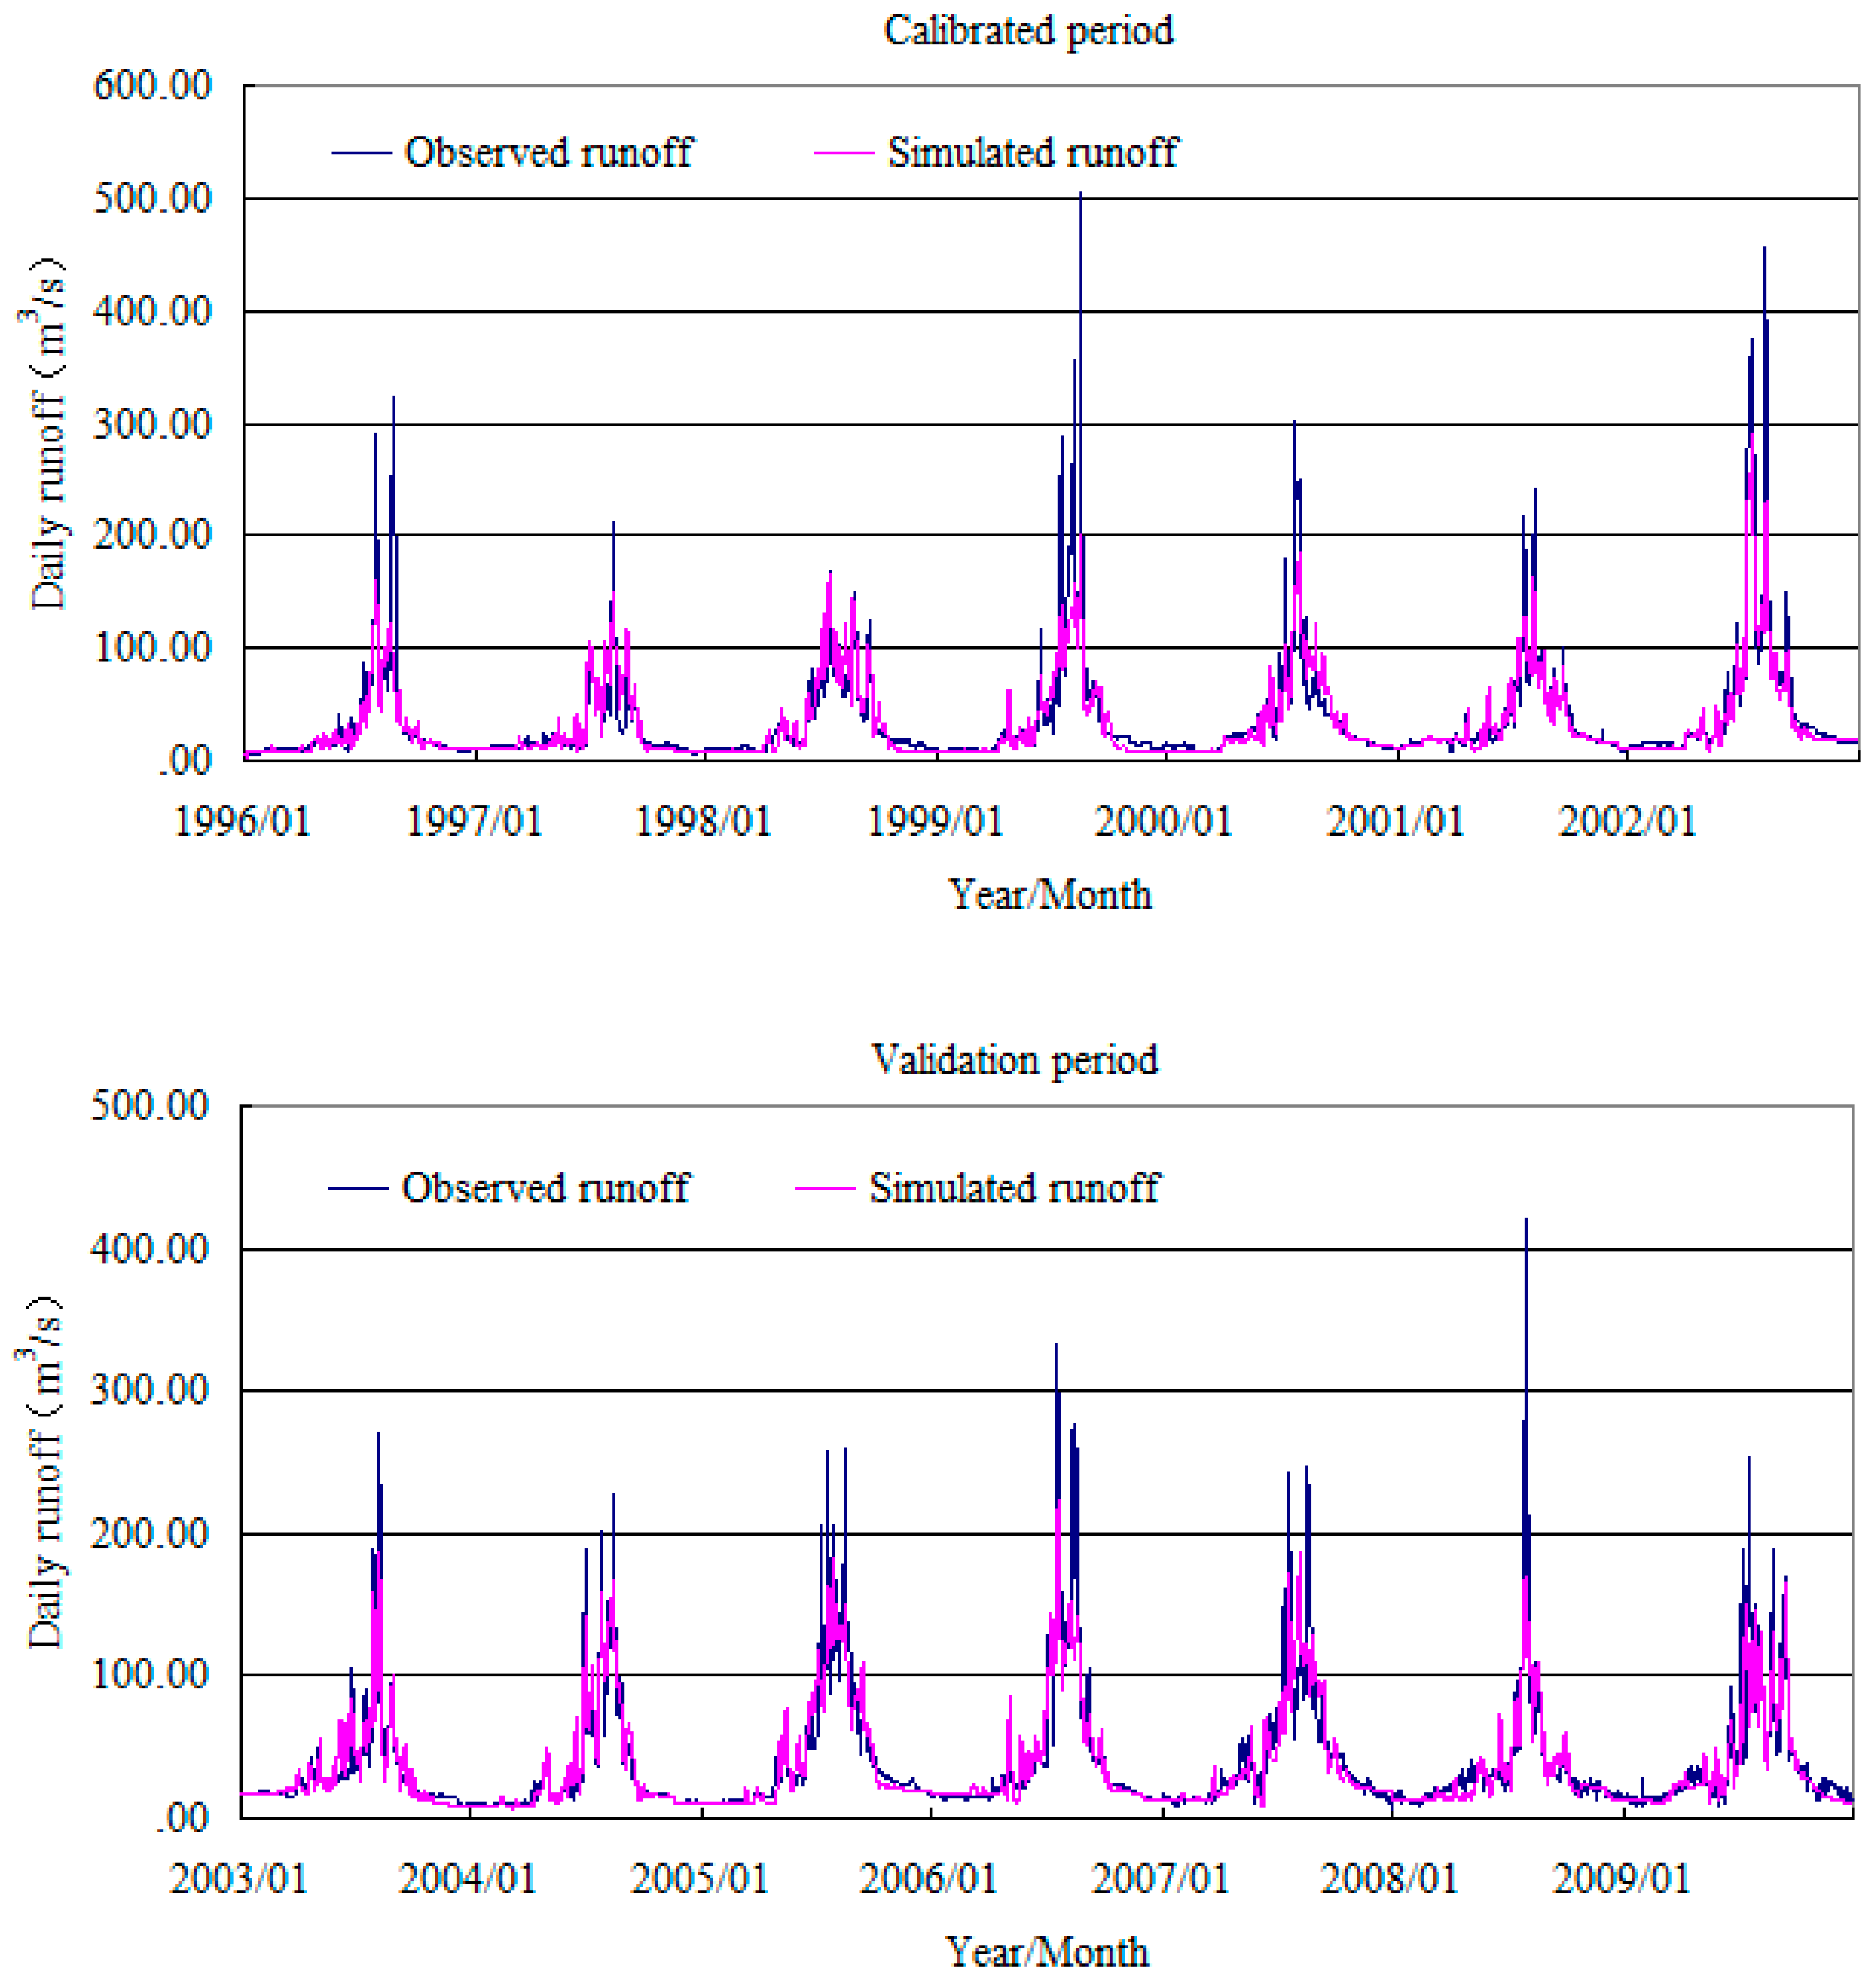
Figure 4.
The simulated baseflow and observed runoff in the study area during 2008–2009.

Figure 5.
The simulated baseflow vs. observed runoff in the winter of 2008–2009.
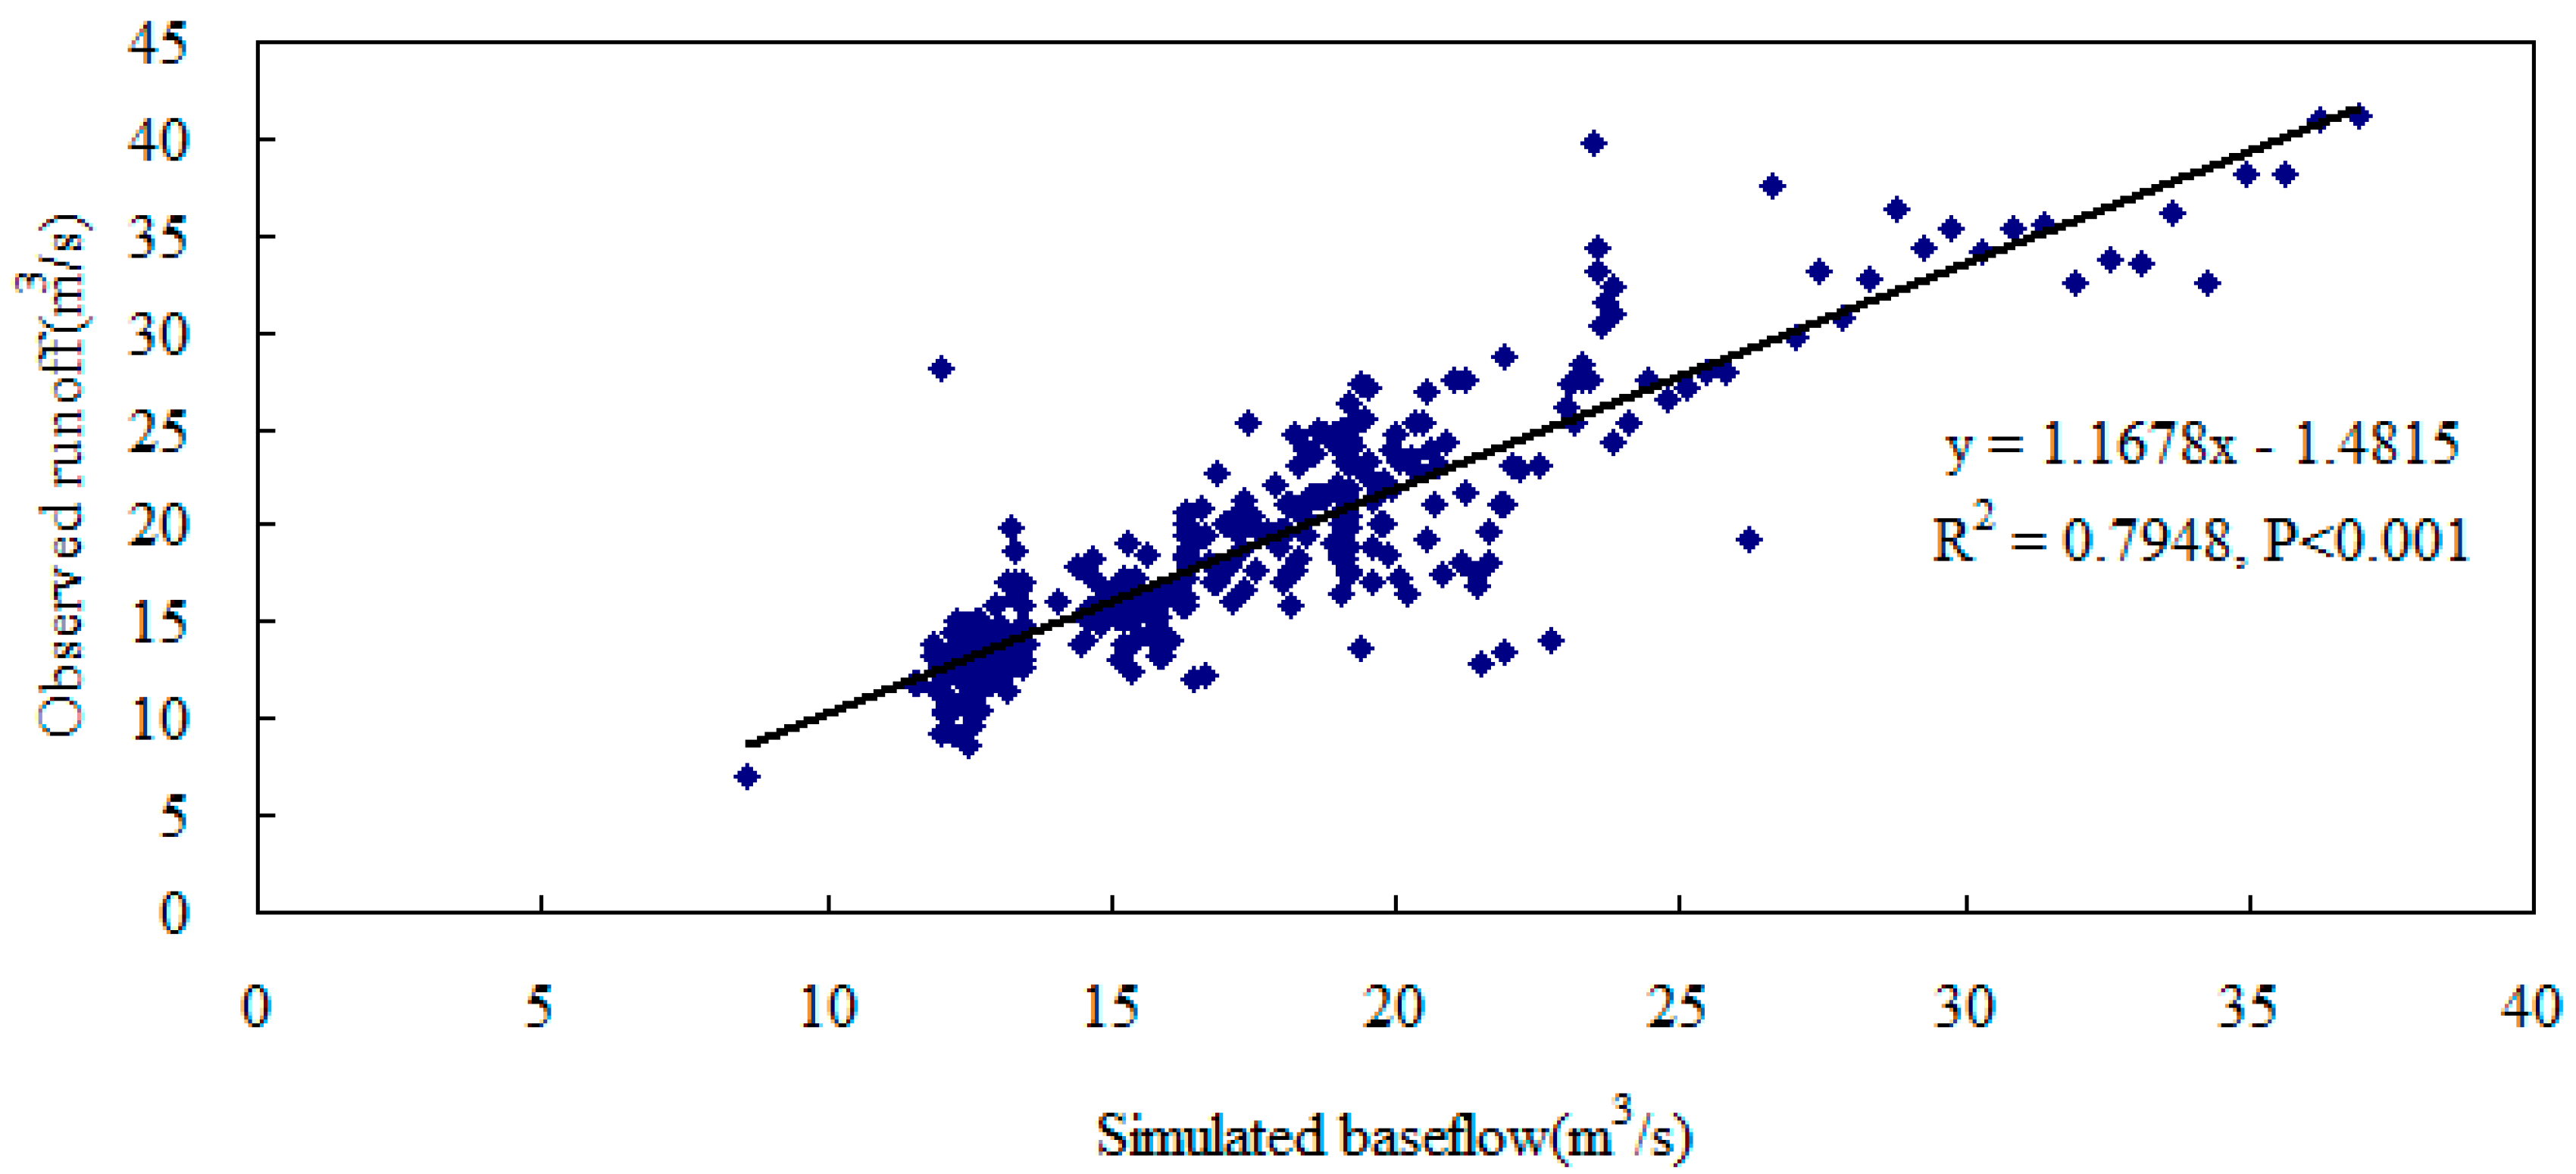
Figure 6.
The predicted and observed baseflow in the upper reaches of the Shule River, during the recession periods of 2008–2009.
Figure 6.
The predicted and observed baseflow in the upper reaches of the Shule River, during the recession periods of 2008–2009.
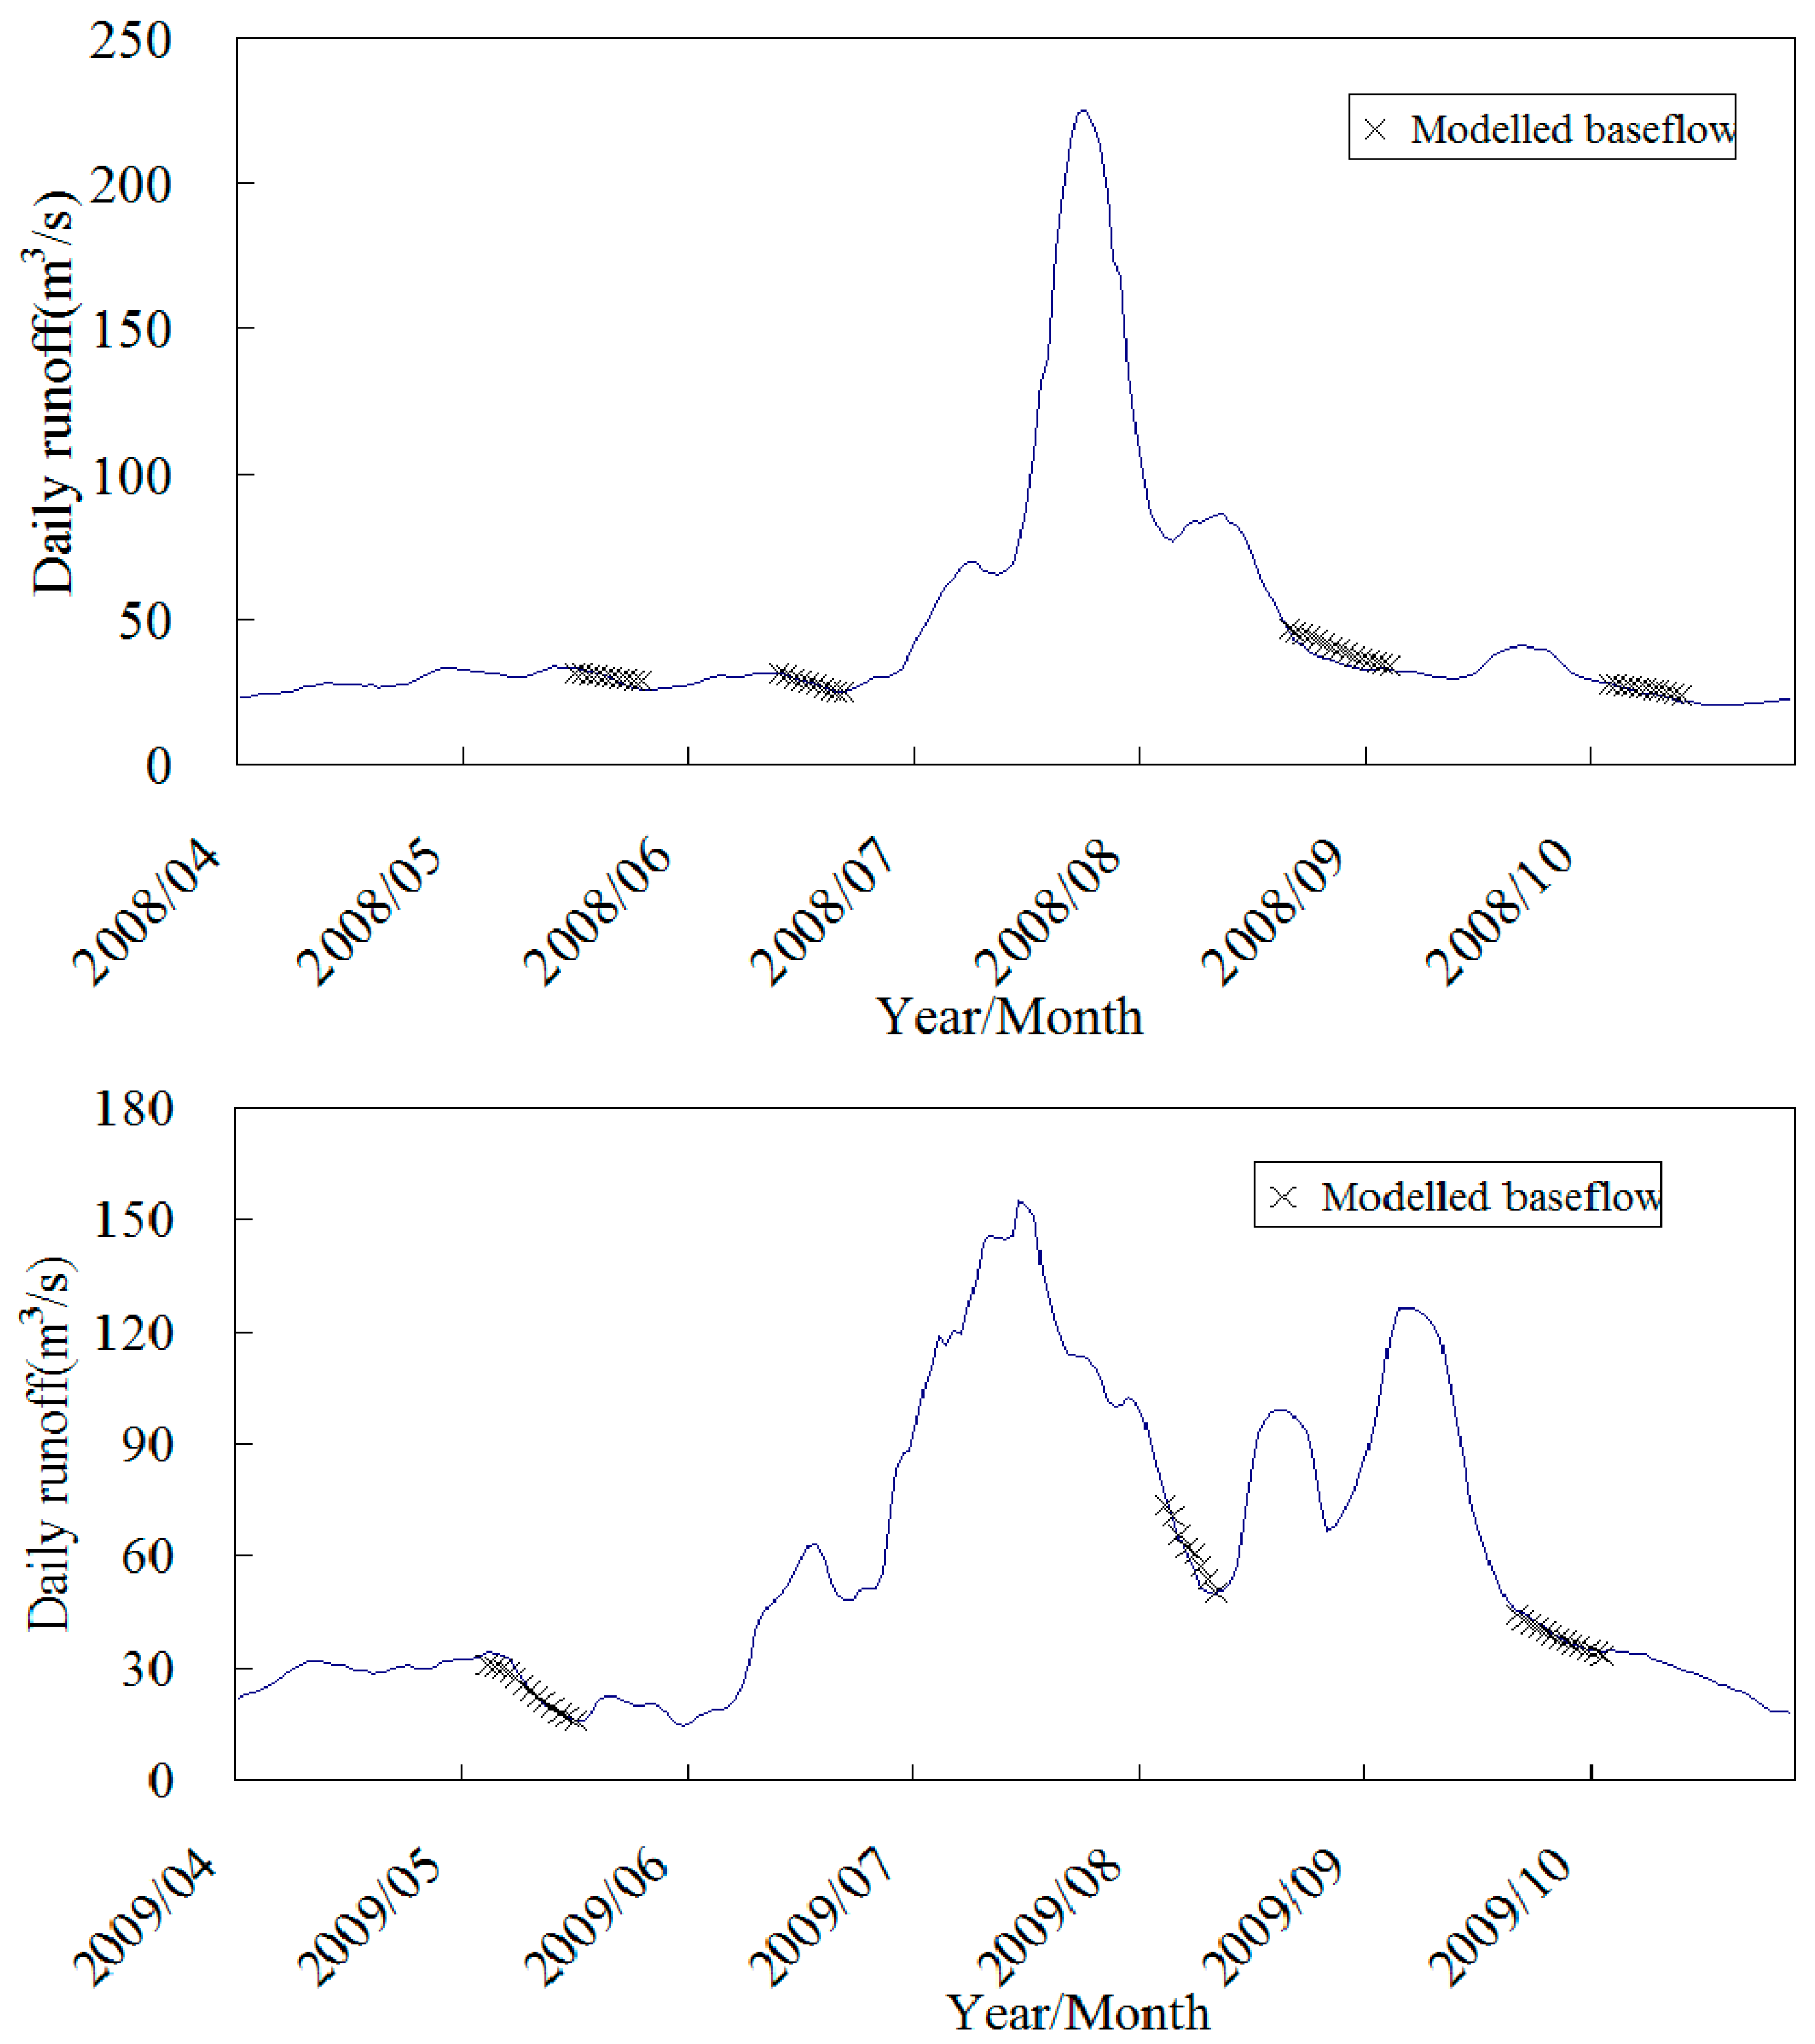
Figure 7.
The spatial distributions of baseflow in the winter and summer half of the year, during 1996–2009.
Figure 7.
The spatial distributions of baseflow in the winter and summer half of the year, during 1996–2009.

Figure 8.
Proportions of the watershed area and baseflow at different elevations of the study area.
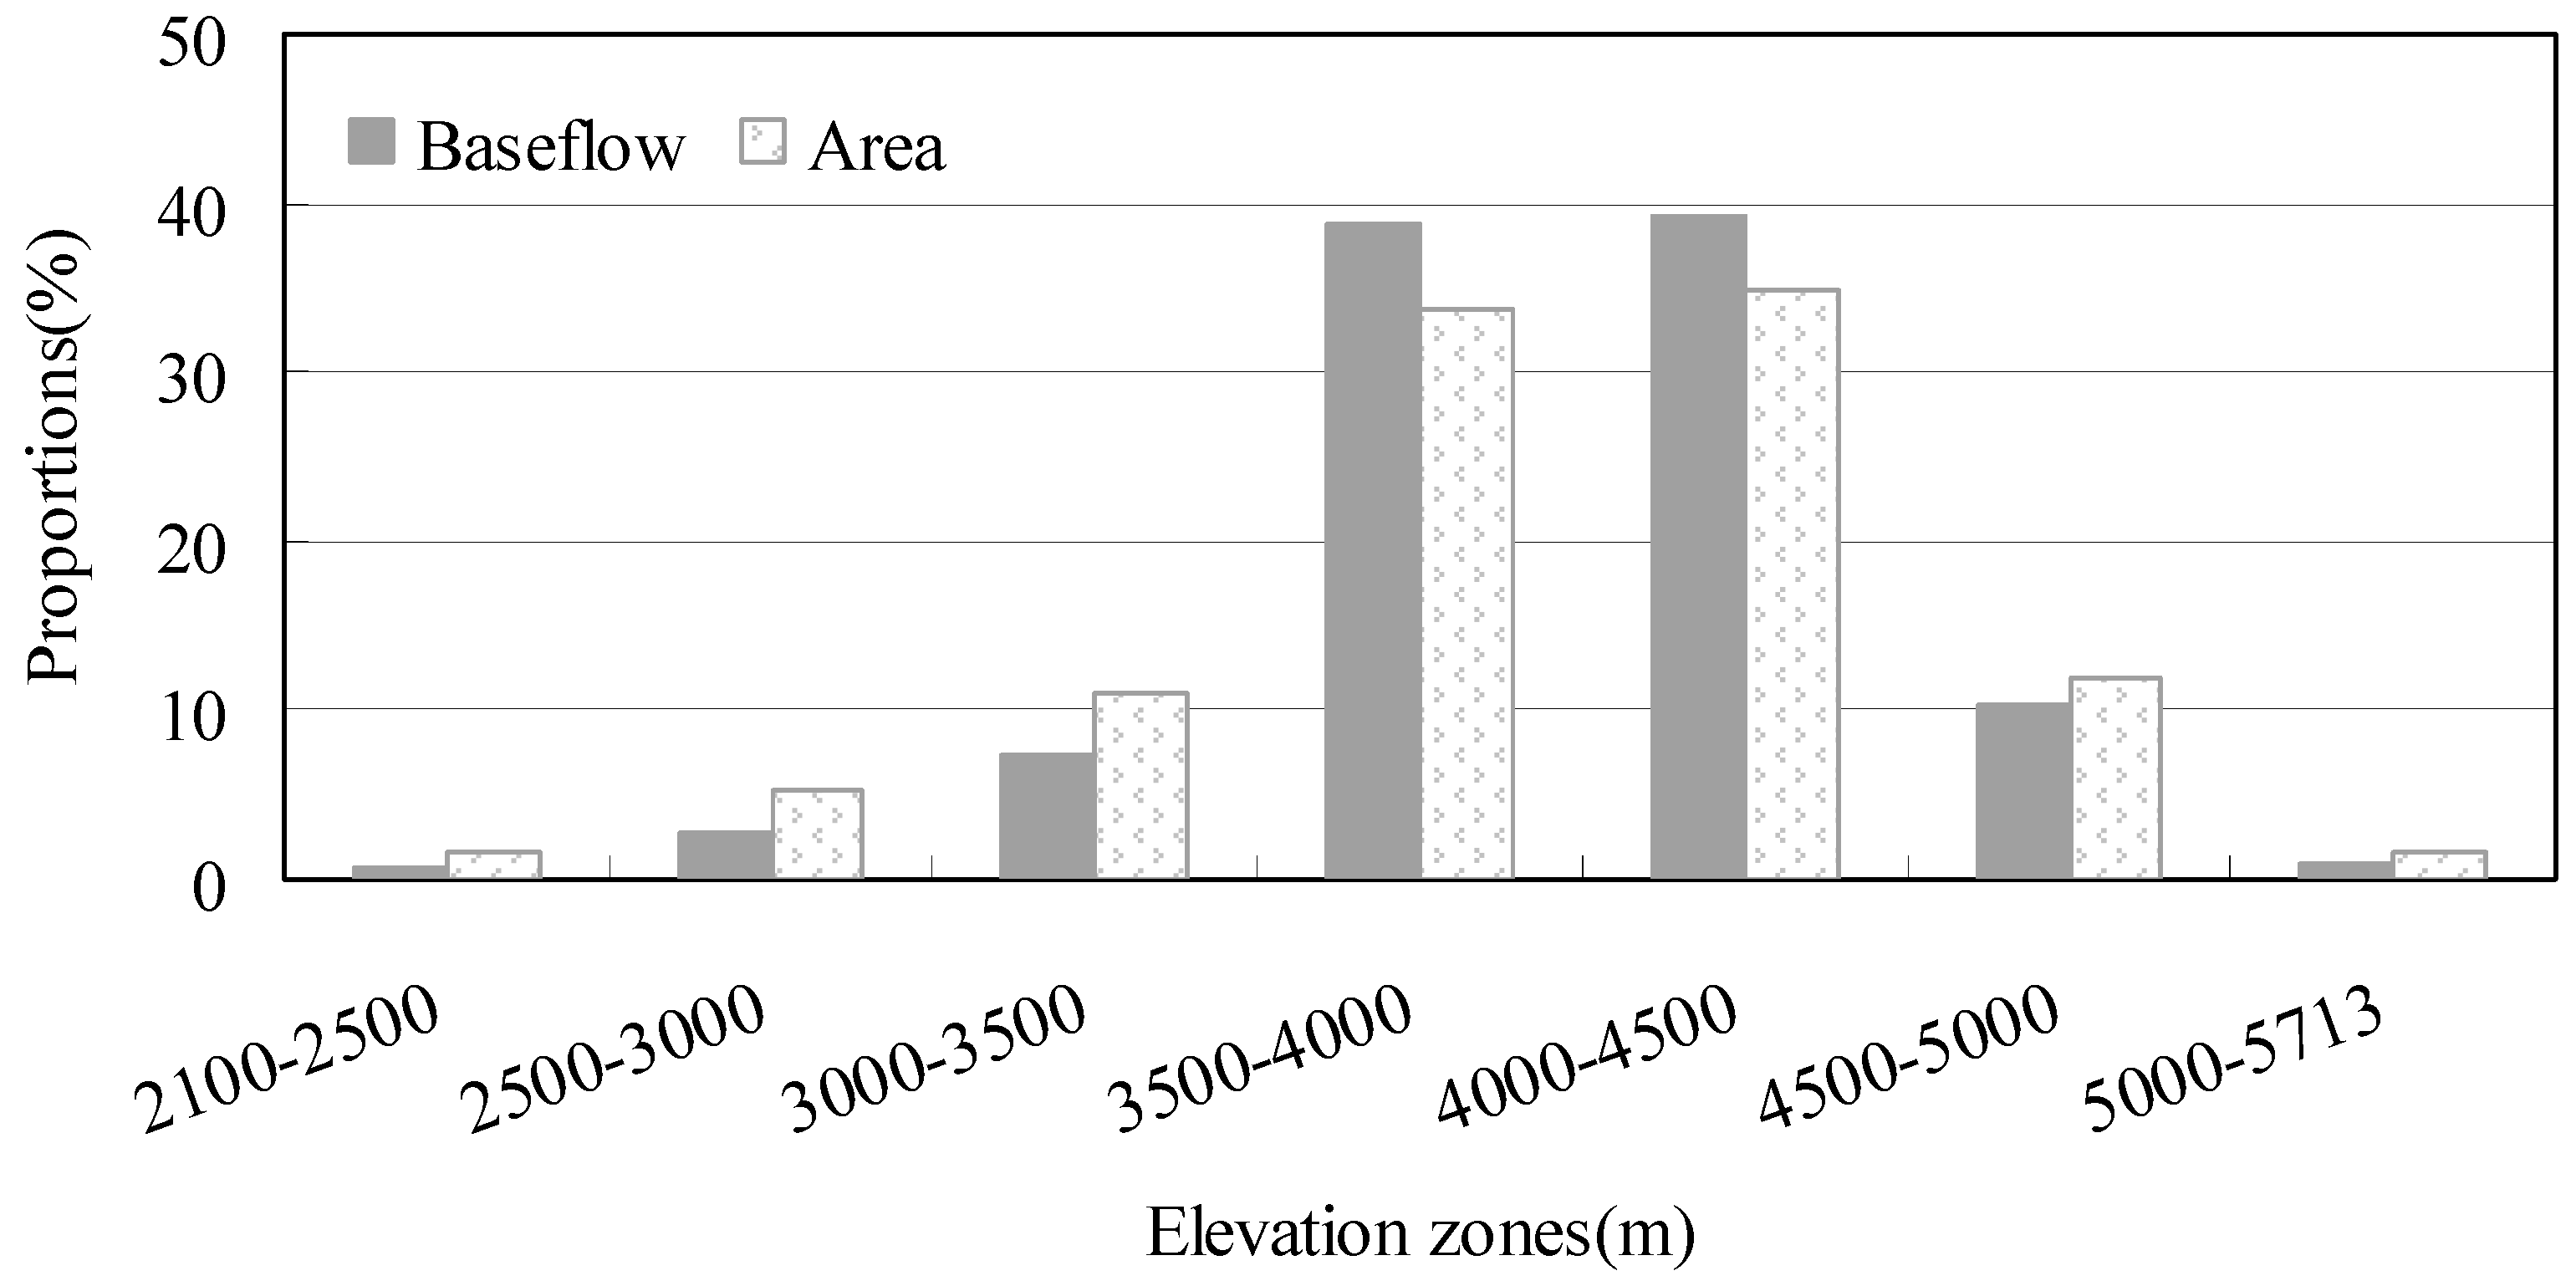
Figure 9.
The relationship between the annual baseflow (B) and total precipitation (TP) (with the solid trend line), and the relationship between the baseflow (B) and temperature (T) (with the dotted trend line), in the study area during the period from 1996 to 2009.
Figure 9.
The relationship between the annual baseflow (B) and total precipitation (TP) (with the solid trend line), and the relationship between the baseflow (B) and temperature (T) (with the dotted trend line), in the study area during the period from 1996 to 2009.
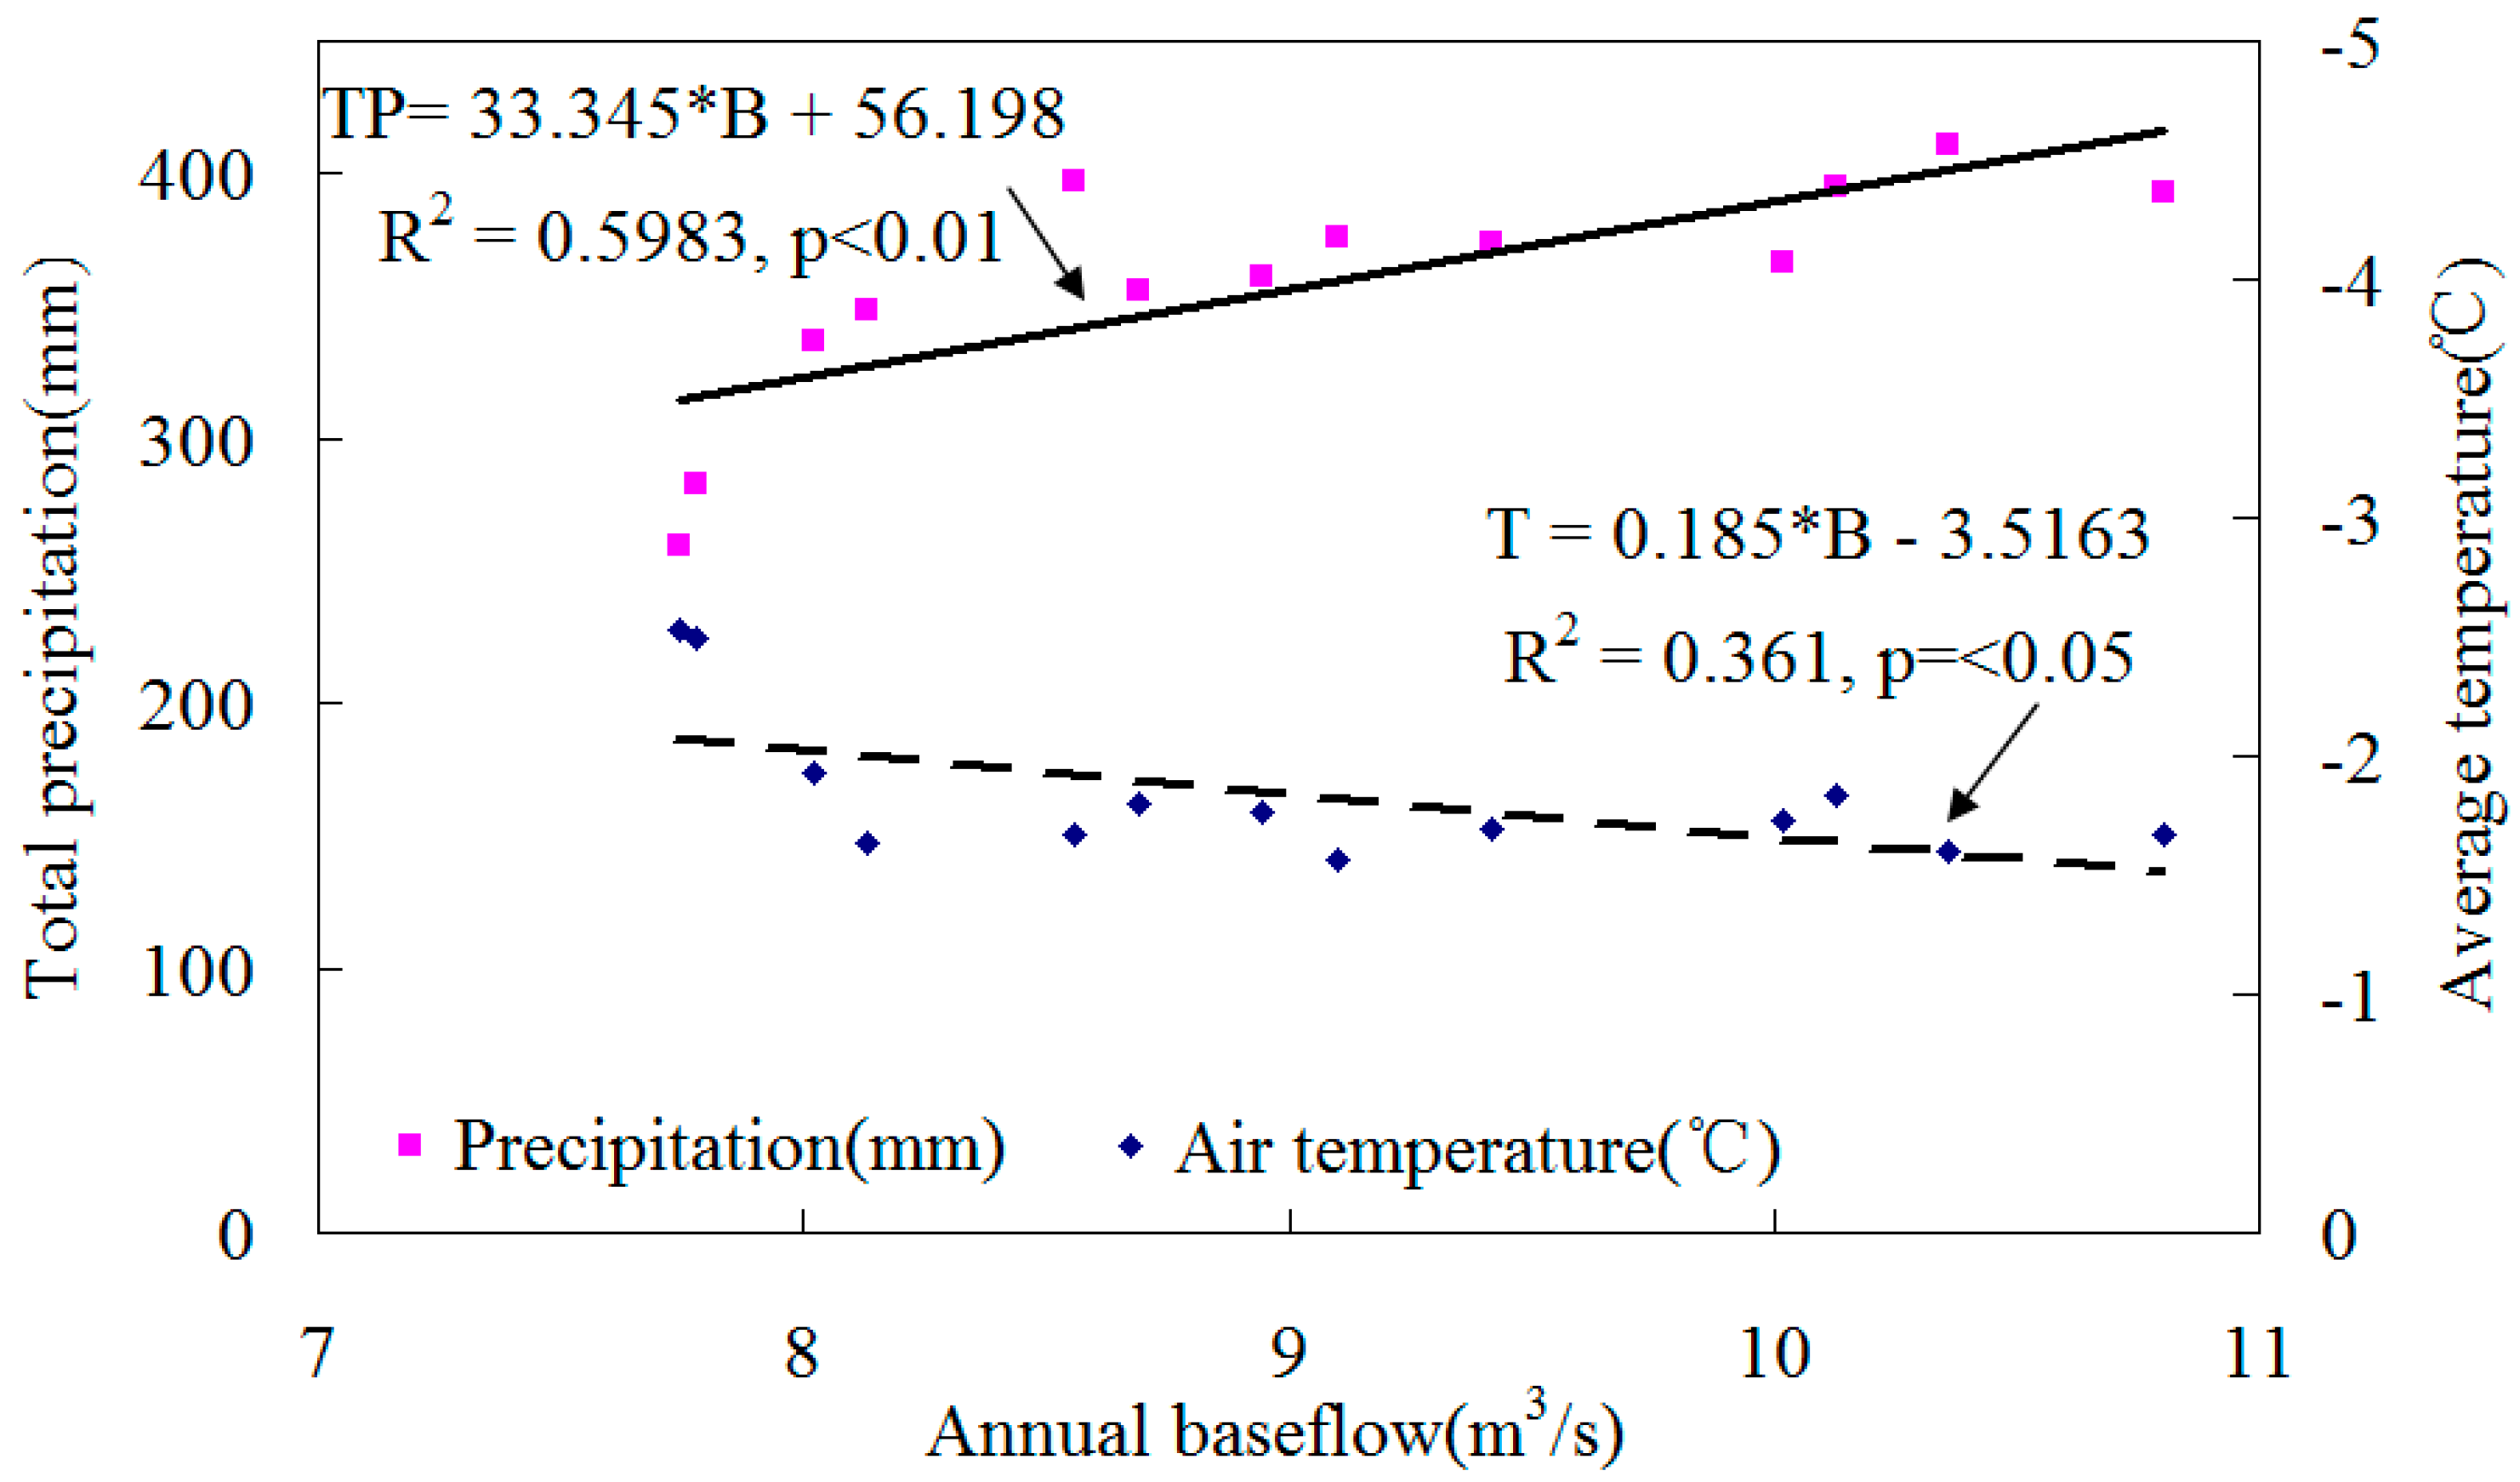
Figure 10.
Monthly precipitation (P) and average temperature (T) plotted against baseflow (B) in the summer/winter half of the year, during 1996–2009.
Figure 10.
Monthly precipitation (P) and average temperature (T) plotted against baseflow (B) in the summer/winter half of the year, during 1996–2009.

Figure 11.
Soil temperature changes at different depths of the permafrost active layer in the study area. Numbers on the lines represent the soil temperature.
Figure 11.
Soil temperature changes at different depths of the permafrost active layer in the study area. Numbers on the lines represent the soil temperature.

Figure 12.
The processes of the VWC at different soil depths, and the basin baseflow during the four freeze-thaw periods.
Figure 12.
The processes of the VWC at different soil depths, and the basin baseflow during the four freeze-thaw periods.
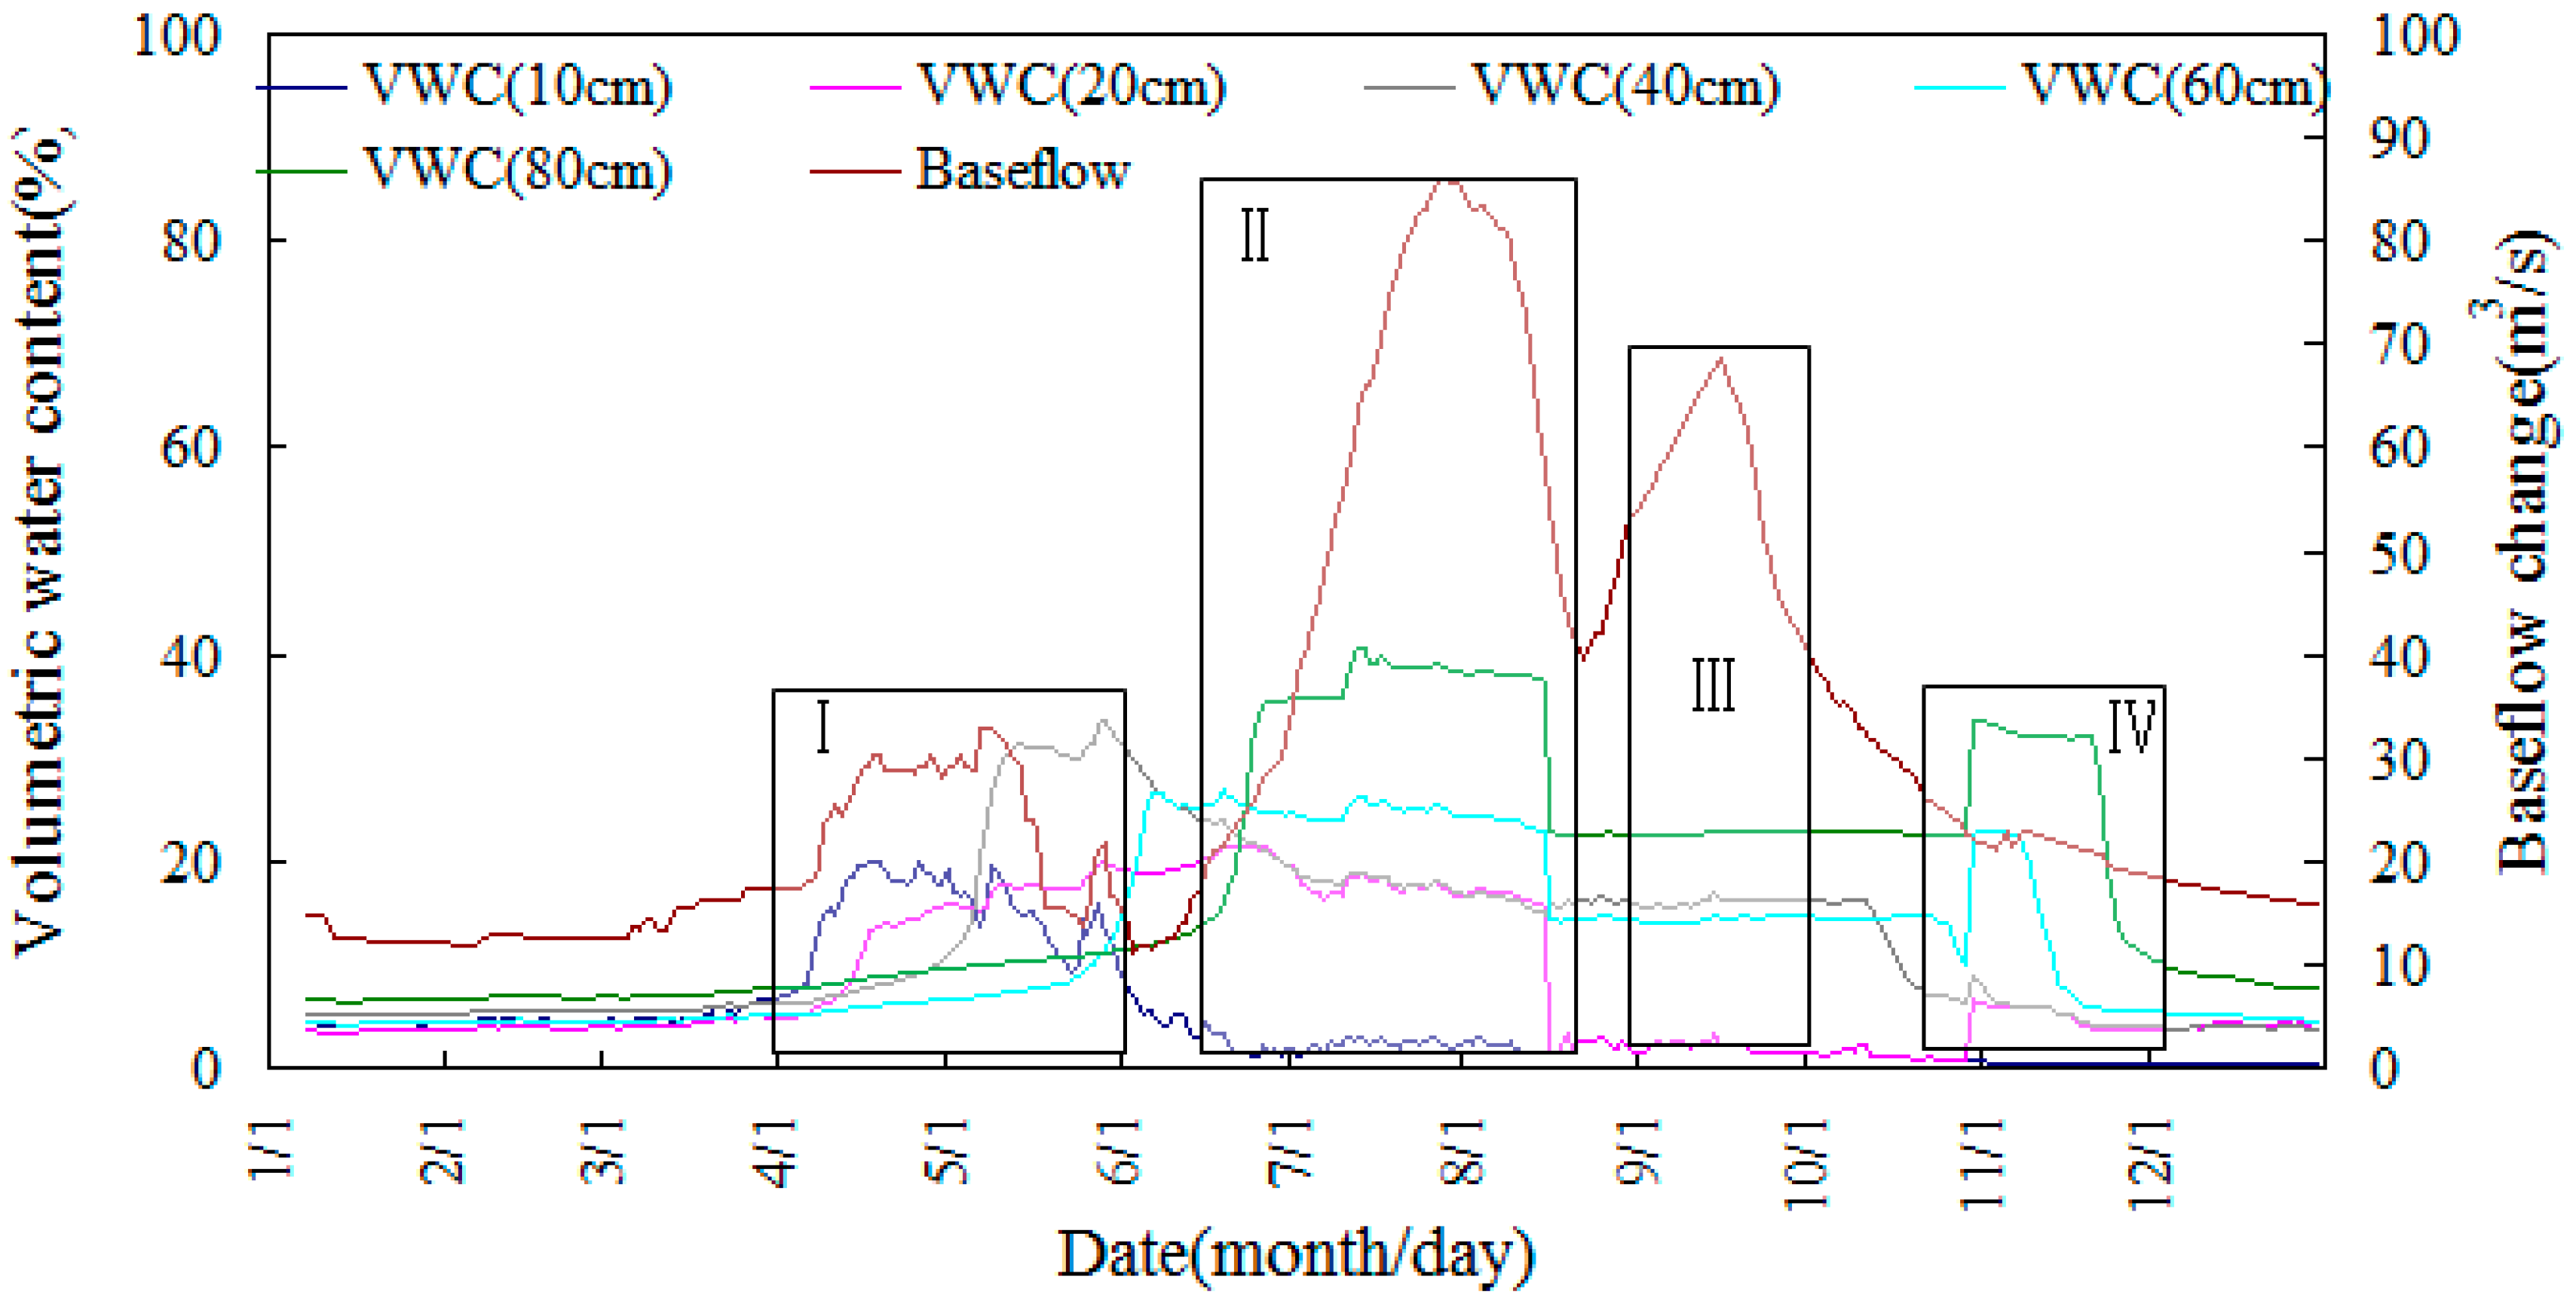
Figure 13.
The precipitation and air temperature changes in the study area.


Table 1.
Simulated daily runoff in the study area during the summer half of the year (S), the winter half of the year (W) and the entire year (E).
Table 1.
Simulated daily runoff in the study area during the summer half of the year (S), the winter half of the year (W) and the entire year (E).
| Periods | NS | PBIAS | R2 |
|---|---|---|---|
| S W E | S W E | S W E | |
| 1996–2002 | 0.73 0.57 0.78 | 6.55 11.41 7.62 | 0.76 0.59 0.80 |
| 2003–2009 | 0.74 0.69 0.80 | 2.83 6.06 3.34 | 0.74 0.72 0.81 |
© 2017 by the authors. Licensee MDPI, Basel, Switzerland. This article is an open access article distributed under the terms and conditions of the Creative Commons Attribution (CC BY) license (http://creativecommons.org/licenses/by/4.0/).
Share and Cite
MDPI and ACS Style
Qin, J.; Ding, Y.; Han, T.; Liu, Y. Identification of the Factors Influencing the Baseflow in the Permafrost Region of the Northeastern Qinghai-Tibet Plateau. Water 2017, 9, 666. https://doi.org/10.3390/w9090666
AMA Style
Qin J, Ding Y, Han T, Liu Y. Identification of the Factors Influencing the Baseflow in the Permafrost Region of the Northeastern Qinghai-Tibet Plateau. Water. 2017; 9(9):666. https://doi.org/10.3390/w9090666
Chicago/Turabian StyleQin, Jia, Yongjian Ding, Tianding Han, and Yuexia Liu. 2017. "Identification of the Factors Influencing the Baseflow in the Permafrost Region of the Northeastern Qinghai-Tibet Plateau" Water 9, no. 9: 666. https://doi.org/10.3390/w9090666
Note that from the first issue of 2016, this journal uses article numbers instead of page numbers. See further details here.