Velocity Distribution and 3D Turbulence Characteristic Analysis for Flow over Water-Worked Rough Bed


1
School of Engineering, Faculty of Engineering and Informatics, University of Bradford, Bradford DB7 1DP, UK
2
State Key Laboratory of Hydroscience and Engineering, Tsinghua University, Beijing 100084, China
3
State Key Laboratory of Plateau Ecology and Agriculture, Qinghai University, Xining 810016, China
4
School of Water Resources and Electric Power, Qinghai University, Xining 810016, China
*
Author to whom correspondence should be addressed.
Water 2017, 9(9), 668; https://doi.org/10.3390/w9090668
Submission received: 31 July 2017
/
Revised: 31 August 2017
/
Accepted: 1 September 2017
/
Published: 8 September 2017
Abstract
:To reproduce the natural flow topography in a laboratory environment, it is crucial to recapture its bed condition in order to ensure the accurate representation. Water-worked bed represents a state-of-the-art experimentally formed bed to imitate the natural-formed channel in most rivers or natural streams. Recently, this technique has been intensively studied through experimental and computational approaches; however, its actual influence towards the near-bed flow as compared to experimentally prepared rough bed in well-packed bedform order are still yet to be investigated deeply. This experimental study systematically investigated and compared the differences in velocity distribution and three-dimensional (3D) turbulence characteristics, including turbulence intensities and Reynolds stresses, between uniform smooth bed, laboratory-prepared rough bed and water-worked bed open channel flows. The flow comparisons were concentrated at near-bed region where clear flow behaviour change can be observed. Through these comparisons, the study inspected the characteristics of water-worked bedform thoroughly, in order to inform future experimental research that tries to reproduce natural stream behaviours.
1. Introduction
The accurate prediction of natural flow characteristics is important to identify natural hazards and their potential impacts to society. To ensure that the condition for natural flow tests conducted at a laboratory environment adequately reflects naturally formed rough bed channel flows, the water-worked sediment bed has been investigated [1,2]. In those experimental studies, static sediment amour layers were established by using the water-worked concept, where the sediment was fed to gradually form amour layers and to fill up the whole water flume bed. The transported materials were fed using a maintained water discharge until its transport rate diminished. This concept can create a non-moving deposited surface topography suitable to represent the natural open channel rough bed, which is usually produced in similar water-worked manner. As suggested by Coleman et al. [3] after studying different forms of rough bed, the bed-form and its roughness can effectively alter the time-averaged spatial velocity and turbulence characteristics, particularly at inner flow region; thus, the water-worked bedform should impact the flow characteristics especially at near-bed flow.
The state-of-the-art water-worked bed technique has been actively studied through both experimental [4] and computational approaches [5]. However, to date there has been a lack of studies that look into comparing the smooth and experimentally arranged well-packed rough bed to the water-worked bed flow’s velocity distribution and turbulence characteristics, which is potentially an important indicator to the key influence of the mimicked natural bed-form to flow. In efforts to compare the well-packed rough and smooth bed flows by Nezu and Rodi [6], Nezu and Nakagawa [7], and Nezu and Azuma [8], the turbulence intensity of the rough bed flow was represented by the similar characteristics as the smooth bed flow, as they were found to be represented by the same exponential formula. This similar characteristic assumption was suggested to be sufficient to represent the studied smooth and rough bed flows in laboratory environment; however, for the natural flow where its bed-form layer is less uniform and more unsorted, the same assumption may not be exactly followed.
The three-dimensional (3D) turbulence characteristics, including the time-averaged turbulence intensity and Reynolds stress, can be produced by the Reynolds decomposition process using the instantaneous flow velocities in streamwise, lateral and vertical directions. To represent velocity distribution of open channel flow, the law of wake suggested by Coles [9] is usually used (improved from the law of wall first suggested by Keulegan [10] for rectangular open channel flow), as it is equipped with a wake correction term to more accurately represent the outer region of the flow velocity distribution. The boundary friction velocity is often used to normalise the turbulence intensity and Reynolds stress, in order to allow universal comparison between different sets of data collected under different hydraulic and bed conditions.
This study compared the near-bed uniform flow turbulence characteristics, including turbulence intensity and Reynolds stress, over smooth, rough and water-worked beds to identify the impact of water-worked bed to the time-averaged spatial flow turbulence characteristics. The investigation also included study of their respective flow velocity distribution profiles, in order to determine the water-worked bed impact to near-bed flow velocity. In addition, the proposed results in this study were compared and validated with findings from literature. Since to date there is a lack of studies that look into the afore-mentioned issue to compare water-worked bed with smooth and experimentally arranged rough bed flows altogether, this study can fill this knowledge void and inform future water-worked bed research.
2. Experimental Description
In this section, the friction velocity, experimental instrumentation (including the hydraulic flume and flow velocimeter used), flow conditions as well as bed boundary conditions are described in detail.
2.1. Friction Velocity
Two common approaches to determine the friction velocity are (refer to detailed study by Biron et al. [11]): (1) the measured Reynolds stress profile’s extrapolation method; and (2) the energy gradient method. These approaches have been proven to reasonably calculate the friction velocity in different bed conditions [12,13], providing that the bed surface layer condition is relatively uniform through streamwise space. Among the methods, the extrapolation approach is heavily dependent on the near-bed Reynolds stress measurements; and for the measuring technique utilised in this study, Acoustic Doppler Velocimetry (ADV), the quality of measured signal-to-noise ratio (SNR) can be sensitive to signal reflections near to the wall region as studied by Yu and Tan [14]. In comparison, the energy gradient method involves the use of basic flow parameters, such as the hydraulic radius and bed slope, hence theoretically it should be more error-resistant in estimating friction velocity as proven in Pu et al. [5] and Pu [15]. Thus, the energy gradient method was utilised in this study.
2.2. Experimental Instrumentations
The utilised flume has dimensions of 12 m × 0.50 m × 0.45 m, and is located in the Hydraulic Laboratory at the University of Bradford, UK (for details, refer to studies by Pu and Shao [16], and Pu et al. [5]). The flume functions with a recirculation flow system, in which the outlet water discharges into an end-channel tank then pumps back into the flume to be re-used. The flume has been built by smooth glass walls and stainless-steel base. A flat tilting gate is located at the end of the channel to control both flow elevation and velocity in the flume.
Two parallel tracks are located at the top of the flume to attach and hold measurement trolleys used to secure the utilised ADV and Vernier water gauge measuring equipment in the intended measuring position. The ADV used is equipped with down-looking probes, which is a product of the Nortek Ltd. (Vectrino ADV). It is also equipped with the four-probe receiver, which can significantly reduce the noise signal of collected measurements as compared to the three-probe receiver ADV, discussed in Blanckaert and Lemmin [17].
As a manufacturing feature, the ADV has a measuring limitation of 5 cm distance downward from the probe location, which restricts the data collection at 5 cm vertical distance near to the water-free surface. However, in our open channel flow application, the key focus is on the data collection at near-bed flow region with ratio for the vertical distance to water flow depth (z/δ) of less than 0.4; hence, the aforementioned ADV restriction has no measurement impact to the present study. Also, the velocity-signals checking method is embedded into the Vectrino ADV for its data post-processing, in order to remove signal errors.
2.3. Experimental Conditions
In Table 1, a summary has been presented to outline all the experimental setups for the smooth, rough and water-worked bed uniform flows tested in this experimental study. To ensure that the fully developed uniform flow has been generated, this experimental study adopts the strategy to measure separate velocity distribution profiles at 3, 5, 6, 7 and 10 m to confirm the uniform flow characteristic. After comparing those separate profiles, all of them recorded almost identical velocity distribution characteristic (including their profile patterns and depth-averaged velocity values), suggesting the self-similarity nature of the fully developed uniform flow. Due to the similar nature of their profiles, the mid-stream 6 m profile has been used to represent all uniform flow profiles at different locations.
The velocity point measurements have been recorded at multiple vertical positions to establish full flow profile within the studied near-bed flow region. At each ADV sampling point, the minimum allowable sampling volume is 1 mm3. In this study, this minimum volume has been adopted for its measurements; however, for the measuring point with low SNR ratio, this sampling volume was increased to improve the sampling point accuracy. All point measurements have been conducted at a frequency of 100 Hz for 5 min of sampling duration.
2.4. Rough and Water-Worked Beds Forming
The water-worked bed in this study was gradually formed by using various static amour layers of sediment. The process started with feeding of sediment into upstream of the flume at a constant rate of 280 g/s. A conveyor system was utilised upstream of the flume to release sediment by the designed uniform rate. During the whole process of sediment amour layers forming, the water flow was maintained at a uniform 100 mm of depth with a discharge of 40.5 L/s. The whole water-worked bed forming process took days of continuous flush stream, and the bed was determined to be in non-moving condition when the average bed change throughout the whole channel was less than 0.2 d50. The sediment release rate, which was calculated using the Meyer-Peter–Muller formula, was designed to allow the sediment bed to achieve a static condition through-flow flushing where the critical shear stress of sediment is used as the guide for its threshold motion.
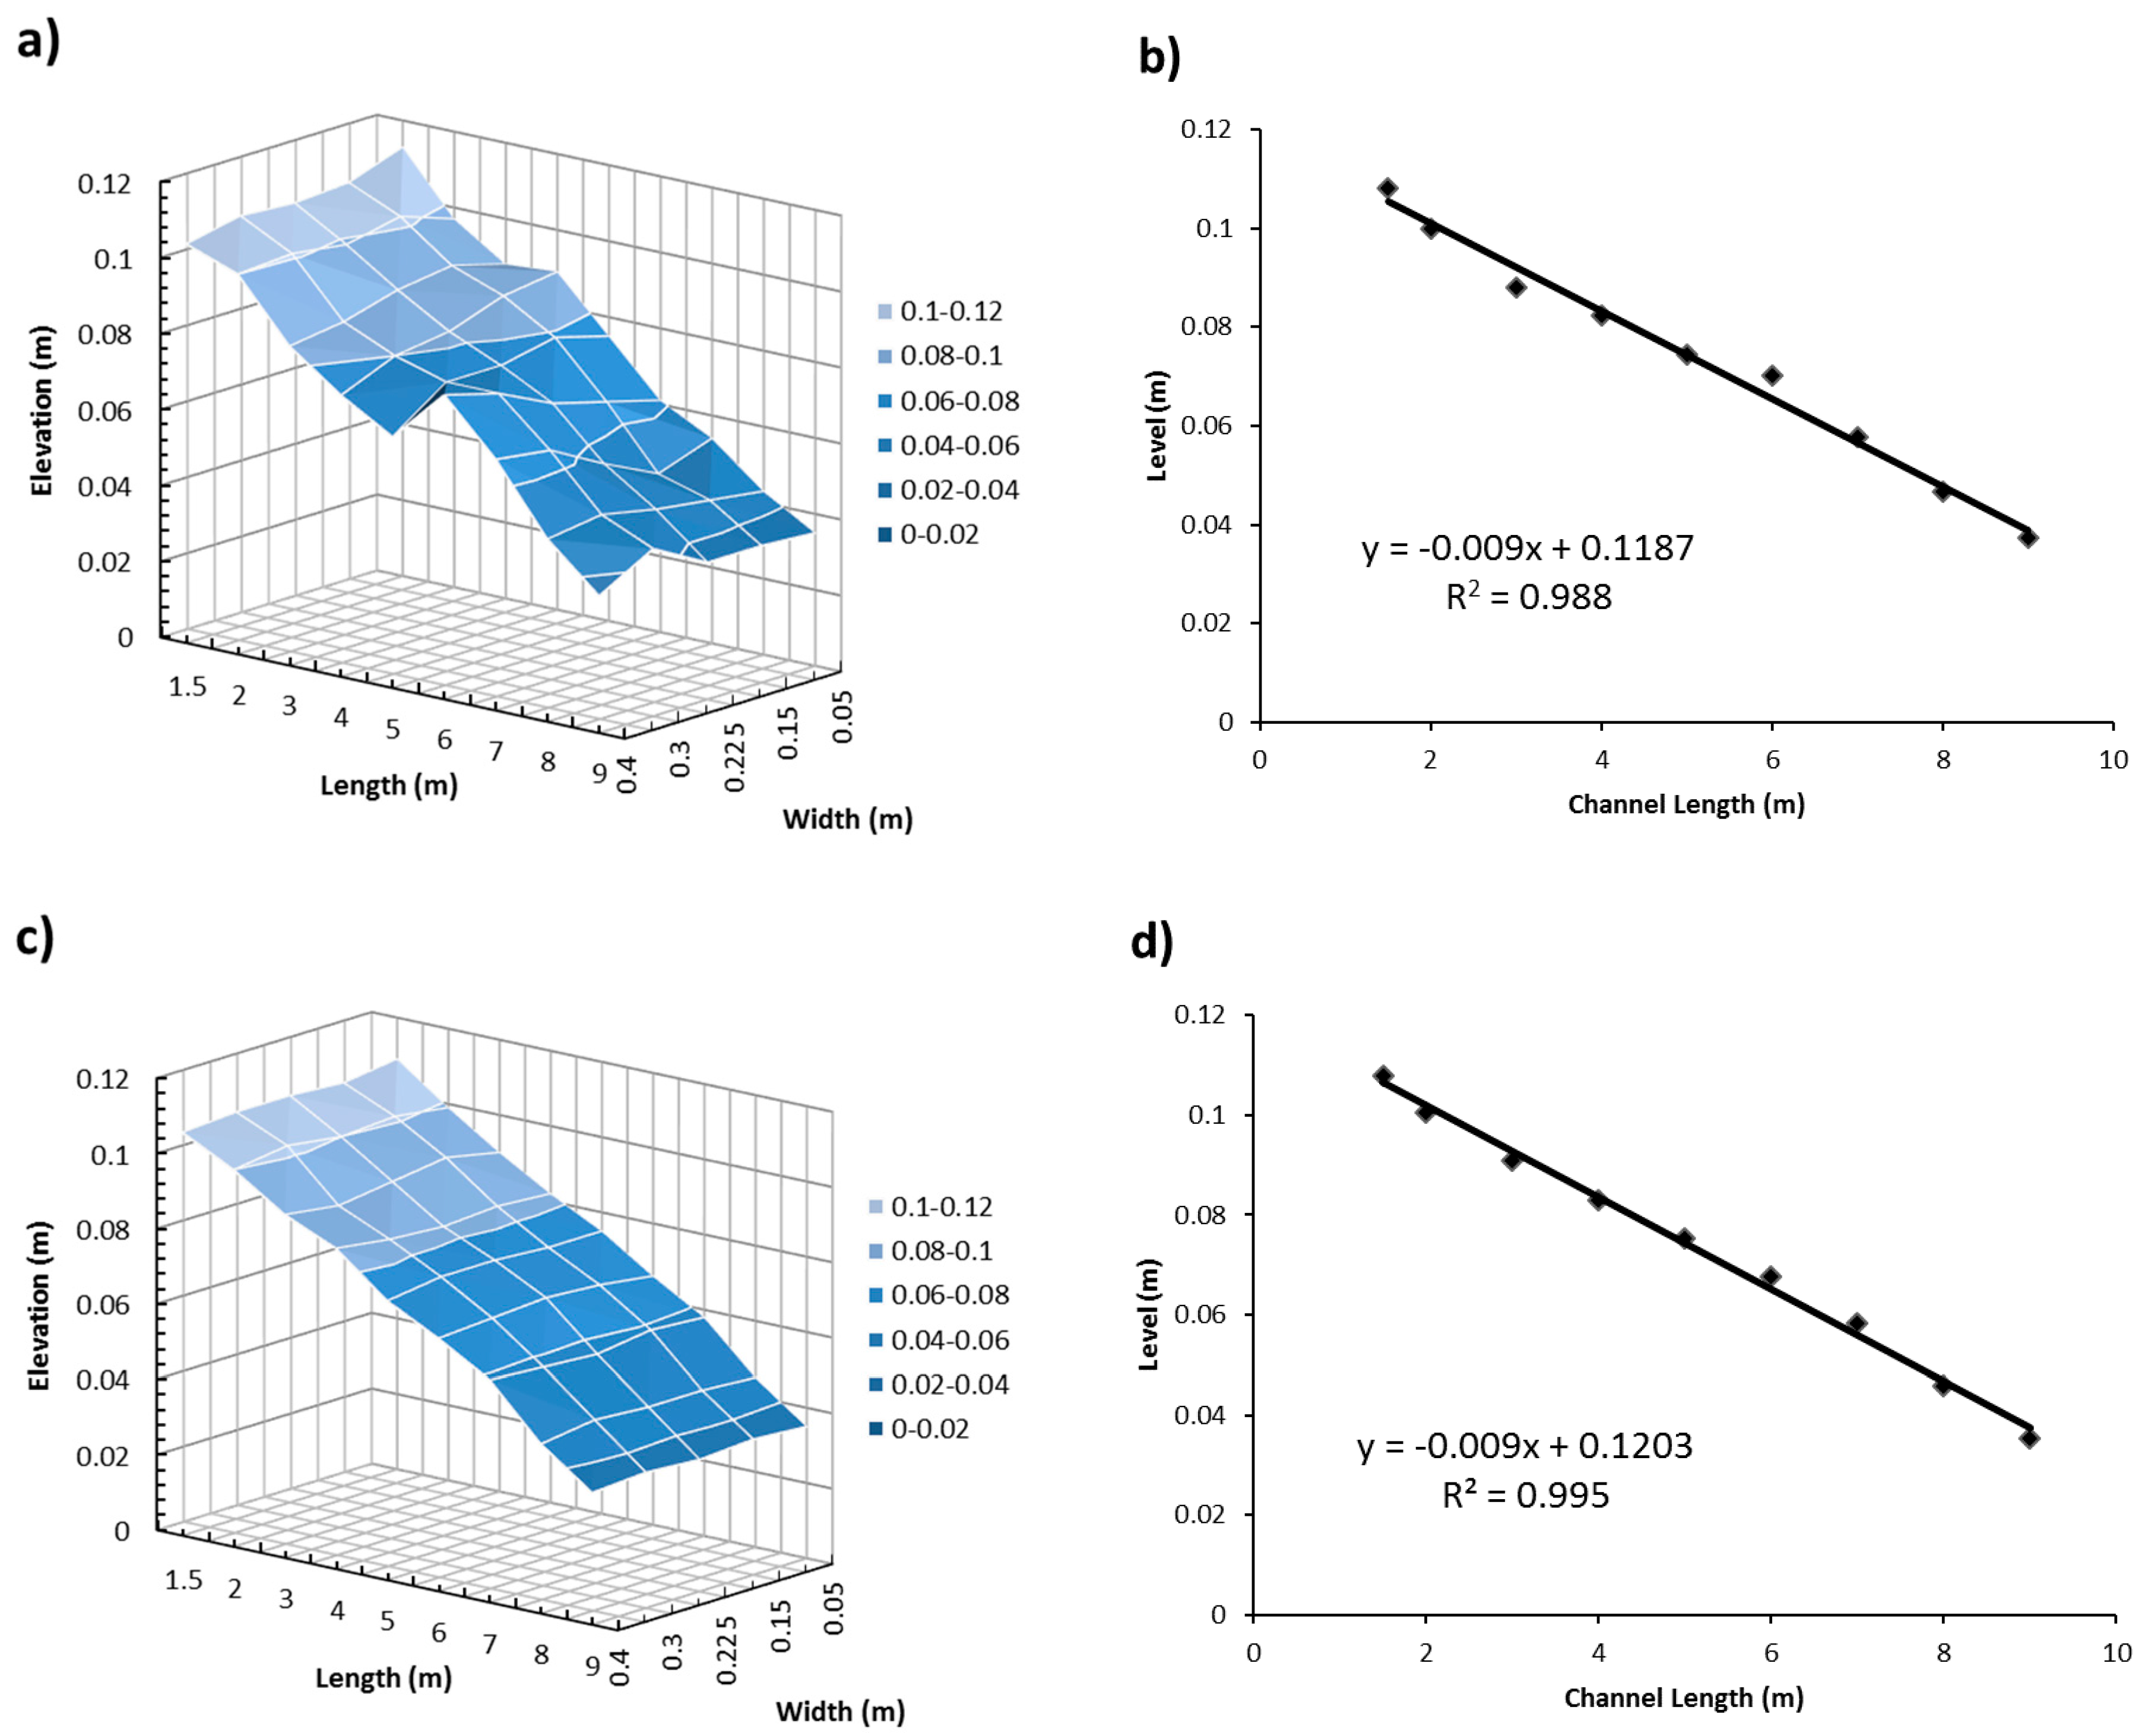
After the bed feeding was completed and the static sediment layers fully established, the sediment bed elevation was measured from a distance of 1.5 m from the upstream end to 3.0 m from the downstream end across a width of 0.05 m to 0.40 m (refer to Figure 1a). From Figure 1b, it can be observed that the width-averaged bed elevation formed a relatively steady sediment slope of 9.0 × 10⁻³ (with a regression coefficient R2 of 0.988). Beds with the same slope and materials were also experimentally arranged to test the well-packed bedform as shown in Figure 1c,d. Comparing the water-worked and experimentally prepared beds in Figure 1, we could observe that the water-worked concept creates a much uneven bedform; even though both beds showed relatively smooth slope (with regression coefficients R2 of 0.988 and 0.995, respectively). The bed materials used were natural river gravels with the grain sizes of d16 = 3.81 mm, d50 = 6.62 mm and d84 = 7.94 mm and density of 2823.8 kg/m3. d50 was used in this study to representatively determine the Nikuradse’s equivalent roughness ks as suggested by Dey and Raikar [13] using flow tests from different gravel sizes. Figure 2 shows the comparative bed conditions of water-worked rough bed (Figure 2a) and arranged rough bed (Figure 2b). Since the same flow condition was tested on these rough beds, the static bed condition was also consistently maintained for the rough bed flow test.
3. Velocity Profile
To understand the influence of smooth, rough and water-worked beds on flow, their uniform flow velocity profiles were used for comparison. In this study, in order to show the flow phenomenon to compare those bedforms, the flows up to region z/δ = 0.4 were recorded. This measured depth can effectively capture the inner flow at near-bed region (z/δ < 0.2) plus the measured profile up to where each flow on different beds fully establishes its velocity distribution identity as compared to the law of wake (0.2 < z/δ < 0.4). For all the measured data, the lowest near-wall measurements were designed to start from 1 mm position above the wall and at least 6–7 point measurements were taken within the inner flow region; these could ensure the full representation of near-bed flow characteristics.
In this study, the normalised flow velocity profile can be represented by the law of wake as:
where , , , is flow velocity at z distance, = friction velocity, z = vertical elevation, zo = flow reference vertical displacement elevation from rough bed crest, and ν = kinematic viscosity. zo used in this study followed a model suggested in van Rijn [18] and Dey and Raikar [13], and it was assumed to be equivalent to 0.25 ks below the top particle bed. The first two expressions on the right-hand side of Equations (1) and (2) provide the law of wall function, and the inclusion of the last item on the right-hand side represents the wake function to the log law. Utilising the full law of wake, Equations (1) and (2) can effectively calculate the law of wall’s function at inner flow region and law of wake’s function at outer flow region; hence, it is employed in this study.
In previous studies, relatively consistent values have been proposed for the von Karman constant κ. A range of 0.40–0.42 for κ was suggested for the smooth bed flows reported in Coles [9] and Cardoso et al. [19]; whereas, κ ≈ 0.40 was proposed for the rough bed flow investigated by Song et al. [20]. In recent investigation, a universal κ ≈ 0.41 ± 5% was proposed by Auel et al. [21] for both smooth and rough bed flows after reviewing works from different studies. For log law integration constant Br in Equations (1) and (2), it was proposed as Br ≈ 4.90 for smooth bed uniform flows in both Mellor and Gibson [22], and Anwar and Atkins [23]; and Br ≈ 5.10 in Coles [9], and Cardoso et al. [19]. On the other hand, in rough bed uniform flow studies, Br was found to be 8.47 ± 0.90 by Kironoto and Graf [24], 8.42 ± 0.22 by Song et al. [20], and 7.80 ± 0.37 by Dey and Raikar [13]. In comparison of different literature studies, the rough bed flow showed higher Br value than the smooth bed flow, due to their different basics of log law integration using and , respectively.
In the studies of the wake parameter, П, different estimates were given to the smooth bed uniform flow, in which higher value has been proposed by Nezu and Rodi [6]: П = 0.20; and lower values by Kirkgoz [25]: П = 0.10, Steffer et al. [26]: П = 0.08~0.15, and Cardoso et al. [19]: П = 0.079 ± 0.093. Π was found in the uniform rough bed flows to be 0.09 by Kironoto and Graf [24], 0.08 by Song et al. [20], and 0.110 ± 0.026 by Dey and Raikar [13]. Comparing various studies discussed above, Π shows no distinct value for flows with different bed roughness conditions.
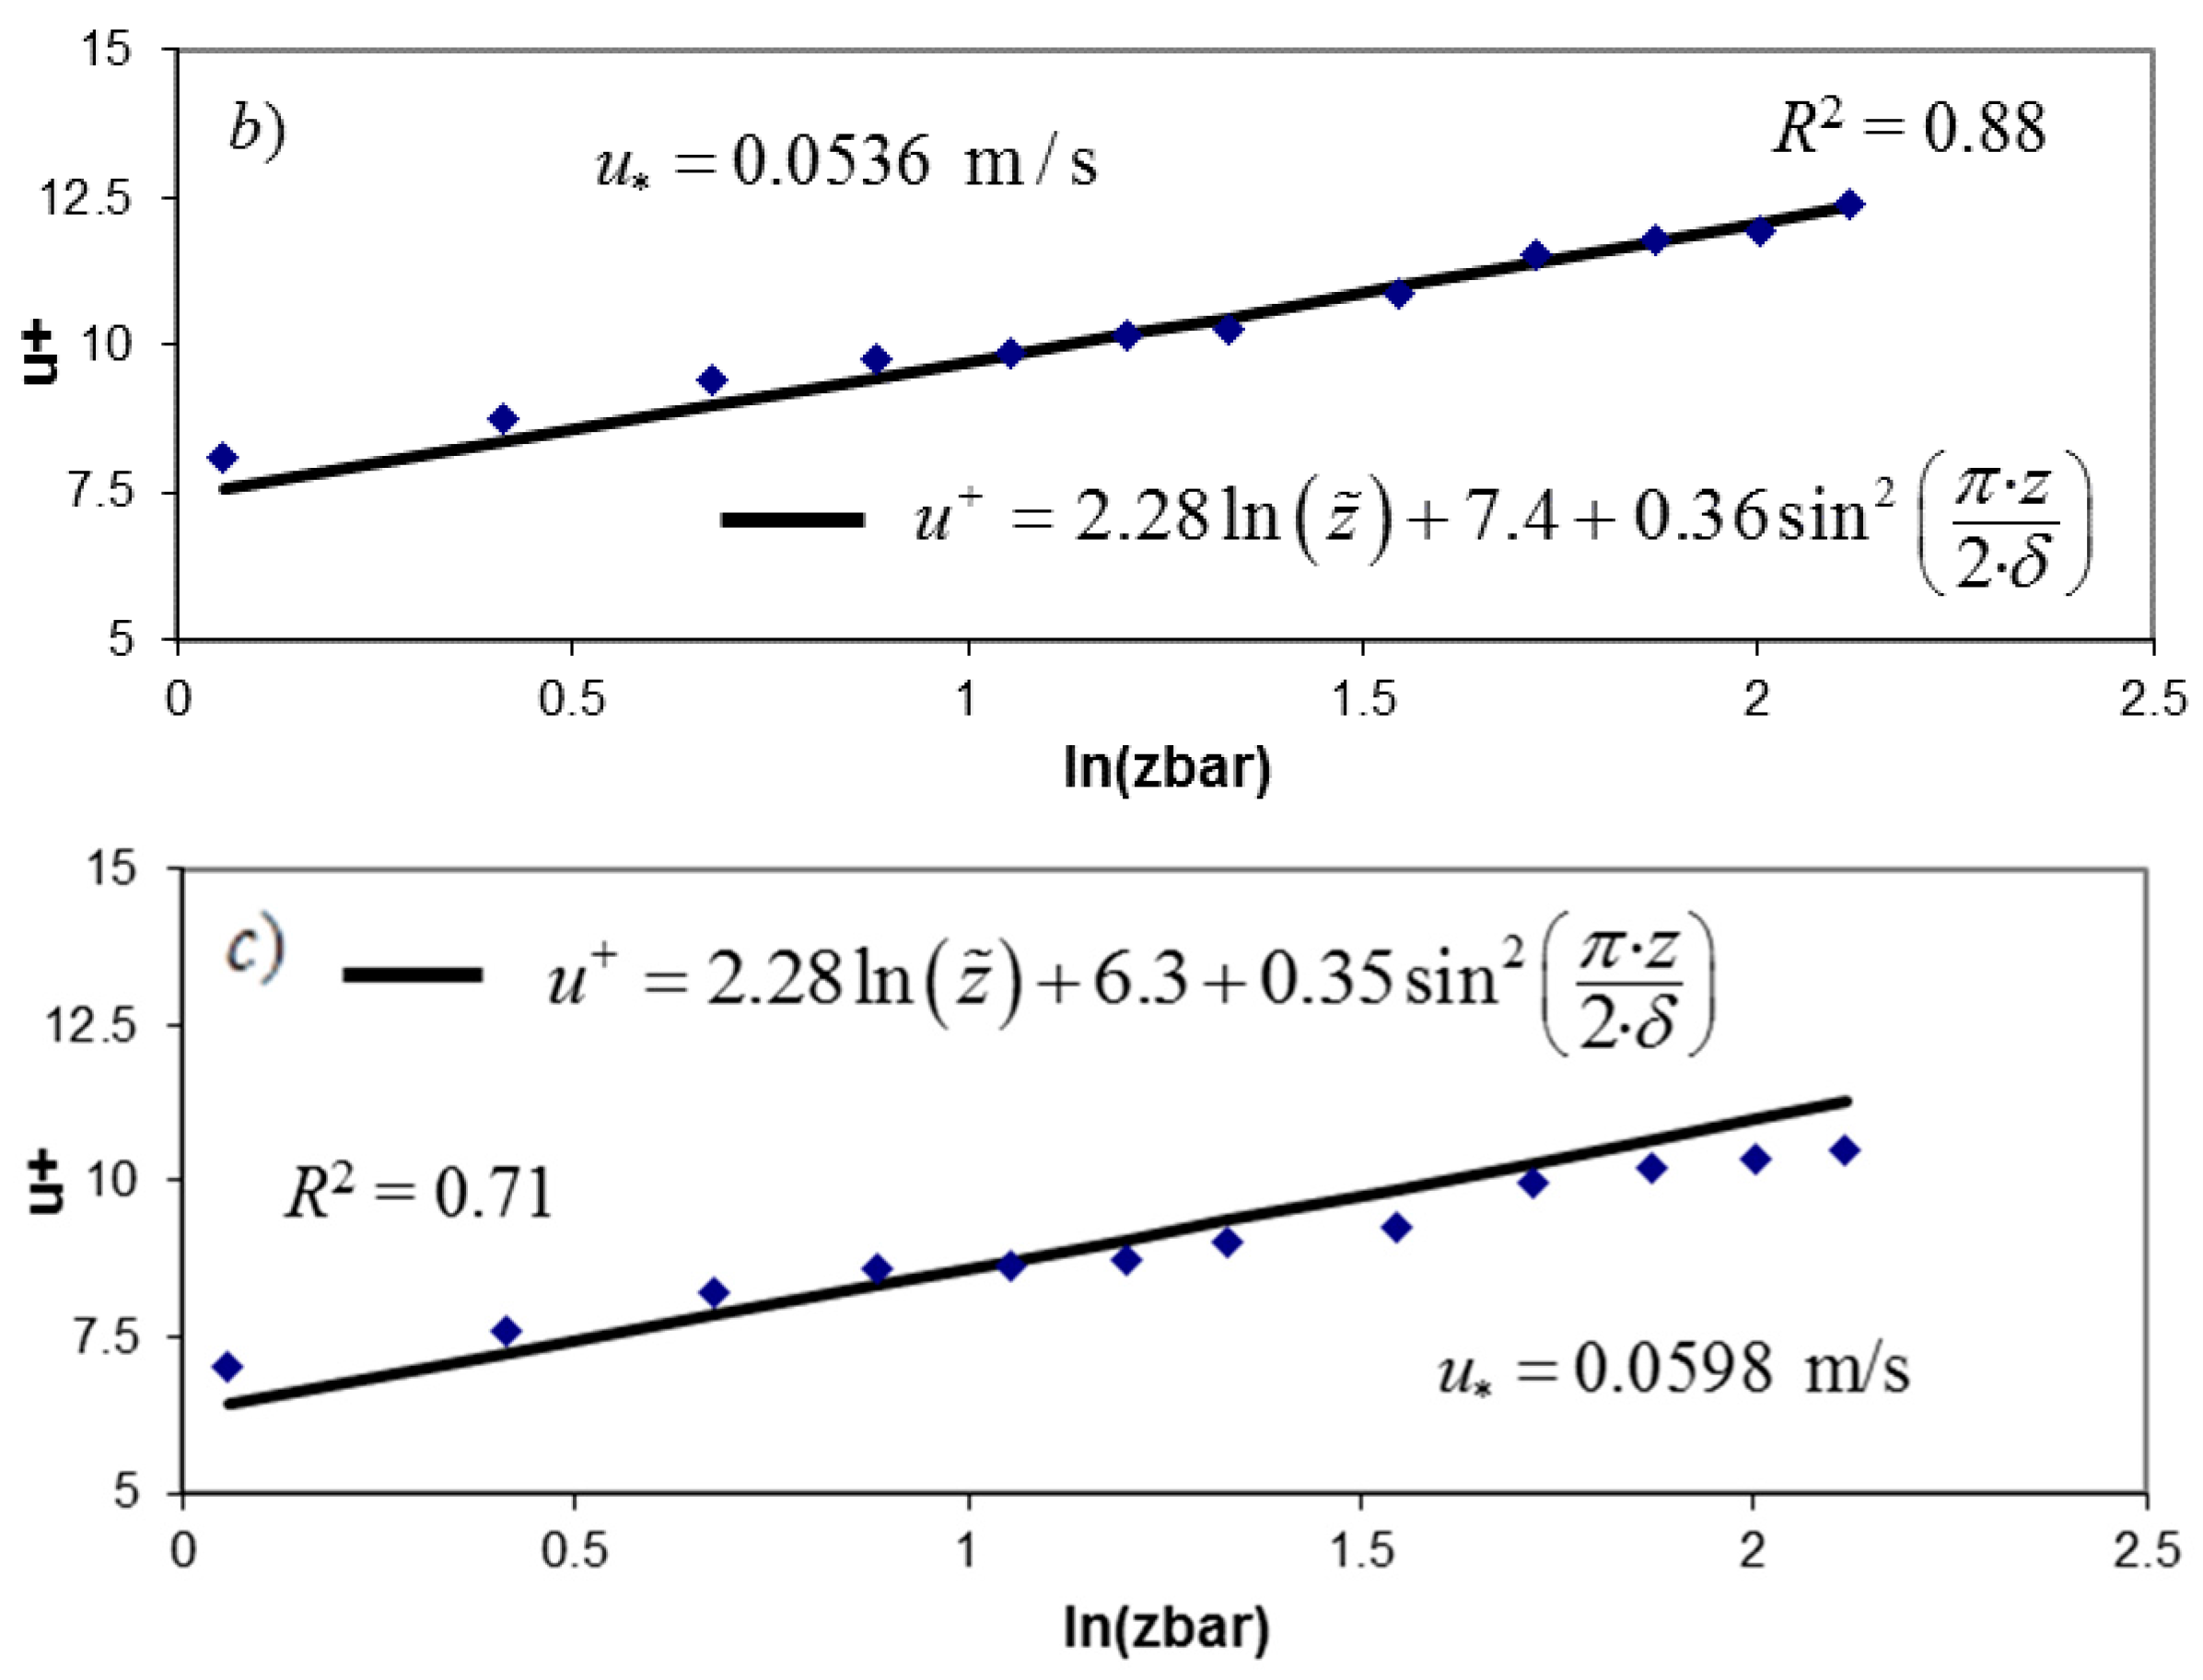
Figure 3a–c present the u+ distribution profile for Tests 1–3, respectively, and they are used to empirically calculate κ, Br and П constants found in Equations (1) and (2). These constants are also compared against the proposed values from the literature. The friction velocity in this test is obtained using the bed shear stress computed from the uniform flow’s zero pressure gradient approach, i.e., at Equation (3). The calculated u* of each test are presented at Table 1. In this study, separate velocity profiles were measured for all smooth, rough and water-worked bed flow tests along the channel at five different locations (3 to 10 m from the flume inlet). In each test, their profiles at different locations coincide with each other, which has confirmed the self-similarity of the fully developed uniform flow.
where g is the gravitational acceleration, R is the hydraulic radius, and So is the bed slope. In Figure 3a, the smooth bed flow measurements show the values of κ, Br and П constants to be 0.43, 4.7 and 0.0754, respectively. These parameters are found to be consistent with most of the other smooth bed uniform flow studies discussed above; however, κ = 0.43 is found to be at the higher end of κ range suggested in the review study by Auel et al. [21]. On the other hand, Figure 3b,c are used to calculate the empirical constants for the rough bed flow (κ = 0.44, Br = 7.4, and П = 0.0792) and for the water-worked bed flow (κ = 0.44, Br = 6.3, and П = 0.0767). The smooth bed flow κ and П have presented consistent values with those of the rough and water-worked bed flows. However, both water-worked and rough bed flows report higher Br value than the smooth bed flow. Our measured Br values for the rough and water-worked bed flows show distinct difference with each other (Br = 7.4 for rough bed flow; and Br = 6.3 for water-worked bed flow), in which Br value for rough bed flow shows closer resemblance to literature findings (i.e., Br = 7.80 ± 0.37 by Dey and Raikar [13]). Interestingly, Br = 6.3 for water-worked bed flow is lower than most reported values in the laboratory-prepared rough bed uniform flow literatures (i.e., Br = 8.47 ± 0.90 by Kironoto and Graf [24], 8.42 ± 0.22 by Song et al. [20], and 7.80 ± 0.37 by Dey and Raikar [13]). This suggests that the water-worked bed has clear influence on the magnitude of the velocity profile at the near-bed flow region, as Br in Equation (2) can control the order of magnitude for the whole law of wake. Due to the dissimilar basics of log law integration for Equations (1) and (2), i.e., using the basics of and , the log law integration constant Br values for smooth and rough beds (including experimentally arranged rough and water-worked beds) cannot be consistently linked to each other. The general trend of their comparison shows that the smooth bed flow’s Br is smaller than those of the rough bed flows. Comparison of the wake parameter also reveals that the water-worked bed has not altered П in velocity profile compared to other flow tests, which shows its insignificant influence on the wake function that mainly governs the profile at outer flow region (at z/δ > 0.2), and this finding is also agreed by the study of Pu [27] on different smooth and rough bed flows.
4. Turbulence Characteristics
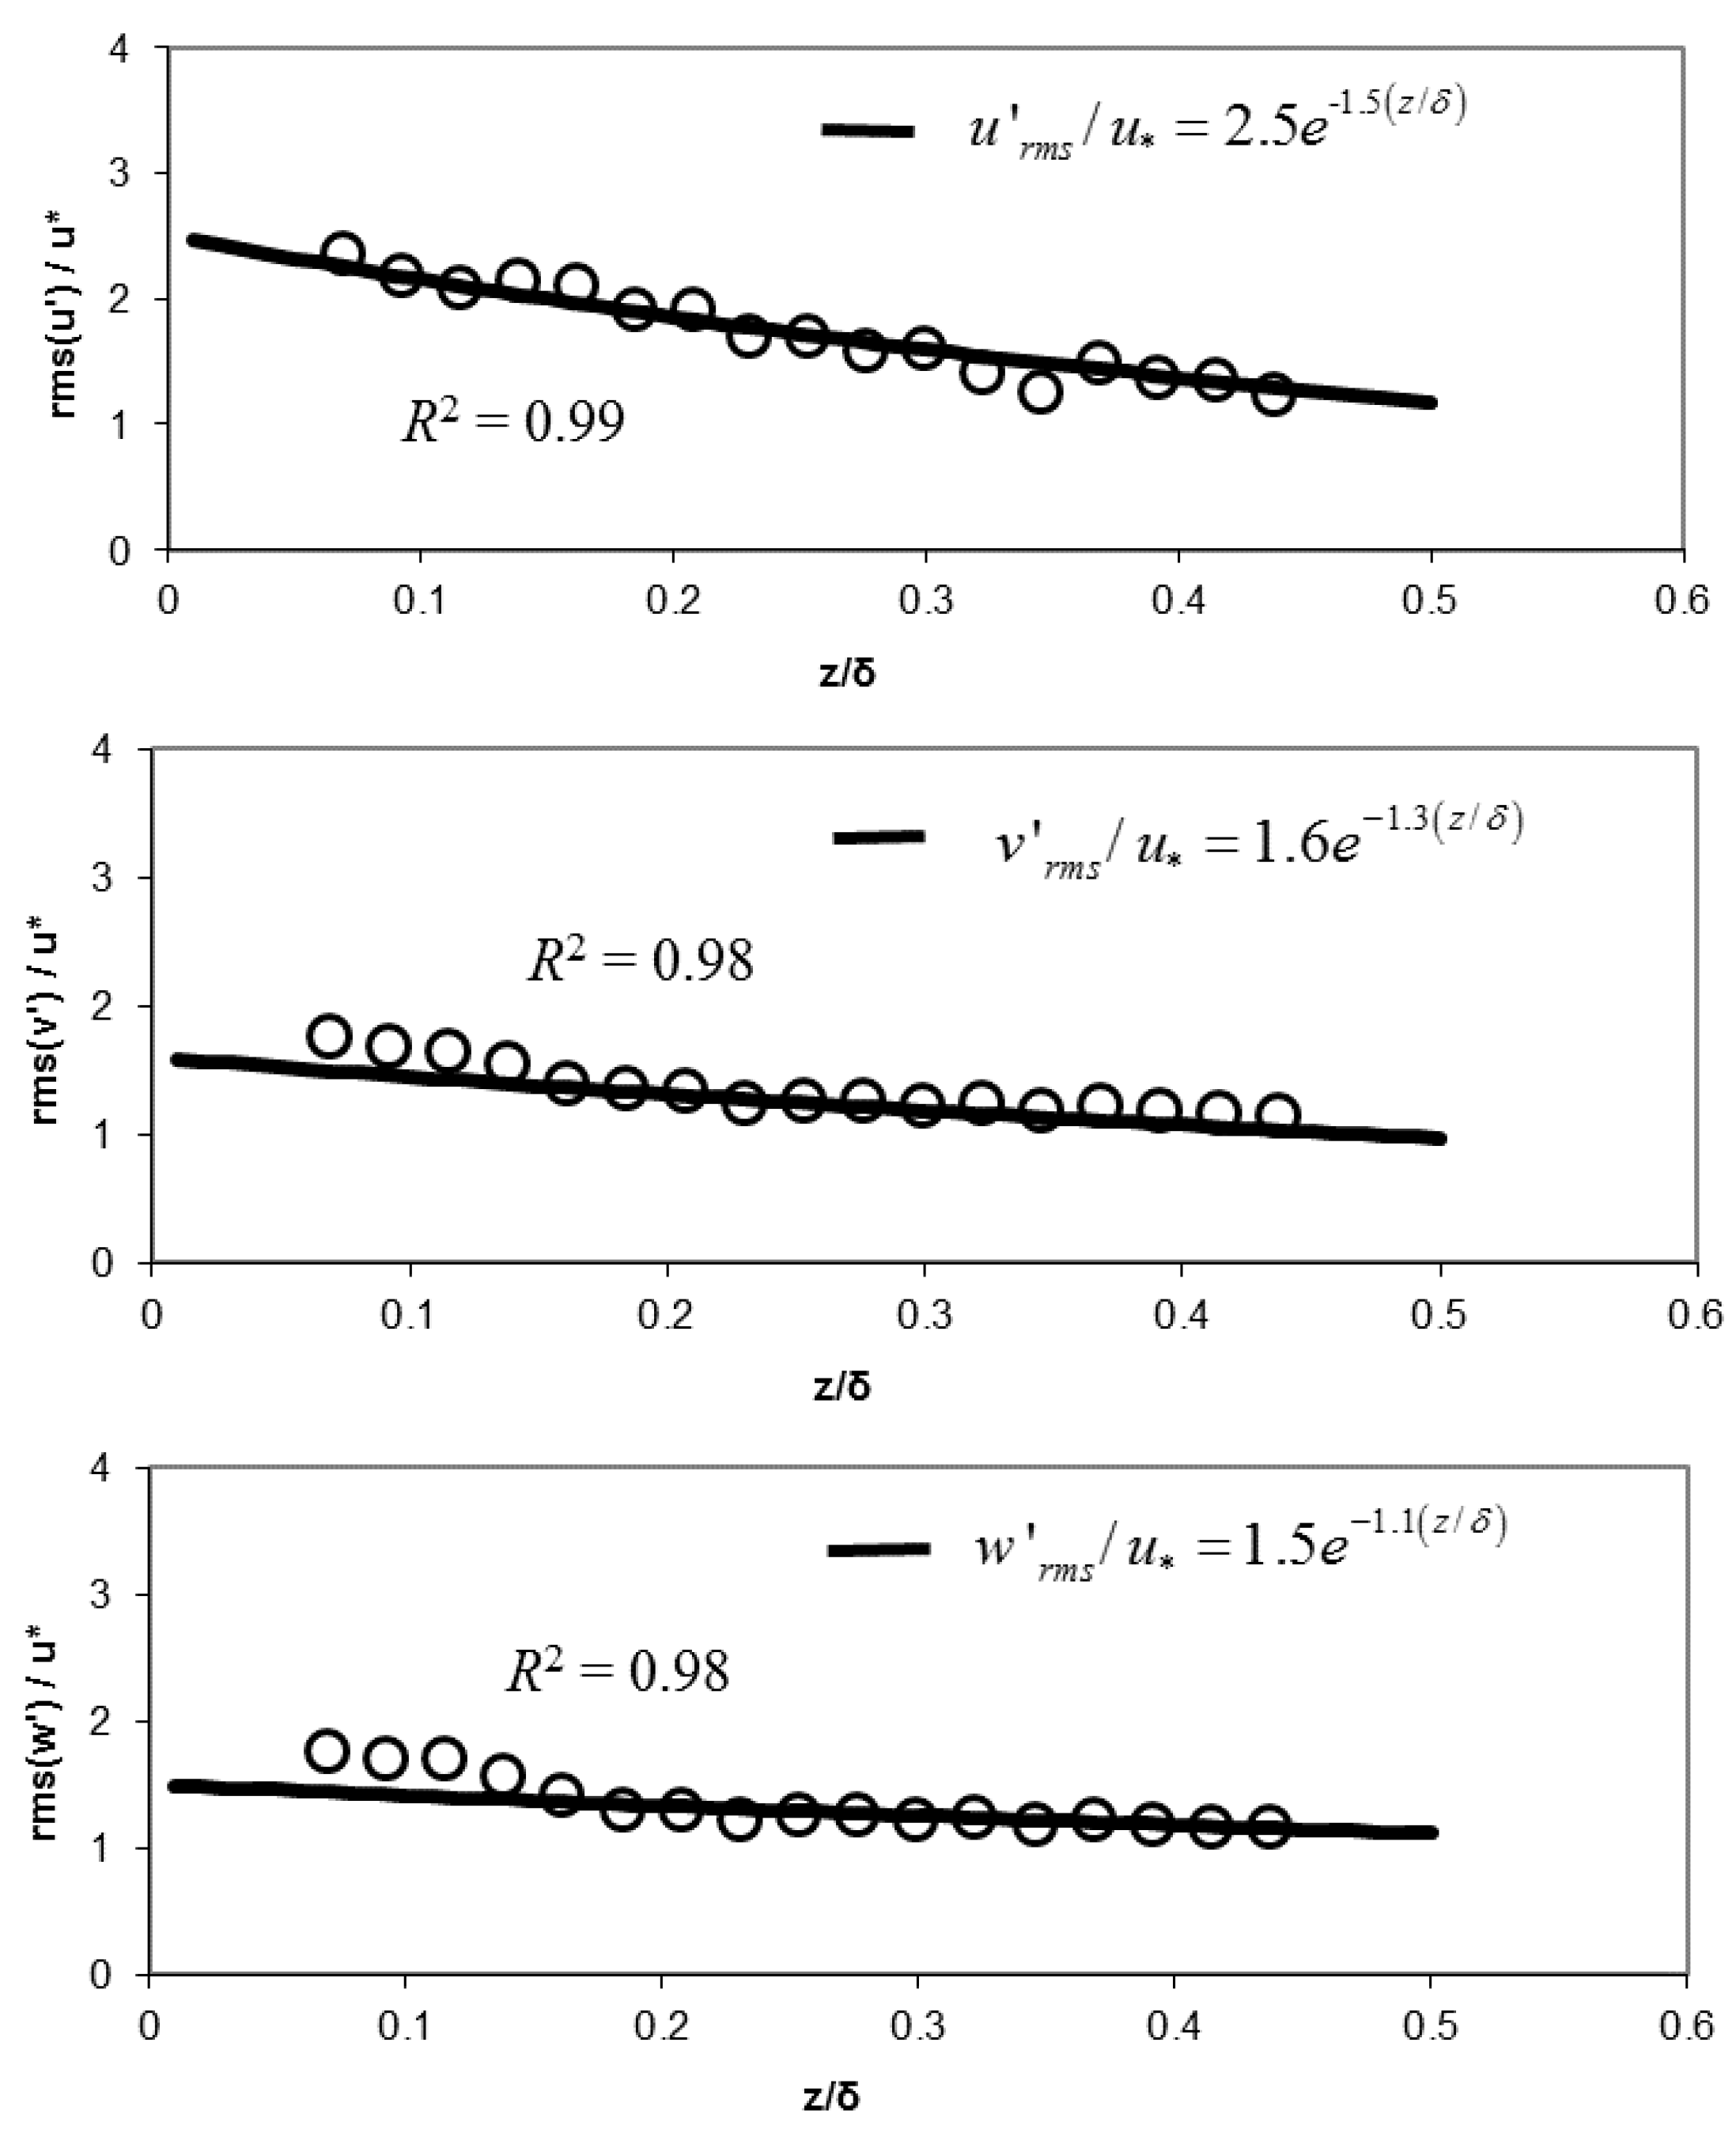
In order to carry out the turbulence characteristic analysis, the 3D turbulence intensities of all smooth, rough and water-worked bed flow tests were investigated. This study uses the well-known finding of Nezu [28] to express the 3D turbulence intensities in exponential form as follows:
where u’, v’ and w’ are the 3D velocity fluctuations in streamwise, transverse and vertical directions, respectively, and D1, D2, D3, λ1, λ2 and λ3 are all empirical constants for turbulence intensities.
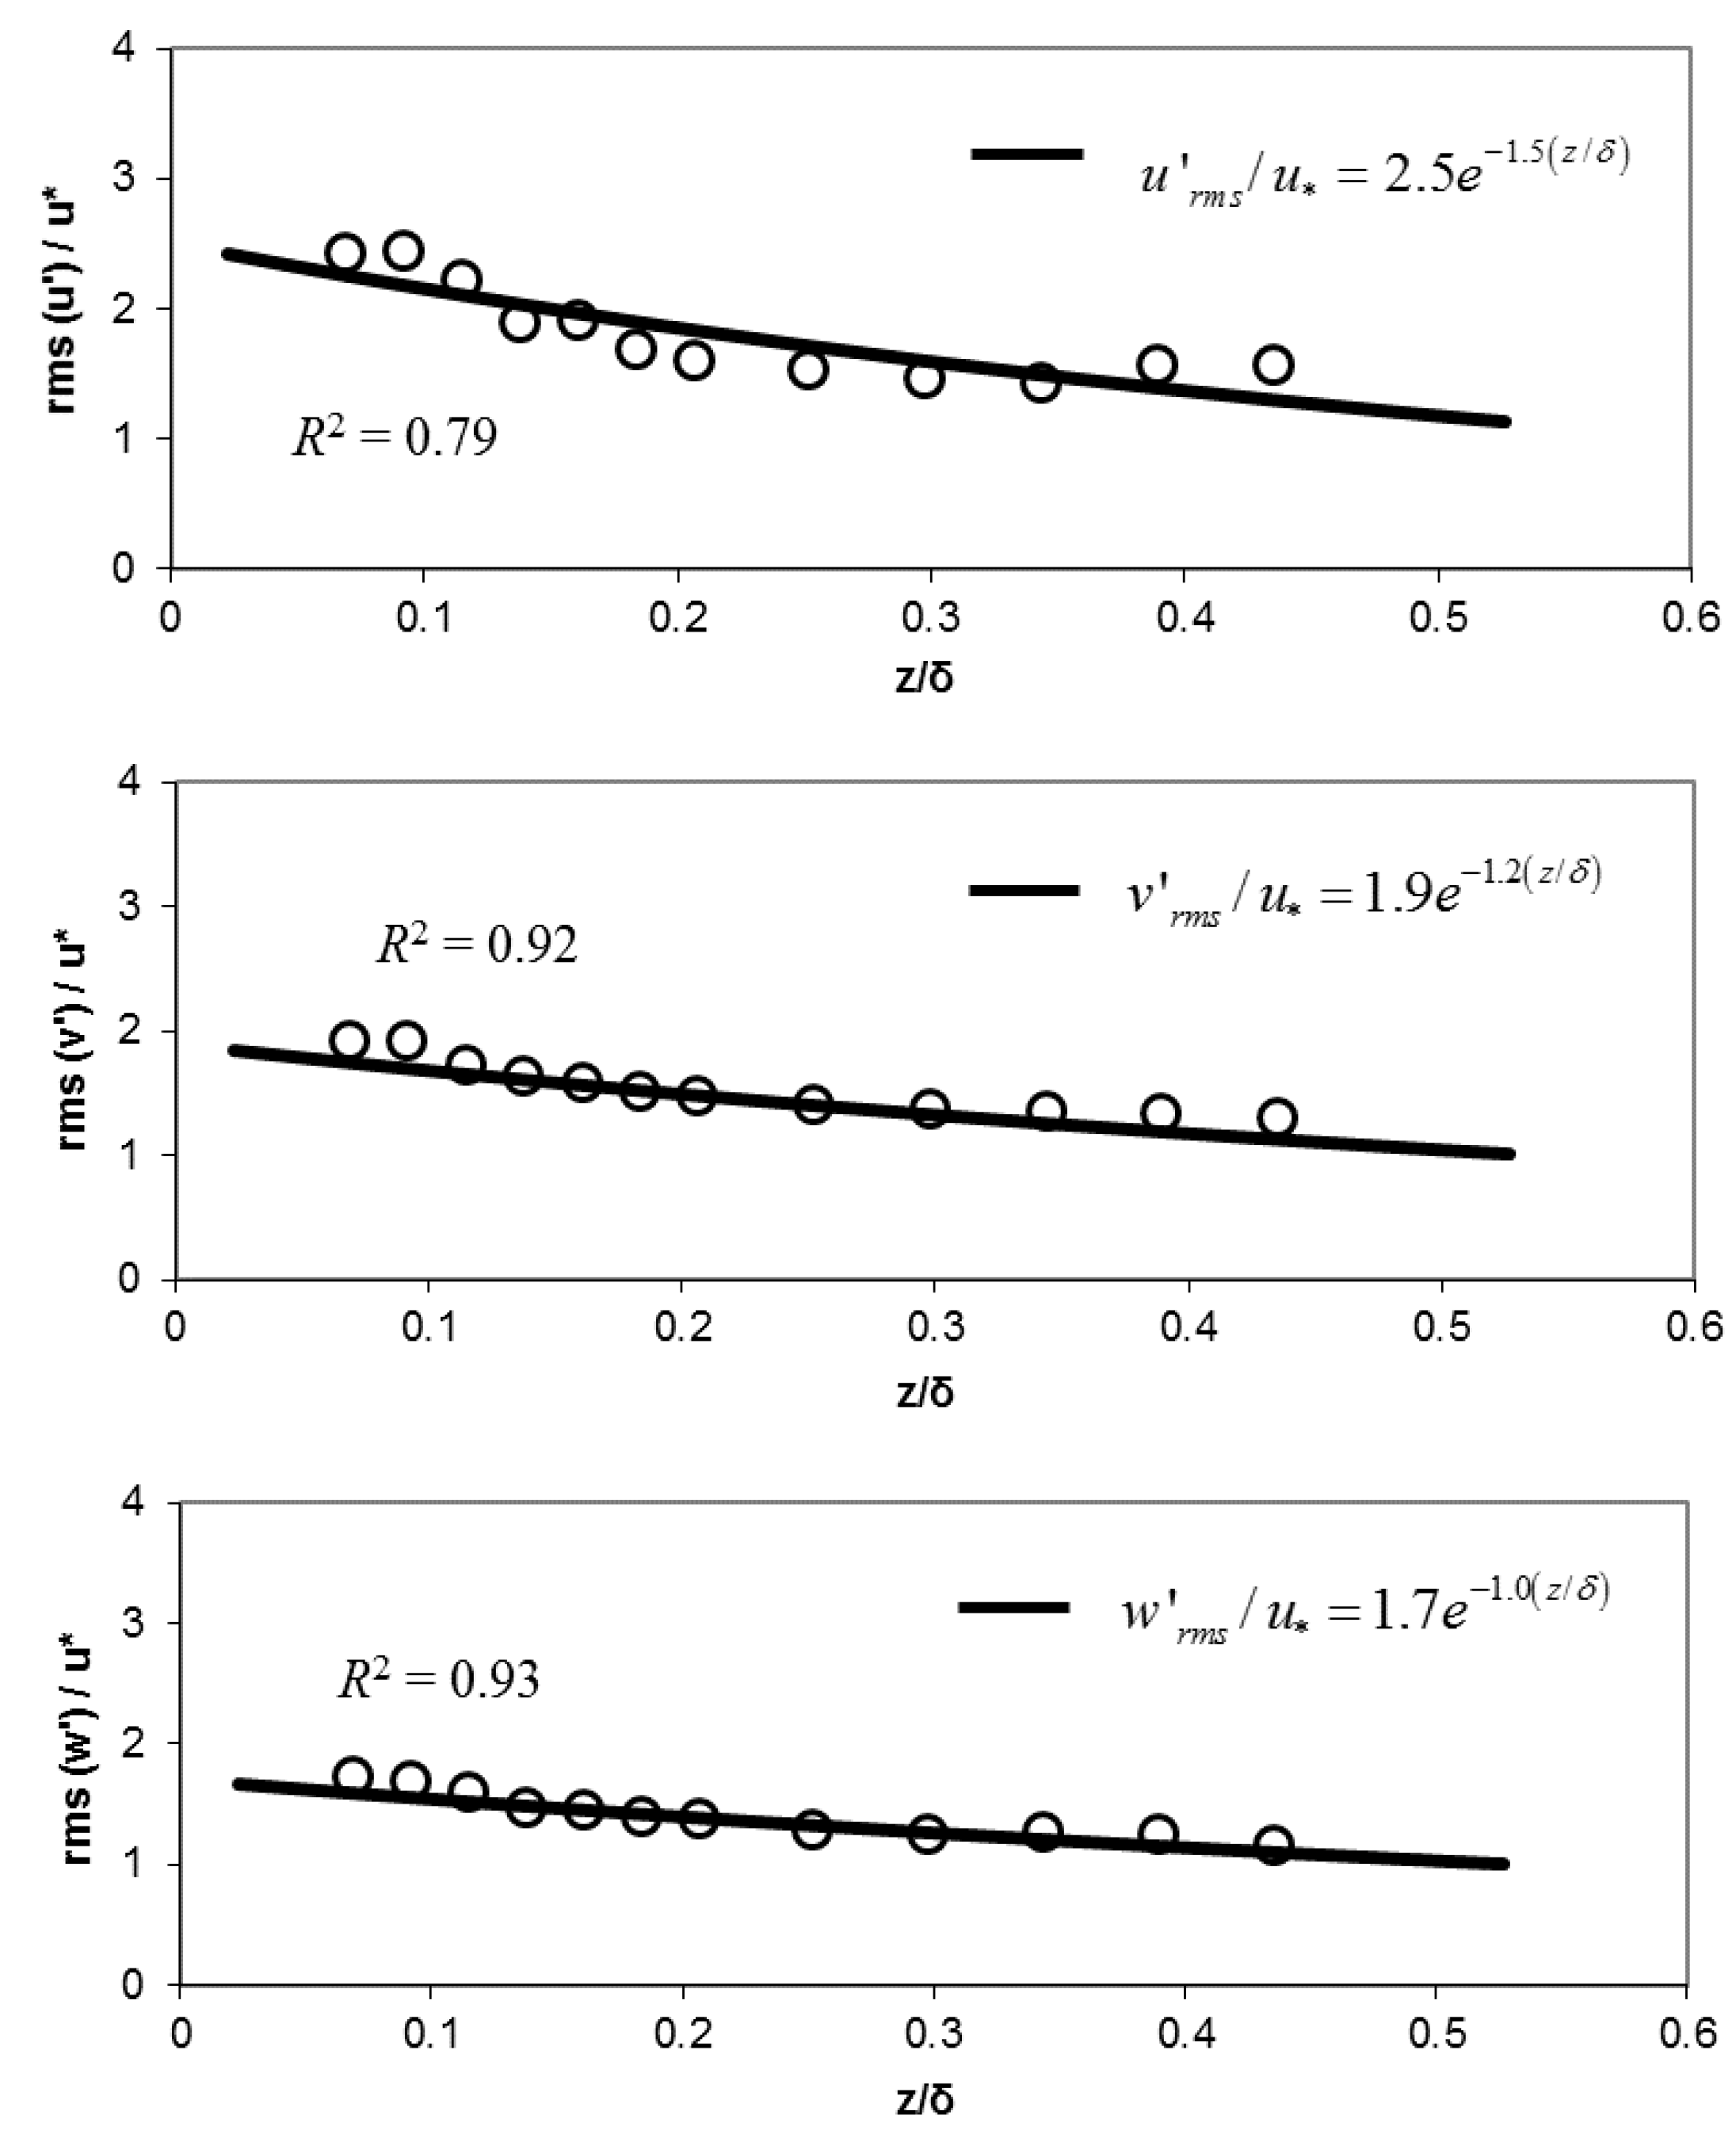
We can observe from Figure 4, Figure 5 and Figure 6 that all the measured smooth, rough and water-worked bed flow turbulence intensity profiles (symbols) are represented well by Equations (4)–(6) (lines). In vertical to transverse profiles comparison, Papanicolaou and Hilldale [29] suggested that D2 and λ2 should be larger than D3 and λ3, which is also agreed by our findings on all flows over hydraulically smooth, rough and water-worked beds. As shown in Table 2, all turbulence intensities D1, D2, D3, λ1, λ2 and λ3 in Figure 4, Figure 5 and Figure 6 compare reasonably well with literature findings. Detailed comparison reveals that λ1 is slightly higher than most proposed values. This can be a result from our flow study up to z/δ = 0.4, in which this slight difference might diminish if higher flow depth is considered. However, all smooth, rough and water-worked bed flows in this study obtain the same result of λ1, which suggests that it is not influenced by bed condition.
When the 3D turbulence intensity profiles are analysed between the smooth bed flow at Figure 4 and rough bed flows (including laboratory prepared and water-worked beds) at Figure 5 and Figure 6, clear differences can be identified in the transverse and vertical profiles, in which the rough bed flows show higher profiles than the smooth bed flow. In comparison, the water-worked bed flow presents higher transverse and vertical turbulence intensity profiles than the flow over experimentally prepared rough bed, which suggests that the less-even bed topography created by the water-worked concept can cause larger flow turbulence and velocity fluctuation. This finding that the water-worked bed alters flow turbulence intensity distribution compared with a laboratory-prepared rough bed has not presented in most laboratory findings from other published works; thus, this study contributes to a further understanding for the caution to reproduce natural flow in laboratory scale. However, more water-worked bed setups should also be investigated in future studies to fully establish and validate its key characteristics.
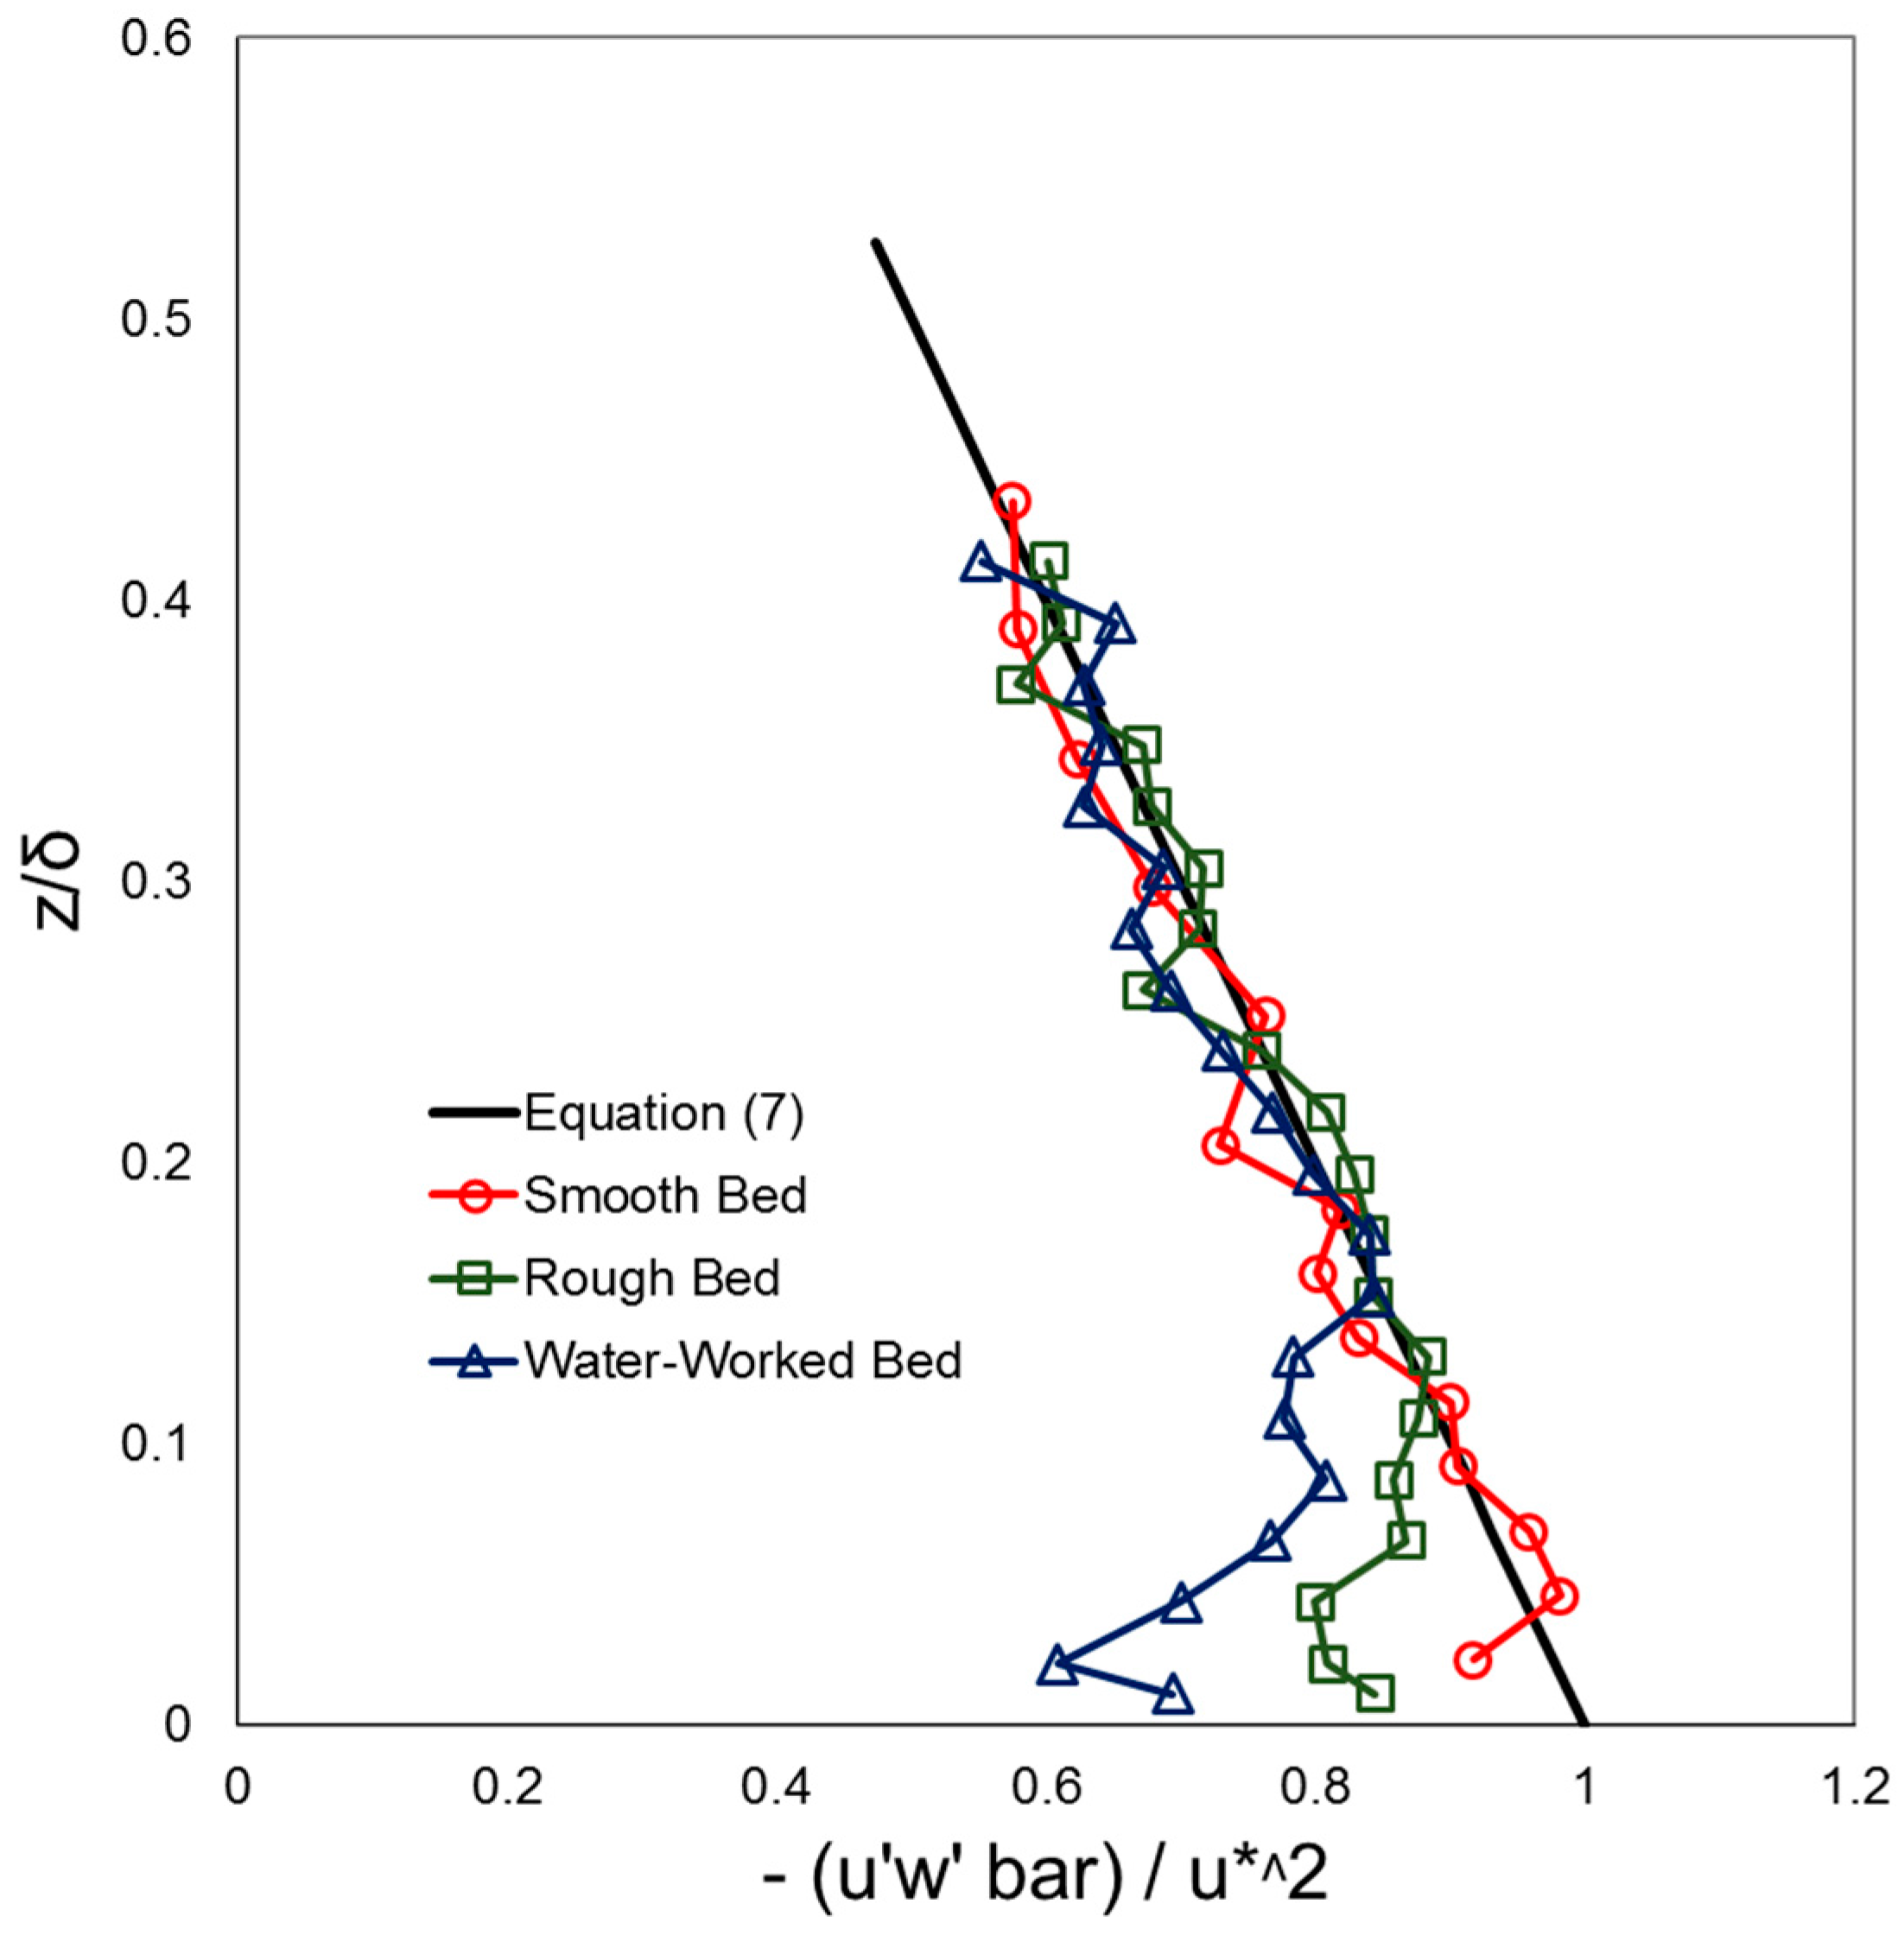
Further comparison of the normalised Reynolds stress profiles for the smooth, rough and water-worked bed flows are presented in Figure 7. The universal distribution given in Nezu and Nakagawa [7] to represent normalised Reynolds stress in both smooth and rough bed flows, as showing in Equation (7), is also used to compare with the measured data. From Figure 7, all flow measurements over smooth, rough and water-worked beds observably retain the characteristic of the universal Reynolds stress distribution within inner flow region by z/δ = 0.2.
At z/δ < 0.2, we can observe that the Reynolds stress for water-worked bed flow takes longer vertical distance to collapse into universal distribution, i.e., at about z/δ = 0.15, if compared to rough bed flow, i.e., at about z/δ = 0.12. The smooth bed flow convergence to universal distribution happens in the shortest vertical distance if compared with both rough and water-worked bed flows. The water-worked bed has the roughest boundary topography among all studied flows, and this causes the flow to have the thickest unsettled turbulent shear layer at the near-bed region. However, this turbulent shear layer was self-diminishing in the inner flow region within z/δ < 0.2, and the created water-worked bed surface amour layer has not presented persistence disturbance to higher flow depth of Reynolds stress profile, i.e., at outer flow region. This proves that the generated water-worked bed can be potentially used to represent natural flow that experiences long flushing to reach a self-smoothing effect in its near-bed turbulent shear layer.
5. Conclusions
The velocity profile and 3D turbulence characteristics of separate smooth, rough and water-worked bed flows were investigated and compared in this study. All tested flows were maintained in uniform flow condition throughout their tests. For the velocity distribution profiles of each flow, most of their von Karman constants κ, log law integration constants Br and wake parameters П were compared reasonably well to previous studies; however, Br = 6.3 found from the water-worked bed flow test was lower than most literature findings which showed the water-worked bed influence on the magnitude of the velocity profile at near-bed flow region. The comparison also showed that the smooth bed flow’s Br is smaller than those of the laboratory-prepared rough and water-worked bed flows. When the turbulence intensity was analysed, its streamwise profile showed close similarity between the smooth, rough and water-worked bed flows. Flow over rough beds, including experimentally prepared rough and water-worked beds, presented higher transverse and vertical turbulence intensity profiles than the smooth bed flow. In comparison, the water-worked bed flow showed transverse and vertical turbulence intensity profiles higher than the experimentally prepared rough bed flow due to the rougher bed condition created through the water-worked concept, that caused higher turbulence and velocity fluctuations. This study also identified that the water-worked bed flow caused higher near-bed disturbance to Reynolds stress profile when compared to smooth and rough bed flows; however, the disturbance showed feeble characteristic and was diminished within inner flow region. Overall, this study has successfully set up a test on the water-worked bed flow to identify a possible way to reproduce similar natural flow’s bed condition in laboratory scale. However, due to this wide but important topic of natural flow reproduction in laboratory scale, studies on more different flow and bed setups will be needed in future works to more clearly identify further distinct features of the water-worked bed flow.
Acknowledgments
The authors acknowledge the support of the Major State Basic Research Development Grant No. 2013CB036402 from Tsinghua University. The support from the Major State Basic Research Development Program (973 program) of China is also greatly appreciated. We also acknowledge the National Key Research and Development Project from the Ministry of Science and Technology during the Thirteenth Five-year Plan Period (Grant No. 2017YFC0403600) and the Science and Technology Projects State Grid Corporation of China (Grant No. 52283014000T).
Author Contributions
Jaan Hui Pu conducted the experiments, collected the data and drafted the manuscript; Jiahua Wei and Yuefei Huang improved the manuscript draft by proofreading and editing. All authors contributed to the work.
Conflicts of Interest
The authors declare no conflict of interest.
Nomenclatures
| Br | log law integration constant |
| d | sediment diameter/grain size |
| Fr | Froude number |
| g | gravitational acceleration |
| ks | Nikuradse roughness |
| P | pressure |
| R | hydraulic radius |
| So | channel slope |
| u* | friction velocity |
| u’ | fluctuation of streamwise velocity |
| v’ | fluctuation of lateral velocity |
| w’ | fluctuation of vertical velocity |
| x | longitudinal distance |
| y | lateral distance |
| z | vertical distance |
| zo | reference zero-plane displacement level |
| β | pressure gradient parameter |
| δ | water flow depth |
| κ | von Karman constant |
| ν | kinematic viscosity |
| П | wake parameter |
| ρ | water density |
| τo | bed shear stress |
References
- Cooper, J.R.; Tait, S.J. Examining the physical components of boundary shear stress for water-worked gravel deposits. Earth Surf. Process. Landf. 2010, 35, 1240–1246. [Google Scholar] [CrossRef]
- Cooper, J.R.; Tait, S.J. Spatial representative velocity measurement over water-worked gravel beds. Water Resour. Res. 2010, 46, 1–15. [Google Scholar] [CrossRef]
- Coleman, S.E.; Nikora, V.I.; Schlicke, T. Spatially-averaged oscillatory flow over a rough bed. Acta Geophys. 2008, 56, 698–733. [Google Scholar] [CrossRef] [Green Version]
- Qin, J.; Ng, S.L. Estimation of effective roughness for water-worked gravel surfaces. J. Hydraul. Eng. 2012, 138, 923–934. [Google Scholar] [CrossRef]
- Pu, J.H.; Shao, S.; Huang, Y. Numerical and experimental turbulence studies on shallow open channel flows. J. Hydrol. Environ. Res. 2014, 8, 9–19. [Google Scholar] [CrossRef]
- Nezu, I.; Rodi, W. Open-channel flow measurements with a laser Doppler anemometer. J. Hydraul. Eng. 1986, 112, 335–355. [Google Scholar] [CrossRef]
- Nezu, I.; Nakagawa, H. Turbulent Open-Channel Flows; IAHR Monograph Series: Rotterdam, The Netherlands, 1993. [Google Scholar]
- Nezu, I.; Azuma, R. Turbulence characteristics and interaction between particles and fluid in particle-laden open channel flows. J. Hydraul. Eng. 2004, 130, 988–1001. [Google Scholar] [CrossRef]
- Coles, D. The law of the wake in the turbulent boundary layer. J. Fluid Mech. 1956, 1, 191–226. [Google Scholar] [CrossRef]
- Keulegan, G.H. Laws of turbulent flow in open channels. J. Res. Nat. Bur. Stand. 1938, 21, 707–741. [Google Scholar] [CrossRef]
- Biron, P.M.; Robson, C.; Lapointe, M.F.; Gaskin, S.J. Comparing different methods of bed shear stress estimates in simple and complex flow fields. Earth Surf. Process. Landf. 2004, 29, 1403–1415. [Google Scholar] [CrossRef]
- Song, T.; Chiew, Y.M. Turbulence measurement in nonuniform open-channel flow using acoustics Doppler velocimeter (ADV). J. Eng. Mech. 2001, 127, 219–232. [Google Scholar] [CrossRef]
- Dey, S.; Raikar, R.V. Characteristics of loose rough boundary streams at near-threshold. J. Hydraul. Eng. 2007, 133, 288–304. [Google Scholar] [CrossRef]
- Yu, G.; Tan, S.K. Errors in bed shear stress as estimated from vertical velocity profile. J. Irrig. Drain. Eng. 2006, 132, 490–497. [Google Scholar] [CrossRef]
- Pu, J.H. Turbulence modelling of shallow water flows using Kolmogorov approach. Comput. Fluids 2015, 115, 66–74. [Google Scholar] [CrossRef]
- Pu, J.H.; Shao, S. Non-uniform open channel flows study using three-dimensional turbulence measurements. In Proceedings of the 35th International IAHR World Congress, Chengdu, China, 8–13 September 2013; Article A10326. pp. 1–10. [Google Scholar]
- Blanckaert, K.; Lemmin, U. Means of noise reduction in acoustic turbulence measurements. J. Hydraul. Res. 2006, 44, 1–15. [Google Scholar] [CrossRef]
- Van Rijn, L.C. Sediment transport. Part I: Bed load transport. J. Hydraul. Eng. 1984, 110, 1431–1456. [Google Scholar] [CrossRef]
- Cardoso, A.H.; Graf, W.H.; Gust, G. Uniform flow in a smooth open channel. J. Hydraul. Res. 1989, 27, 603–616. [Google Scholar] [CrossRef]
- Song, T.; Graf, W.H.; Lemmin, U. Uniform flow in open channels with movable gravel bed. J. Hydraul. Res. 1994, 32, 149–173. [Google Scholar] [CrossRef]
- Auel, C.; Albayrak, I.; Boes, R.M. Turbulence characteristics in supercritical open channel flows: Effects of Froude number and aspect ratio. J. Hydraul. Eng. 2014, 140, 04014004. [Google Scholar] [CrossRef]
- Mellor, G.L.; Gibson, D.M. Equilibrium turbulent boundary layers. J. Fluid Mech. 1966, 24, 225–253. [Google Scholar] [CrossRef]
- Anwar, H.O.; Atkins, R. Turbulence measurements in simulated tidal flow. J. Hydraul. Div. 1980, 106, 1273–1289. [Google Scholar]
- Kironoto, B.A.; Graf, W.H. Turbulence characteristics in rough uniform open-channel flow. Proc. Inst. Civ. Eng.-Water Marit. Eng. 1994, 106, 333–344. [Google Scholar] [CrossRef]
- Kirkgoz, M.S. Turbulent velocity profiles for smooth and rough open channel flow. J. Hydraul. Eng. 1989, 115, 1543–1561. [Google Scholar] [CrossRef]
- Steffer, P.M.; Rajaratnam, N.; Peterson, A.W. LDA measurements in open channel. J. Hydraul. Eng. 1985, 111, 119–130. [Google Scholar] [CrossRef]
- Pu, J.H. Universal velocity distribution for smooth and rough open channel flows. J. Appl. Fluid Mech. 2013, 6, 413–423. [Google Scholar]
- Nezu, I. Turbulent Structure in Open Channel Flows. Ph.D. Thesis, Kyoto University, Kyoto, Japan, 1 July 1977. (In Japanese). [Google Scholar]
- Papanicolaou, A.N.; Hilldale, R. Turbulence characteristics in gradual channel transition. J. Hydraul. Eng. 2002, 128, 948–960. [Google Scholar] [CrossRef]
Figure 1.
(a) 3D sediment elevation and (b) width-averaged sediment elevation measured for the water-worked bed; (c) 3D sediment elevation and (d) width-averaged sediment elevation measured for experimentally arranged rough bed.
Figure 1.
(a) 3D sediment elevation and (b) width-averaged sediment elevation measured for the water-worked bed; (c) 3D sediment elevation and (d) width-averaged sediment elevation measured for experimentally arranged rough bed.

Figure 2.
Comparison of (a) water-worked bed and (b) experimentally prepared rough bed in lab flume.
Figure 2.
Comparison of (a) water-worked bed and (b) experimentally prepared rough bed in lab flume.
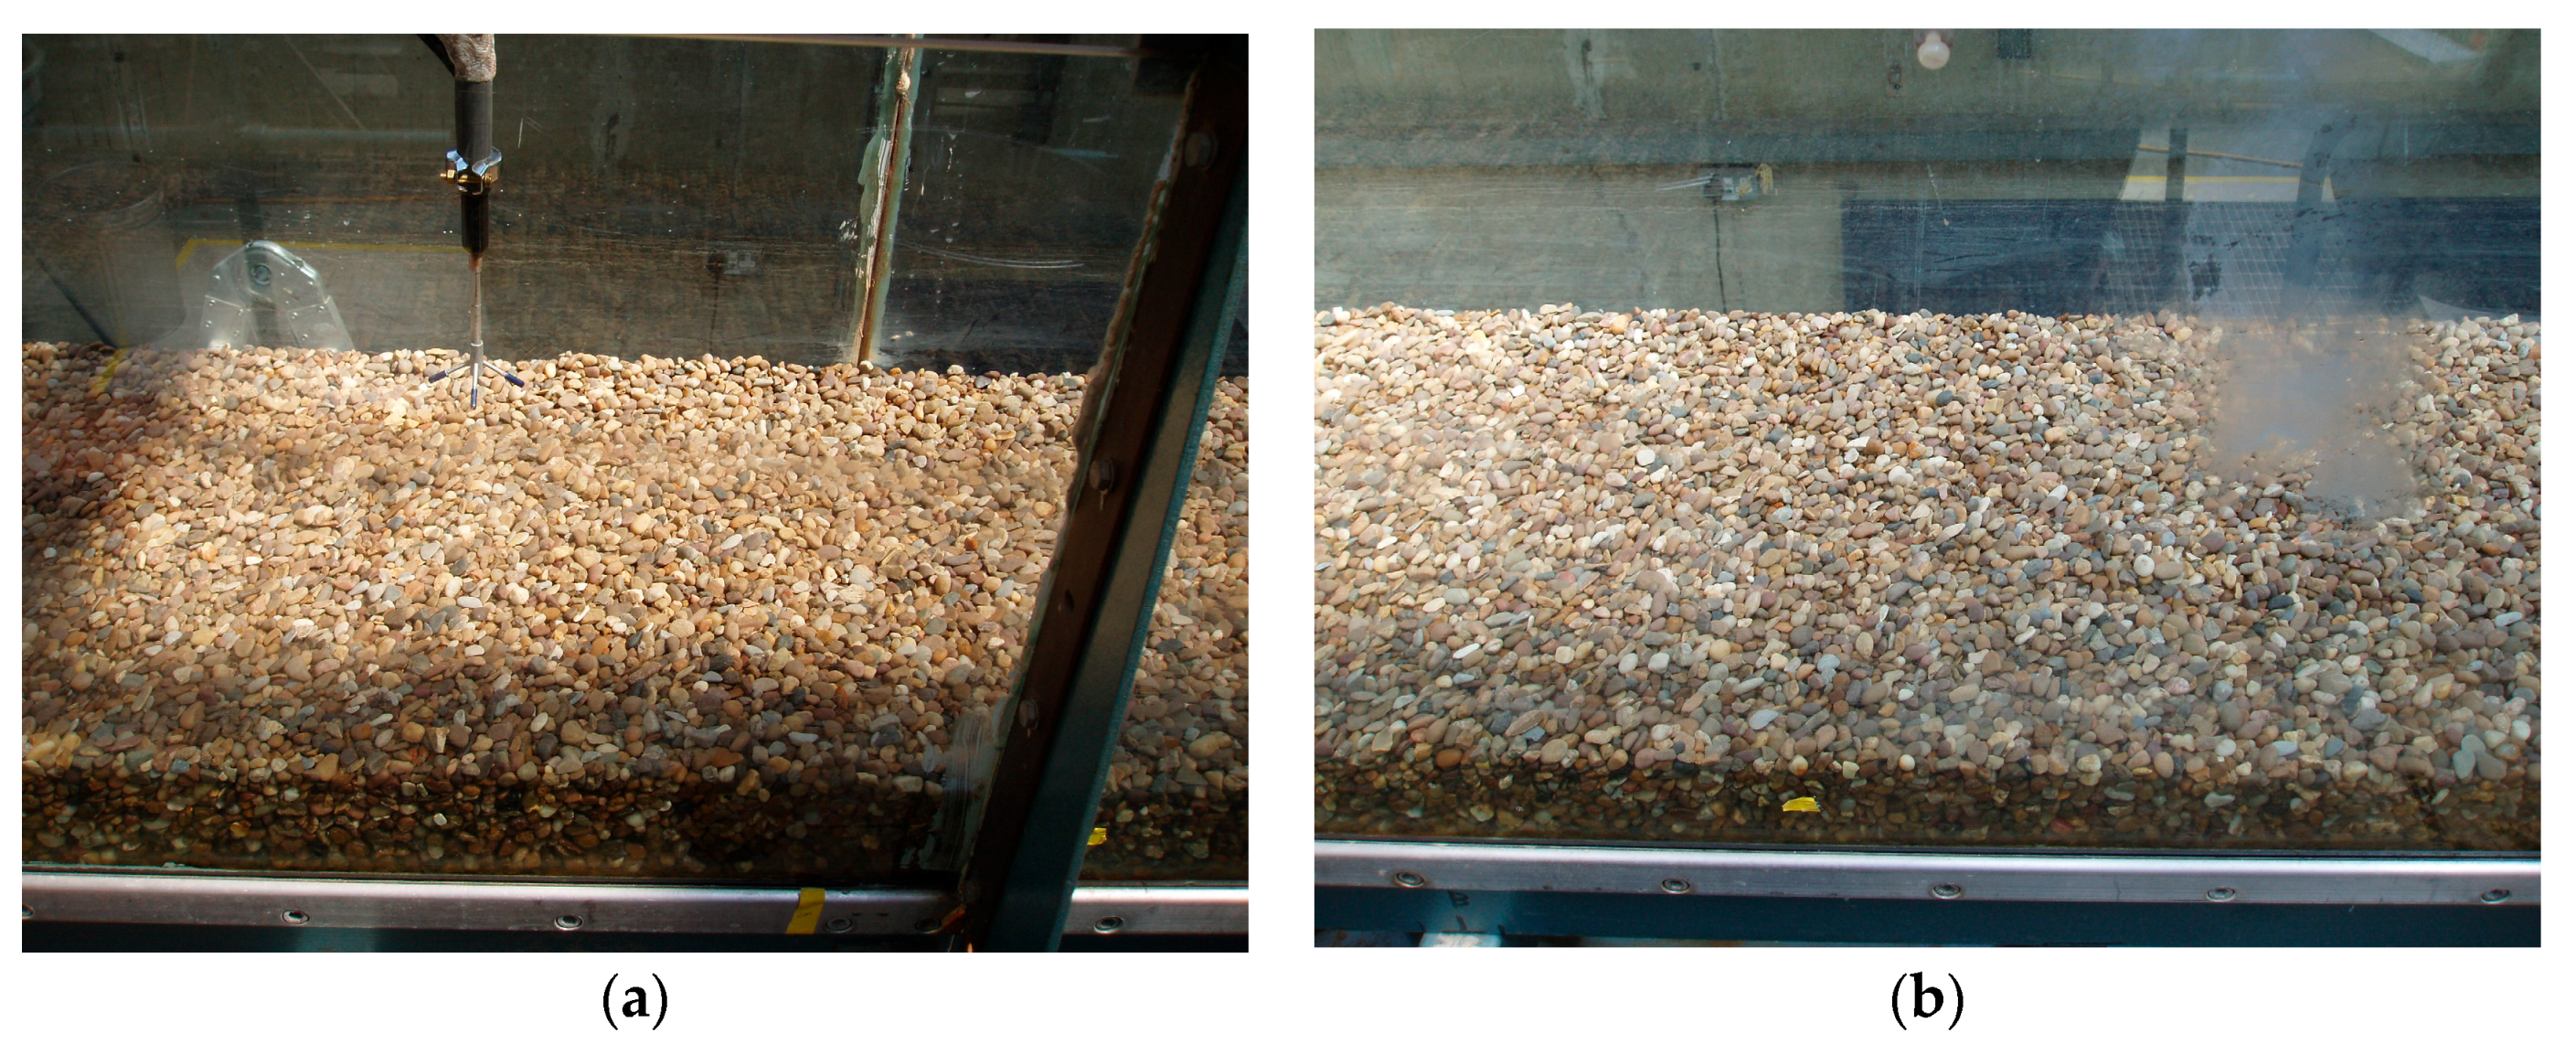
Figure 3.
Measured normalised flow velocity profile over (a) smooth bed (Test 1), (b) rough bed (Test 2), and (c) water-worked bed (Test 3).
Figure 3.
Measured normalised flow velocity profile over (a) smooth bed (Test 1), (b) rough bed (Test 2), and (c) water-worked bed (Test 3).
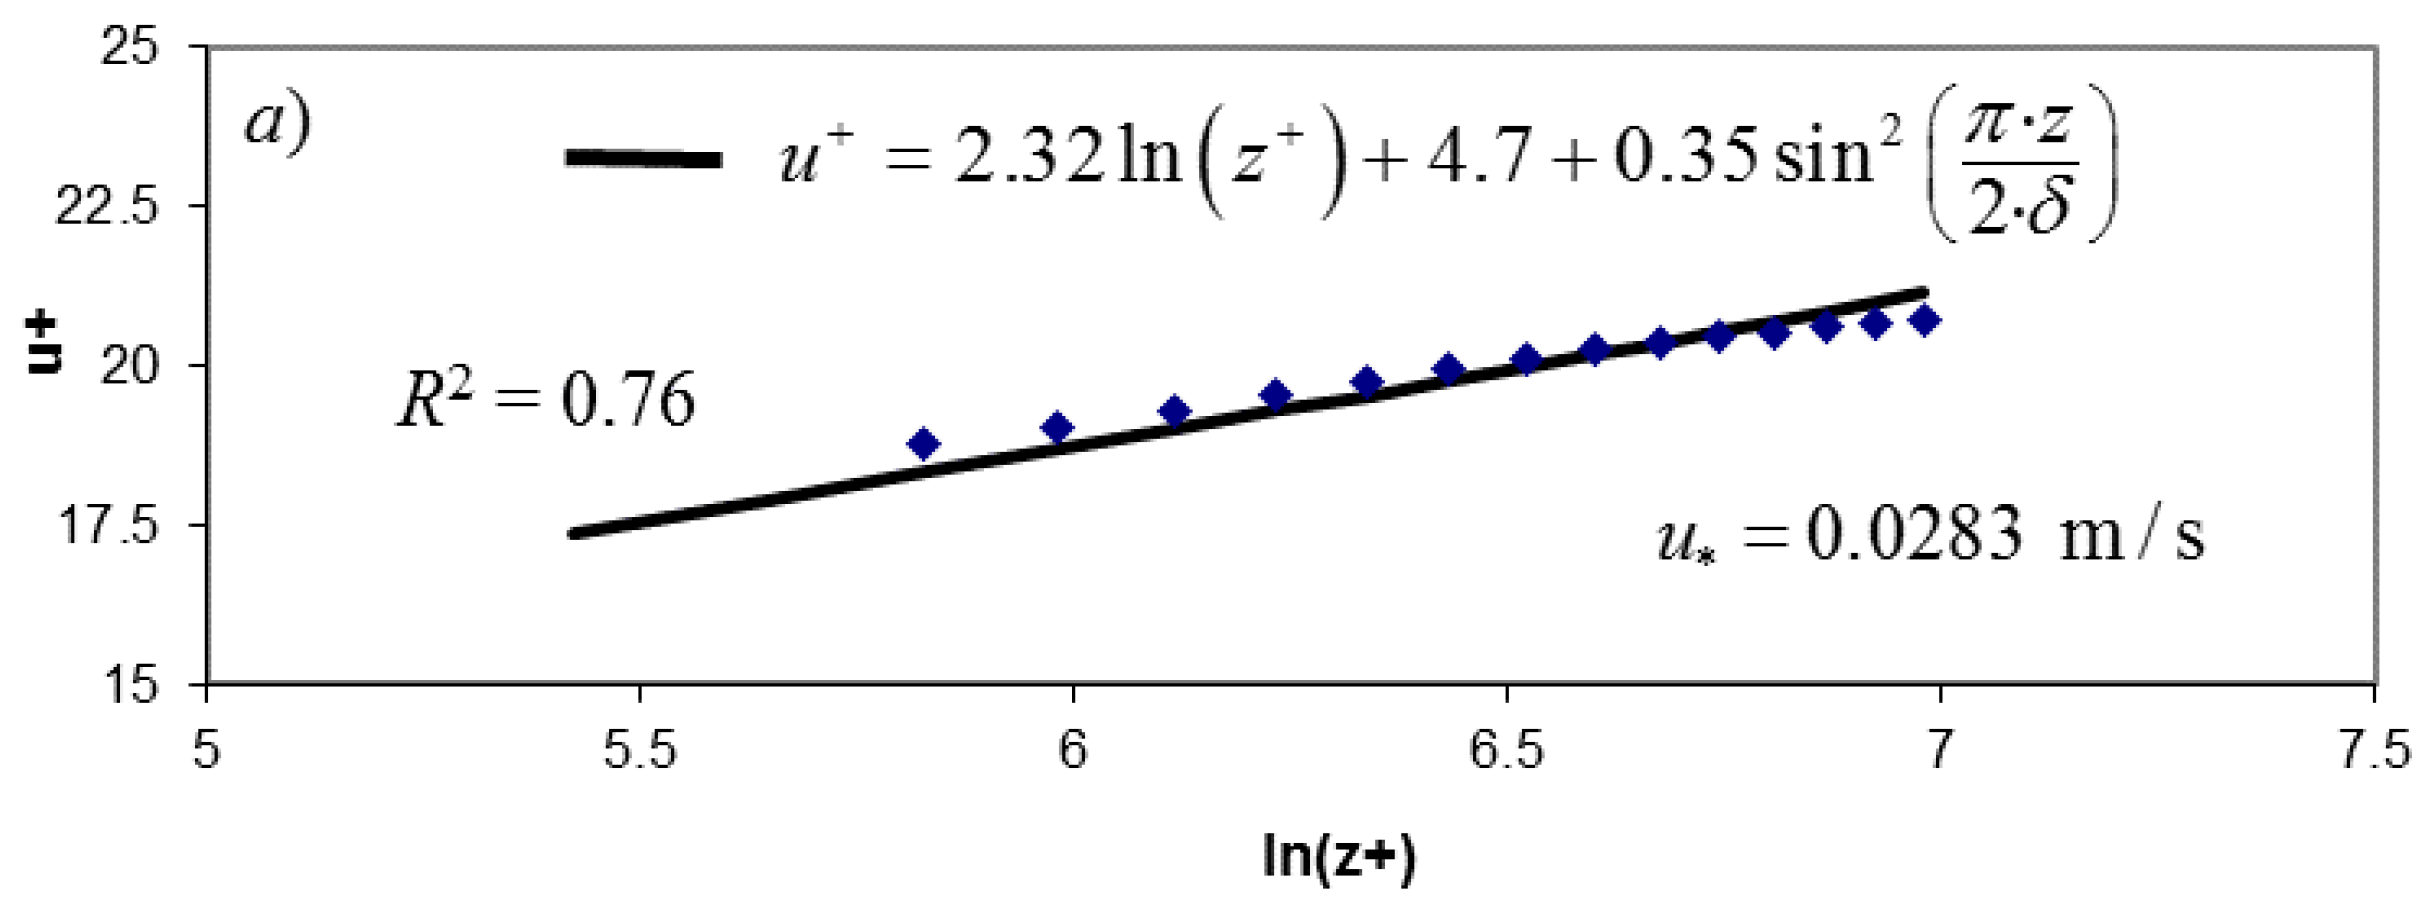

Figure 4.
Measured normalised turbulence intensity profiles for smooth bed flow (Test 1).

Figure 5.
Measured normalised turbulence intensity profiles for rough bed flow (Test 2).

Figure 6.
Measured normalised turbulence intensity profiles for water-worked bed flow (Test 3).
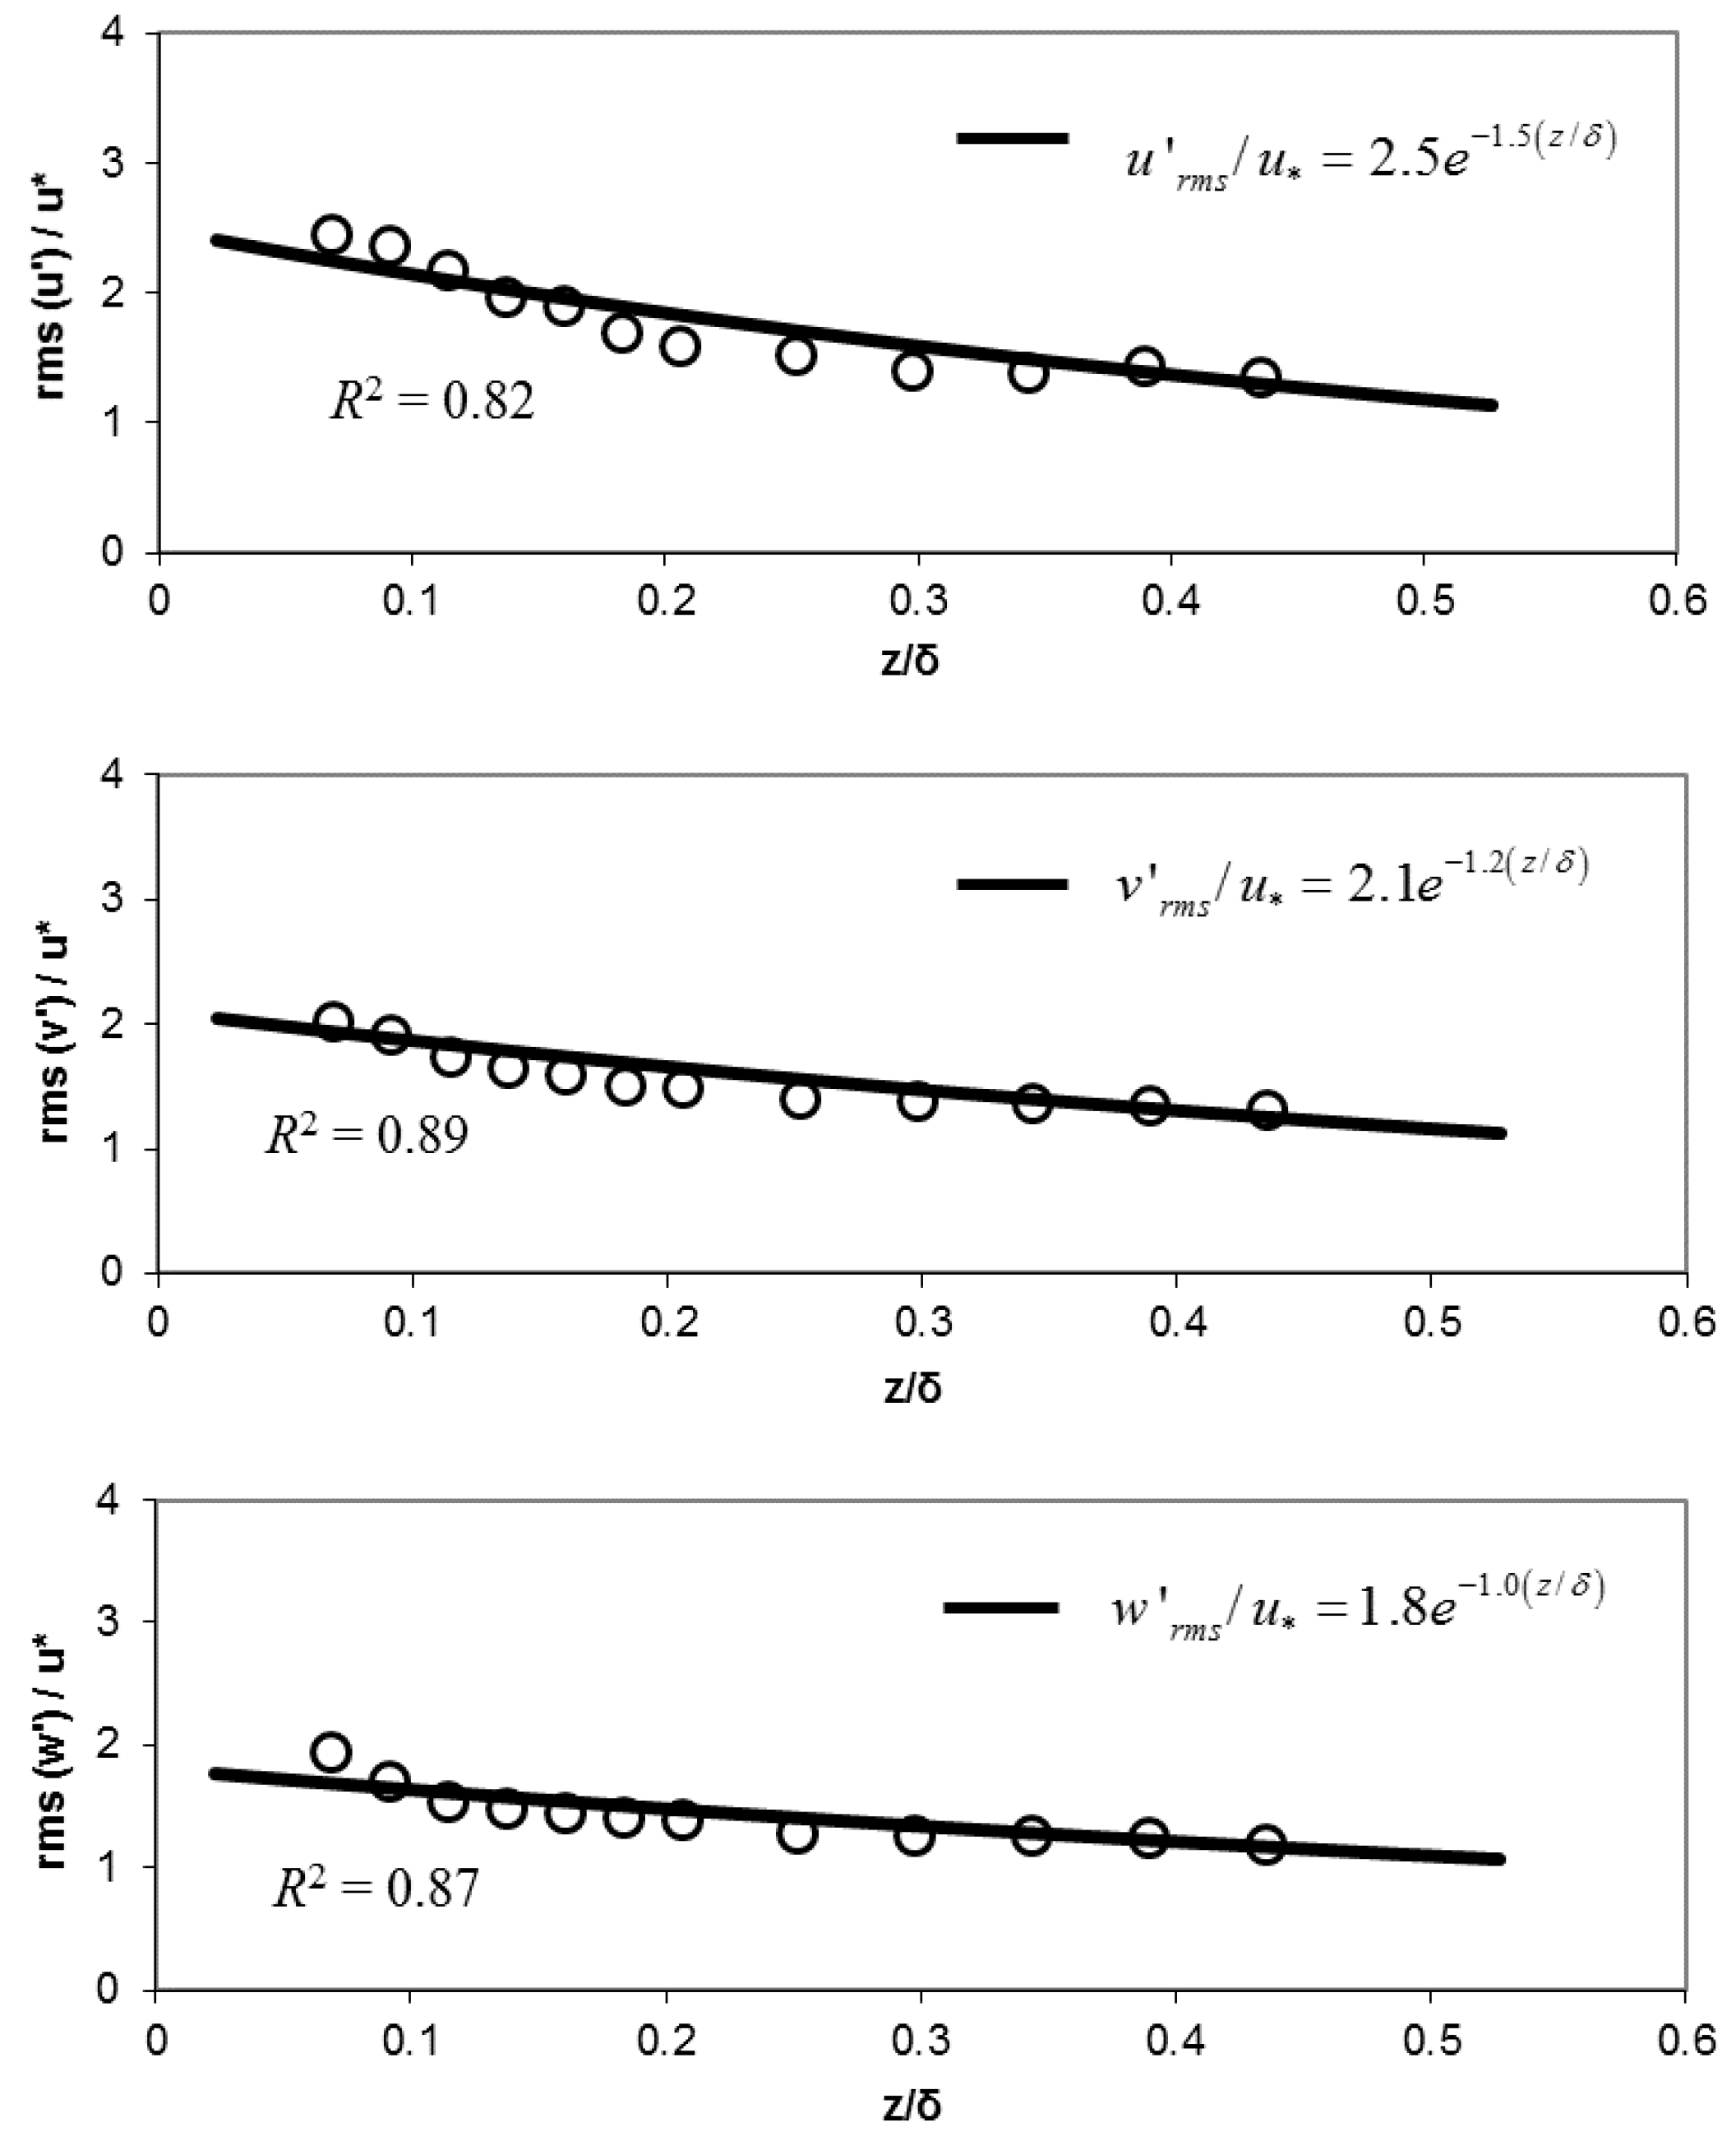
Figure 7.
Measured normalised Reynolds stress profiles over smooth bed (Test 1), rough bed (Test 2), and water-worked bed (Test 3).
Figure 7.
Measured normalised Reynolds stress profiles over smooth bed (Test 1), rough bed (Test 2), and water-worked bed (Test 3).

Table 1.
Summary of basic experimental hydraulic and geometric conditions in smooth, rough and water-worked bed flows †.
Table 1.
Summary of basic experimental hydraulic and geometric conditions in smooth, rough and water-worked bed flows †.
| Test No. | Q (L/s) | U (m/s) | δ (m) | Fr (-) | u* (m/s) | Bed Condition | Flow Feature |
|---|---|---|---|---|---|---|---|
| 1 | 40.5 | 0.667 | 0.135 | 0.579 | 0.0283 | Smooth | Uniform |
| 2 | 40.5 | 0.687 | 0.131 | 0.606 | 0.0536 | Rough | Uniform |
| 3 | 40.5 | 0.687 | 0.131 | 0.606 | 0.0598 | Water-Worked | Uniform |
Notes: † Q is the flow discharge; U is the flume averaged velocity where U = Q/(b*δ); b is the width of channel; δ is the water flow depth; Fr is the Froude number where Fr = U/√(g*δ); g is the gravitational acceleration; and u* is friction velocity.
Table 2.
Empirical constants from the present study and literature for turbulence intensity exponential law.
Table 2.
Empirical constants from the present study and literature for turbulence intensity exponential law.
| Sources | D1 | D2 | D3 | λ1 | λ2 | λ3 | Bed Condition(s) |
|---|---|---|---|---|---|---|---|
| Present Study | 2.50 | 1.60 | 1.50 | 1.50 | 1.00 | 0.60 | Smooth |
| Present Study | 2.50 | 1.90 | 1.70 | 1.50 | 1.20 | 1.00 | Rough |
| Present Study | 2.50 | 2.10 | 1.80 | 1.50 | 1.20 | 1.00 | Water-Worked |
| Cardoso et al. [19] | 2.28 | - | - | 1.08 | - | - | Smooth |
| Dey and Raikar [13] | 2.07 | - | 1.17 | 0.95 | - | 0.69 | Rough |
| Kironoto and Graf [24] | 2.04 | - | 1.14 | 0.97 | - | 0.76 | Rough |
| Nezu and Azuma [8] | 2.30 | - | 1.27 | 1.00 | - | 1.00 | Smooth & Rough |
| Nezu and Nakagawa [7] | 2.30 | 1.63 | 1.27 | 1.00 | 1.00 | 1.00 | Smooth & Rough |
| Nezu and Rodi [6] | 2.26 | - | 1.23 | 0.88 | - | 0.67 | Smooth & Rough |
© 2017 by the authors. Licensee MDPI, Basel, Switzerland. This article is an open access article distributed under the terms and conditions of the Creative Commons Attribution (CC BY) license (http://creativecommons.org/licenses/by/4.0/).
Share and Cite
MDPI and ACS Style
Pu, J.H.; Wei, J.; Huang, Y. Velocity Distribution and 3D Turbulence Characteristic Analysis for Flow over Water-Worked Rough Bed. Water 2017, 9, 668. https://doi.org/10.3390/w9090668
AMA Style
Pu JH, Wei J, Huang Y. Velocity Distribution and 3D Turbulence Characteristic Analysis for Flow over Water-Worked Rough Bed. Water. 2017; 9(9):668. https://doi.org/10.3390/w9090668
Chicago/Turabian StylePu, Jaan Hui, Jiahua Wei, and Yuefei Huang. 2017. "Velocity Distribution and 3D Turbulence Characteristic Analysis for Flow over Water-Worked Rough Bed" Water 9, no. 9: 668. https://doi.org/10.3390/w9090668
Note that from the first issue of 2016, this journal uses article numbers instead of page numbers. See further details here.