Comparison of Potential Risk on Two Managed Aquifer Recharge Sites from River Basin


Department of Civil and Environmental Engineering, Dongguk University, 30, Pildong-ro 1-gil, Jung-gu, Seoul 04620, Korea
*
Author to whom correspondence should be addressed.
Water 2017, 9(9), 674; https://doi.org/10.3390/w9090674
Submission received: 26 June 2017
/
Revised: 30 August 2017
/
Accepted: 2 September 2017
/
Published: 6 September 2017
(This article belongs to the Special Issue New Advances in Integrated River Basin Management)
Abstract
:Drinking water production facilities are designed to filter contaminants that are ever-present in raw water. These facilities, however, pose risks of tap water contamination or water supply discontinuation in the event of a massive chemical spill. A managed aquifer recharge (MAR) offers the advantage of purifying surface water as well as maintaining water underground for extended periods of time, thus securing sufficient time for a response to contaminant infiltration and dramatically increasing consumer safety. However, contaminated aquifers are difficult to recover; accordingly, it is important that MAR sites engage in preemptive responses to chemical spills in order to protect their aquifers. This study assesses potential risks in order to quantify the detrimental impacts of chemical spills in cities located in river basins on drinking water supply facilities. The targets of analysis are two MAR sites in South Korea. The potential risk analysis offers grounds upon which aggressive basin management can be implemented to ensure water supply facility operation safety. The lack of data for available for analysis is addressed using a stochastic methodology that ranks cities in which MAR sites are endangered based on the cities’ potential risk probability distributions. The results of the analysis show that water supply facilities surrounded by larger cities have relatively higher potential risks, and would, therefore, need to handle more management targets to prevent chemical spills. Furthermore, the proposed methodology contributes not only to potential risk management of existing water supply facilities, but also to MAR site selection.
1. Introduction
Today’s water purification technologies have sufficiently advanced to convert seawater and wastewater into drinking water. However, their high unit costs of production continue to prevent these technologies from becoming more available to the general public. A typical water treatment system uses processes, such as sedimentation, filtration, and chlorine disinfection, to treat raw water from rivers and lakes to satisfy specified minimum standards. Ordinary water treatment systems are economically designed to withstand water quality fluctuations brought on by year-round natural environment changes, as well as ever-present pollutants. Consequently, general filtration systems are susceptible to water quality changes resulting from accidents.
For instance, despite the availability of purification systems, citizens were detrimentally affected by a chemical spill in the Rhine River in 1986 [1], phenol leaks in the South Korean Nakdong River in 1991 [2], and a 2014 spill of 4-methylcyclohexanemethanol (MCHM) in the Elk River (West Virginia, USA) [3]. Water pollution accidents continue to increase in frequency. In the United States, the National Response Center reports thousands of inland waterway incidents every year, including oil spills which jeopardize water supplies and public health [4]. South Korea, had 59 reported cases of water pollution accidents in 2005, which jumped to 212 cases in 2014—a 3.6 fold increase over nine years [5].
Preventive strategies for water treatment systems include discontinuing the water supply or providing additional filtration facilities. The former may prevent users from drinking contaminated water but still means the discontinuation of the drinking water supply. Depending on the circumstances, the latter may require considerable amounts of money. Therefore, the most fundamental and economical solution would be to reduce the rate of water pollution accidents or even prevent chemical spills altogether. For such prevention, proactive management of chemical substances in river basin areas is necessary.
Typically, river basin management studies actively focus on tracing point sources and non-point sources of pollution [6]. Such tracing involves post-incident management, whereas prevention involves risk management. Risk is the probability or threat of damage, injury, liability, loss, or any other negative occurrence caused by external or internal vulnerabilities and that may be avoided through preemptive action [7]. Reducing risk means decreasing the number of incidents or the extent of damage occurring during an incident. Jiang et al. [8] and Bryant and Abkowitz [9] examined the risks arising from spills in river basin areas. Similarly, Lim et al. [10] conducted priority screening of toxic chemicals and industry sectors in the U.S. For the Lake Biwa-Yodo river basin, Ariyadasa et al. [11] categorized the chemicals posing the greatest health risks.
While previous studies have viewed the government or local governing bodies as the principal players in river basin management, Hazard Analysis and Critical Control Points (HACCP) and the Water Safety Plan [12] saw water treatment facilities as the main agents in basin management, covering the entire process of drinking water production from river basin to end users and accordingly conducted water quality risk analyses. The analyses, however, were evaluated as falling short of objectivity since they were likely to be subject to the opinions of those who performed the analysis [13].
This study aims to complement the risk analysis reported by HACCP and the Water Safety Plan through a quantitative estimation of the potential risks in water treatment systems as posed by each of the cities in selected river basin areas in the wake of chemical spills. Ji and Lee [14,15] analyzed the potential risks using both deterministic and stochastic methods with the aim of strengthening HACCP basin management. Owing to a lack of raw data, the stochastic approach was deemed to be more persuasive than the deterministic approach. This study similarly lacks raw data. Therefore, this study applies the stochastic methodology to two different Managed Aquifer Recharge (MAR) sites and compares them in terms of location and proactive management of chemicals.
2. Study Area and Managed Aquifer Recharge
2.1. Study Area
The two MAR sites, that is, the targets of potential risk analysis, are in Jeungsan-ri and Samrak Park, each located in the Nakdong River basin in South Korea (Figure 1a). The Nakdong River, at a length of 400.7 km, is a major source of drinking water in southeastern South Korea. The river basin, with coordinates of N35°–37°, E127°–129° and an area of approximately 23,000 km2, accounts for 23% of the country’s territory. The basin consists of forests (71%), rice paddies and farms (26%), and a small level of urban territory (1.4%). The basin has a soil profile made up mostly of lithosols (65%) followed by alluvial soil (19%) and rocky soil (9%).
This study includes as its targets 42 cities located within the Nakdong River basin. Figure 1b shows that a number is allocated to each of these cities for convenience of analysis. Busan and Daegu are both major cities in the Nakdong River basin. Busan, the second-largest city in South Korea, is a heavy and chemical industry hub as well as a port city that enjoys active export activities and coastal fisheries. Numbers 40, 41, and 42 correspond to parts of Busan. Daegu is located in the center of the basin, serving as a transportation hub connecting the country’s capital, Seoul, to the second-largest city, Busan. Daegu is heavily involved in the textile industry while enjoying growth in high-tech industries including automobile manufacturing, machinery, and steel. Numbers 2 through 9 are included in Daegu. The total population across the 42 cities is 10.9 million (persons). In terms of its population density, number 7 ranks highest at 11,496 persons/km2, followed by numbers 9, 2, 6, 40, and 41 in descending order. Collectively, all these cities are part of Daegu and Busan.
The Nakdong River has 11 dams along its length. However, growing population, worsening water quality, water pollution accidents, and frequent droughts cause concern among river basin cities with regard to water resource security. Jung et al. [16] reported that the lower Nakdong River maintains year-round eutrophication. Another study [17] reported that in 2012, the Nakdong River was associated with the largest number of water pollution incidents occurring locally, with a total of 15 cases. According to Seo and Lee [18], the groundwater level has decreased continuously since 2003. Of particular note, they found continuously declining rainfalls from 2012 to 2015 led to a failure of ensuring water storage capacity at previously secured levels. As such, the MAR sites located in Jeungsan-ri and Samrak Park are outcomes of national projects for securing new water resources.
2.2. Two Types of Managed Aquifer Recharge
MAR is a technology that directly uses aquifers for the treatment, storage, and use of water [19]. According to Maliva and Missimer [20], MAR facilities offer an extremely large storage for aquifers, no costs for securing storage, no evaporation loss, fewer risks for pollutants and algae proliferation, small environmental impact, and less exposure to the outside than other aboveground storage facilities. The typical water storage capacity of an MAR facility is 103–106 m3/year, and its supply price is 1–10 US$/m3, offering a cost advantage compared to other storage technologies of comparable capacity [19]. MAR can be found in many places regardless of the region’s climate: Saudi Arabia [21], Europe [22] and Australia [23] are no exception. The main uses include drinking, agriculture, and landscaping. There are 748 MAR sites in the USA [24], and the state of Texas plans to produce 3.8% of total water supply through MAR in 2060 [25].
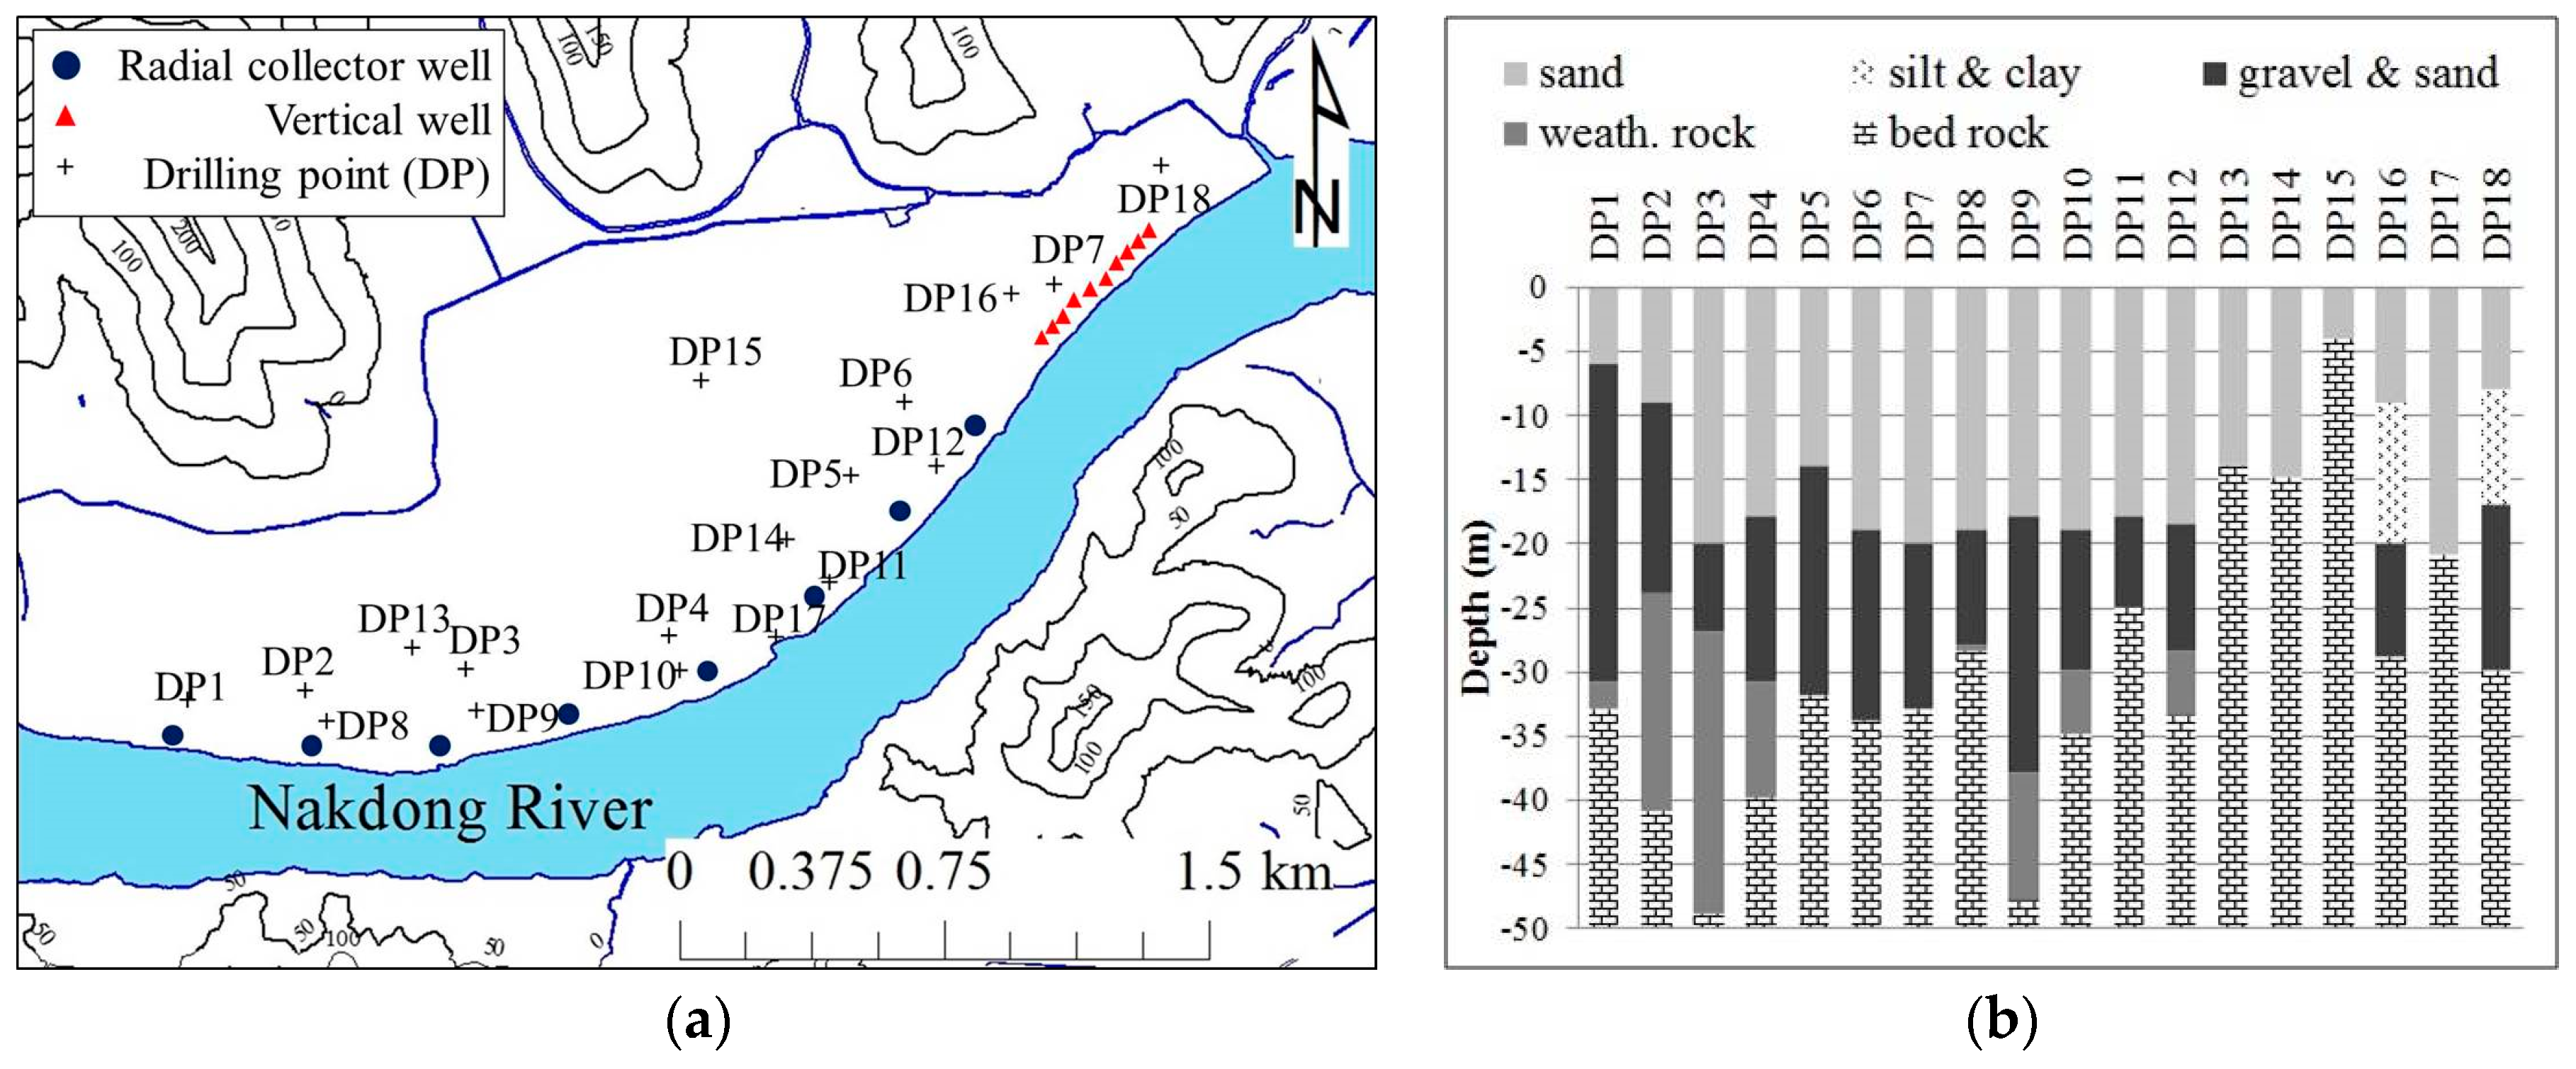
Dillon [19] reported 11 types of MAR. These include riverbank filtration (RBF) and aquifer storage transfer and recovery (ASTR). RBF extracts groundwater from a well or caisson near or under a river or lake to induce infiltration from the surface water body, thereby improving and making more consistent the quality of water recovered [19]. The Jeungsan-ri site uses RBF (Table 1). The site is situated south of the city 14 (Figure 1). Eight radial collector wells and 10 vertical wells are found along the main stream of the Nakdong River (Figure 2a). The strata in these areas are represented by sand, gravel and sand, and weathered rock, in this order. The RBF wells recover river water indirectly from the gravel and sand layers located 20–30 m underground (Figure 2b) and are capable of supplying a maximum of 680,000 m3/day [26]. Albeit, equally beneficial compared with other MAR types, RBF uses unconfined aquifers. It is thus relatively more sensitive to surrounding contamination. Furthermore, RBFs can lower groundwater levels and are incapable of storing water for the dry season.
Another MAR technique, aquifer storage transfer and recovery (ASTR), injects water into a well for storage and recovers it from a different well, generally providing additional water treatment. The MAR site for Samrak Park, west of the city 41 (Figure 1), has ASTR systems installed (Table 1). A location 50 m away from the main stream of the river holds eight extraction wells, nine injection wells, and eight observation wells (Figure 3a). Their strata consist of clay sand, sandy clay, sand, clay, gravel, and granite, in this order. Water injection and recovery take place in the sand and gravel layers 40–70 m underground (Figure 3b). The target is a 100,000 m3/day supply and a 107 m3 storage capacity. ASTR utilizes confined aquifers and are hence relatively safer from surrounding contamination. Capable of storing surface water, ASTR poses no problem to groundwater level reduction and can store water for the dry season. Furthermore, ASTR requires a large swath of confined aquifer and thick layers of clay.
3. Methods and Materials
3.1. Definition of Potential Risk
This study focuses on the assessment of the risk posed by chemical substances scattered around the basin. There must be numerous ways in which these chemicals can reach a water-related facility. Instead of calculating actual transport trajectories and their health risks, this study attempts to assess the potential risks that those chemicals can create.
Potential risk is a quantification of the detrimental impacts of chemical spills in cities located in river basins on drinking water supply facilities. The potential risks posed by each of the cities in a river basin can be expressed as functions of transfers, distance traveled, and chemical toxicity. With the existing information and data, it is infeasible to estimate the probability of each city having chemical spills, the volume of the chemicals transferring into a MAR site affected or the extent of economic damage incurred because of the transfers. Hence, the negative impact is indicated indirectly as potential risk. For the potential risk function, the distance traveled is converted as follows:
refers to the relative distance between city and the drinking-water supply facility, with 2 being allocated to the nearest city and 1 to the farthest. indicates the linear distance (m) between the drinking water supply facility and the city.
Figure 4 illustrates how potential risk is created from a specific city to a MAR site as a function of time and space. At time (), the total transfers () mean the amount of chemicals () to be transferred by a city (); varies with time, city, and the type of chemicals. The toxicity of chemicals is represented by , which varies with the type of the chemical substances. The potential risk for the city’s chemical spill transferring into the MAR site is indicated as , which is expressed as the multiplication of total transfers, toxicity, and distance. Equation (2) expresses potential risk as follows:
For time (years), indicates the potential risk posed by the city () on the MAR site in the wake of a chemical spill. Furthermore, , , , and represent the toxicity, number of chemicals, chemical substances, and total transfers (kg/yr), respectively.
3.2. Generation of Potential Risk
Safer operation of MAR sites could be achieved if it were possible to calculate the probability for a potential risk occurring, taking into account time and the city. Often, the time period for data is too short to compute the potential risk probability. This section of the paper describes a method for artificially generating the potential risk using a stochastic process so that an incomplete potential risk can be complemented.
Table 2 summarizes the processes for creating a new potential risk set using the stochastic approach after correcting slightly the potential risk probability calculated from raw data. Based on a new potential risk set, the probability distribution is fitted. When creating an frequency table in Step 1, some of the classes can have zero frequency. When the frequency is zero, that class cannot create any value, no matter how many potential risks are generated. For this study, it is hypothesized that, with the population, the frequency of all classes is other than 0. Reflecting the mentioned hypothesis, Step 2 allocates a small value (e.g., 0.1%) to the zero relative frequency to an extent that does not affect the distribution of the raw data so that all classes can have their own probability values when a potential risk is created. Step 3 refers to the process in which the relative frequencies of other classes are adjusted by the allocated small value (e.g., 0.1%). Based on the cumulative probability computed in Step 4, Step 5 artificially generates the potential risk. Step 6 fits the generated potential risk set to the probability distribution. The potential risk generated can be expressed as .
When generating potential risk, determining of (how many are generated) is an important matter. For instance, for city 41, Sasang-gu (a district in Busan), a series of Monte Carlo simulation is conducted. The experimental and control groups are and . of is 1 considering only city 41, and of is assigned from 30 to 330 at intervals of 30. of is also 1, and of is 14 because we have 14 years of raw data for total transfer. After computing the relative frequencies of and , the coefficient of correlation between their relative frequencies is computed. The whole process is repeated many times (e.g., 1000 times) and the results are presented in Figure 5. The results show that the increase of of leads the median of the correlation coefficient to approach approximately 1, decreasing the range of distribution of the correlation coefficient.
The reason for generating the is to complement the flaw of values that lack data. The generated potential risk sets have a slightly different distribution than that of , while remaining compliant with the cumulative probability of . In this process, it is important to ensure randomness (a sort of mutation) probability-wise. The small probability presented in Step 2 of Table 2 serves as a key for creating the mutation. However, as of generated increases, the role played by the small probability diminishes gradually, and the unexpectedness disappears following the distribution of . In other words, as of increases, the meaning or intention of granting the small probability is lost. From the foregoing point of view, it is then appropriate to generate having of 30 only, that is, the minimum recommended number for fitting statistically to the probability distribution.
3.3. Input Data
Among the variables that constitute the potential risk function, the transfers ( in Equation (2)) are subjected to data regarding pollutant release and transfer register (PRTR). The PRTR is a system that allows spontaneous reporting of transfers of chemicals that are moved outside of a business. PRTR specifically reports on the handling of transferred amounts of chemical substances that are discharged from the business to the atmosphere, water sources, and soil, or during disposal and treatment. The PRTR collects data on the amounts discharge and transfers in kg/year by year, area/region, substance, and business type. The system also allows the release of that information/data to the general public. The original intention of PRTR is to encourage businesses to spontaneously reduce the amount of chemical discharge. However, the intrinsic value of the PRTR as basic data is strong. Numerous studies have utilized the PRTR’s basic data when studying pollution assessment/evaluation [28,29], disaster risk assessment/evaluation [30,31], assessment/evaluation of pollutant leaks into the atmosphere [32], tracing of pollutants [33], and other environmental subjects.
Countries have used PRTRs for decades. In 1976, the Netherlands introduced a PRTR for the first time, followed by the United States in 1988. PRTR’s introduction eventually led to proving chemical discharge reduction effects [34]. In 1996, the Organization for Economic Co-operation and Development (OECD) produced a PRTR guidance manual and advised countries on its introduction [35]. Thereafter, South Korea started to implement the PRTR in 1999, published its official reports starting in 2002, and has posted data online since 2001 [36]. As of 2014, 3524 businesses (39 chemical business types) are subject to the survey, and 226 types of chemicals out of the 415 types under survey have been reported in South Korea.
Water pollution accidents due to chemical spills refer to an outdoor discharge of a substance that was not to be released into the environment. The amounts of discharge in PRTR indicate the amounts that are released as per the environmental laws and regulations; accordingly, such amounts are not termed as chemical spills, and hence no water pollution accident is then noted. On the contrary, the amounts of the transfers in PRTR refer to the amounts of substances that are forbidden for release into the environment and as such, the amounts can lead to a water pollution accident. Hence, transfers can express the potential risks of water pollution incidents.
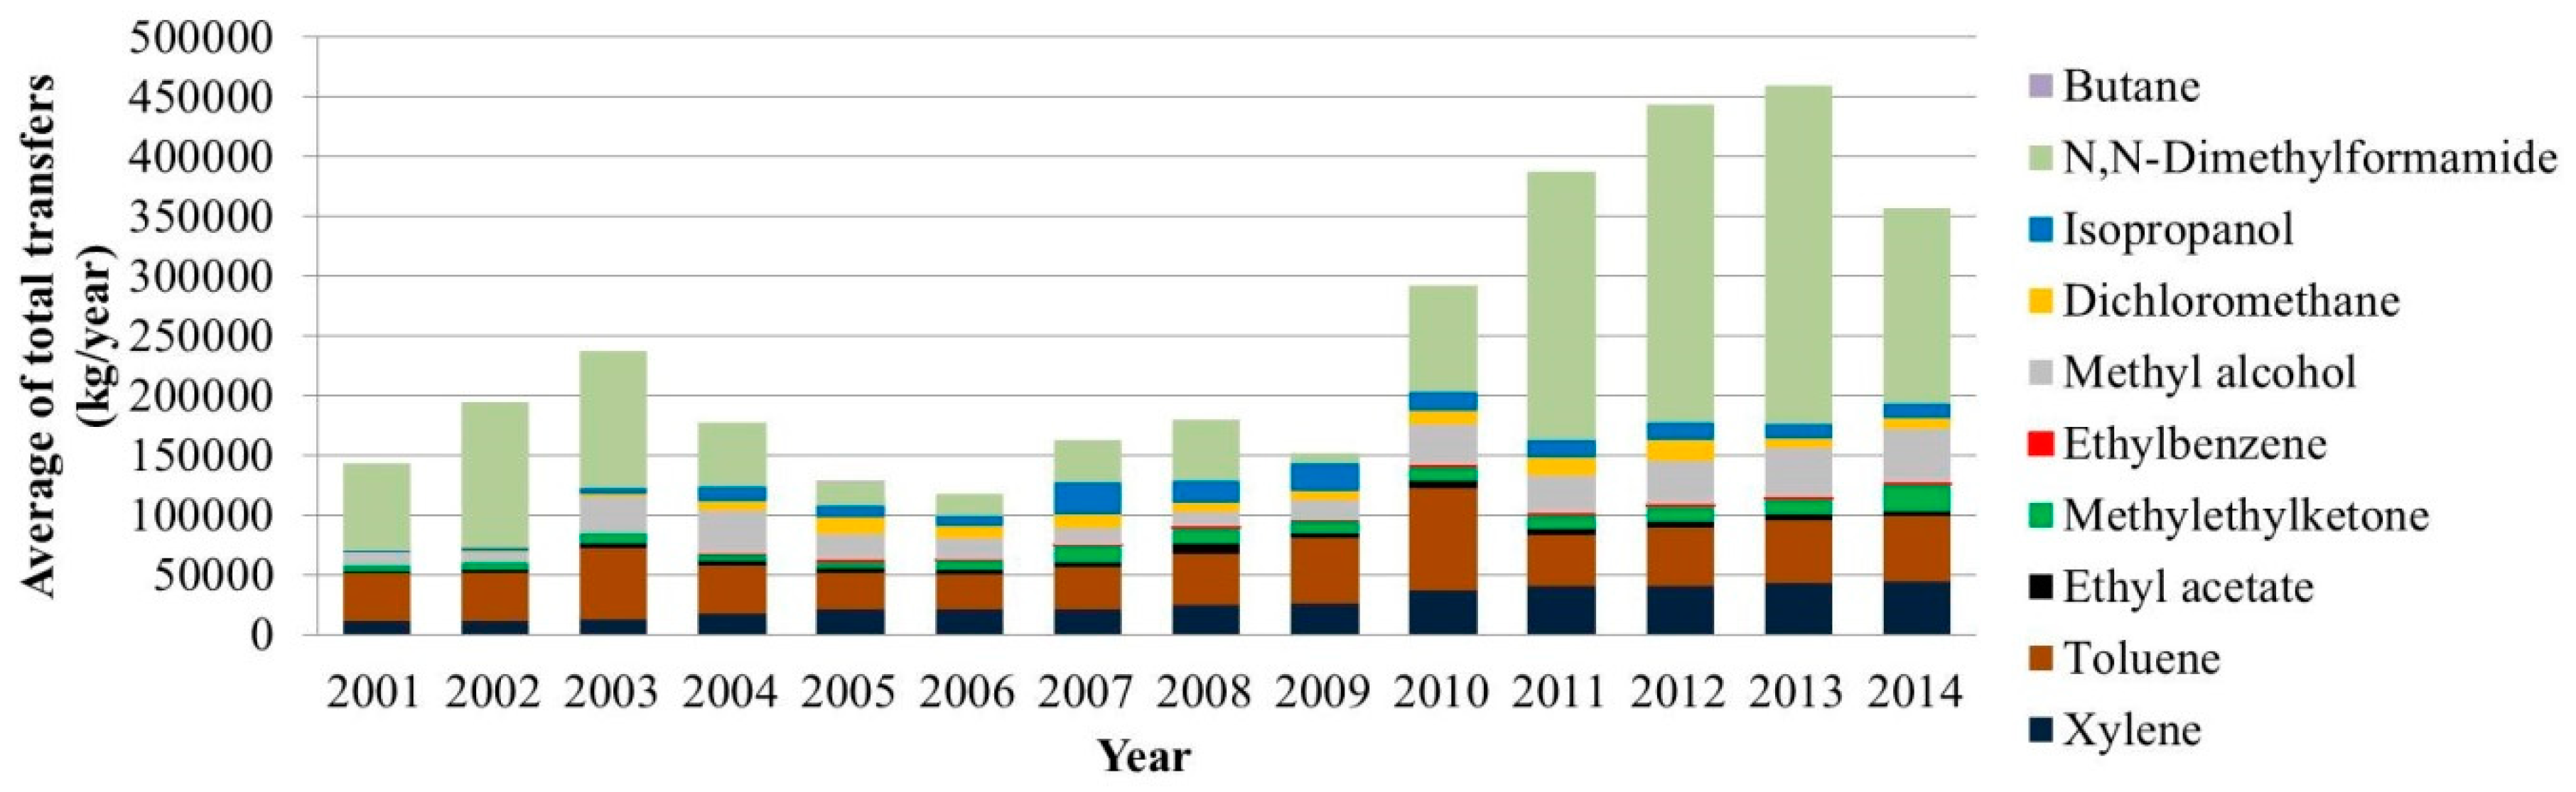
Transfers are typically divided into the amount of chemicals that are contained inside the wastewater moved outside a business or the said amount contained in waste matter likewise disposed of. This study combines both categories, using the total transfers for in Equation (2). The targets of analysis are the 10 principal chemical substances presented in Table 3. The total transfers are based on the data collected for 14 years (from 2001 and 2014) from 42 cities regarding these 10 major chemicals. Figure 6 shows the changes that occurred in the 42 cities’ average total transfers over the 14-year period. The average total transfer was 14,300 kg/year in 2001, which then increased to 35,700 kg/year in 2014. Of the total transfers, the percentage of N,N-Dimethylformamide is the highest, whereas there is hardly any presence of butane. Overall, the transfers display an upward trend, with the highest growth rate shown by N,N-Dimethylformamide.
Toxicity ( in Equation (2)) used in this study refers to the health index in NFPA 704, the code requirement issued by the National Fire Protection Association (NFPA). According to NFPA [38], the health index is allocated based on sufficient numbers of tests using albino mice on intake, contact, and inhalation; hence, adequate reference information exists regarding toxicity. The NFPA 704 index gives 0 as the lowest level of toxicity and 4 as the highest. The toxicity of 10 targeted substances was found to be either 1 or 2, indicating only a mild level.
Distance ( in Equation (1)) indicates the linear distance between the MAR site and the city. The detrimental impact of released chemicals on a MAR site decreases if the chemicals have to travel farther from their spill source. This is because the amounts spilled will then dwindle through dispersion, adsorption, reaction, and evaporation, as well as provide more time for the concerned parties to respond. Hence, this study uses relative distance ( in Equation (1)) as the inverse scale of the linear distance. For relative distance, the city at number 1 has a value of 1, the smallest value, while the city at number 41 is represented by 2, the largest value.
4. Results and Discussion
4.1. Exceedance Probability of Potential Risk
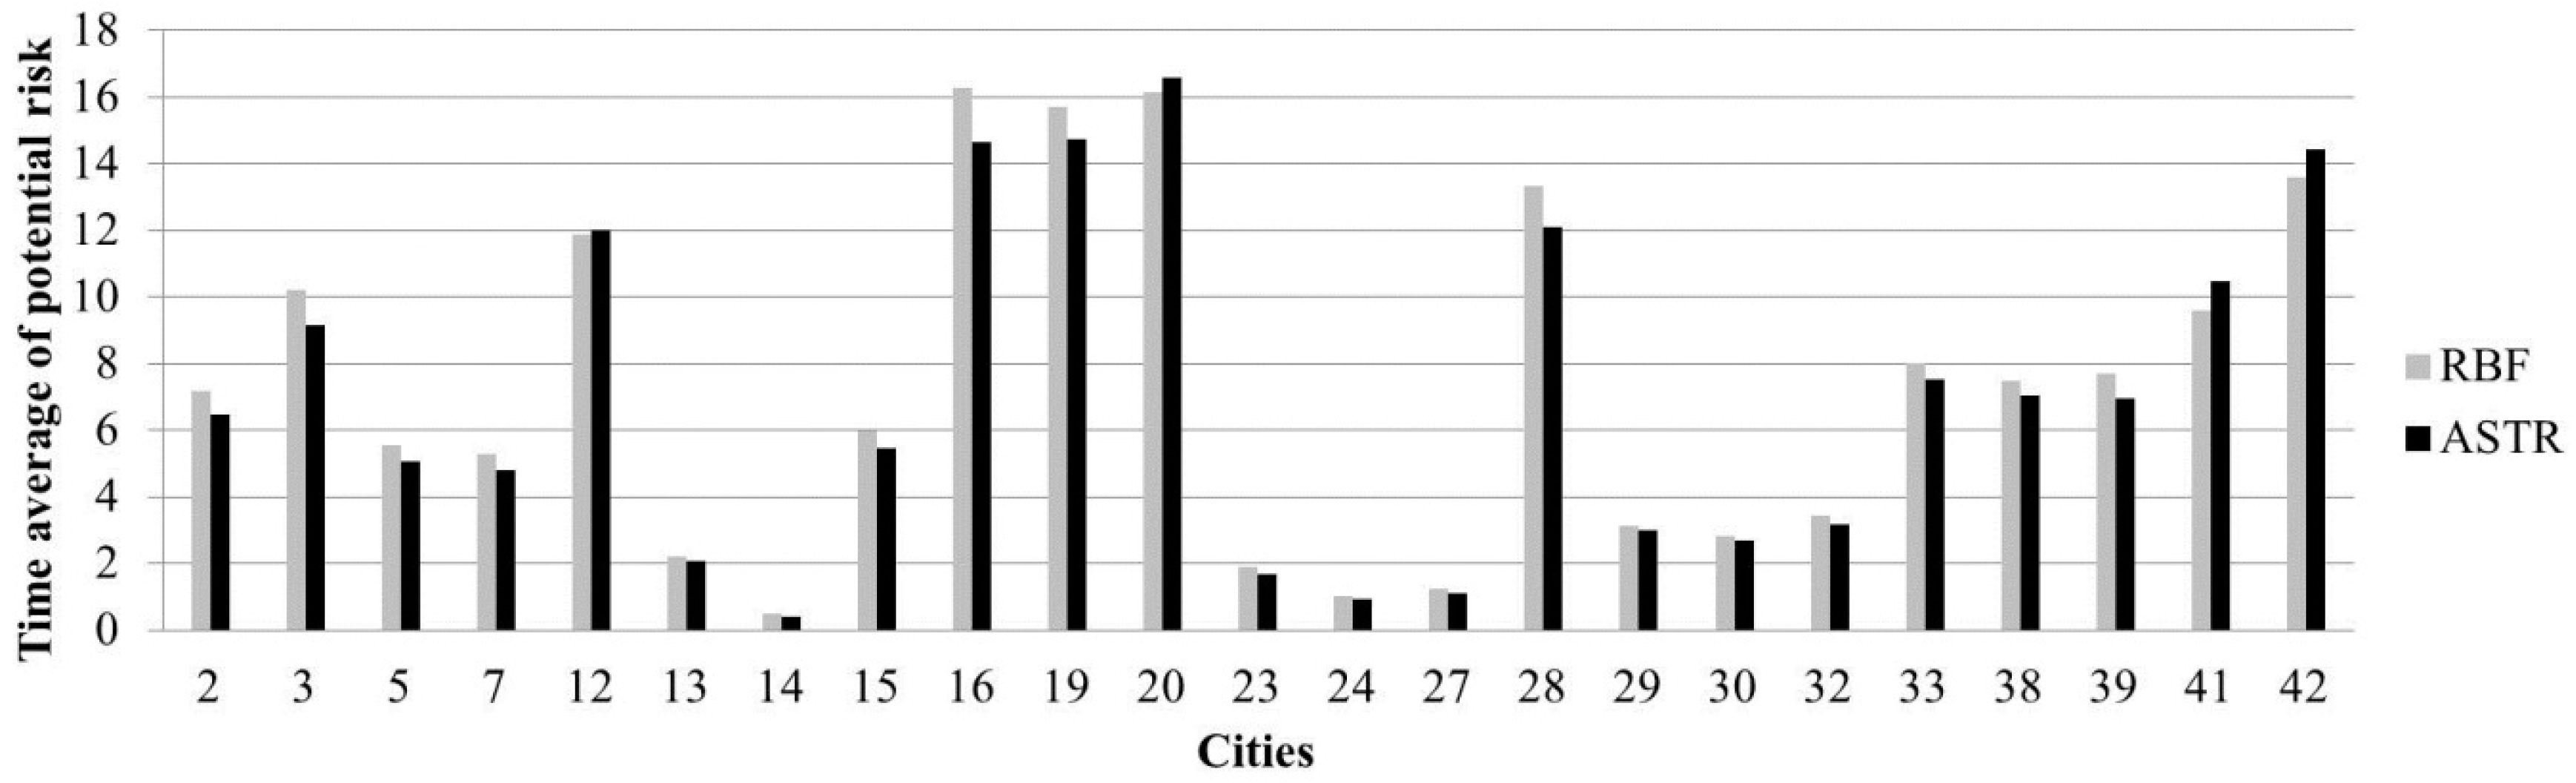
Although the targets of the study are 42 cities, the analysis excluded 20 cities with no transfer in chemicals, leaving 22 cities for analysis. Transfers, toxicity, and distance data were entered to Equations (1) and (2) to calculate . Figure 7 lists the average potential risk for each city over the past 14 years for the Jeunsan-ri RBF and Samrak Park ASTR. In 18 cities (over 50%), a greater potential risk was identified in the Jeungsan-ri RBF. Moreover, city numbers 12, 16, 19, 20, 28, and 42 were found to have an extremely large level of potential risk.
According to Table 2, the potential risk was generated artificially from . Thirty-year-long were fitted to the probability distribution. The cumulative probability distribution function of potential risk can be converted into the exceedance probability distribution based on Equation (3).
Exceedance probability refers to the probability that a potential risk exceeds a specified level of potential risk. For instance, in Figure 8a, the probability that a potential risk exceeds a value of 20 is 12% for city number 16 (RBF) and 15% for city number 42 (ASTR). The foregoing can be expressed as follows:
The potential risk in a city can be stated as high when there is an increased probability of a higher potential risk occurring. Accordingly, when the exceedance probability () for a 10-year-return period is 0.1 (10%), a city was considered to have a higher level of potential risk if it was situated farther to the right of the graph. Based on the mentioned criteria, the comparisons between cities showed that the cities with the greatest potential risk were city number 16 for RBF and city number 42 for ASTR. Figure 8a shows the exceedance probability distributions of these two cities. City number 16 showed a normal distribution, with its potential risk distribution ranging roughly between 11 and 23. For ASTR, the intercity comparisons confirmed city number 42 with the highest level of potential risk. City number 42 also showed a normal distribution where, overall, the potential risk was evenly distributed. Notably, when the potential risk was at least 20, the corresponding exceedance probability was shown to be at a level that overwhelmingly outperformed that of the other cities. In Figure 8a, the exceedance probability for the RBF was higher in sections with potential risks no greater than 19. However, in sections with potential risks greater than 19, the exceedance probability for ASTR was found to be higher. When using an exceedance probability of 0.1 as the reference value, the potential risk for ASTR was higher.
For RBF and ASTR, Figure 8b shows the cities with the seventh-highest potential risk. City number 3 for the RBF showed a three-variable-based Weibull distribution; city number 41 for ASTR had a Weibull distribution using two variables. City number 3 for RBF and city number 41 for ASTR crossed near potential risk of 11. Where the potential risk was at or below 11, the exceedance probability of ASTR city number 41 was higher. For a potential risk above 11, the exceedance probability of RBF city number 3 was higher. Using the aforementioned Q = 0.1 as the reference, the potential risk of RBF city number 3 was higher.
Figure 8c illustrates the cities with the eighth-highest potential risk for RBF and ASTR. The RBF city number 33 followed a Gumbel distribution, and ASTR city number 39 followed a three-variable Weibull distribution. Against all levels of potential risk, RBF city number 33 ranked above ASTR city number 39 in terms of exceedance probability.
4.2. Return Period of Potential Risk
Exceedance probability was converted into a return period using Equation (4), where the return period refers to the occurrence cycle for a particular potential risk. A return period is used in engineering for designing a structure robust against rainfall, flood discharge, wave height, and so forth. Typically, return periods of 10, 50, and 100 years are considered. This study, too, considered the same return periods.
and are the exceedance probability and return period, respectively. Table 4 shows how the use of Equation (4) leads to the calculation of potential risk for the top 10 cities for RBF and ASTR, whose respective potential risks are likely to be higher regarding return periods of 10, 50, and 100 years. When comparing potential risk for the first- and second-highest cities in each of the sites, ASTR data were found to have higher values. Notably, far greater differences were found for the top-ranked cities in terms of the 50- and 100-year return periods. However, for the second-highest-ranked cities, the RBF data gained ground gradually. For = 10, ASTR was higher by 0.61, whereas the RBF for = 50 and 100 were higher by 1.06 and 1.69, respectively. For the third-highest cities, the potential risk for = 10 showed higher values for RBF, whereas the potential risk for = 50 and 100 showed higher values for ASTR. For the fourth-highest cities, RBF was higher for = 10 and 50, while ASTR was higher for = 100. For ranks of fifth and below, higher values for RBFs were shown. In particular, at the eighth rank, the RBF’s potential risk for = 100 exceeded the ASTR’s by 10.65, thus accounting for the largest difference. The comparison of the exceedance probability distribution for the potential risk for the top 10 cities revealed that, overall, RBF facilities were at greater risk.
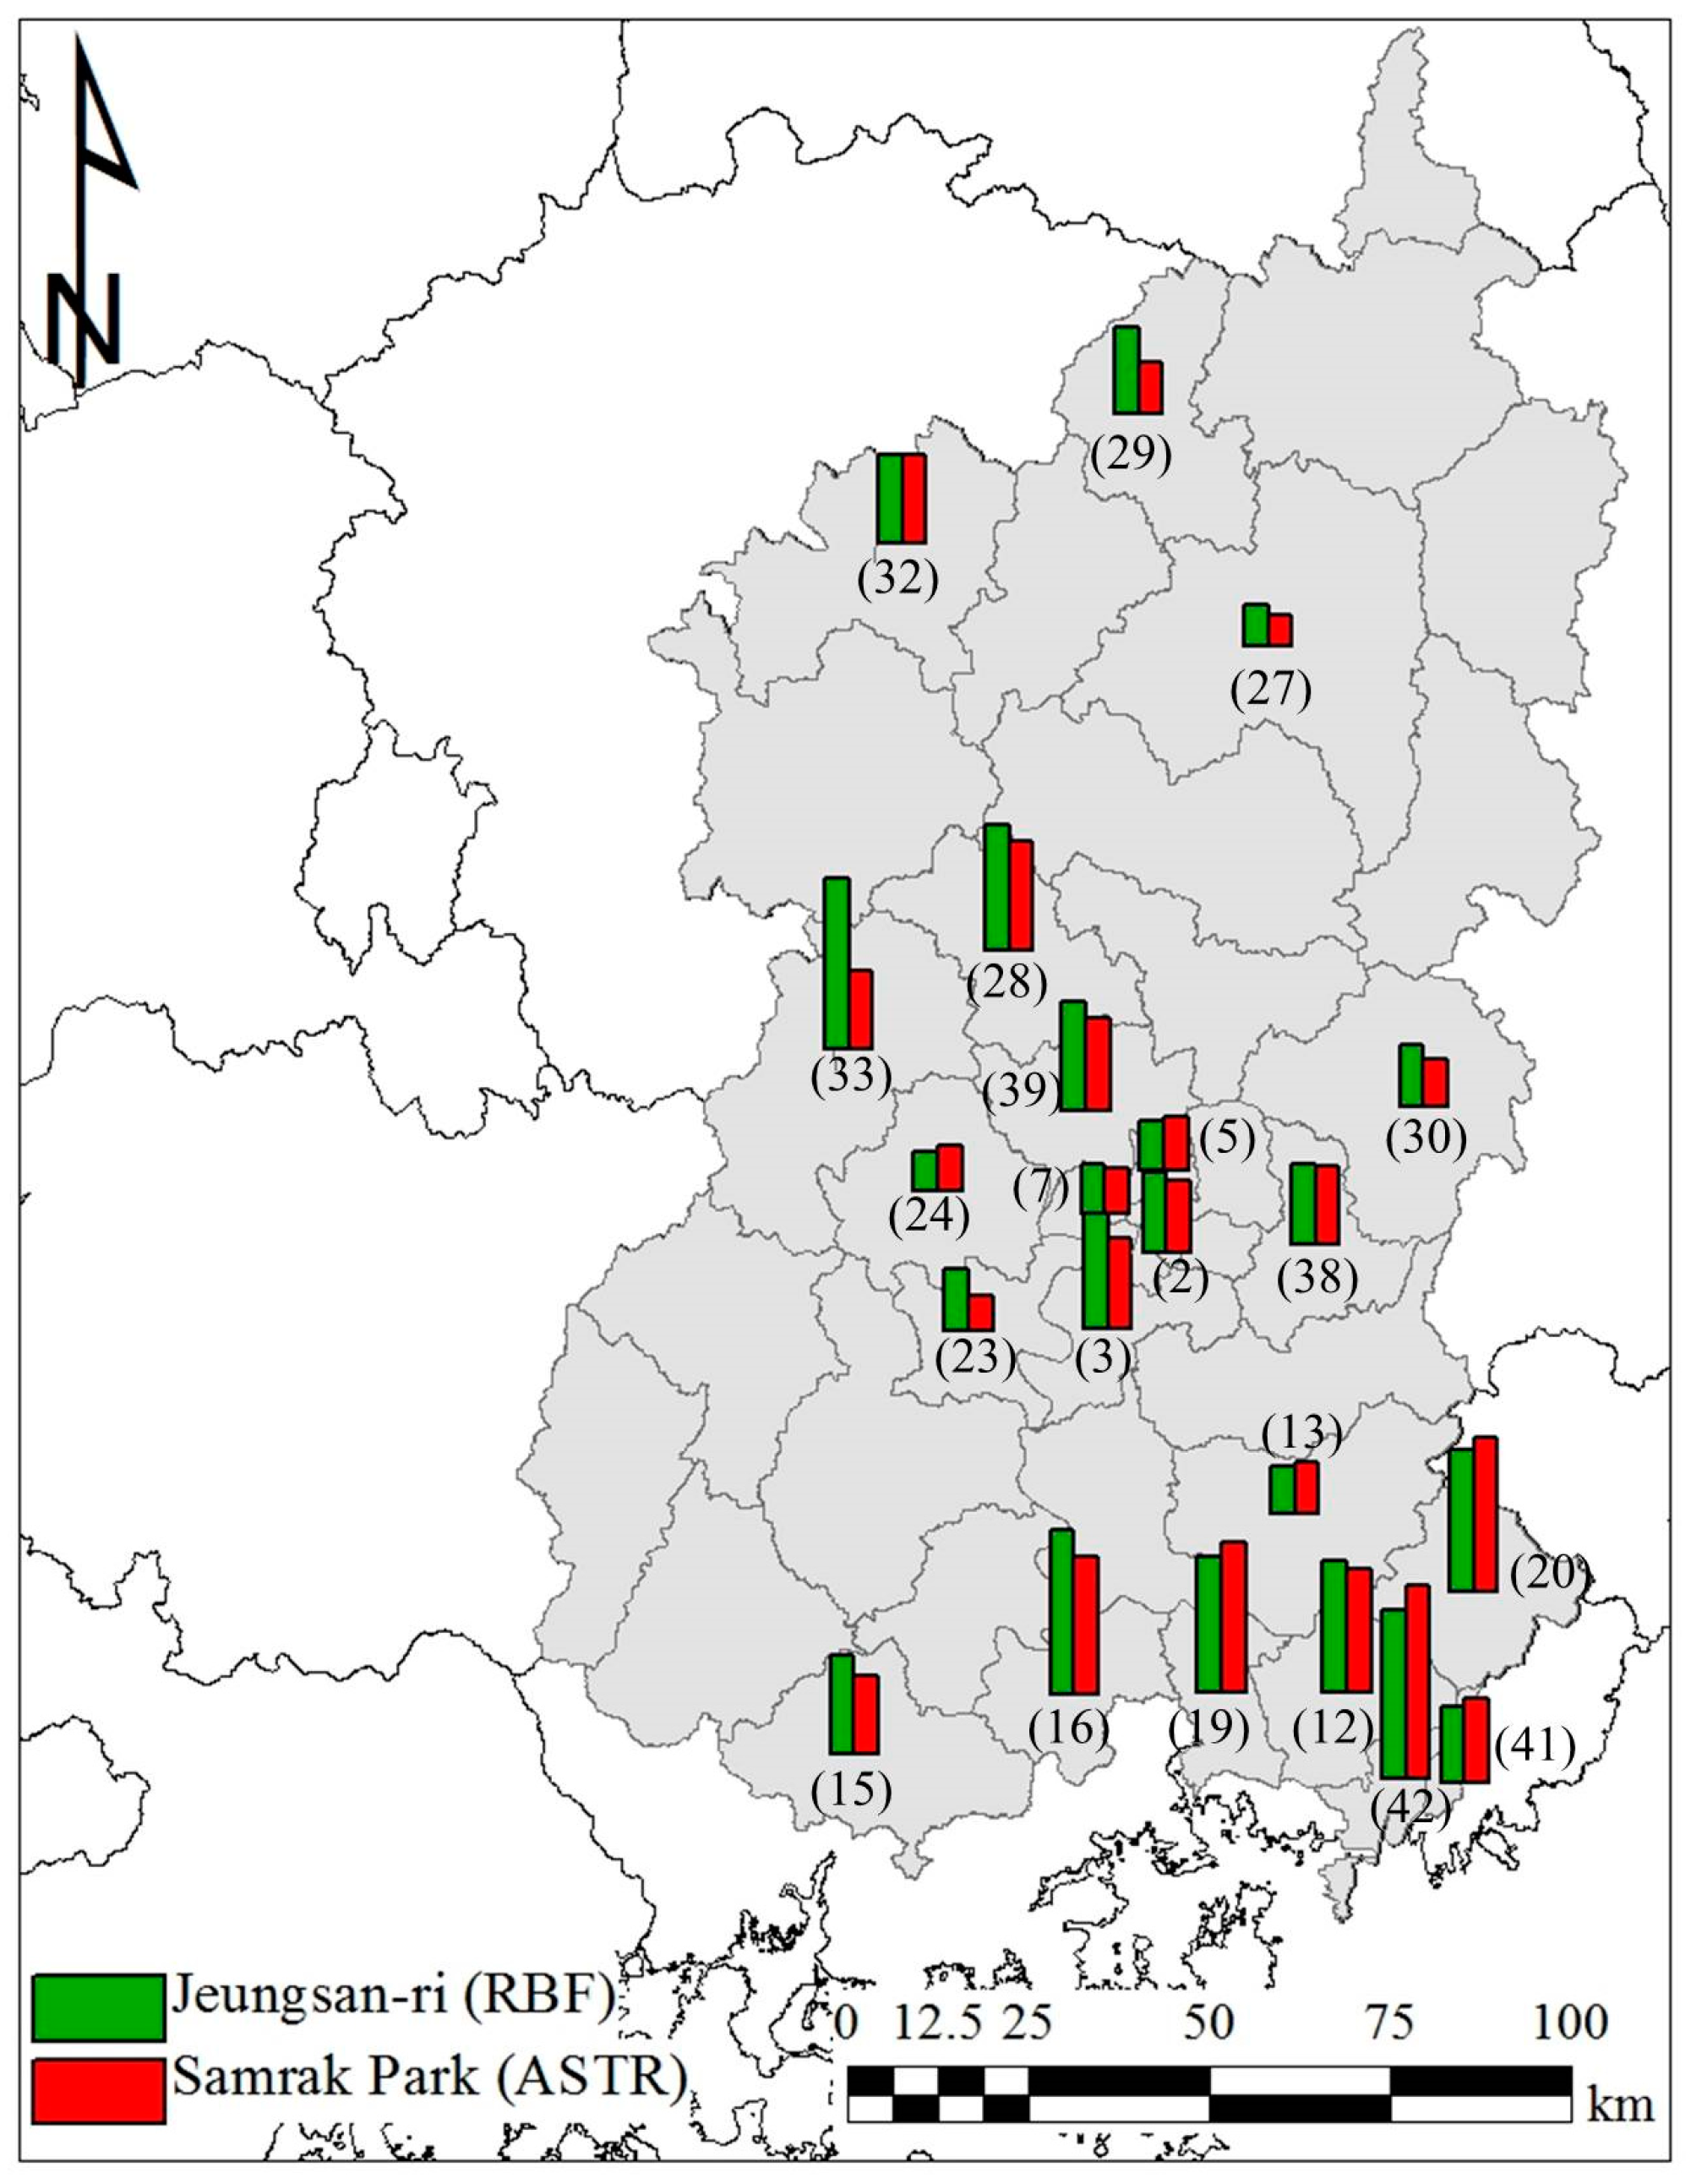
Figure 9 represents a map with the potential risks for a 100-year return period. What commonly emerged across the RBF case (green bars) and ASTR case (red bars) was a greater risk shown for cities located closer to the southern coast. City number 42 is part of Busan, the second-most densely populated metropolitan city in South Korea, and has concentrated industrial areas. City numbers 12, 19, and 20 are all satellite towns of Busan, enjoying advanced industries. Given that the foregoing cities are closely located to Samrak Park and Jeungsan-ri, they are expected to have higher levels of potential risk in terms of socioeconomics.
Differences between the RBF and ASTR cases were noted. The RBF case showed city numbers 16, 33, and 42 to have potential risk of at least 20 for = 100. Higher levels of potential risks were found not only in the coastal area south of the Nakdong River basin, but in the central areas as well. City number 33 (Gimcheon) located in the center of the river basin has a far greater population dedicated to tertiary industry (service) rather than to agriculture; however, Gimcheon Industrial Complexes 1 and 2, along with four other agricultural and industrial complexes, have likely contributed to higher levels of potential risk. Although the potential risk for T = 100 is lower than 20, city number 3 (Dalseong-gun) has high potential risk value in the center of the river basin. City number 3 is part of Daegu, South Korea’s representative industrial megalopolis. Since the 1960s, Daegu has enjoyed national attention for rapid industrial development, resulting in 26.1% of the businesses in city number 3 being manufacturers; hence, a greater potential risk may manifest in this zone.
In contrast, the ASTR case was found to have cities with potential risks of at least 20 for = 100. These include city numbers 19, 20, and 42, all of which are concentrated in the southern coastal area. Of these, city number 42 shows a particularly high potential risk. Its risk value was 26.63 for = 100, representing the highest value across RBF and ASTR cases. Overall, a comparison between RBF and ASTR cases amongst the relevant cities revealed a greater risk present in the RBF case.
4.3. Discussion
Along with growing industry, the amounts of chemicals in use and their transported volumes will both continue to increase. Accordingly, chemical spill incidents will also increase, risking the operation of drinking water supply facilities. The risks include discontinuation of the water supply and contamination of potable water owing to chemical spills. Since MAR facilities store large quantities of raw water in aquifers and utilize the stored water, these facilities enjoy flexibility against the mentioned discontinuation of the water supply; but they are not free from the risks of drinking water contamination. Recovering aquifer from toxic-chemical-induced contamination is extremely difficult.
This study applied potential risk analysis to two sites, one RBF and one ASTR, and compared the results. This study then applied those results to propose more advantageous conditions for addressing potential risk. One of the sites, Samrak Park (ASTR), is located near the Nakdong River mouth, which is close to the megalopolis of Busan. However, the location of ASTR puts distance between Samrak Park and the other cities that were investigated in the study. In contrast, Jeungsan-ri (RBF), albeit distant from Busan, is situated in the central part of the river basin, closer to other cities. Accordingly, there were four cities in the ASTR case with potential risks at or above 20, and the corresponding number for the RBF case was seven. Having more targets for management, the RBF case presents relatively more challenging aims for potential risk management. The results indicate that a remotely located city rather than a city surrounded by a number of other cities is at an advantage. In other words, managing single rather than multiple contamination sources is easier.
The potential risk analysis aims to ensure safe operation of potable water supply facilities. The analyses may also contribute to the selection of future MAR sites by comparing data on potential sites to other areas or regions. Based on the results of this study, Samrak Park was a better candidate for a MAR site in terms of chemical-spill-induced accident risk management.
Ordinarily, MAR sites are selected based on hydrogeological data. To assess appropriate MAR sites, Lee and Lee [39] and Brown et al. [40] emphasized factors relating to the injection, storage, and use of surface water. Brown et al. [41] and Rahman et al. [42] addressd a spatial analytical methodology with land use. However, none of the previous studies have used the PRTR’s chemical transfer data for selecting MAR sites. PRTR offers more direct information/data on chemical substances rather than land use. Therefore applying PRTR data to the selection of MAR sites could prove more useful, provided that the source of contamination is taken into consideration.
This study presented a new paradigm in that it proposes drinking water supply facilities be directly involved in river basin management. Traditionally, government or local governing bodies have led the implementation of basin management policies, while water supply facilities operated accordingly. This study proposes that, through conducting a potential risk analysis for each target city, a drinking water supply facility may proactively make requests to the local government to take measures against potential risks. Such active participation in river basin management could help protect against potential risks of potable water contamination and/or water supply discontinuation.
5. Conclusions
In order to supply tap water at reasonable prices, drinking water supply facilities have optimized purification processes. As a result, such facilities have become susceptible to raw water contamination resulting from chemical spills. Given the trend of an increasing number of chemical leak incidents each year, a potential risk analysis can be applied as a solution for ensuring safe operation of potable water supply facilities.
Likewise, such an analysis may protect facilities against water supply stoppage and water contamination. Conducting potential risk analysis offers the following two advantages: (1) it encourages water supply facilities to actively manage river basins; and (2) it contributes to the selection of MAR sites. Whereas previous environment- or water-related risk analyses have utilized hydrogeological data and land use data, this study offers the merit of introducing the PRTR to potential risk analysis.
For the purpose of this study, the potential risk analysis was applied to South Korea’s Jeungsan-ri RBF and Samrak Park ASTR sites. Results of the two cases were compared, and more advantageous conditions were presented in terms of potential risk. The results revealed a greater potential risk was found in the RBF case located upstream of the river relative to the ASTR case in the river mouth area. When new water supply facilities such as RBF or ASTR are developed in a densely populated and industrialized river basin, the evaluation of site suitability based on risks is a difficult task. In this work, the potential risk was defined and evaluated by considering the amount of chemical transfer, relative distance and toxicity. Analysis results quantify the risk a city poses on the facility under consideration and provides valuable information for the comparative evaluation of development alternatives and for proactive management of important water-related facilities. The concept of potential risk studied here can provide an additional tool to planners to be used in conjunction with geological and hydrogeological assessment methods. Once cities or chemicals having high potential risk are identified from preliminary analysis, the in-depth assessment of real risk can be made by taking hydrogeological processes into account. Further research is needed to develop practical basin-scale risk assessment tools which will contribute to the operation of drinking water supply facilities more effectively.
Acknowledgments
This research was supported by Basic Science Research Program through the National Research Foundation (NRF) funded by the ministry grant (NRF-2015R1D1A1A09060690). This research was supported by a grant (code 17AWMP-B066761-05) from AWMP Program funded by Ministry of Land, Infrastructure and Transport of Korean government.
Author Contributions
Hyon Wook Ji and Sang-Il Lee made substantial contributions to the conception and design of the study and were involved in critically revising the manuscript in terms of intellectual content.
Conflicts of Interest
The authors declare no conflict of interest.
References
- Capel, P.D.; Giger, W.; Reichert, P.; Wanner, O. Accidental input of pesticides into the Rhine River. Environ. Sci. Technol. 1988, 22, 992–997. [Google Scholar] [CrossRef] [PubMed]
- Kim, D.H.; Lee, S.K.; Chun, B.Y.; Lee, D.H.; Hong, S.C.; Jang, B.K. Illness associated with contamination of drinking water supplies with phenol. J. Korean Med. Sci. 1994, 9, 218–223. [Google Scholar] [CrossRef] [PubMed]
- Cooper, W.J. Responding to crisis: The West Virginia chemical spill. Environ. Sci. Technol. 2014, 48, 3095. [Google Scholar] [CrossRef] [PubMed]
- National Response Center (NRC) Data Download. Available online: http://nrc.uscg.mil/ (accessed on 5 September 2017).
- K-Water. Available online: http://www.water.or.kr/wstatic/easy/easys030101.do (accessed on 1 December 2016).
- Dore, M.H. Global Drinking Water Management and Conservation, Optimal Decision-Making; Springer: Cham, Switzerland, 2014; pp. 117–136. [Google Scholar]
- Business Dictionary. Available online: http://www.businessdictionary.com/definition/risk.html (accessed on 16 January 2016).
- Jiang, J.; Wang, P.; Lung, W.S.; Guo, L.; Li, M. A GIS-based generic real-time risk assessment framework and decision tools for chemical spills in the river basin. J. Hazard. Mater. 2012, 227, 280–291. [Google Scholar] [CrossRef] [PubMed]
- Bryant, D.L.; Abkowitz, M.D. Estimation of terrestrial chemical spill risk factors using a modified Delphi approach. J. Environ. Manag. 2007, 85, 112–120. [Google Scholar] [CrossRef] [PubMed]
- Lim, S.R.; Lam, C.W.; Schoenung, J.M. Priority screening of toxic chemicals and industry sectors in the US toxics release inventory: A comparison of the life cycle impact-based and risk-based assessment tools developed by US EPA. J. Environ. Manag. 2011, 92, 2235–2240. [Google Scholar] [CrossRef] [PubMed]
- Ariyadasa, B.; Kondo, A.; Inoue, Y. Screening for potentially hazardous PRTR chemicals in the Lake Biwa-Yodo River basin of Japan using a one-box multimedia model. Environ. Sci. Pollut. Res. 2015, 22, 2757–2764. [Google Scholar] [CrossRef] [PubMed]
- Bartram, J.; Corrales, L.; Davison, D.; Drury, D.; Gordon, B.; Howard, G.; Rinehold, A.; Stevens, M. Water Safety Plan Manual: Step-by-Step Risk Management for Drinking-Water Suppliers; World Health Organization: Geneva, Switzerland, 2009. [Google Scholar]
- Havelaar, A.H. Application of HACCP to drinking water supply. Food Control 1994, 5, 145–152. [Google Scholar] [CrossRef]
- Ji, H.W.; Lee, S.-I. Assessment of risk due to chemicals transferred in a watershed: A case of an aquifer storage transfer and recovery site. Water 2016, 8, 242. [Google Scholar] [CrossRef]
- Ji, H.W.; Lee, S.-I. Use of pollutant release and transfer register (PRTR) to assess potential risk associated with chemicals in a drinking water supply facility. Desalination Water Treat. 2016, 57, 29228–29239. [Google Scholar] [CrossRef]
- Jung, S.-H.; Park, H.-K.; Lee, H.-J.; Lee, S.-H. Effect of climate change for diatom bloom at winter and spring season in Mulgeum Station of the Nakdong River, South Korea. J. Korean Soc. Water Environ. 2013, 29, 155–164. (In Korean) [Google Scholar]
- Lee, J.-K.; Kim, T.-O.; Jung, Y.-J. Analysis of domestic water pollution accident and response management. J. Wetl. Res. 2013, 15, 529–534. (In Korean) [Google Scholar] [CrossRef]
- Seo, J.Y.; Lee, S.-I. Integration of GRACE, ground observation, and land-surface models for groundwater storage variations in South Korea. Int. J. Remote Sens. 2016, 37, 5786–5801. [Google Scholar] [CrossRef]
- Dillon, P. Future management of aquifer recharge. Hydrogeol. J. 2005, 13, 313–316. [Google Scholar] [CrossRef]
- Maliva, R.G.; Missimer, T.M. Aquifer Storage and Recovery and Managed Aquifer Recharge Using Wells: Planning, Hydrogeology, Design and Operation; Schlumberger: Sugar Land, TX, USA, 2010; pp. 8–9. [Google Scholar]
- Missimer, T.M.; Guo, W.; Maliva, R.G.; Rosas, J.; Jadoon, K.Z. Enhancement of wadi recharge using dams coupled with aquifer storage and recovery wells. Environ. Earth Sci. 2015, 73, 7723–7731. [Google Scholar] [CrossRef]
- Levantesi, C.; La Mantia, R.; Masciopinto, C.; Böckelmann, U.; Ayuso-Gabella, M.N.; Salgot, M.; Tandoi, V.; Van Houtte, E.; Wintgens, T.; Grohmann, E. Quantification of pathogenic microorganisms and microbial indicators in three wastewater reclamation and managed aquifer recharge facilities in Europe. Sci. Total Environ. 2010, 408, 4923–4930. [Google Scholar] [CrossRef] [PubMed]
- Parsons, S.; Dillon, P.; Irvine, E.; Holland, G.; Kaufman, C. Progress in Managed Aquifer Recharge in Australia; Waterlines Report; National Water Commission: Canberra, Australia, 2012; pp. 11–12. [Google Scholar]
- United States Environmental Protection Agency (EPA). Available online: https://www.epa.gov/uic/aquifer-recharge-and-aquifer-storage-and-recovery (accessed on 28 July 2017).
- Callahan, M.; Vaughan, E.G.; Crutcher, J.M.; Labatt, T.W., III; McMahan, L.H.; Bradford, B.R., Jr.; Cluck, M. 2012 State Water Plan; Texas Water Development Board: Austin, TX, USA, January 2012.
- Lee, D.; No, J.H.; Kim, H.C.; Choi, J.W.; Choi, I.H.; Maeng, S. Effect of silver nanoparticles on the performance of riverbank filtration: Column study. J. Korean Soc. Water Wastewater 2015, 29, 77–88. (In Korean) [Google Scholar] [CrossRef]
- Lee, E.; Hyun, Y.; Lee, K.-K.; Kim, H.-S.; Jeong, J.-H. Evaluation of well production by a riverbank filtration facility with radial collector well system in Jeungsan-ri, Changnyeong-gun, Korea. J. Soil Groundw. Environ. 2010, 15, 1–12. (In Korean) [Google Scholar]
- Matsui, S. Drainage basin security of hazardous chemical fluxe in the Yodo River basin. Water Sci. Technol. 2004, 49, 189–197. [Google Scholar] [PubMed]
- Ozaki, M.; Suwa, M.; Suzuki, Y. Study on risk management of heavy metals for reuse of biosolids. Water Sci. Technol. 2006, 53, 189–195. [Google Scholar] [CrossRef] [PubMed]
- Hartmann, J.; Okada, N.; Levy, J.K. Integrated disaster risk management strategy to prevent exposure to hazardous substances due to inundation triggered releases: A concept for Japan. J. Nat. Disaster Sci. 2004, 26, 87–93. [Google Scholar]
- Sekizawa, J.; Ohtawa, H.; Yamamoto, H.; Okada, Y.; Nakano, T.; Hirai, H.; Yamamoto, S.; Yasuno, K. Evaluation of human health risks from exposures to four air pollutants in the indoor and the outdoor environments in Tokushima, and communication of the outcomes to the local people. J. Risk Res. 2015, 10, 841–851. [Google Scholar] [CrossRef]
- Fred, T.; Heinonen, M.; Sundell, L.; Toivikko, S. Air emissions at large municipal wastewater treatment plants in Finland for national E-PRTR reporting register. Water Pract. Technol. 2009, 4. [Google Scholar] [CrossRef]
- Hoshi, J.Y.; Amano, S.; Sasaki, Y.; Korenaga, T. Investigation and estimation of emission sources of 54 volatile organic compounds in ambient air in Tokyo. Atmos. Environ. 2008, 42, 2383–2393. [Google Scholar] [CrossRef]
- United States Environmental Protection Agency (EPA). Toxics Release Inventory; United States Environmental Protection Agency: Washington, DC, USA, 1995.
- The Organisation for Economic Co-operation and Development (OECD). ENV/EPOC(2000)8/FINAL. 2000. Available online: http://www.oecd.org/officialdocuments/displaydocument/?doclanguage=en&cote=env/epoc(2000)8/final (accessed on 5 September 2017).
- PRTR Information System. Available online: http://ncis.nier.go.kr/triopen (accessed on 3 March 2017).
- National Institute of Chemical Safety. Available online: http://kischem.nier.go.kr/kischem2/wsp/main/main.jsp (accessed on 2 May 2015).
- National Fire Protection Association (NFPA). NFPA 704: Standard System for the Identification of the Hazards of Materials for Emergency Response, 2012 ed.; NFPA: Boston, MA, USA, 2012; pp. 8–16. [Google Scholar]
- Lee, S.I.; Lee, S.S. Site suitability analysis for riverbank filtration using game theory. J. Korea Water Resour. Assoc. 2010, 43, 95–104. (In Korean) [Google Scholar] [CrossRef]
- Brown, C.J.; Ward, J.; Mirecki, J. A revised brackish water aquifer storage and recovery (ASR) site selection index for water resources management. Water Resour. Manag. 2016, 30, 2465–2481. [Google Scholar] [CrossRef]
- Brown, C.J.; Weiss, R.; Verrastro, R.; Schubert, S. Development of an aquifer, storage and recovery (ASR) site selection suitability index in support of the comprehensive everglades restoration project. J. Environ. Hydrol. 2005, 13, 20. [Google Scholar]
- Rahman, M.A.; Rusteberg, B.; Gogu, R.C.; Ferreira, J.L.; Sauter, M. A new spatial multi-criteria decision support tool for site selection for implementation of managed aquifer recharge. J. Environ. Manag. 2012, 99, 61–75. [Google Scholar] [CrossRef] [PubMed]
Figure 1.
(a) Location of Managed Aquifer Recharge (MAR) sites (Jeungsan-ri and Samrak Park); (b) the cities in the Nakdong River Basin.
Figure 1.
(a) Location of Managed Aquifer Recharge (MAR) sites (Jeungsan-ri and Samrak Park); (b) the cities in the Nakdong River Basin.
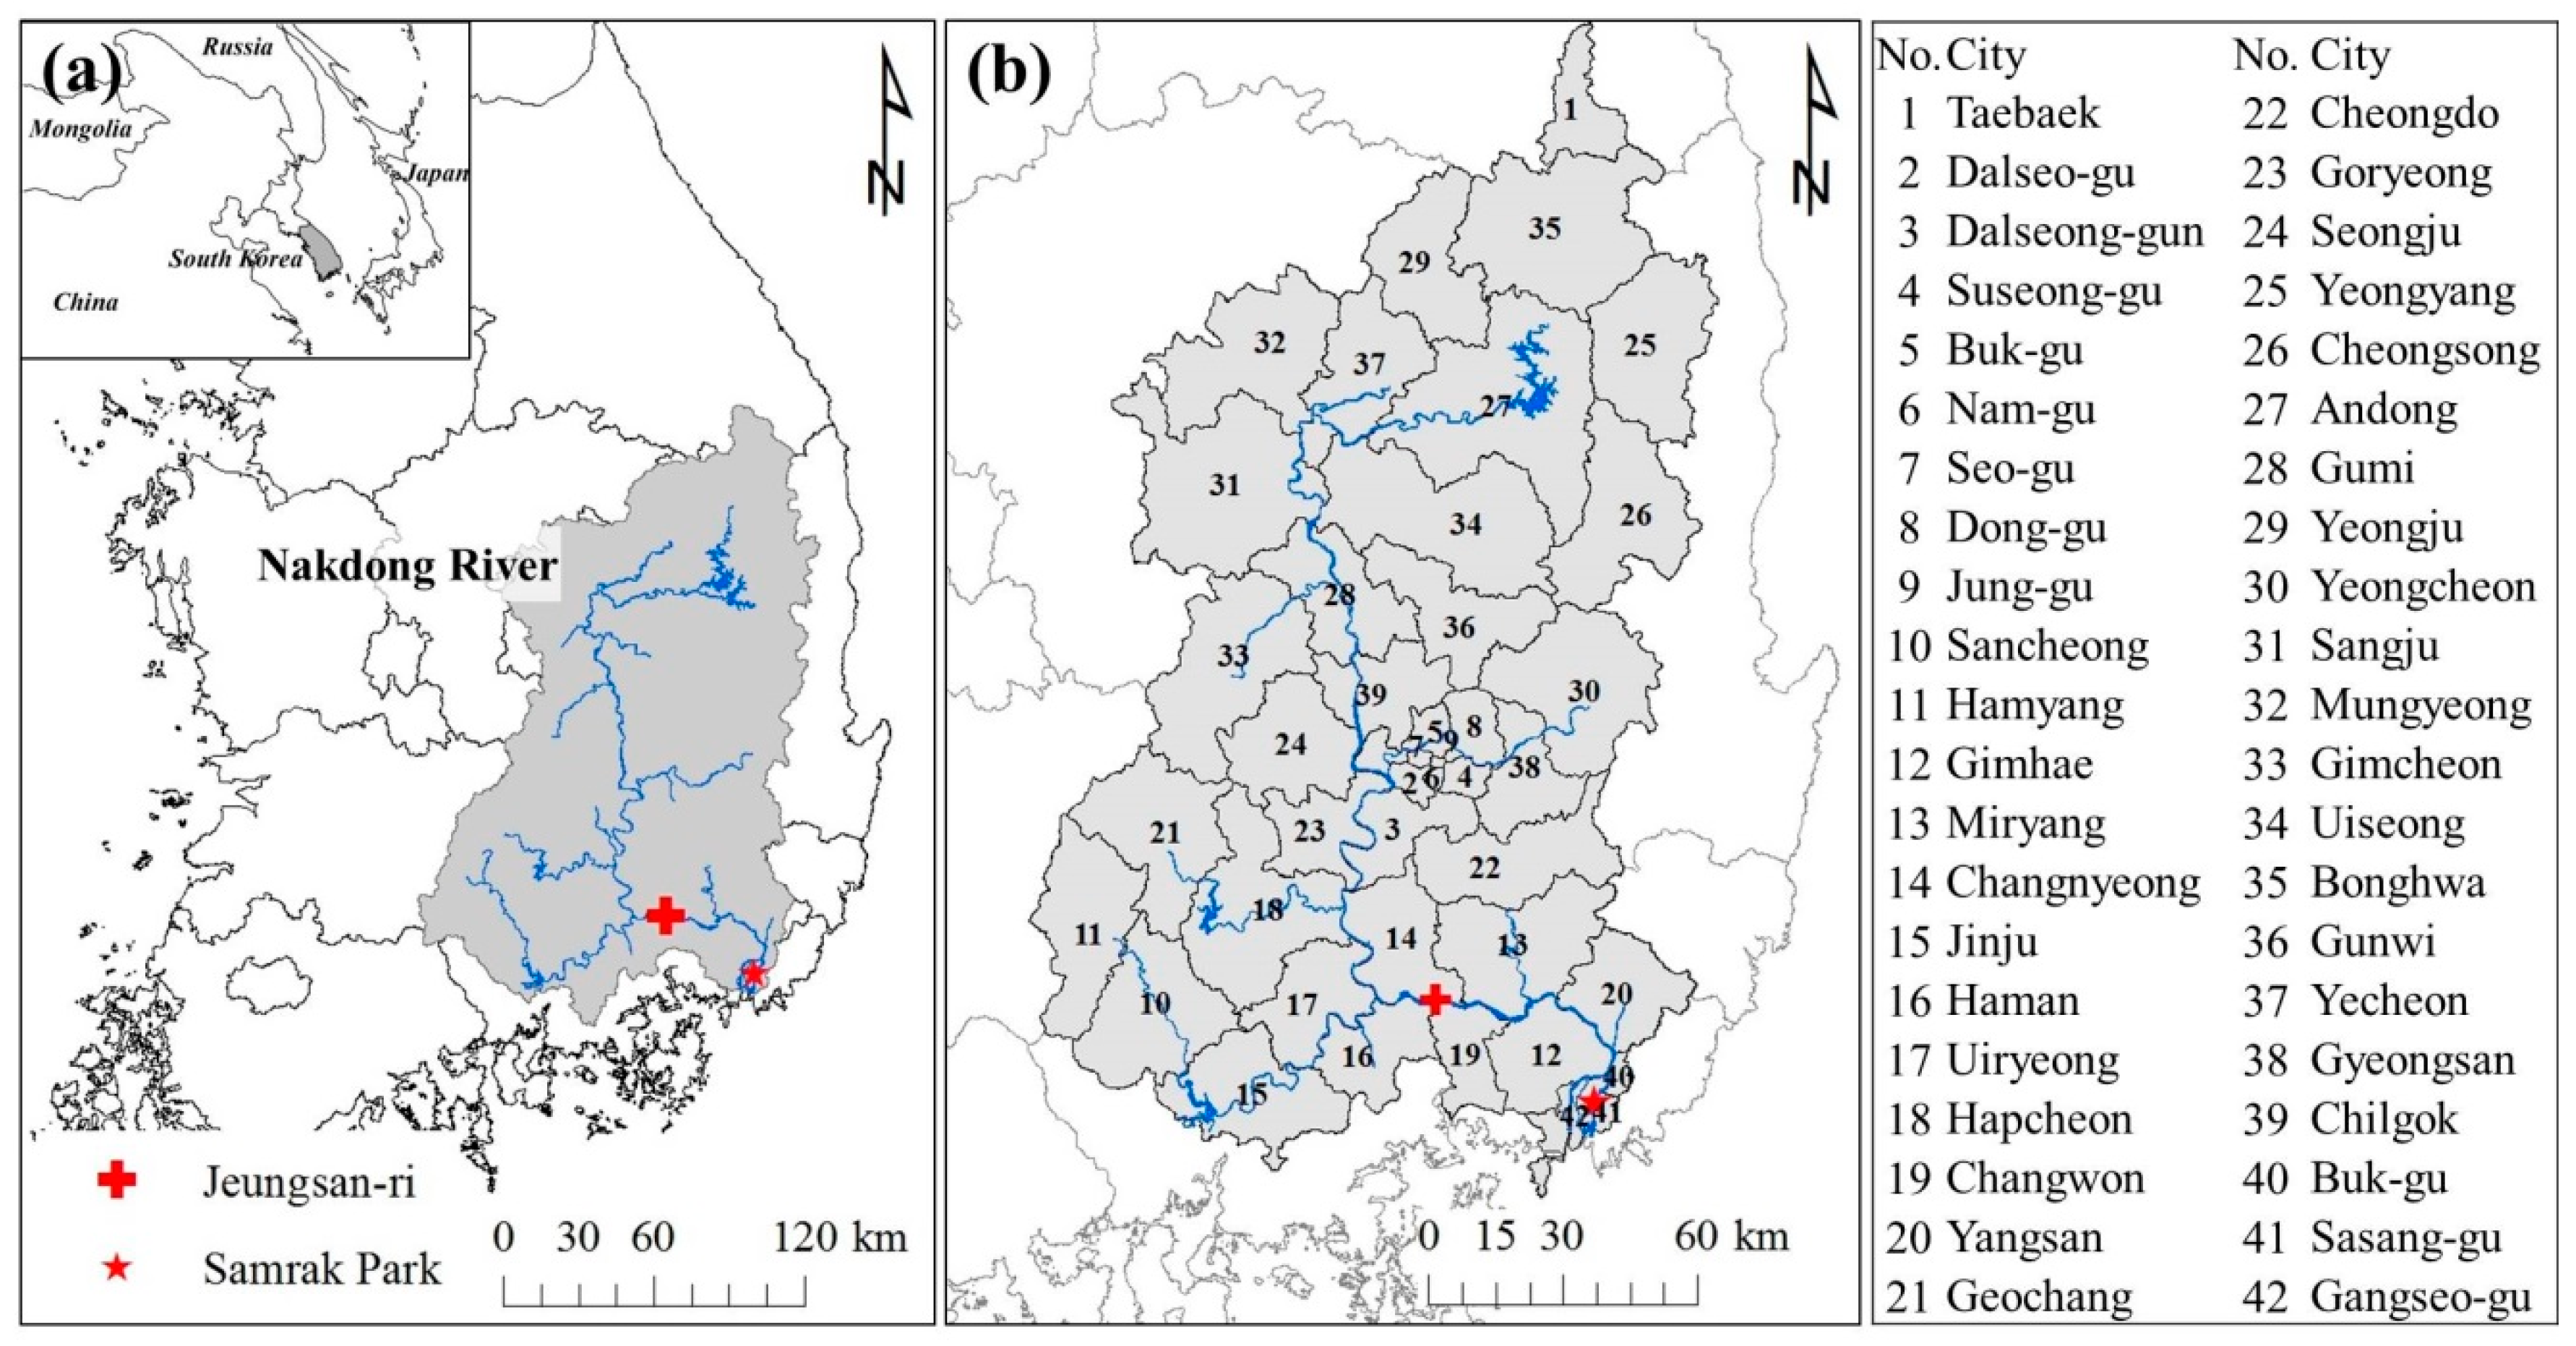
Figure 2.
Wells (a) and boring log (b) at Jeungsan-ri RBF site [27].
Figure 2.
Wells (a) and boring log (b) at Jeungsan-ri RBF site [27].

Figure 3.
Wells (a) and boring log (b) at Samrak Park ASTR site.
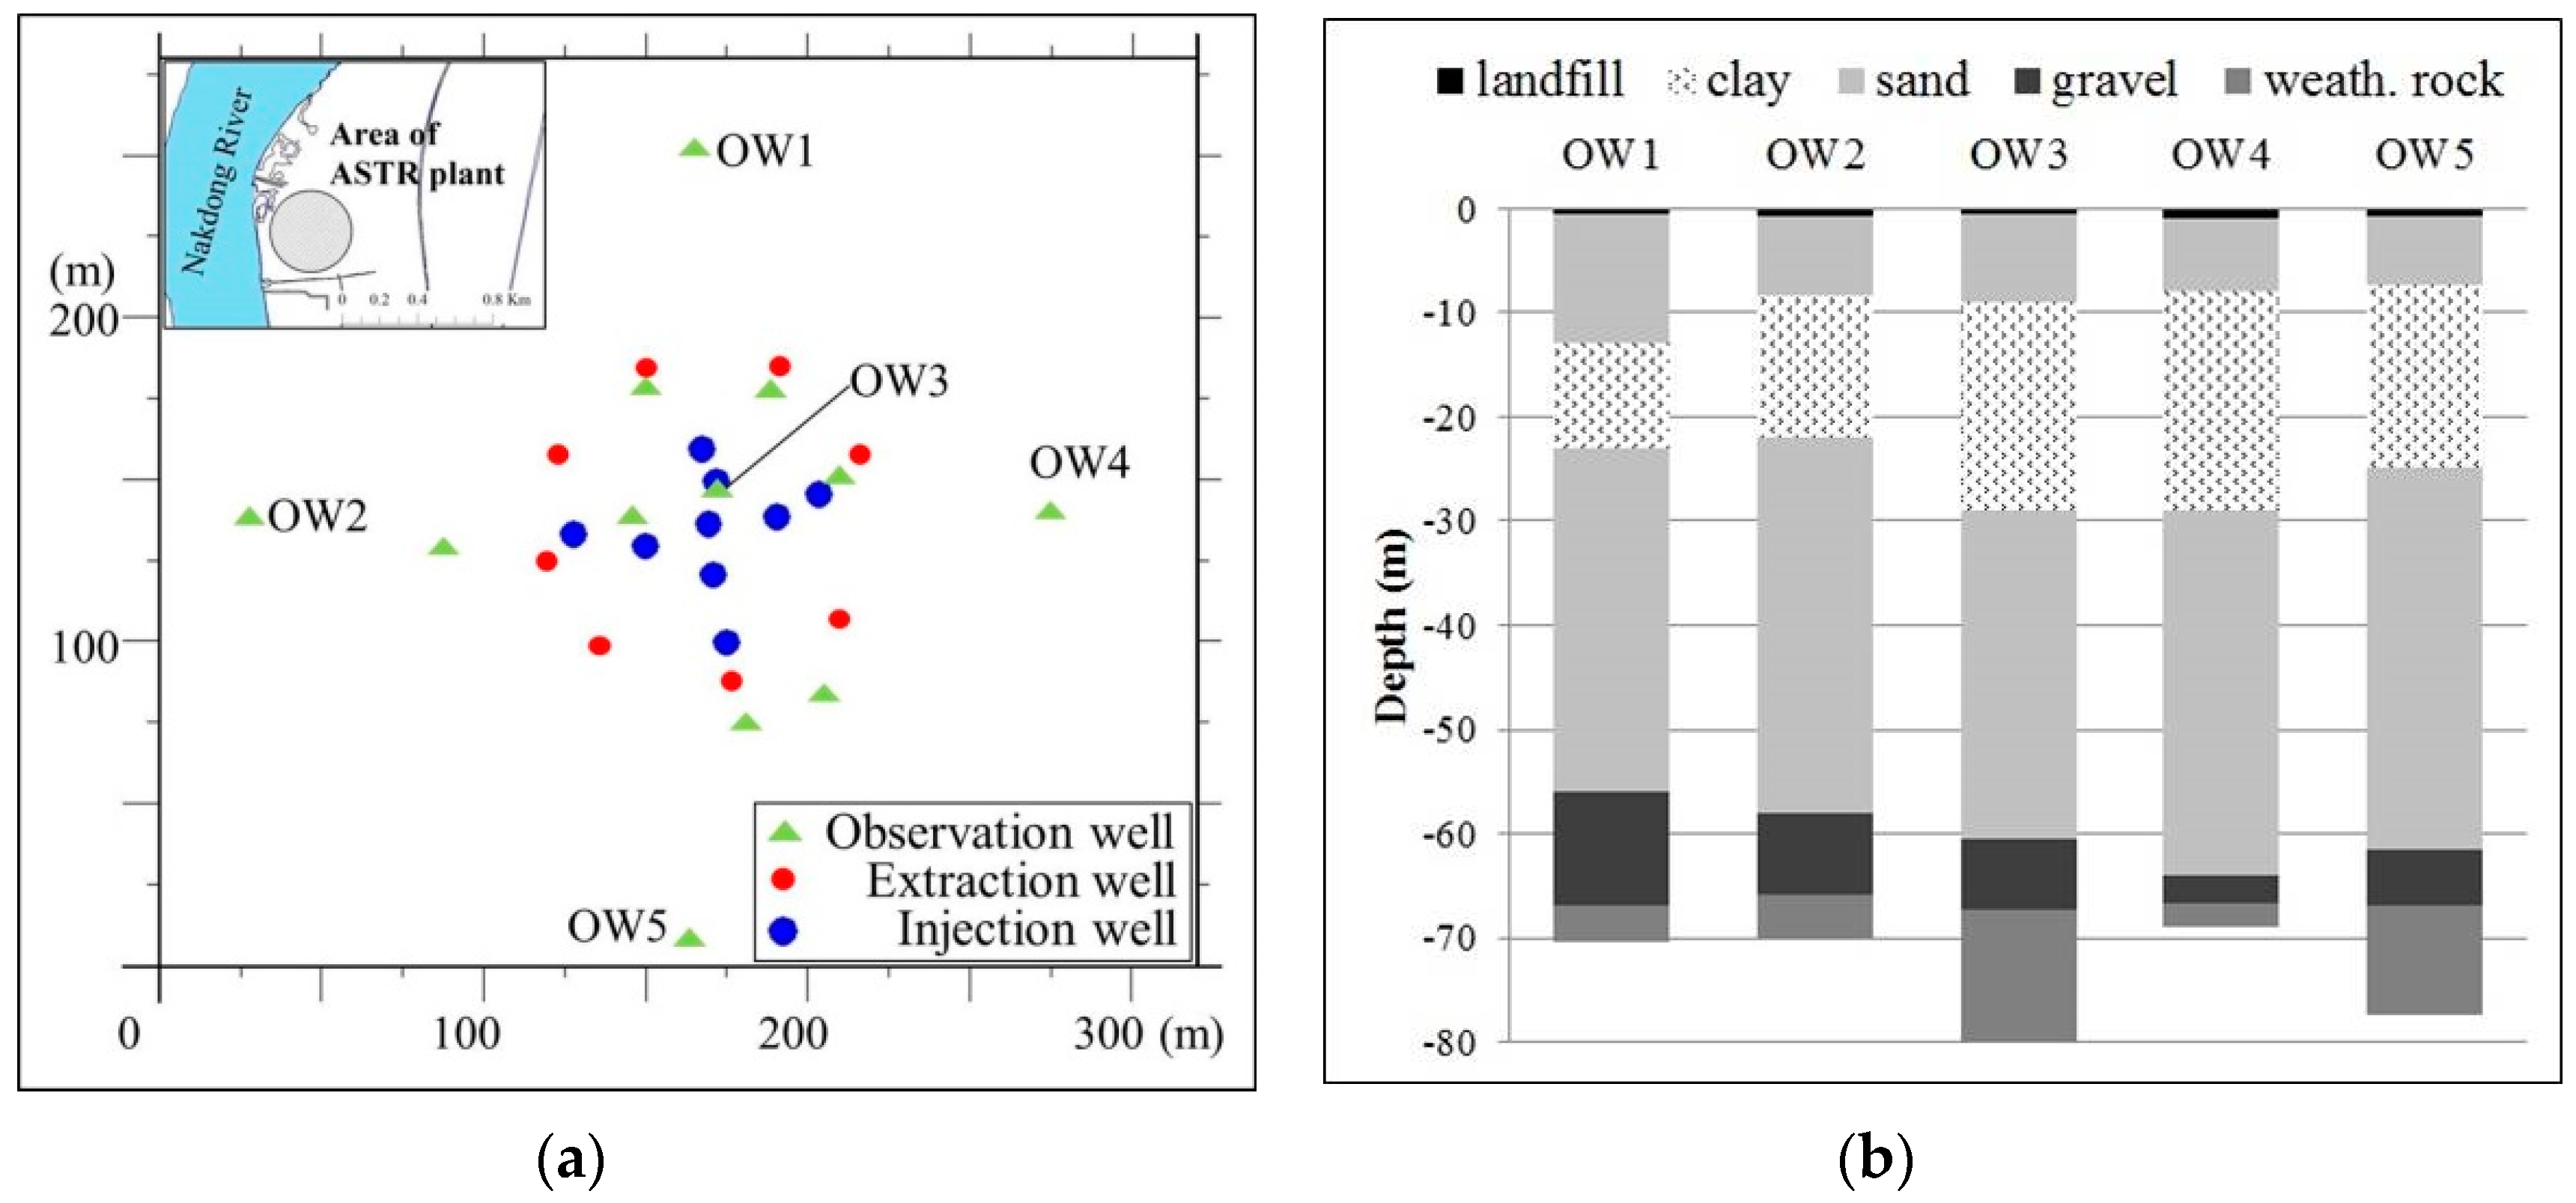
Figure 4.
Potential risks from cities to a MAR site.
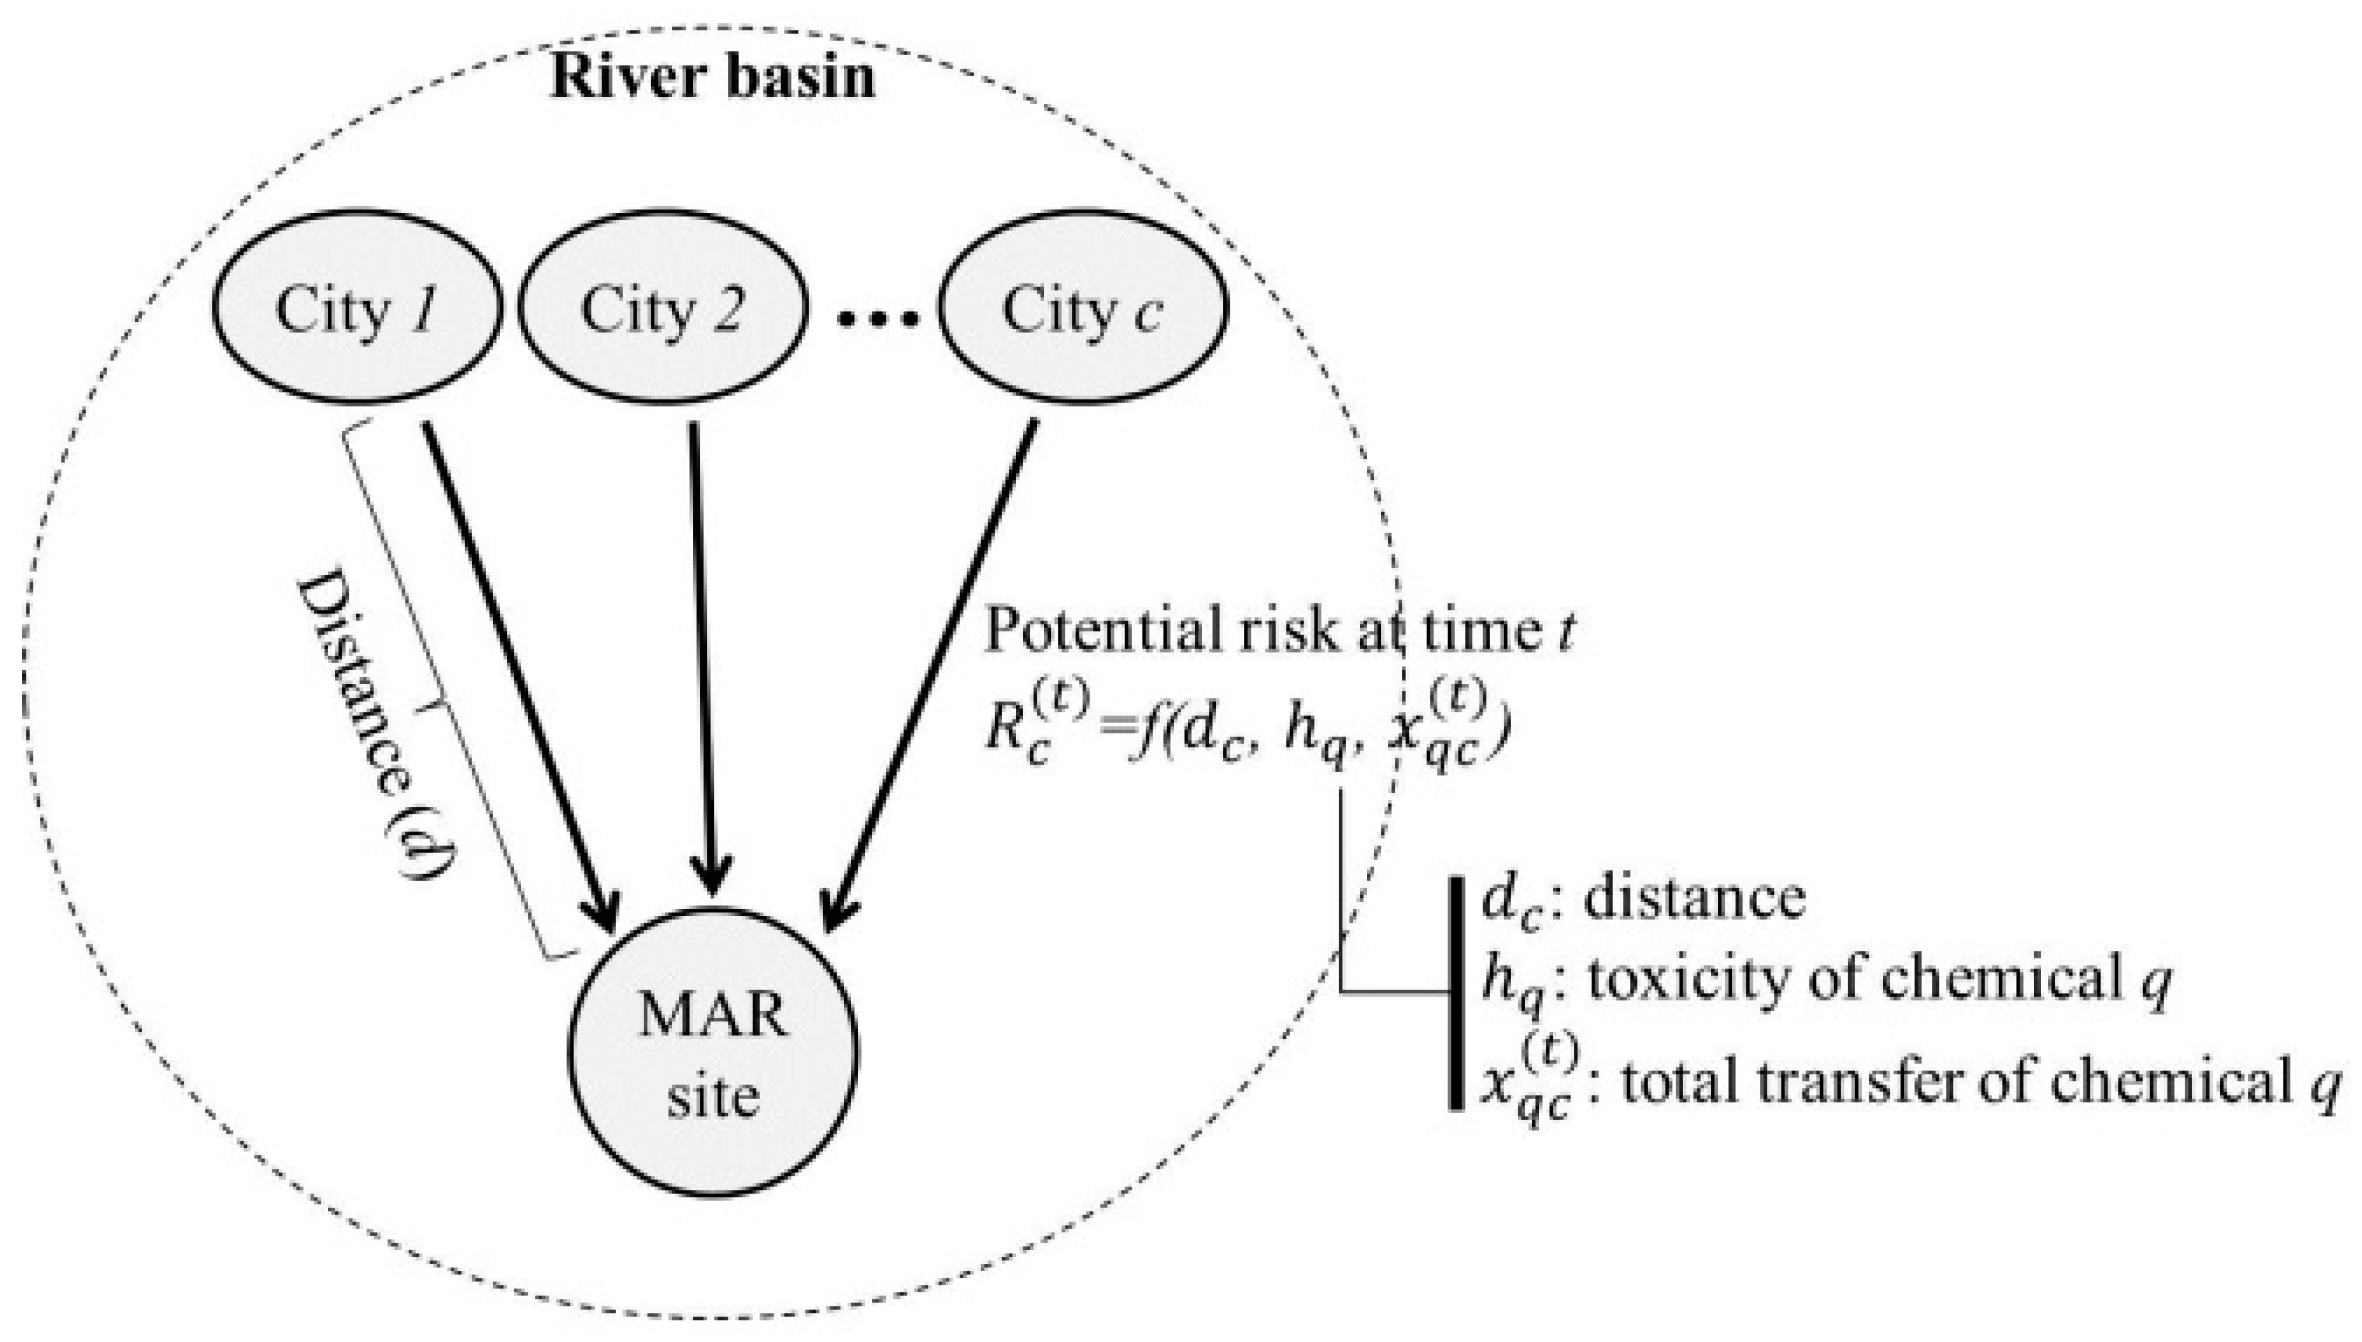
Figure 5.
Coefficient of correlation between and datasets according to increase in of (city 41 in ASTR cases).
Figure 5.
Coefficient of correlation between and datasets according to increase in of (city 41 in ASTR cases).
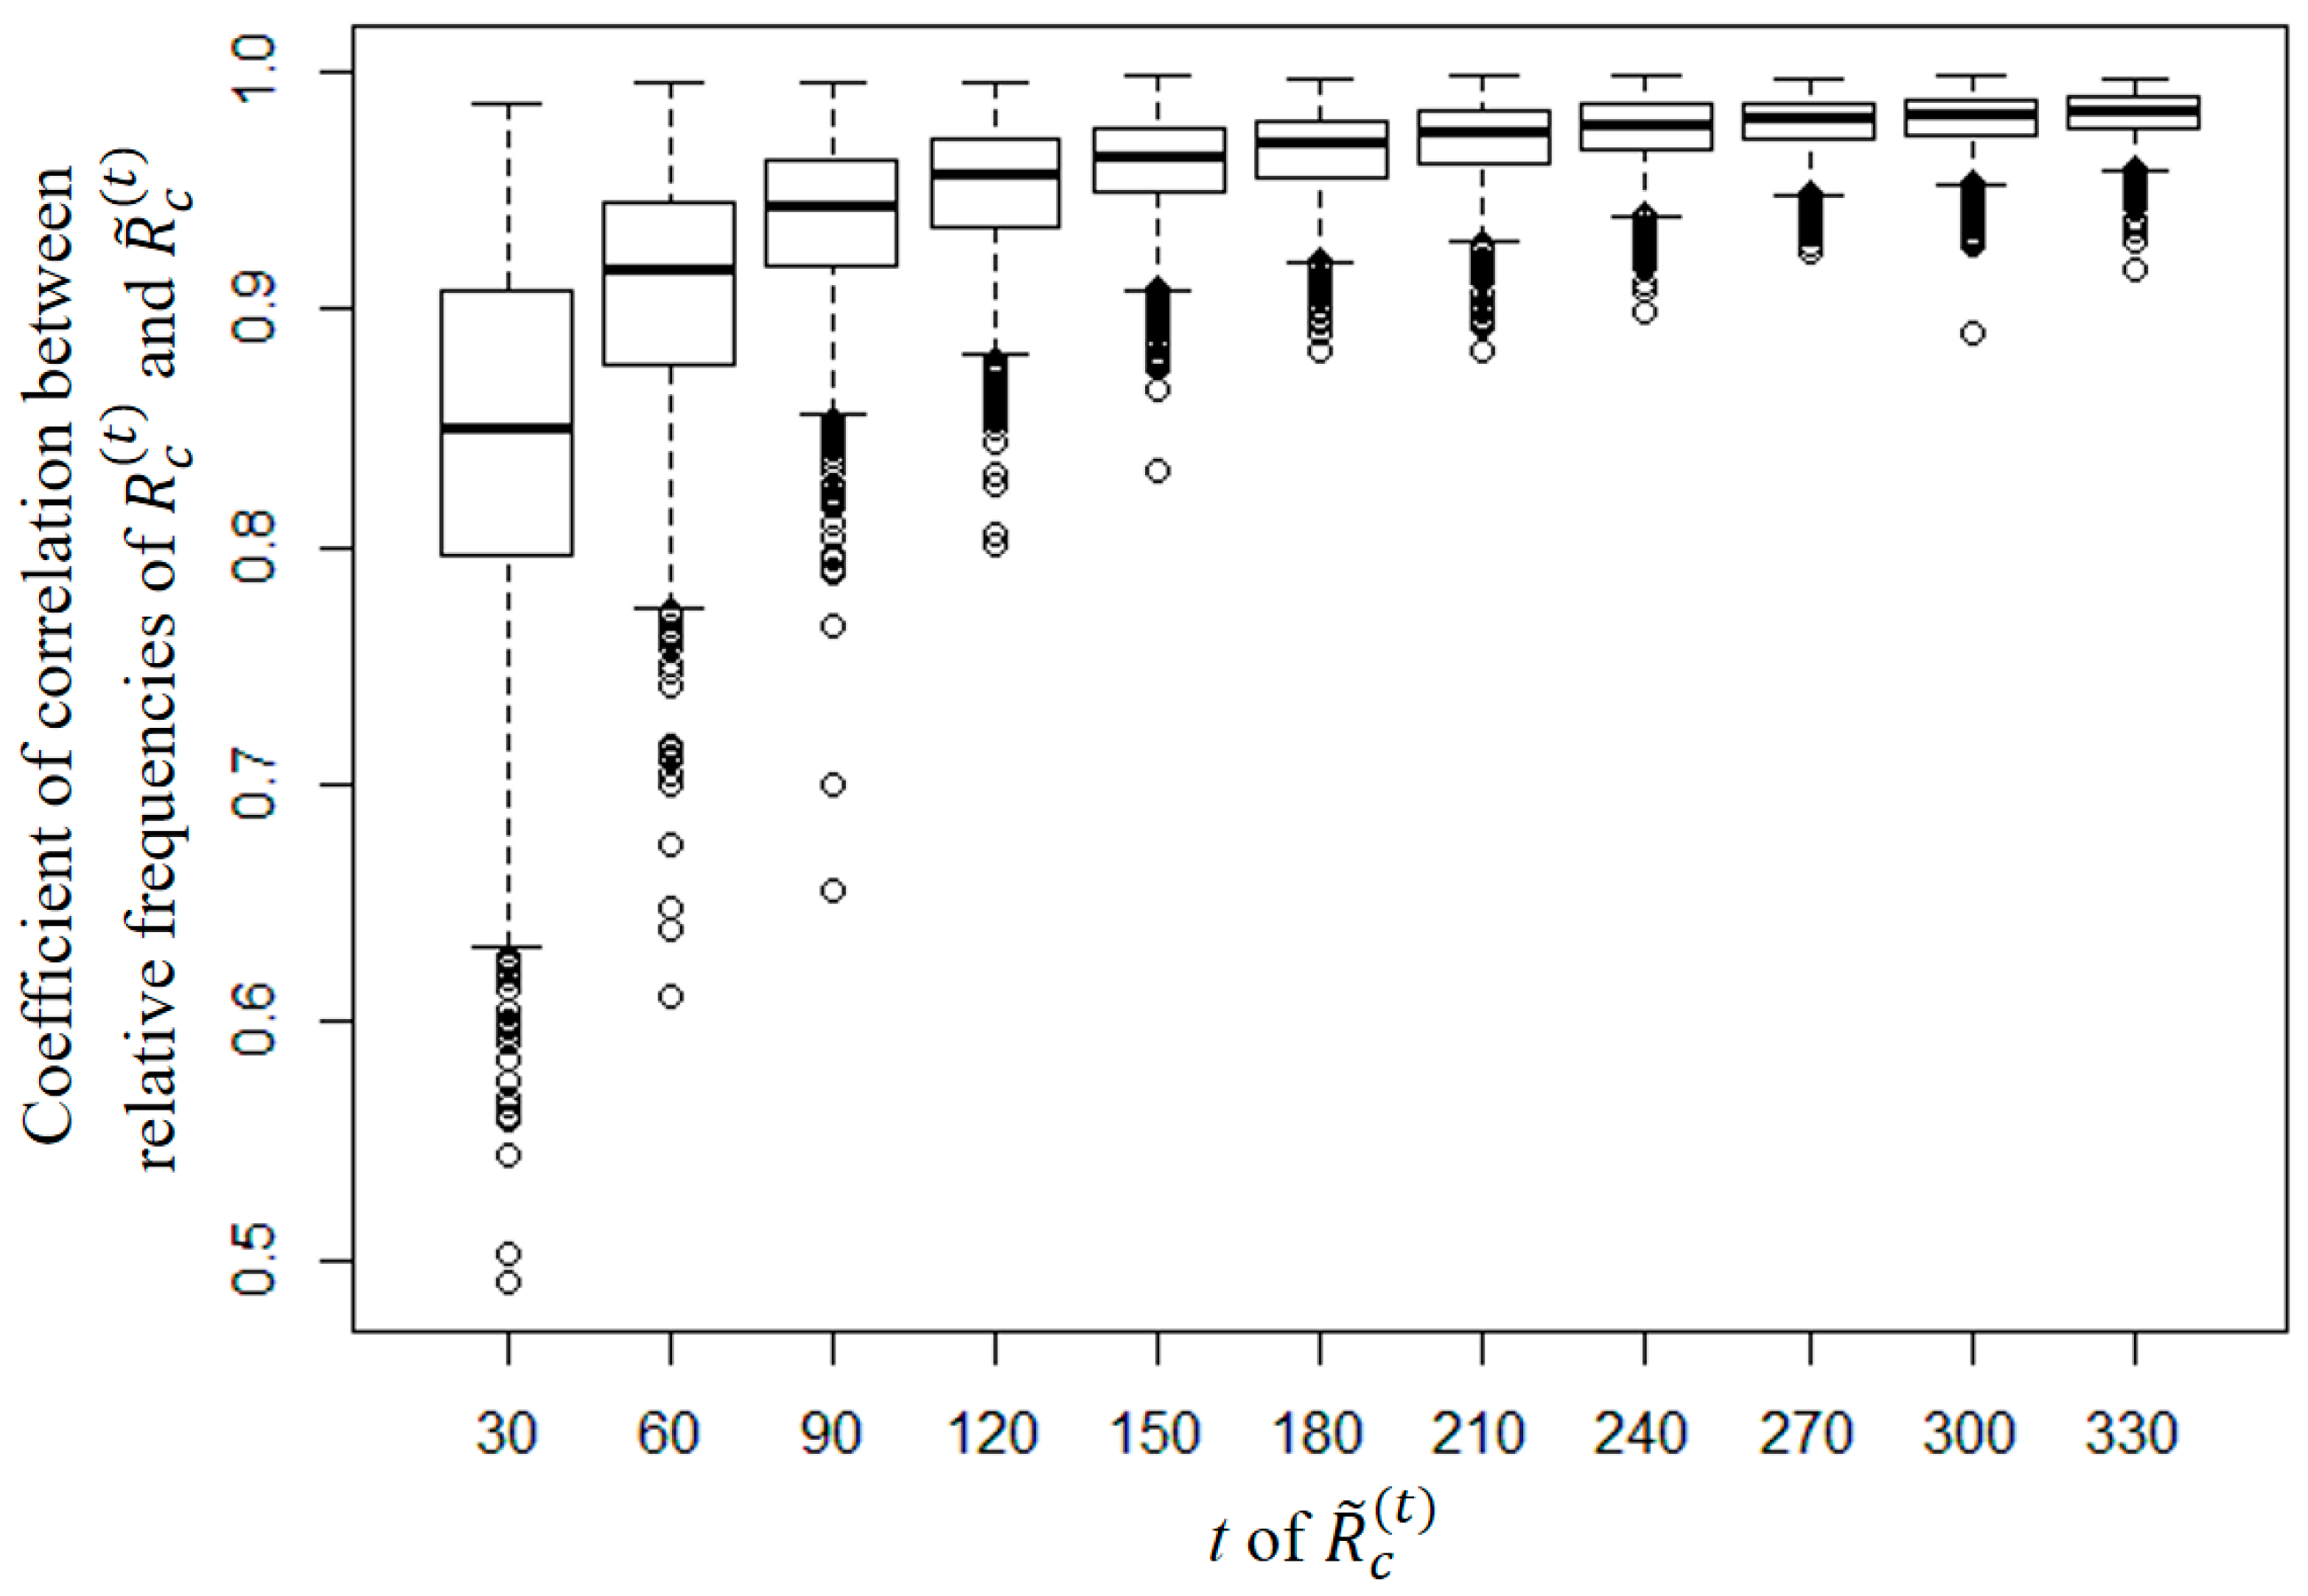
Figure 6.
Average total transfers of top 10 chemicals in 42 cities.

Figure 7.
Time average of potential risk () of cities for two MAR sites from 2001 to 2014.

Figure 8.
Comparison of exceedance probability distribution of cities in RBF and ASTR cases. (a) The 1st rank; (b) The 7th rank; (c) The 8th rank.
Figure 8.
Comparison of exceedance probability distribution of cities in RBF and ASTR cases. (a) The 1st rank; (b) The 7th rank; (c) The 8th rank.
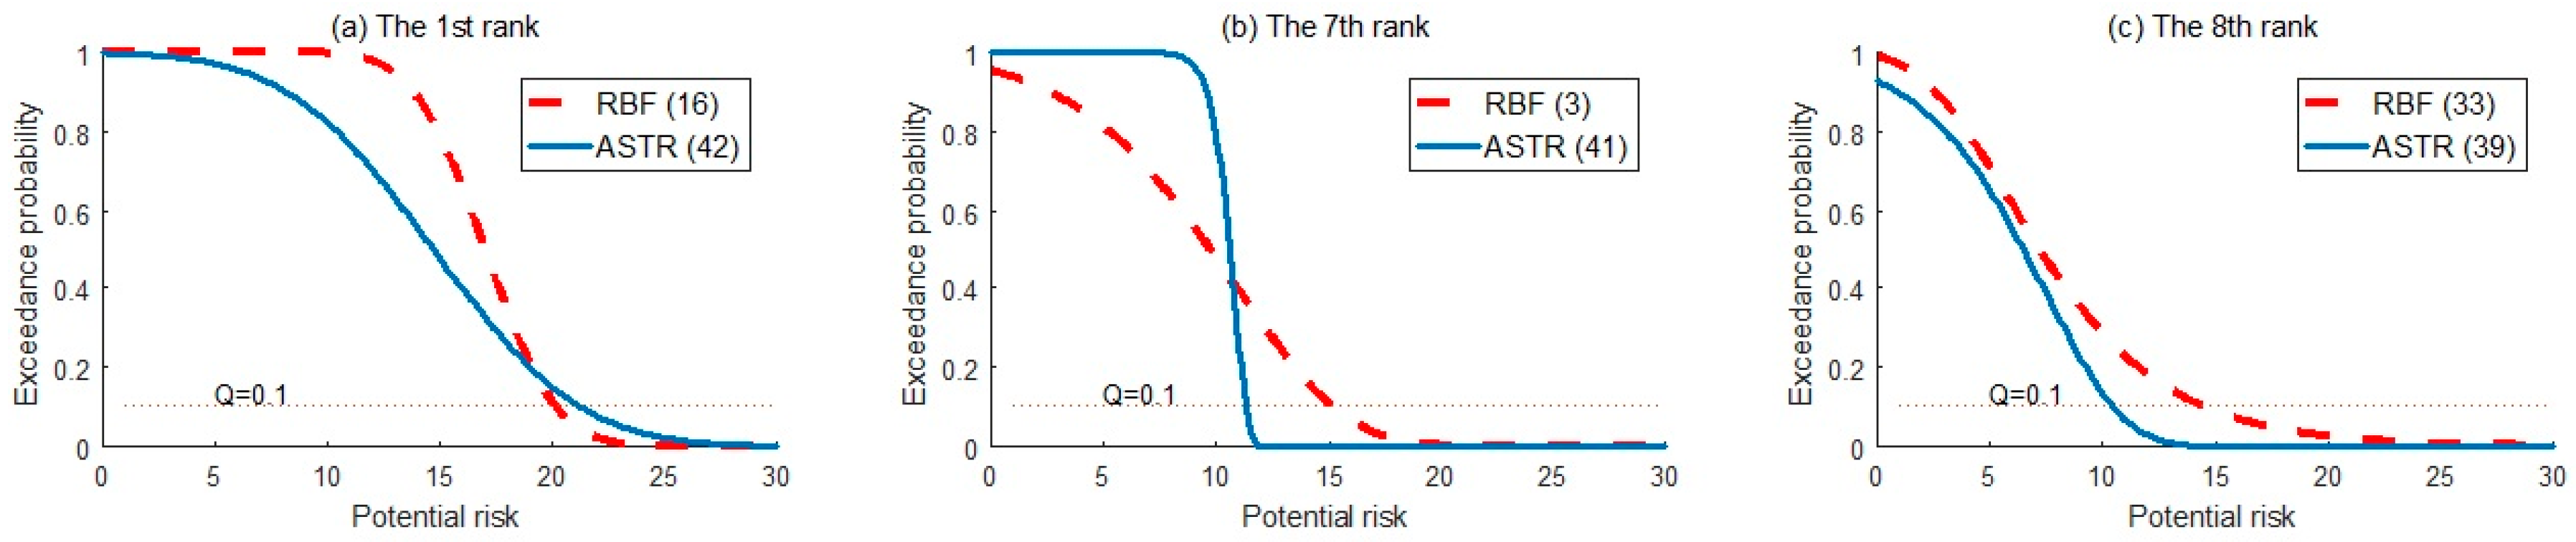
Figure 9.
Cities’potential risk of 100-year return period.

Table 1.
Characterization of two MAR cases. Riverbank filtration (RBF); aquifer storage transfer and recovery (ASTR).
Table 1.
Characterization of two MAR cases. Riverbank filtration (RBF); aquifer storage transfer and recovery (ASTR).
| Contents | Jeungsan-Ri Case (RBF) | Samrak Park Case (ASTR) |
|---|---|---|
| Location | South of city No. 41 | West of city No. 14 |
| Distance from the Nakdong River mouth | 75 km | 9 km |
| MAR type | Riverbank filtration (RBF) | Aquifer storage transfer and recovery (ASTR) |
| Schematic | 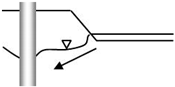 | 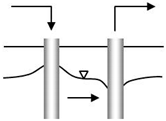 |
| Aquifer type | Unconfined aquifer | Confined aquifer |
| Depth of target aquifer | 20–30 m | 40–70 m |
| Supply | 680,000 m3/day | 100,000 m3/day |
| Storage | - | 107 m3 |
Table 2.
Procedure for potential risk generation and probability distribution fitting (modified from [15]).
Table 2.
Procedure for potential risk generation and probability distribution fitting (modified from [15]).
| Step | Content |
|---|---|
| 1 | Construct a frequency table of . |
| 2 | Replace relative frequencies of zero with a small number δ/n, where n is the number of relative frequencies of zero. |
| 3 | Multiply 1 − δ by other relative frequencies. |
| 4 | Calculate the cumulative relative frequency (). |
| 5 | Generate potential risk by assigning the class mark in accordance with a random number between 0 and 1, which is considered as the cumulative relative frequency. |
| 6 | Fit the generated potential risk () to an optimal probability distribution. |
Table 3.
Top 10 chemicals released in the Nadong River basin in 2014 (source: [37]).
Table 3.
Top 10 chemicals released in the Nadong River basin in 2014 (source: [37]).
| Emission Ranking | CAS No. | Chemicals | Toxicity 1 | Emisson (Tonnes) |
|---|---|---|---|---|
| 1 | 1330-20-7 | Xylene | 2 | 17,661 (32.5%) |
| 2 | 108-88-3 | Toluene | 2 | 8538 (15.7%) |
| 3 | 141-78-6 | Ethyl acetate | 1 | 4222 (7.8%) |
| 4 | 78-93-3 | Methylethylketone | 1 | 3422 (6.3%) |
| 5 | 100-41-4 | Ethylbenzene | 2 | 2821 (5.2%) |
| 6 | 67-56-1 | Methyl alcohol | 1 | 2716 (5.0%) |
| 7 | 75-09-2 | Dichloromethane | 2 | 2588 (4.8%) |
| 8 | 67-63-0 | Isopropanol | 1 | 2313 (4.3%) |
| 9 | 68-12-2 | N,N-Dimethylformamide | 1 | 1124 (2.1%) |
| 10 | 106-97-8 | Butane | 1 | 742 (1.4%) |
Note: 1 National Fire Protection Association (NFPA) health index. Low (0) < toxicity < high (4).
Table 4.
Comparison of ranks and potential risk as the return period changes.
| Rank | Jeungsan-Ri (RBF) | Return Period | Samrak Park (ASTR) | Return Period | ||||
|---|---|---|---|---|---|---|---|---|
| 10 | 50 | 100 | 10 | 50 | 100 | |||
| 1 | Haman (16) | 20.20 | 22.11 | 22.79 | Gangseo-gu (42) | 21.29 | 25.23 | 26.63 |
| 2 | Gangseo-gu (42) | 19.00 | 22.12 | 23.22 | Yangsan (20) | 19.61 | 21.06 | 21.53 |
| 3 | Yangsan (20) | 18.46 | 19.53 | 19.87 | Changwon (19) | 18.43 | 20.38 | 21.07 |
| 4 | Changwon (19) | 18.17 | 18.68 | 18.84 | Haman (16) | 17.17 | 18.50 | 18.93 |
| 5 | Gimhae (12) | 16.40 | 17.71 | 18.17 | Gimhae (12) | 14.89 | 16.47 | 17.02 |
| 6 | Gumi (28) | 16.23 | 17.25 | 17.58 | Gumi (28) | 13.86 | 14.92 | 15.27 |
| 7 | Dalseong-gun (3) | 15.24 | 17.89 | 18.74 | Chilgok (41) | 11.31 | 11.64 | 11.74 |
| 8 | Gimcheon (33) | 14.54 | 20.92 | 23.62 | Sasang-gu (39) | 10.48 | 12.37 | 12.97 |
| 9 | Sasang-gu (39) | 12.26 | 14.36 | 15.02 | Dalseong-gun (3) | 10.25 | 12.03 | 12.63 |
| 10 | Jinju (15) | 10.55 | 12.93 | 13.77 | Gimcheon (33) | 9.63 | 10.50 | 10.79 |
© 2017 by the authors. Licensee MDPI, Basel, Switzerland. This article is an open access article distributed under the terms and conditions of the Creative Commons Attribution (CC BY) license (http://creativecommons.org/licenses/by/4.0/).
Share and Cite
MDPI and ACS Style
Ji, H.W.; Lee, S.-I. Comparison of Potential Risk on Two Managed Aquifer Recharge Sites from River Basin. Water 2017, 9, 674. https://doi.org/10.3390/w9090674
AMA Style
Ji HW, Lee S-I. Comparison of Potential Risk on Two Managed Aquifer Recharge Sites from River Basin. Water. 2017; 9(9):674. https://doi.org/10.3390/w9090674
Chicago/Turabian StyleJi, Hyon Wook, and Sang-Il Lee. 2017. "Comparison of Potential Risk on Two Managed Aquifer Recharge Sites from River Basin" Water 9, no. 9: 674. https://doi.org/10.3390/w9090674
Note that from the first issue of 2016, this journal uses article numbers instead of page numbers. See further details here.