Laboratory Investigation of the Effect of Slenderness Effect on the Non-Darcy Groundwater Flow Characteristics in Bimsoils

Beijing Key Laboratory of Urban Underground Space Engineering, Department of Civil Engineering, School of Civil & Resource Engineering, University of Science & Technology Beijing, Beijing 100083, China
*
Authors to whom correspondence should be addressed.
Water 2017, 9(9), 676; https://doi.org/10.3390/w9090676
Submission received: 1 June 2017
/
Revised: 2 September 2017
/
Accepted: 5 September 2017
/
Published: 7 September 2017
(This article belongs to the Special Issue Advances in Groundwater Flow and Solute Transport: Pushing the Hidden Boundary)
Abstract
:A series of experimental flow tests for artificial block-in-matrix-soils (bimsoils) samples with various slenderness ratios were performed to study the Non-Darcy groundwater flow characteristics. The variations of seepage velocity, permeability coefficient, critical sample height, and non-Darcy flow factor for samples against slenderness ratios were investigated. A servo-controlled flow testing system that was developed by the authors was adopted to conduct the flow test. Cylindrical bimsoil samples (50 mm diameter and various heights) with staggered rock block percentages (RBPs) (30, 40, 50, and 60%, by mass) were prepared by compaction tests to roughly insure the same porosity of the soil matrix. The testing results show that flow the distance has a strong influence on the flow characteristics of bimsoil, and the relationship between the permeability coefficient and slenderness ratio is proposed. In addition, the critical sample height to eliminate the slenderness effect was determined, and the relationship between the critical sample height and RBP was established. Moreover, the responses of non-Darcy flow were studied by using an index of non-Darcy βfactor, which reveals the internal mechanism of the effect of flow distance on groundwater flow characteristics. The research results can be useful to the prediction of flow piping disaster for geological body made up of bimsoils.
1. Introduction
Geological formations are generally classified as either soils or rocks from an engineering point of view. In the geomechanical literature, the term block-in-matrix-soils (bimsoils) is used to describe the structurally chaotic geomaterials characterized by structurally complex formations composed of a variety of stronger rock block inclusions with various sizes, strengths and different lithologies embedded in a pervasively fine-grained weaker matrix (soil) [1,2,3,4,5,6,7,8,9]. In the literature, despite some researchers having focused on this special inhomogeneous and loose geomaterial, different terms have been used to describe those mixed geomaterials similar to bimsoil, such as mélange [10,11,12,13,14,15], bimrocks [16,17,18,19,20,21], SRM [5,6,7,8], rock and soil aggregate [3,22], conglomerates [23], coarse-grain alluviums and colluviums [20], to name a few. These complex mixtures occur globally and originated by several geological processes (fault rocks, mélanges, olistostromes, breccias, weathering eluvia deposit, etc.) [1]. The mechanical and physical properties of bimsoils are characterized by the extreme inhomogeneity, looseness and environmental sensitivity, and the mechanical and physical properties of bimsoil are controlled by the interactions between rock blocks and the soil matrix [1,2,4,7].
A number of studies have been done to investigate the effect of sample sizes on the mechanical properties of bimsoils subject to internal and external loading, namely the scale effect. Medley [13] considered that bimsoils have the same general appearance regardless of scale, and he pointed out that bimsoils were independent of the RBP in bimsoils. Bagnold and Barndorff-Nielsen [24] conducted in-situ measurement of the size of blocks in bimsoil, and studied the log-histogram relationship of bimsoil with different scales. They found that for the measured area, the rock blocks show very similar shapes, and the fractal dimensions are almost the same [10]. Based on this study, other researchers assumed that the geomechanical behaviors of bimsoil are also scale-independent [1,23,25]. Xu et al. [25] conducted a series of in-situ shear tests, and pointed out that the sample height should be five times larger than the maximum rock block diameter. Co li et al. [1] conducted in-situ shear tests, and pointed out that a maximum dimension of the rock block should be 0.1 times the bimsoil sample. To study the deformability and failure process, Zhang et al. [9] have performed numerical simulations to conduct uniaxial compression for bimsoil samples with different RBP, size, and slenderness ratios. They found the geomechanical behavior of bimsoil is scale-dependent; changing the ratio of height and diameter alters the shear strain band, and the associated peak strength. They also found that he slenderness effect of ail rezone formation for bimsoil was not obvious for bimsoil samples with lower RBP, but became appreciable for samples with higher RBP. The permeable properties of bimsoil have equal importance forits strength and deformation characteristics in soil and rock mechanics. The issues on the permeability of bimsoil have been deeply studied by many scholars and engineers, as the permeability of bimsoil is directly related to the stability of geological bodies [5,26,27,28,29]. Bimsoilis a kind of typical porous medium, and its flow characteristics are closely related to the content of rock blocks, soil matrix properties, random distribution of blocks, the size of the blocks, etc. One of the special characteristics of bimsoilis its sensitivity to water. To study the flow rule of bimsoil, it is important to understand the deformation and failure mechanism under a stress–flow coupled environment. To study the seepage characteristics of bimsoil, different testing methods have been used, such as the conventional seepage test (e.g., constant head laboratory test) [27,30,31], servo-controlled laboratory seepage tests [5], in-situ seepage tests [31,32,33], and numerical simulations [25,34]. Physical experimental approaches are essential to studying the flow behavior for geomaterials. Direct observations by means of in-situ flowtests and laboratory experiments can provide plenty of insights into the complicated flow behaviors of bimsoil. In summary, the RBP has the most remarkable influence on the flow properties of bimsoil. When the physical and mechanical properties of the soil matrix is roughly the same, adding rock blocks to the soil matrix causes the permeability coefficient of bimsoil to first increase and then decrease, with increasing RBP. The influence of rock block content on the permeability of bimsoil has been widely studied. However, the influences of flow distance on the permeability mechanisms of bimsoil (e.g., the relationship between the hydraulic gradient and seepage velocity, the link among the non-Darcy flow factor and flow distance, etc.) have not been involved up to now.
A review of the literature shows that the study of the slenderness effect on the permeability properties for bimsoil materials is very limited. In addition, the critical H/D (ratio of sample height to diameter) for bimsoil samples with different RBP has not been published. It is clear that the slenderness effect is an important aspect of the scale effect, and the study of it can reveal the flow characteristics of bimsoil along different flow distances, the relationship between the permeability coefficient and flow distance, and point out the mechanism that influences the flow distance on the non-Darcy flow rule. The basic purpose of this study is to investigate the flow slenderness effect for artificial bimsoils, with different RBP. The authors carried out a series of systematic testing on bimsoil samples with RBP of 30%, 40%, 50%, and 60%,with various slenderness ratios (i.e., H/D = 40/50, 60/50, 80/50, 100/50, 120/50, 140/50, 160/50, 180/50, and 200 mm/50 mm, respectively). The water was injected into the samples by using a self-developed servo-controlled permeability testing system. The newest test results presented here show that the permeability coefficient of bimsoil is strongly related to flow distance, and the permeability coefficient of bimsoil was almost kept constant after a critical flow distance. The critical flow distance is also different for bimsoils with different RBP. Inaddition, by introducing the Forchheimer non-Darcy flow law, the effect of flow distance on the degree of non-Darcy flow properties was first discussed in this work.
2. Experimental Methods
2.1. Experimental Setup
This testing setup was previously reported by Wang et al. [5]. Figure 1 shows the layout of the flow test system made up of rigid sample holder, the servo pressurized water-supply system, and the sample chamber system.
The rigid sample holder is composed of the beams, rigid column, rigid platform, guide bar, etc. Its purpose is to keep the sample chamber system steady on the platform during the flow test.
The servo pressurized water-supply system includes the main parts of the speed feedback component, servo and drive motor, full digital servo controller, and the computer. It is the core component of the overall setup. The Doli servo controller made in German is used to control the servo pressurized water-supply system, a ball screw stepping servo motor is used to drive it to work. According to the operating principle of a piston, the fluid is pressurized and supplied to the bimsoil sample. We can control the servo pressurized water supply system by computer, the injected fluid into the samples can be supplied at a constant pressure or rate. Before the flow test, water is returned to the piston from water tank, and then the piston is driven in servo controlled mode to control the injected speed of water at constant hydraulic pressure or constant flow rate, into the sample chamber.
The sample chamber system is composed of two metal seepage plates, two metal cushions (upper one and lower one), two hose clamps, and a length of heat shrink tubing accommodating the bimsoil sample. The metal permeability cushions are specially designed for the flow test; they contain the inlet valves, outlet valves, and some grooves. The diameters of the inlet and outlet are 3 mm. The heat shrinks tube and metal cushion is connected with self-adhesive type and hose clamps, purpose of the self-adhesive type is to prevent leakage, and its sealing hydraulic pressure can reach 1 MPa. The detailed dimensions and structure of the metal cushion, and locations of the inlet and outlet valve are shown in Figure 2. For samples with the same RBP of 30%, the tested sample height varies from 40 mm to 200 mm, and the diameter was kept constant at 50 mm, as shown in Figure 3.
2.2. Material Properties
2.2.1. Soil Matrix
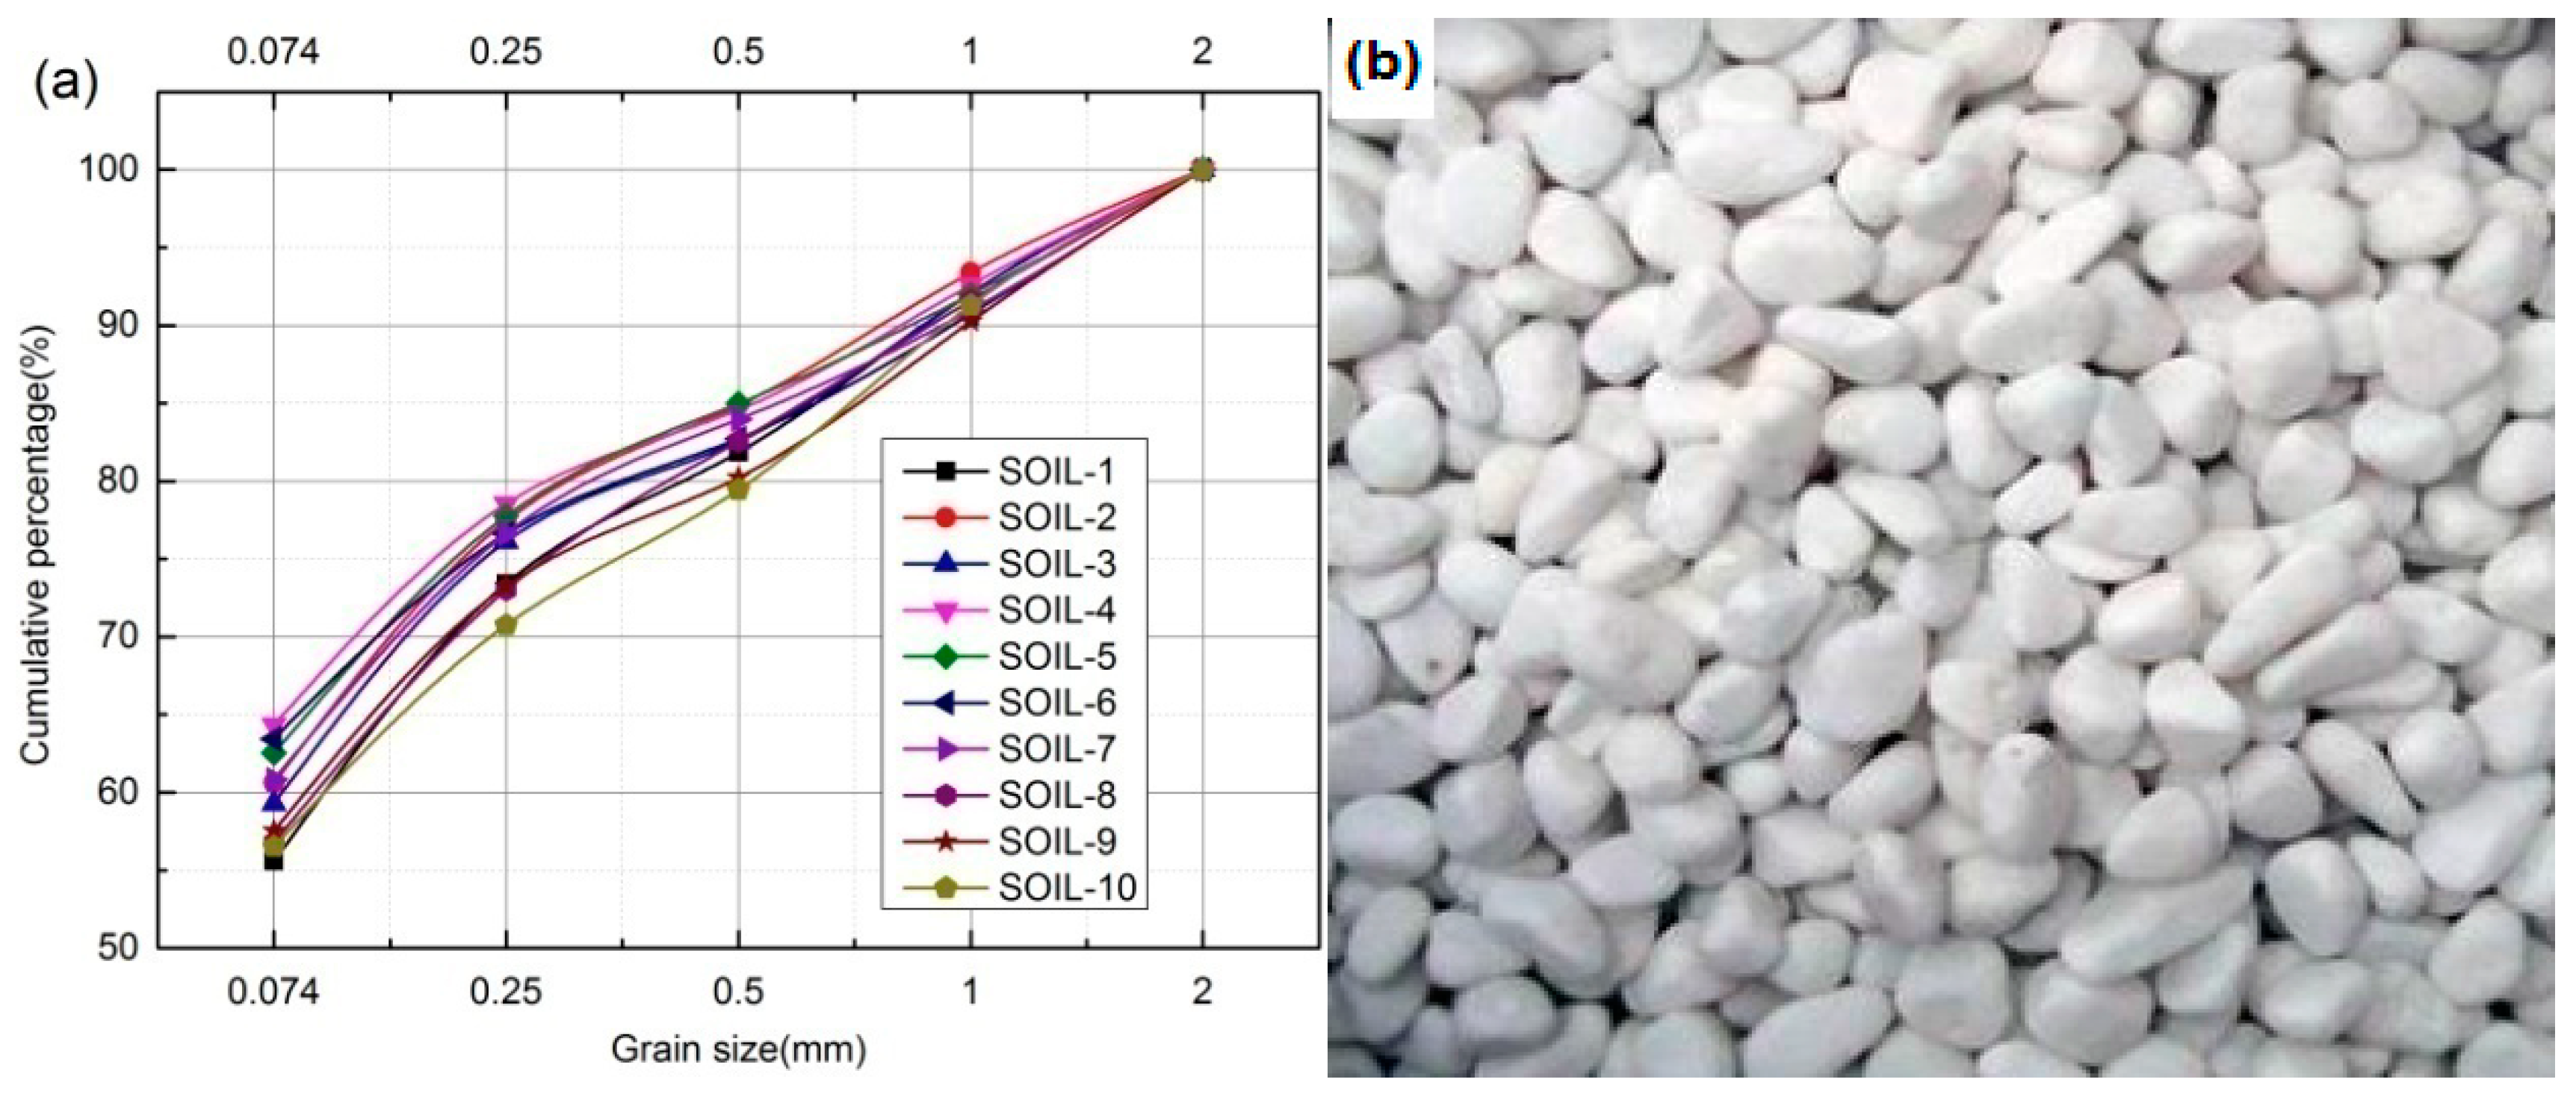
The soil used in this experimental work was a kind of clay soil. The gradation curve of this soil is shown in Figure 4a. The physical and mechanical properties of the soil are summarized in Table 1. Scanning Electron Microscope (SEM) and X-Ray diffraction (XRD) tests were performed to obtain the mineral content and composition to the typical soil matrix. Many irregular and rod like quartz grains surrounded by clay minerals can be observed under SEM (scanning electron microscope) scanning, the grain size is between 0.001 and 0.003 mm, as shown in Figure 5a–b. The detailed mineral composition was acquired by XRD (X-ray diffraction) tests and listed in Table 2. From the analysis results, it can be seen that plenty of clay minerals (e.g., montmorillonite, kaolinite, and illite) exist in soil matrix.
2.2.2. Rock Blocks
According to the geotechnical test standards [35,36] and the preparation of bimsoil samples, the threshold value for soil particle and rock block is determined as 2 mm. This is to say, when the grain size exceeds 2 mm, it is treated as block, while it is treated as soil matrix if the grain size is below 2 mm. Lithology of rock blocks used in the flow test was white marble (Figure 4b), the size of rock blocks ranges between 2 and 5 mm. The physical and mechanical properties of rock block are also listed in Table 1. Generally, the morphological characteristics of the rock block have great effect on the geomechanical properties of bimsoil. Therefore, quantitative morphological feature of the rock blocks with weighted average indices are obtained by the digital image process [3], as follows: (1) outline indices: flakiness is 0.954, elongation is 1.343, sphericity is 0.845, and shape factor is 0.943; and (2) angularity indices: angularity (Gradient Method) is 0.917, and convexity ratio is 0.902.
2.3. Remolded Sample Preparation
Because of the special geological and structural characteristics of the bimsoil, obtaining the undisturbed samples is very difficult; therefore, using the remolded sample to conduct experiments is necessary [37]. Many researchers [6,37,38] have adopted a hand mixing method to mix rock blocks uniformly within the soil matrix. To ensure homogeneity of the samples, the rock blocks were mixed by hand into the soil with 10 min. Hand mixing method can better avoid damage occurring in the soil matrix and rock blocks compared to other methods, e.g., machine mixing. Machine mixing may affect the permeability characteristics of the tested material. According to the study results of Wang et al. [5], the permeability coefficient of soil matrix can change after loading and unloading confining pressure, and soil matrix damage occurs in this case.
Then compaction tests were conducted to produce samples similar to that used for natural soil. The maximum dry unit weight and optimum water content for all tests was determined. The following procedure was adopted when preparing the samples. In the preparation of bimsoil samples, the soil was mixed with an amount of water corresponding to the optimum water content. Moist soil was kept in a closed plastic bag and allowed to cure for 24 h. All mixing was conducted by hand and proper care was taken to prepare homogenous mixtures at each stage of mixing. For the dynamic compaction, the relationship between hammer count and soil density was studied, and the appropriate optimal hammer count was finally determined. Compaction was done in a split mold by applying a dynamic pressure, using a compaction test apparatus. Owing to the high difference of elastic modulus between the soil matrix and the rock block, the compactness of the bimsoil is actually the compactness of the soil matrix. Soil matrix density is a very important factor affecting the permeability of the bimsoil [28]. As a result, how to control the hammer count at different values is crucial to the analysis result. In this work, hammer count to produce specimens with different soil density is determined from the relationship between the soil density and the optimal hammer count, as shown in Figure 6a. In Figure 6a, the density of the soil matrix in bimsoil samples with a RBP of 30–60% increases with an increase of hammer count. To roughly keep the same soil density (i.e., void ratio) in the bimsoil samples, we draw a dot dash line to intersect with the curves in Figure 6a, and the value of abscissa is determined as the optimal hammer count. In Figure 6a, the optimal hammer count was determined as 3, 4, 5, and 11 counts for bimsoil samples with RBP of 30%, 40%, 50%, and 60%, respectively. According to the value of RBP (i.e., 30%, 40%, 50% and 60%), combined with the density of soil and rock blocks, which are already known in bimsoil sample, the total volume of the prepared sample is also known in advance. Therefore, the required amount of soil and rock blocks can be calculated for bimsoil samples with a certain RBP and a certain height. The number of compaction layers can be determined according to the specific prepared sample. Taking the sample with a height of 20 mm and 100 mm as examples, we can produce the samples with one layer and three layers, respectively. For convenience and to keep the produced sample entire, only samples with length of 20 mm, 40 mm, 60 mm, 80 mm, and 100 mm were produced. If we want to obtain the sample with height of 120 mm, we grouped the samples with height of 20 mm and 100 mm together, and so on. The samples were cylinder-shaped, and all the tested samples were sealed with heat shrink tubing to prevent water volatilization.
2.4. Test Procedure
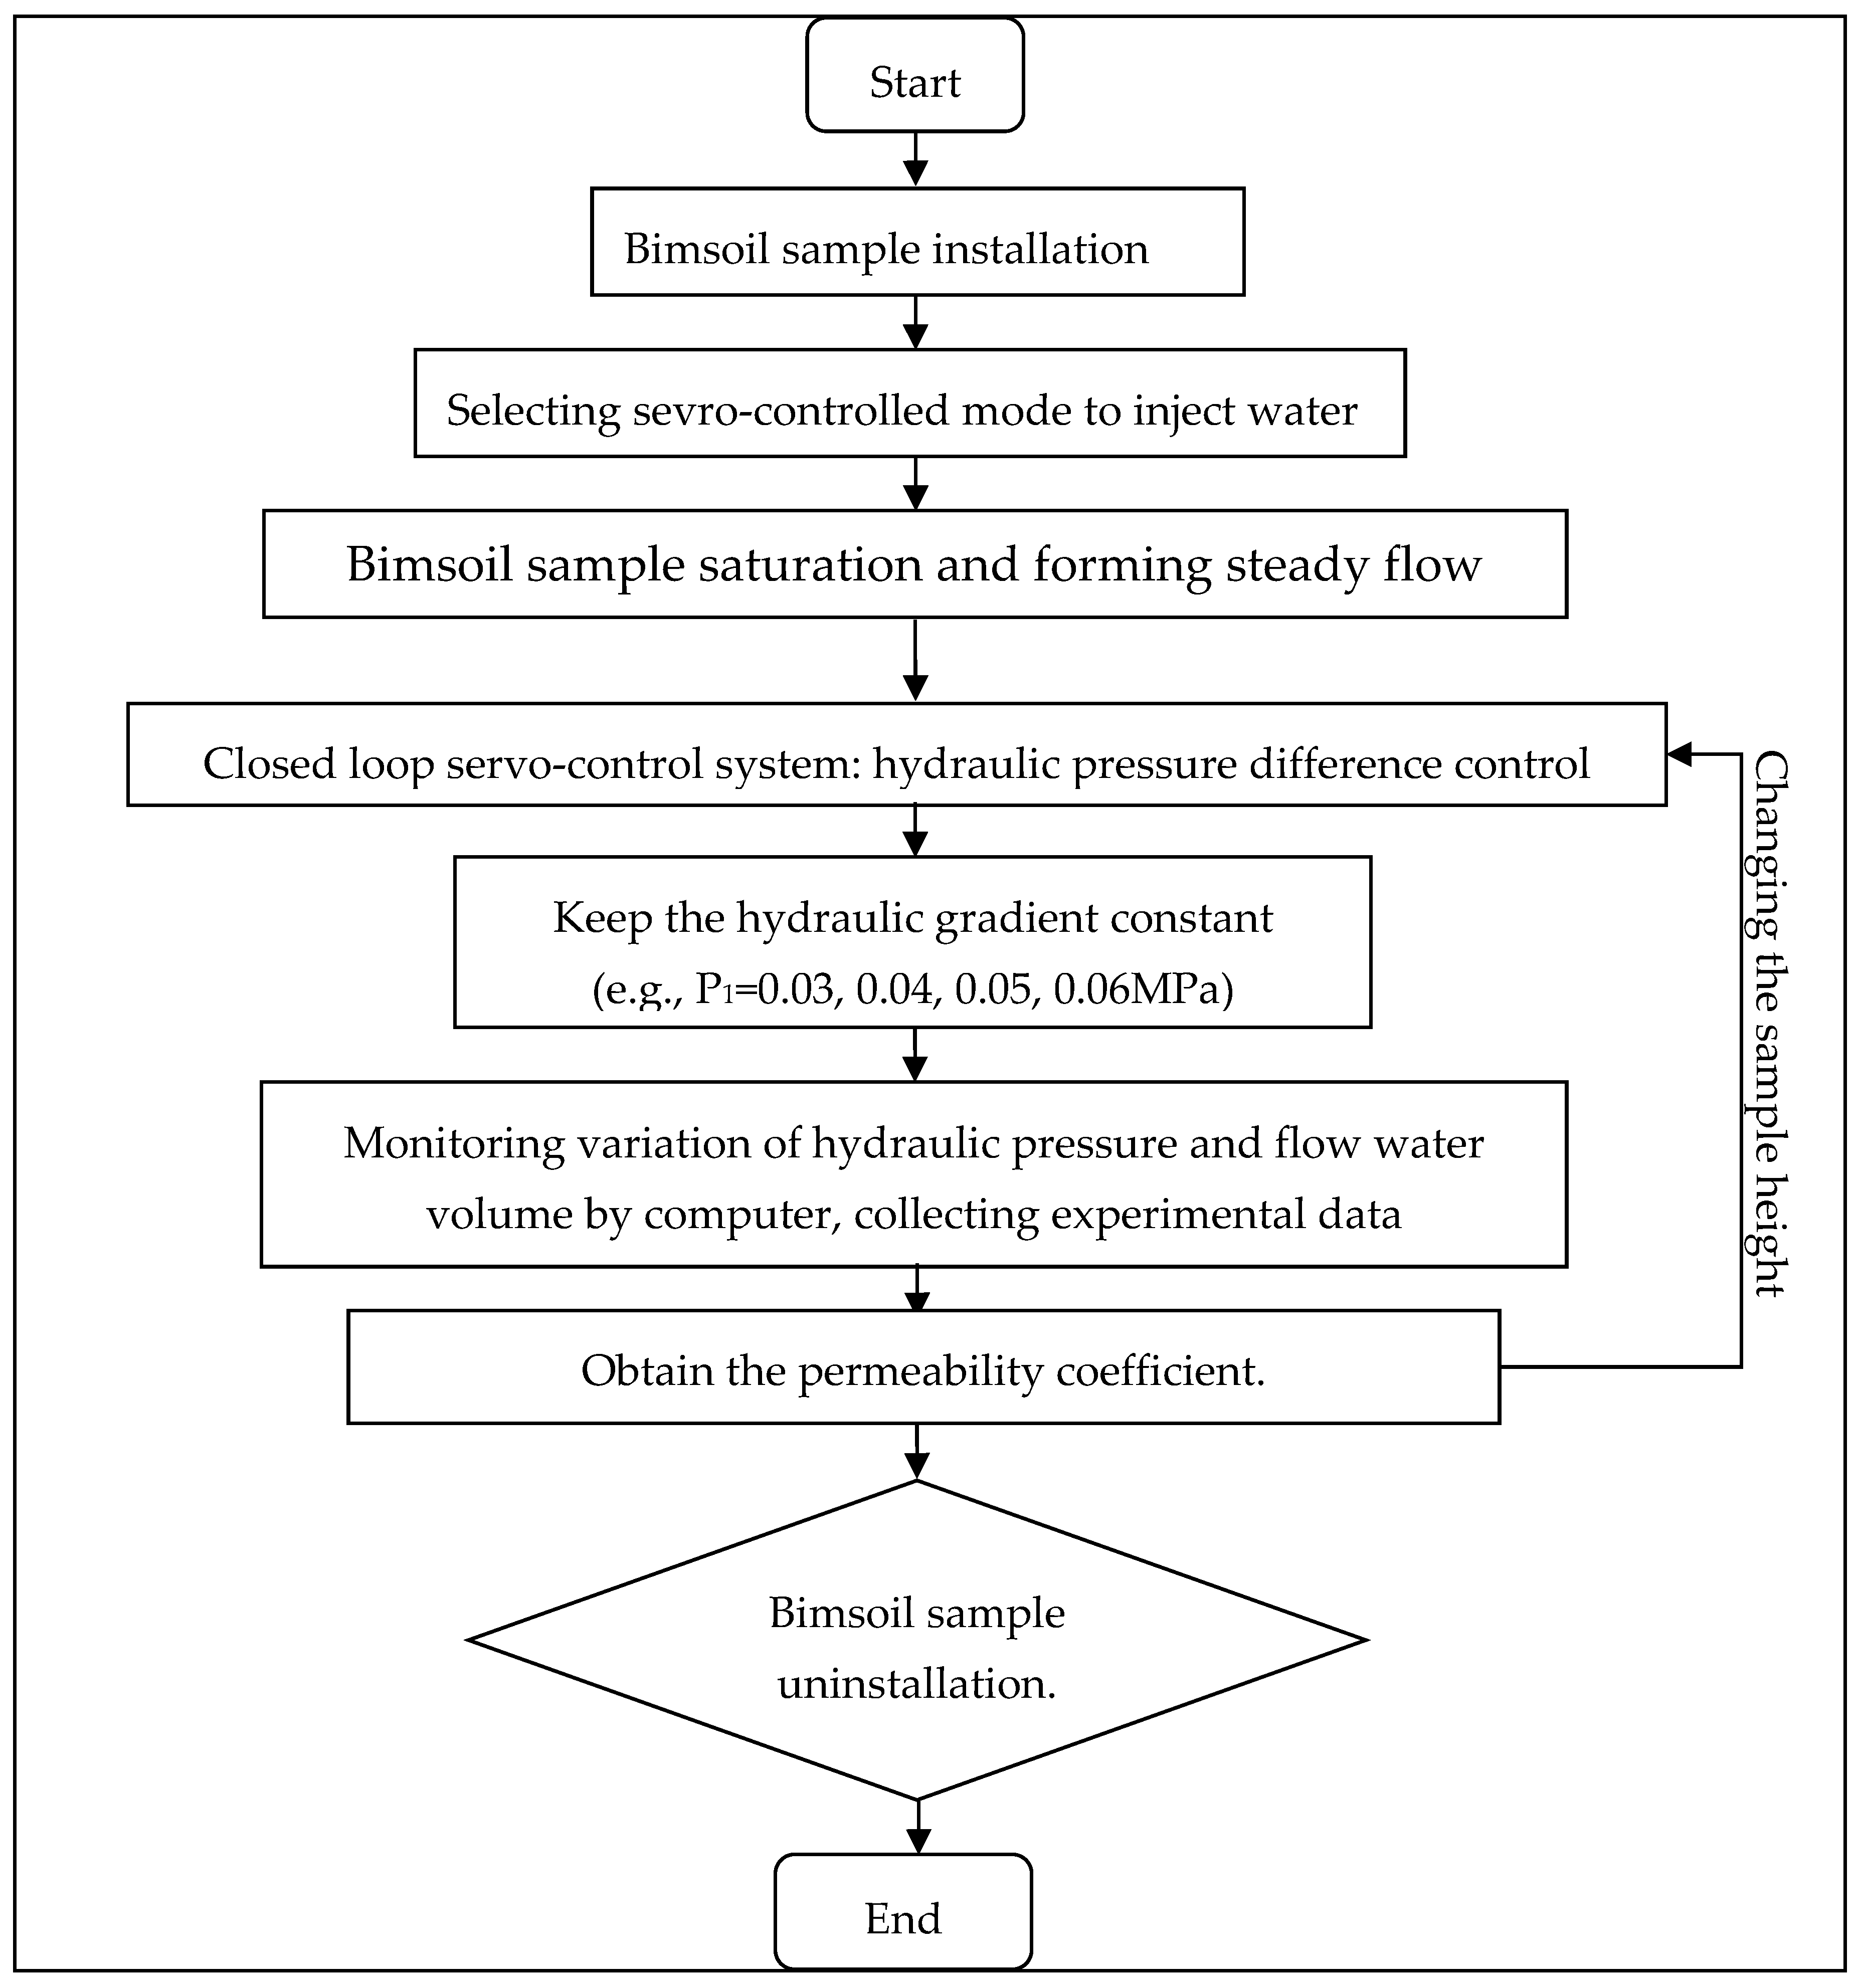
To investigate the effect of the slenderness ratio on the groundwater flow characteristics in bimsoil and to get some important conclusions from the flow test, the detailed technical flowchart is shown in Figure 7. First, the bimsoil sample was installed on the chamber system, and then the water was injected into the chamber at a constant rate until saturation of the bimsoil sample; at this moment, the seepage fluid in bimsoil reaches a steady state. When the sample reached saturation state, the hydraulic gradient was kept constant, and the flow test started. During the flow test, we monitored the variation of the hydraulic gradient and the flow water volume while collecting the corresponding experimental data. After analyzing the data, we obtained the permeability coefficient of bimsoil with a different heights with a certain RBP. The influence of the flow path on the permeability mechanism was analyzed.
The permeability coefficient of bimsoil was obtained when water flow reaches steady state. The water-outflow volume, hydraulic pressure and flow time at each of the injection steps were automatically recorded by a computer, and then we can calculate the hydraulic gradient, permeability coefficient based on Darcy law, as shown below [5,6]:
where Q is the total amount of water flow; A is the sample cross-section area; t is the flow time; L is flow distance (i.e., length of sample); P1 and P2 are the hydraulic pressure of the inlet valve and outlet valve, respectively; and and are the coefficient of water kinematic viscosity at T °C and 20 °C, respectively.
3. Experimental Results and Discussion
3.1. General Descriptions
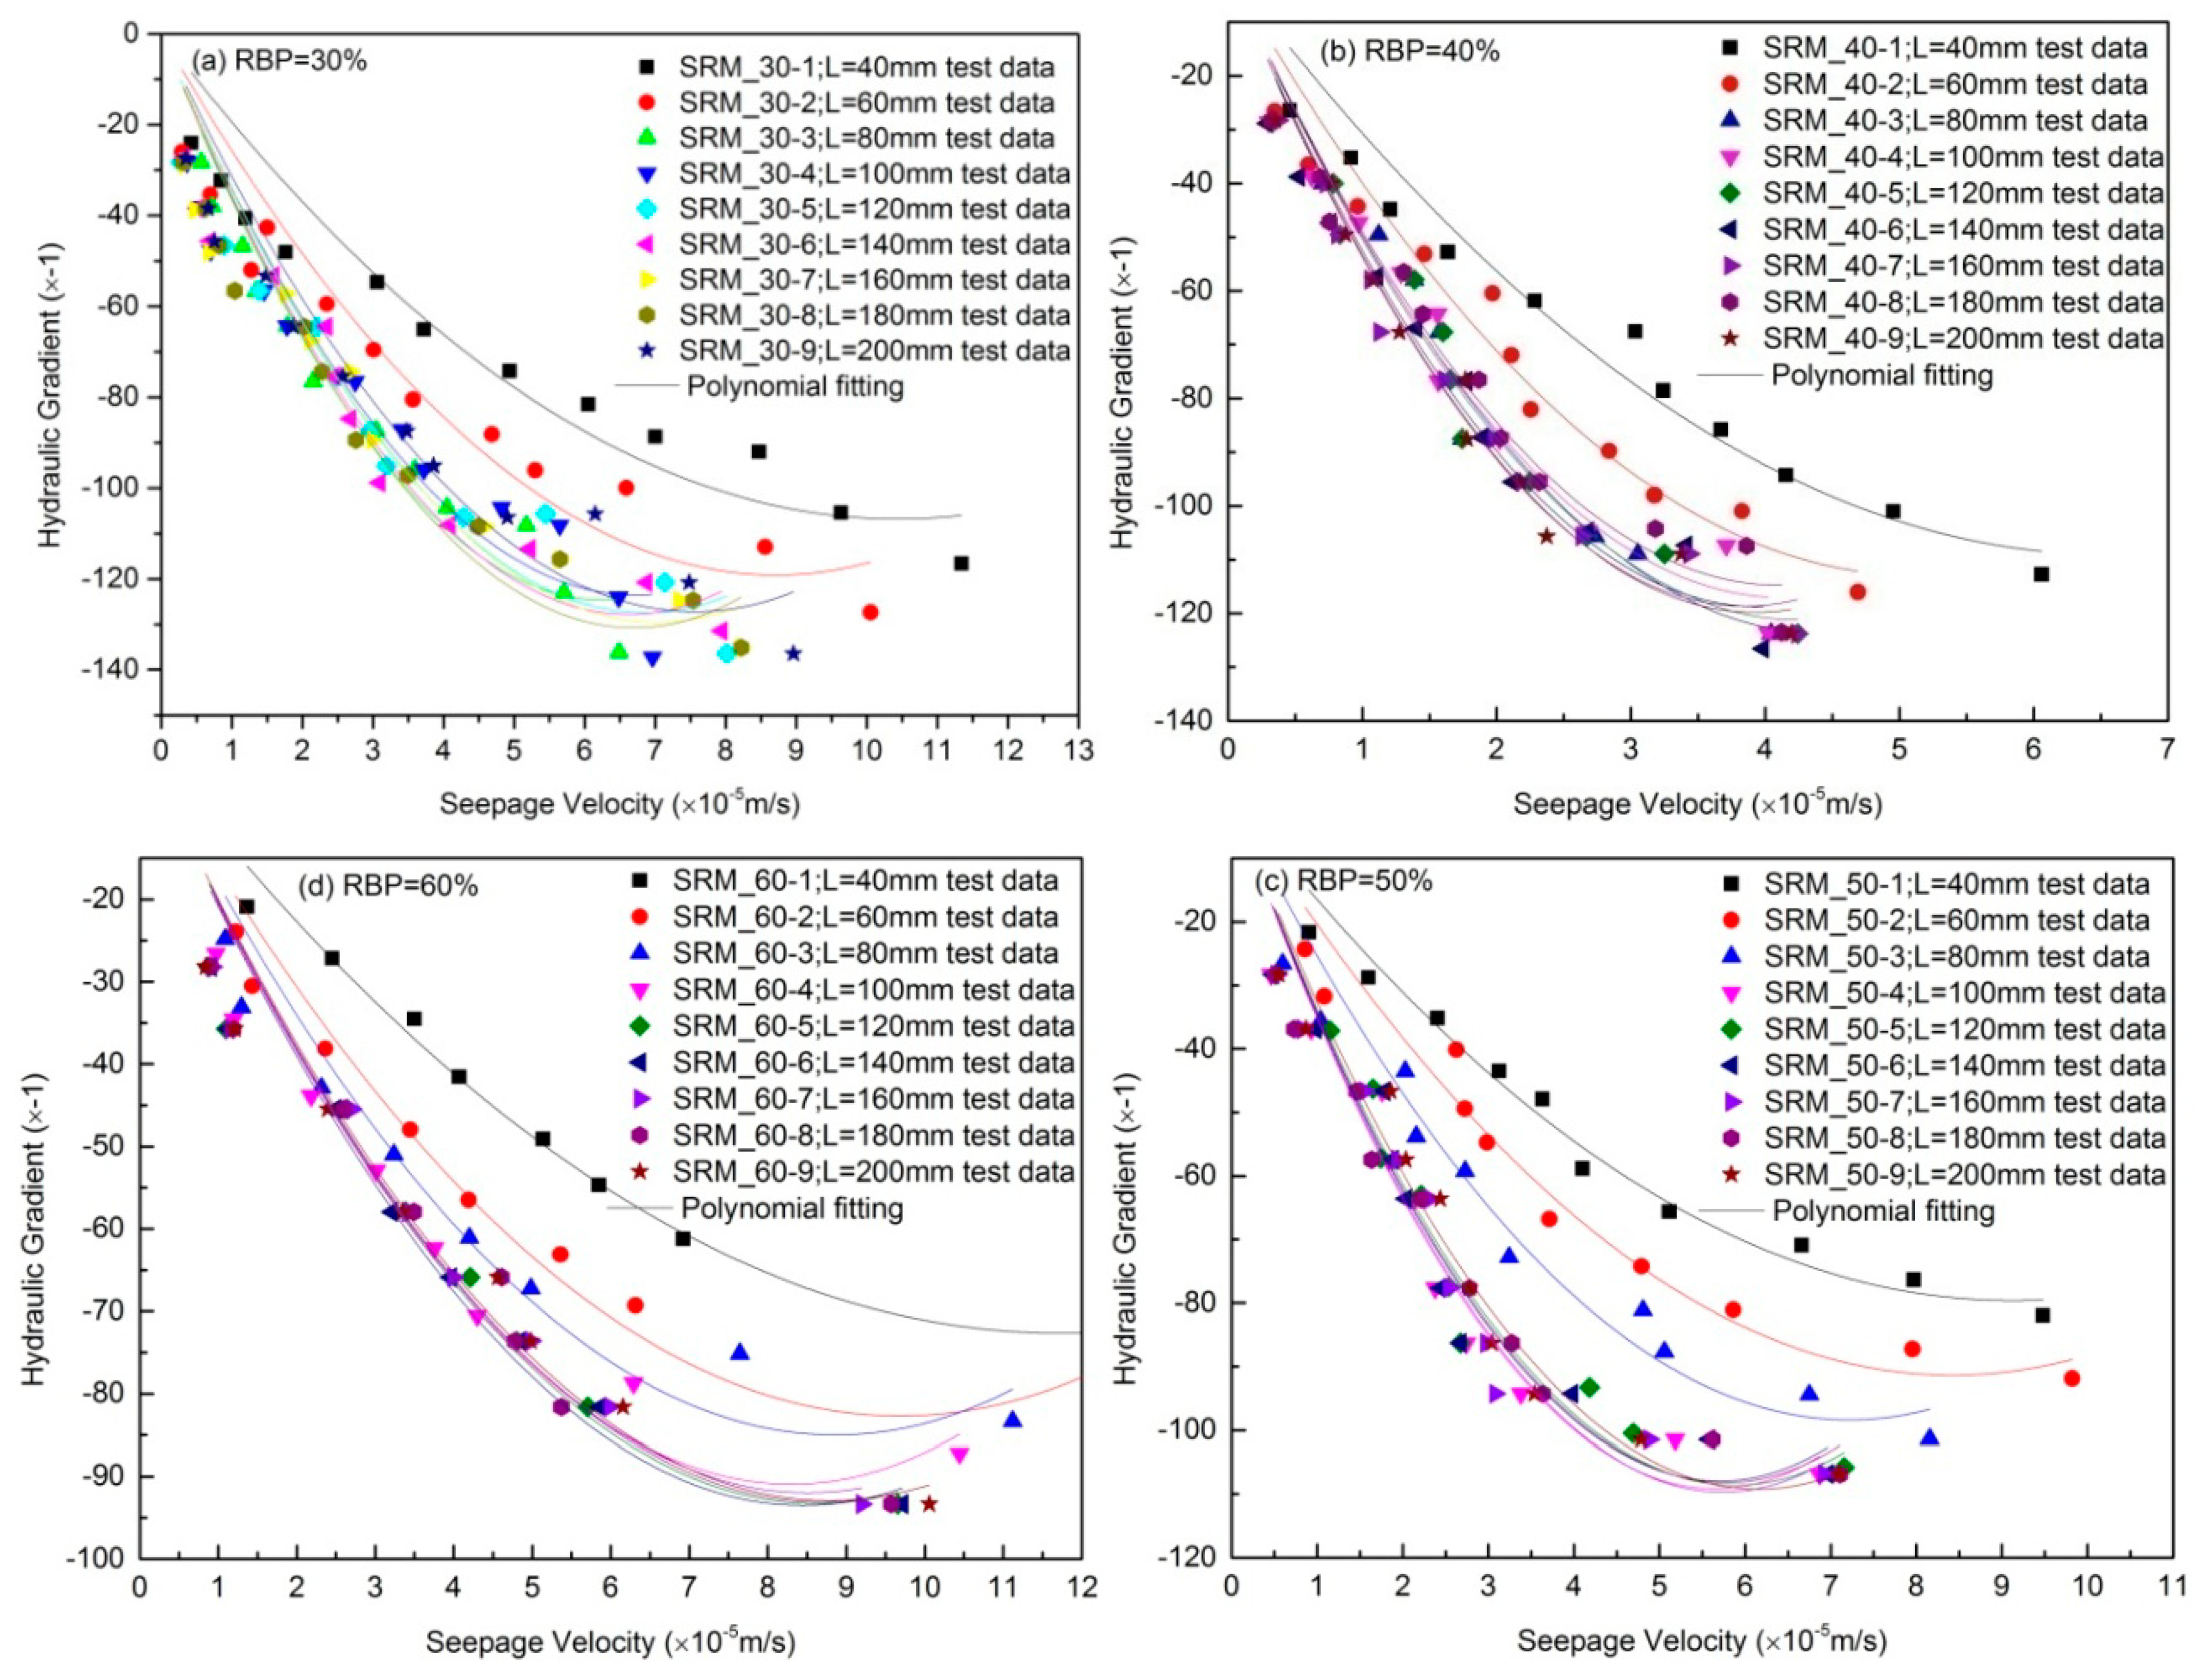
The relationships between hydraulic gradient and seepage velocity for bimsoil samples with different RBPs are shown in Figure 8. As shown in Figure 8, samples with various heights were tested from 40 mm to 200 mm. It can be seen that the seepage velocity increases with increasing hydraulic gradient, and the increment rate for bimsoil samples with a RBP of 60% is the most evident. In addition, for the samples with various RBPs, the seepage velocity decreased with the increase of sample height. These results implied that the permeability coefficient of bimsoils is variational and not constant, and it depends on the hydraulic gradient. This result is consistent with the study of Wang et al. [5]: the permeability law of bimsoils does not comply with Darcy’s law. With the increase of sample height, the curves tended to be stable. This indicates that the seepage field in inhomogeneous bimsoil becomes steady gradually after a certain flow distance; the flow distance is an important factor influencing the flow characteristics. Moreover, the critical sample height is different for samples with various RBPs.
3.2. The Non-Darcy’s Flow of Bimsoils
When water flows in bimsoils, with the increase of seepage velocity, the flow characteristic becomes non-Darcian, and the link between the seepage velocity and pressure gradient of Darcy’s Law becomes nonlinear (i.e., the bimsoil permeability depends on the seepage velocity). This dependency is influenced by the randomly distributed rock blocks in the bimsoil samples. To interpret this phenomenon well, an empirical equation was proposed by Forchheimer [39] to correct for the nonlinearity of Darcy’s Law. During the flow process in bimsoil, each stage of the stable value of the hydraulic gradient and seepage velocity is performed with a binomial fitting, and a modified version of Darcy’s Law can be obtained as below (Wang et al. 2015a):
where ρ is the fluid mass density; Ca is the acceleration coefficient; f is the volume force of unit mass; V is seepage velocity; p/x is pressure gradient; and coefficient β is termed the non-Darcy flow factor, m−1, also known as the inertial coefficient, inertial resistance, or turbulence factor. Both β and k are regarded as material constants of the Forchheimer’s equation in the range of its validity.
When the duration of the path of the fluid flow in bimsoil samples is long enough, the flow reaches stability, thus .Theoretical analysis shows that when ignoring the compressibility of the liquid, the pressure gradient presents a uniform distribution [39]. As a result, we rewrite the expression of the pressure difference as follows:
where pbase and ptop are the hydraulic pressure at the outlet and inlet of the bimsoil sample, respectively; and H is the height of the sample, which is the length of the flow path.
Neglecting the mass force, in the case the sample is not very large, the expression for Equation (3) can be written as follows:
Using the experimental data above, the polynomial fitting equations for the typical specimens with different specimen height are listed in Table 3, Table 4, Table 5 and Table 6. Figure 9 plots the curve fitting results of sample height from 40 mm to 200 mm, with RBP of 30%, 40%, 50%, and 60%, respectively. The correlation coefficient of all equations is good with a correlation coefficient larger than 0.9. From Equation (4), we can obtain the non-Darcy permeability coefficient and the non-Darcy flow β factor accordingly.
3.3. Slenderness Effect on Flow Characteristics
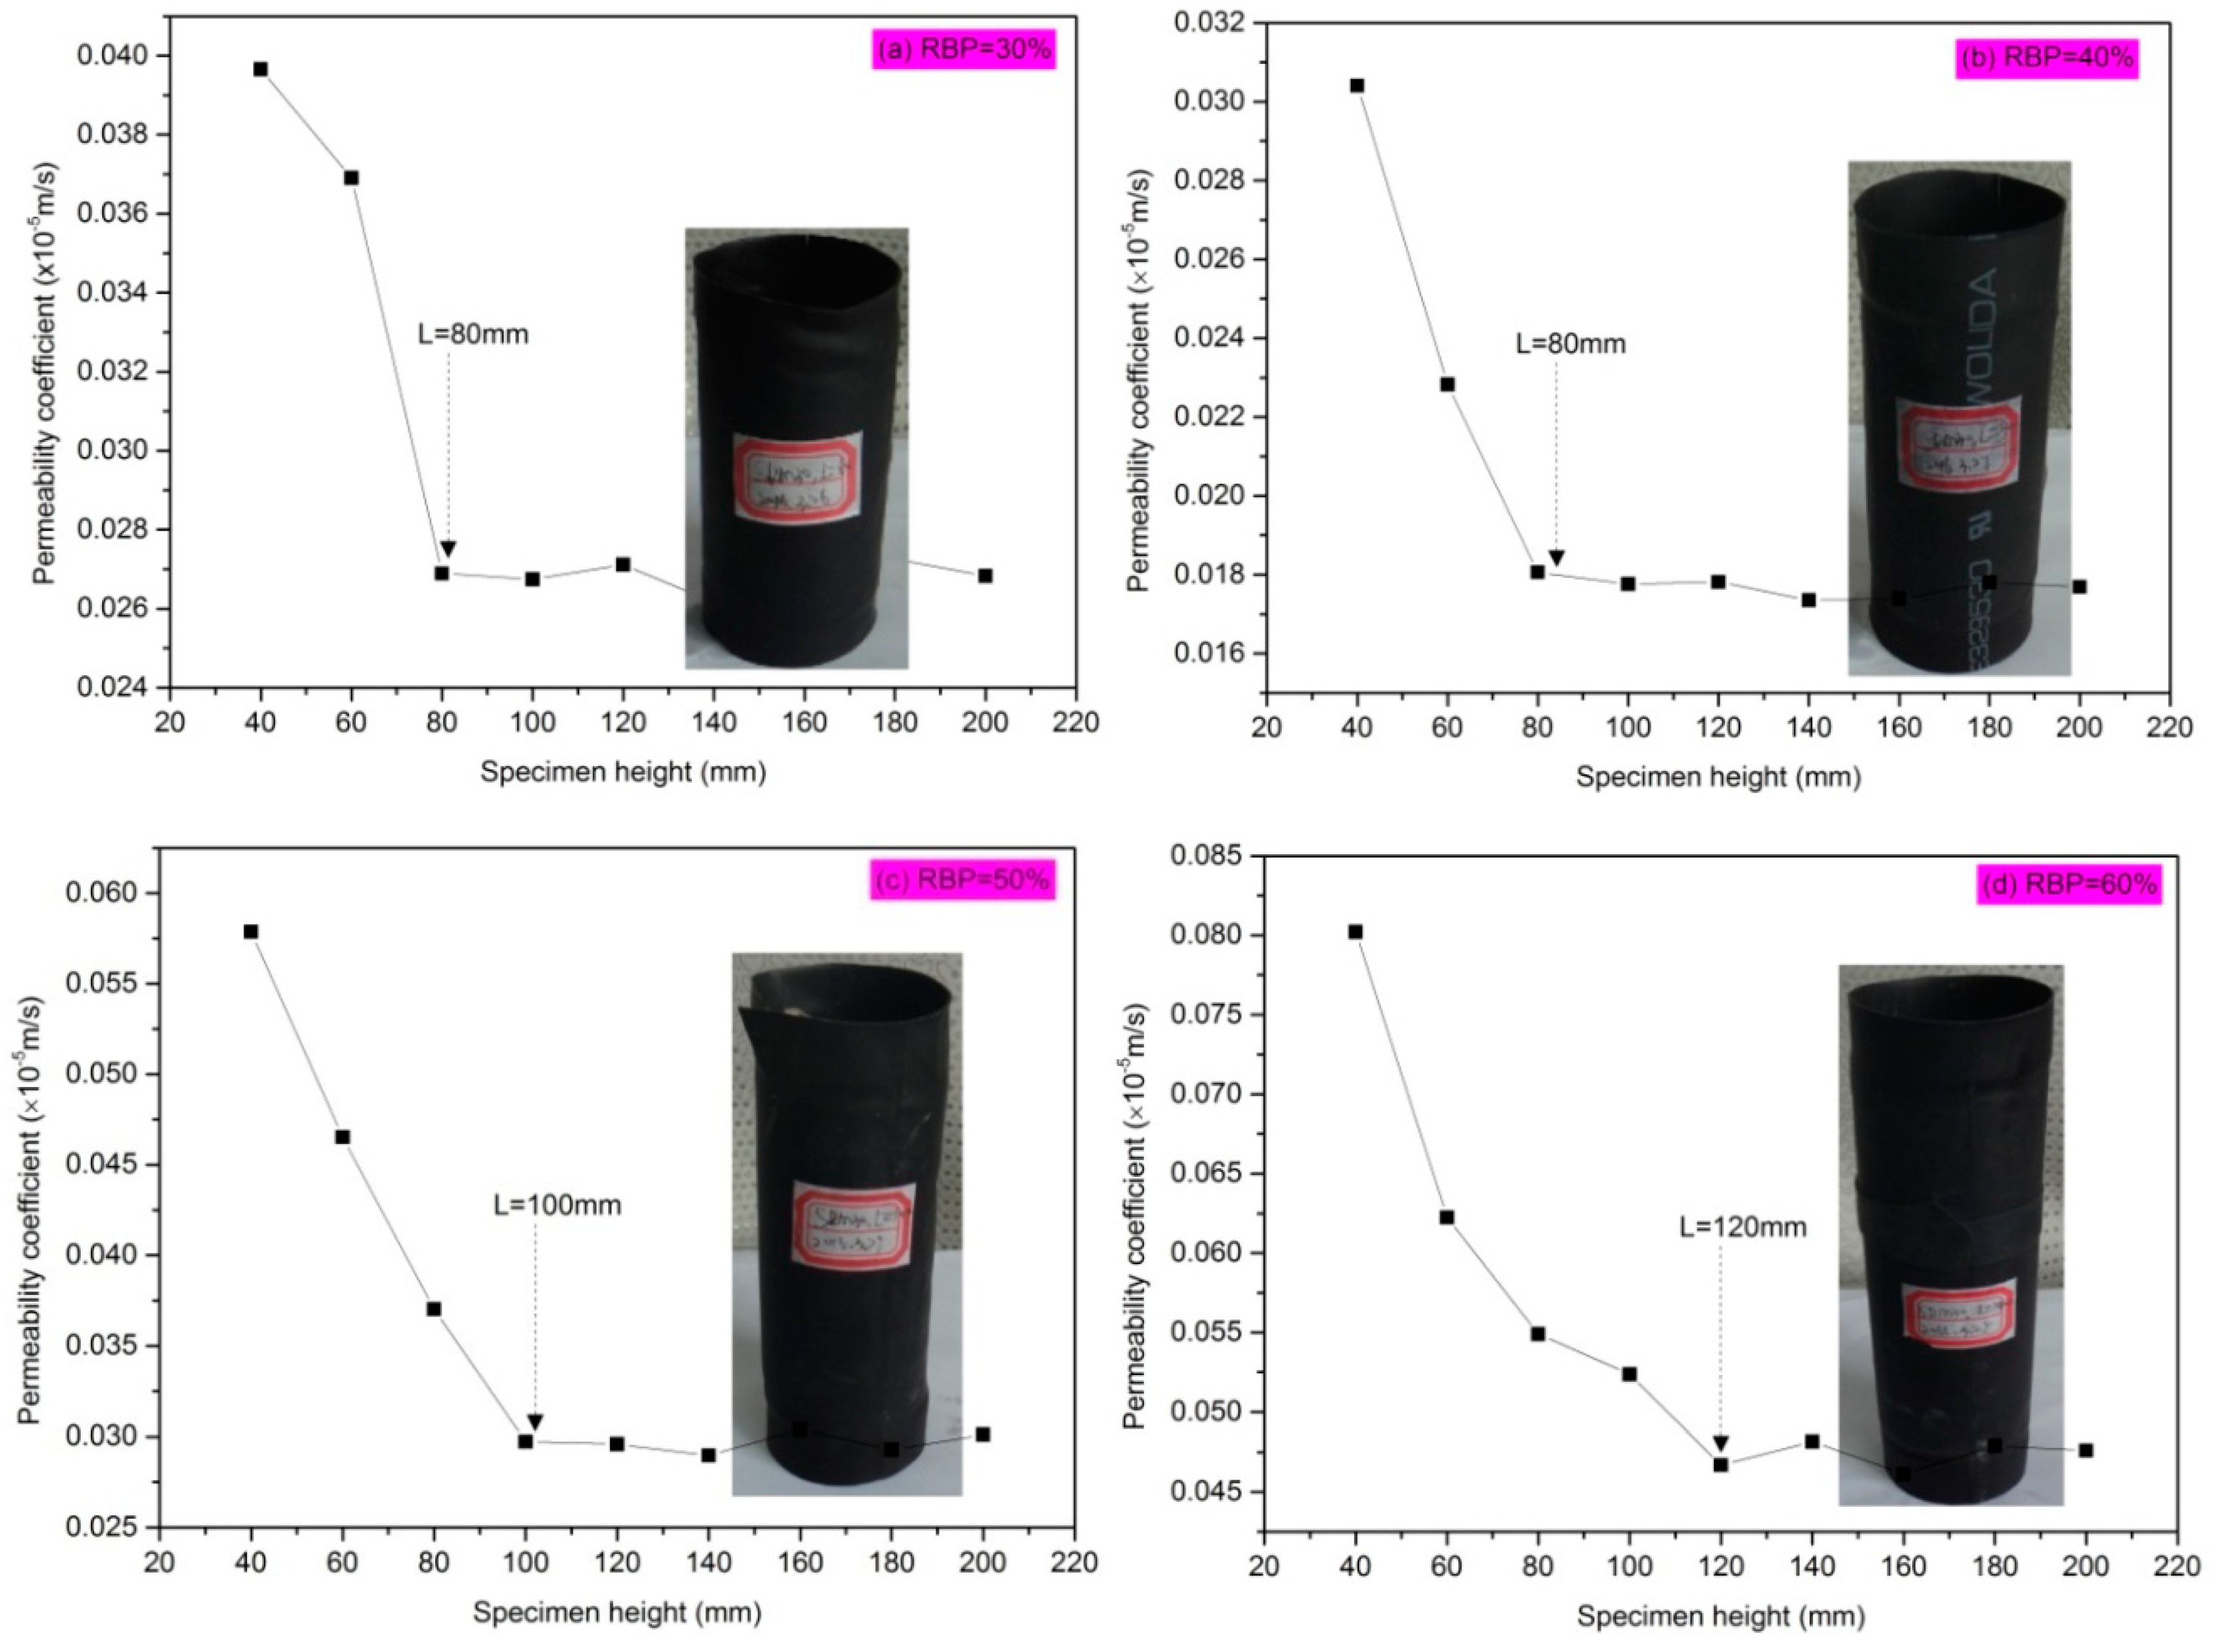
From Equation (4), we can obtain the non-Darcy permeability coefficient and the non-Darcy flow β factor. The plots of the permeability coefficient against sample height, for samples with different RBP, are shown in Figure 10. It can be seen that there exists an inflection on the curves; the permeability coefficient is prone to a stable value as the height increases. For the samples with RBP of 30% and 40%, the critical height is 80 mm; for the samples with RBP of 50%, the critical height is 100 mm; and for the samples with RBP of 60%, the critical height is 120 mm. These results indicate that when greater than the critical height, the seepage field in bimsoil tends to be stable. According to the results of Wang et al. [5], they conducted the flow tests five times for the bimsoil sample with the same RBP, and the results show that the permeability coefficient of the sample with the same RBP is almost same when using roughly the same morphology of the rock block in bimsoil samples. Therefore, distribution of rock blocks in samples with the same height may not be a primary factor influencing the flow characteristics. In this work, the tested samples have different height, the length of the sample may affect the distribution of rock blocks, which may further affect the heterogeneity and the associated permeability coefficient. The experimental results further imply that the flow distance is a crucial factor controlling the flow characteristics of bimsoil. We use a quadratic polynomial to fit the relationship between critical height and RBP, as shown in Equation (5). To eliminate the influence of the slenderness effect on the result of the flow test for bimsoil with various BRPs, using the equation fitting method to study the relationship between RBP and the critical sample height, it can be obtained from the equation as below (Figure 11):
where CH is the critical sample height, and RBP is the rock block content of the bimsoil sample.
CH = 0.05 × RBP2 − 3.1 × RBP + 127 (x > 25; D = 50 mm) R2 = 0.945
In this work, the slenderness effect has been studied by laboratory tests for samples with the same diameter but different heights. The change of the permeability coefficient with the sample slenderness ratio (H/D) is shown in Figure 12. It is noted that the permeability coefficient nonlinearly decreased with the H/D in an exponential fit, and the regression equations were listed in Table 7, which can be expressed as:
where a, b, and c are the coefficients related to the RBP of bimsoil.
K = c + b exp[a(H/D)]
Figure 13 shows plots of the non-Darcy flow factor versus sample height. The degree of non-Darcy flow decreases with the increase of sample height. This result indicates that with the increase of flow distance, the non-Darcy degree becomes weaker, and the effect of the rock–soil interface flow becomes stable. Content of the rock blocks in bimsoil samples controls the orientation and tortuosity degree of flow and the associated non-Darcy degree. With the increase of flow distance, the incidence of rock blocks also decreases. In Figure 13, it can also be seen that the non-Darcy factor of bimsoil samples with RBP of 40% is larger than these samples with the RBP of 30%, 50%, and 60%. The non-Darcy flow characteristics for samples with RBP of 40% is very obvious, which indicates that the interaction between rock blocks and the soil matrix is great. From the results of Wang et al. [5], with the increase of the RBP, the average permeability coefficient decreases to a minimum at a RBP of 40%.As the RBP value continues to increase above 40%, the permeability increases again. The variation of permeability for bimsoil samples is a result of soil matrix properties combined with rock blocks and rock–soil interfaces. The results in this work further prove this phenomenon; for sample with RBP of 40%, interaction between soil matrix and rock blocks is stronger when the water flows in bimsoil.
3.4. Discussions
The scale effect is a widespread phenomenon for various geomaterials (e.g., soil, rock, etc.), especially for the extreme soil and rock mixtures. Plenty of studies about the slenderness effect of bimsoil are mainly focused on the strength and deformation properties, and they think that the block size and distribution results in the scale effect of bimsoil. In our work, the slenderness effect also exists for the flow characteristic of bimsoil. We speculated that the reason may result from the seepage tortuosity along the flow direction. When water transports in bimsoil, the soil matrix combined with rock blocks and rock–soil interfaces simultaneously controls the flow characteristics. Flow tortuosity alters the seepage field and flow direction, and the water is prone to flowing along the path with least tortuosity, and the sample with larger RBP has the most tortuous flow path, therefore, the critical flow distance is larger than sample with low RBP. Specifically, the flow path tends to be along the direction with the least tortuosity, and the sample with more slender height, provides more possible flow paths along the flow direction. Therefore, as the sample slenderness increases, the tortuosity is reduced and the non-Darcy flow characteristic becomes not asobvious.
4. Conclusions
In this work, we focus on the slenderness effect of artificial bimsoil under unconfined flow test using a self-developed servo-controlled permeability testing system. Up to now, however, few reports have been published about this issue. The flow slenderness effect was studied according to the relationships among the seepage velocity, permeability coefficient, non-Darcy flow factor, and the critical sample height. Some main conclusions can be drawn as below:
- (1)
- Flow distance is a key factor influencing the non-Darcy flow characteristics of bimsoil. With the increase flow distance, the seepage field in bimsoil tends to stabilize, and the seepage velocity is prone to be a constant value at the same hydraulic gradient. The permeability of bimsoil is influenced by the soil matrix properties combined with rock blocks and rock–soil interfaces.
- (2)
- The permeability coefficient of bimsoil samples with different slenderness ratios is different. The value of the permeability coefficient decreases with the increase of flow distance. At the same sample diameter, the critical height varies for samples with different RBP, and its value increases with increasing RBP. The permeability coefficient varies in a monotonously decreasing nonlinear correlation with the sample slenderness. The slenderness effect for high RBP scenario is much more obvious.
- (3)
- The degree of non-Darcy flow in bimsoil decreases with the increase of sample height. The flow path is prone to be along the channel with the least tortuosity, and a more slender sample can provide more possible flow paths along the flow direction.
Acknowledgments
The authors would like to thank the editors and the anonymous reviewers for their helpful and constructive comments. This work was supported by the Beijing Natural Science Foundation of China (Grants No. 8164070), the Fundamental Research Funds for the Central Universities, and National Natural Science Foundation of China (Grant No. 41502294).
Author Contributions
Y. Wang and C. Li designed the theoretical framework; Y. Wang conducted the experiment, analyzed the experimental date and wrote the manuscript; and X. Wei and Z. Hou corrected the figures.
Conflicts of Interest
The authors declare no conflict of interest.
References
- Coli, N.; Berry, P.; Boldini, D. In situ non-conventional shear tests for the mechanical characterisation of a bimrock. Int. J. Rock Mech. Min. 2011, 48, 95–102. [Google Scholar] [CrossRef]
- Wang, Y.; Li, X. Experimental study on cracking damage characteristics of a soil and rock mixture by UPV testing. Bull. Eng. Geol. Environ. 2015, 74, 775–788. [Google Scholar] [CrossRef]
- Wang, Y.; Li, X.; Wu, Y.F.; Lin, C.; Zhang, B. Experimental study on meso-damage cracking characteristics of RSA by CT test. Environ. Earth Sci. 2015, 73, 5545–5558. [Google Scholar] [CrossRef]
- Wang, Y.; Li, X.; Zheng, B.; Zhang, B.; Wang, J.B. Real-time ultrasonic experiments and mechanical properties of soil and rock mixture during triaxial deformation. Géotech. Lett. 2015, 5, 281–286. [Google Scholar] [CrossRef]
- Wang, Y.; Li, X.; Zheng, B.; Zhang, Y.X.; Li, G.F. Experimental study on the non-Darcy flow characteristics of soil–rock mixture. Environ. Earth Sci. 2016, 75, 1–18. [Google Scholar] [CrossRef]
- Wang, Y.; Li, X.; Zheng, B.; Li, S.D.; Duan, Y.T. A laboratory study of the effect of confining pressure on permeable property in soil-rock mixture. Environ. Earth Sci. 2016, 75, 1–16. [Google Scholar] [CrossRef]
- Wang, Y.; Li, X.; Zheng, B.; Ma, C.F. An Experimental Investigation of the Flow–Stress Coupling Characteristics of Soil–Rock Mixture Under Compression. Transp. Porous Med. 2016, 112, 429–450. [Google Scholar] [CrossRef]
- Wang, Y.; Li, X.; Zheng, B.; He, J.M.; Li, S.D. Macro–meso failure mechanism of soil–rock mixture at medium strain rates. Géotech. Lett. 2016, 6, 28–33. [Google Scholar] [CrossRef]
- Zhang, S.; Tang, H.M.; Zhan, H.B.; Lei, G.P.; Cheng, H. Investigation of scale effect of numerical unconfined compression strengths of virtual colluvial–deluvial soil–rock mixture. Int. J. Rock Mech. Min. 2015, 77, 208–219. [Google Scholar] [CrossRef]
- Lindquist, E.S. The Strength and Deformation Properties of Melange. Ph.D. Thesis, Department of Civil Engineering, University of California, Berkeley, CA, USA, June 1994. [Google Scholar]
- Goodman, R.E.; Ahlgren, C.S. Evaluating safety of concrete gravity dam on weak rock. J. Geotech. Geoenviron. Eng. 2000, 126, 429–442. [Google Scholar] [CrossRef]
- Medley, E.; Lindquist, E.S. The engineering significance of the scale-independence of some Franciscan Melanges in California, USA. In Proceedings of the 35th US Rock Mechanics Symposium, Reno, NV, USA, 5–7 June 1995; Daemen, J.K., Schultz, R.A., Eds.; Balkema: Rotterdam, The Netherlands, 1995; pp. 907–914. [Google Scholar]
- Medley, E.W. Systematic characterization of mélange bimrocks and other chaotic soil/rock mixtures. Felsbau-Rock Soil Eng. 1999, 17, 152–162. [Google Scholar]
- Medley, E.W. Observations on tortuous failure surfaces in Bimrocks. Felsbau Rock Soil Eng. 2004, 5, 35–43. [Google Scholar]
- Medley, E.W.; Wakabayashi, J. Geological characterization of mélange for practitioners. Felsbau Rock Soil Eng. J. Eng. Geol. Geomech. Tunn. 2004, 2, 10–18. [Google Scholar]
- Sonmez, H.; Kasapoglu, K.E.; Coskun, A.; Tunusluoglu, C.; Medley, E.W.; Zimmerman, R.W. A conceptional empirical approach for the overall strength of unwelded bimrocks. In Rock Engineering in Difficult Ground Conditions, Karst and Soft Rock, Proceeding of the International Society Rock Mechanics Regional Symposium, Dubrovnik, Croatia, 29–31 October 2009; CRC Press: Leiden, The Netherlands, 2009; pp. 29–31. [Google Scholar]
- Coli, N.; Boldin, I.D.; Bandini, A.; Lopes, D.S. Modeling of complex geological rock mixtures under triaxial testing conditions. In Proceedings of the International Symposium on Rock Engineering & Technology for Sustainable Underground Construction (Eurock), Stockholm, Sweden, 28–30 May 2012. [Google Scholar]
- Kahraman, S.; Alber, M. Estimating unconned compressive strength and elastic modulus of a fault breccias mixture of weak block sand strong matrix. Int. J. Rock Mech. Min. Sci. 2006, 43, 1277–1287. [Google Scholar] [CrossRef]
- Kahraman, S.; Albe, R.M. Triaxial strength of a fault breccias of weak rocks in a strong matrix. Bull. Eng. Geol. Environ. 2008, 67, 435–441. [Google Scholar] [CrossRef]
- Afifipour, M.; Moarefvand, P. Failure patterns of geomaterials with block-in-matrix texture: Experimental and numerical evaluation. Arab. J. Geosci. 2014, 7, 2781–2792. [Google Scholar] [CrossRef]
- Medley, E.W. Uncertainty in estimates of block volumetric proportions in melange bimrock. In Proceedings of the International Symposium, 22nd Engineering Geology and the Environment, Athens, Greece, 23–27 June 1997; Marinos, P.G., Koukis, G.C., Tsiambaos, G.C., Stournaras, G.C., Eds.; Balkema: Rotterdam, The Netherlands, 1997; pp. 267–272. [Google Scholar]
- Li, X.; Liao, Q.L.; He, J.M. In-situ tests and astochastic structural model of rock and soil aggregate in the three Gorges Reservoir Area, China. Int. J. Rock Mech. Min. Sci. 2004, 41, 702–727. [Google Scholar] [CrossRef]
- Akram, M.S. Physical and Numerical Investigation of Conglomeratic Rocks. Ph.D. Thesis, University of New South Wales, Sydney, Australia, June 2010. [Google Scholar]
- Bagnold, R.A.; Barndorff-Nielsen, O. The pattern of natural size distribution. Sedimentology 1980, 27, 199–207. [Google Scholar] [CrossRef]
- Xu, W.J.; Wang, Y.G. Meso-structural permeability of S-RM based on numerical tests. Chin. J. Geotech. Eng. 2010, 32, 543–550. (In Chinese) [Google Scholar]
- Shelley, T.L.; Daniel, D.E. Effect of gravel on hydraulic conductivity of compacted soil liners. J. Geotech. Eng. ASCE 1993, 119, 54–68. [Google Scholar] [CrossRef]
- Shafiee, A. Permeability of compacted granule-clay mixtures. Eng. Geol. 2008, 97, 199–208. [Google Scholar] [CrossRef]
- Vallejo, L.E.; Zhou, Y. The mechanical properties of simulated soil–rock mixtures. In Proceedings of the 13th International Conference on Soil Mechanics and Foundation Engineering, New Delhi, India, 5–10 January 1994; pp. 365–368. [Google Scholar]
- Gutierrez, J.J.; Vallejo, L.E. Laboratory Experiments on the Hydraulic Conductivity of Sands with Dispersed Rock Particles. Geotech. Geol. Eng. 2013, 31, 1405–1410. [Google Scholar] [CrossRef]
- Chen, X.B.; Li, Z.Y.; Zhang, J.S. Effect of granite gravel content on improved granular mixtures as railway subgrade fillings. J. Cent. South Univ. 2014, 21, 3361–3369. (In Chinese) [Google Scholar] [CrossRef]
- Chen, Z.H.; Chen, S.J.; Chen, J.; Sheng, Q.; Yan, H.; Hu, W. In-situ Double-Ring Infiltration Test of Soil-Rock Mixture. J. Yangtze River Sci. Res. Inst. 2012, 29, 52–56. (In Chinese) [Google Scholar]
- Gao, Q.; Liu, Z.H.; Li, X.; Li, J.H. Permeability Characteristics of Rock and Soil Aggregate of Backfilling Open-Pit And Particle Element Numerical Analysis. Chin. J. Rock Mech. Eng. 2009, 28, 2342–2348. (In Chinese) [Google Scholar]
- Wu, J.H.; Chen, J.H.; Lu, C.W. Investigation of the Hsien-du-Shan rock avalanche caused by typhoon Morakot in 2009 at Kaohsiung county, Taiwan. Int. J. Rock Mech. Min. 2013, 60, 148–159. [Google Scholar] [CrossRef]
- Liao, Q.L. Geological Origin and Structure Model of Rock and Soil Aggregate and Study on Its Mechanical and MH Coupled Properties. Ph.D. Thesis, Institute of Geology and Geophysics, Chinese Academy of Science, Beijing, China, July 2004. (In Chinese). [Google Scholar]
- British Standard Methods of Test for Soils for Civil Engineering Purposes-Part 1: General Requirements and Sample Preparation; BS1377-1; BSI: London, UK, 1990.
- Standard for Soil Test Method, GB/T 50123-1999; Ministry of Water Resources of the People’s Republic of China: Beijing, China, 1999.
- Donaghe, R.T.; Torrey, V.H. Proposed New Standard Test Method For Laboratory Compaction Testing of Soil-Rock Mixtures Using Standard Effort. Geotech. Test. J. 1994, 3, 387–392. [Google Scholar]
- Rücknagel, J.; Götze, P.; Hofmann, B.; Christen, O.; Marschall, K. The influence of soil gravel content on compaction behaviour and pre-compression stress. Geoderma 2013, 209–210, 226–232. [Google Scholar] [CrossRef]
- Forchheimer, P. Wasserbewegung durch Boden. Zeitz. Ver. Dtsch Ing. 1901, 45, 1782–1788. [Google Scholar]
Figure 1.
Schematic diagram of the flow testing system [5], which is composed of the rigid sample holder, the servo pressurized water-supply system, and the sample chamber system.
Figure 1.
Schematic diagram of the flow testing system [5], which is composed of the rigid sample holder, the servo pressurized water-supply system, and the sample chamber system.
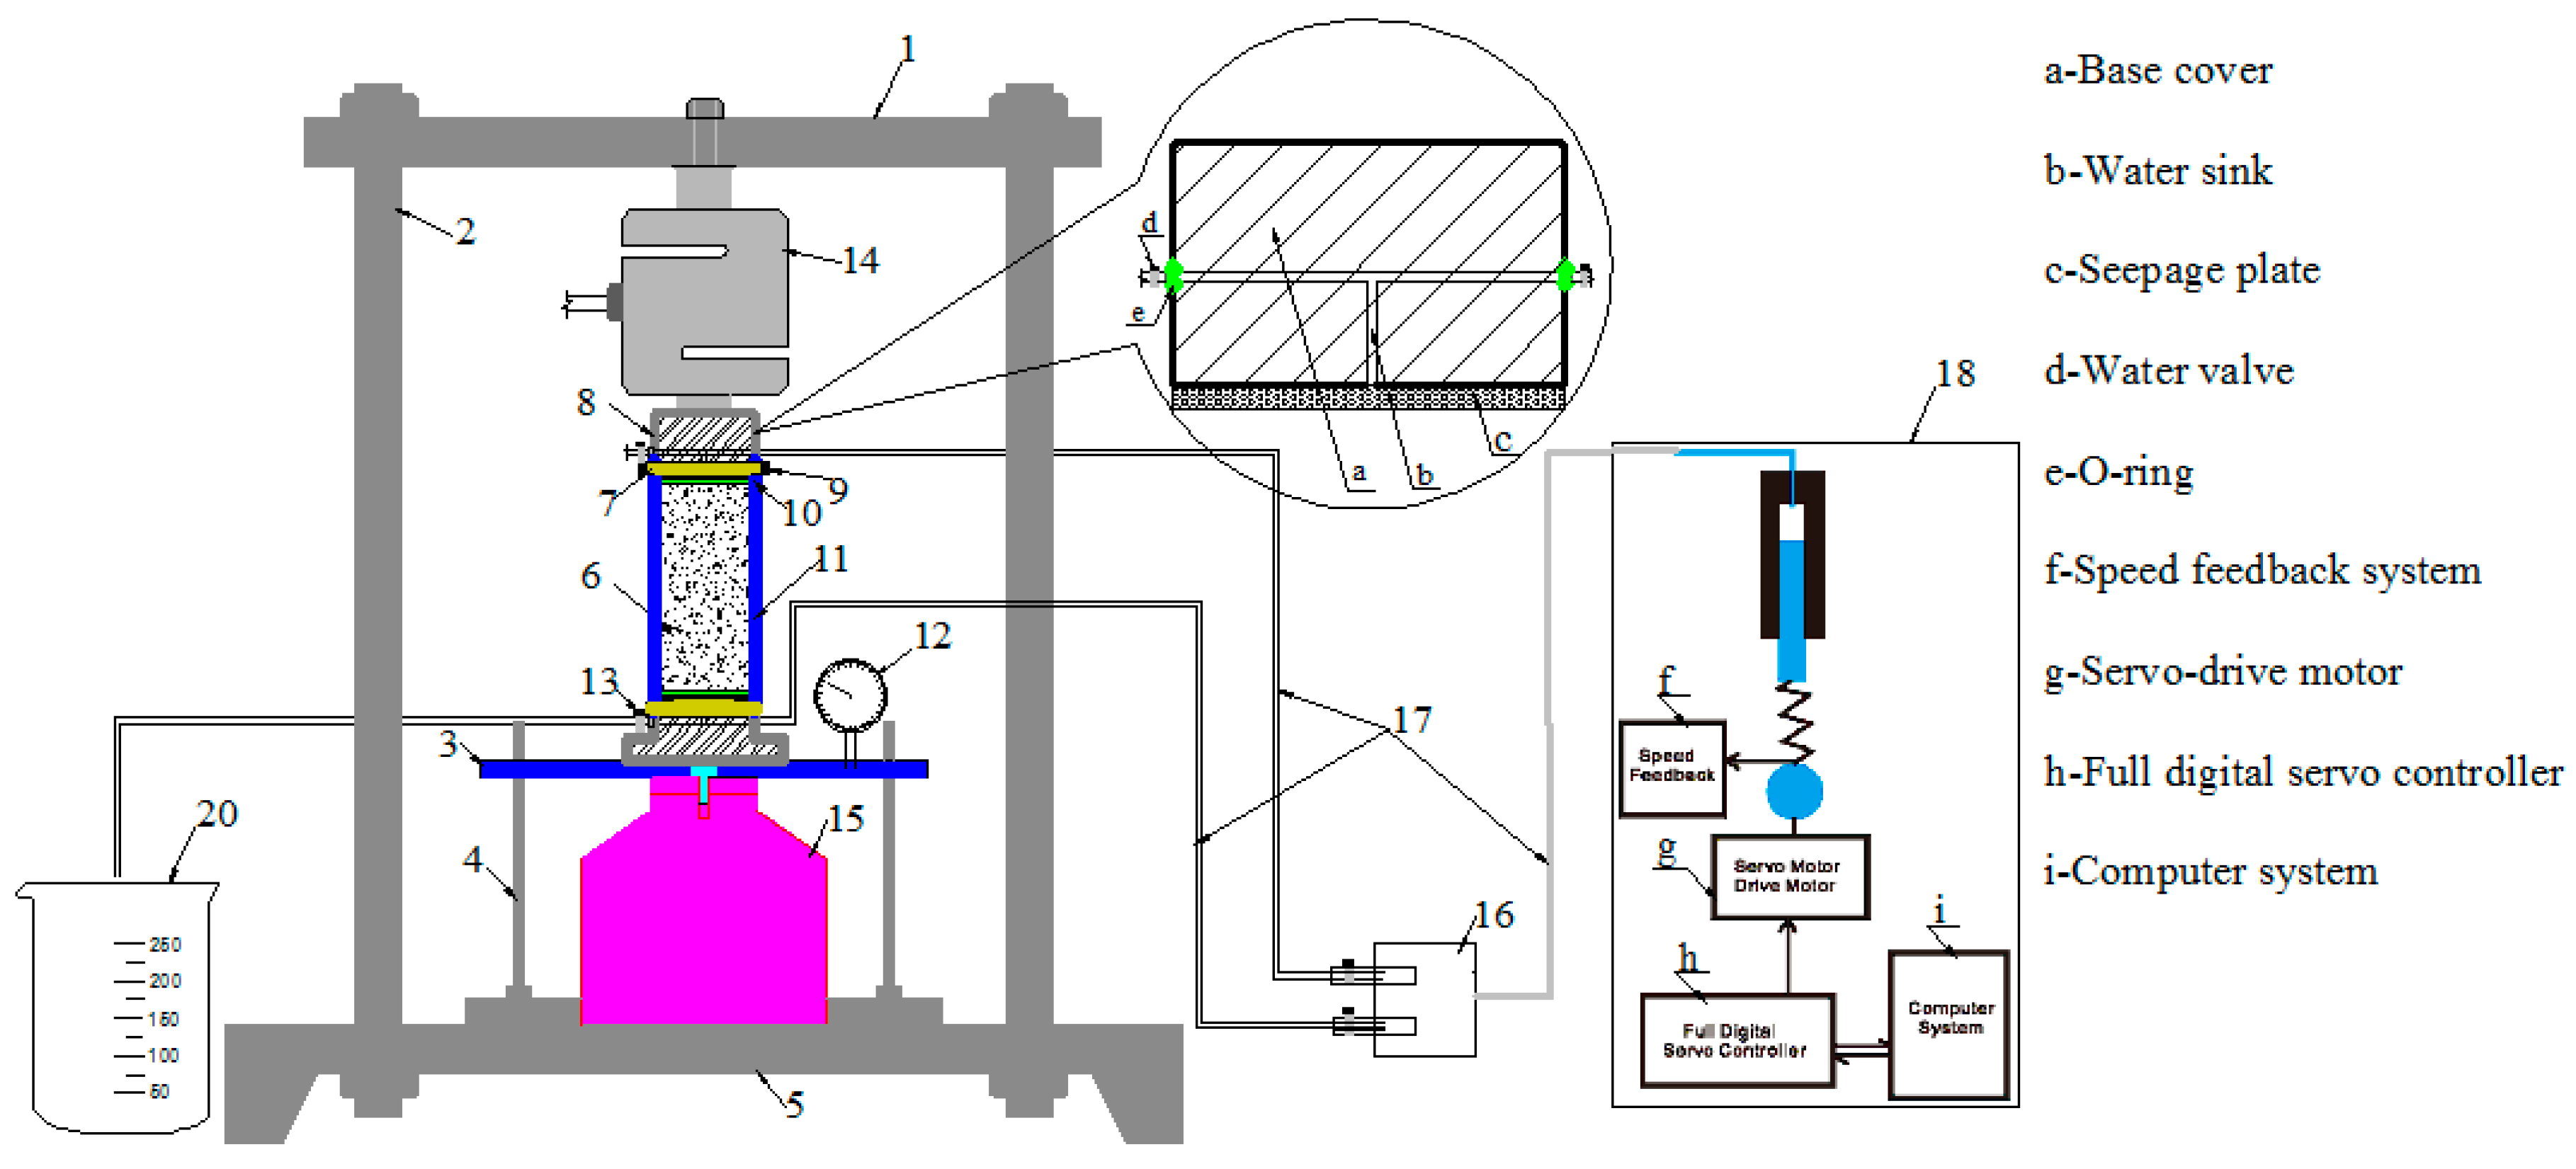
Figure 2.
Photograph of the sample chamber structure and metal permeability cushions [5]: (a) the upper cushion; (b) the lower cushion; and (c) structure of the sample chamber.
Figure 2.
Photograph of the sample chamber structure and metal permeability cushions [5]: (a) the upper cushion; (b) the lower cushion; and (c) structure of the sample chamber.
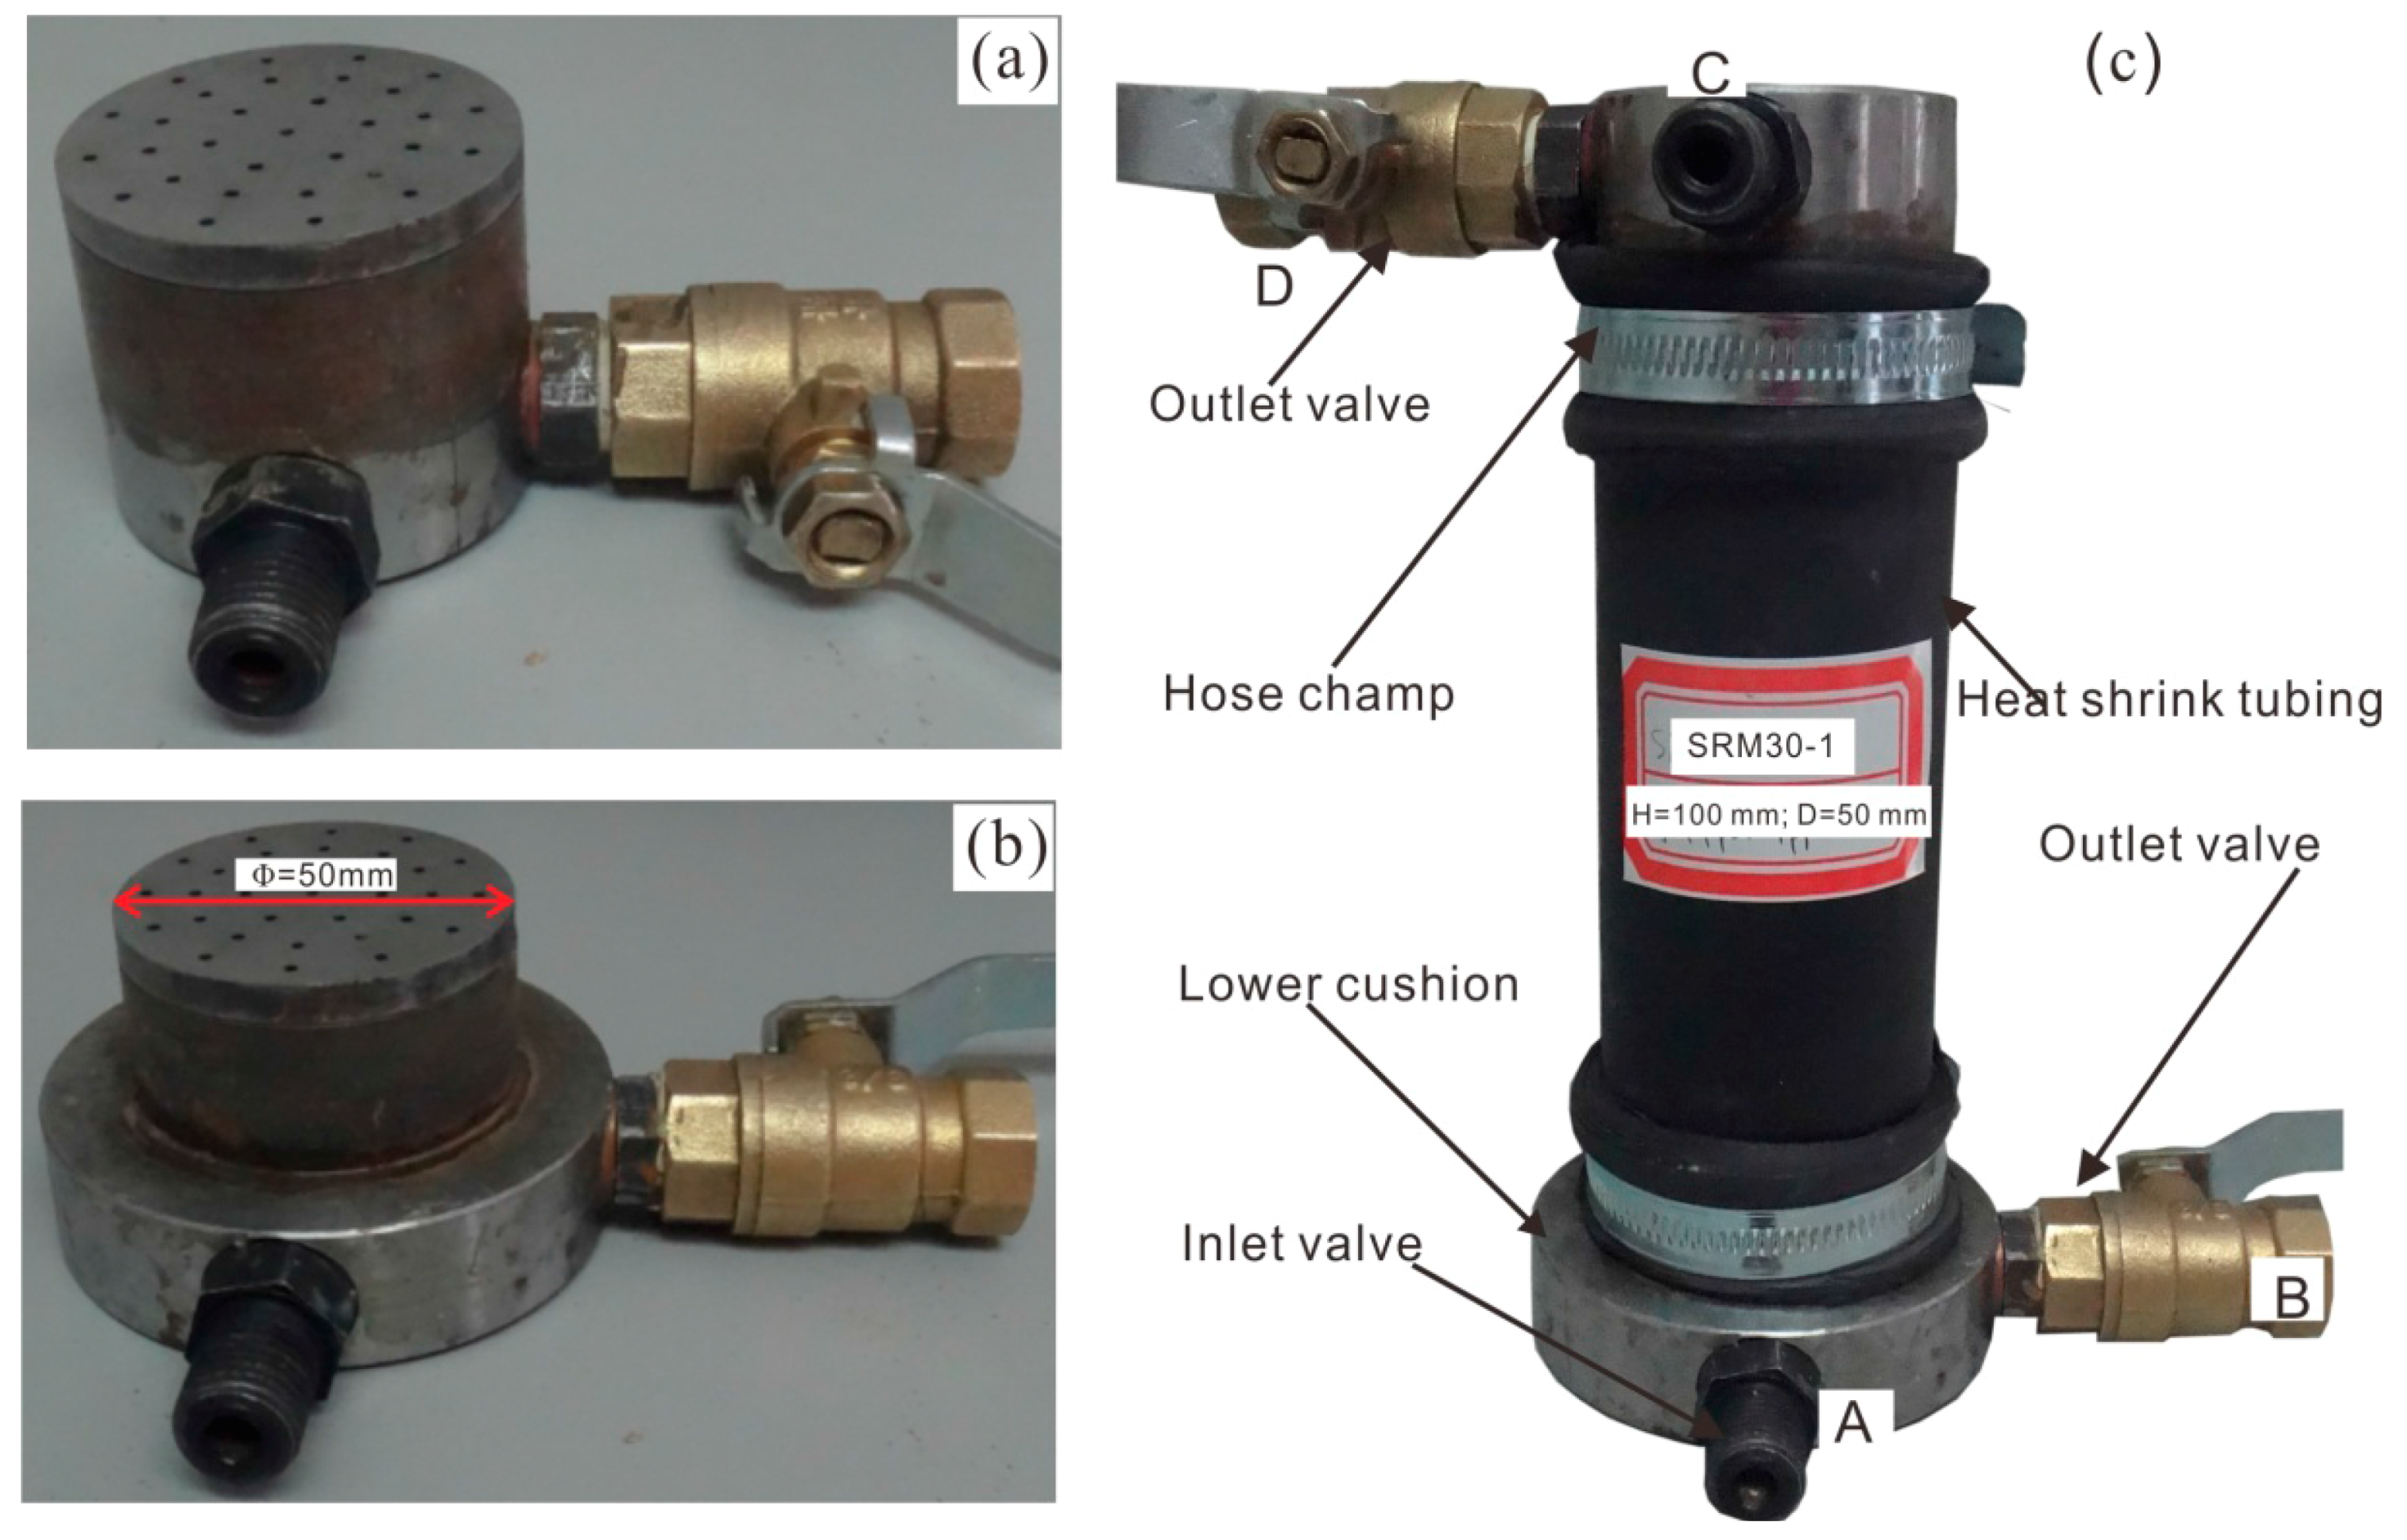
Figure 3.
The sample chamber system for bimsoil samples with different height, taking samples with RBP (rock block percentages) of 30% as an example.
Figure 3.
The sample chamber system for bimsoil samples with different height, taking samples with RBP (rock block percentages) of 30% as an example.
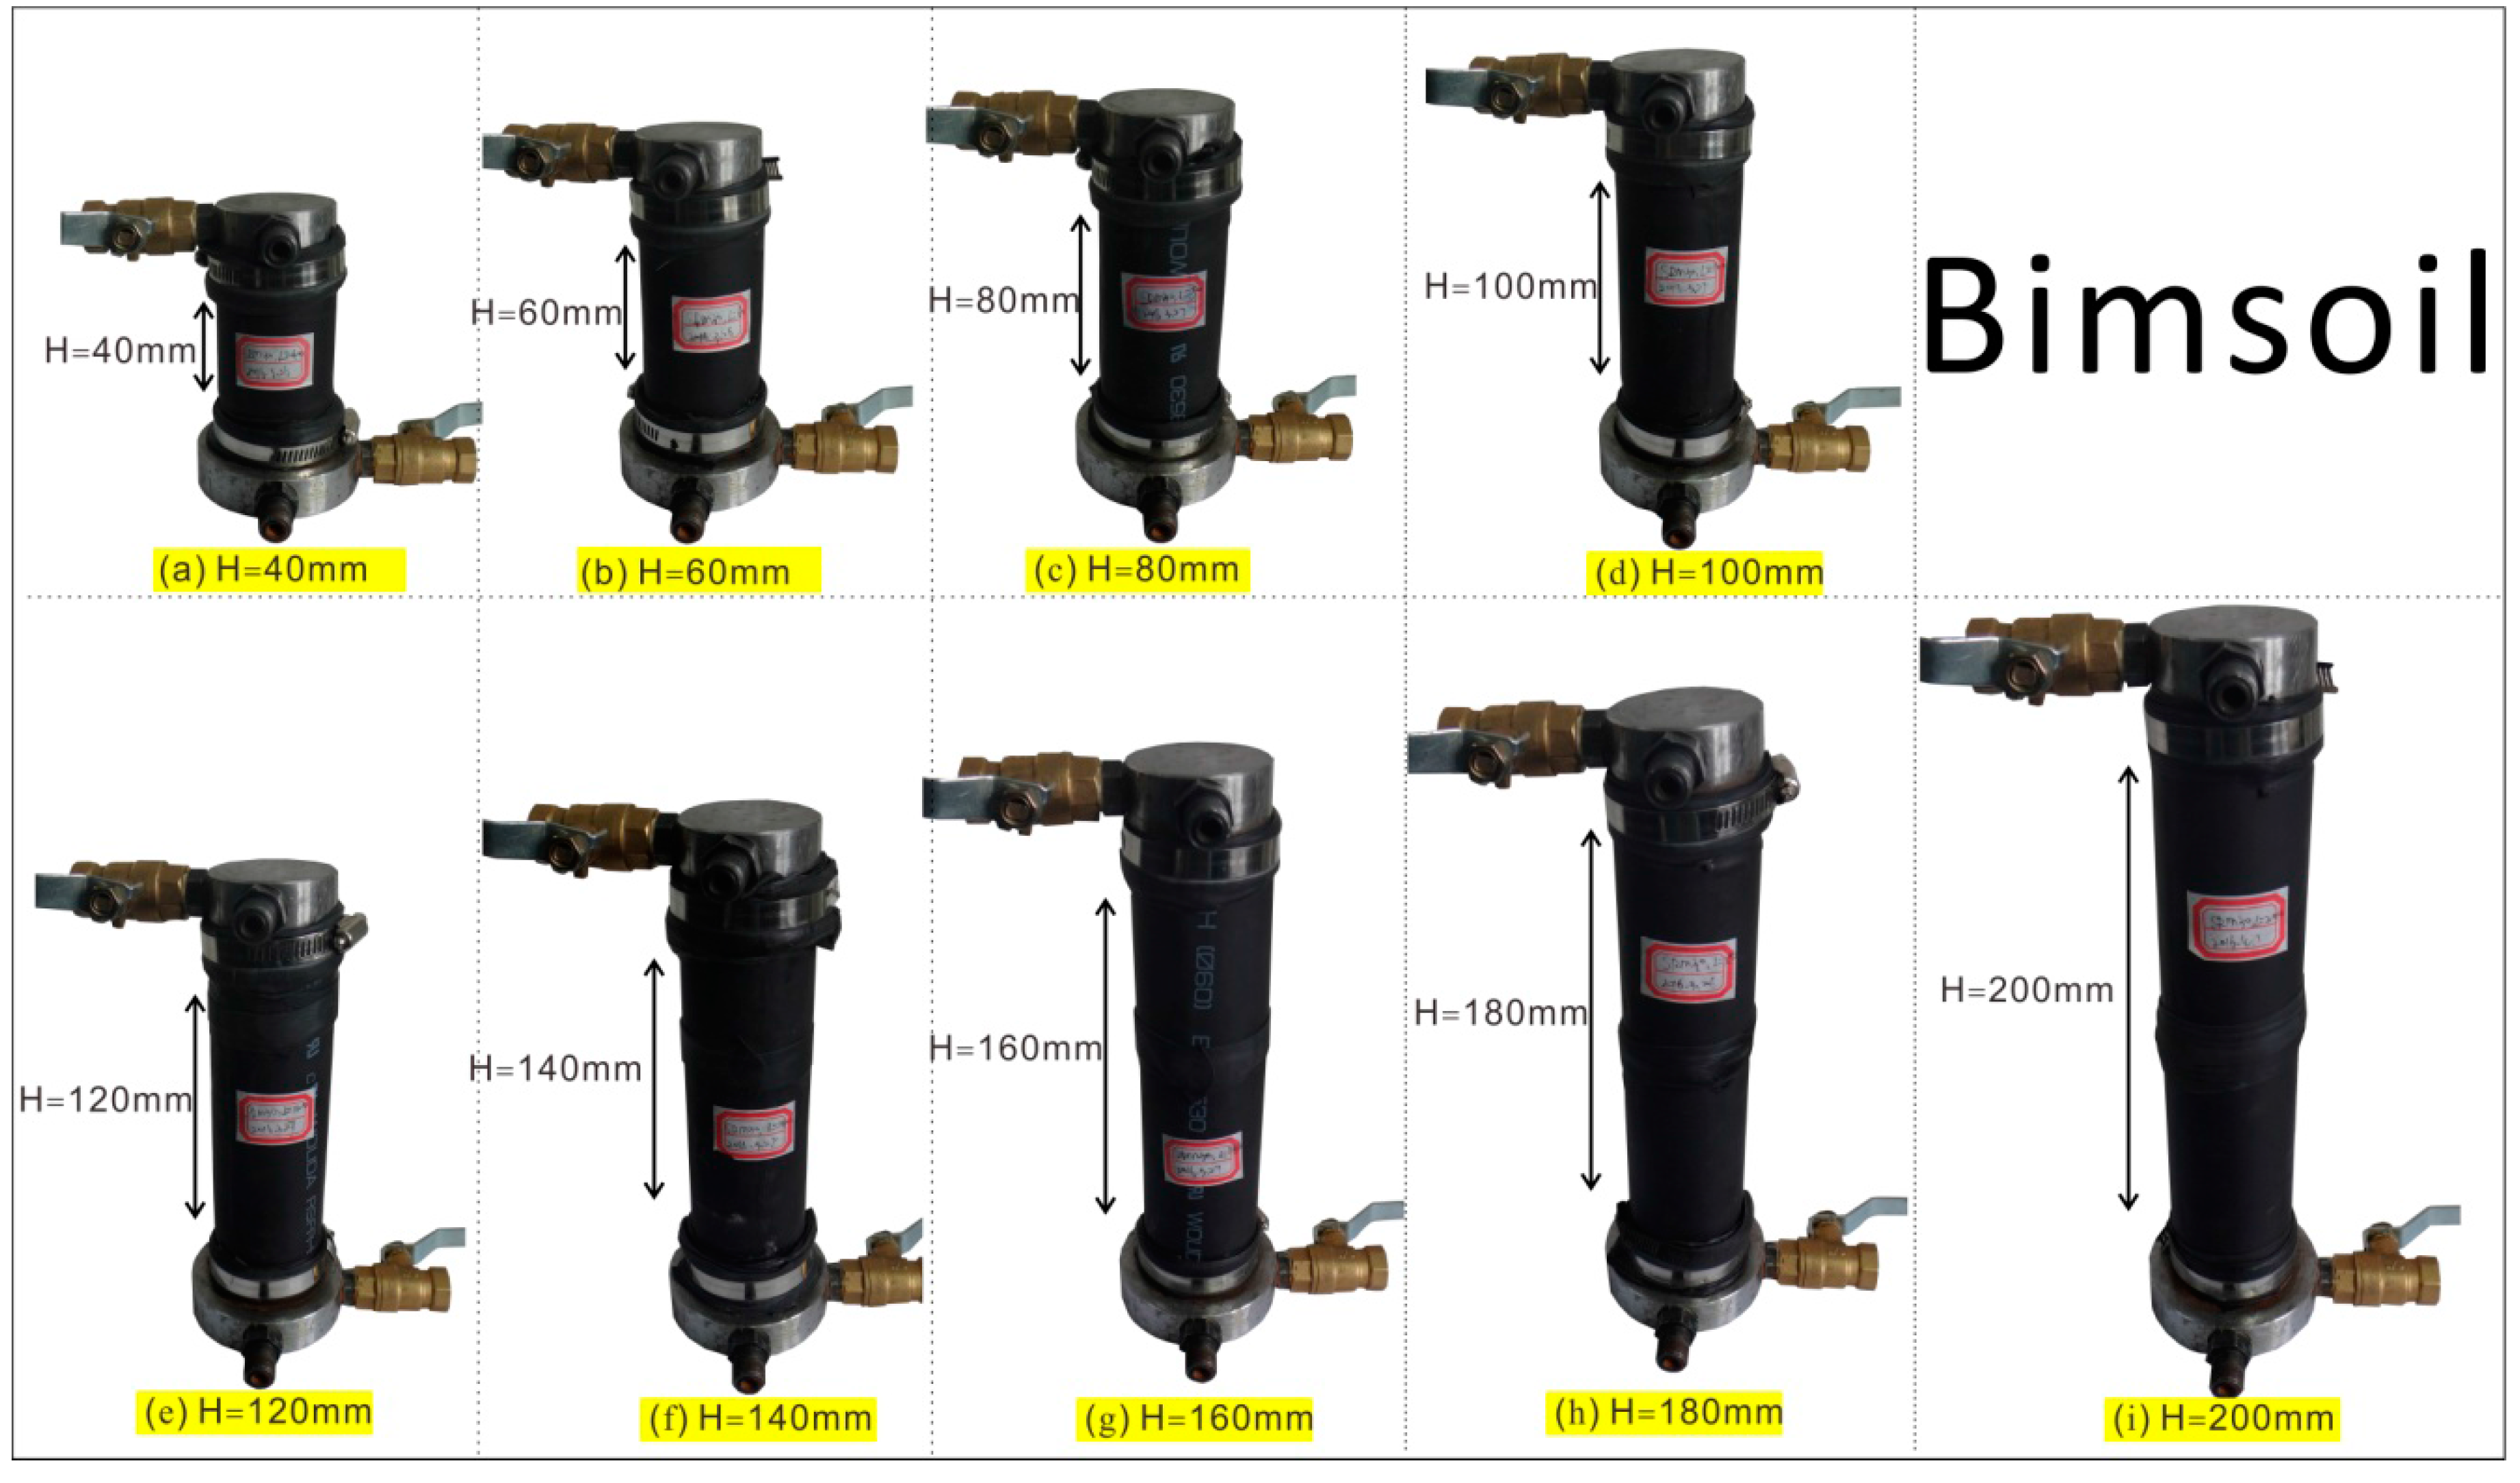
Figure 4.
The soil and rock blocks used in the preparation of bimsoil samples [5]: (a) grain size distribution of soil matrix, with particle size larger than 0.074; and (b) rock blocks used in bimsoil samples, size range between 2 and 5 mm.
Figure 4.
The soil and rock blocks used in the preparation of bimsoil samples [5]: (a) grain size distribution of soil matrix, with particle size larger than 0.074; and (b) rock blocks used in bimsoil samples, size range between 2 and 5 mm.

Figure 5.
SEM (scanning electron microscope) results for soil Matrix 1 and Matrix 2 used for the preparation of bimsoil sample. (a) SEM result for matrix 1; (b) SEM result for matrix 2.
Figure 5.
SEM (scanning electron microscope) results for soil Matrix 1 and Matrix 2 used for the preparation of bimsoil sample. (a) SEM result for matrix 1; (b) SEM result for matrix 2.
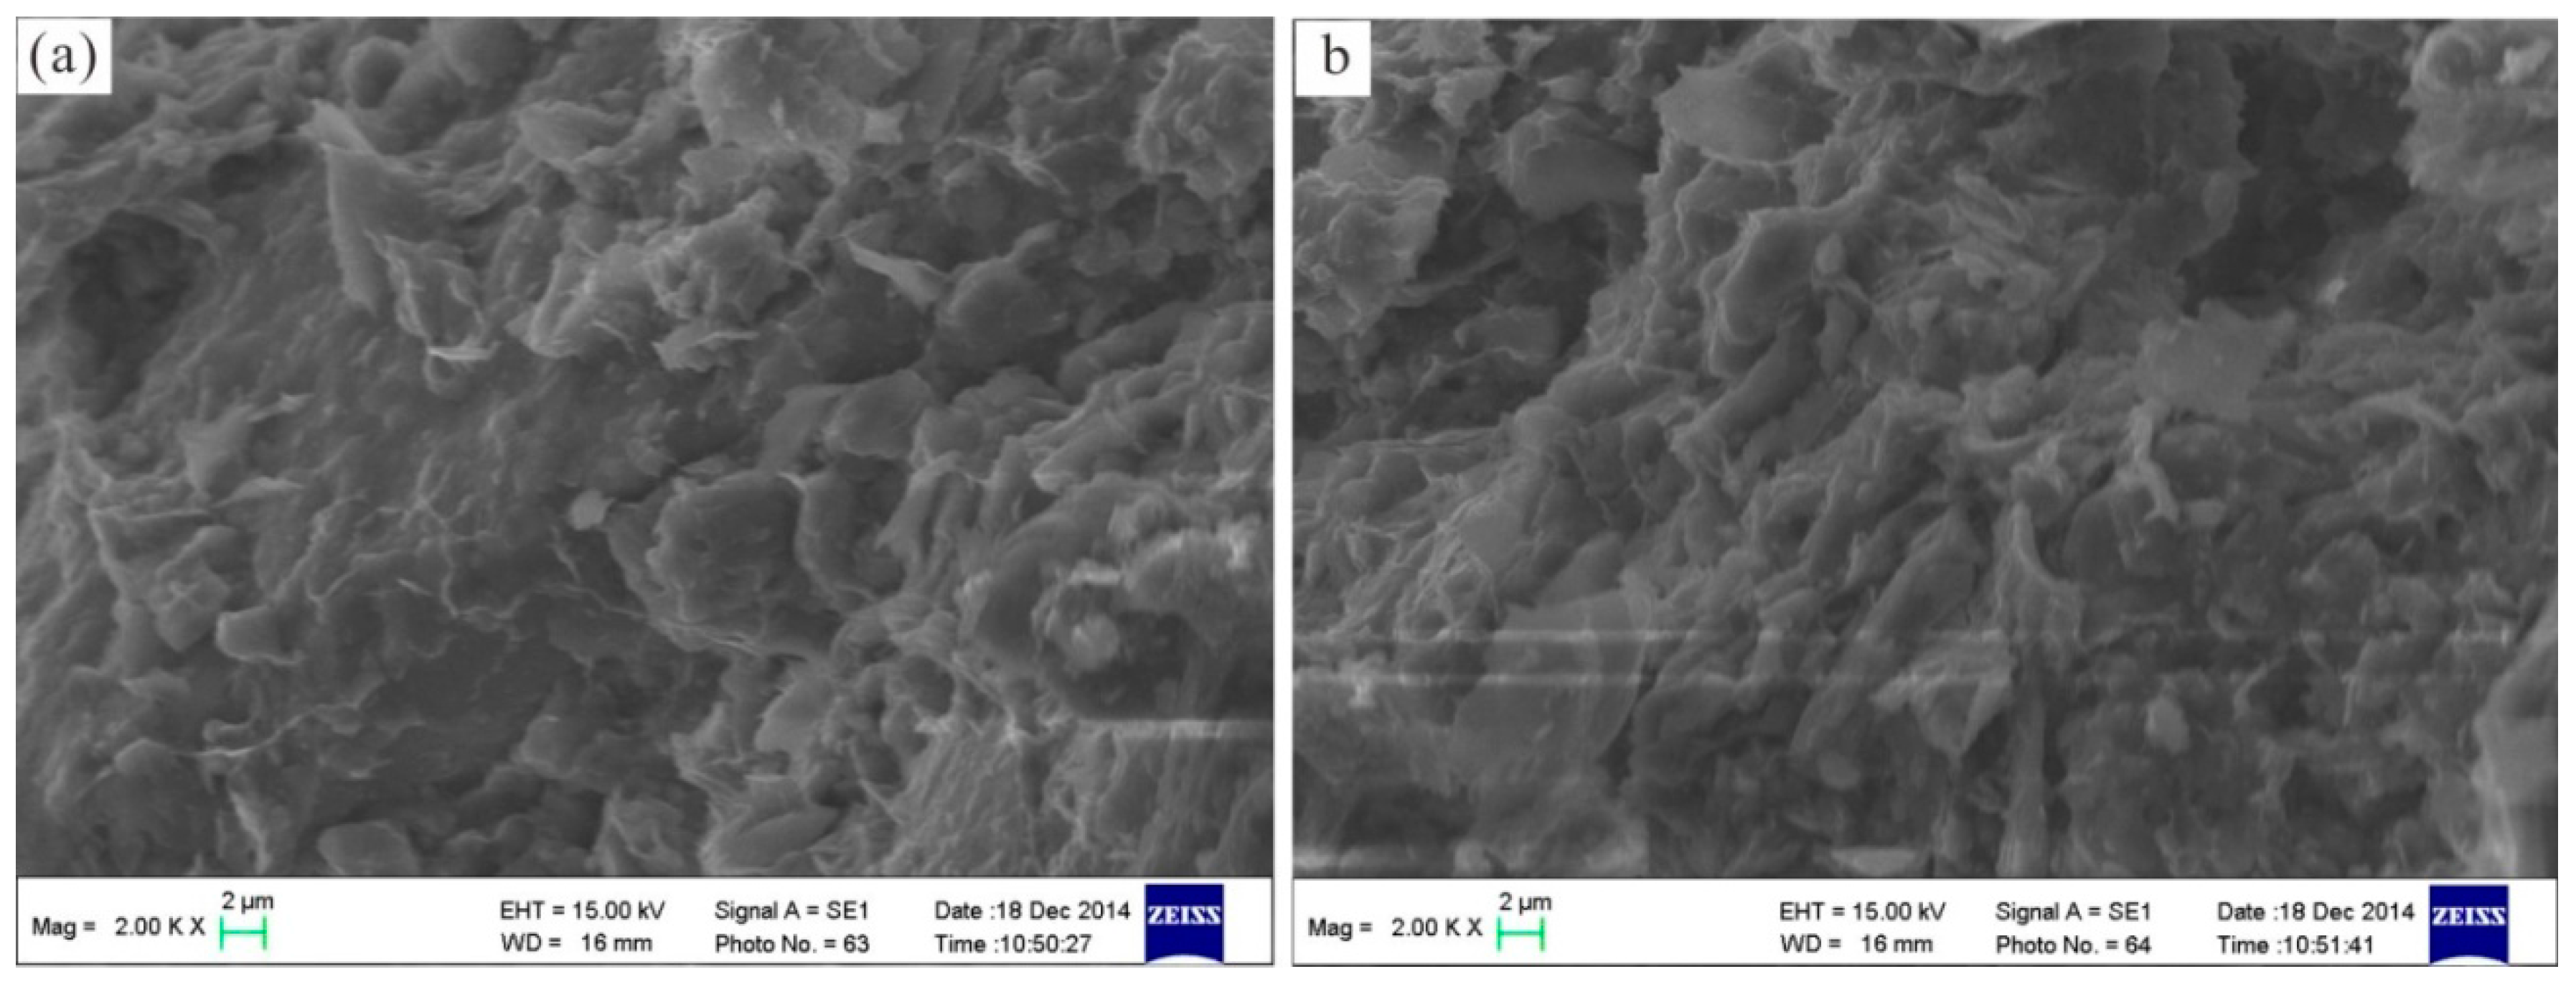
Figure 6.
The methods to keep the same soil density in bimsoil samples: (a) relationship between the density of soil matrix and hammer count, for samples with RBP of 30–60%, and 100 g soil matrix; and (b) determination of the optimal hammer count for bimsoil sample.
Figure 6.
The methods to keep the same soil density in bimsoil samples: (a) relationship between the density of soil matrix and hammer count, for samples with RBP of 30–60%, and 100 g soil matrix; and (b) determination of the optimal hammer count for bimsoil sample.

Figure 7.
Technical flowchart for study on the slenderness ratio flow tests for bimsoil samples.

Figure 8.
The relationship between hydraulic gradient and seepage velocity for samples with height from 40 mm to 200 mm: (a–d) the RBP is 30%, 40%, 50%, and 60%, respectively.
Figure 8.
The relationship between hydraulic gradient and seepage velocity for samples with height from 40 mm to 200 mm: (a–d) the RBP is 30%, 40%, 50%, and 60%, respectively.
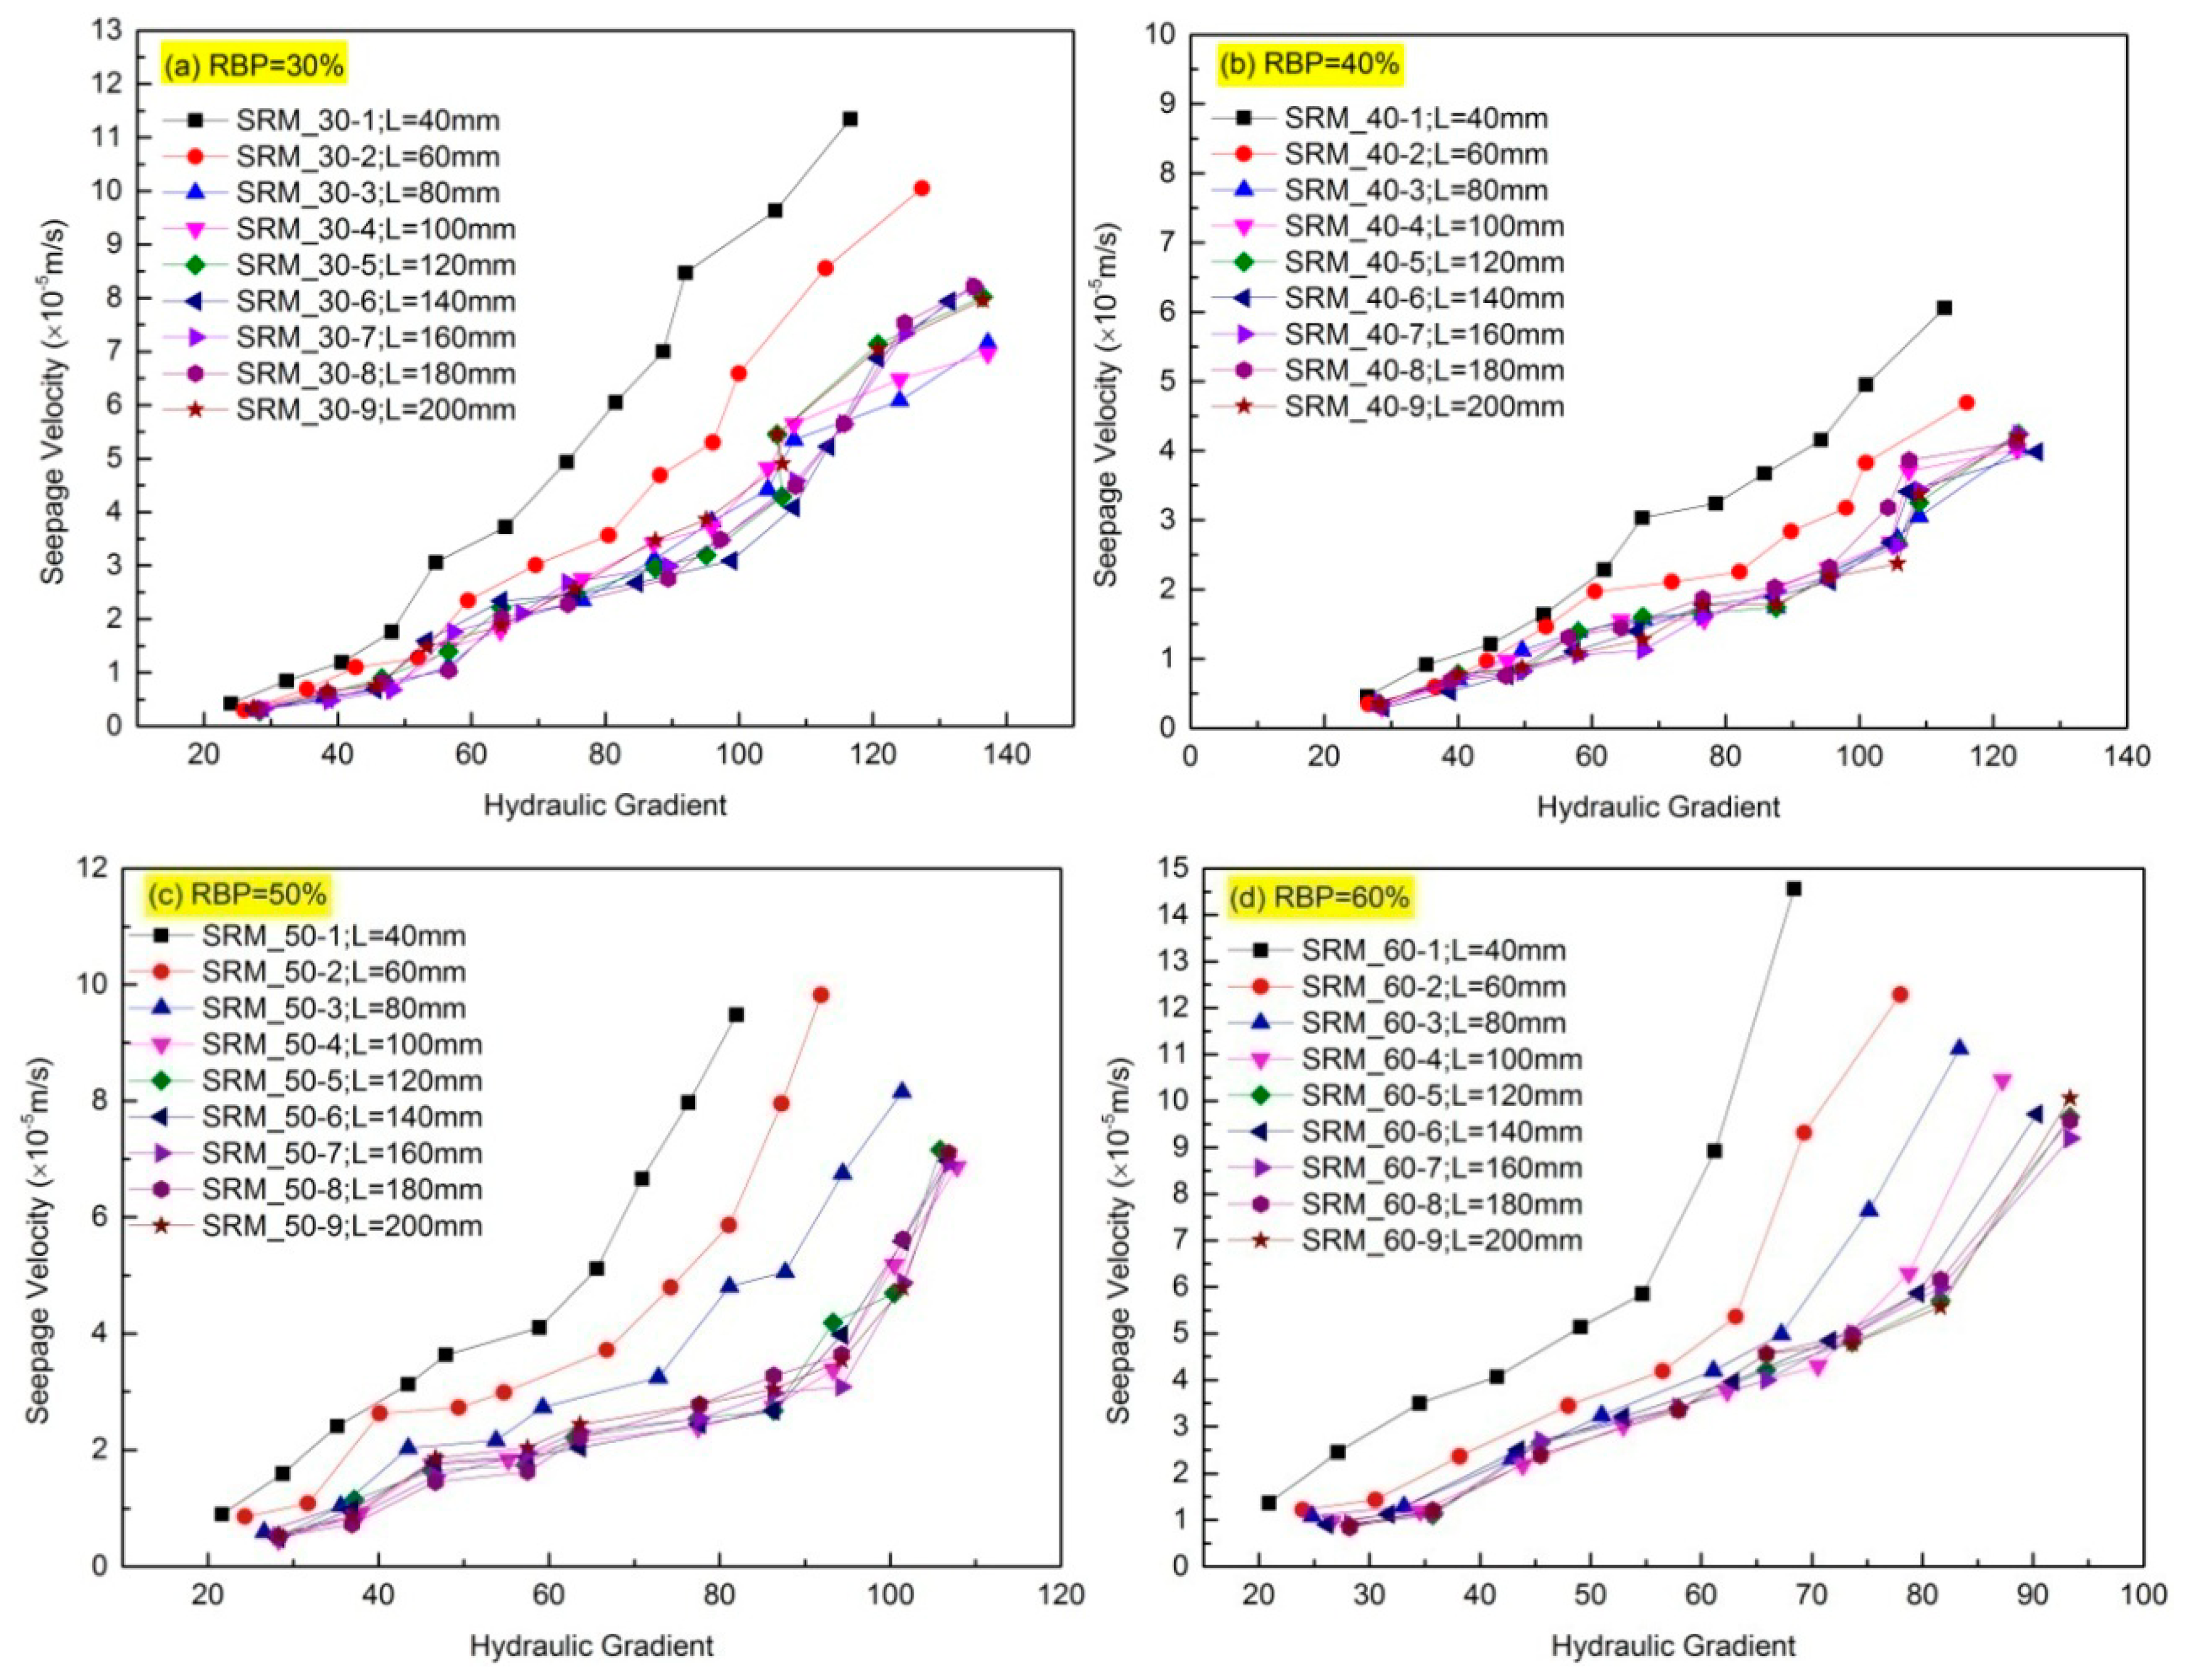
Figure 9.
The curves of negative hydraulic gradient and seepage velocity for samples with height from 40 m to 200 mm: (a–d) the RBP is 30%, 40%, 50%, and 60%, respectively.
Figure 9.
The curves of negative hydraulic gradient and seepage velocity for samples with height from 40 m to 200 mm: (a–d) the RBP is 30%, 40%, 50%, and 60%, respectively.

Figure 10.
The plots of permeability coefficient against sample height for typical bimsoil samples:(a–d) the RBP is 30%, 40%, 50%, and 60%, respectively.
Figure 10.
The plots of permeability coefficient against sample height for typical bimsoil samples:(a–d) the RBP is 30%, 40%, 50%, and 60%, respectively.

Figure 11.
The relationship between critical sample height and RBP.
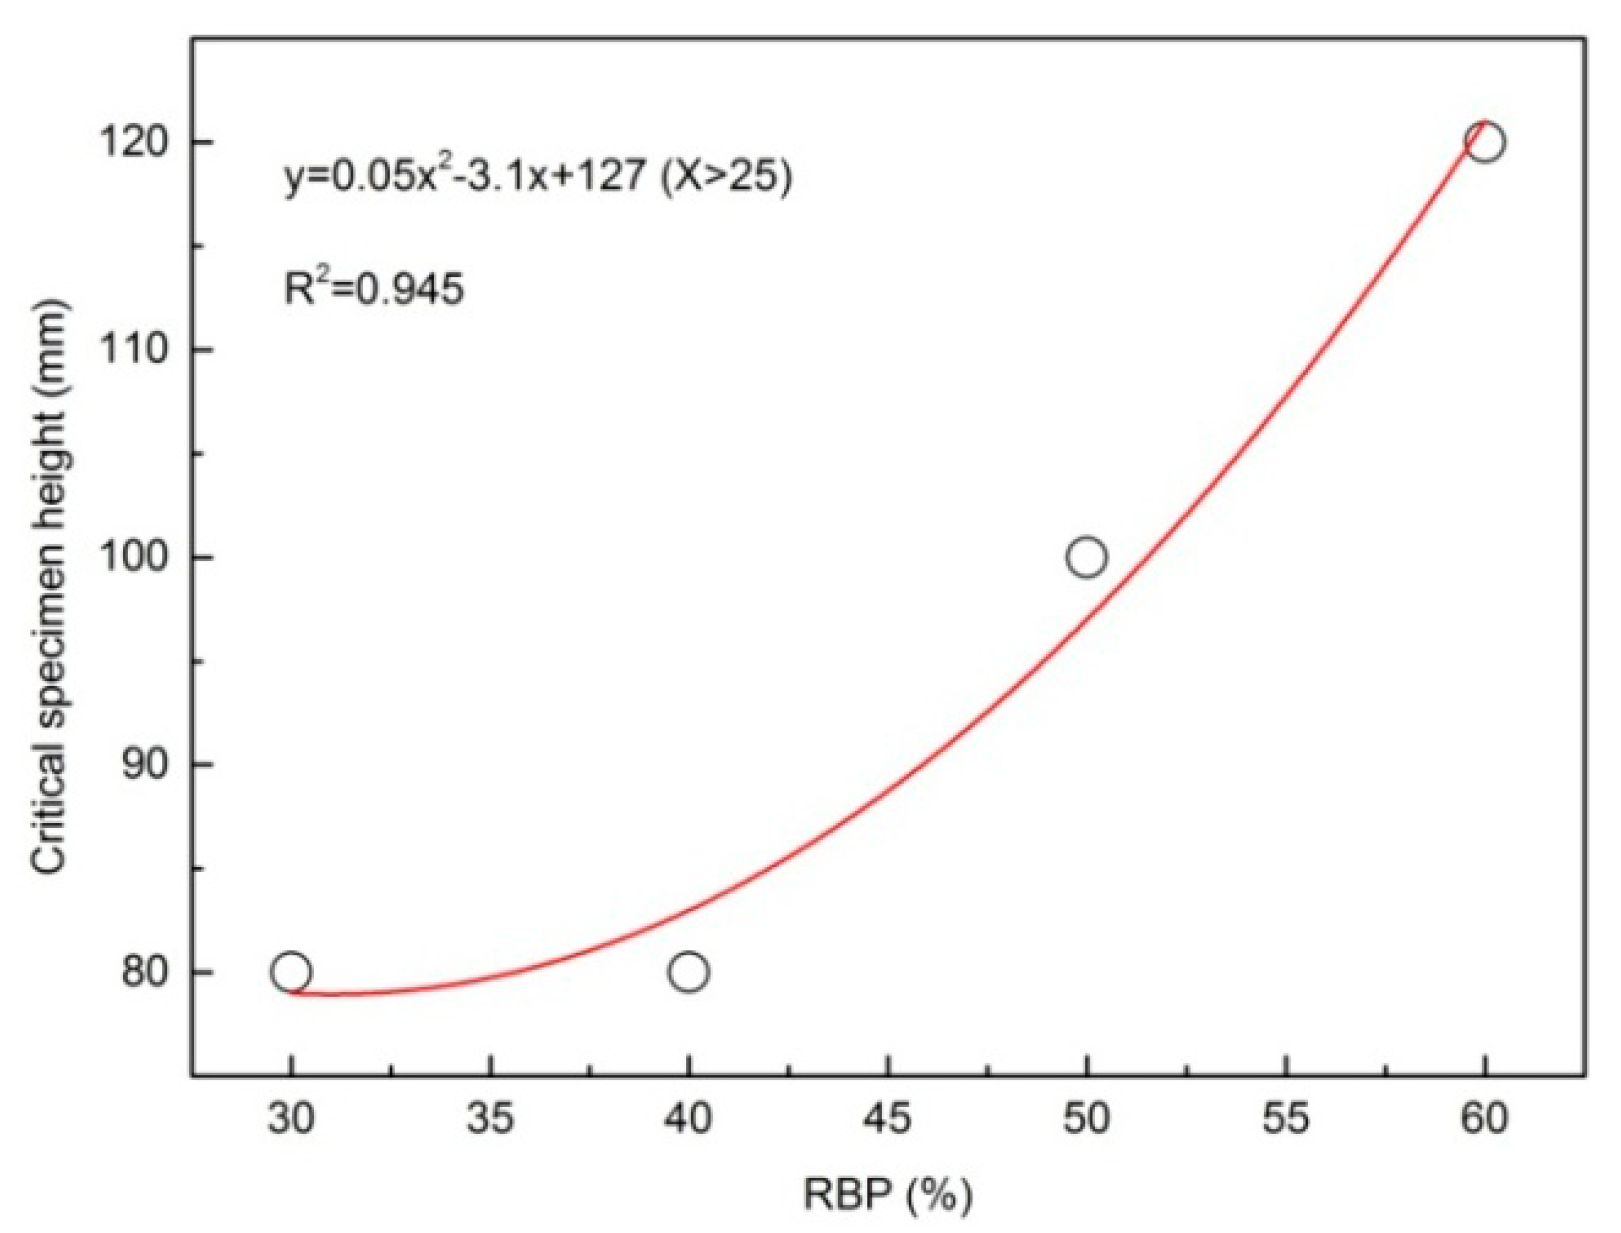
Figure 12.
Evolution diagram of the permeability for samples with different slenderness ratio (H/D).
Figure 12.
Evolution diagram of the permeability for samples with different slenderness ratio (H/D).
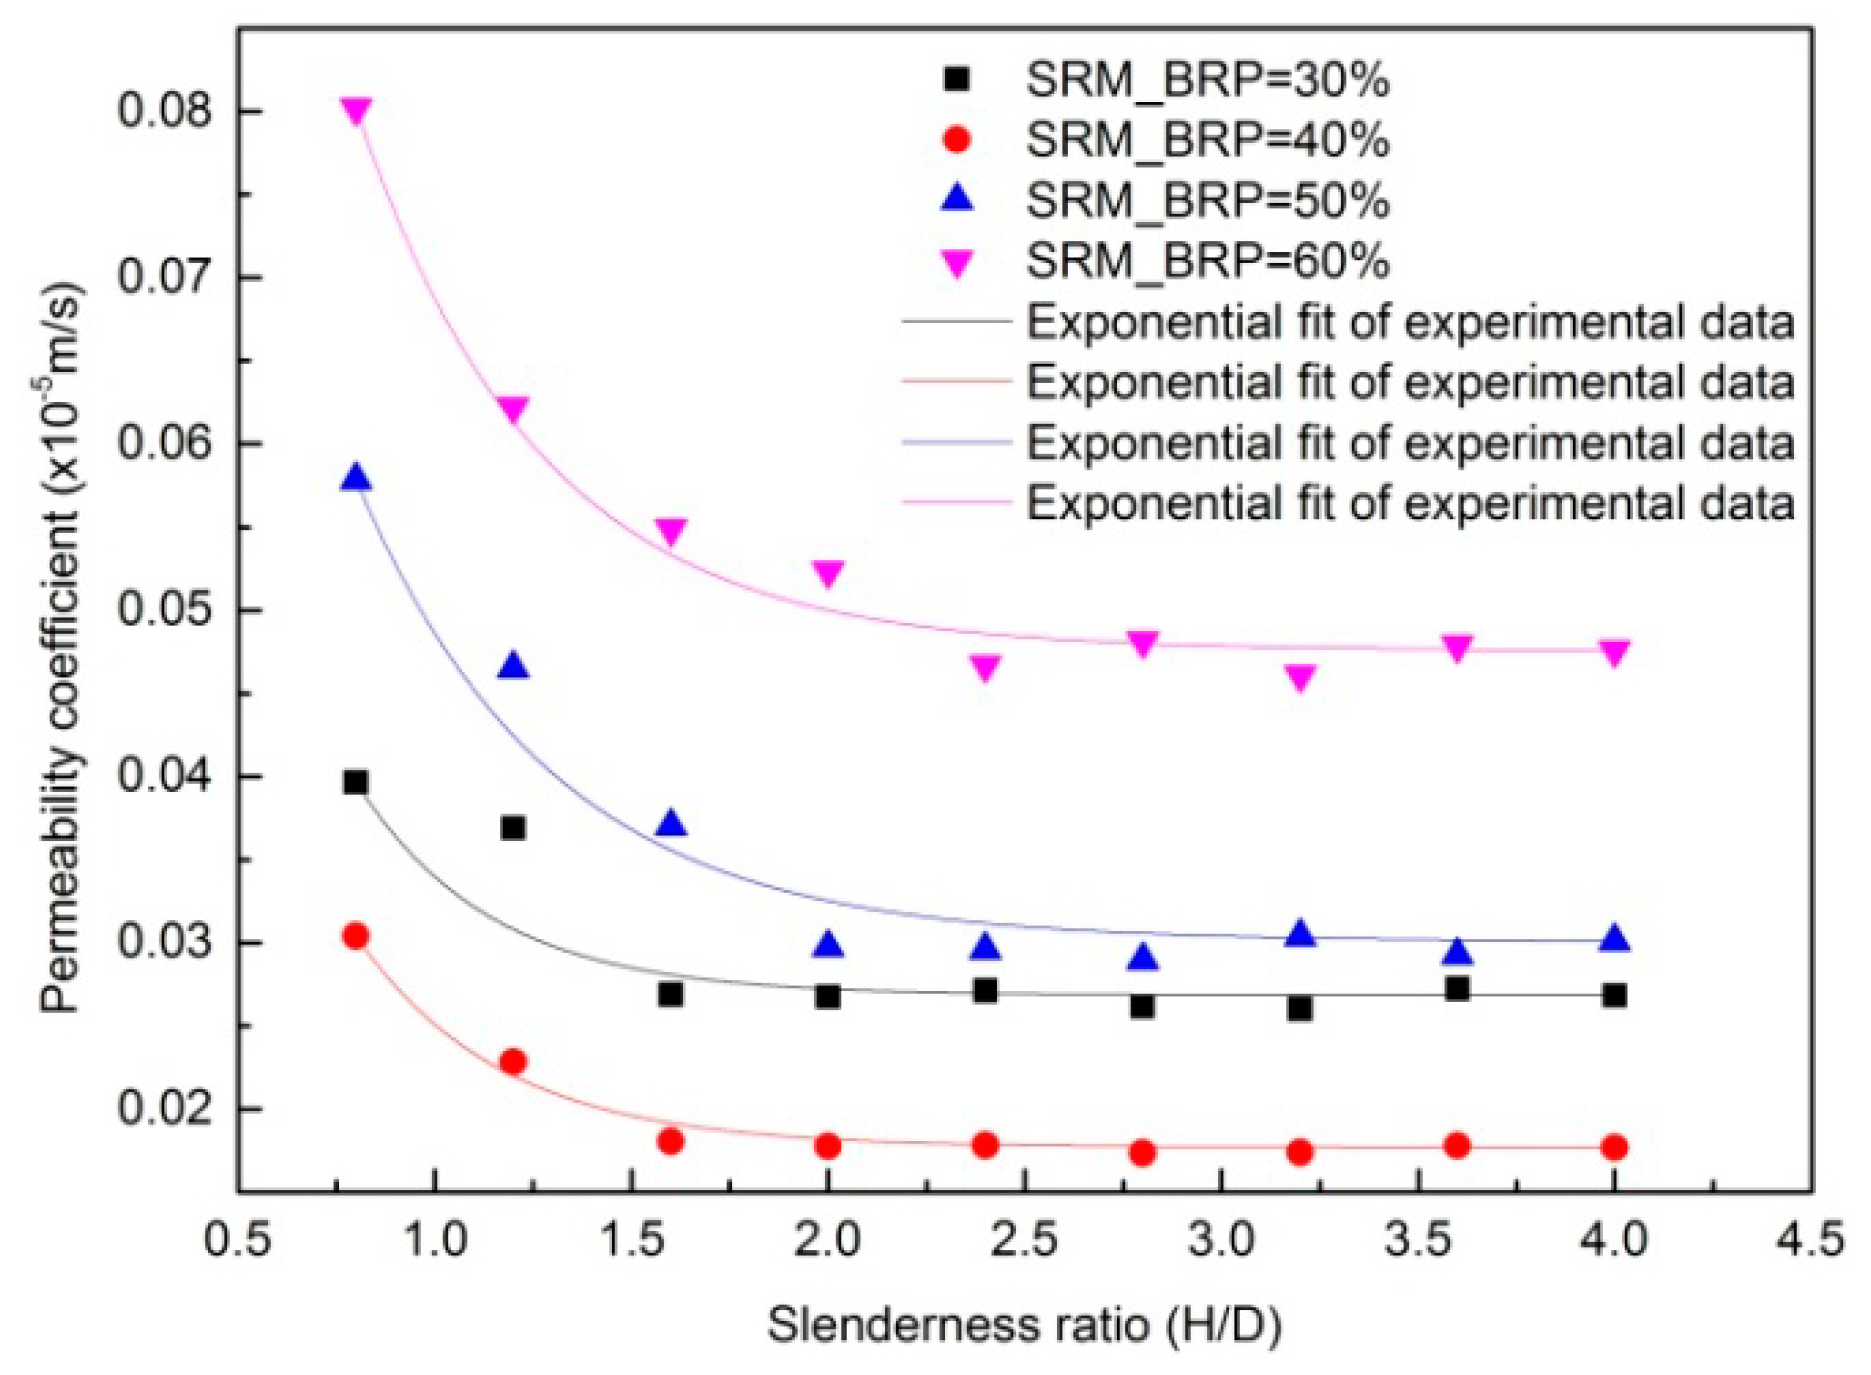
Figure 13.
The plots of non-Darcy flow factor versus sample height against height for samples with RBPof30%, 40%, 50%, and 60%, respectively.
Figure 13.
The plots of non-Darcy flow factor versus sample height against height for samples with RBPof30%, 40%, 50%, and 60%, respectively.


Table 1.
Basic physical and mechanical properties of the used soil matrix and rock blocks for bimsoil samples.
Table 1.
Basic physical and mechanical properties of the used soil matrix and rock blocks for bimsoil samples.
| Index | Soil Matrix | Rock Block |
|---|---|---|
| Bulk density (g/cm3) | 1.64 | 2.53 |
| Dryweight density (g/cm3) | 2.06 | / |
| Optimum water content (%) | 9.5 | / |
| Specific gravity (GS) | 2.73 | / |
| Effective particle size, D10 (mm) | 0.01 | / |
| Coefficient of uniformity, Cu | 4.2 | / |
| Coefficient of curvature, Cc | 1.32 | / |
| Liquid limit (%) | 64 | / |
| plastic limit (%) | 36 | / |
| plasticity index | 28 | / |
| liquidity index | 0.121 | / |
| Wet compressive strength (MPa) | 0.57 | 43.21 |
| Dry compressive strength (MPa) | 2.27 | 80.75 |
Note: for soil matrix, the wet state corresponds to natural state, and, for rock block, the wet state corresponds to saturation state.
Table 2.
Mineralogical composition of soil sample obtained from XRD (X-ray diffraction).
| Mineral | Soil Matrix 1 | Soil Matrix 2 |
|---|---|---|
| Montmorillonite | 61.52 | 63.28 |
| Kaolinite | 26.73 | 24.66 |
| Illite | 6.25 | 6.58 |
| chlorite | 5.5 | 5.48 |
Table 3.
The non-Darcy’s flow equations for typical specimens with rock block percentage of 30%, using Forchheimer equation.
Table 3.
The non-Darcy’s flow equations for typical specimens with rock block percentage of 30%, using Forchheimer equation.
| Specimen No. | −J = −aV + bV2 (Equation (4)) | K (×10−5 m/s) | R2 | |
|---|---|---|---|---|
| a | b | |||
| Bimsoil_30-1(H = 40 mm) | 25.4676 | 57.28886 | 0.03966 | 0.975 |
| Bimsoil_30-1(H = 60 mm) | 27.3673 | 46.06427 | 0.03691 | 0.977 |
| Bimsoil_30-1(H = 80 mm) | 37.5564 | 36.6585 | 0.02689 | 0.990 |
| Bimsoil_30-1(H = 100 mm) | 37.7689 | 25.86399 | 0.02674 | 0.977 |
| Bimsoil_30-1(H = 120 mm) | 37.2458 | 25.04659 | 0.02712 | 0.980 |
| Bimsoil_30-1(H = 140 mm) | 38.612 | 26.41917 | 0.02616 | 0.981 |
| Bimsoil_30-1(H = 160 mm) | 38.827 | 27.59595 | 0.02601 | 0.979 |
| Bimsoil_30-1(H = 180 mm) | 37.0617 | 27.39719 | 0.02725 | 0.980 |
| Bimsoil_30-1(H = 200 mm) | 37.6457 | 26.13581 | 0.02683 | 0.976 |
Table 4.
The non-Darcy’s flow equations for typical specimens with rock block percentage of 40%, using Forchheimer equation.
Table 4.
The non-Darcy’s flow equations for typical specimens with rock block percentage of 40%, using Forchheimer equation.
| Specimen No. | −J = −aV + bV2 (Equation (4)) | K (×10−5 m/s) | R2 | |
|---|---|---|---|---|
| a | b | |||
| Bimsoil_40-1(H = 40 mm) | 33.21934 | 79.41739 | 0.0304 | 0.991 |
| Bimsoil_40-1(H = 60 mm) | 44.2489 | 54.85734 | 0.02283 | 0.957 |
| Bimsoil_40-1(H = 80 mm) | 55.9207 | 46.08953 | 0.01806 | 0.978 |
| Bimsoil_40-1(H = 100 mm) | 56.86151 | 38.04205 | 0.01776 | 0.986 |
| Bimsoil_40-1(H = 120 mm) | 56.6892 | 29.67069 | 0.01782 | 0.976 |
| Bimsoil_40-1(H = 140 mm) | 58.2059 | 30.95381 | 0.01735 | 0.990 |
| Bimsoil_40-1(H = 160 mm) | 58.0889 | 30.68529 | 0.01739 | 0.989 |
| Bimsoil_40-1(H = 180 mm) | 56.72037 | 30.81588 | 0.01781 | 0.957 |
| Bimsoil_40-1(H = 200 mm) | 57.1004 | 28.84796 | 0.01769 | 0.977 |
Table 5.
The non-Darcy’s flow equations for typical specimens with rock block percentage of 50%, using Forchheimer equation.
Table 5.
The non-Darcy’s flow equations for typical specimens with rock block percentage of 50%, using Forchheimer equation.
| Specimen No. | −J = −aV + bV2 (Equation (4)) | K (×10−5 m/s) | R2 | |
|---|---|---|---|---|
| a | b | |||
| Bimsoil_50-1(H = 40 mm) | 17.45548 | 48.85914 | 0.05786 | 0.996 |
| Bimsoil_50-2(H = 60 mm) | 21.70822 | 36.53996 | 0.04653 | 0.992 |
| Bimsoil_50-3(H = 80 mm) | 27.27899 | 25.15432 | 0.03702 | 0.991 |
| Bimsoil_50-4(H = 100 mm) | 33.96639 | 27.1969 | 0.02974 | 0.991 |
| Bimsoil_50-5(H = 120 mm) | 34.12356 | 26.77677 | 0.0296 | 0.992 |
| Bimsoil_50-6(H = 140 mm) | 34.85317 | 26.23295 | 0.02898 | 0.990 |
| Bimsoil_50-7(H = 160 mm) | 33.23728 | 27.15362 | 0.03039 | 0.992 |
| Bimsoil_50-8(H = 180 mm) | 34.50031 | 26.9832 | 0.02928 | 0.992 |
| Bimsoil_50-9(H = 200 mm) | 33.54192 | 26.56346 | 0.03011 | 0.993 |
Table 6.
The non-Darcy’s flow equations for typical specimens with rock block percentage of 60%, using Forchheimer equation.
Table 6.
The non-Darcy’s flow equations for typical specimens with rock block percentage of 60%, using Forchheimer equation.
| Specimen No. | −J = −aV + bV2 (Equation (4)) | K (×10−5 m/s) | R2 | |
|---|---|---|---|---|
| a | b | |||
| Bimsoil_60-1(H = 40 mm) | 12.5917 | 30.10298 | 0.08021 | 0.997 |
| Bimsoil_60-2(H = 60 mm) | 16.2290 | 22.59943 | 0.06223 | 0.993 |
| Bimsoil_60-3(H = 80 mm) | 18.3969 | 17.88247 | 0.0549 | 0.988 |
| Bimsoil_60-4(H = 100 mm) | 19.2867 | 17.64004 | 0.05237 | 0.990 |
| Bimsoil_60-5(H = 120 mm) | 21.6305 | 17.5256 | 0.04669 | 0.987 |
| Bimsoil_60-6(H = 140 mm) | 20.9707 | 17.21499 | 0.04816 | 0.989 |
| Bimsoil_60-7(H = 160 mm) | 21.9001 | 16.46893 | 0.04612 | 0.988 |
Table 7.
Fitting regression functions of permeability coefficient with slenderness ratios (H/D). The R2 is the correlation coefficient.
Table 7.
Fitting regression functions of permeability coefficient with slenderness ratios (H/D). The R2 is the correlation coefficient.
| RBP (%) | Regression Function of Permeability Coefficient (k × 10−5) | R2 |
|---|---|---|
| 30 | K = 0.02683 + 0.13314e−2.92448(H/D) | 0.8455 |
| 40 | K = 0.01769 + 0.11061e−2.70369(H/D) | 0.9831 |
| 50 | K = 0.03007 + 0.14022e−2.02304(H/D) | 0.9663 |
| 60 | K = 0.04756 + 0.18436e−2.16395(H/D) | 0.9862 |
© 2017 by the authors. Licensee MDPI, Basel, Switzerland. This article is an open access article distributed under the terms and conditions of the Creative Commons Attribution (CC BY) license (http://creativecommons.org/licenses/by/4.0/).
Share and Cite
MDPI and ACS Style
Wang, Y.; Li, C.; Wei, X.; Hou, Z. Laboratory Investigation of the Effect of Slenderness Effect on the Non-Darcy Groundwater Flow Characteristics in Bimsoils. Water 2017, 9, 676. https://doi.org/10.3390/w9090676
AMA Style
Wang Y, Li C, Wei X, Hou Z. Laboratory Investigation of the Effect of Slenderness Effect on the Non-Darcy Groundwater Flow Characteristics in Bimsoils. Water. 2017; 9(9):676. https://doi.org/10.3390/w9090676
Chicago/Turabian StyleWang, Yu, Changhong Li, Xiaoming Wei, and Zhiqiang Hou. 2017. "Laboratory Investigation of the Effect of Slenderness Effect on the Non-Darcy Groundwater Flow Characteristics in Bimsoils" Water 9, no. 9: 676. https://doi.org/10.3390/w9090676
Note that from the first issue of 2016, this journal uses article numbers instead of page numbers. See further details here.