Implication of Directly Connected Impervious Areas to the Mitigation of Peak Flows in Urban Catchments


1
Department of Civil Engineering, Yeungnam University, Gyeongsan 38541, Korea
2
Korea Institute of Civil Engineering and Building Technology, 283 Goyangdae-ro, Goyang 10223, Korea
*
Author to whom correspondence should be addressed.
Water 2017, 9(9), 696; https://doi.org/10.3390/w9090696
Submission received: 18 July 2017
/
Revised: 23 August 2017
/
Accepted: 1 September 2017
/
Published: 12 September 2017
Abstract
:The existence of impervious areas is one of the most distinguishing characteristics of urban catchments. They decrease infiltration and increase direct runoff in urban catchments. The recent introduction of green infrastructure in urban catchments for the purpose of sustainable development has contributed to the decrease in directly connected impervious areas (DCIA) by isolating existing impervious areas, and consequently, has also contributed to flood risk mitigation. This study coupled the width function-based instantaneous hydrograph (WFIUH), which is able to handle the spatial distribution of the impervious areas, with the concept of the DCIA to assess the impact of decreasing DCIA on the shape of direct runoff hydrographs. Using several scenarios for typical green infrastructure and the corresponding changes of DCIA for a test catchment in Seoul, South Korea, this study evaluated the effect of green infrastructure on the shape of the resulting direct runoff hydrographs and reducing peak flows. The results showed that the changes in the DCIA immediately affect the shape of the direct runoff hydrograph, and decrease peak flows by up to 12% depending on spatial implementation scenarios in the test catchment. This study demonstrates the importance of the DCIA concept for the evaluation of green infrastructures in urban catchments, enabling quantitative assessment of the spatial distribution of impervious areas, and also changes to the DCIA by various types of green infrastructure. The results of this study also suggest that more effective and well-planned green infrastructures could be introduced in urban environments for the purpose of flood risk management.
1. Introduction
Broadly, the surface of an urban catchment can be divided into three distinct areas: impervious areas that are directly connected to the drainage system, such as roads, parking lots and, in some cases, roofs; additional impervious areas that are not directly connected; and pervious or semi-pervious areas consisting of lawns, gardens, and park lands [1]. The existence of impervious cover is one of the most distinguishing characteristics of urban catchments compared to natural ones, affecting both the quantity and quality of runoff [2]. Therefore, impervious cover is an important factor in the hydro-environmental analysis of urbanization impacts [3,4,5]. Understanding the contribution to runoff hydrographs from pervious and impervious surfaces is crucial for the hydraulic design of stormwater systems, as well as for modelling non-point source pollution [1]. In a general sense, urbanization is accompanied by an increase in impervious cover and, consequently, increases in both surface runoff [6] and flood risks [7,8,9].
The concept of directly connected impervious areas (DCIA) refers to a subset of impervious cover that is directly connected to a drainage system or a water body via continuous impervious surfaces [10]. The concept of DCIA is important, in that it is regarded as a better predictor of stream ecosystem health than the total impervious area (TIA) [2]. Researchers have found that the concept of DCIA improved the accuracy of runoff predictions [11], and also yielded more accurate results for water quality analysis [12]. In addition, DCIA is considered to be responsible for the majority of stream alterations due to urbanization [13,14,15].
DCIA is a key concept in better assessing green infrastructure, which has been receiving more attention recently. The term green infrastructure has been used in different ways in different contexts, but it basically refers to a natural process that is actively adopted to urban environments. The United States Environmental Protection Agency (USEPA) describes it as a cost-effective, resilient approach to manage wet weather impact that provides many community benefits [16]. The elements of green infrastructure include practices, methodologies, and systems that use or mimic natural processes, such as infiltration, evapotranspiration, retention or detention, and so forth. The adoption of green infrastructure in urban catchments for the purpose of sustainable development considerably contributes to the isolation or mitigation of the impact from existing impervious areas and, consequently, a decrease in the DCIA [15,17,18,19,20]. For example, surrounding a parking lot with vegetated swales isolates the impervious areas, which were previously connected directly to the main drainage system or a water body. Therefore, the concept of DCIA is crucial in terms of the evaluation of green infrastructure both in water quantity and quality.
For this reason, it is very important to accurately distinguish the DCIA from the total impervious area (TIA). The measurement of impervious areas in an urban catchment is challenging due to complex structures, materials, and different states of development in urban areas. It is even more complicated to identify DCIA, because it requires consideration of surface and subsurface runoff processes, flow paths, and drainage structures and their connectivity. The empirical relationship between TIA and DCIA as a function of land use was the first choice for researchers to easily obtain the DCIA [21,22,23]. USEPA [24,25] also adopted Sutherland’s equations [23] to estimate DCIA based on land use types. However, land use categories are not often clearly distinguished, meaning that results can vary depending on the individual choices. Recently, a methodology based on a precise GIS database has been widely accepted among researchers to distinguish DCIA from TIA [12,26,27]. For example, Lee and Heaney [12] used polygon type coverage for every impervious surface and road boundaries from planimetric CAD drawings. They estimated DCIA with different levels of methodology for the analysis. Sahoo and Sreeja [27] determined DCIA by integrating remote sensing data, digitized drainage networks, and a DEM of the study area. The methodology determines DCIA based on a detailed impervious surface map compiled from various sources such as aerial photographs, satellite imagery and results from site surveys merged into a GIS database. The connectivity of impervious areas to a drainage system is a primary factor in identifying DCIA from TIA. Furthermore, it is able to consider surface flow directions to distinguish DCIA.
In spite of the active implementation of green infrastructure in urban environments for a sustainable and resilient society, the impact of green infrastructure on the direct runoff hydrographs is often not fully quantified. The aim of this study is to evaluate potential methodologies with the GIS database to identify and calculate the DCIA, and also to propose a methodology for assessing the impact of green infrastructure on the resulting direct runoff hydrographs of an urban catchment. This study couples the width function-based instantaneous hydrograph (WFIUH) [11], which handles the spatial distribution of the impervious areas, with the concept of the DCIA to assess the impact of decreasing DCIA on the shape of the hydrographs. Two types of green infrastructure (permeable pavement, redirection of rooftop runoff to infiltration areas) are introduced to different locations to show the importance of the spatial distribution of DCIA and, therefore, the strategic implementation of green infrastructure in an urban catchment.
2. Methodology
2.1. Study Area and Land Cover Data
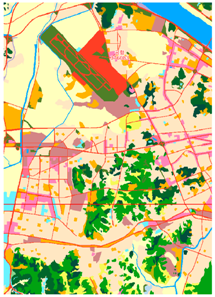
In this study, three subcatchments (6.50 km2 in total area) in the Shinweol Basin in Seoul, South Korea, were investigated as shown in Figure 1. The Shinweol Basin is a highly developed area with a mixture of residential and commercial areas. Drainage loads in the basin are mostly conveyed through underground networks of drainage structures, such as pipes and culverts that have replaced open channels and streams throughout the history of the city development. The Shinweol Basin, including the subcatchments in this study, suffered from heavy rainfall events in 2010 and 2011. The aftermath of the flood damage in 2010 and 2011 was severe. The Seoul Metropolitan Government implemented several structural projects, such as deep tunnels with diameters up to 10 m and depths of 50 m to keep and drain overflows. In addition, design criteria and design standards for urban drainage structures were re-evaluated and re-established. This study used a GIS database of the drainage network from the city government that includes pipes with diameters from 300 mm, and multiple box structures with single widths up to 4.5 m. Among 15 operational gauging stations in the Shinweol Basin, three gauges (Shinweol 1, Shinweol 3, and Hwagok 2) were used for validation and calibration purposes in this study. The flow data was collected and recorded every 10 min.
2.2. Land Cover Data and Estimation of DCIA
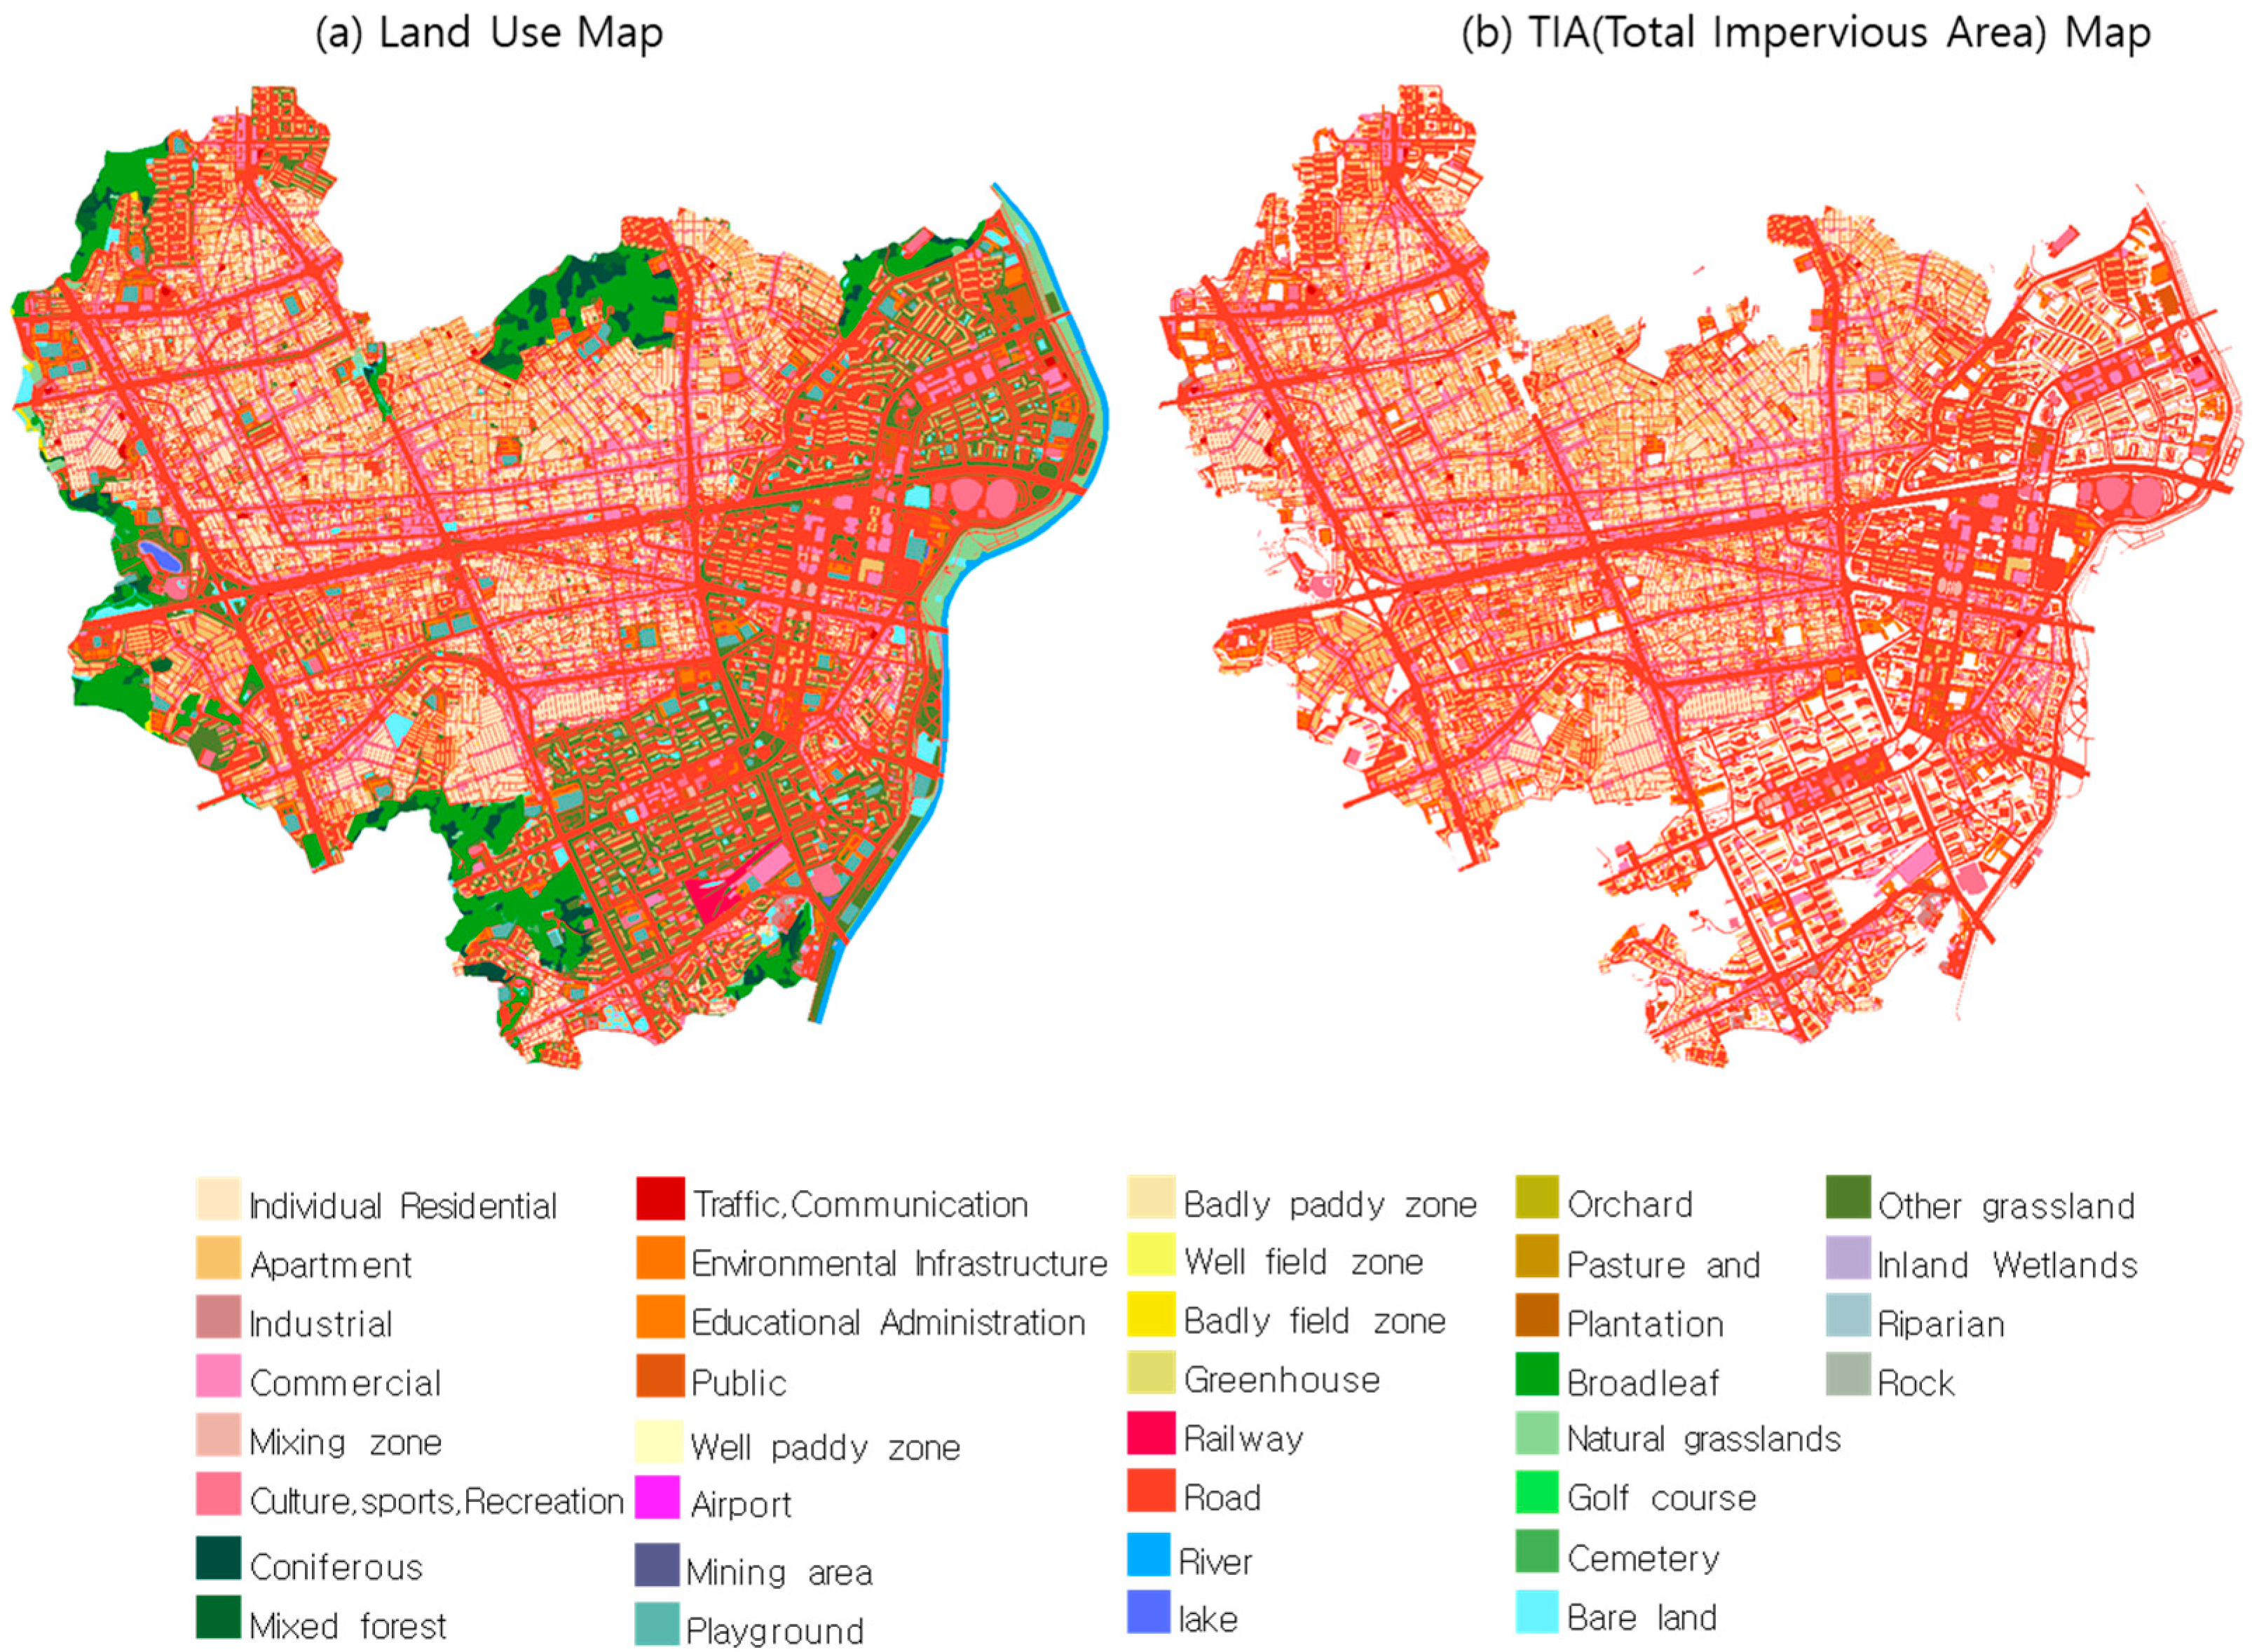
In order to estimate TIA and DCIA, this study used high-resolution land cover data developed by the Ministry of Environment between 2013 and 2014 in Korea. This was built from various sources from satellites and air-photographs, with a spatial resolution of 1 m. The data sets were divided into three levels: low-level, mid-level, and high-level land cover data. Table 1 shows each land cover level and its characteristics. High-level land cover data describes the land use, with 41 land use classifications to identify the impervious areas. Figure 2 shows the high-level land cover data for the entire Shinweol Basin, where impervious areas could be obtained from the data.
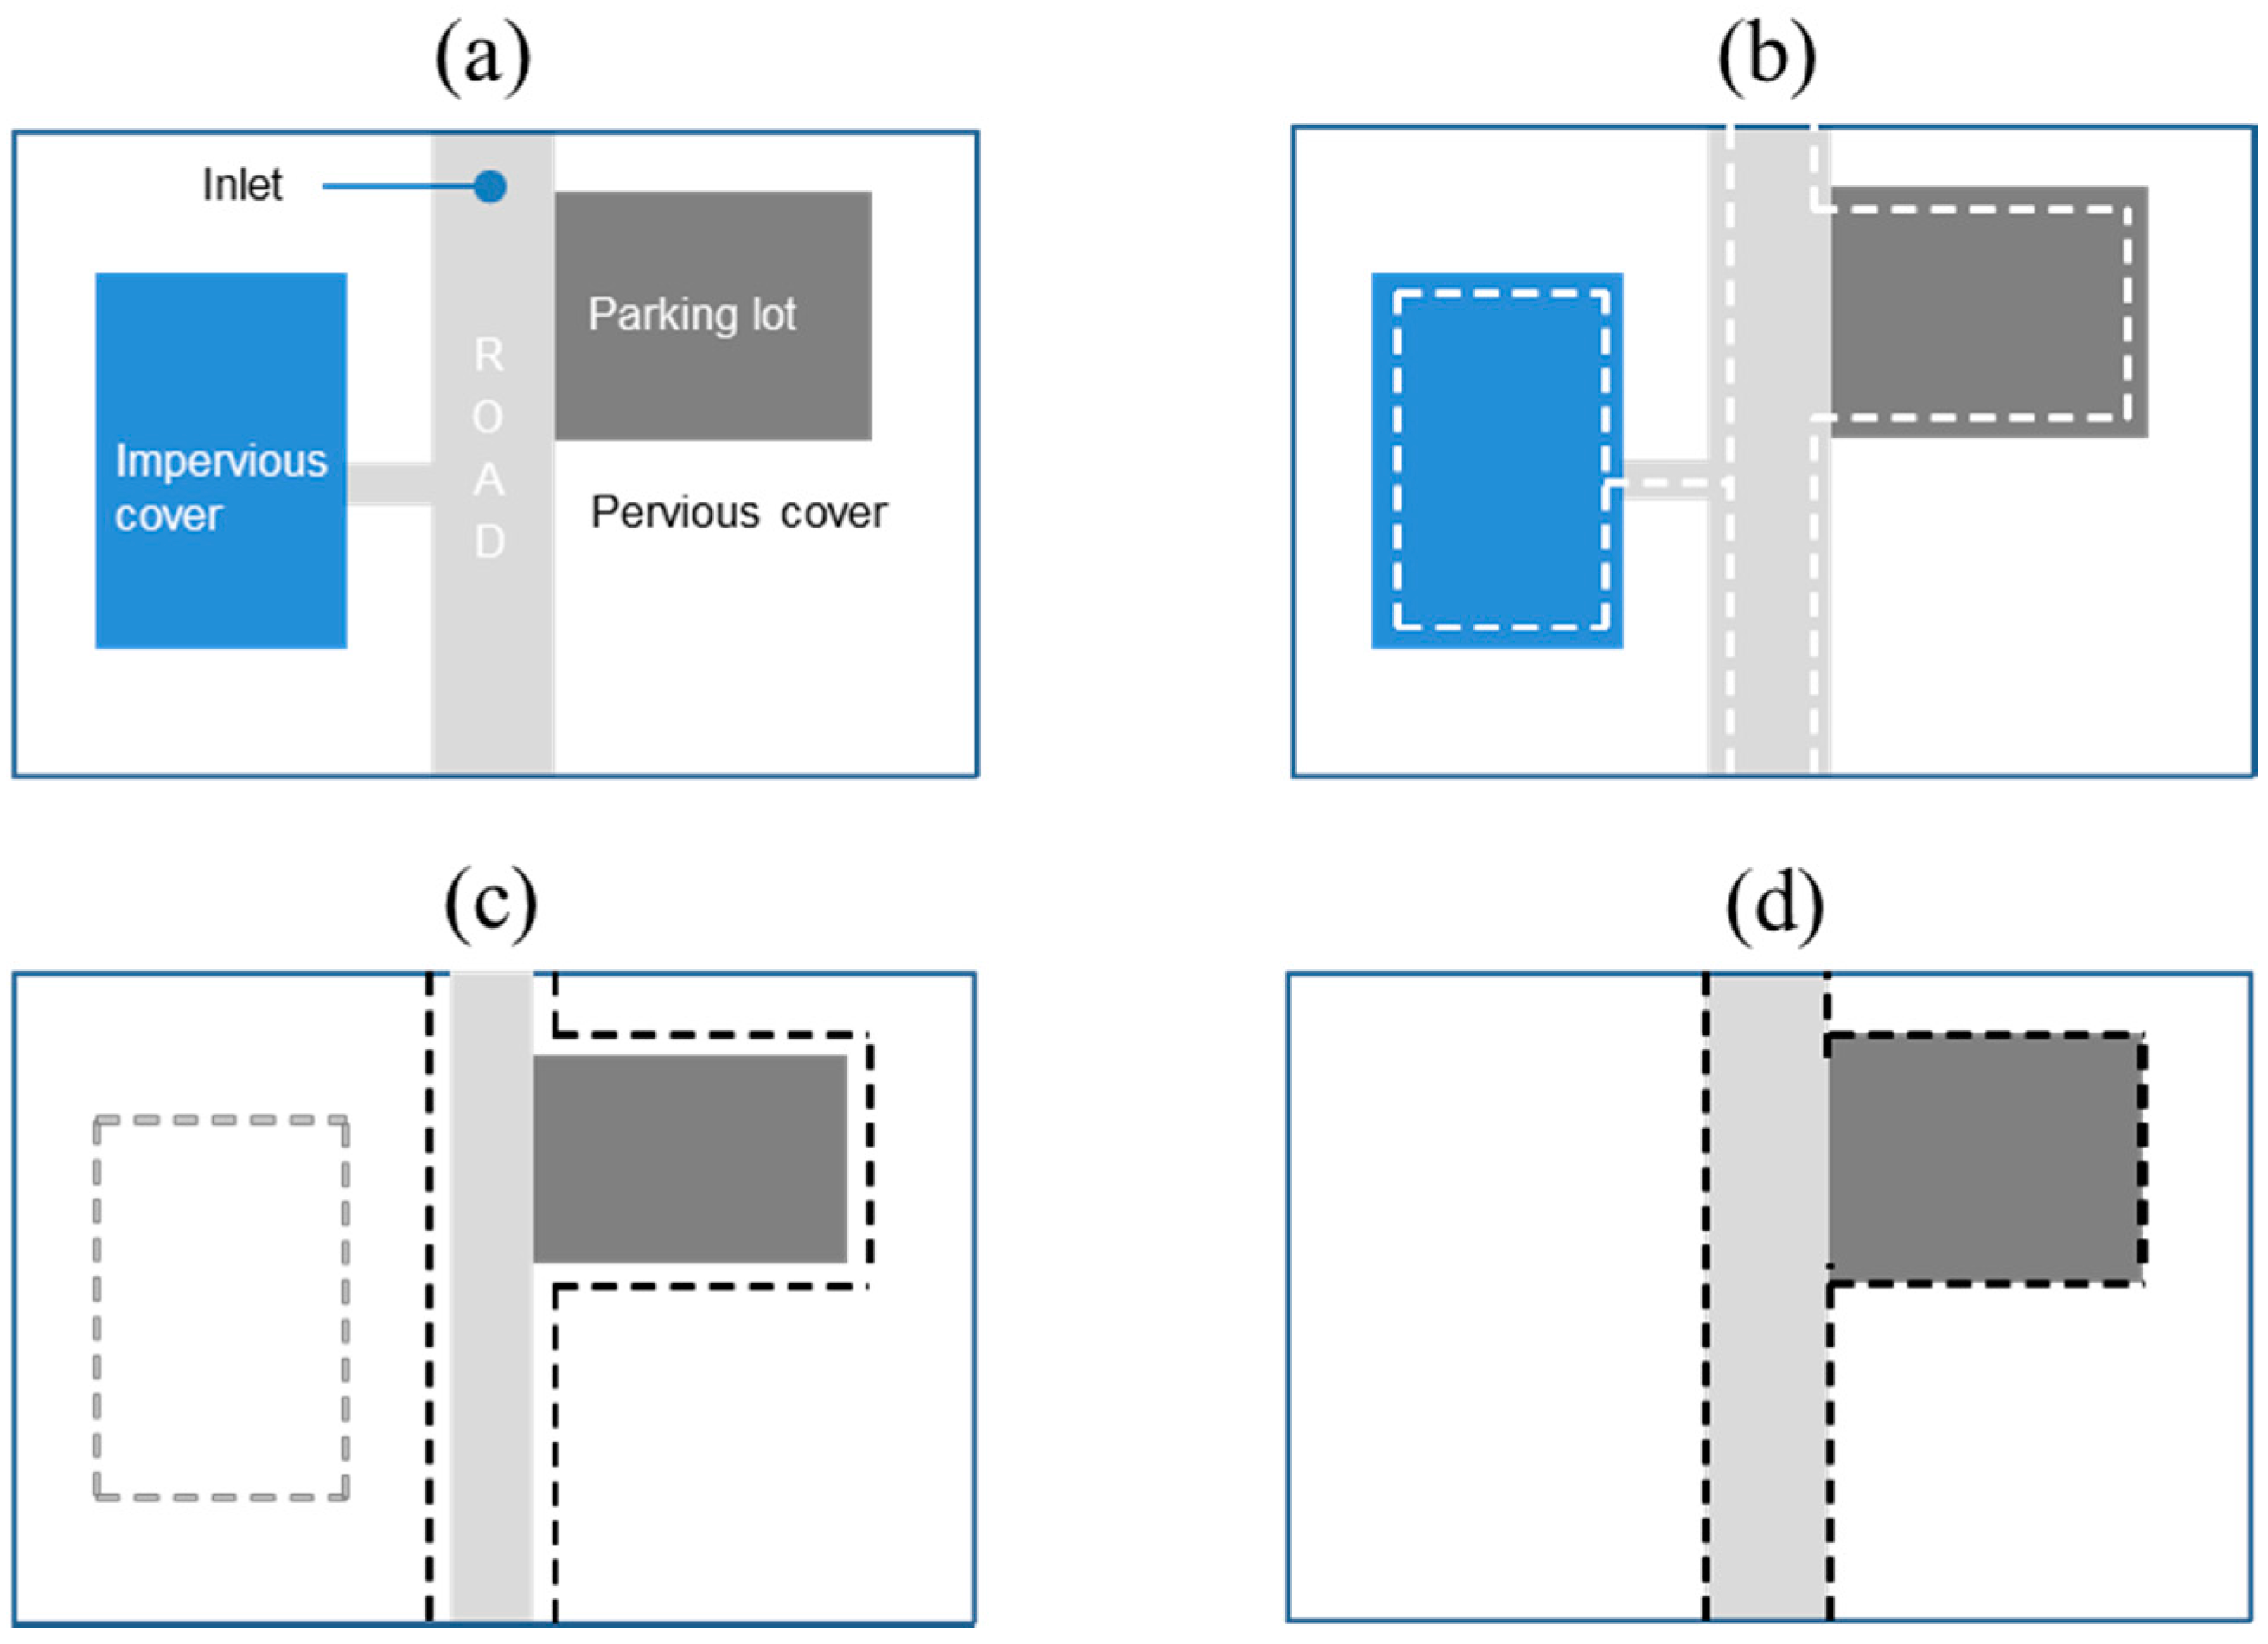
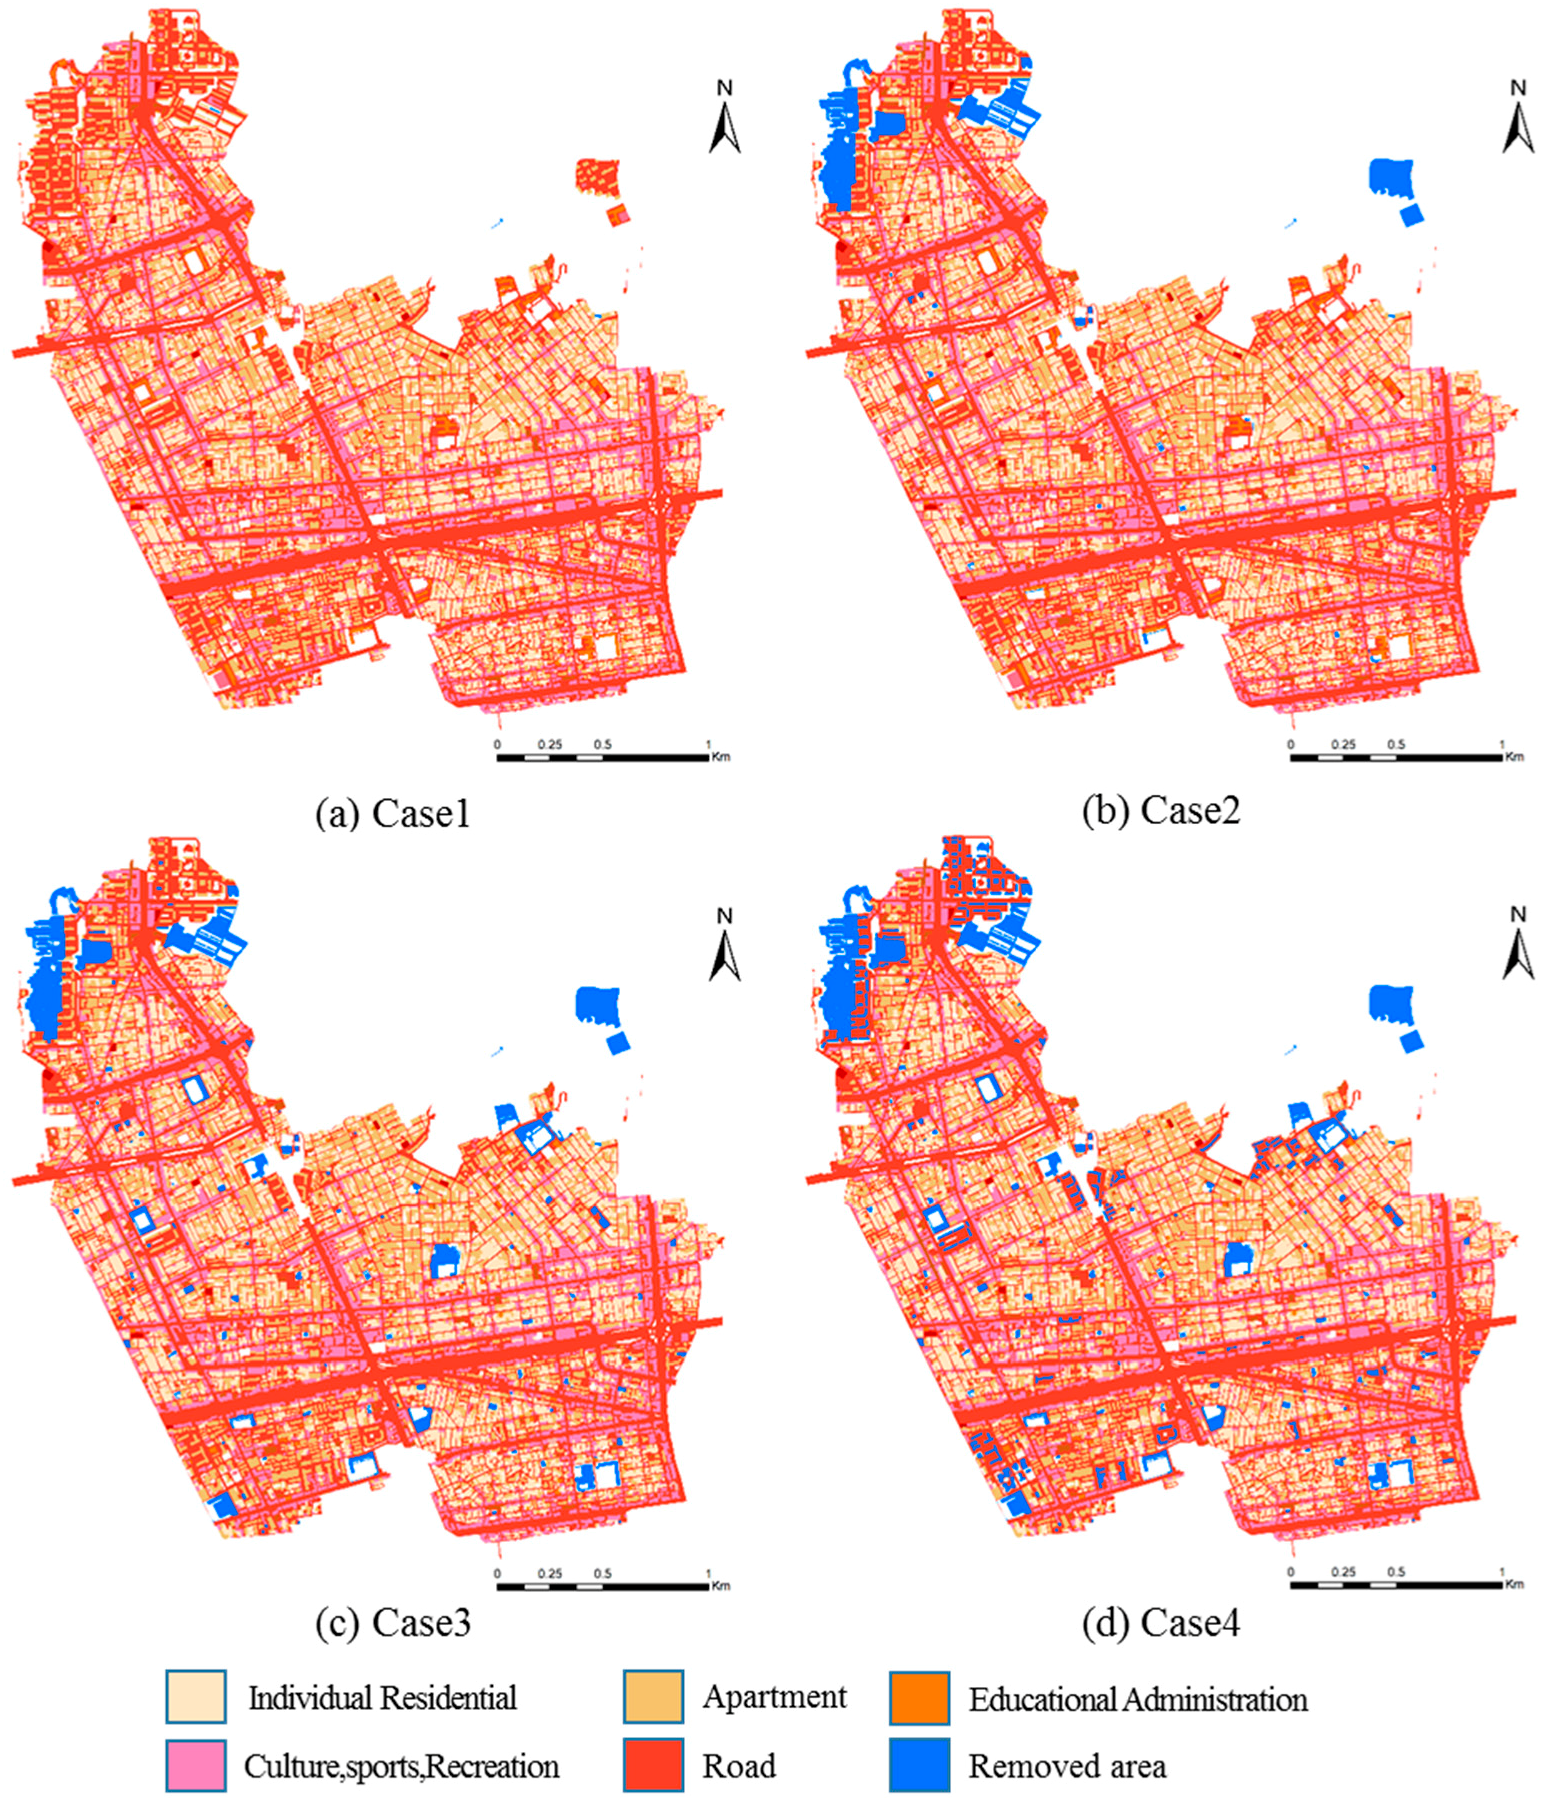
In this study, the DCIA was obtained in four steps. First, isolated impervious areas (IIA) surrounded by pervious cover and remote from the storm drainage network were removed (Case 1). A threshold value of 1 meter was used to determine the IIA. Second, additional isolated impervious areas were identified even in areas directly connected to a main drainage system by considering flow directions obtained from the digital elevation model (Case 2). Case 2 distinguishes impervious areas that are connected to the main body of impervious areas as shown in the land cover map, but which are not connected to the drainage network. If other adjacent DCIAs are to the downstream of these impervious areas considering flow direction, these impervious areas remain as DCIA, but are otherwise removed. The flow directions were obtained from the DEM. Third, the land cover for schools and gardens were removed as these typically include pervious areas not identified by the land use cover (Case 3). Finally, apartments were removed, as they commonly include pervious pavement, raingardens, playgrounds, and green alleys (Case 4). Schools, gardens, and large apartment complexes were not deemed to be totally disconnected, in view of the detailed land cover, but regional characteristics were reflected in these facilities and buildings, which typically include elements of green infrastructure, such as pervious pavement, raingarden, green corridors, and alleys. However, classifying all apartments as DCIA should be done cautiously, because classification is highly dependent on regional characteristics, and further study on this is required. During the process of identifying DCIA, satellite imagery and drainage networks were also overlaid on the land user cover and taken into account for identification purposes. Figure 3 shows the basic procedure for determining DCIA using the threshold value. Figure 3a shows an impervious area connected to a road with a narrow path, the width of which is less than or equal to 1 meter. Using the buffer function in a GIS application, the boundary shrinks (Figure 3b) then expands back to its original boundary (Figure 3c), but the impervious cover is no longer connected to the drainage system as shown in Figure 3d.
2.3. Hydrological Modeling Using WFIUH and SWMM
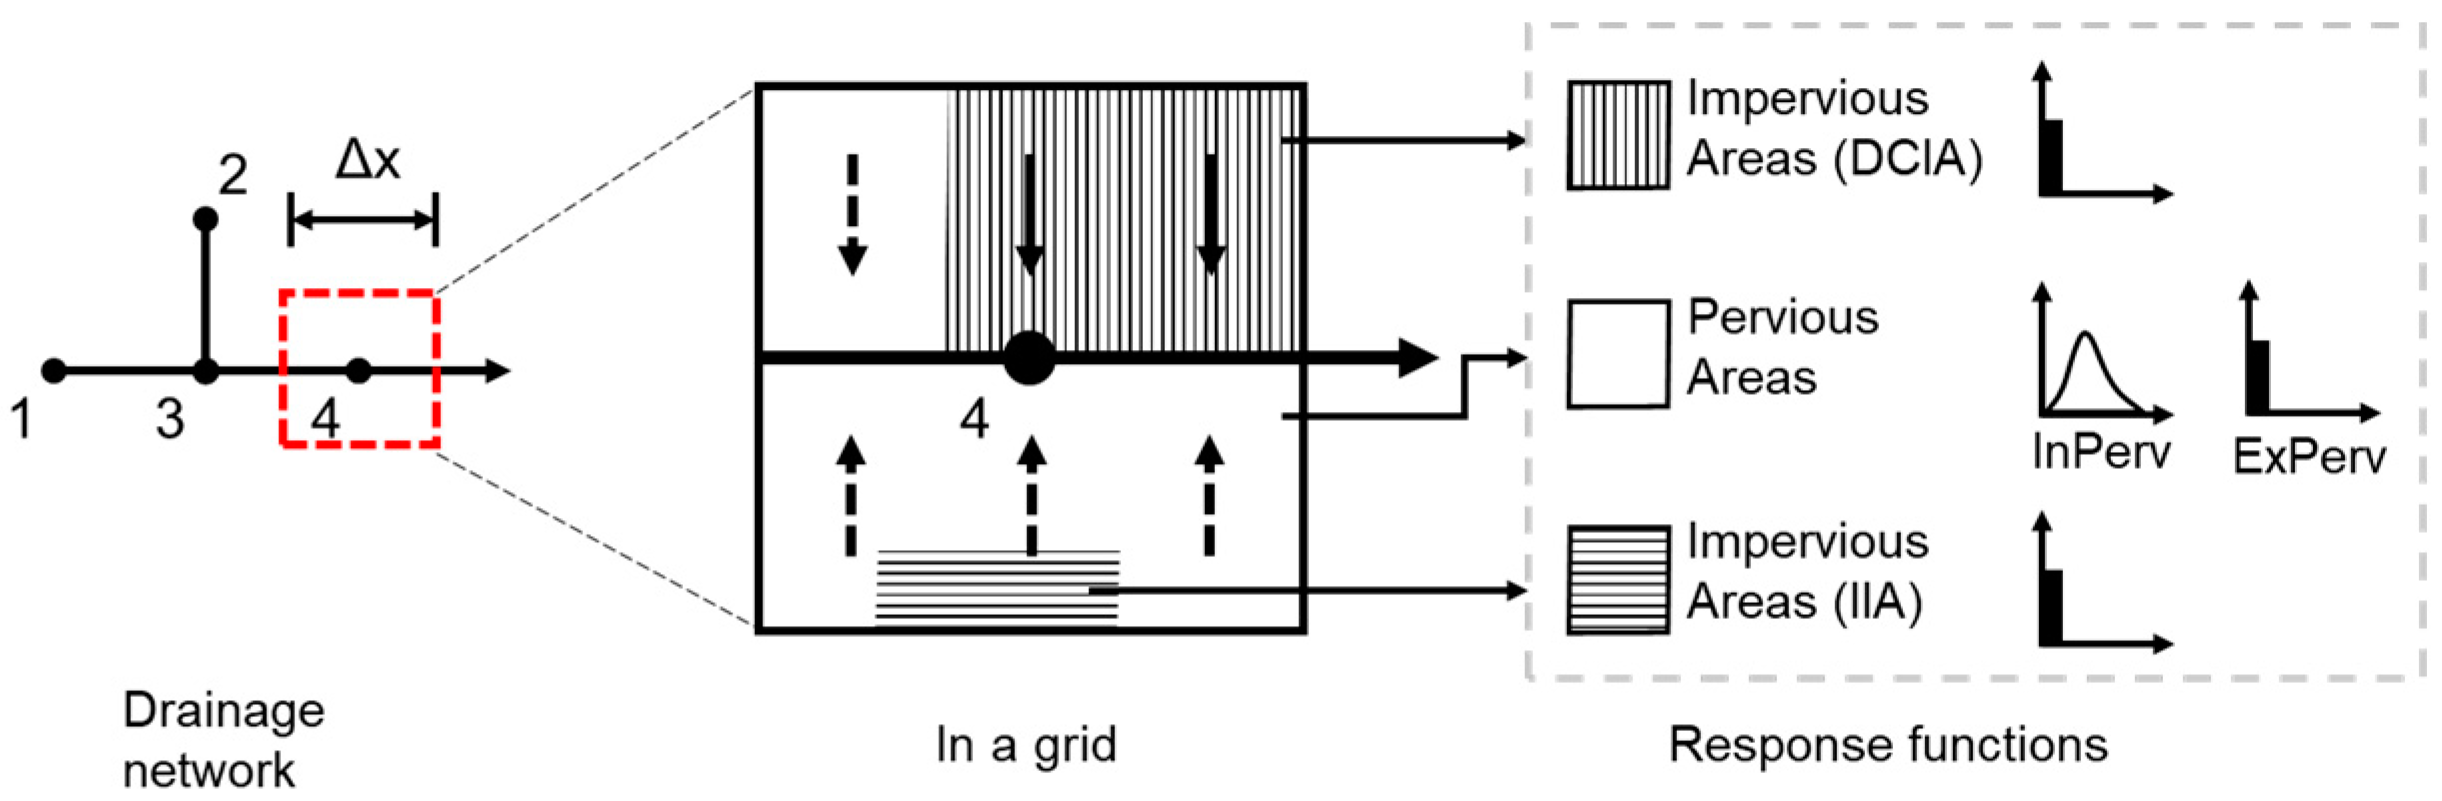
The original approach for WFIUH [28] was a grid-based model, but it has not been applied to urban areas. This study utilized a methodology that conceptualizes the contributing area of an urban catchment [11,29,30] based on the DCIAs that are directly connected to the main drainage network, isolated impervious areas (IIAs) that need to travel through pervious areas to get to the drainage network, and pervious areas. The contribution of the pervious areas can be further divided into excess rainfall amount (ExPerv) and infiltrated rainfall amount (InPerv). Traditionally, no design is considered for the urban drainage media [31]. In contrast, this study includes the contribution from infiltrated rainfall (InPerv). In order to include the contribution from different parts of an urban catchment, this study introduces a hydrological response function at the outlet of a drainage network as:
where i = 1 for contribution from excess rainfall in DCIA, i = 2 for excess rainfall in IIA, i = 3 for ExPerv, and i = 4 for InPerv. Here, W,i is a width function obtained from the reconstructed network in a lattice. The term nw is the maximum distance of the width function. In Equation (1), f is a response function of the main drainage network, and g is a response function for each contribution from DCIA, IIA, ExPerv, and InPerv, as shown in Figure 4. The response from the main drainage network is obtained from the solution of an advection-diffusion equation [32,33]:
where c1 and D1 are the celerity and diffusion coefficient of the main drainage network, respectively. The response function from excess rainfall in DCIA, IIA, and ExPerv is given as:
The flow path of the contribution from InPerv is not explicitly identified. Therefore, it is assumed that g4 has the same form as in Equation (4), which is a solution of an advection-diffusion equation:
where c2 and D2 are the celerity and diffusion coefficient of flow paths for InPerv. D2 is assumed to be on the same order of hydraulic conductivity, and c2 needs to be calibrated. Table 2 lists rainfall for each contributing area before and after saturation in pervious areas, where Iimperv denotes the excess rainfall considering depression storage only in impervious areas, and Iperv denotes the excess rainfall considering depression storage as well as infiltration in pervious areas. In Table 2, ri is the impervious ratio of the catchment (TIA/total catchment area), and rc is the area of IIA divided by the total impervious area (IIA/TIA). The term rb is the contributing ratio of the infiltrated water to runoff that needs to be calibrated. Once calibrated, rb represents the condition of the drainage system. For example, when rb is bigger, the hydrograph at the outlet can be obtained as the sum of the convolution of the response function from each area and the corresponding rainfall as follows:
where i = 1 for DCIA, i = 2 for IIA, i = 3 for ExPerv, and i = 4 for InPerv, respectively.
In this study, a detailed SWMM was used as a reference for hydrological modeling. The model consists of 7120 links and 6821 nodes, and the model (roughness coefficient) calibration is based on the observed flow data from 2012. All pipes and culverts with diameters equal to or bigger than 300 mm were included in the model. The cross-sectional geometry of the pipes or box culverts was collected from the GIS database of the city government.
3. Results and Discussion
3.1. Estimation of DCIA with Stepwise Methods
Figure 5 and Table 3 show the DCIA using the methods described in Section 2.2. The blue areas are the isolated impervious areas identified in Case 1 to Case 4 in Figure 5. Table 3 shows that DCIA is close to TIA in Case 1. Figure 5a shows the DCIA where the apparent isolated impervious areas surrounded by pervious cover were removed (Case 1). The result illustrates that the discernable isolated impervious areas are very uncommon, and most of the impervious areas are interconnected with each other in the study catchments. Figure 5b shows the DCIA where additional isolated impervious areas, which were identified by flow directions, were removed (Case 2). In this case, the DCIA was reduced by 11% in Shinweol 1 subcatchment but less than 1.5% in other two subcatchments. The results show that DCIA was not reduced much in the study area even after considering the flow directions to identify isolated impervious areas. Figure 5c shows the DCIA where the land covers for schools and gardens were removed. This typically includes pervious areas not identified by land user cover (Case 3). In this case, the DCIA was reduced by from 2.2% (Shinweol 3) up to 12.2% (Shinweol 1). Finally, Figure 5d shows the DCIA when apartments with pervious pavement, raingardens, playgrounds, and green alleys were removed (Case 4). As mentioned earlier, the study area includes highly developed areas where most areas have impervious cover. The ratio of impervious area is high, from 85% (Hwagok 2) to 95% (Shinweol 3). Moreover, the ratio of DCIA compared to TIA is high, from 85% (Shinweol 1) to 96% (Shinweol 3), even if IIA is identified by the various methods and steps shown in Table 3. Most notably, subcatchment Shinweol 3 has a high imperviousness ratio (95%) and high DCIA ratio (96%).
3.2. Hydrological Response Estimation with WFIUH
Figure 6 shows the direct runoff hydrographs estimated by WFIUH compared to observation and the detailed SWMM at the two flow observation stations, Shinweol 3 (Figure 6a–c) and Hwagok 2 (Figure 6d). Note that Figure 6c,d were observed on the same date, but at different stations. Shinweol 3 is located upstream. Figure 6a shows the resulting hydrographs considering the stepwise method (Case 1 to Case 4) described in the previous section. The results indicate that Case 4 shows the best estimation compared to the observed flows. The result demonstrates how important the estimation of the DCIA is in terms of flow estimation in urban catchments. It is also interesting that identification of the DCIA using a specific method, such as apparent isolated impervious areas (Case 1), would result in a biased estimation of the runoff hydrographs. Therefore, the estimation of the DCIA should be conducted cautiously, and the results should be verified using an appropriate hydrological model that is able to assess the effect of the DCIA at various urban catchment scales. WFIUH is a simple conceptual model that is capable of handling the DCIA in an urban catchment. It also shows a good estimate of the direct runoff hydrographs compared to observation as well as the highly detailed and heavy SWMM model.
However, the changes of the DCIA are very small for the two subcatchments, Shinweol 3 and Hwagok 2, and resulted in slight changes of peak flows as shown in Figure 6a. As shown in Table 3, the DCIA was reduced after identifying IIA mostly at subcatchment Shinweol 1, compared to the other two subcatchments. Unfortunately, WFIUH was not applied to Shinweol 1 because the subcatchment area was too small. Alternatively, Figure 7 shows the inverse proportionality of the peak flows and the DCIA reduction ratio for the storm event of 19 July 2012. The relationship is very linear, because the ratio of the DCIA linearly decreases with the contributing rainfall (as shown in Equation (5) and Table 3). The result shows the peak flow sharply decreases with decreasing DCIA. The decreasing ratio of peak flow is 5 m3/s per 10% decrease in the DCIA, which is equal to a 1.1% peak flow decrease per 1% decrease in the DCIA.
3.3. Resulting Direct Runoff Hydrographs Depending on Implementation Scenarios of Green Infrastructure
Based on the results from the previous sections, this study evaluated the impact of spatial planning for green infrastructure on the shape of the resulting direct runoff hydrographs. To accomplish this, three scenarios for green infrastructure for the test catchments are introduced, as shown in Table 4 and Figure 8. Scenario 1 converts existing impervious surfaces, such as individual residential and apartment parking lots, which were identified as DCIA, to permeable pavement. Scenario 2 includes the redirection of rooftop runoff to infiltration areas. Scenario 3 includes the implementation of both Scenario 1 and 2. This study applied the above scenarios separately to the upstream, mid-stream, and downstream catchment areas, depending on the distance from the outlet of the test catchment, to evaluate the impact of the spatial planning of green infrastructure. In this study, the reduction factors, which were suggested by USEPA [14], were used for implementation of typical green infrastructure. This reduction factor refers to the reduction ratio of DCIA from its original state. For example, if the reduction factor is 0.25, the area of DCIA is reduced by 25%. The disconnection coefficient suggested by USEPA (2014) is 0.25 for Scenario 1 and 0.15 for Scenario 2. Even though the disconnection coefficient is smaller for Scenario 2, the changes in the DCIA for Scenario 1 are bigger than in Scenario 2. This is because the application area for the permeable pavement is much larger than the rooftop redirection, as shown in Figure 8. The ratio of the DCIA compared to TIA for each scenario is applied separately to the upstream, mid-stream, and downstream areas of the test catchment.
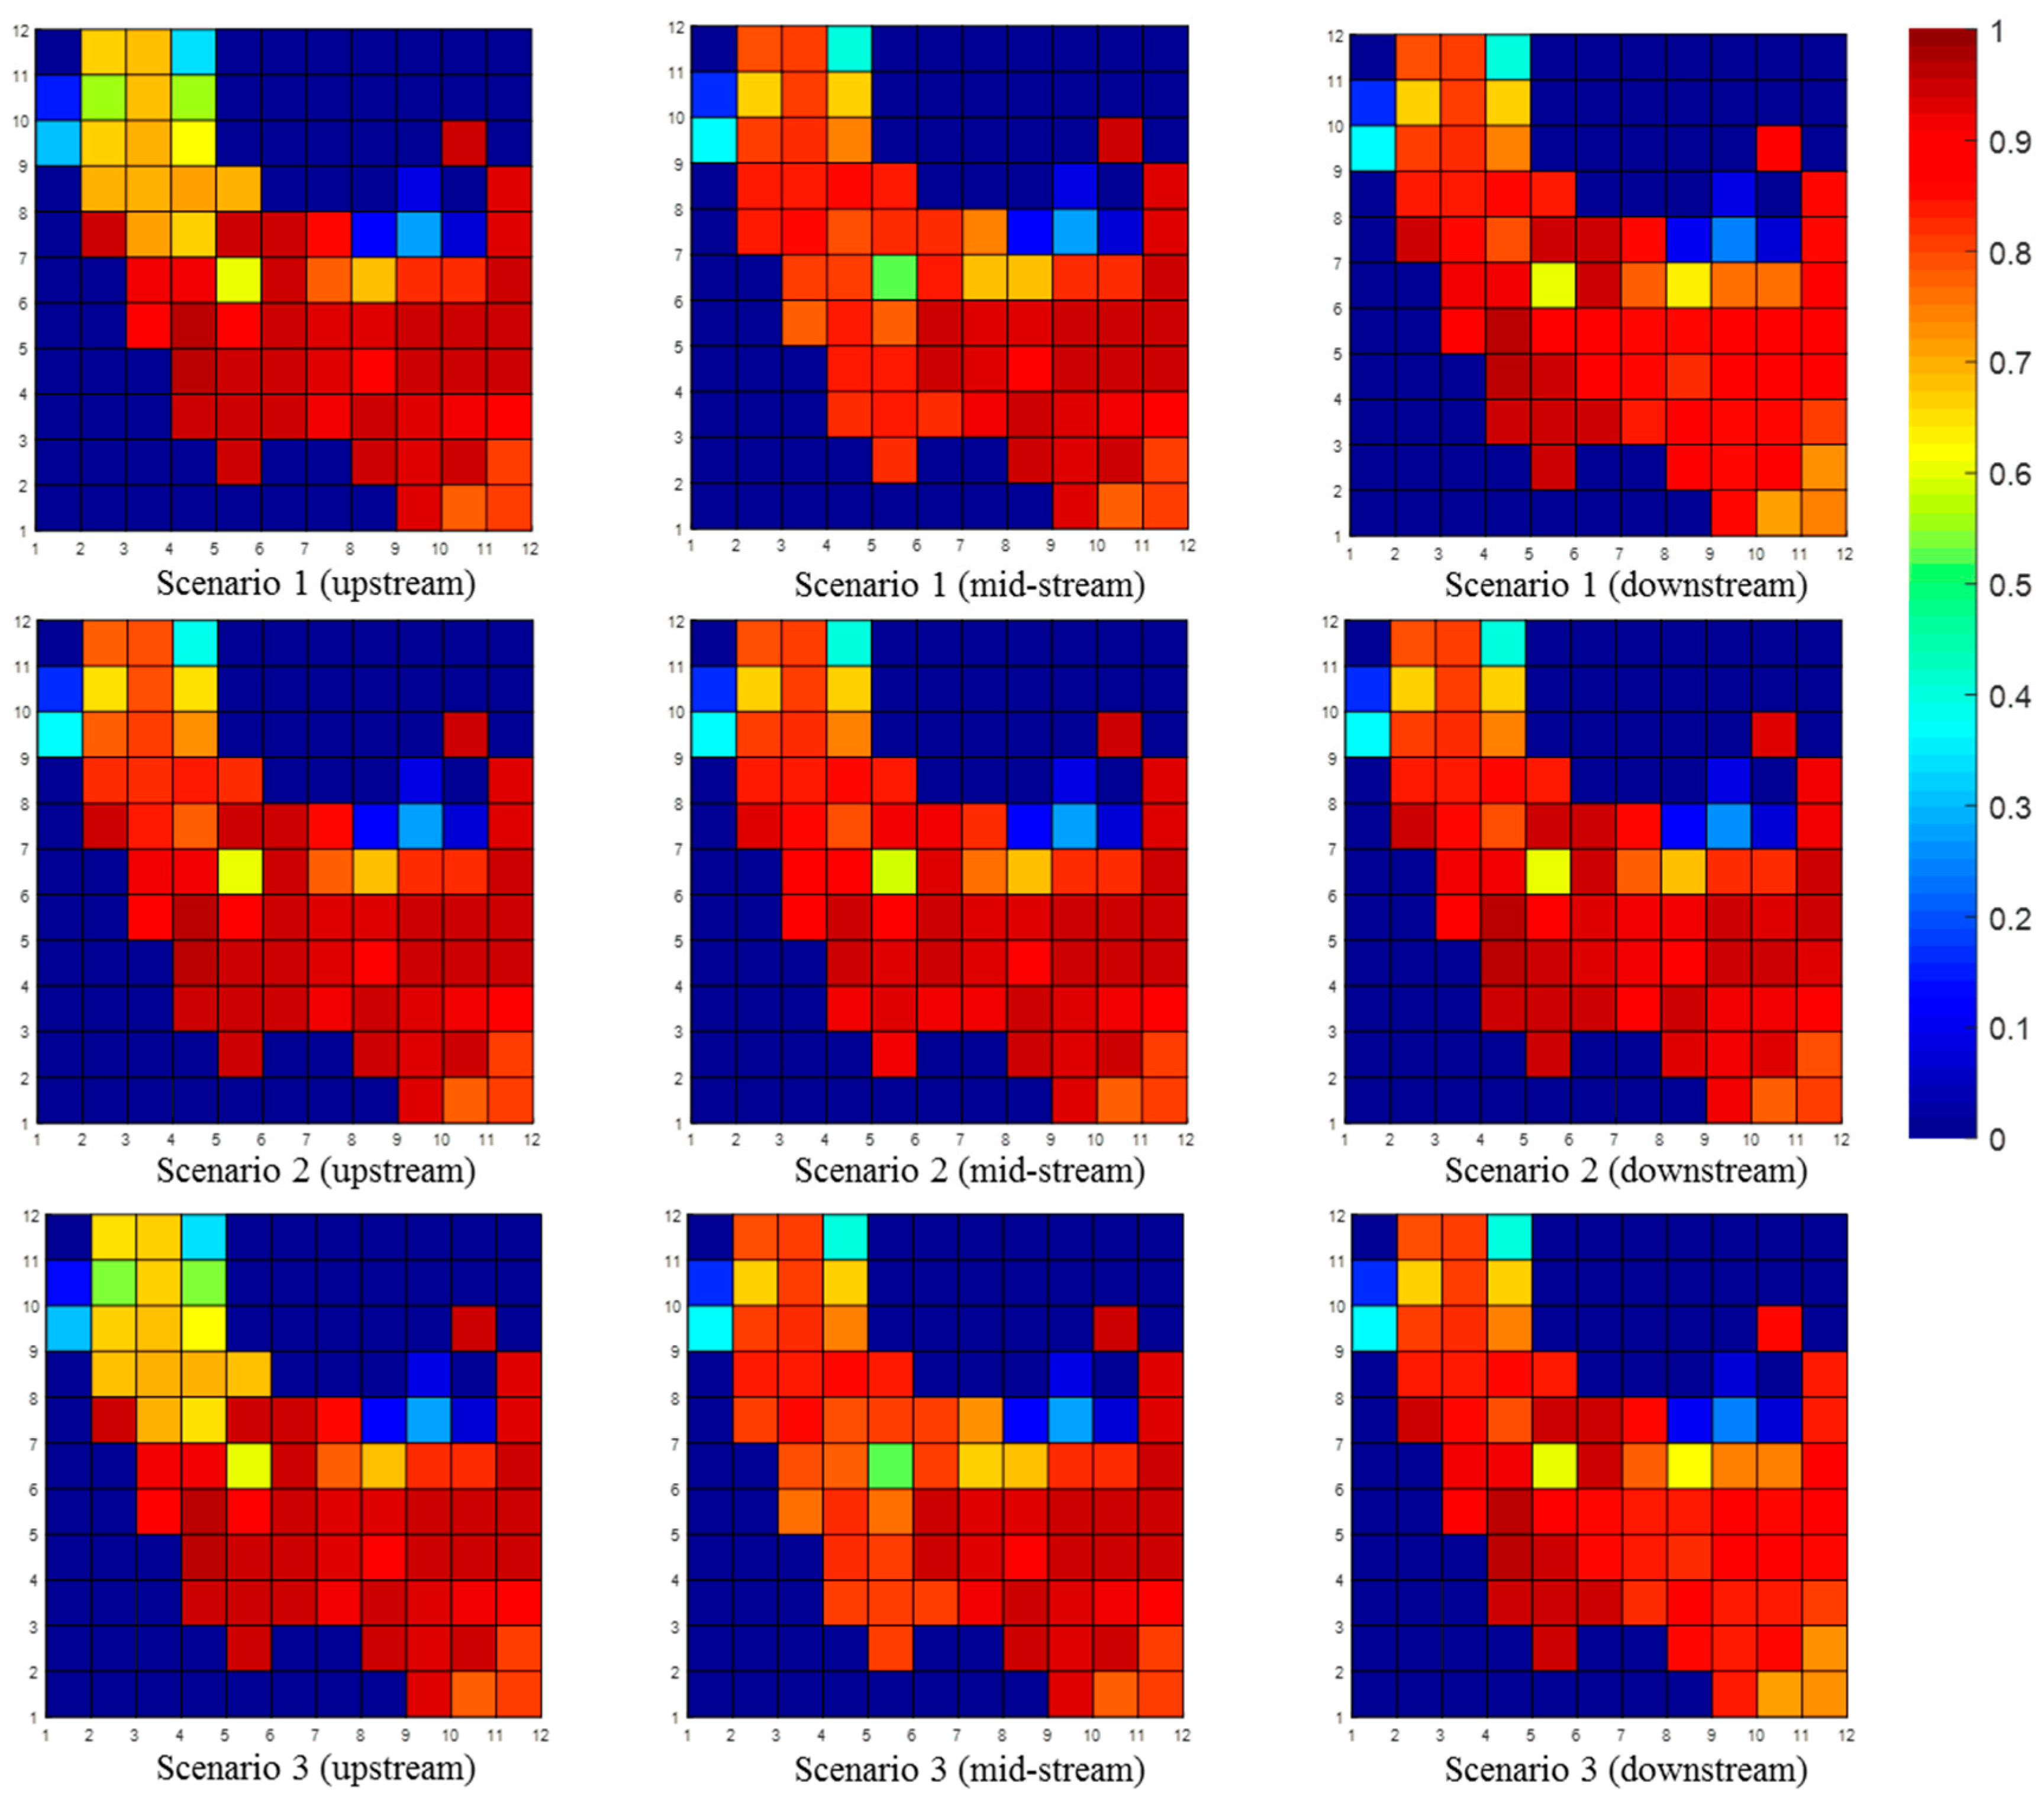
Figure 9 shows how changes in the DCIA ratio were applied to WFIUH based on grids. The scenario map (Figure 6) was averaged on grids based on the WFIUH runs. When Scenario 1 is applied to upstream areas, the map shows clear differences, with low DCIA ratios in the upstream areas compared to the other two maps for Scenario 1. Scenario 2 shows little difference, but Scenario 3 results in maps similar to those for Scenario 1. Figure 10 shows the resulting hydrograph for the application of Scenario 3 to the entire catchment where the peak flow was reduced by 12%. It should be noted that the storm event was not large enough to examine the contribution of a delayed response from permeable areas; that is, the thick tail was not shown, as in Seo et al. [11] for hypothetically greater storms. Table 5 lists the resulting peak flows by introduction of green infrastructure for the entire basin, upstream areas, mid-stream areas, and downstream areas, respectively, for Scenarios 1, 2, and 3. The results show that the peak flow can be reduced by 12% for Scenario 3 compared to the current state. Scenario 2 shows a 0.5% to 1% decrease in peak flows due to little changes in the DCIA as shown in Figure 9.
In spite of the limitations of this study, which was confined to specific catchments on specific spatial and temporal scales, the results showed that the difference in peak flows depend on the location of the implementation. It implies that strategic planning for green infrastructure in urban environments will improve the run-off issues. Table 5 shows that if Scenario 1 is introduced, there will be a difference in peak flow reduction from −2% to −5%, depending on the location of the application. The reduction of peak flows is not quite as impressive when implementing the potential green infrastructure in this study. This is due to the selection of measures for which simulations were conducted using more realistic and potential alternatives in the test catchment.
4. Conclusions
Researchers have found that the DCIA of an urban catchment is a more accurate factor for evaluating the changes in hydrological regimes than the TIA. This study assessed the impact of green infrastructure in urban catchments, focusing on their effect on decreasing DCIA. To accomplish this, three implementation scenarios of green infrastructure for the test catchment were introduced, focusing on the effect of spatial implementation planning. Coupled with the WFIUH, which is able to consider the spatial distribution of the impervious areas considering DCIA, the results showed that changes in the DCIA immediately affect the shape of the direct runoff hydrograph and decrease peak flows, depending on spatial implementation scenarios. The results imply that estimation of the DCIA should proceed with caution, and the results should be verified using an appropriate hydrological model that is able to assess the effect of DCIAs on a catchment scale. WFIUH could be a good alternative due to its simplicity, and also the capability of handling DCIA in urban catchments. It also provides good estimates of direct runoff hydrographs compared to observation, and even the highly detailed heavy SWMM model. Although the disconnection coefficient suggested by the US EPA is quite empirical and can be improved on a site-specific base, it still implies the importance of DCIA in the evaluation of green infrastructures. The quantitative assessment of the spatial distribution of the impervious areas and the changes in the DCIA suggest that more effective strategic planning of green infrastructure should be introduced in urban environments for flood risk management. This study left the quantitative cost-benefit analysis based on the suggested approach to future study.
Acknowledgments
This research was supported by a 2015 Yeungnam University Research Grant and also supported by a grant from a Strategic Research Project funded by the Korea Institute of Civil Engineering and Building Technology.
Author Contributions
Yongwon Seo proposed the research idea and schematics for the analysis. Dong Sop Rhee provided the analysis tool. Junshik Hwang performed the hydrologic analysis. The manuscript was written by Yongwon Seo and Junshik Hwang with support from Dong Sop Rhee.
Conflicts of Interest
The authors declare no conflict of interest. The founding sponsors had no role in the design of the study; in the collection, analysis, or interpretation of data; in the writing of the manuscript, and in the decision to publish the results.
References
- Boyd, M.J.; Bufill, M.C.; Knee, R.M. Pervious and impervious runoff in urban catchments. Hydrol. Sci. J. 1993, 38, 463–478. [Google Scholar] [CrossRef]
- Roy, A.H.; Shuster, W.D. Assessing impervious surface connectivity and applications for watershed management. J. Am. Water Resour. Assoc. 2009, 45, 198–209. [Google Scholar] [CrossRef]
- Schueler, T.R. The importance of imperviousness. Watershed Prot. Tech. 1994, 1, 100–111. [Google Scholar]
- Arnold, C.L.; Gibbons, C.J. Impervious surface coverage: The emergence of a key environmental indicator. J. Am. Plan. Assoc. 1996, 62, 243–258. [Google Scholar] [CrossRef]
- Urbona, B.R. Urban Runoff Quality Management; American Society of Civil Engineers: Reston, VA, USA, 1998. [Google Scholar]
- Mays, L.W. Stormwater Collection Systems Design Handbook, 1st ed.; McGraw-Hill: New York, NY, USA, 2001. [Google Scholar]
- Dunne, T.; Leopold, L.B. Water in Environmental Planning, 1st ed.; W. H. Freeman: San Francisco, CA, USA, 1978. [Google Scholar]
- Gordon, N.D.; Finlayson, B.L.; McMahon, T.A. Stream Hydrology: An Introduction for Ecologists, 2nd ed.; Wiley: Chichester, West Sussex, UK, 2004. [Google Scholar]
- Leopold, L.B. A View of the River; Harvard University Press: Cambridge, MA, USA, 1994. [Google Scholar]
- Boyd, M.J.; Bufill, M.C.; Knee, R.M. Predicting pervious and impervious storm runoff from urban drainage basins. Hydrol. Sci. J. 1994, 39, 321–332. [Google Scholar] [CrossRef]
- Seo, Y.; Choi, N.J.; Schmidt, A.R. Contribution of directly connected and isolated impervious areas to urban drainage network hydrographs. Hydrol. Earth Syst. Sci. 2013, 17, 3473–3483. [Google Scholar] [CrossRef]
- Lee, J.G.; Heaney, J.P. Estimation of urban imperviousness and its impacts on storm water systems. J. Water Res. Plan Manag. 2003, 129, 419–426. [Google Scholar] [CrossRef]
- Brabec, E.; Schulte, S.; Richards, P.L. Impervious surfaces and water quality: A review of current literature and its implications for watershed planning. J. Plan. Lit. 2002, 16, 499–514. [Google Scholar] [CrossRef]
- Walsh, C.J. Protection of in-stream biota from urban impacts: Minimise catchment imperviousness or improve drainage design? Mar. Freshw. Res. 2004, 55, 317–326. [Google Scholar] [CrossRef]
- Walsh, C.J.; Fletcher, T.D.; Ladson, A.R. Stream restoration in urban catchments through redesigning stormwater systems: Looking to the catchment to save the stream. J. N. Am. Benthol. Soc. 2005, 24, 690–705. [Google Scholar] [CrossRef]
- United States Environmental Protection Agency (USEPA). Available online: https://www.epa.gov/green-infrastructure/ (accessed on 12 January 2017).
- Roesner, L.A.; Bledsoe, B.P.; Brashear, R.W. Are best-management-practice criteria really environmentally friendly? J. Water Res. Plan Manag. 2001, 127, 150–154. [Google Scholar] [CrossRef]
- Booth, D.B.; Hartley, D.; Jackson, R. Forest cover, impervious-surface area, and the mitigation of stormwater impacts. J. Am. Water Resour. Assoc. 2002, 38, 835–845. [Google Scholar] [CrossRef]
- Carter, T.; Jackson, C.R. Vegetated roofs for stormwater management at multiple spatial scales. Landsc. Urban Plan. 2007, 80, 84–94. [Google Scholar] [CrossRef]
- Mayer, A.; Shuster, W.D.; Beaulieu, J.; Hopton, M.; Rhea, L.K.; Thurston, H.; Roy, A.H. Building green infrastructure via citizen participation—A six-year study in the shepherd creek. Environ. Pract. 2012, 14, 57–67. [Google Scholar] [CrossRef]
- Alley, W.M.; Veenhuis, J.E. Effective impervious area in urban runoff modeling. J. Hydraul. Eng. 1983, 109, 313–319. [Google Scholar] [CrossRef]
- Dinicola, R.S. Characterization and Simulation of Rainfall-Runoff Relations for Headwater Basins in Western King and Snohomish Counties, Washington; Department of the Interior, U.S. Geological Survey: Reston, VA, USA, 1990.
- Sutherland, R.C. Methods for estimating the effective impervious area of urban watersheds. Pract. Watershed Prot. 2000, 32, 193–195. [Google Scholar]
- EPA’s Methodology to Calculate Baseline Estimates of Impervious Area (IA) and Directly Connected Impervious Area (DCIA) for Massachusetts Communities; United States Environmental Protection Agency: Washington, DC, USA, 2010.
- Estimating Change in Impervious Area (IA) and Directly Connected Impervious Area for Massachusetts Small MS4 Permit; United States Environmental Protection Agency: Washington, DC, USA, 2014.
- Prisloe, M.; Giannotti, L.; Sleavin, W. Determining impervious surfaces for watershed modeling applications. Presented at the 8th National Nonpoint Source Monitoring Conference, Hartford, CT, USA, 10–14 September 2000. [Google Scholar]
- Sahoo, S.N.; Sreeja, P. Determination of effective impervious area for an urban Indian catchment. J. Hydrol. Eng. 2016, 21. [Google Scholar] [CrossRef]
- Naden, P.S. Spatial variability in flood estimation for large catchments: The exploitation of channel network structure. Hydrol. Sci. J. 1992, 37, 53–71. [Google Scholar] [CrossRef]
- Seo, Y. The effect of rainstorm movement on urban drainage network runoff hydrographs. Hydrol. Process. 2012, 26, 3830–3841. [Google Scholar] [CrossRef]
- Seo, Y.; Schmidt, A.R. Application of Gibbs’ model to urban drainage networks: A case study in southwestern Chicago, USA. Hydrol. Process. 2014, 28, 1148–1158. [Google Scholar] [CrossRef]
- Yen, B.C.; Akan, A.O. Hydraulic design of urban drainage systems. In Hydraulic Design Handbook; Mays, L.W., Ed.; McGraw-Hill: New York, NY, USA, 1999. [Google Scholar]
- Franchini, M.; OConnell, P.E. An analysis of the dynamic component of the geomorphologic instantaneous unit hydrograph. J. Hydrol. 1996, 175, 407–428. [Google Scholar] [CrossRef]
- Da Ros, D.; Borga, M. Use of digital elevation model data for the derivation of the geomorphological instantaneous unit hydrograph. Hydrol. Process. 1997, 11, 13–33. [Google Scholar] [CrossRef]
Figure 1.
Study area in Shinweol Basin, Seoul, South Korea. Precipitation data with 10-min time intervals obtained from the Automated Weather System (AWS) in the basin.
Figure 1.
Study area in Shinweol Basin, Seoul, South Korea. Precipitation data with 10-min time intervals obtained from the Automated Weather System (AWS) in the basin.
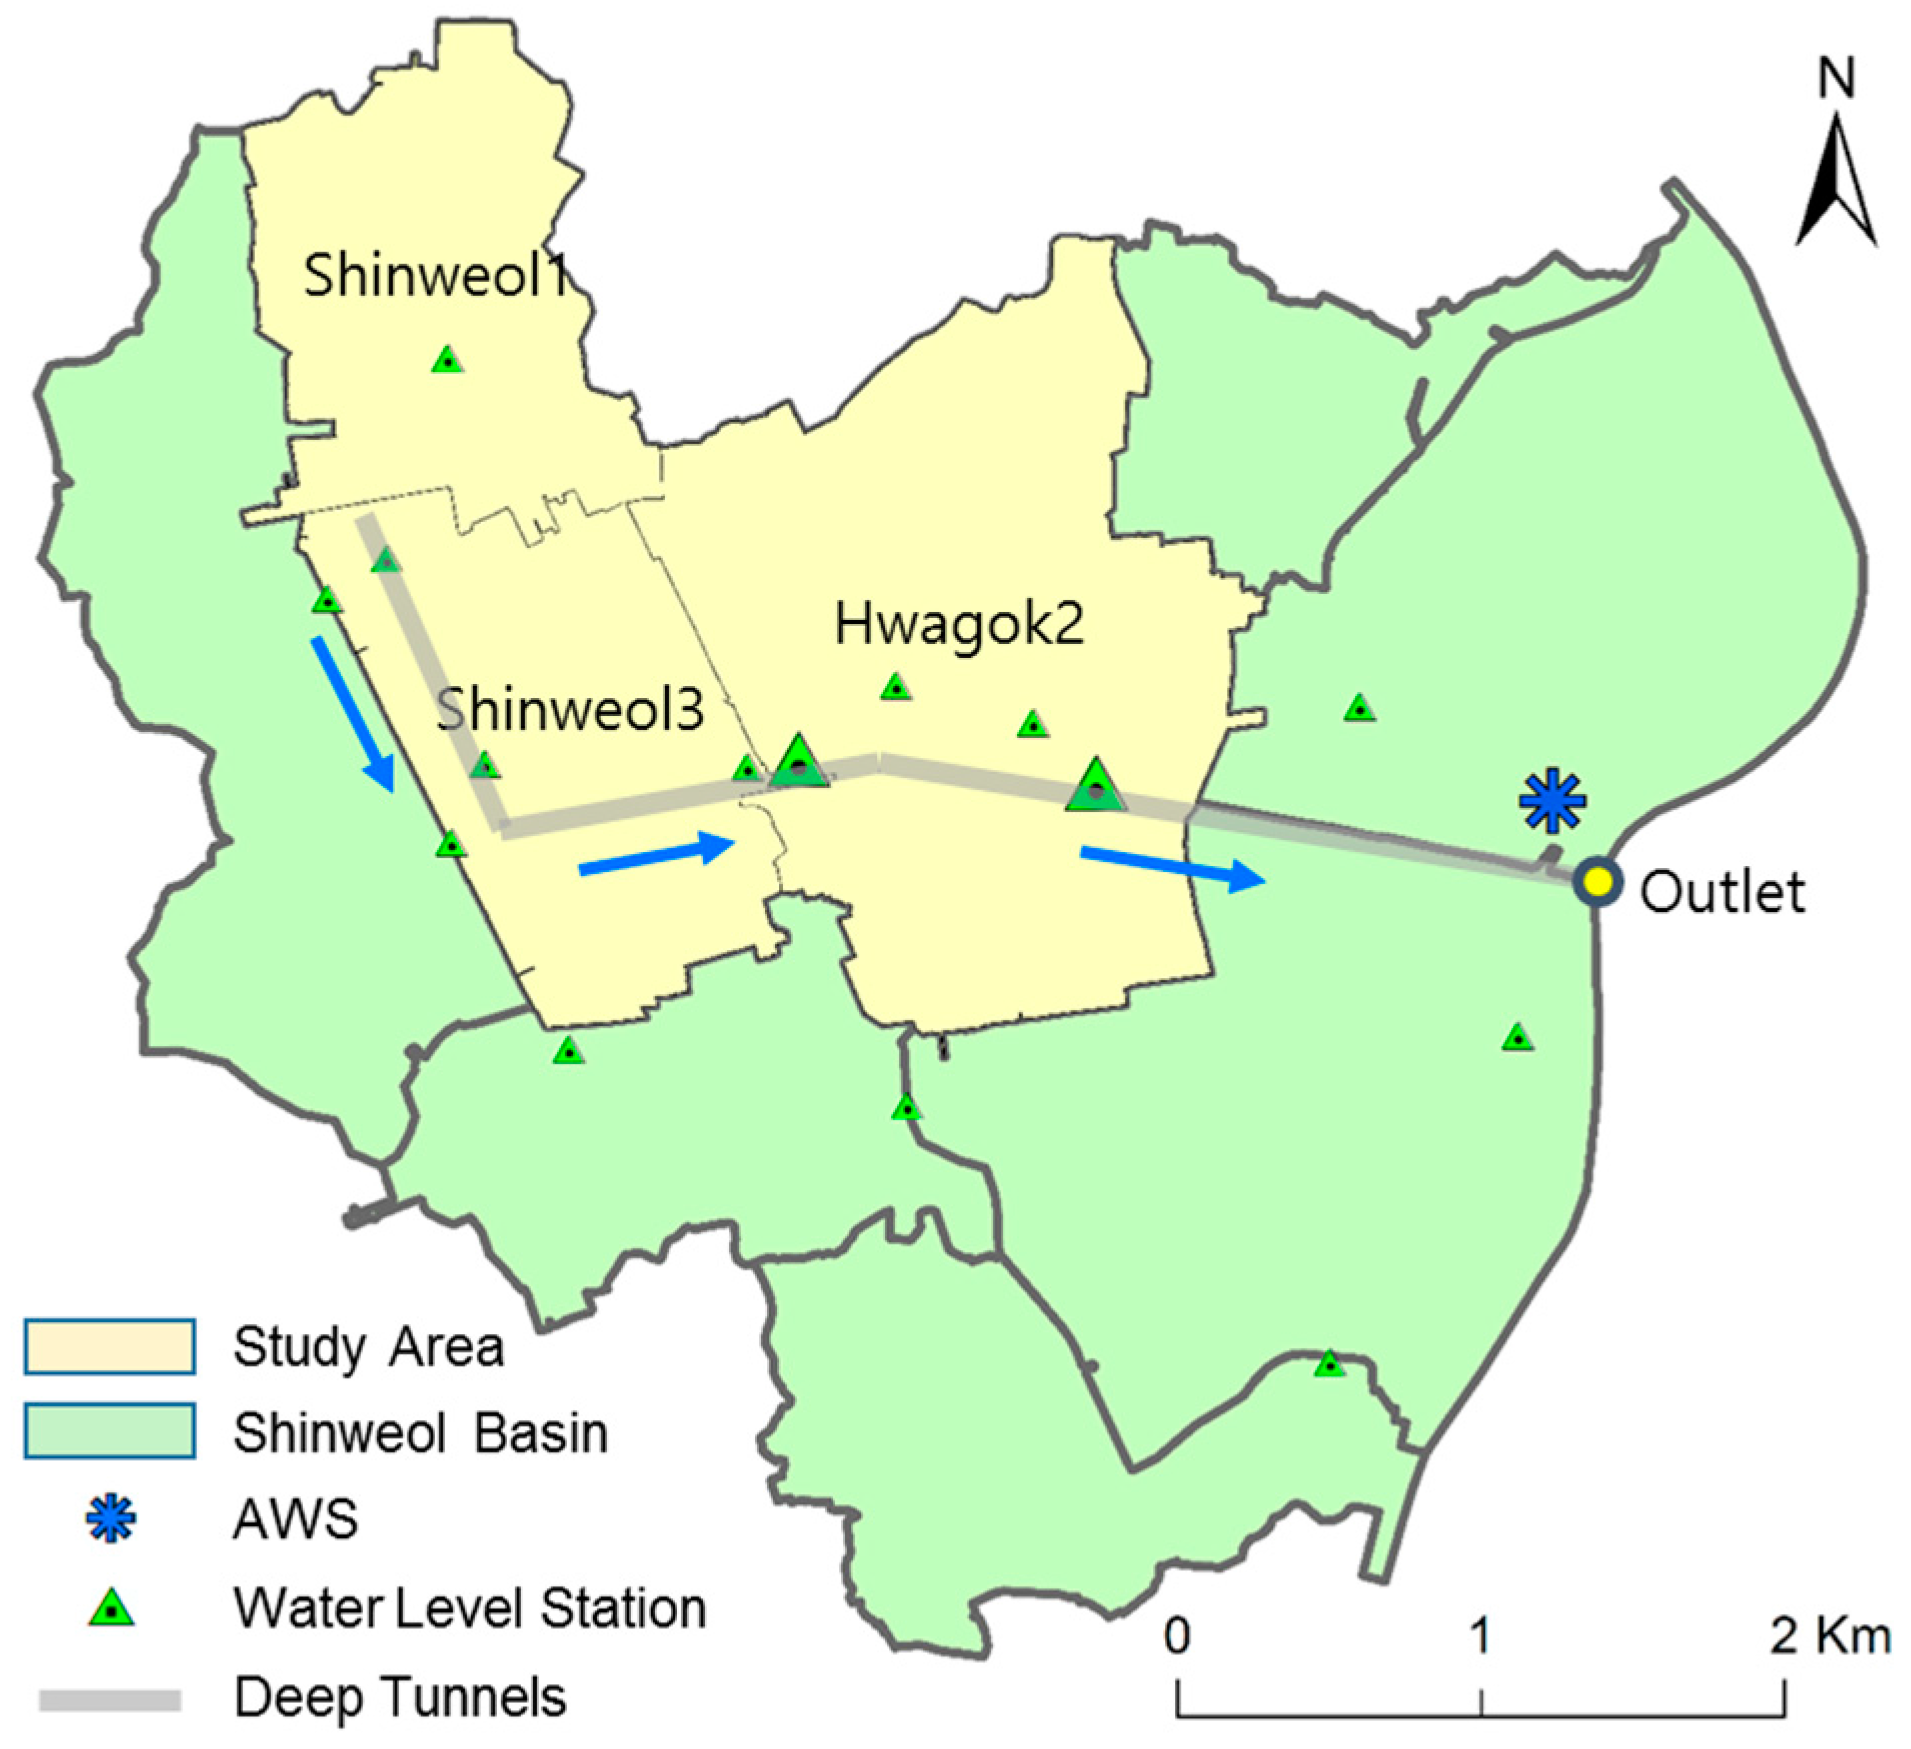
Figure 2.
Land use map and total impervious area map identified from the detailed land use cover data of the Shinweol Basin.
Figure 2.
Land use map and total impervious area map identified from the detailed land use cover data of the Shinweol Basin.

Figure 3.
A procedure for determining DCIA using the threshold value and the buffer function in a GIS application.
Figure 3.
A procedure for determining DCIA using the threshold value and the buffer function in a GIS application.

Figure 4.
Response functions from each area (DCIA, IIA and pervious areas) contributing to runoff hydrographs.
Figure 4.
Response functions from each area (DCIA, IIA and pervious areas) contributing to runoff hydrographs.

Figure 5.
Land use map and total impervious area map identified from the detailed land use cover data of the study area.
Figure 5.
Land use map and total impervious area map identified from the detailed land use cover data of the study area.

Figure 6.
Runoff hydrographs estimated by WFIUH compared with observation and detailed SWMM.
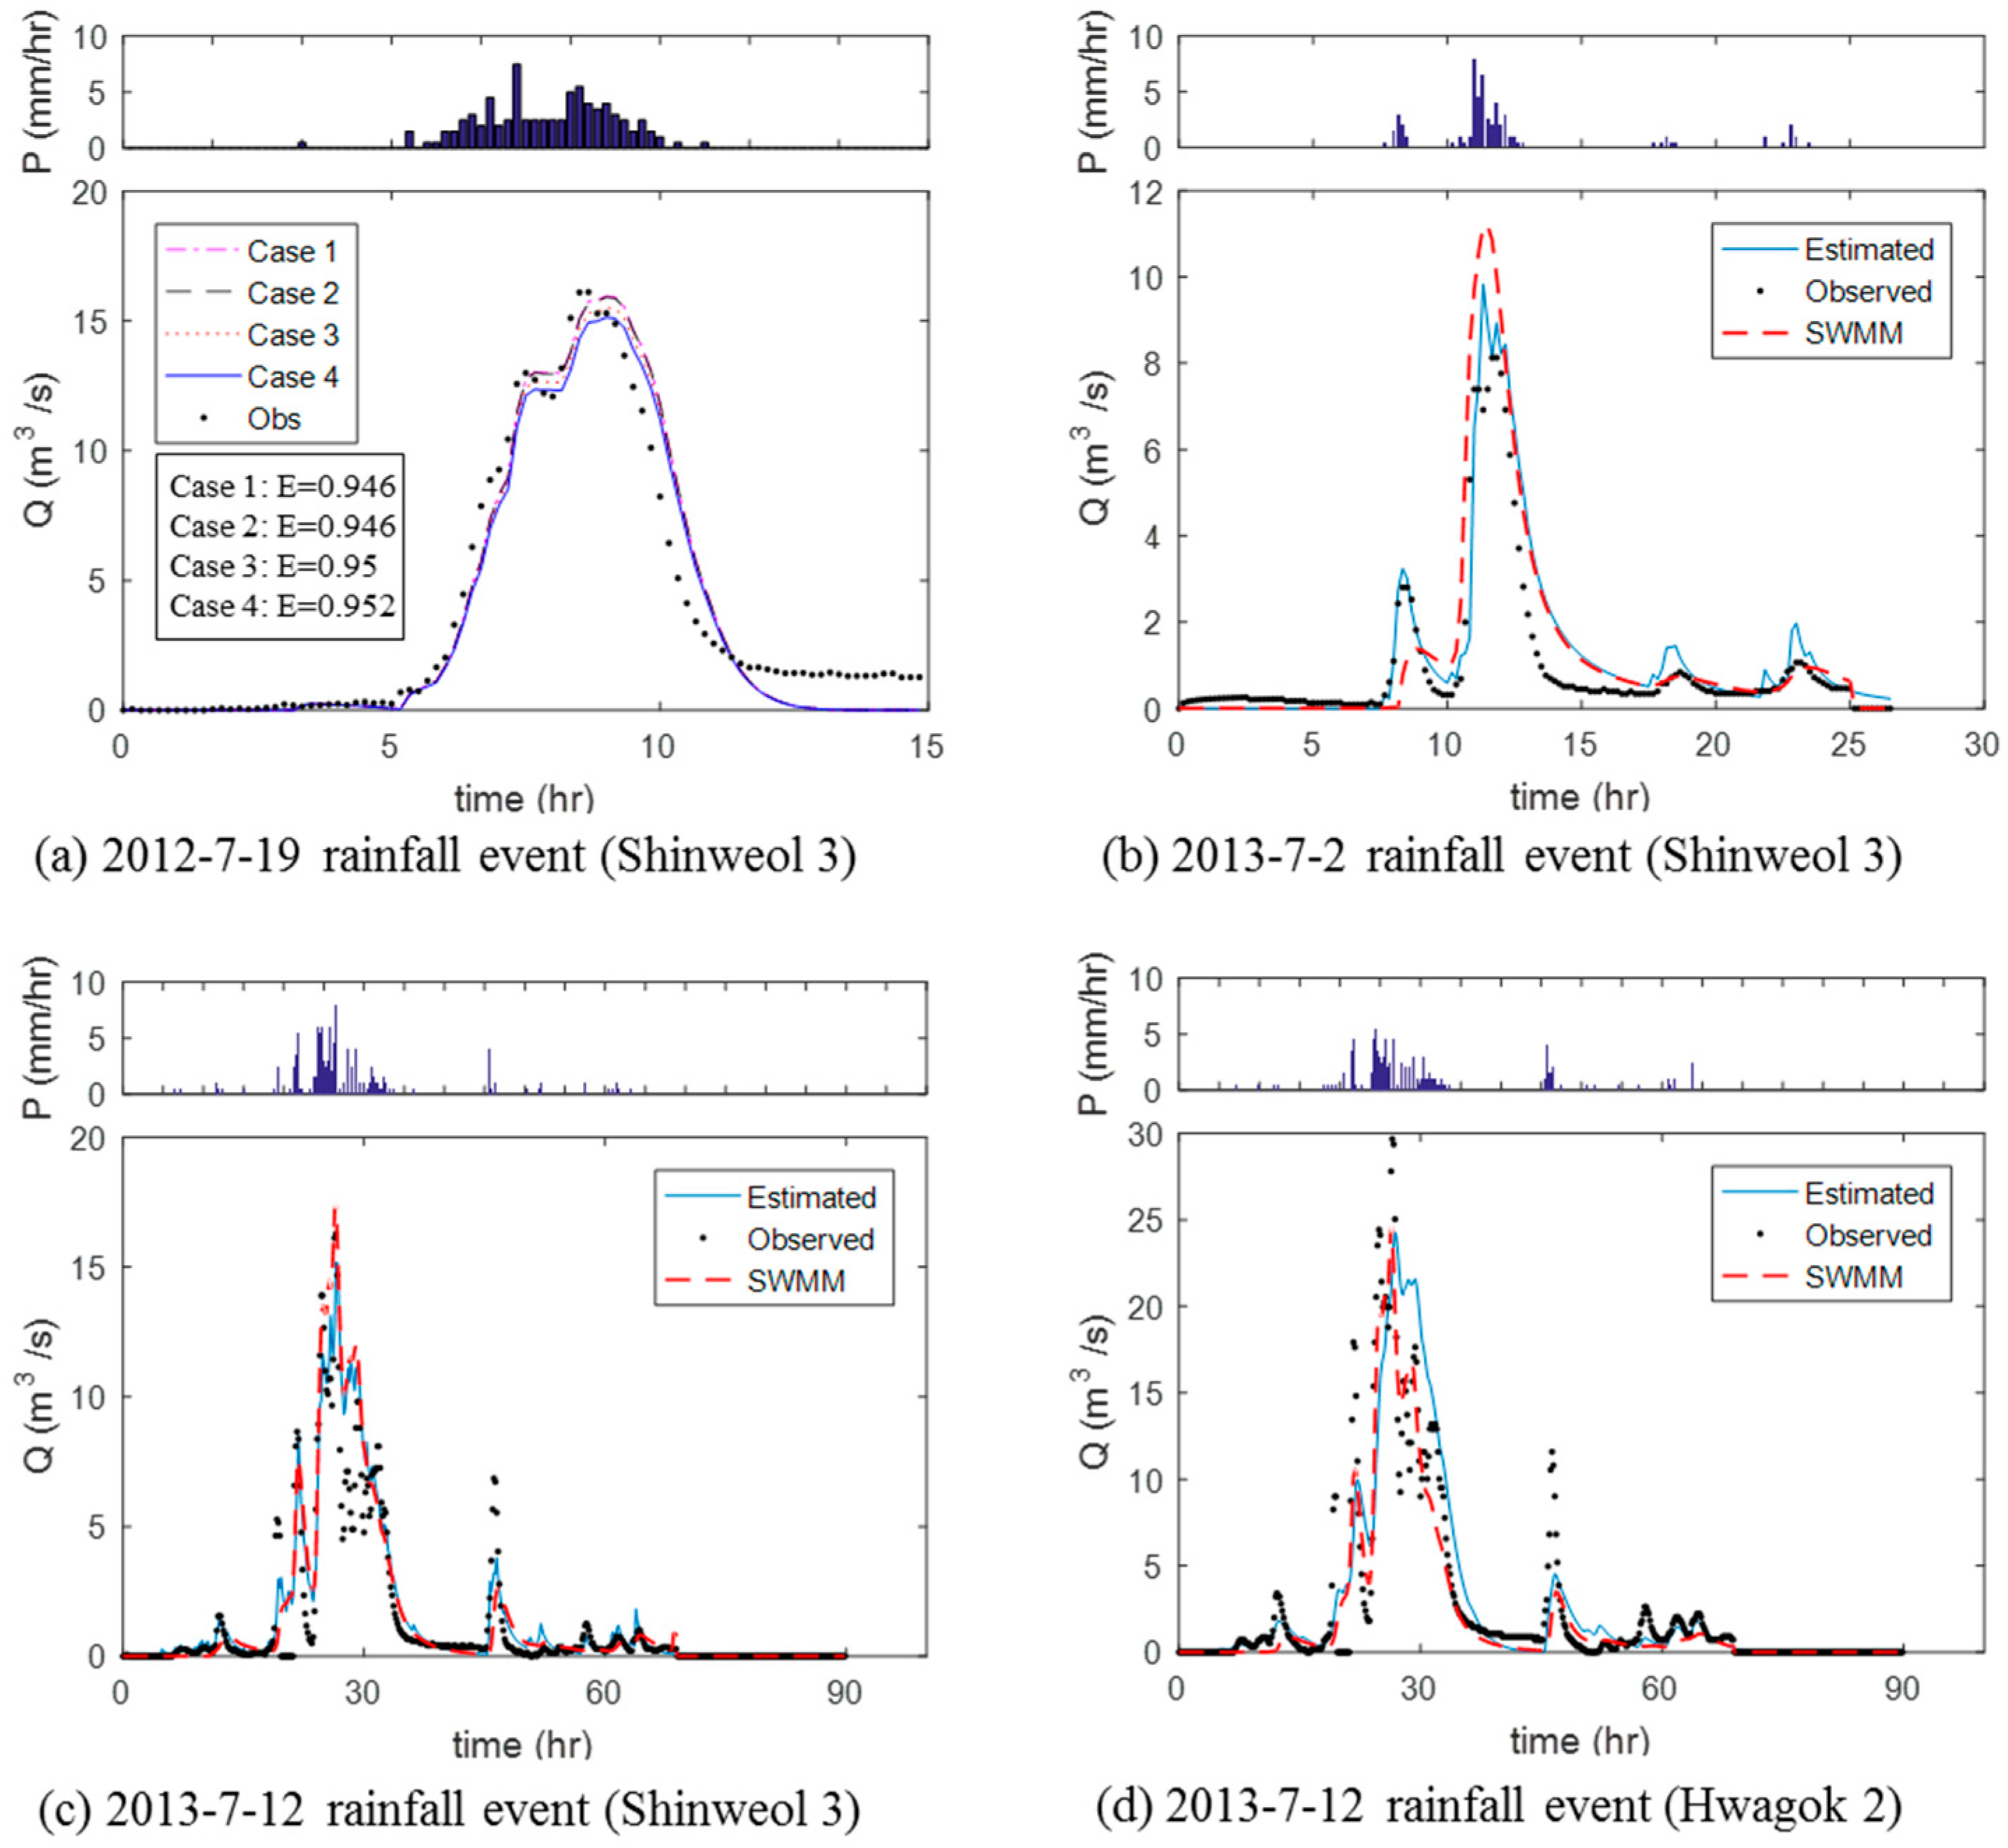
Figure 7.
Peak flow as a function of DCIA reduction ratio at Shinweol 3 for the storm event on 19 July 2012.
Figure 7.
Peak flow as a function of DCIA reduction ratio at Shinweol 3 for the storm event on 19 July 2012.
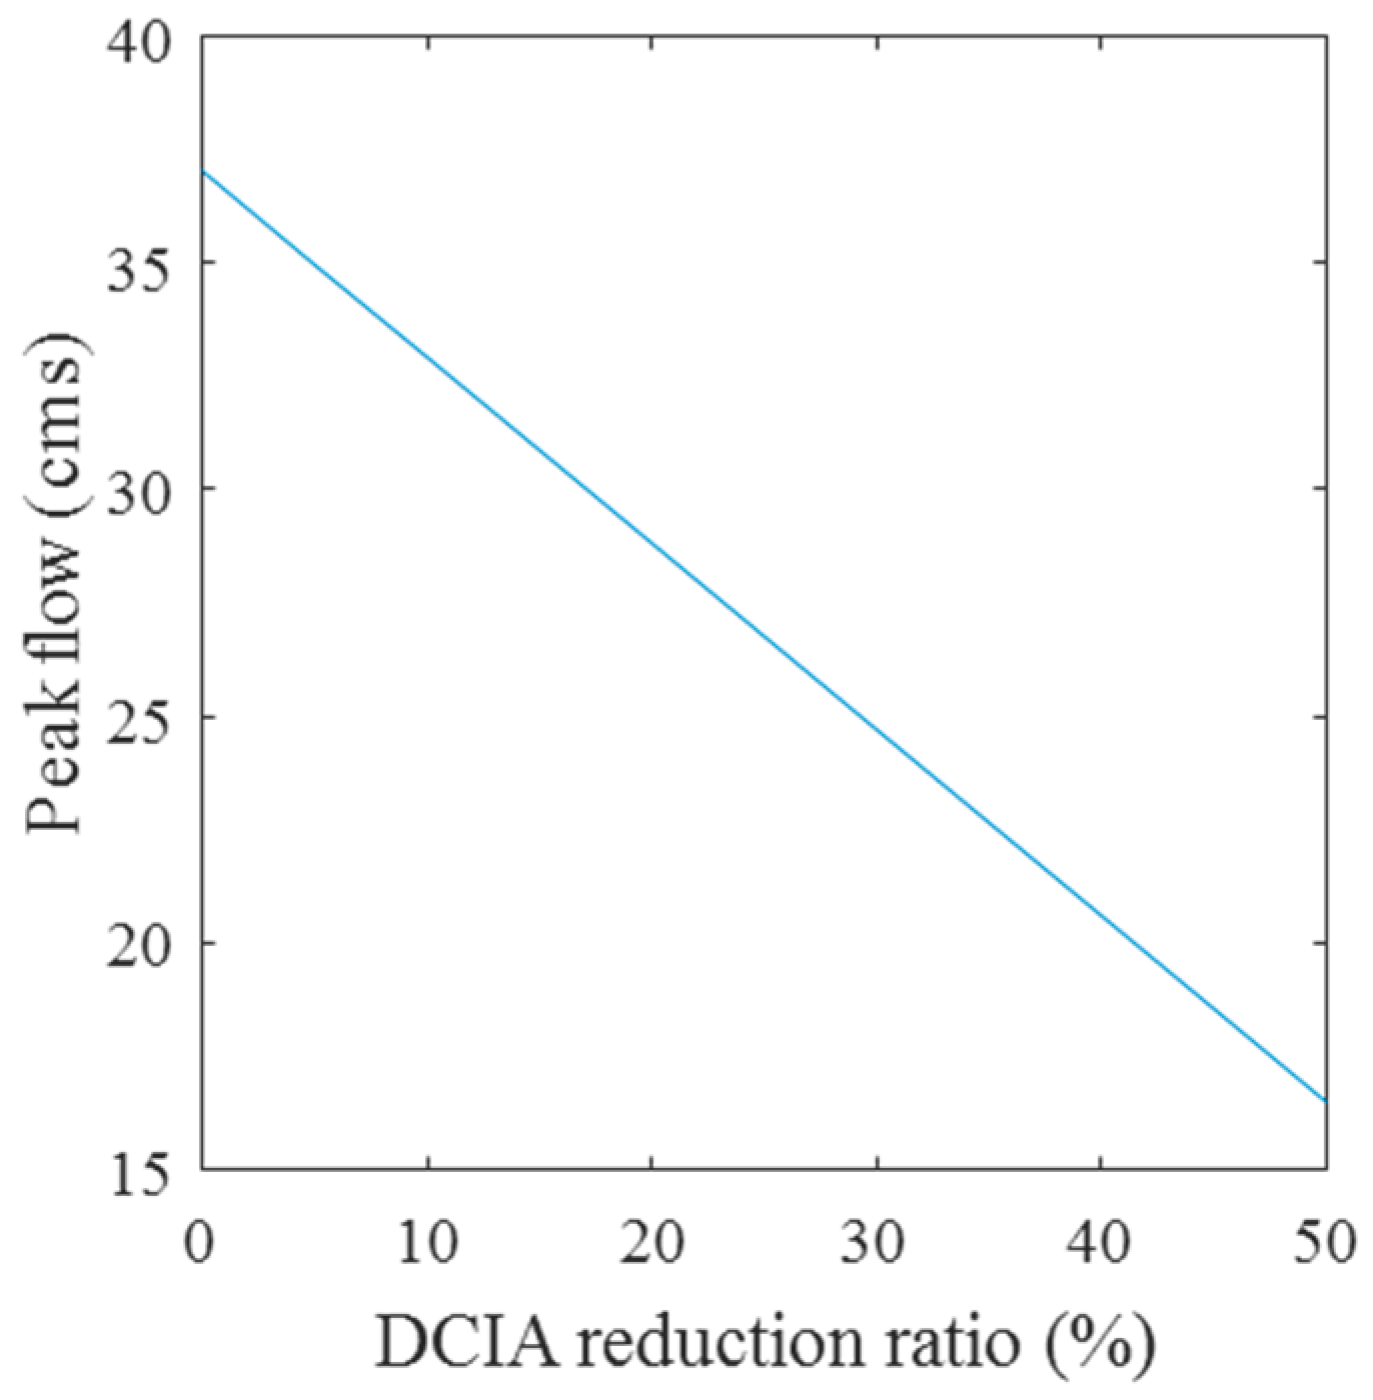
Figure 8.
DCIA reduction scenario maps (red areas) where two types of green infrastructure were applied: (a) permeable pavement (Scenario 1), (b) redirection of rooftop runoff to infiltration areas (Scenario 2), and (c) Scenario 1 + Scenario 2 (Scenario 3).
Figure 8.
DCIA reduction scenario maps (red areas) where two types of green infrastructure were applied: (a) permeable pavement (Scenario 1), (b) redirection of rooftop runoff to infiltration areas (Scenario 2), and (c) Scenario 1 + Scenario 2 (Scenario 3).
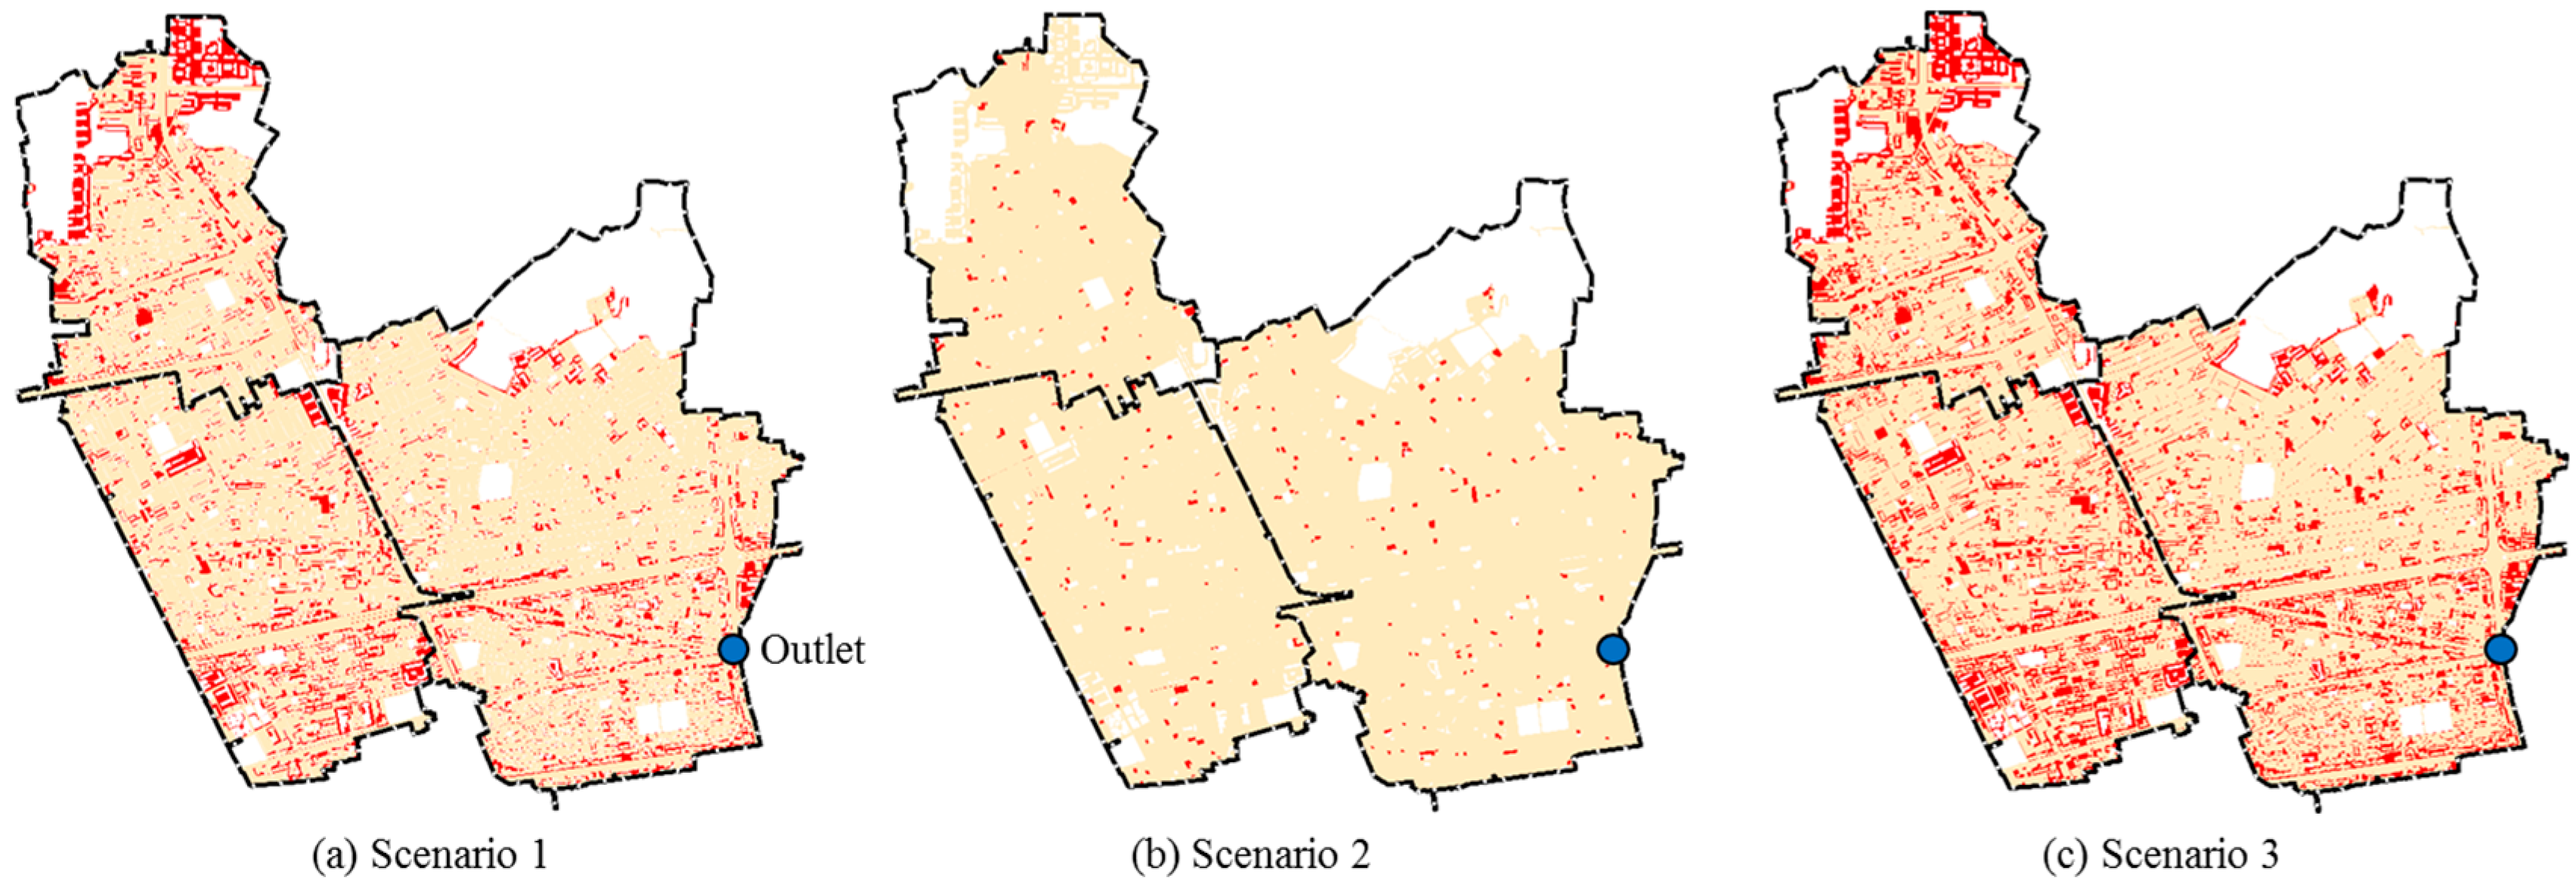
Figure 9.
Application of Scenarios to WFIUH by changing the DCIA ratio on grids. The DCIA ratio is the DCIA divided by the TIA. Therefore, the closer the DCIA ratio is to 1, the more likely it is that most of the impervious area is directly connected to the drainage network. Conversely, the closer the DCIA ratio is to zero, the less direct connection to the drainage network in the impervious area.

Figure 10.
Resulting hydrograph for the application of Scenario 3 to the entire catchment with peak flow reduction of 12 % for the storm event on 12 July 2013.
Figure 10.
Resulting hydrograph for the application of Scenario 3 to the entire catchment with peak flow reduction of 12 % for the storm event on 12 July 2013.


Table 1.
Land cover classification (Ministry of Environment, South Korea).
| Low-level Land Cover Data | Mid-level Land Cover Data | High-level Land Cover Data |
|---|---|---|
 |  |  |
| ∙ Spatial resolution: 30 m ∙ Classification: 7 items ∙ Map scale: 1:50,000 ∙ Data: Landsat TM satellite image | ∙ Spatial resolution: 5 m ∙ Classification: 22 items ∙ Map scale: 1:25,000 ∙ Data: Landsat TM + IRS 1C, SPOT5, Arirang 2 satellite image | ∙ Spatial resolution: 1 m ∙ Classification: 41 items ∙ Map scale: 1:5000 ∙ Data: Arirang 2, IKONOS satellite image, Air-Photographs |
Table 2.
Rainfall intensity for each contributing area in an urban catchment.
| Contribution | Saturation Condition | |
|---|---|---|
| Before Saturation | After Saturation | |
| DCIA | ||
| IIA | ||
| ExPerv | ||
| InPerv | ||
Table 3.
DCIA calculated for the study area.
| Catchment | Area (km2) | TIA (km2) | DCIA (km2) | |||
|---|---|---|---|---|---|---|
| Case 1 | Case 2 | Case 3 | Case 4 | |||
| Shinweol 1 | 1.524 | 1.368 | 1.364 | 1.216 | 1.197 | 1.159 |
| Shinweol 3 | 1.725 | 1.674 | 1.674 | 1.670 | 1.636 | 1.605 |
| Hwagok 2 | 3.255 | 2.773 | 2.770 | 2.726 | 2.658 | 2.632 |
Table 4.
DCIA reduction scenarios for the test catchment.
| Scenario | Description | DCIA (%) | |||
|---|---|---|---|---|---|
| Present | Applied to Upstream | Applied to Midstream | Applied to Downstream | ||
| Scenario 1 | Convert roads, individual residential and apartment parking lots to permeable pavement | 82.95 | 63.76 | 81.41 | 74.27 |
| Scenario 2 | Redirection of rooftop runoff to infiltration areas | 74.94 | 91.57 | 79.91 | |
| Scenario 3 | Scenario 1 + Scenario 2 | 62.69 | 79.93 | 73.34 | |
Table 5.
Resulting peak flows by application of green infrastructure.
| Application Areas | Peak Flows (m3/s) for the Storm Event on 12 July 2013 | |||
|---|---|---|---|---|
| Current State | Scenario 1 | Scenario 2 | Scenario 3 | |
| Entire catchment | 36.96 | 32.98 (−11%) | 36.39 (−2%) | 32.48 (−12 %) |
| Upstream areas | 36.09 (−2%) | 36.83 (−0.5%) | 36.03 (−3%) | |
| Midstream areas | 35.61 (−4%) | 36.73 (−1%) | 35.39 (−4%) | |
| Downstream areas | 35.19 (−5%) | 36.74 (−1%) | 34.97 (−5%) | |
© 2017 by the authors. Licensee MDPI, Basel, Switzerland. This article is an open access article distributed under the terms and conditions of the Creative Commons Attribution (CC BY) license (http://creativecommons.org/licenses/by/4.0/).
Share and Cite
MDPI and ACS Style
Hwang, J.; Rhee, D.S.; Seo, Y. Implication of Directly Connected Impervious Areas to the Mitigation of Peak Flows in Urban Catchments. Water 2017, 9, 696. https://doi.org/10.3390/w9090696
AMA Style
Hwang J, Rhee DS, Seo Y. Implication of Directly Connected Impervious Areas to the Mitigation of Peak Flows in Urban Catchments. Water. 2017; 9(9):696. https://doi.org/10.3390/w9090696
Chicago/Turabian StyleHwang, Junshik, Dong Sop Rhee, and Yongwon Seo. 2017. "Implication of Directly Connected Impervious Areas to the Mitigation of Peak Flows in Urban Catchments" Water 9, no. 9: 696. https://doi.org/10.3390/w9090696
Note that from the first issue of 2016, this journal uses article numbers instead of page numbers. See further details here.