Applications of Mobile Augmented Reality to Water Resources Management

1
School of Engineering, Basilicata University, Viale dell’Ateneo Lucano 10, 85100 Potenza, Italy
2
Department of Mathematics, Computer Science, and Economics, Basilicata University, Viale dell’Ateneo Lucano 10, 85100 Potenza, Italy
3
Environmental Engineering Services Srl—Academic Spin off, Basilicata University, Via delle Medaglie Olimpiche 38, 85100 Potenza, Italy
*
Author to whom correspondence should be addressed.
Water 2017, 9(9), 699; https://doi.org/10.3390/w9090699
Submission received: 23 June 2017
/
Revised: 19 August 2017
/
Accepted: 6 September 2017
/
Published: 13 September 2017
Abstract
:The present paper proposes a mobile prototype platform, based on Augmented Reality and multimedia smart-phone technology, which operates on a combination of real environment and computer-generated data in order to increase the human perception of a scene in real time. By enhancing visible details and displaying invisible or inexistent objects, this platform could improve water monitoring activities as well as the understanding of physical processes by technical and non-technical mobile workforces. At the same time, such a tool might support decision-makers in choosing strategies and actions aimed at forecasting, preventing, and mitigating environmental risks. A preliminary validation of the prototype performance was carried out in the field of water management, specifically for sample basin of Southern Italy. During the testing phase, this innovative application showed its ability to speed up field surveys, easily move around in unknown or remote places, and allow the employment of less-specialised users. These results could help reduce the time and costs of water monitoring activities, which would be perceived as essential by local administrators, contributing thus to the safeguard and the correct use of water resources.
1. Introduction
Correct water management is fundamental to improve policies of its usage, reduce leakages, and combine prevention and defence actions against potential environmental degradation and disasters. The availability of water resources is of vital importance around the world, not only for developing countries. Today, there are more than 748 million people who cannot use drinking water with continuity, and almost 55% of irrigation water and a third of that for domestic use and industrial production is currently lost, not only due to a real material lack, but mainly to inefficient distribution and use [1]. It is in this context that resource protection, control, and management actions are fundamental to eliminate problems such as water over-exploitation and pollution, as well as to reduce the inefficiency of the supply systems. A great intervention is thus advisable to protect the environment and support sustainable development policies, beginning from the use of new technologies and the adoption of advanced monitoring and control techniques.
Water monitoring demands field surveys and storage of environmental and spatial information in a digital database. Currently, although almost all the information is processed on computers, for example through the use of Geographic Information Systems (GIS), the visualisation of spatial and environmental data during field surveys still demands the use of conventional maps and reports. Therefore, there is a remarkable gap between desktop GIS technology available in the office and access to this information in the field.
To fill this gap, this paper proposes a prototype platform providing mobile field workers with a useful tool that is able to facilitate the visualisation of the surroundings, provide relative information, and minimise the need to read maps and documents during monitoring and controlling activities [2].
The present application uses Augmented Reality (AR) as the main vector. AR is a field of research which deals with the combination of real environment and computer-generated data to increase human perception of a scene in real time, enhancing visible details and displaying invisible or inexistent objects. This virtual-real merge is achieved via the appropriate Graphical User Interfaces (GUIs) on portable devices (smart phones, tablets, etc.) hand-held by the user [3]. AR is a technology that has already been successfully employed in marketing and advertising, the entertainment industry, medicine, architecture, the military, construction work, and other fields [4], but its usage in water monitoring is still restricted, despite its renowned utility during field surveys ([5,6,7,8], to name a few).
In 2009, Centeno et al. [5] developed an AR prototype to visualise the position of measurement points and the results of models related to water quality, overlaid onto natural scenes captured by a digital video camera during field surveys. The performance of the prototype was then tested by simulating field surveys in a sample watershed. The success of the experiments was limited due to two main restrictions: firstly, the device needed to be oriented, using a compass, before being used; secondly, the device had a tendency to drift over time and had to be reset through a button or software. Schall et al. [6] used a mobile AR technology for interactive 3D visualisations of local underground network infrastructures on the user’s hand-held device, a location- and context-aware system for on-site visualisation and interaction, which addressed the workflow optimisation of common field tasks with utilities. Later, Haynes and Lange [7] presented an interactive AR tool for visualising flooded environments with occlusion geometry, already discussed by Coelho [8]. The main aim of these works was to raise citizen’s awareness of potential construction dangers within local flood zones. The literature works here mentioned focused mainly on ordinary water management tasks in field and do not make use of AR technology to support actions immediately before, during, and after extraordinary events.
The proposed application is not only able to support both technical and non-technical workers during ordinary field activities, but also helps them to move quickly within the critical areas during a flood event. In fact, thanks to its fast interaction with numerical models [9,10] and other sources of information, it shows timely and continuous up-to-date augmented information on various vulnerability scenarios during the emergency phases, speeding up decision-making processes and thus potential interventions. The first version of the application was discussed by the authors in Reference [2]. At the time, it had been tested only by the software developers, not by the public, and only in well-known and easily accessible areas, but only outside the urban centre, using a limited number of mobile devices. In particular, these tests underlined some constraints related to the need of a more immediate visualisation of the shortest path, the lack of a simultaneous visualisation of different information associated to the real elements, called Points of Interest (POIs), and the difficulty in using the AR system in slow- and no-network conditions, as the offline mode had not yet been implemented.
The version of the application described here does not show the previous limits, and its performance was later validated by ordinary field activities and simulated floods in a sample basin in Southern Italy, involving a larger number of users outside of the software developers. During these tests, the application showed the following advantages:
- −
- it is able to speed up monitoring and controlling activities;
- −
- it allows one to reach the most critical areas during flooding more easily;
- −
- it reduces field activities costs thanks to the possibility of employing less-specialised labour;
- −
- it improves the decision-making process through faster interventions;
- −
- it enhances the overall knowledge of environmental phenomena and physical processes;
- −
- it helps on-site inspections and the fault management of gauge stations spread over the river basin, as well as the control and maintenance of works interacting with the flow (e.g., weirs, dams, gabions, piles of bridges, etc.);
- −
- it makes not-well-known or difficult-to-locate study areas more accessible.
The outline of the paper is as follows: in Section 2, the application architecture and the user modes are described; Section 3 deals with the application functionality in field; the tests on the real cases and the simulated ones are shown and discussed in Section 4; the main findings of the present work are summarised in Section 5.
2. Software Architecture and Its User Modes
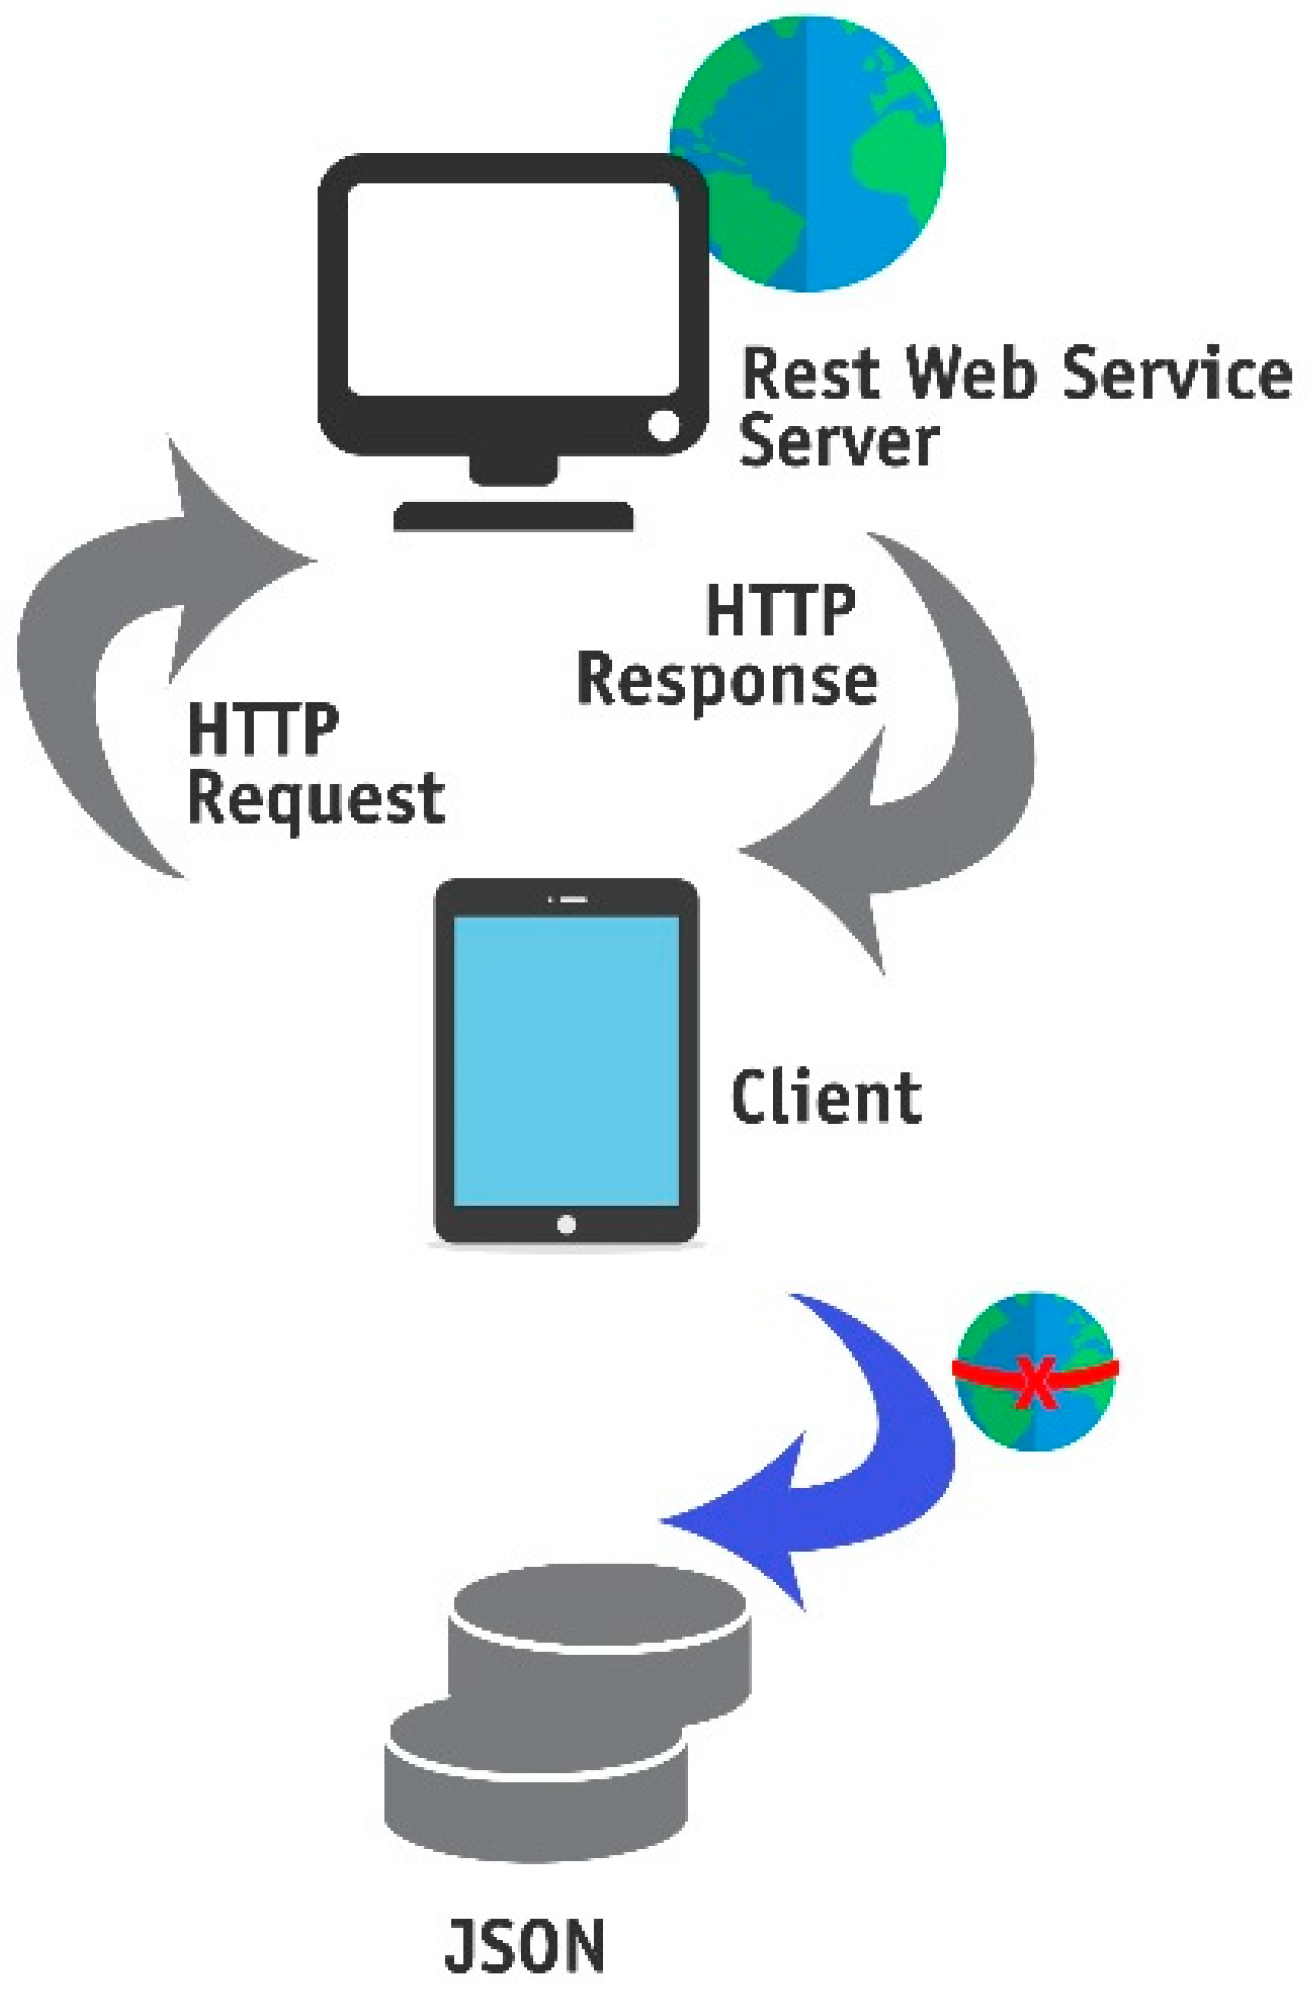
Through the use of Augmented Reality, an application able to visualise geo-referenced sensor measurements and integrate simulation data of hydraulic and hydrological models was implemented. Developed in the Metaio framework, it runs on mobile devices equipped with a webcam and sensors, such as a gyroscope, a compass, and a Global Positioning System (GPS). It is based on a multi-tier system architecture with a mobile front-end and an operational geospatial database as the back-end (Figure 1). The mobile front-end is a hand-held client device (i.e., a smart phone or tablet), designed as a see-through screen, interacting with a server application (Web Service) through messages. Upon the client’s request, the Web Service queries the database, which sends the retrieved information back to the client. Hence, the client device interprets the response showing the surrounding scenes assembled in real time by merging continuously streamed video footage with geo-referenced computer graphics, considering the client’s tracked position and orientation. The system ensures that the virtual objects overlaying the real scenes adjust continuously on screen as the user moves around.
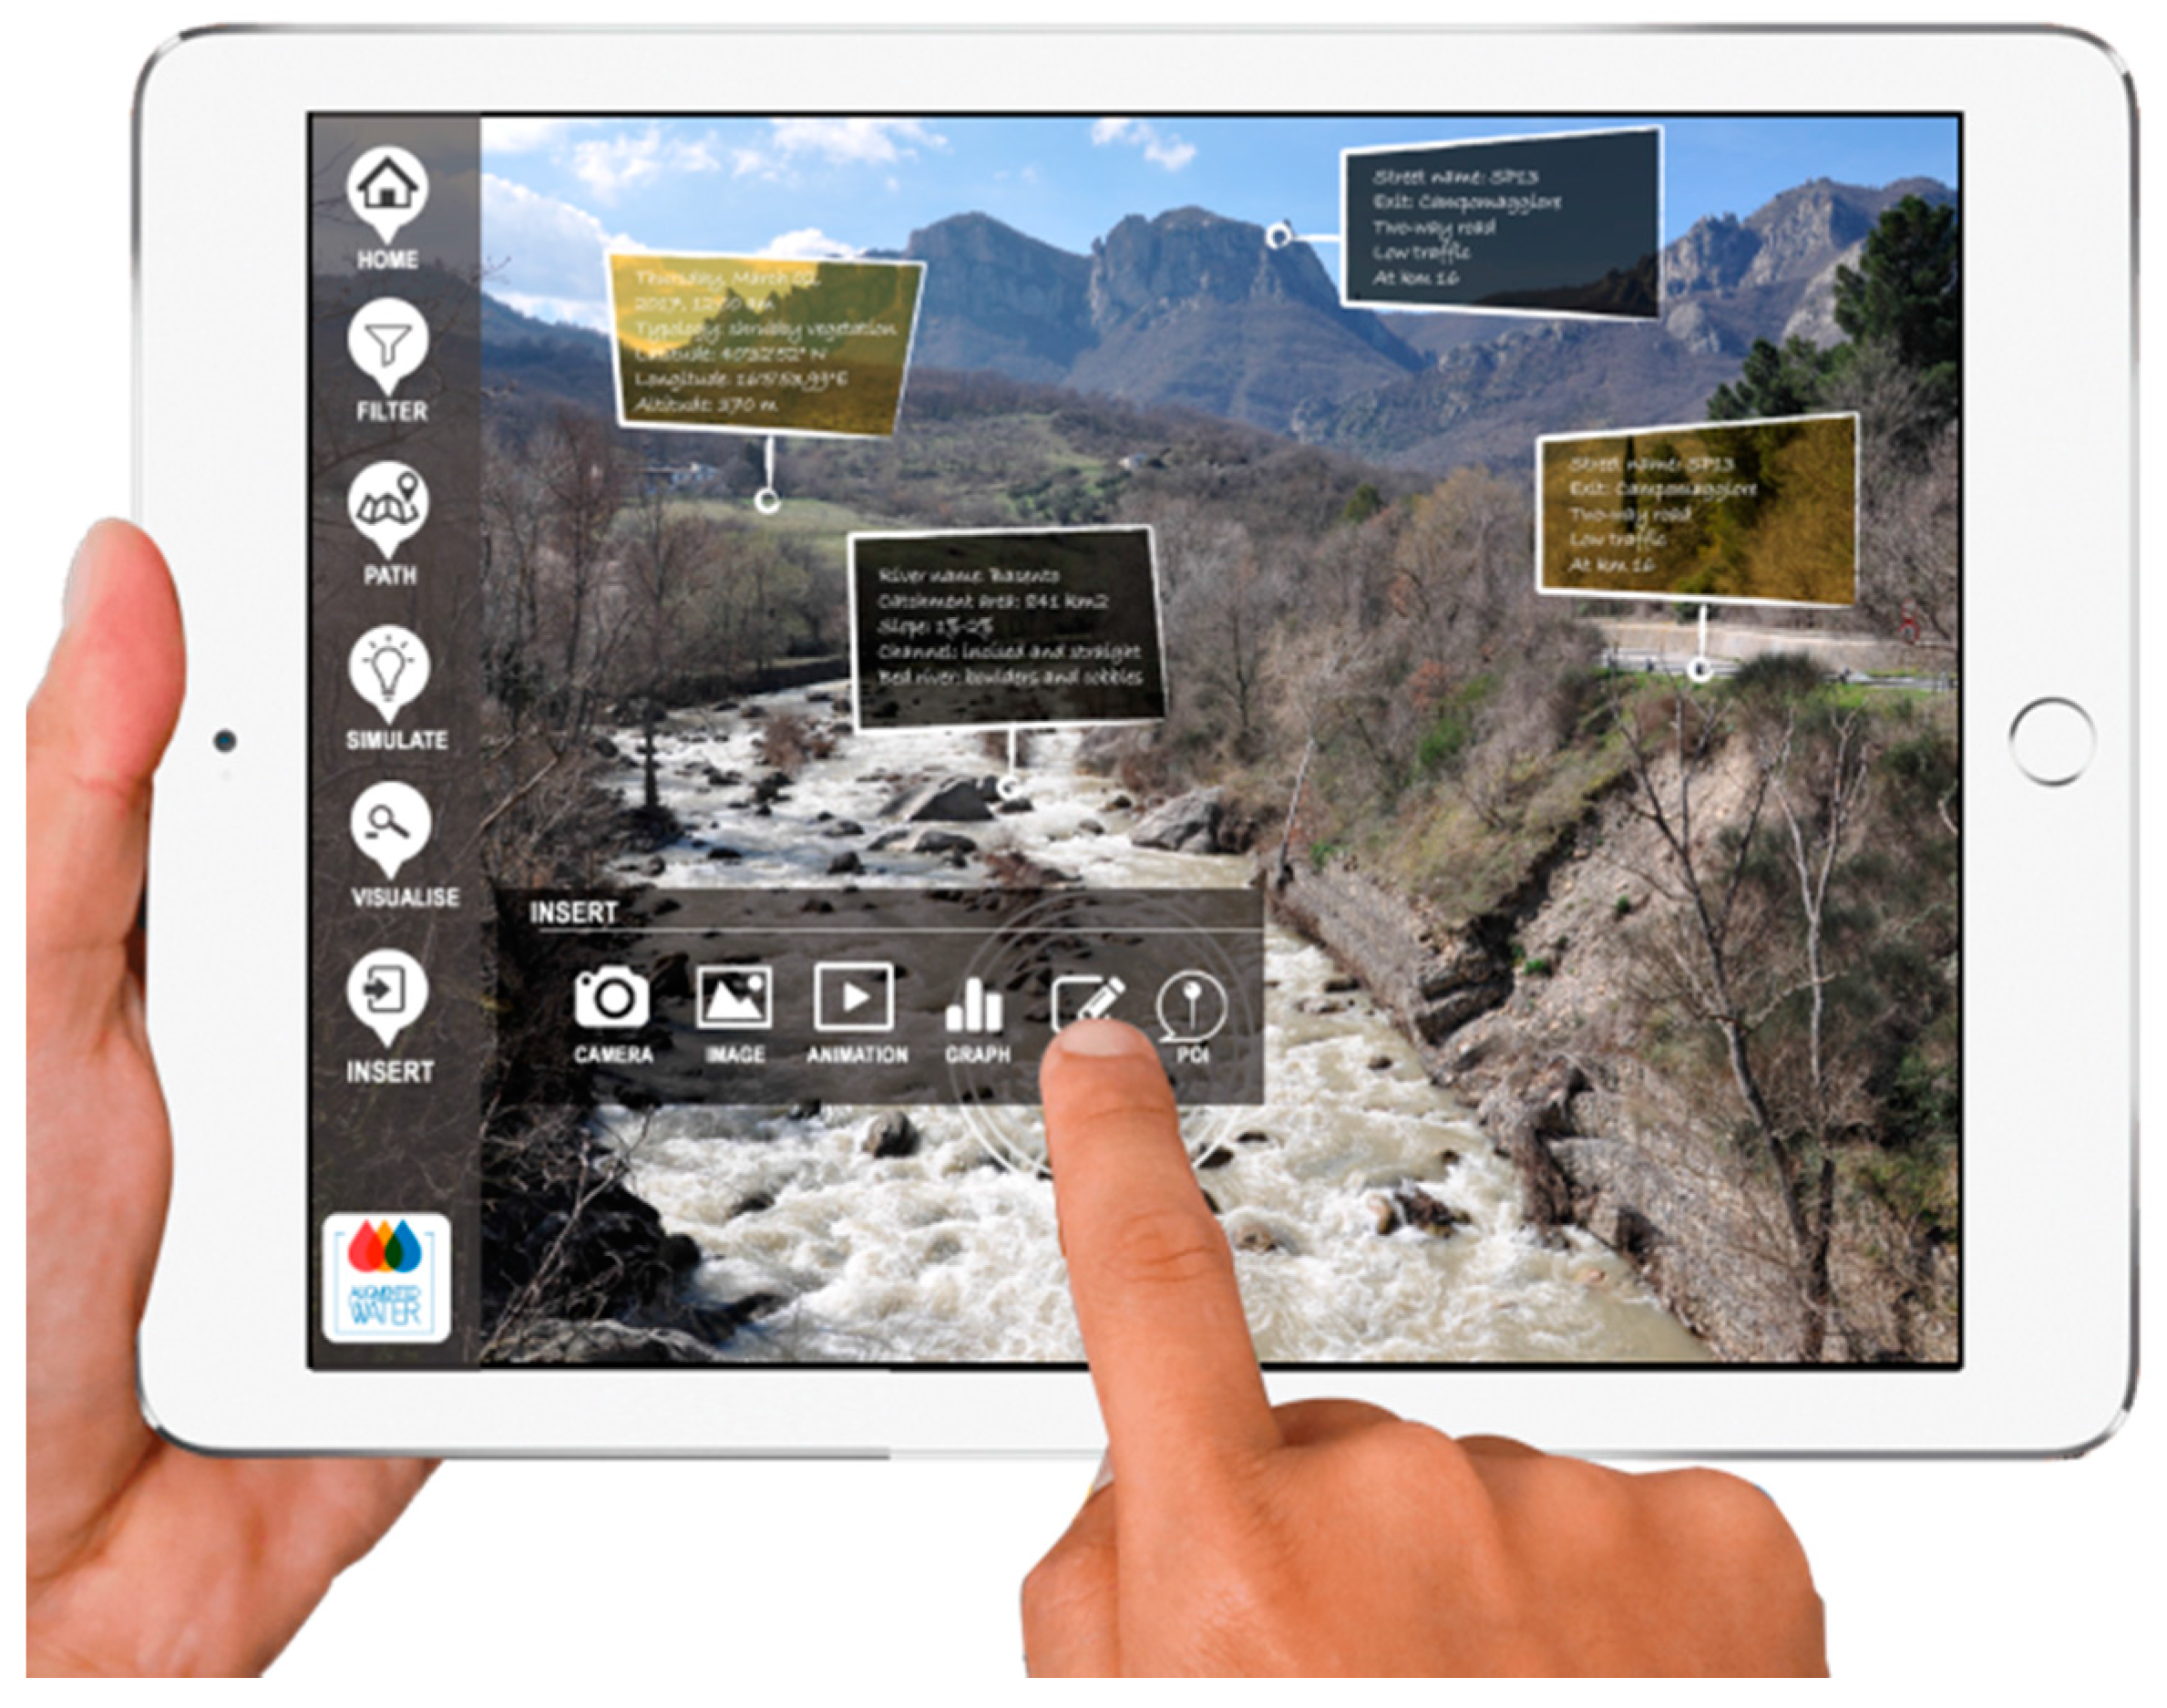
This architecture associates database information to POIs. A POI is represented by a marker detected through geographic coordinates (latitude, longitude, and altitude), corresponding to locations such as a road, a bridge, or a specific address, and displayed by a graphical symbol on a mobile device. In this paper, the POIs are gauge stations or structures/infrastructures within the chosen basin, captured by the mobile device camera and displayed as billboards overlaid onto a scene (Figure 2). Billboards are icons that take different shapes and colours, each associated with a label that shows different data, such as the distance between the mobile device and the POI or the instantaneous data acquired by the sensor. Furthermore, the platform, together with the POIs, provides images, graphs, videos, notes, tables, and more associated information, as well as POIs on 2D or 3D maps, which allow the user to move easily, to integrate the existing information seamlessly, to import new POIs into the database, and to export data and metadata out to other programs and software.
The application was set for two user modes: the online mode, which allows for the visualization of updated data of a remote database, and the offline mode, which shows previously saved information on the mobile device ready to be used even in no-network conditions.
More specifically, the online mode requires web service, which provides the user location and the different POIs in the surrounding circular area, whose radius is equal to the distance selected by the user. Thanks to this filtering operation, the interaction between the user and the information becomes easier, avoiding the visualisation of too many overlaying images. When the user approaches a certain POI, the surrounding circular area modifies and new POIs can be found.
In the offline mode, the application obtains information from previously saved files (in json extension) on the mobile device (Figure 1). Before a survey, for example, the user can download all the augmented information about the POIs, saving all data and metadata on the mobile device, so that they can be retrieved once in field and in slow or no-network conditions. The same data will automatically update as soon as the network returns.
3. AR Application Functionality in Field
The target of this application is to keep contact with the complex real environment by displaying simple computer-generated elements. Therefore, the virtual objects modelling step was relatively easy, compared to the display of too realistic and detailed objects. This way, thanks to the option of visualising the location enhanced through the simple modelling, field workers can recognise and reach the POIs more rapidly. The hydrometric gauge stations located along the river are represented through coloured drops (Figure 3) which allow for the visualisation of the POI locations as well as the relative distance and direction. This is possible because the drops are oriented according to the user’s position and the visualisation perspective through the mobile device screen, and they also progressively increase in size as the user approaches the POIs, showing the user-station distance in real time (Figure 3).
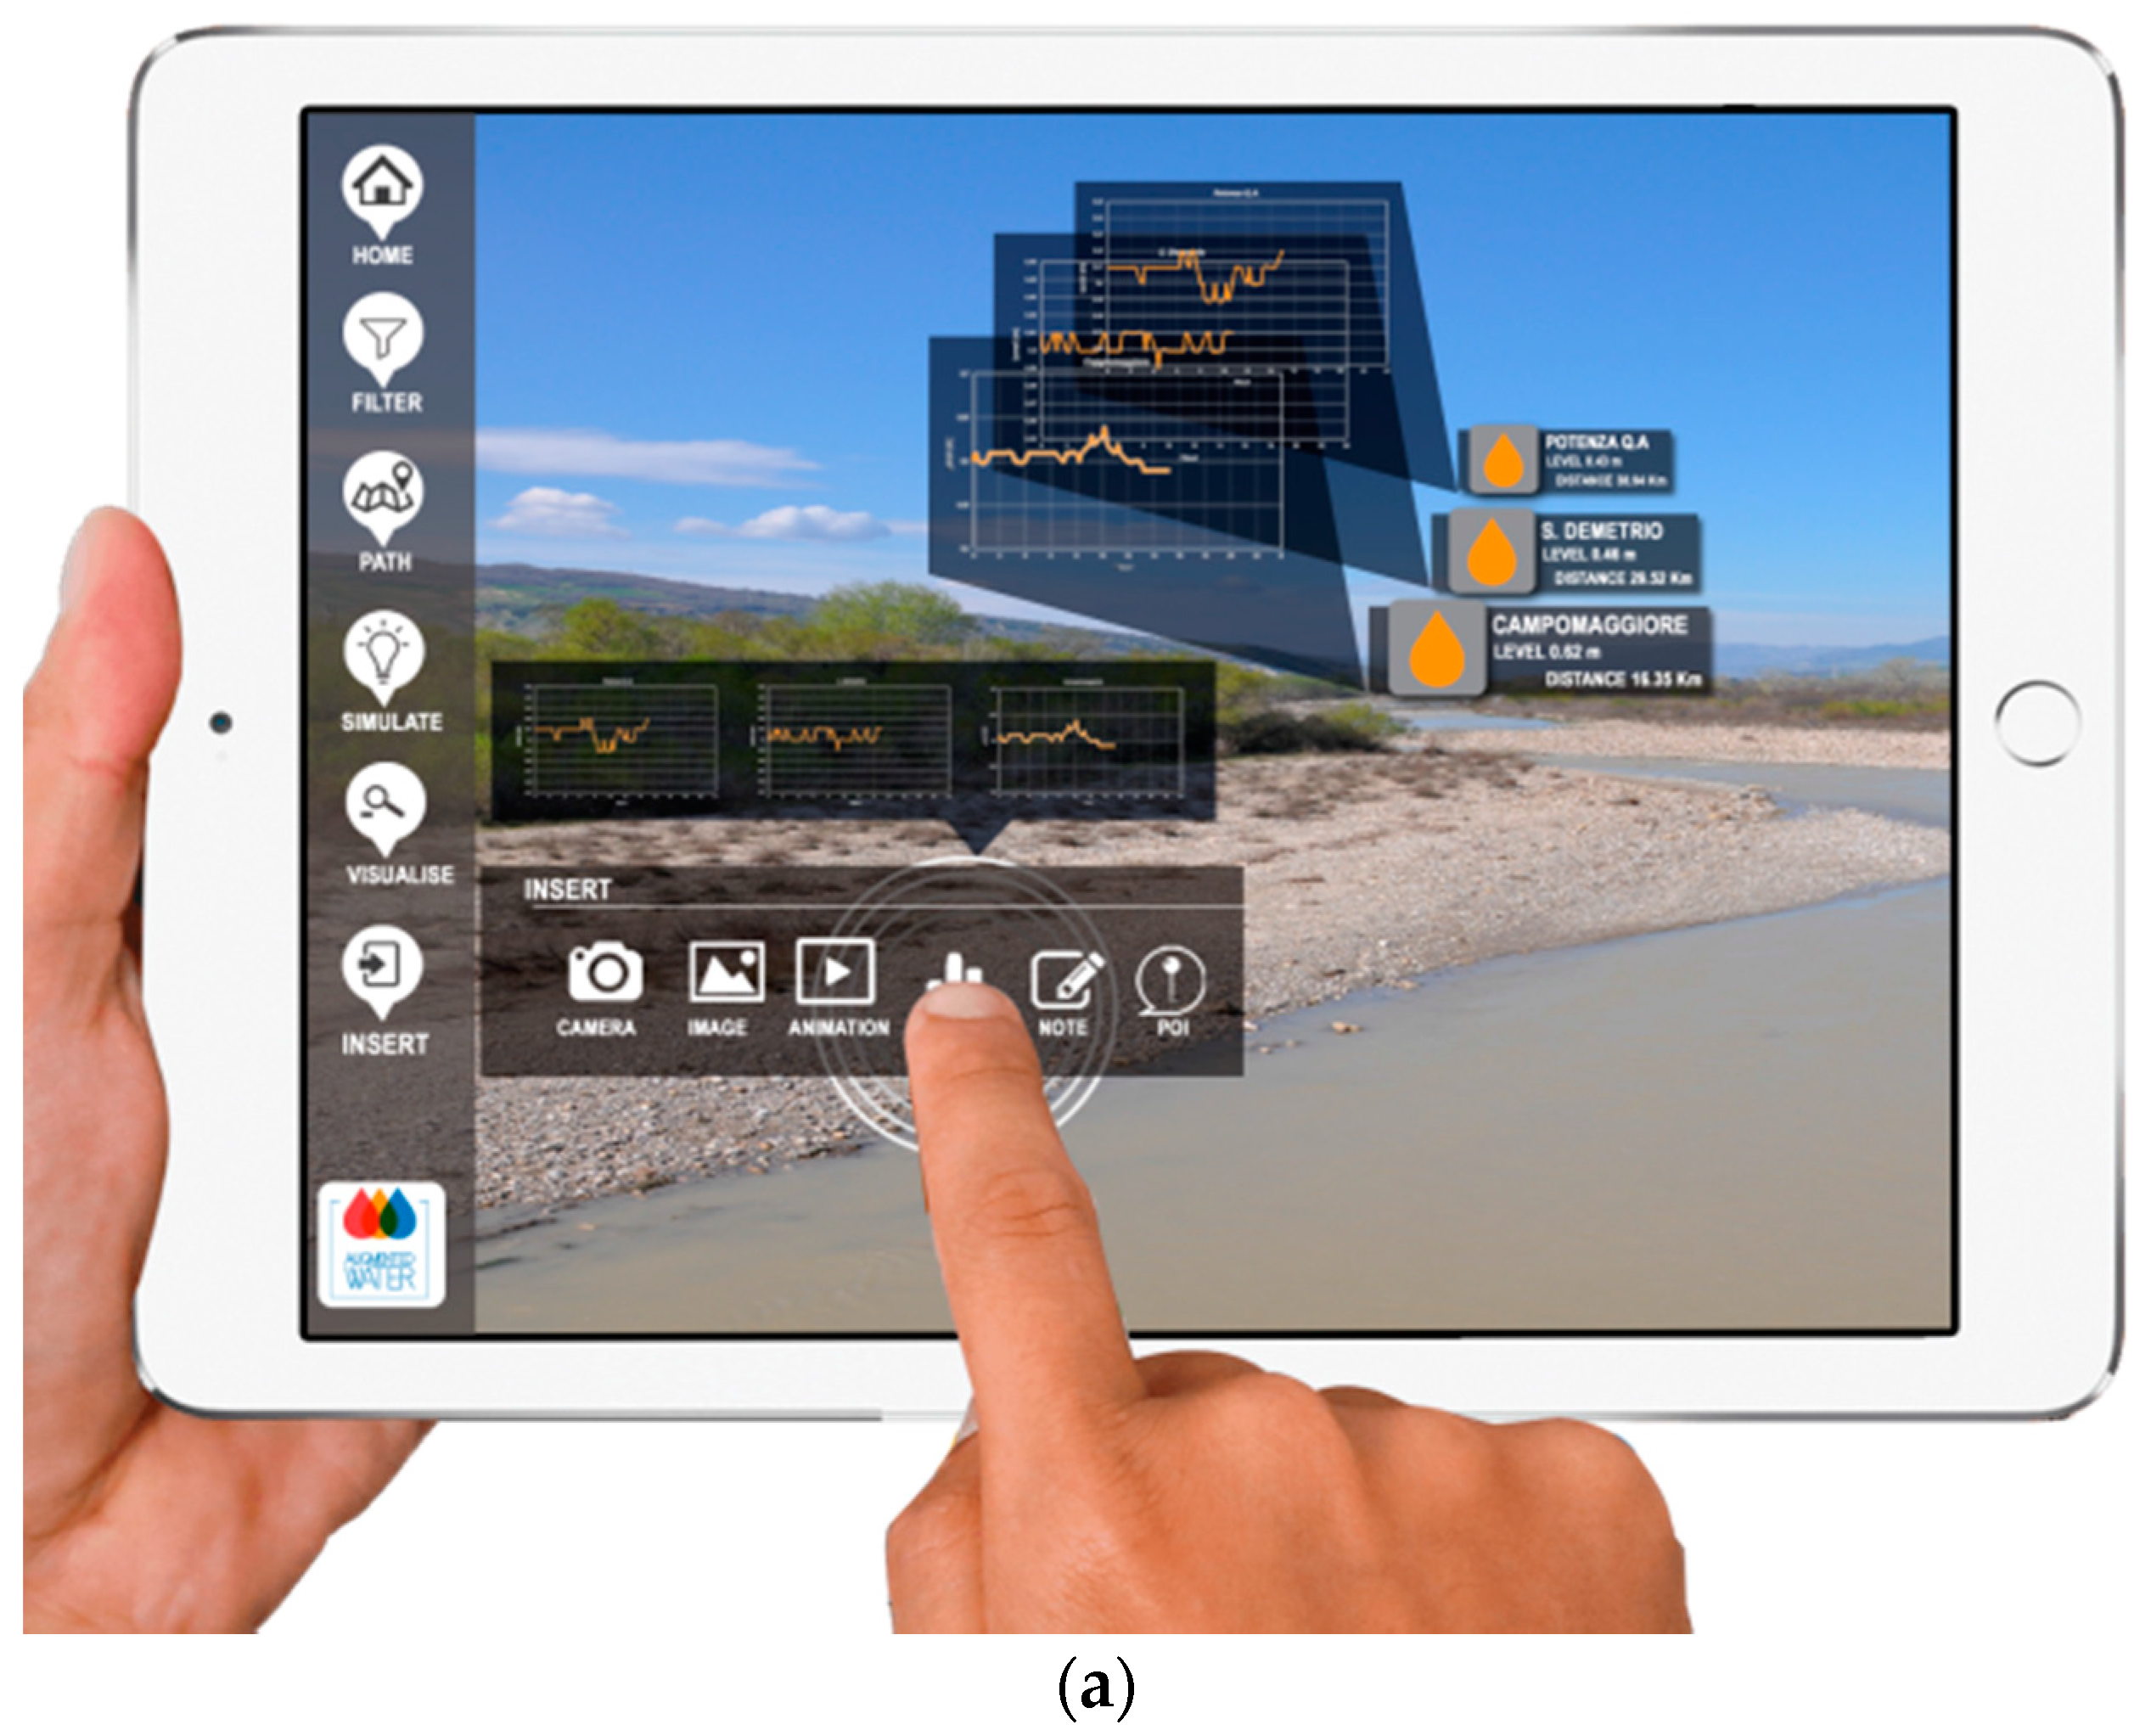
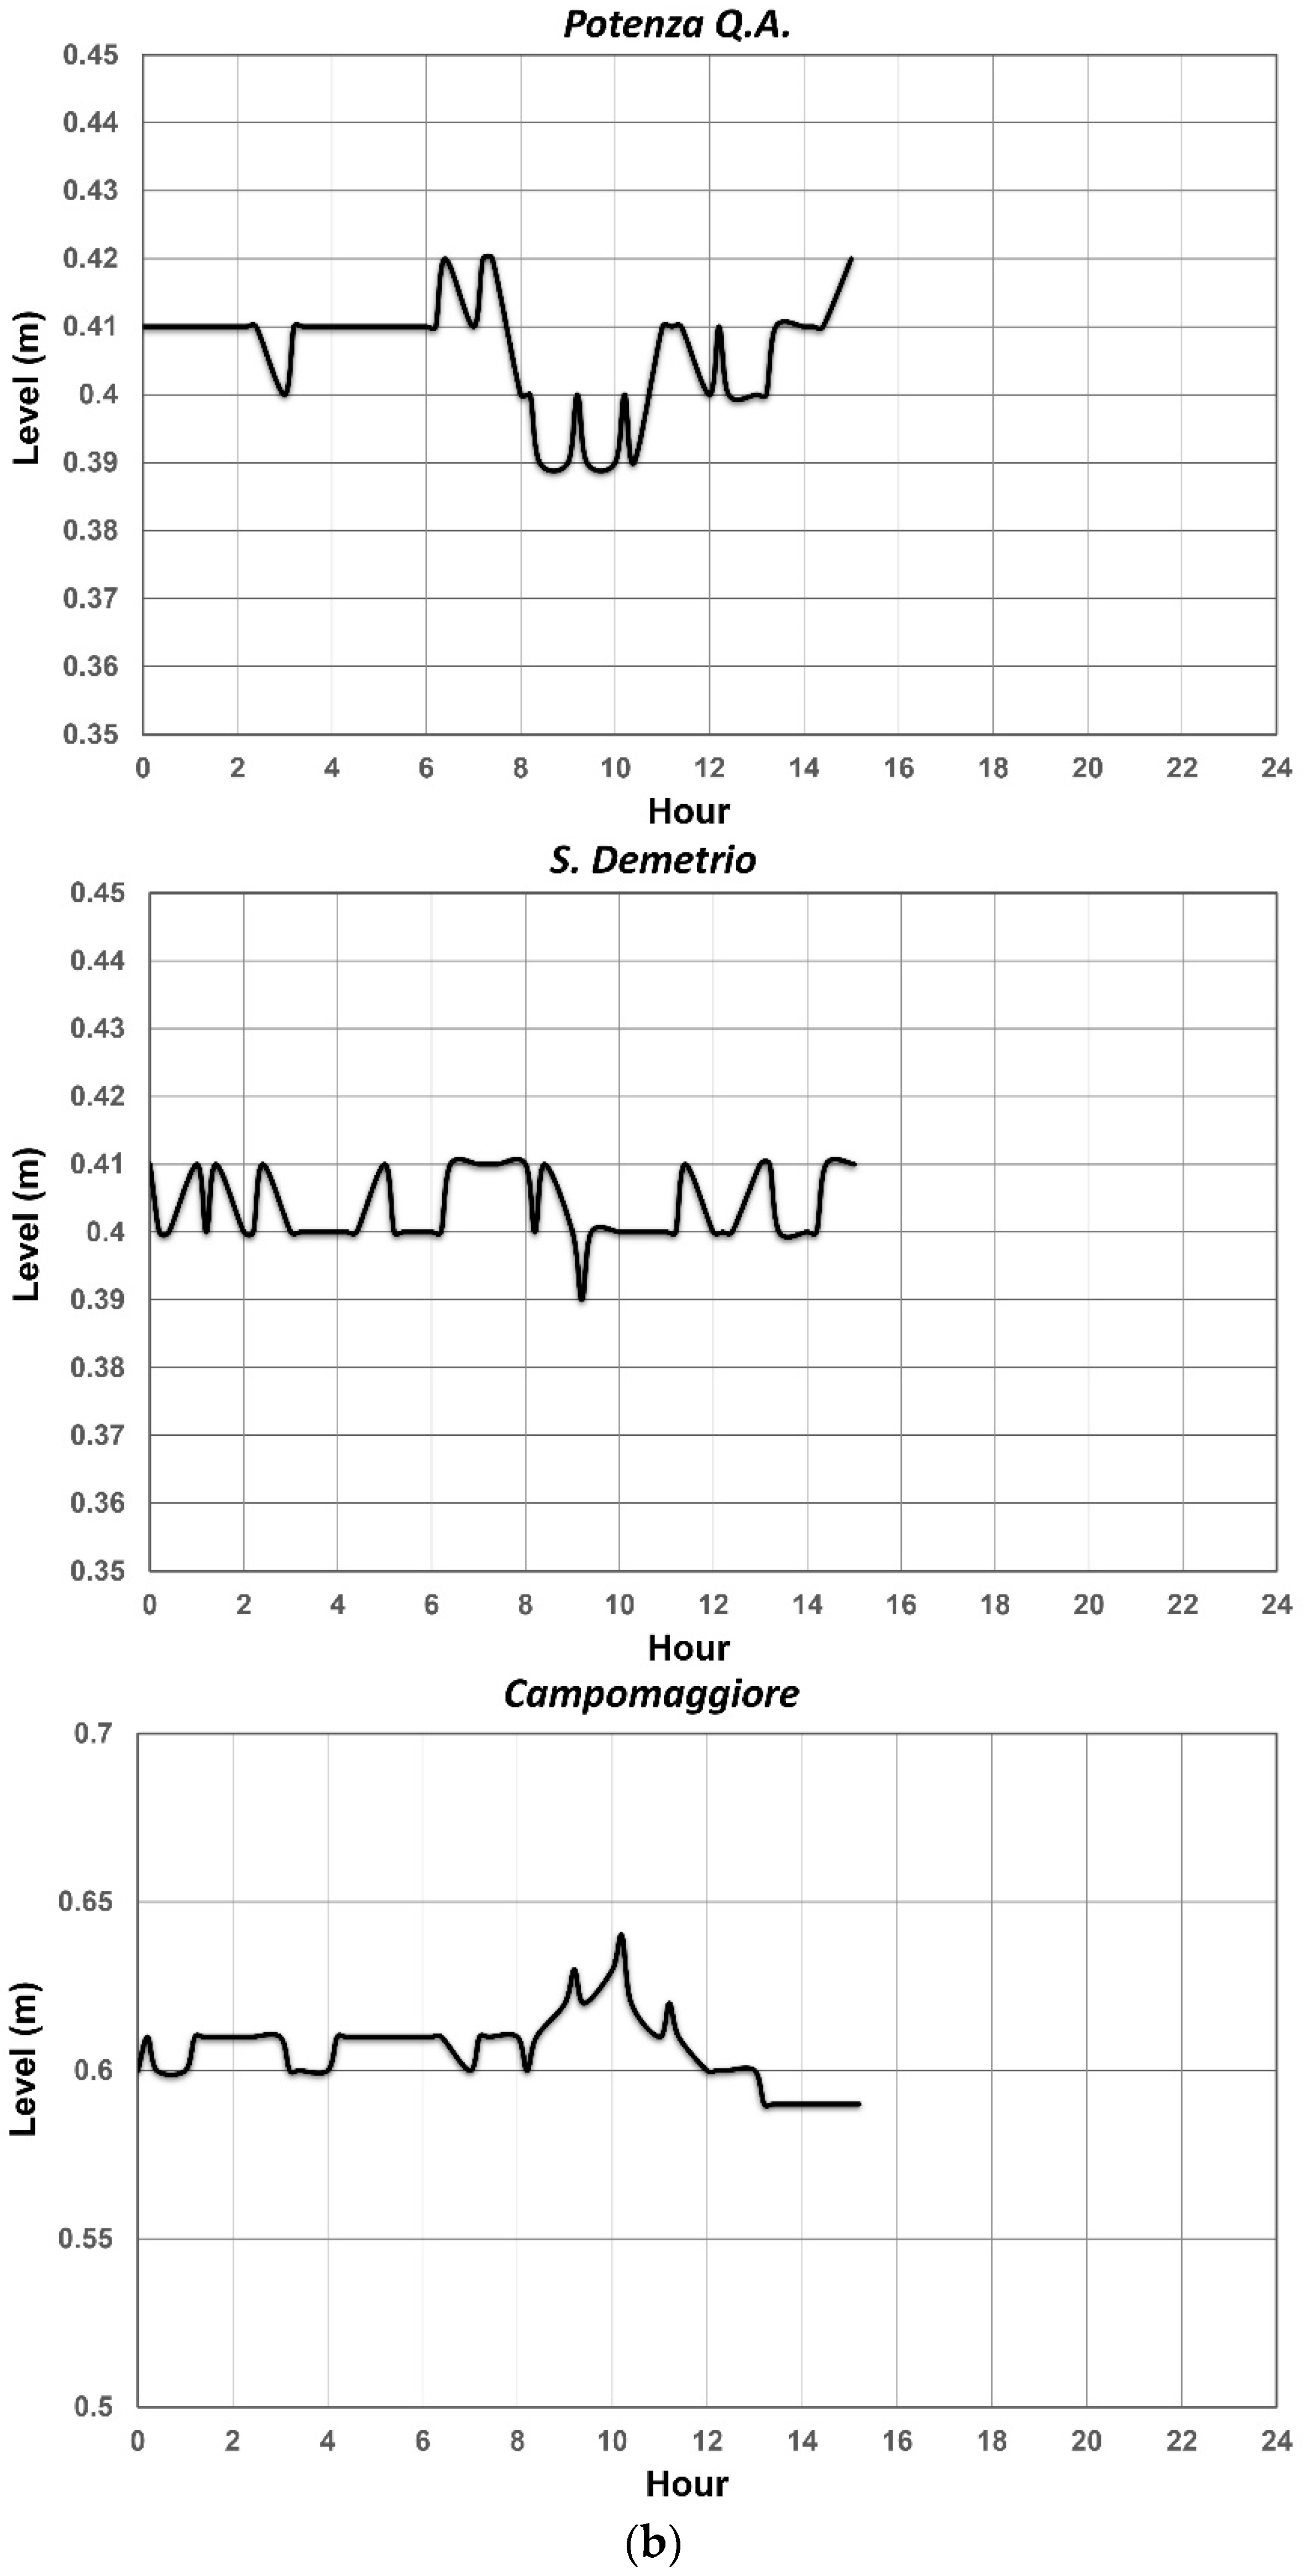
In addition to these functions, simply by clicking on the icon of the specific gauge station, users can analyse the trend of the recorded hydrometric levels, using plots previously generated at predefined time intervals by the server, from the regional Civil Protection, and transferred to the hand-held device upon request (Figure 4a,b). An interesting aspect to note is how, from the simultaneous trend observation of multiple stations, users can compare them in order to better understand the development of the phenomenon.
Even the interactiveness is increased by the application association of more information to the station, such as photos, images, videos, animations, and notes carrying indications of the previous field activities (Figure 5). Furthermore, by calculating the shortest path to reach the POIs, the application allows the users to quickly find and reach the detected hydrometric stations and structures/infrastructures (Figure 6).
The application was also developed to simulate real emergency situations, i.e., a flood event. Two key concepts that drove the design and the implementation of the simulation are the POIs, already described above, and the scenario. The latter is essentially the state of the real and the virtually modelled objects at a given point in time. In detail, the application represents the scenario as a snapshot of the hybrid world—composed of the simulated world, generated by the output of analytical and numerical models, and the real world, captured by a device camera at every time unit.
Since one of the objectives of this study is to validate AR technology during a flood event in order for workforces to move more easily within critical areas, the application displays different vulnerability scenarios for some parts of sample basins, built on the results of hydraulic models based on the measurements of gauge stations located along the river. In particular, through expeditive mathematical models based on the entropy theory [11,12,13,14,15] which calculate the water discharge, the hydrometric station criticality level, represented by differently coloured drops on the hand-held device, is detected. The colour of the drop can be either yellow, orange, or red if the values of the water depth acquired by the gauge station have reached the ordinary, moderate, or high criticality threshold, respectively.
Subsequently, from the simulation output of hydraulic models, the platform shows differently coloured symbols representing the structures and infrastructures within the flood-prone area (Figure 7). For instance, the yellow, orange, and red symbols show that the POI is located in an area not at flood risk, at moderate, or at high flood risk, respectively.
Table 1 reports the summarised application features.
4. Validation and Discussion of Results
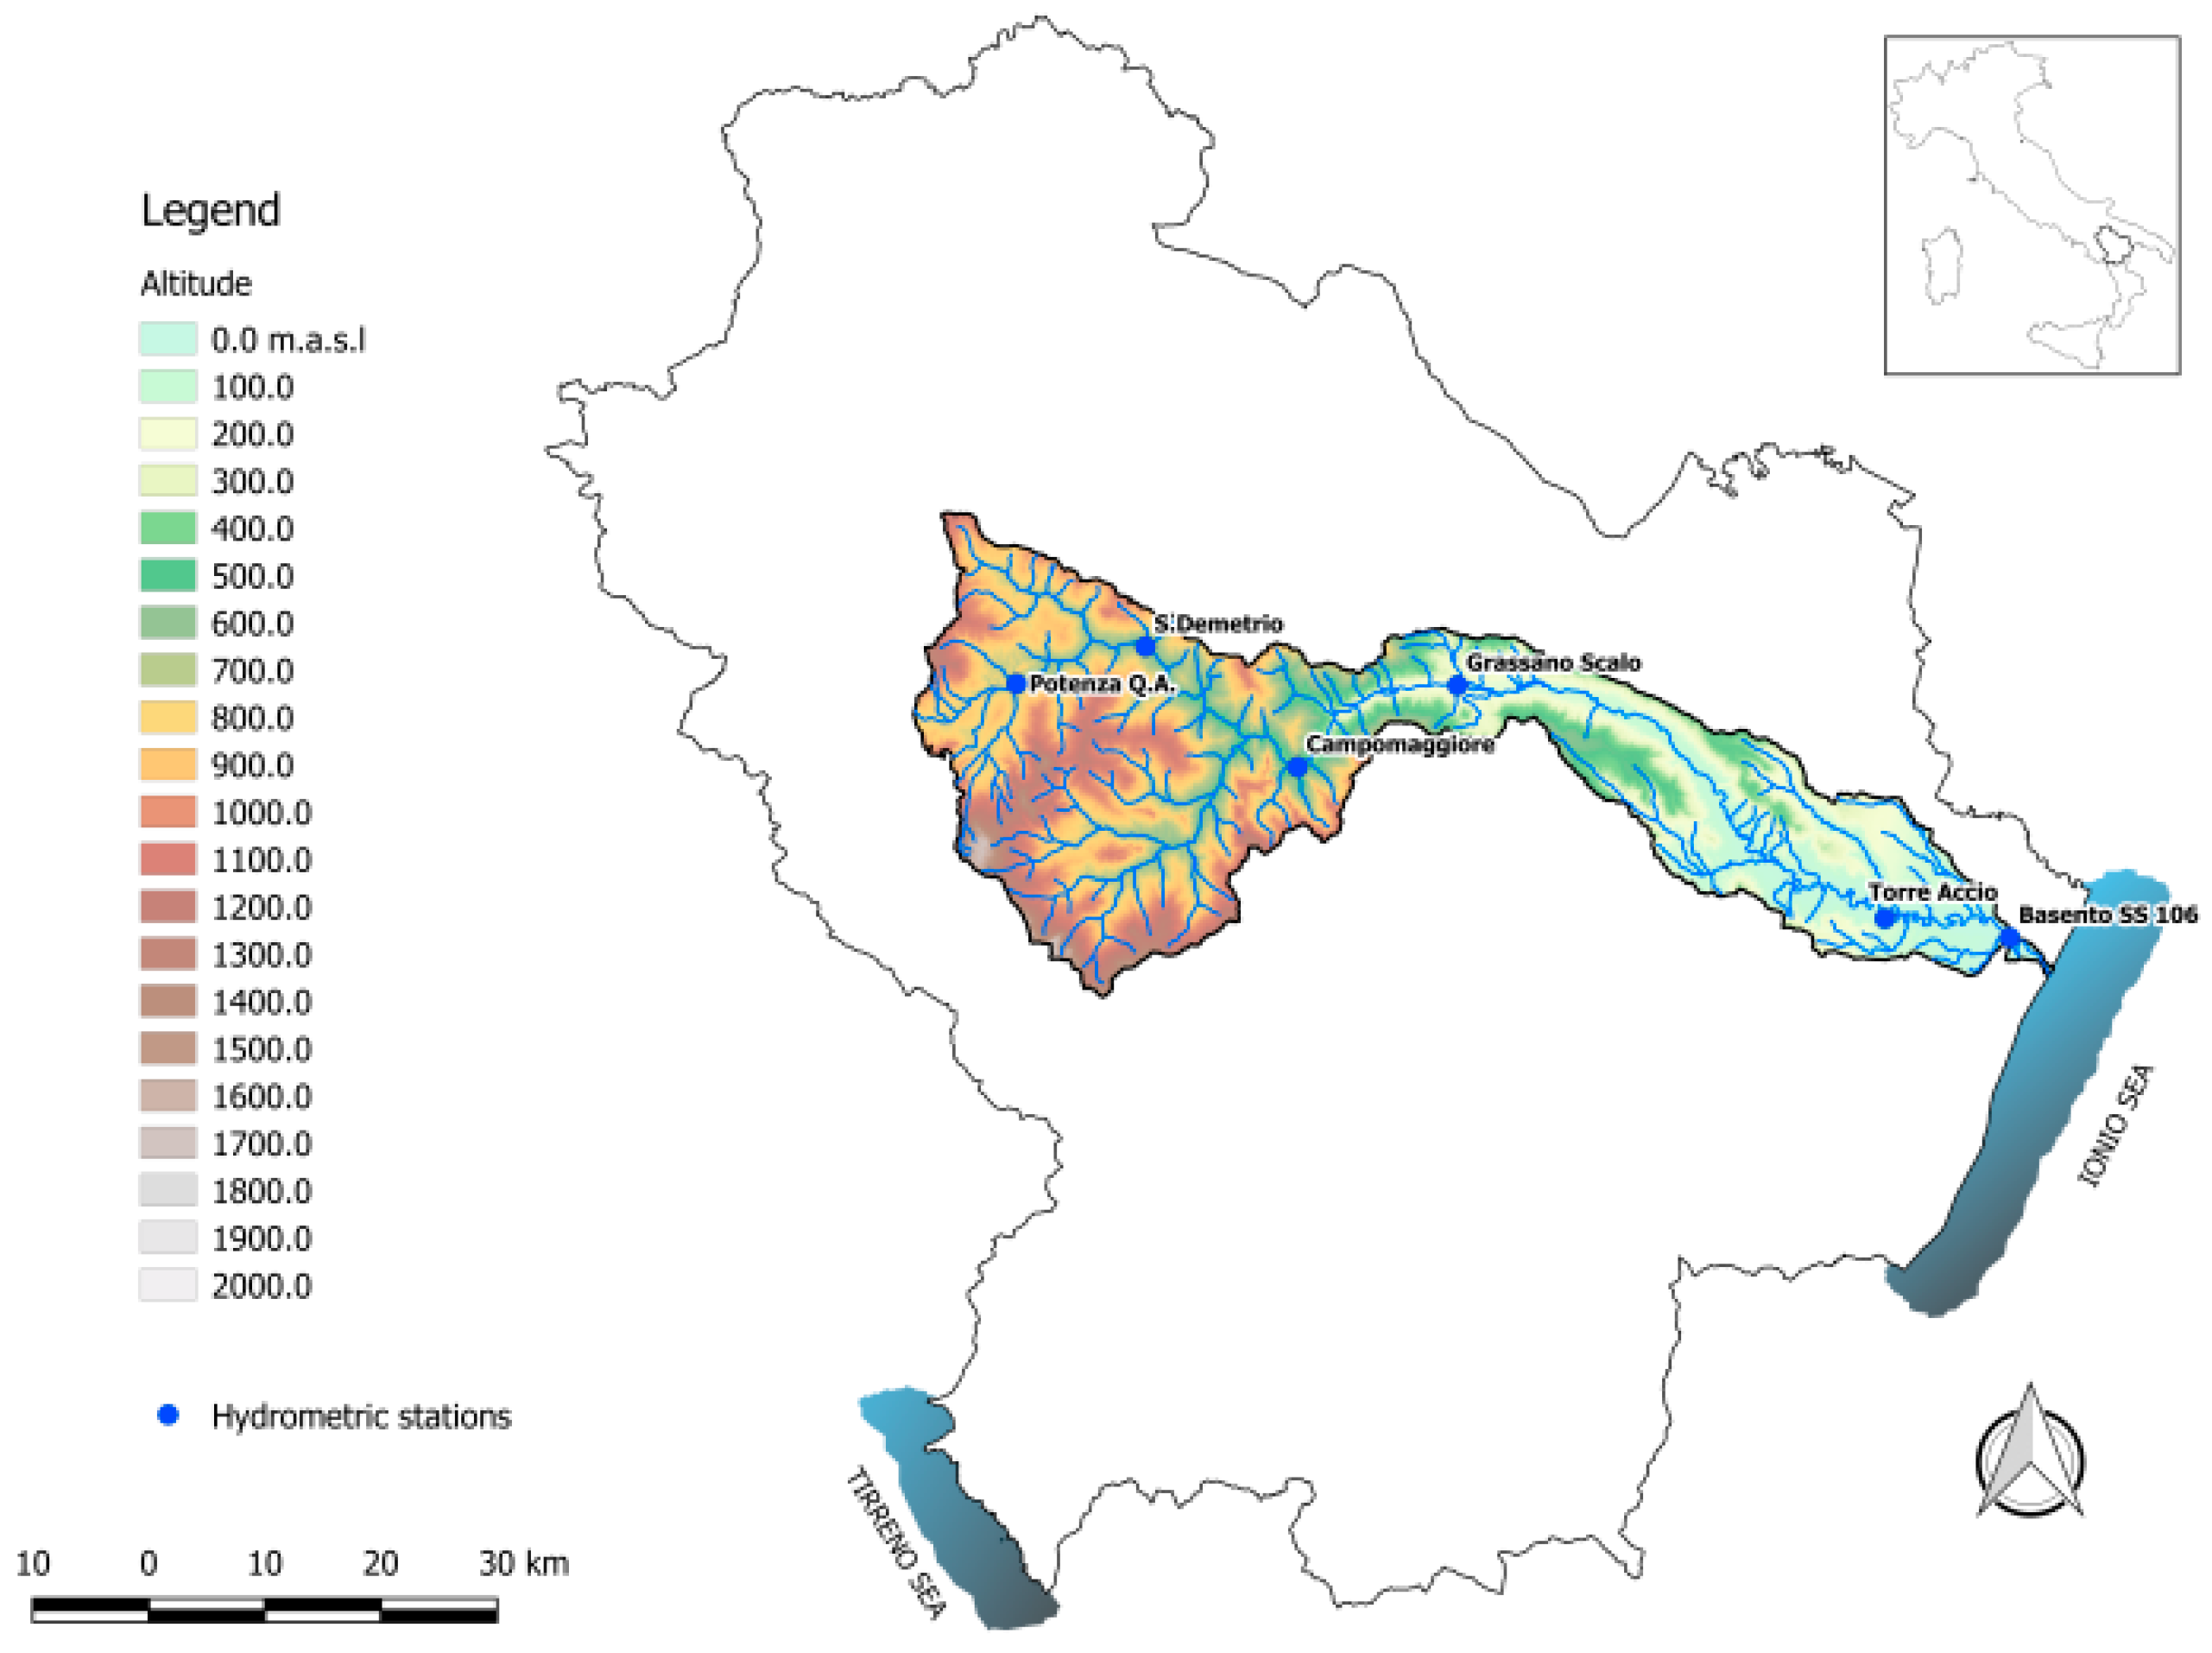
The application performance was validated in a sample basin, the Basento, (Figure 8), one of the main rivers in the Basilicata region (Southern Italy), considering two different scenarios: ordinary surveys in some areas of the sample basin and simulated emergency situations caused by potential floods.
The testing phase occurred over a period of about four months, recruiting 40 users of different backgrounds and IT knowledge levels, both among the technical employees in the forecasting and prevention of natural hazards, first aid and emergency management departments, and some non-technical volunteers of the regional Civil Protection.
Before the start of the tests, all users attended a brief introductory course on the use of the application and its functions. In field, the users were divided into groups of 4–5 people, each led by an expert among the software developers. At the end of the tests, the users completed an extended questionnaire (Table 2), which included four sections about the application content quality, system quality, service quality, and limits, each made of three-four measurement items. All items used a five-point Likert assessment scale, ranging from 1 (“strongly disagree”) to 5 (“strongly agree”).
In general, the AR application here developed was rated from good to very good. Without exceptions, all participants, both technical and non-technical, were enthusiastic about the easy access and the clearness of virtual objects visualisation on the mobile screen (μ = 4.05, σ = 1.01). The users found the texts and numerical data to be well readable (μ = 3.85, σ = 1.05), and the images and plots quality (μ = 4.00, σ = 1.04) to be acceptable. The system was perceived as very simple to use (μ = 4.15, σ = 0.92), being designed to support total immersion applications, especially when the performance of the mobile device was high. Furthermore, participants read and interpreted maps and technical documents (μ = 3.98, σ = 1.03) easily.
With respect to the in-context visualisation, the users were able to quickly reach the POIs in the real world from the information presented on the mobile screen (μ = 4.23, σ = 0.83), even when the places were unknown and not easily accessible.
The communication between the application interface and the models was reliable and fast (μ = 3.50, σ = 1.34). In fact, the platform did not require a high bandwidth connection to download data and metadata from the server onto the mobile device. The sub-optimal performance occurred with a 3G network connection, which was usually enough to completely download images, videos, and notes associated with the POIs, with an average upload speed of 1.57 Mbps and a download speed of 6.27 Mbps. In general, for each POI a data transfer from the server of about 10 Kb was estimated to obtain all visual information required by the client. The optimal performance occurred in a 4G network condition, having an average download speed of 29.12 Mbps and an upload speed of 12 Mbps. This speed will soon increase with the future development of the 5G network.
Moreover, participants found that the integrated visualisation and simultaneous comparison of different sources of information (libraries of photos, images, animations, videos, etc.) enhanced the knowledge of the surroundings (μ = 3.43, σ = 1.28) and could thus represent a major advantage for decision-making processes. Finally, testing the application with different perspectives in the selected area, the users noticed that the platform allowed real-time information exchange (μ = 3.68, σ = 1.27).
However, the tests carried several challenges, apart from the ones related to the understandable network conditions in the online mode, solved thanks to the offline mode option (μ = 3.73, σ = 1.06). The first set of challenges arose from limitations in the device being used, such as processing and storage capabilities (μ = 2.18, σ = 1.03), as well as screen visibility (μ = 2.30, σ = 1.07) and battery life (μ = 2.25, σ = 1.06). To address the restrictions imposed by portable devices, the interface was simplified to contain a minimal set of functions that enabled the user to effectively communicate with the operating centre in the simulation, solving synchronisation issues due to server-client delays in communication and to the different processing capabilities of the client. The screen visibility, under really bright conditions, was avoided using mobile devices with a superior display resolution, a screen light/dark contrast control, and an anti-reflective surface, together with the use of extra and long-lasting batteries. The second set of challenges emphasised the need for a customised view of the simulation based on user’s location and orientation (μ = 2.78, σ = 1.39). This had to be done in real-time so that appropriate contextual information would be sent to the user when needed. Table 3 reports the results of the statistical analysis (mean and standard deviation) based on the scores obtained from the questionnaires.
5. Conclusions
This paper presented a prototype Augmented Reality application specifically designed for monitoring water resources, which allowed mobile workforces to visualise 3D objects as well as textual representations of environmental information in real-time, using a lightweight hand-held computer. In particular, the application guided users towards a correct and fast method for conducting surveys, reducing the possibility of data collection overlapping and improving the decision-making process during ordinary and extraordinary field activities. The overlaying of simple graphic elements on the real scene, in addition to allowing an easier visualisation of the surroundings, minimised the need to read maps and technical documents, speeding up field operations. In good network conditions, the interaction between the platform and the analytical and numerical models or the platform and different sources of information (libraries of photos, images, animations, videos, etc.), was optimal, increasing the reliability of collected measurements and of the models output, and creating new possibilities for data analysis. Furthermore, the simultaneous visual comparison between different data from multiple sources enhanced the knowledge of environmental phenomena. Besides, the platform helped the workforces, especially when they visited study areas which were not well-known or where some elements were difficult to locate because of the presence of thick vegetation.
However, the real and simulated tests demonstrated that the use of smart phones or tablets in the field is not without problems. Mobile devices needed a lot of power and their batteries were quickly drained. Screen glare was another issue, which varied according to the type of phone and the tested environments. These matters were avoided by using more batteries and high performance hand-held computers. With the hardware advancements, the perspective is that the use of such an application will grow considerably in water monitoring and many limits due to technology will be overcome.
In the future, further tests will verify the positional, orientation, and directional accuracy of the AR system in the outdoor environment, the quality and uncertainty of the data acquired by sensors, and the validity of the vulnerability scenarios and their calibration according to the real state of structures and infrastructures within the flood-prone areas. The workforces, including both technical and non-technical operators, could thus benefit from this validation in the following activities: hydrometric levels sampling, defence and protection works status observation and control, survey of flood plains, and hydraulic emergency services.
Acknowledgments
The AR application was developed within the project of Innovation and Internationalisation “Augmented water”—Operative Program ERDF 2007–2013—Basilicata Region in partnership with the academic spin-off ‘Environmental Engineering Services srl.’ and the regional Civil Protection.
Author Contributions
Domenica Mirauda conceived the platform, organised the testing phase and wrote the paper; Ugo Erra and Roberto Agatiello implemented the platform and wrote the paper; Marco Cerverizzo took care of the platform design. All authors contributed to the work.
Conflicts of Interest
The authors declare no conflict of interest.
References
- World Water Assessment Programme (WWDR). Water for a Sustainable World; United Nations Educational, Scientific and Cultural Organization: Paris, France, 2015; ISBN 978-92-3-100071-3. [Google Scholar]
- Mirauda, D.; Erra, U.; Agatiello, R.; Cerverizzo, M. Mobile augmented reality for flood events management. Int. J. Sustain. Dev. Plan. 2018, 13, 3, in press. [Google Scholar]
- Hincapie, M.; Caponio, A.; Rios, H.; Mendivil, E. An introduction to augmented reality with applications in aeronautical maintenance. In Proceedings of the 2011 13th International Conference on Transparent Optical Networks (ICTON), Stockholm, Sweden, 26–30 June 2011; IEEE: New York, NY, USA, 2011; pp. 1–4. [Google Scholar]
- Geroimenko, V. Augmented reality technology and art: The analysis and visualization of evolving conceptual models. In Proceedings of the 2012 16th International Conference on Information Visualisation (IV), Montpellier, France, 11–13 July 2012; IEEE: New York, NY, USA, 2012; pp. 445–453. [Google Scholar]
- Centeno, J.A.S.; Kishi, R.T.; Mitishita, E.A. Three-dimensional data visualization in water quality studies using augmented reality. In Proceedings of the 6th International Symposium on Mobile Mapping Technology, Presidente Prudente, Brazil, 21–24 July 2009. [Google Scholar]
- Schall, G.; Zollmann, S.; Reitmayr, G. Smart Vidente: Advances in mobile augmented reality for interactive visualization of underground infrastructure. Pers. Ubiquitous Comput. 2013, 17, 1533–1549. [Google Scholar] [CrossRef]
- Lange, E.; Haynes, P. Mobile augmented reality for flood visualisation in urban riverside landscapes. J. Digit. Lands. Archit. 2016, 1, 254–262. [Google Scholar] [CrossRef]
- Coelho, H. Erweiterte Realität zur Visualisierung Simulierter Hochwasserereignisse. Ph.D. Thesis, University of Karlsruhe, Baden-Württemberg, Germany, 2005. [Google Scholar]
- Amicarelli, A.; Albano, R.; Mirauda, D.; Agate, G.; Sole, A.; Guandalini, R. A smoothed particle hydrodynamics model 3D solid body transport in free surface flows. Comput. Fluids 2015, 116, 205–228. [Google Scholar] [CrossRef]
- Albano, R.; Sole, A.; Mirauda, D.; Adamowski, J. Modelling large floating bodies in urban area flash-floods via a smoothed particle hydrodynamics model. J. Hydrol. 2016, 541, 344–358. [Google Scholar] [CrossRef]
- Moramarco, T.; Ammari, A.; Burnelli, A.; Mirauda, D.; Pascale, V. Entropy theory application for flow monitoring in natural channels. In Proceedings of the 4th Biennial Meeting—International Congress on Environmental Modelling and Software: Integrating Sciences and Information Technology for Environmental Assessment and Decision Making—iEMSs 2008, Barcelona, Catalonia, 7–10 July 2008; Sànchez-Marrè, M., Béjar, J., Comas, J., Rizzoli, A., Guariso, G., Eds.; International Environmental Modelling and Software Society (iEMSs): Manno, Switzerland, 2008. [Google Scholar]
- Mirauda, D.; Greco, M.; Moscarelli, P. Practical method for flow velocity measurements in fluvial sections. In River Basin Management VI, WIT Transactions on Ecology and the Environment; Brebbia, C.A., Ed.; Wessex Institute of Technology: Ashurst, UK, 2011; Volume 146, pp. 355–367. [Google Scholar]
- Greco, M.; Mirauda, D.; Plantamura Volpe, A. Manning’s roughness through the entropy parameter for steady open channel flows in low submergence. Procedia Eng. 2014, 70, 773–780. [Google Scholar] [CrossRef]
- Greco, M.; Mirauda, D. An entropy based velocity profile for steady flows with large-scale roughness. In Engineering Geology for Society and Territory, River Basins, Reservoir Sedimentation and Water Resources; Lollino, G., Arattano, M., Rinaldi, M., Giustolisi, O., Marechal, J.C., Grant, G.E., Eds.; Springer International Publishing: Cham, Switzerland, 2015; Volume 3, pp. 641–645. [Google Scholar]
- Greco, M.; Mirauda, D. Entropy parameter estimation in large-scale roughness open channel. J. Hydrol. Eng. 2015, 20, 04014047. [Google Scholar] [CrossRef]
Figure 1.
Software architecture.

Figure 2.
Application billboards associated with some points of interest (POIs).
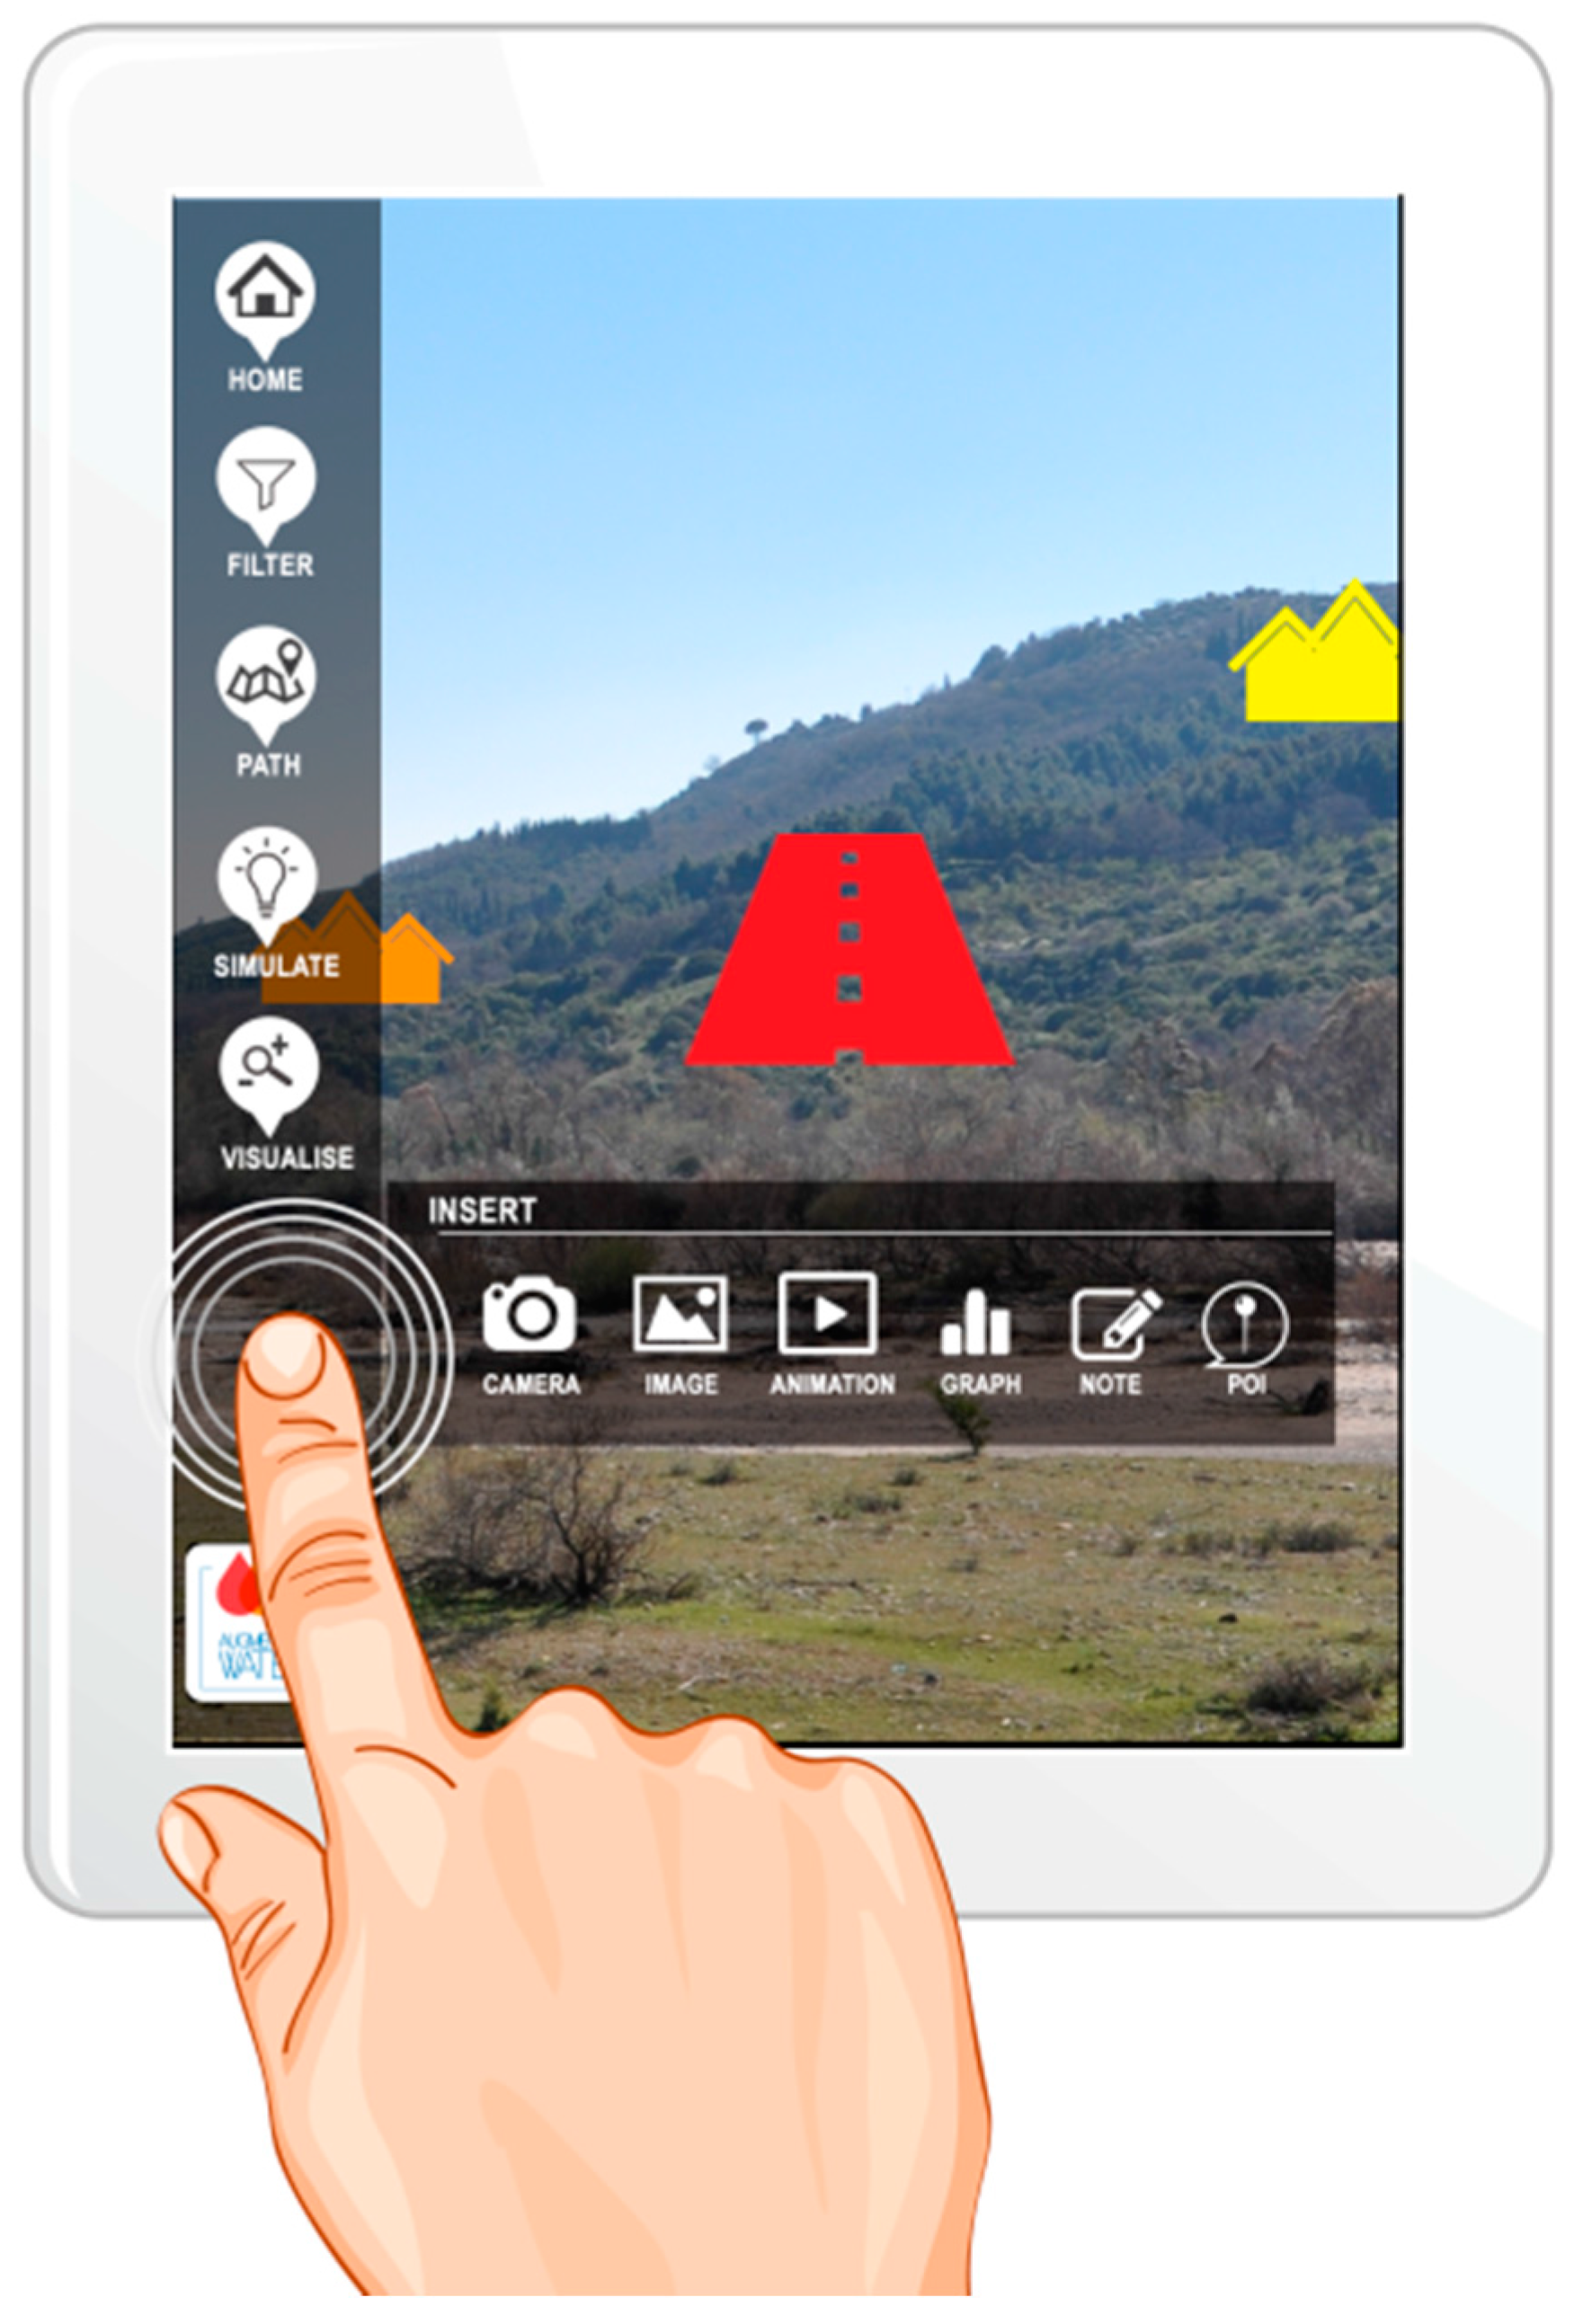
Figure 3.
Augmented Reality (AR) representation of gauge stations along the river through coloured drops. Labels show the station name, the user-station distance, and the instantaneous water level. The size of the billboard increases when the station is nearer.
Figure 3.
Augmented Reality (AR) representation of gauge stations along the river through coloured drops. Labels show the station name, the user-station distance, and the instantaneous water level. The size of the billboard increases when the station is nearer.
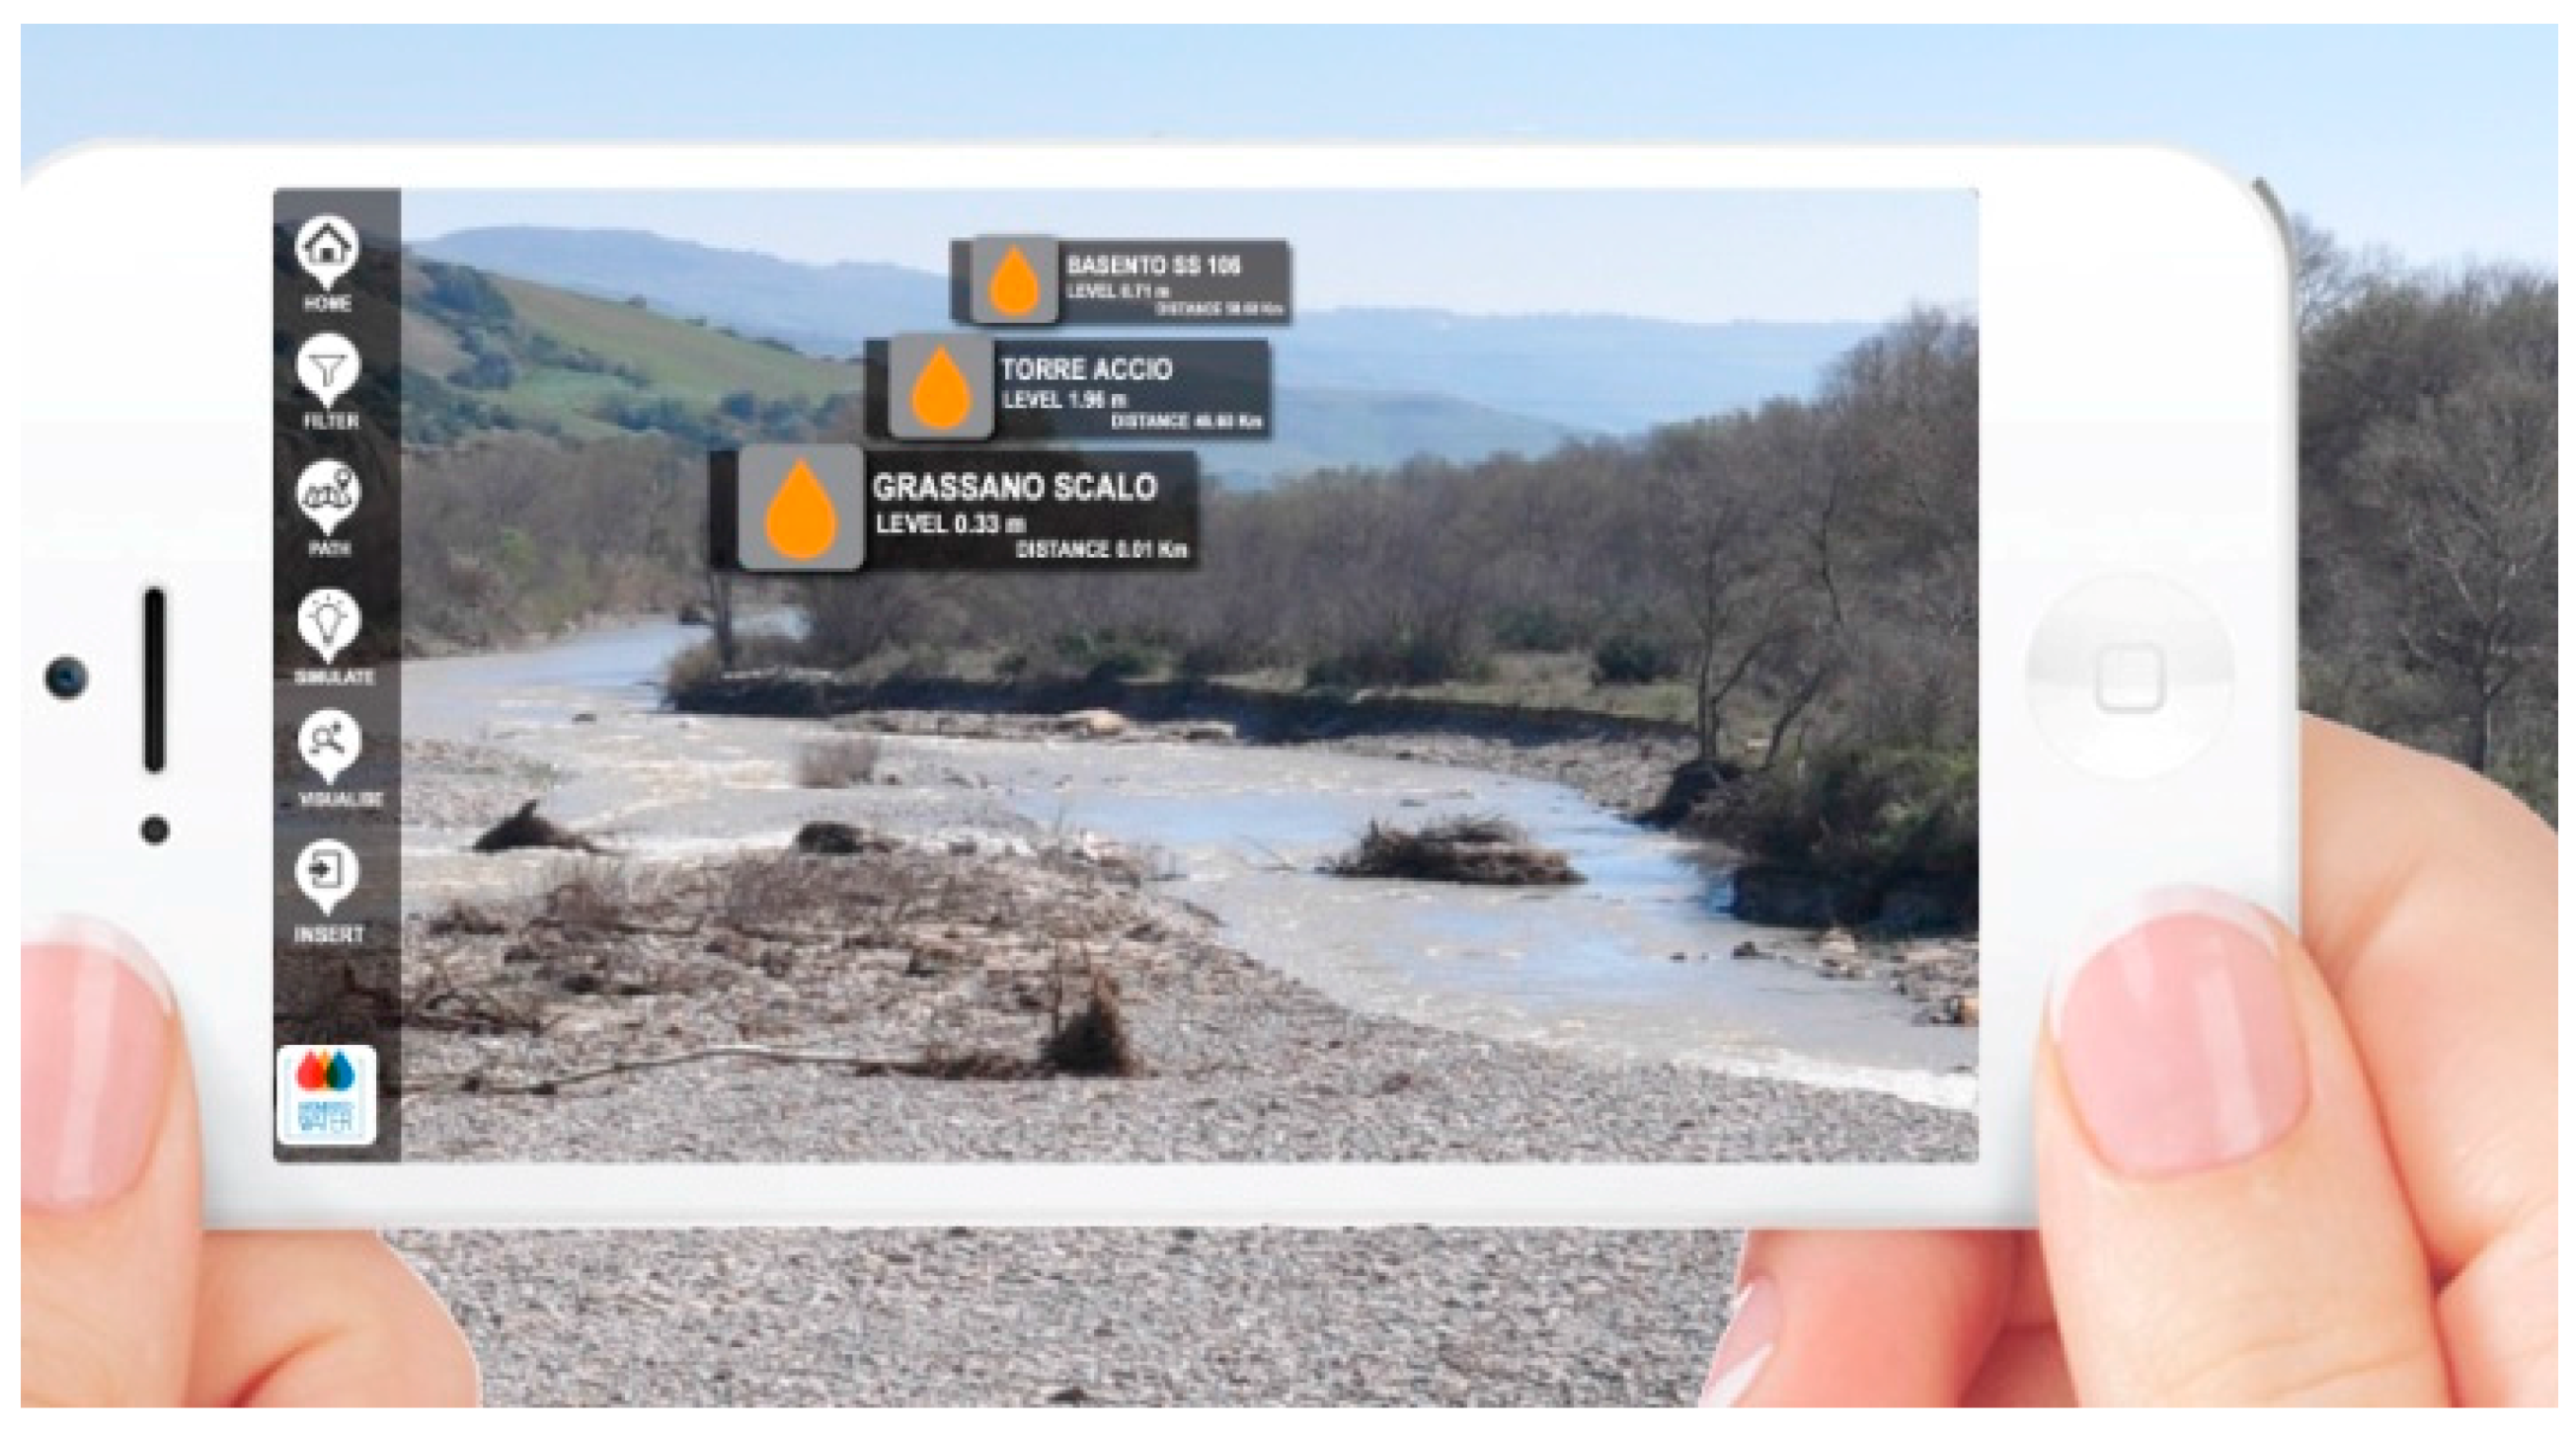
Figure 4.
(a) Comparison among real-time plots of hydrometric levels trends recorded by multiple stations; (b) The plots generated from the regional Civil Protection.
Figure 4.
(a) Comparison among real-time plots of hydrometric levels trends recorded by multiple stations; (b) The plots generated from the regional Civil Protection.


Figure 5.
Application notes associated with some POIs.

Figure 6.
(Left-top) Shortest path to reach the POIs calculated by the platform; (Right-top) Google map of the sample area; (Mid-bottom) The path seems to coexist with the assets in the map.
Figure 6.
(Left-top) Shortest path to reach the POIs calculated by the platform; (Right-top) Google map of the sample area; (Mid-bottom) The path seems to coexist with the assets in the map.
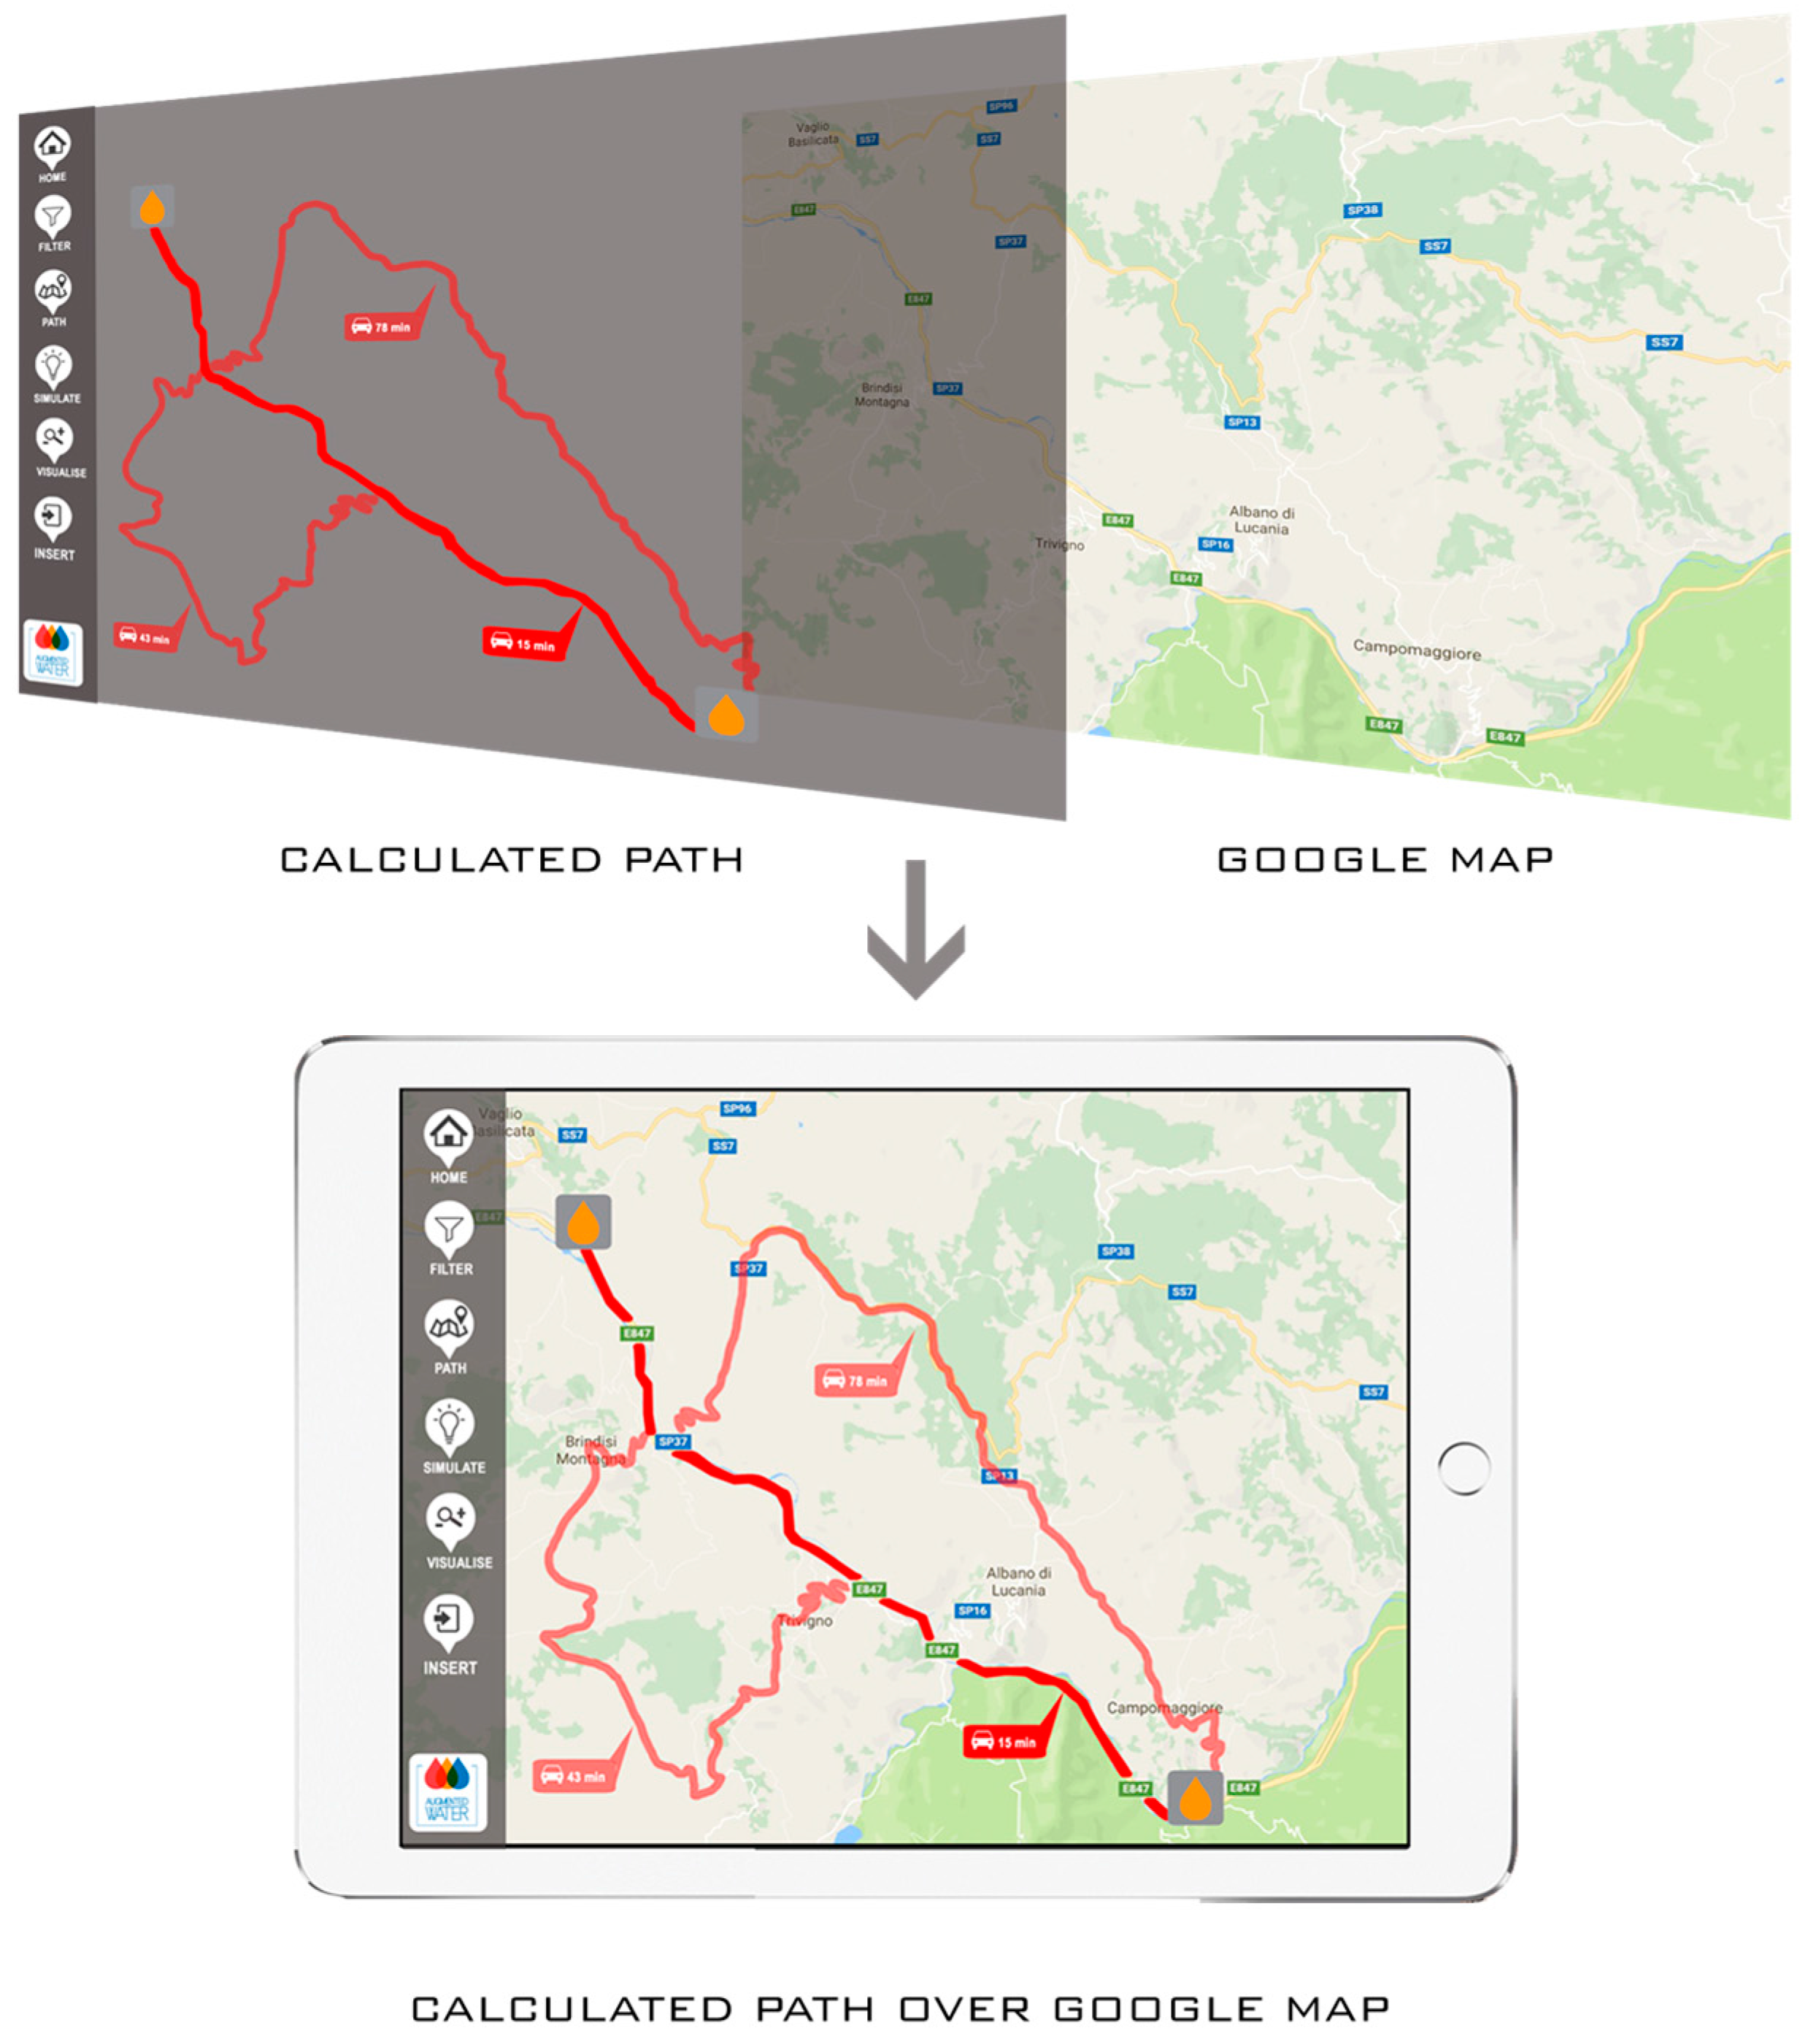
Figure 7.
Visualisation of heterogenous data. (A) Satellite image of the sample area; (B) Simulated data in tabular form; (C) Models outputs are rendered in AR mode (different colours of billboards corresponding to different criticality levels); (D) Layers are blended together in multiple steps.
Figure 7.
Visualisation of heterogenous data. (A) Satellite image of the sample area; (B) Simulated data in tabular form; (C) Models outputs are rendered in AR mode (different colours of billboards corresponding to different criticality levels); (D) Layers are blended together in multiple steps.
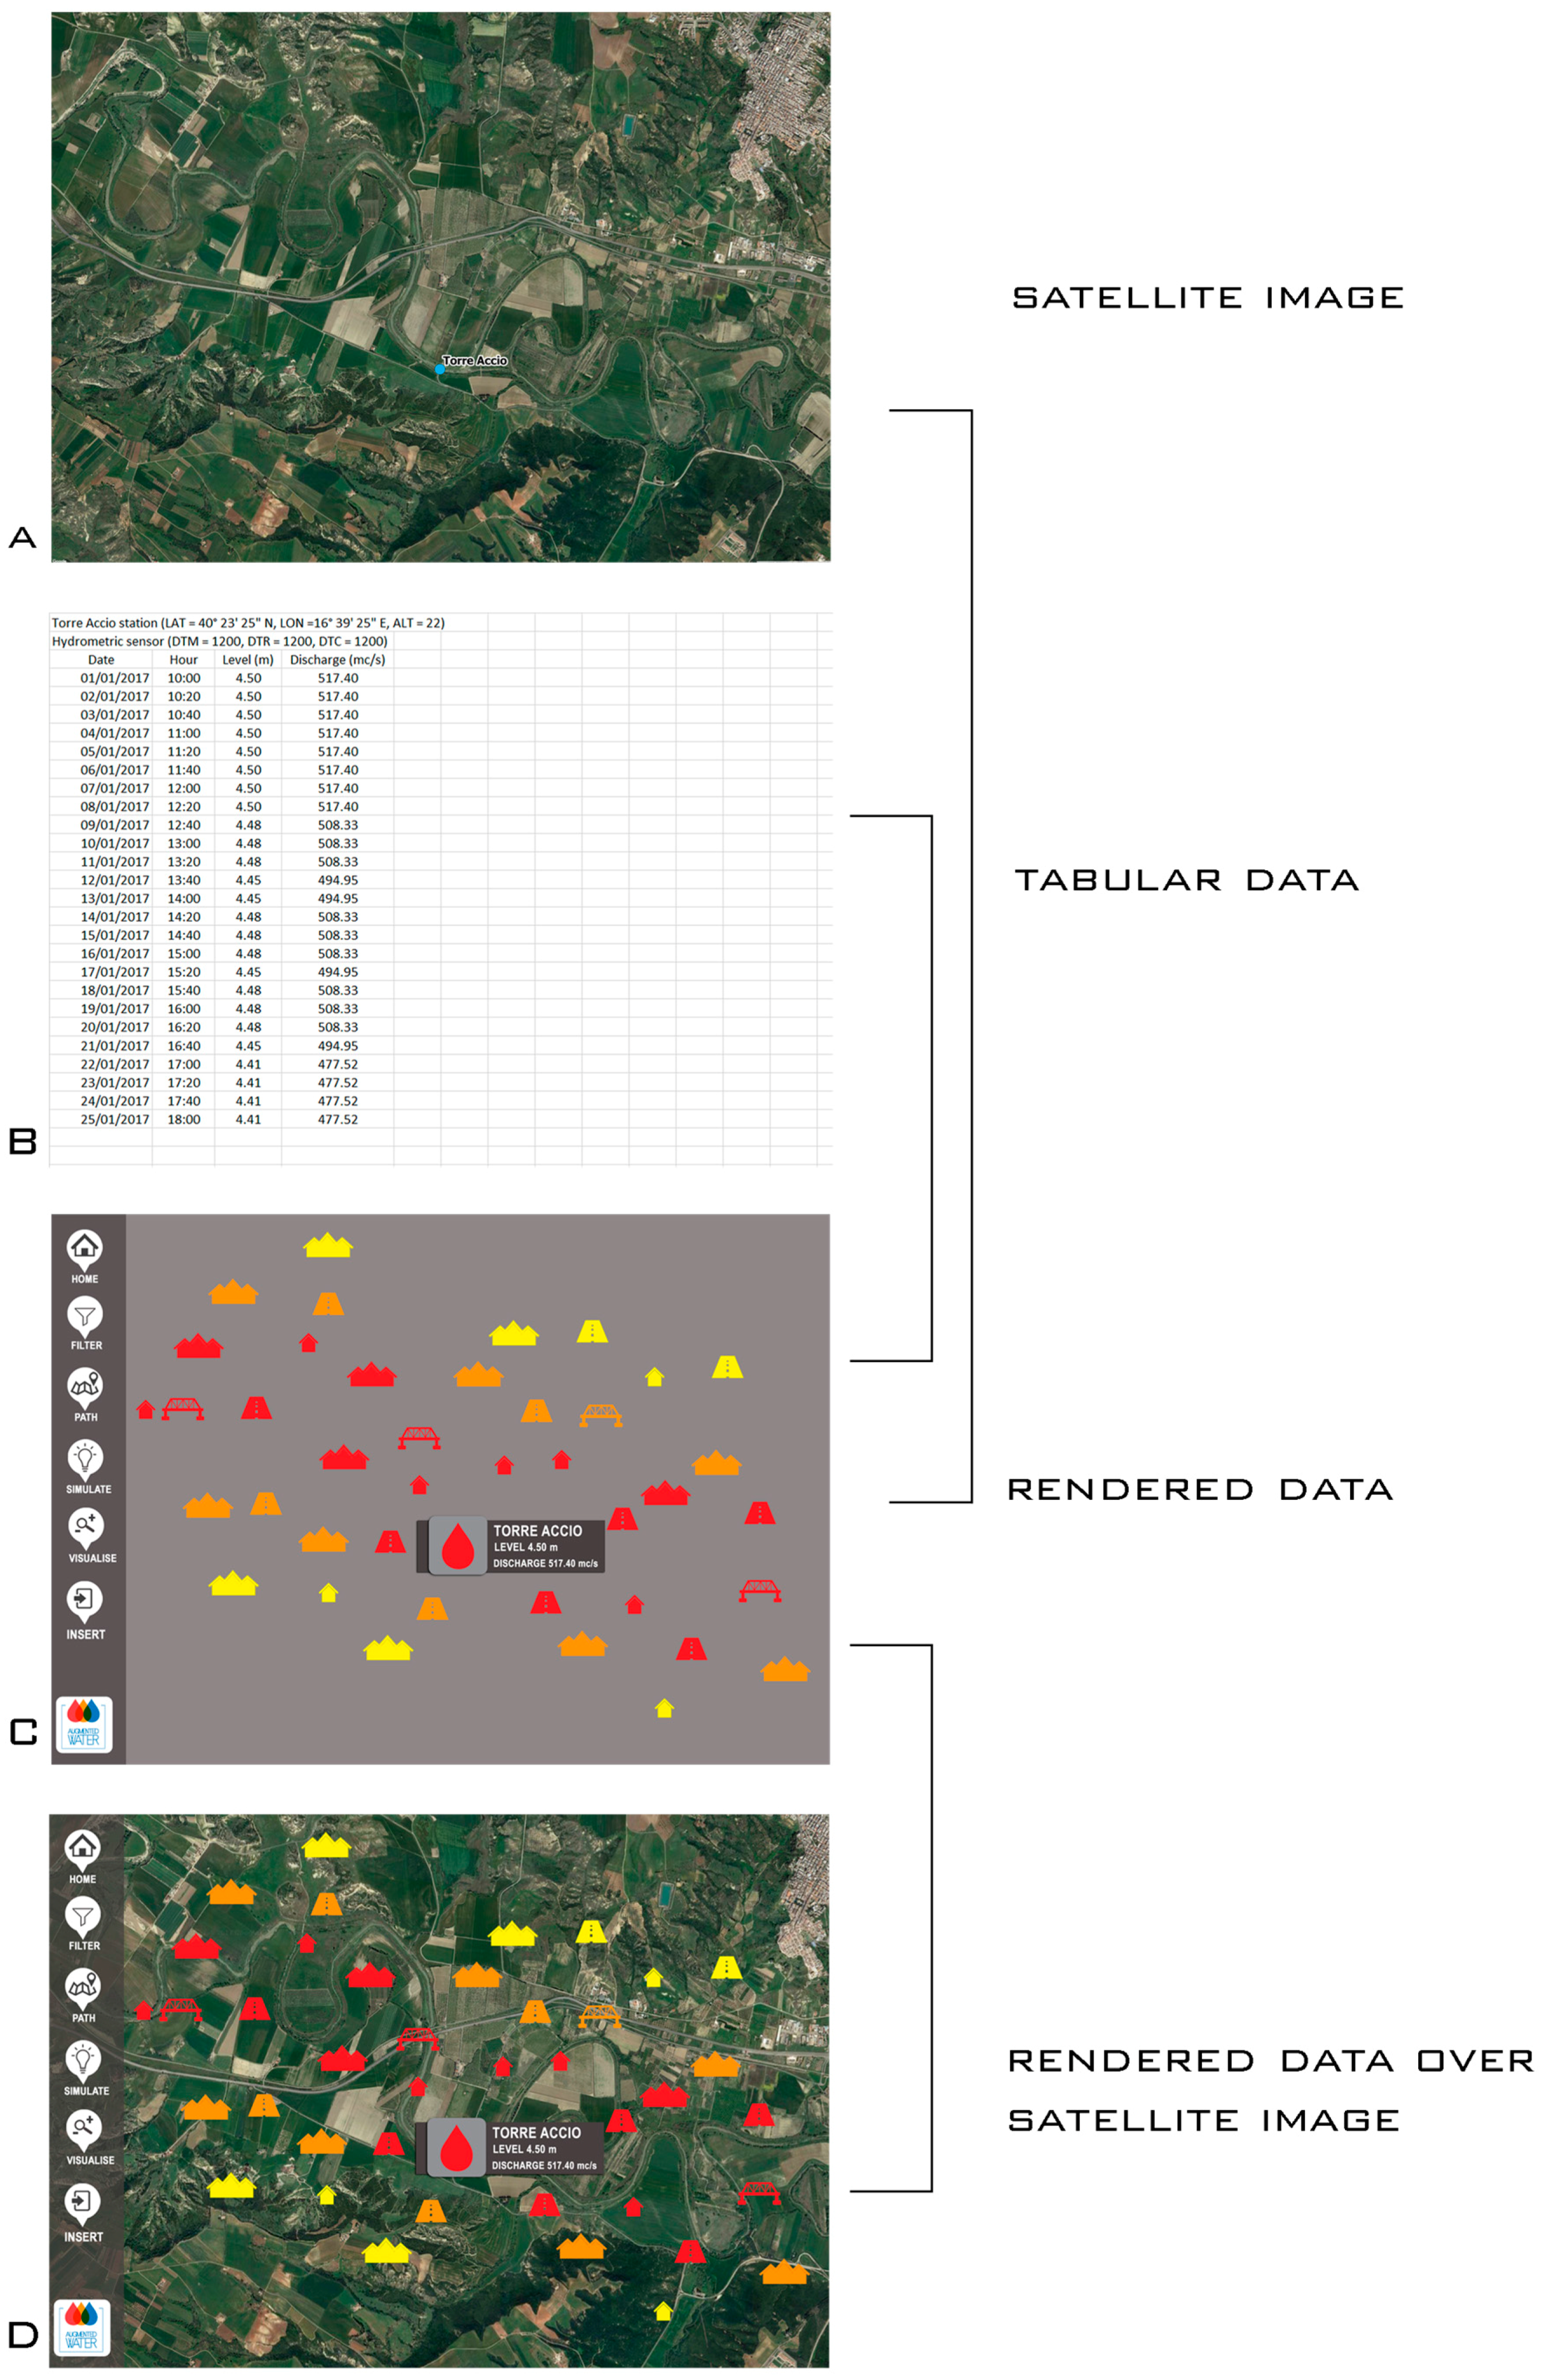
Figure 8.
Sample basin (the River Basento) with hydrometric stations.

Table 1.
Summary of the AR application features.
| The Application |
|---|
| 1. Overlays virtual objects, onto real scenes captured by the mobile device camera |
| 2. Updates the POIs on the mobile device screen according to the user’s position |
| 3. Filters the POIs upon the user’s request |
| 4. Allows inserting newly-found POIs and related information |
| 5. Allows saving all data and metadata to be later retrieved in the offline mode |
| 6. Displays the relative distance and direction, through labels, between the user and each POI |
| 7. Facilitates orienting according to the user’s position and the visualisation perspective |
| 8. Shows the approaching POIs by increasing the billboards size progressively |
| 9. Displays the hydrometric levels trends generated at predefined time intervals by the server |
| 10. Associates more information (e.g., photos, images, videos, animations, and notes) with the POIs |
| 11. Calculates the shortest path to reach the POIs quickly |
| 12. Shows different vulnerability scenarios, colouring the billboards according to the model output |
| 13. Allows the simultaneous visualisation of multiple information |
Table 2.
The questionnaire distributed after the tests.
| Section 1—AR Contents Quality | ||||
| 1. The AR application displays the POIs in a clear way | ||||
| ❍ Strongly Agree | ❍ Agree | ❍ Neither/Nor Agree | ❍ Disagree | ❍ Strongly disagree |
| 2. The texts and the numerical data from the AR application are well readable | ||||
| ❍ Strongly Agree | ❍ Agree | ❍ Neither/Nor Agree | ❍ Disagree | ❍ Strongly disagree |
| 3. The images from the AR application are of good quality | ||||
| ❍ Strongly Agree | ❍ Agree | ❍ Neither/Nor Agree | ❍ Disagree | ❍ Strongly disagree |
| Section 2—AR System Quality | ||||
| 1. The AR application is easy to use | ||||
| ❍ Strongly Agree | ❍ Agree | ❍ Neither/Nor Agree | ❍ Disagree | ❍ Strongly disagree |
| 2. The AR application facilitates the visualisation of maps and technical documents | ||||
| ❍ Strongly Agree | ❍ Agree | ❍ Neither/Nor Agree | ❍ Disagree | ❍ Strongly disagree |
| 3. The AR application allows real-time information exchange | ||||
| ❍ Strongly Agree | ❍ Agree | ❍ Neither/Nor Agree | ❍ Disagree | ❍ Strongly disagree |
| 4. The AR application provides a customised view of the simulation | ||||
| ❍ Strongly Agree | ❍ Agree | ❍ Neither/Nor Agree | ❍ Disagree | ❍ Strongly disagree |
| Section 3—AR Service Quality | ||||
| 1. The communication between the AR application and the model and libraries outputs is reliable and fast | ||||
| ❍ Strongly Agree | ❍ Agree | ❍ Neither/Nor Agree | ❍ Disagree | ❍ Strongly disagree |
| 2. The information presented by the AR application allows one to quickly reach the POIs in the real world | ||||
| ❍ Strongly Agree | ❍ Agree | ❍ Neither/Nor Agree | ❍ Disagree | ❍ Strongly disagree |
| 3. The simultaneous visualisation of different information enhances the knowledge of the surroundings | ||||
| ❍ Strongly Agree | ❍ Agree | ❍ Neither/Nor Agree | ❍ Disagree | ❍ Strongly disagree |
| Section 4—AR Application Limits | ||||
| 1. The screen visibility is optimal | ||||
| ❍ Strongly Agree | ❍ Agree | ❍ Neither/Nor Agree | ❍ Disagree | ❍ Strongly disagree |
| 2. Battery life does not prevent the use of the app | ||||
| ❍ Strongly Agree | ❍ Agree | ❍ Neither/Nor Agree | ❍ Disagree | ❍ Strongly disagree |
| 3. The offline mode is useful | ||||
| ❍ Strongly Agree | ❍ Agree | ❍ Neither/Nor Agree | ❍ Disagree | ❍ Strongly disagree |
| 4. The processing and storage capabilities of the mobile device do not delay the application functionality | ||||
| ❍ Strongly Agree | ❍ Agree | ❍ Neither/Nor Agree | ❍ Disagree | ❍ Strongly disagree |
Table 3.
Mean, μ, and standard deviation, σ, of the questionnaire items.
| No. | Item | μ | σ |
|---|---|---|---|
| 1 | The AR application displays the POIs in a clear way | 4.05 | 1.01 |
| 2 | The texts and the numerical data from the AR application are well readable | 3.85 | 1.05 |
| 3 | The images from the AR application are of good quality | 4.00 | 1.04 |
| 4 | The AR application is easy to use | 4.15 | 0.92 |
| 5 | The AR application facilitates the visualisation of maps and technical documents | 3.98 | 1.03 |
| 6 | The AR application allows real-time information exchange | 3.68 | 1.27 |
| 7 | The AR application provides a customised view of the simulation | 2.78 | 1.39 |
| 8 | The communication between the AR application and the model and libraries outputs is reliable and fast | 3.50 | 1.34 |
| 9 | The information presented by the AR application allows one to quickly reach the POIs in the real world | 4.23 | 0.83 |
| 10 | The simultaneous visualisation of different information enhances the knowledge of the surroundings | 3.43 | 1.28 |
| 11 | The screen visibility is optimal | 2.30 | 1.07 |
| 12 | Battery life does not prevent the use of the app | 2.25 | 1.06 |
| 13 | The offline mode is useful | 3.73 | 1.06 |
| 14 | The processing and storage capabilities of the mobile device do not delay the app functionality | 2.18 | 1.03 |
© 2017 by the authors. Licensee MDPI, Basel, Switzerland. This article is an open access article distributed under the terms and conditions of the Creative Commons Attribution (CC BY) license (http://creativecommons.org/licenses/by/4.0/).
Share and Cite
MDPI and ACS Style
Mirauda, D.; Erra, U.; Agatiello, R.; Cerverizzo, M. Applications of Mobile Augmented Reality to Water Resources Management. Water 2017, 9, 699. https://doi.org/10.3390/w9090699
AMA Style
Mirauda D, Erra U, Agatiello R, Cerverizzo M. Applications of Mobile Augmented Reality to Water Resources Management. Water. 2017; 9(9):699. https://doi.org/10.3390/w9090699
Chicago/Turabian StyleMirauda, Domenica, Ugo Erra, Roberto Agatiello, and Marco Cerverizzo. 2017. "Applications of Mobile Augmented Reality to Water Resources Management" Water 9, no. 9: 699. https://doi.org/10.3390/w9090699
Note that from the first issue of 2016, this journal uses article numbers instead of page numbers. See further details here.