Article

Exploring the Spatial-Seasonal Dynamics of Water Quality, Submerged Aquatic Plants and Their Influencing Factors in Different Areas of a Lake

1
Department of Environmental Science and Engineering, Fudan University, Shanghai 200433, China
2
Faculty of Resources and Environmental Science, Hubei University, Wuhan 430062, China
*
Authors to whom correspondence should be addressed.
Water 2017, 9(9), 707; https://doi.org/10.3390/w9090707
Submission received: 5 June 2017 / Revised: 24 August 2017 / Accepted: 13 September 2017 / Published: 15 September 2017
(This article belongs to the Special Issue Water Quality Monitoring and Modeling in Lakes)

Abstract

:
The degradation of water quality in lakes and its negative effects on freshwater ecosystems have become a serious problem worldwide. Exploring the dynamics in the associated factors is essential for water pollution management and control. GIS interpolation, principal component analysis (PCA) and multivariate statistical techniques were used to identify the main pollution sources in different areas of Honghu Lake. The results indicate that the spatial distribution of the concentrations of total nitrogen (TN), total phosphate (TP), ammonia nitrogen (NH4+–N), and permanganate index (CODMn) have similar characteristics and that their values gradually increased from south to north during the three seasons in Honghu Lake. The major influencing factors of water quality varied across the different areas and seasons. The relatively high concentrations of TN and TP, which might limit the growth of submerged aquatic plants, were mainly caused by anthropogenic factors. Our work suggests that spatial analyses combined with PCA are useful for investigating the factors that influence water quality and submerged aquatic plant biomass in different areas of a lake. These findings provide sound information for the future water quality management of the lake or even the entire lake basin.

Graphical Abstract

1. Introduction

Water quality deterioration in lakes has recently been a matter of great concern due to its negative impacts on social, economic, and health aspects [1] and has been recognized as a serious problem at local, regional and global levels [2]. Numerous lakes have become heavily polluted over the past 50 years in response to the human population growth and development of local industries [3]. The pollution of shallow lakes has had serious influences on the security of drinking water and the function of ecosystems, causing, for example, wetland degradation, eutrophication and salinization [4]. These adverse impacts could result in the rapid production of phytoplankton and other microorganisms and lead to frequent outbreaks of algal blooms and declines in submerged aquatic vegetation [5]. Lakes in China have been experiencing severe deterioration due to anthropogenic and natural influences in recent decades [6]. The percentage of eutrophic lakes has significantly increased from 41.2% to 84.5% since 1978, with most of these lakes located in the middle and lower reaches of the Yangtze River [7,8]. Therefore, solving or alleviating the problem of water quality pollution is urgent for lakes around the world.
The deterioration of lake water quality is mainly caused by a combination of natural and anthropogenic factors, including domestic sewage, industrial wastewater, agricultural runoff and atmospheric depositions [9]. These factors generally undergo seasonal and spatial dynamics and fluctuations depending on local conditions, human activities, hydrodynamic circulation, and chemical and biological processes [1]. Similarly, in both large and small lakes, indicators such as water quality parameters, submerged aquatic plants and microorganisms exhibit seasonal variation and high heterogeneities at different spatial scales [5,10,11]. Water quality characteristics could influence the distribution, abundance, and growth of submerged aquatic plants, which play vital roles in regulating the structure and function of freshwater ecosystems [12]. Submerged aquatic plants release chemical substances that can inhibit algal production, absorb nitrogen and phosphorus directly from the water, limit the resuspension of sediment in lakes, and hence improve water quality [5]. Indeed, the biomass and production of submerged aquatic plants are generally influenced by high nutrient concentrations [13]. Therefore, the analysis of seasonal and spatial variations in water quality, as well as their associated natural and anthropogenic driving forces, is crucial for water management [14]. Many studies have been conducted at global, continental and regional scales [15,16], such as in Lake Romanian in Europe [17], Lake Baikal in Siberia [18], Lake Ontario and Lake Superior in the USA and Canada [19], Lake Biwa in Japan [20], and, more recently, Dongting Lake in China [21]. Most of these case studies used multi-index and correlation analysis methods [22]. Semivariogram analyses have been used to investigate the spatial-temporal characteristics of lake water quality, but these investigations have mainly focused on specific parts of a watershed and have not predicted corresponding values in unsampled areas [14]. Moreover, because they use few monitoring stations over short periods of time they only partially identify the factors affecting water quality [6,23]. Spatial analysis techniques, such as spatial interpolation in GIS, are recommended for use when sufficient data are available that reflect the variation, relationships, and interdependence of the spatial characteristics of water quality parameters in large lakes [14].
The seasonal and spatial dynamics of water quality are related to the regional characteristics and development surrounding a lake. Many studies have suggested that the water quality in different parts of a lake differ due to different driving forces [24,25]. In the Lake of the Woods in Canada, the water quality has deteriorated to a higher degree in northern regions than in other areas [26]. A study in Rawal Lake in Pakistan indicated that the surface water quality was better at sites where disturbances from human activities were the lowest [27]. The total phosphorus (TP) loads was obviously higher in the central and southwest zones in Taihu Lake, China, due to different human activities [28]. However, detailed discussions concerning the dynamics of water quality and submerged aquatic plants in different areas of lake water bodies are still limited. While the interactions are complex, understanding the factors associated with water pollution and could help in management of lake [29]. Moreover, relatively few studies have explored the correlations of nutrient content and geographic location with submerged aquatic plant biomass in lakes [7].
Honghu Lake, the seventh largest freshwater lake in China, is typical of lakes in the middle reaches of the Yangtze River in that it is shallow. This lake has rich biological resources, particularly the aquatic vegetation, which is a key component of lake ecosystems. However, economic development and population increases in the Honghu Lake Basin have resulted in serious ecological problems. These include a drastically deterioration in water quality since the 1990s [30] and reductions in the water surface area, lakeside wetlands, aquatic organism biomass, and rare species [31]. In this study, the forces driving water quality deterioration and the growth of submerged aquatic plants, including anthropogenic and geographic factors, are examined in detail. A relatively high-density water quality data collection effort was conducted in Honghu Lake in dry, wet and normal seasons from 2012 to 2013. The purpose of this study was to: (1) address the spatial and seasonal similarities or differences in water quality and submerged aquatic plants in Honghu Lake; (2) examine the influencing factors for their seasonal and spatial variations across Honghu Lake using GIS interpolation and principal component analysis (PCA) methods; and (3) investigate the dynamic correlations between water quality parameters and the biomass of submerged aquatic plants across the lake and seasons.

2. Materials and Methods
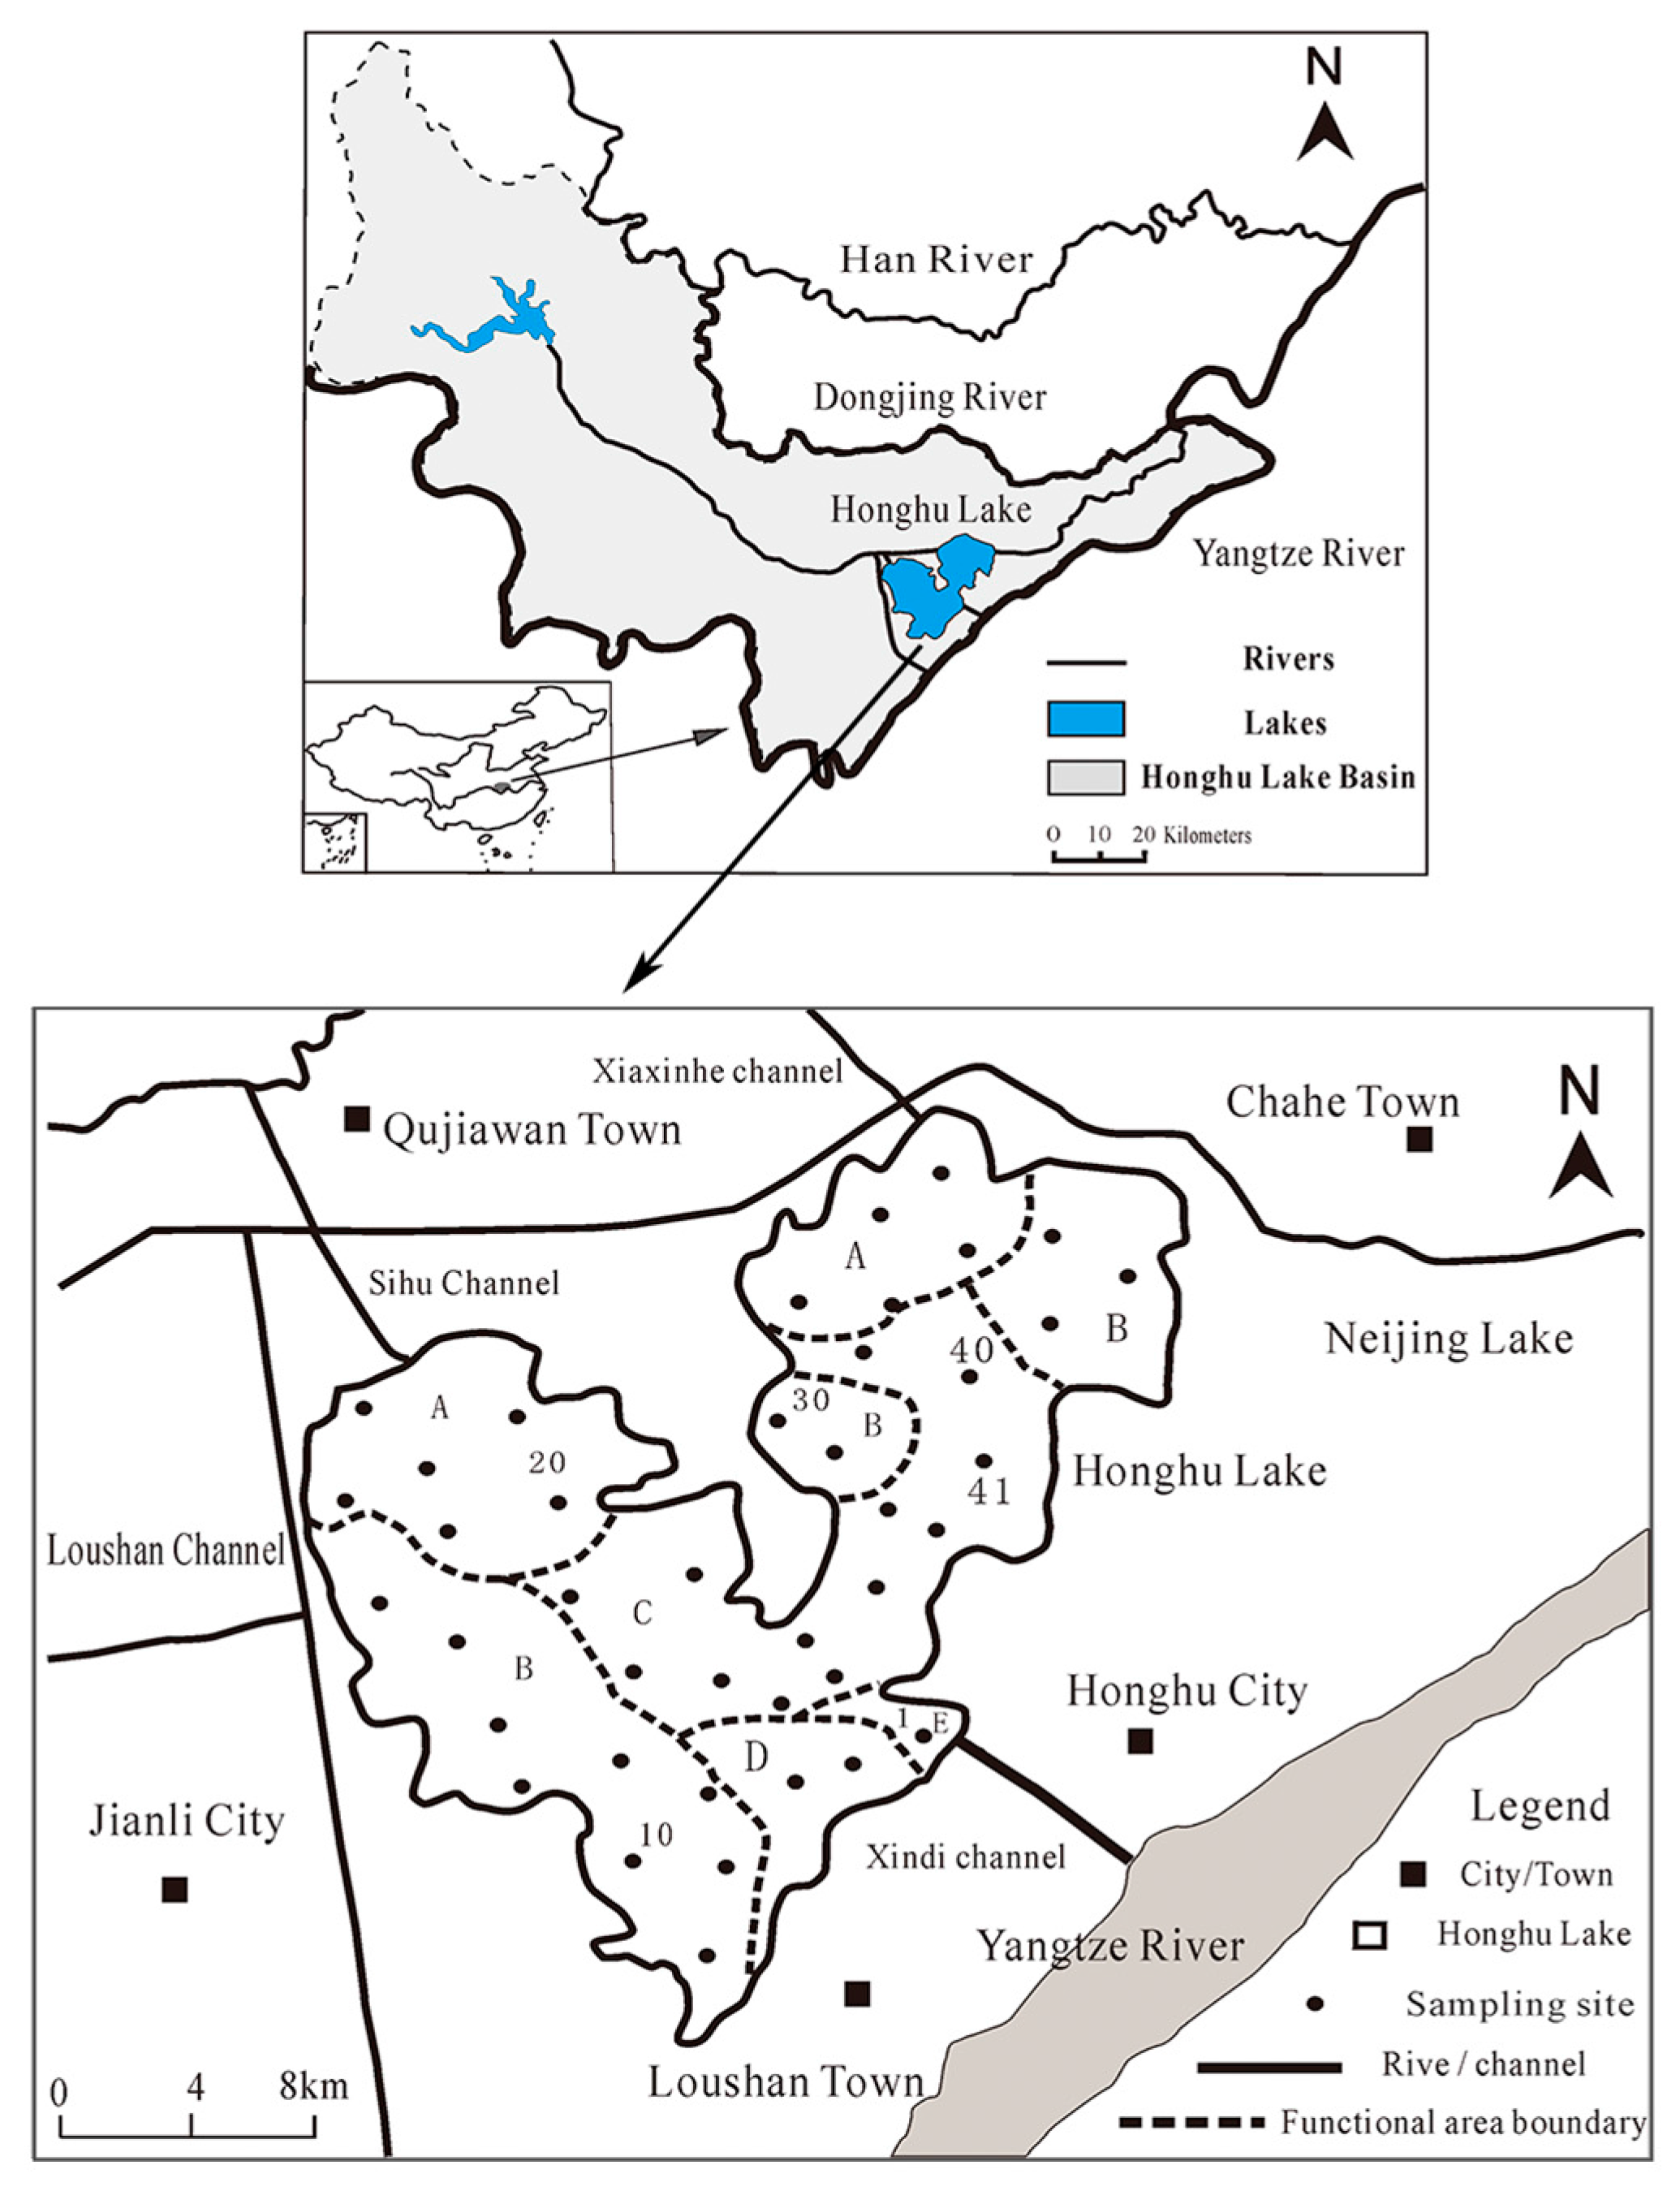
2.1. Study Area

Honghu Lake, located in central Hubei Province in China (112°34′–114°08′ E, 29°33′–30°17′ N), has a surface area of approximately 344 km2. It has an average water inflow of 19.6 × 10⁸ m3 and a water depth of 1.35 m. The total area of the Honghu Lake Basin is approximately 11,152 km2. The lake experiences a subtropical monsoon climate, with an annual mean temperature of 16.3 °C and rainfall ranging from 1100 mm to 1300 mm. The dry, wet and normal seasons generally occur from January to April, May to August, and September to December, respectively. Honghu Lake occurs in Honghu City and Jianli City in Hubei Province, and the lake has been separated from the Yangtze River by several controlling sluices since the 1950s. At present, Honghu Lake is a closed lake with a flat bottom, and surface runoff from the watershed flows into the lake through several inflowing rivers and sluices, including Sihu channel, Xiaxinhe channel and Xindi channel (Figure 1).
Honghu Lake serves critical functions in flood regulation, fishery production and water supply provisioning for local industry and agriculture development. However, artificial hydrological regulation and intensified fish farming have resulted in a significant decrease in the water level and a serious deterioration in water quality and aquatic vegetation, which have had critical influences on the aquatic environment and ecosystem [31]. Following Wang et al. [32], Honghu Lake was divided into five area types: river inflow areas, enclosure culture areas, an open water area, a lake-protection area, and an area connecting to the Yangtze River (Figure 1). The southeastern part of Honghu Lake is connected to the Yangtze River, and a large proportion of the enclosure culture areas is devoted to aquaculture development. The aim of the lake protection area is to protect the ecosystems and aquatic vegetation where minimal human disturbance occurs. The majority of the residential, industrial and tourism developments surround the river inflow areas, where much rice and cotton is planted.

2.2. Data and Methods

2.2.1. Data Collection

Considering the different lake areas shown in Figure 1, 43 sampling sites evenly scattered within our study area were selected, including 41 sites in Honghu Lake and 2 sites in the inflowing river and channel. Water quality data were collected on 20–21 August and 12–13 December 2012 and 14–15 April 2013. Aquatic plants were collected three times from each sampling site within an area of 0.1 m2. Socio-economic data, including population, agricultural development and land use/land cover, were derived from the statistical yearbooks (2008–2013) published by the Municipal Bureau of Statistics of Jingzhou City. Yearly water quality data for 2000–2011 were provided by the Environmental Protection Bureau and Environment Science Institute of Jingzhou City.

2.2.2. Data Preprocessing

Sampling, preservation, transportation, and analysis of the water samples were performed following the standard methods published by the State Environmental Protection Administration of China in 2002 (SEPA, China, 2002). Given that physico-chemical properties and nutrient constituents are the most important factors influencing lake water quality, seven parameters, including total nitrogen (TN), permanganate index (CODMn), ammonia nitrogen (NH4+–N), dissolved oxygen (DO), total phosphate (TP), pH and transparency were measured. The parameters of DO, temperature (T) and transparency were measured in the field using a multi-parameter water quality monitoring instrument (i.e., Hach DS5, Loveland, CO, USA); pH was measured via the glass electrode method; TN was measured using the double-wavelength method (220 and 275 nm) of persulfate digestion and oxidation using a spectrophotometer (Hach DR6000, Loveland, CO, USA); TP was analyzed through digestion and a colorimetric method; NH4+–N was determined through Nessler’s reagent photometry; and CODMn was measured through permanganate oxidation. Plant litter and submerged aquatic plants were washed and separated, and the plant samples were weighed. The biomass of submerged aquatic plants was determined using the average fresh weight of three samples, and the species composition was recorded at the same time.

2.2.3. Methods

Since variation in water quality is continuous within the lake and water quality is easily influenced by closer pollution sources, the interpolation method using the weighted average of inverse distances was applied in this study. Spatial estimation and the spatial correlation between variables and auxiliary variables are considered in [33] using inverse distance weighting (IDW), whereby more weight was given to closer samples than to more distant ones [34]. Using this method, we obtained the spatial distribution of TN, TP, CODMn, submerged aquatic plant biomass and composite water quality (CWQ) across all of Honghu Lake. The formula for the IDW method is as follows [35]:
Z ( P 0 ) = i = 1 N W i Z ( P i )
where Z(P0) represents the interpolated value of interest point, Z(Pi) is the value of sampling point i, N is the number of sampling points, and Wi is the weight. The value and distance between each sample point were used in the interpolation model to generate a continuous surface of values displayed as a raster layer using ArcGIS 10.0.
PCA was performed to identify the main sources of pollution. All water quality data were normalized (with a mean and variance of zero and one, respectively) in three seasons, and Kaiser–Meyer–Olkin (KMO) and Bartlett’s sphericity tests were conducted for the PCA [36]. Moreover, the correlations among different water quality parameters and submerged aquatic plant biomass were assessed using Pearson’s correlation coefficients. The indicators TN, TP, NH4+–N and CODMn were used to evaluate the CWQ using a single-factor water quality assessment method according to the National Surface Water Environment Quality Standards of China (GB3838-2002).

3. Results

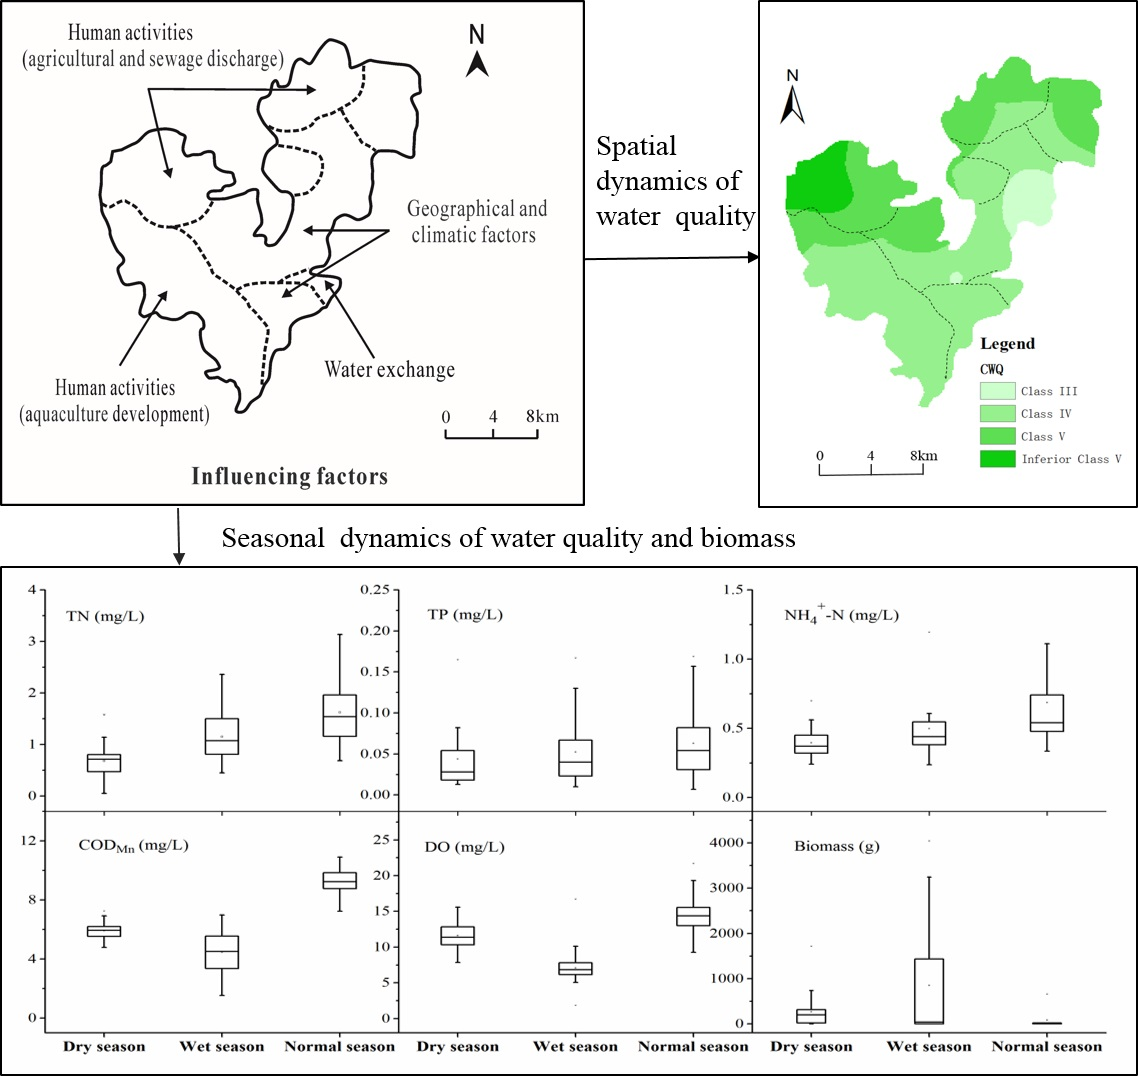
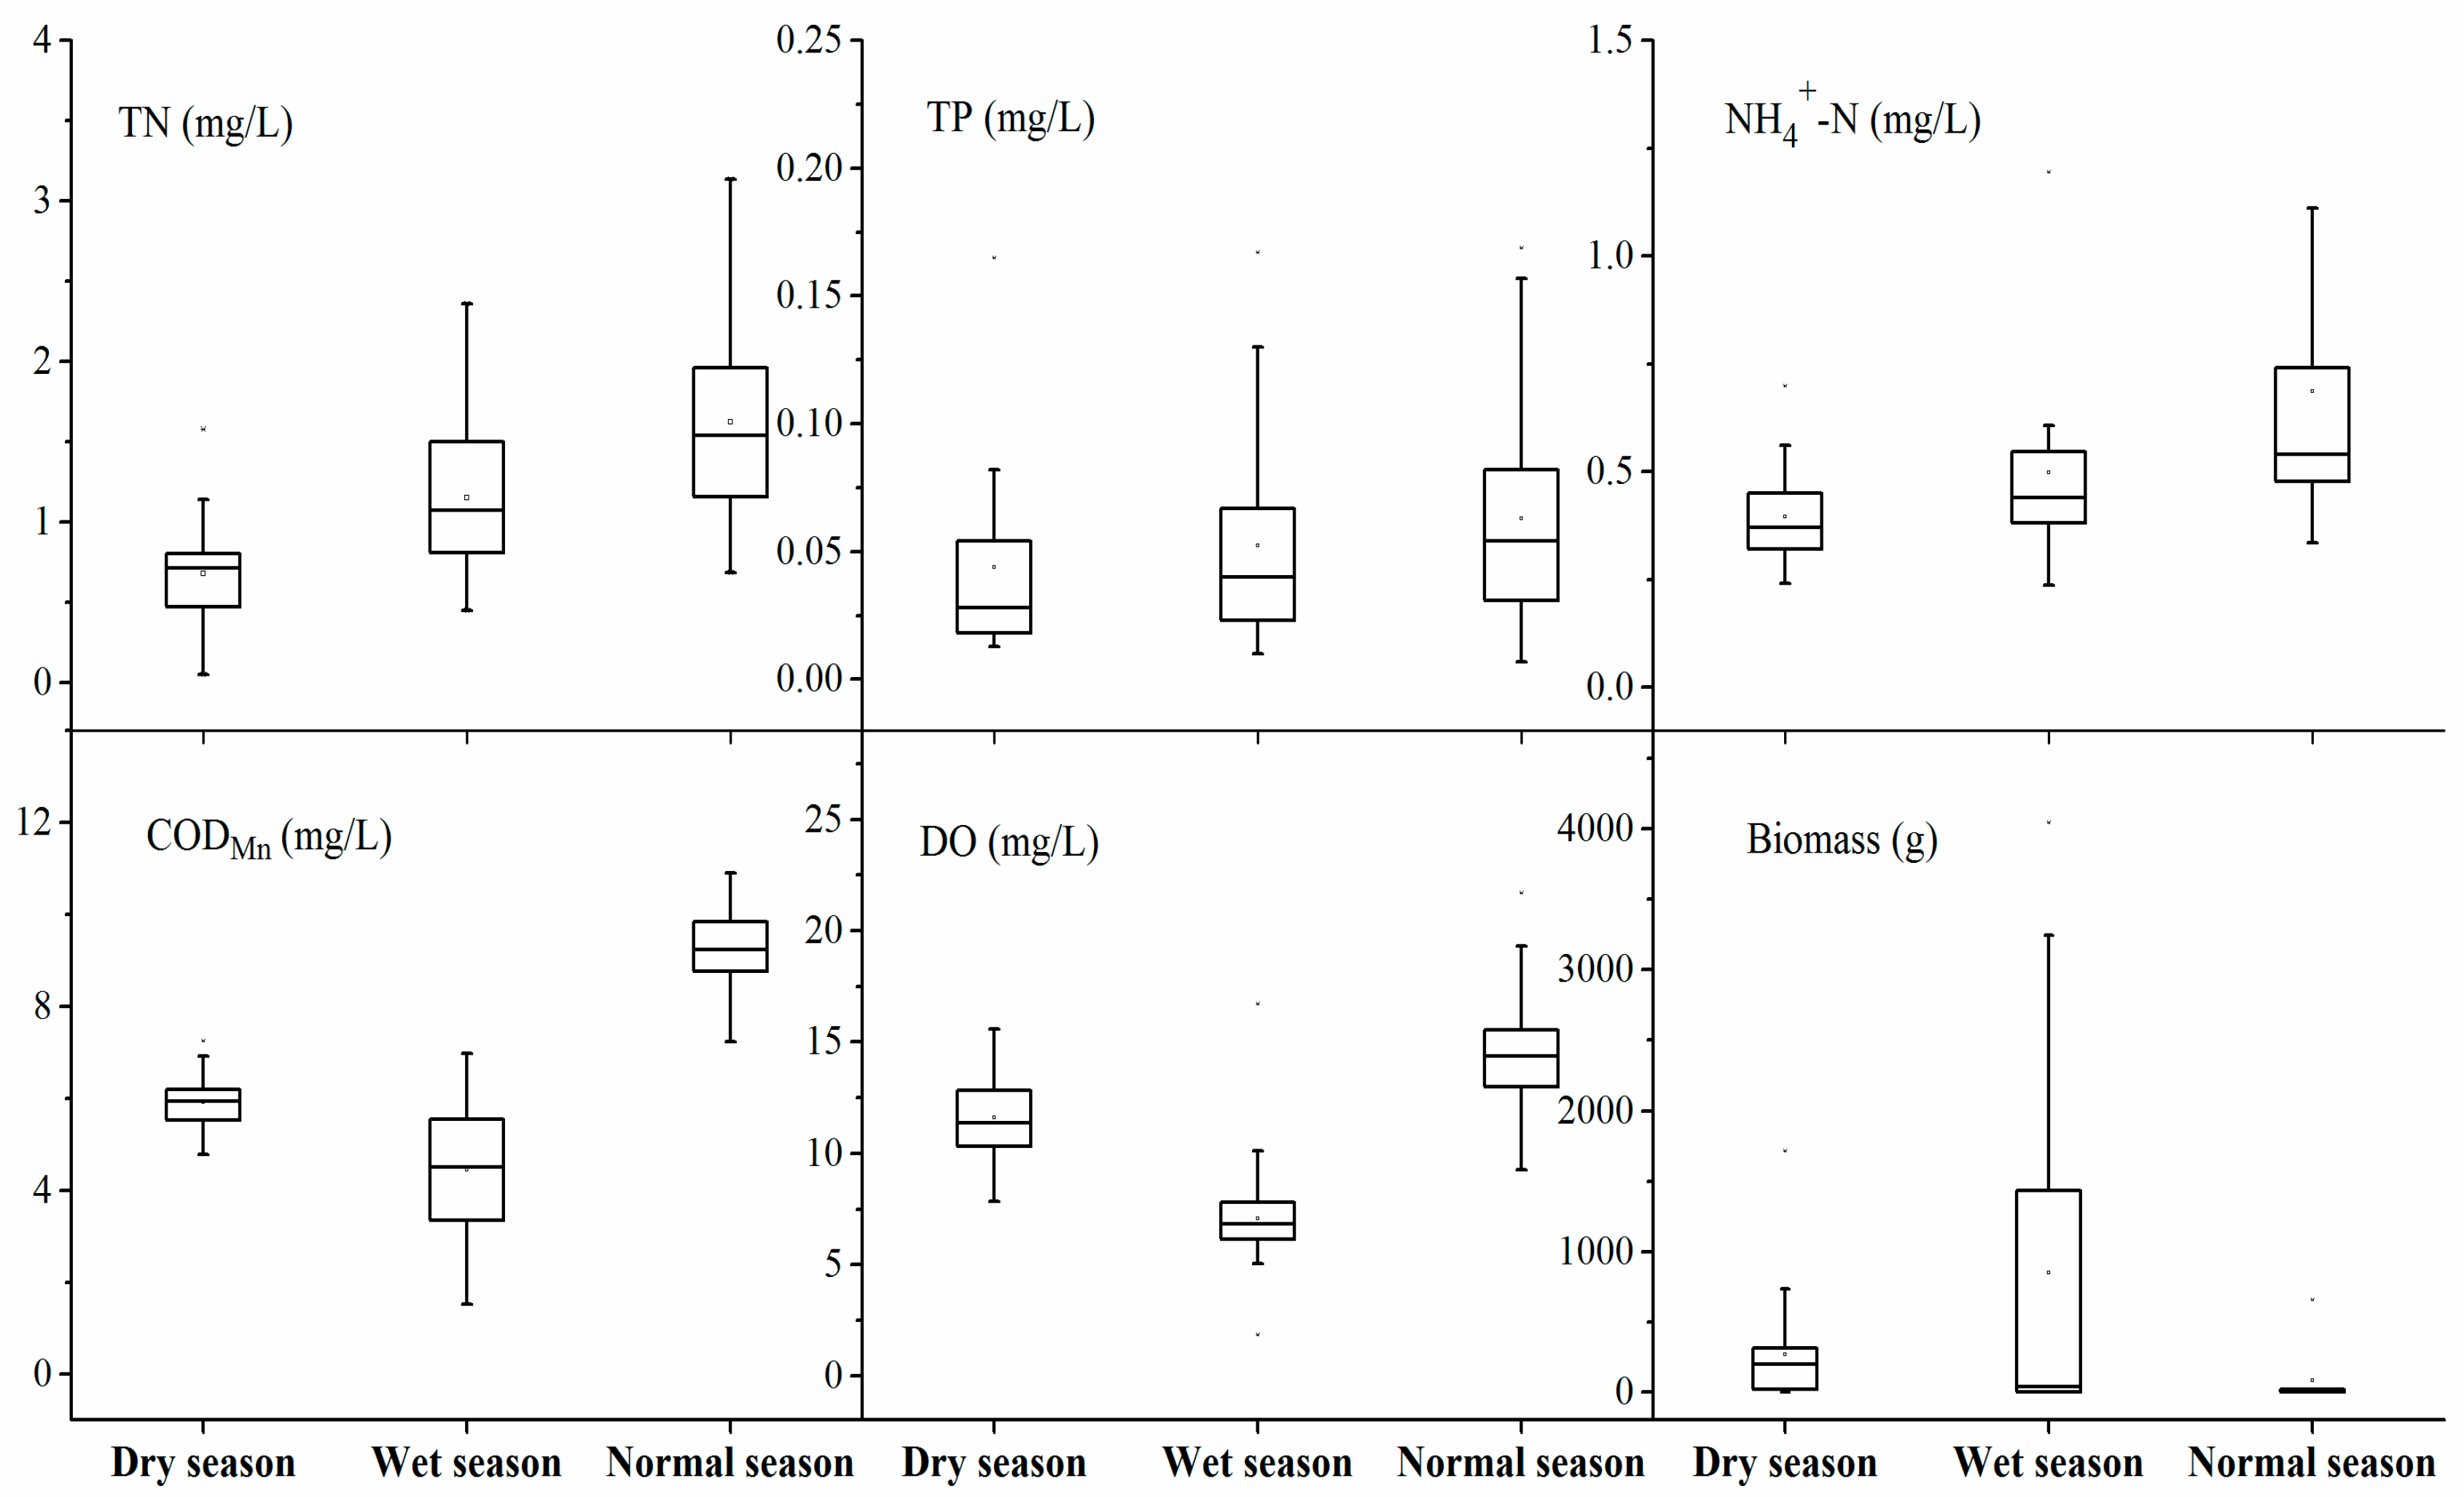
3.1. Seasonal Variation in Water Quality and Submerged Aquatic Plant Biomass

The collected data regarding the seven water quality parameters and submerged aquatic plant biomass are summarized in Table 1. According to the environmental guidelines of surface water quality in China (GB3838-2002), surface water quality can be classified into five groups: clean water Class I (excellent); Class II (good); Class III (ordinary); Class IV (poor); and Class V (bad) (see Table A1 in Appendix A). According to the environmental function zoning of water bodies in Hubei Province, China, the target for surface water quality in Honghu Lake is Class III. During the examined years, the average concentrations of TN, TP and CODMn exceeded this target (Table 1). As shown in Figure 2, 61%, 46.3%, 85.4% and 4.9% of the 41 samples in Honghu Lake exceeded the Class III water quality target in terms of TN, TP, CODMn, and NH4+–N, respectively. For the CWQ, 7.3%, 70.7%, 17.1% and 4.9% of the 41 monitoring sites could be classified as Class III, Class IV, Class V and inferior Class V, respectively. The coefficient of variation (CV) for transparency, NH4+-N, TN, TP and biomass indicated that these parameters changed significantly across sampling sites over the three seasons, as shown in Table 1.
The seasonal variation in water quality parameters and submerged aquatic plant biomass was further examined for different seasons, as shown in Figure 3 and Tables S1–S4. The mean concentrations of DO, NH4+-N, TN, TP and CODMn were all highest during the normal season (Figure 3). The degree of pollution was in the following order: CODMn > TP > TN > NH4+–N > DO in the dry season, TN > TP > CODMn > NH4+–N > DO in the wet season and CODMn > TN > TP > NH4+–N > DO in the normal season. The highest mean value of CODMn observed in the normal season was 9.24 mg·L−1. The highest mean biomass value observed in the wet season was 852.5 g, which was approximately 3 and 10 times higher than those in the dry and normal seasons, respectively. Seven kinds of submerged aquatic plants, including Stuckenia pectinata (L.) Börner sago pondweed, Myriophyllum verticillatum, Ceratophyllum demersum L., Potamogeton malaianus, Potamogeton maackianus, Vallisneria natans, and Hydrilla verticillata, were collected in Honghu Lake during dry and wet seasons. However, Vallisneria natans were not collected in normal season. In all, Myriophyllum verticillatum, Ceratophyllum demersum L. and Stuckenia pectinata (L.) Börner sago pondweed were the three dominant species, and accounted for 96%, 95% and 76% of total biomass of submerged aquatic plants in dry, wet and normal seasons, respectively (see Supplementary Materials Table S5). The mean pH values for the all samples collected during the three seasons were within the permissible standard range of between 7.39 and 8.69, which indicated that the water in Honghu Lake was alkaline. Altogether, approximately 56%, 68% and 100% of all sampling sites exceeded the water quality target (i.e., Class III) during the dry, wet and normal seasons, respectively. The water quality was the worst in the normal season.

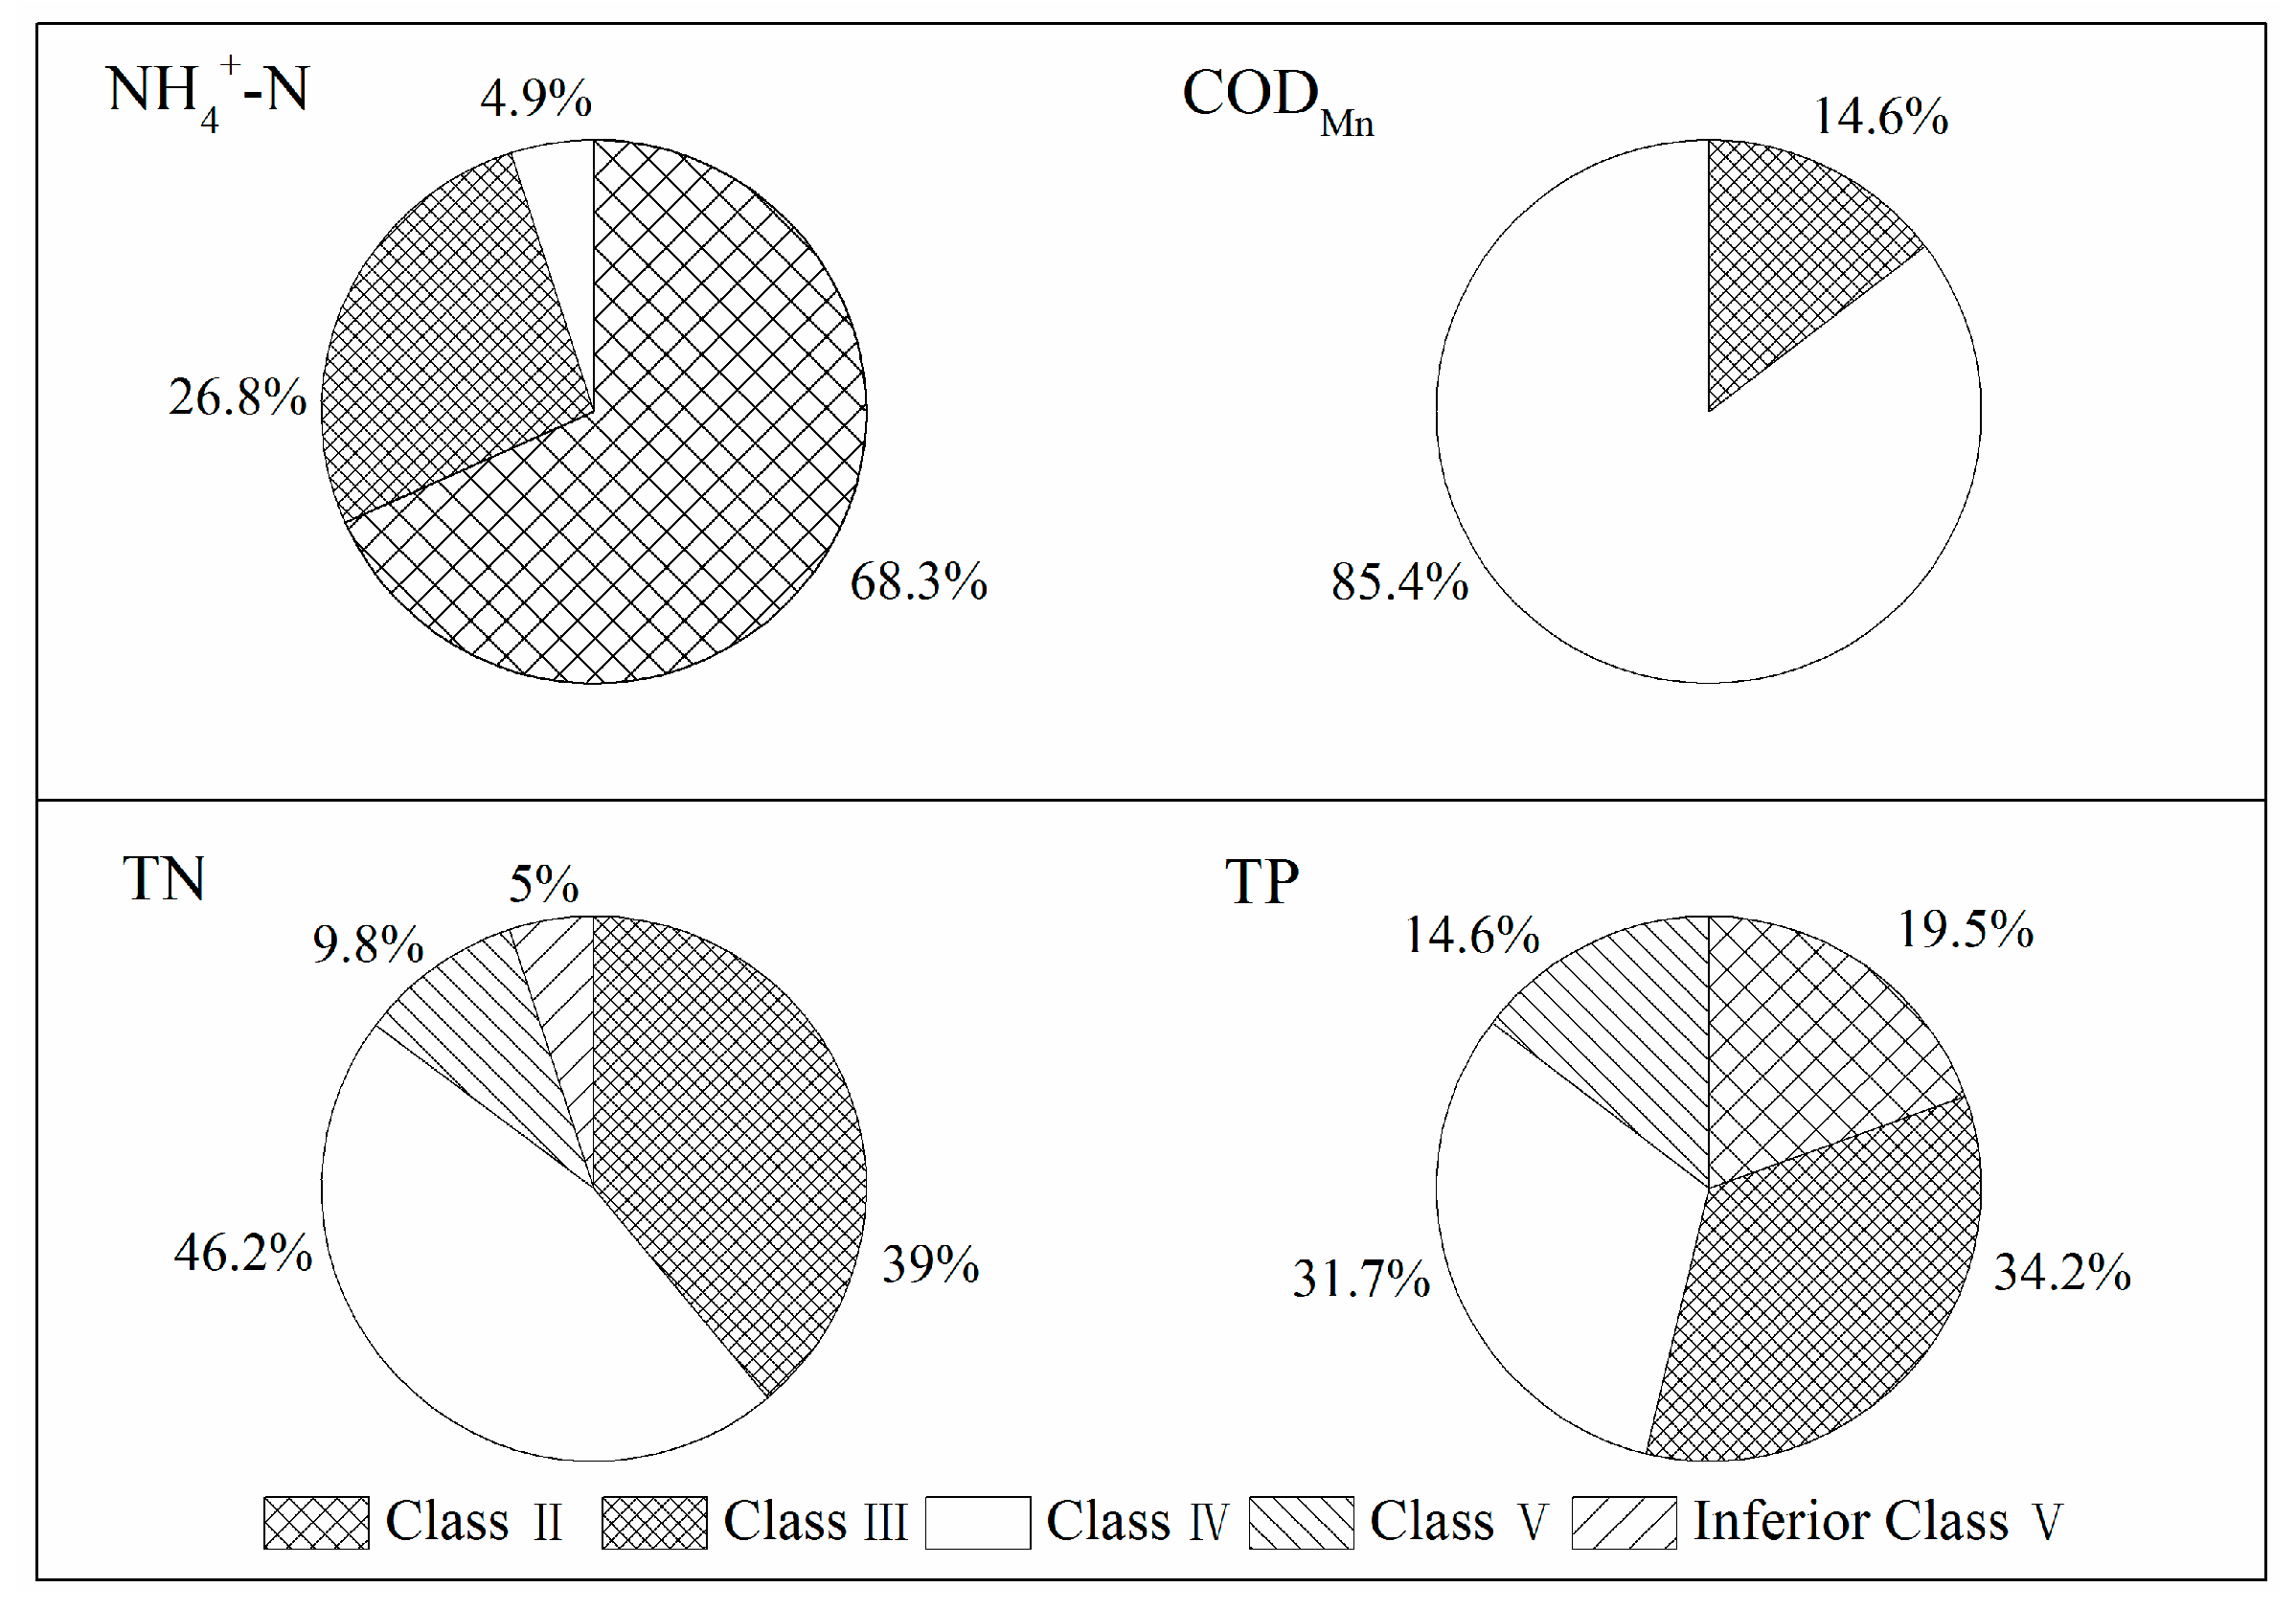
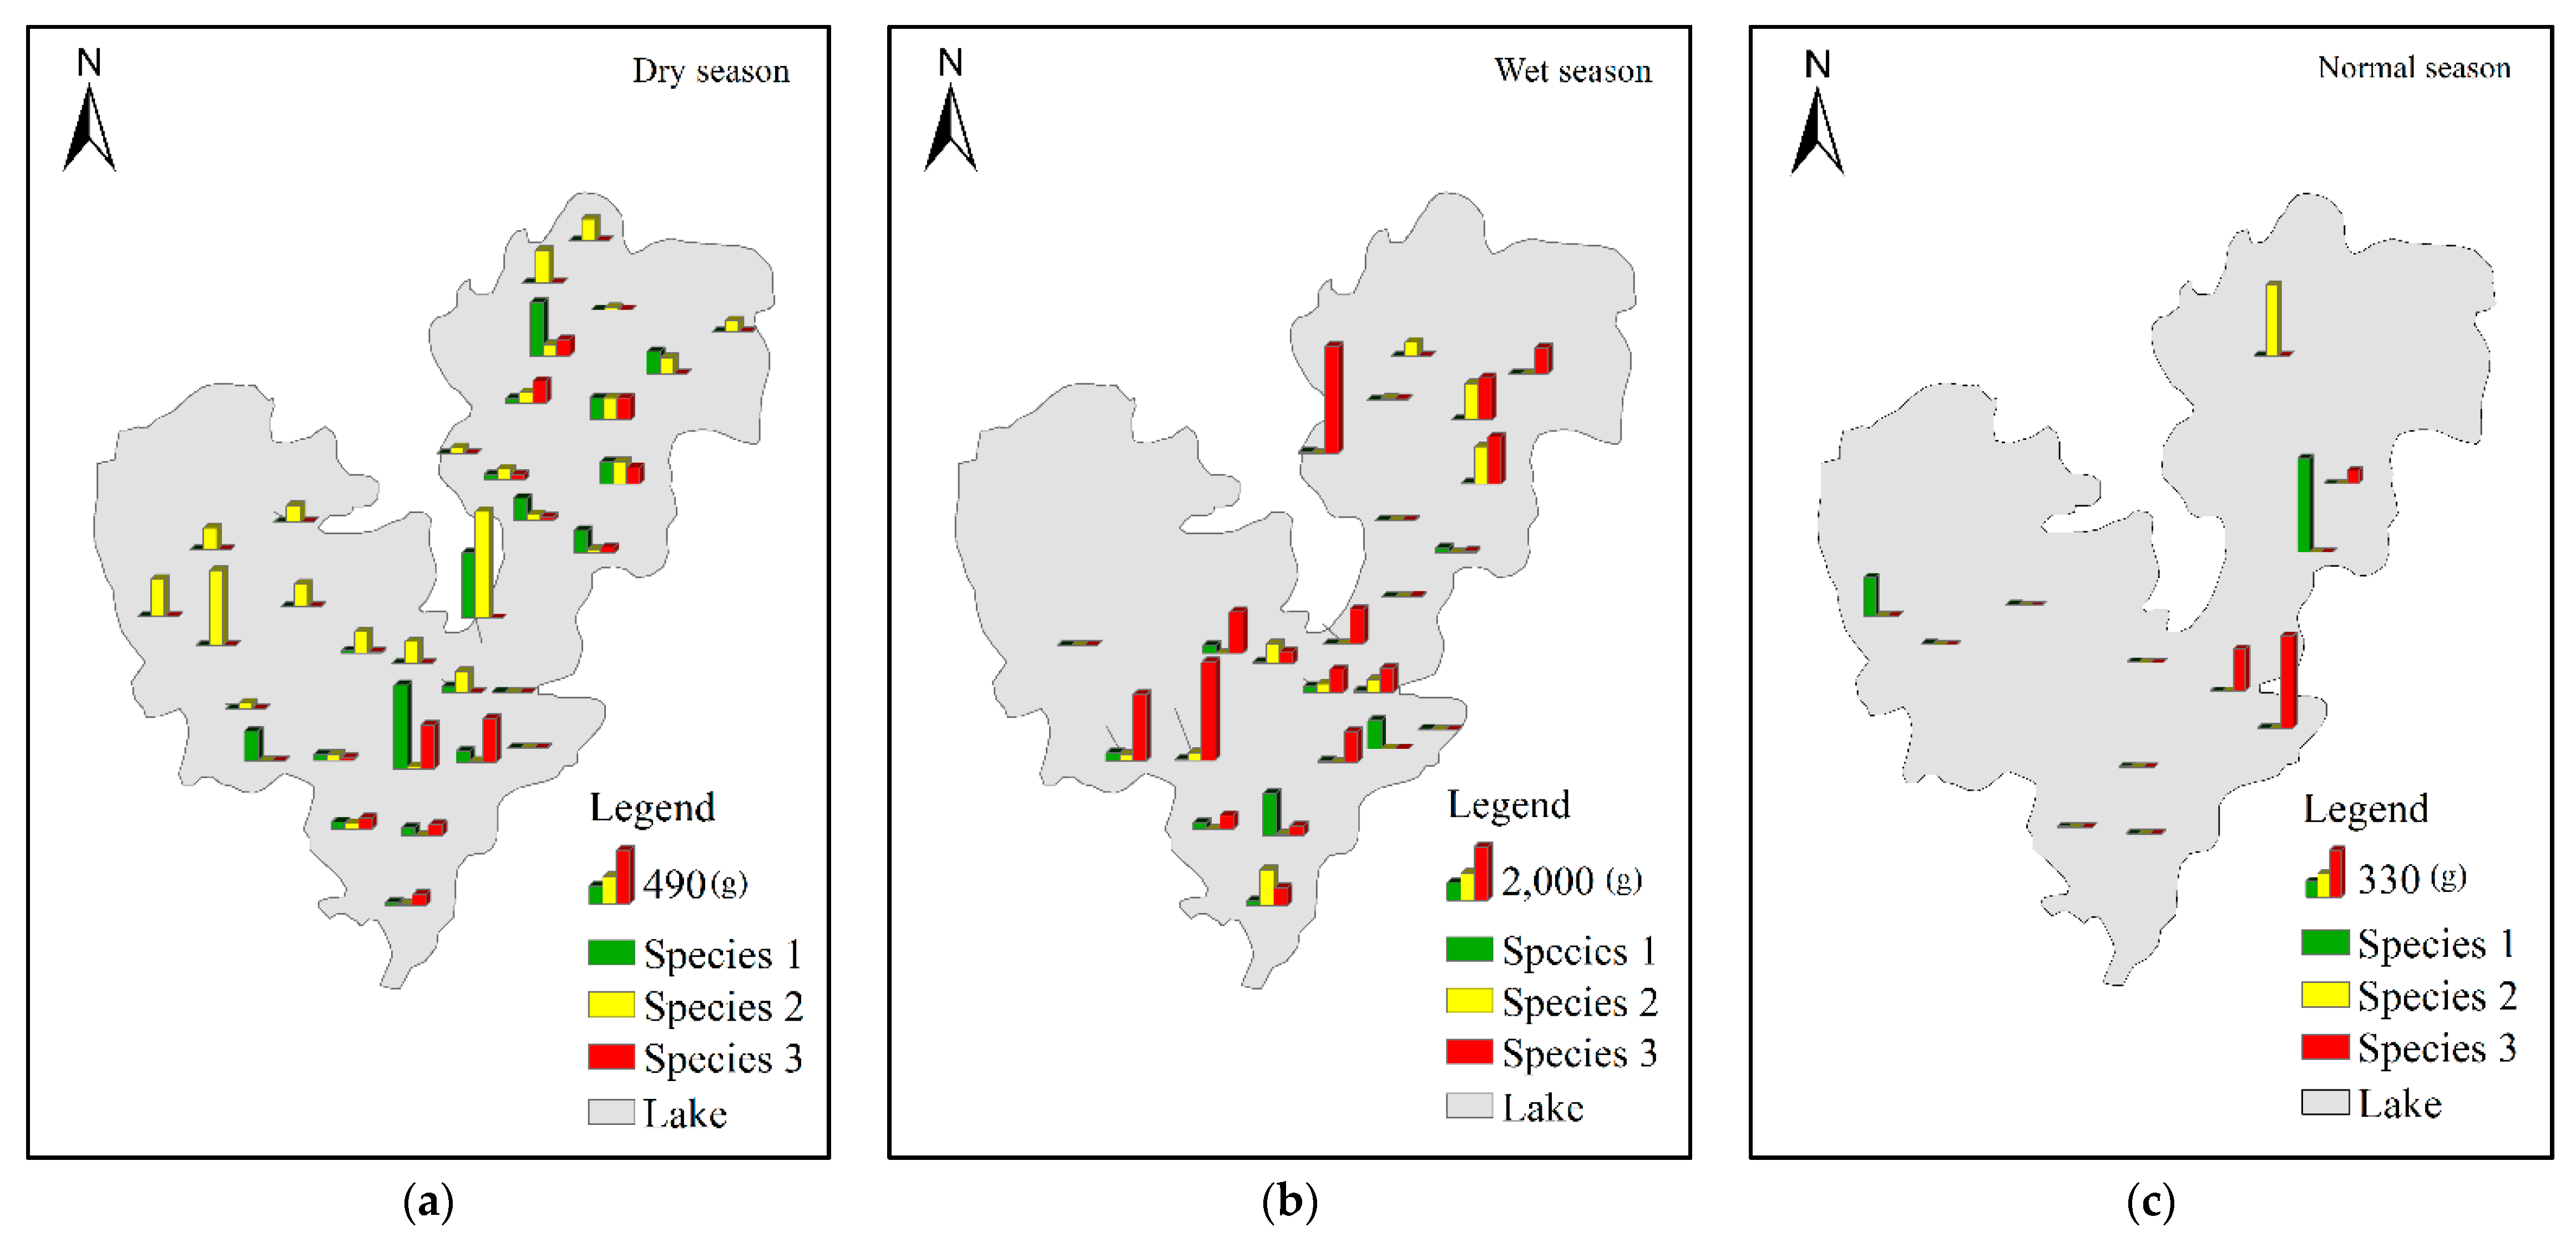
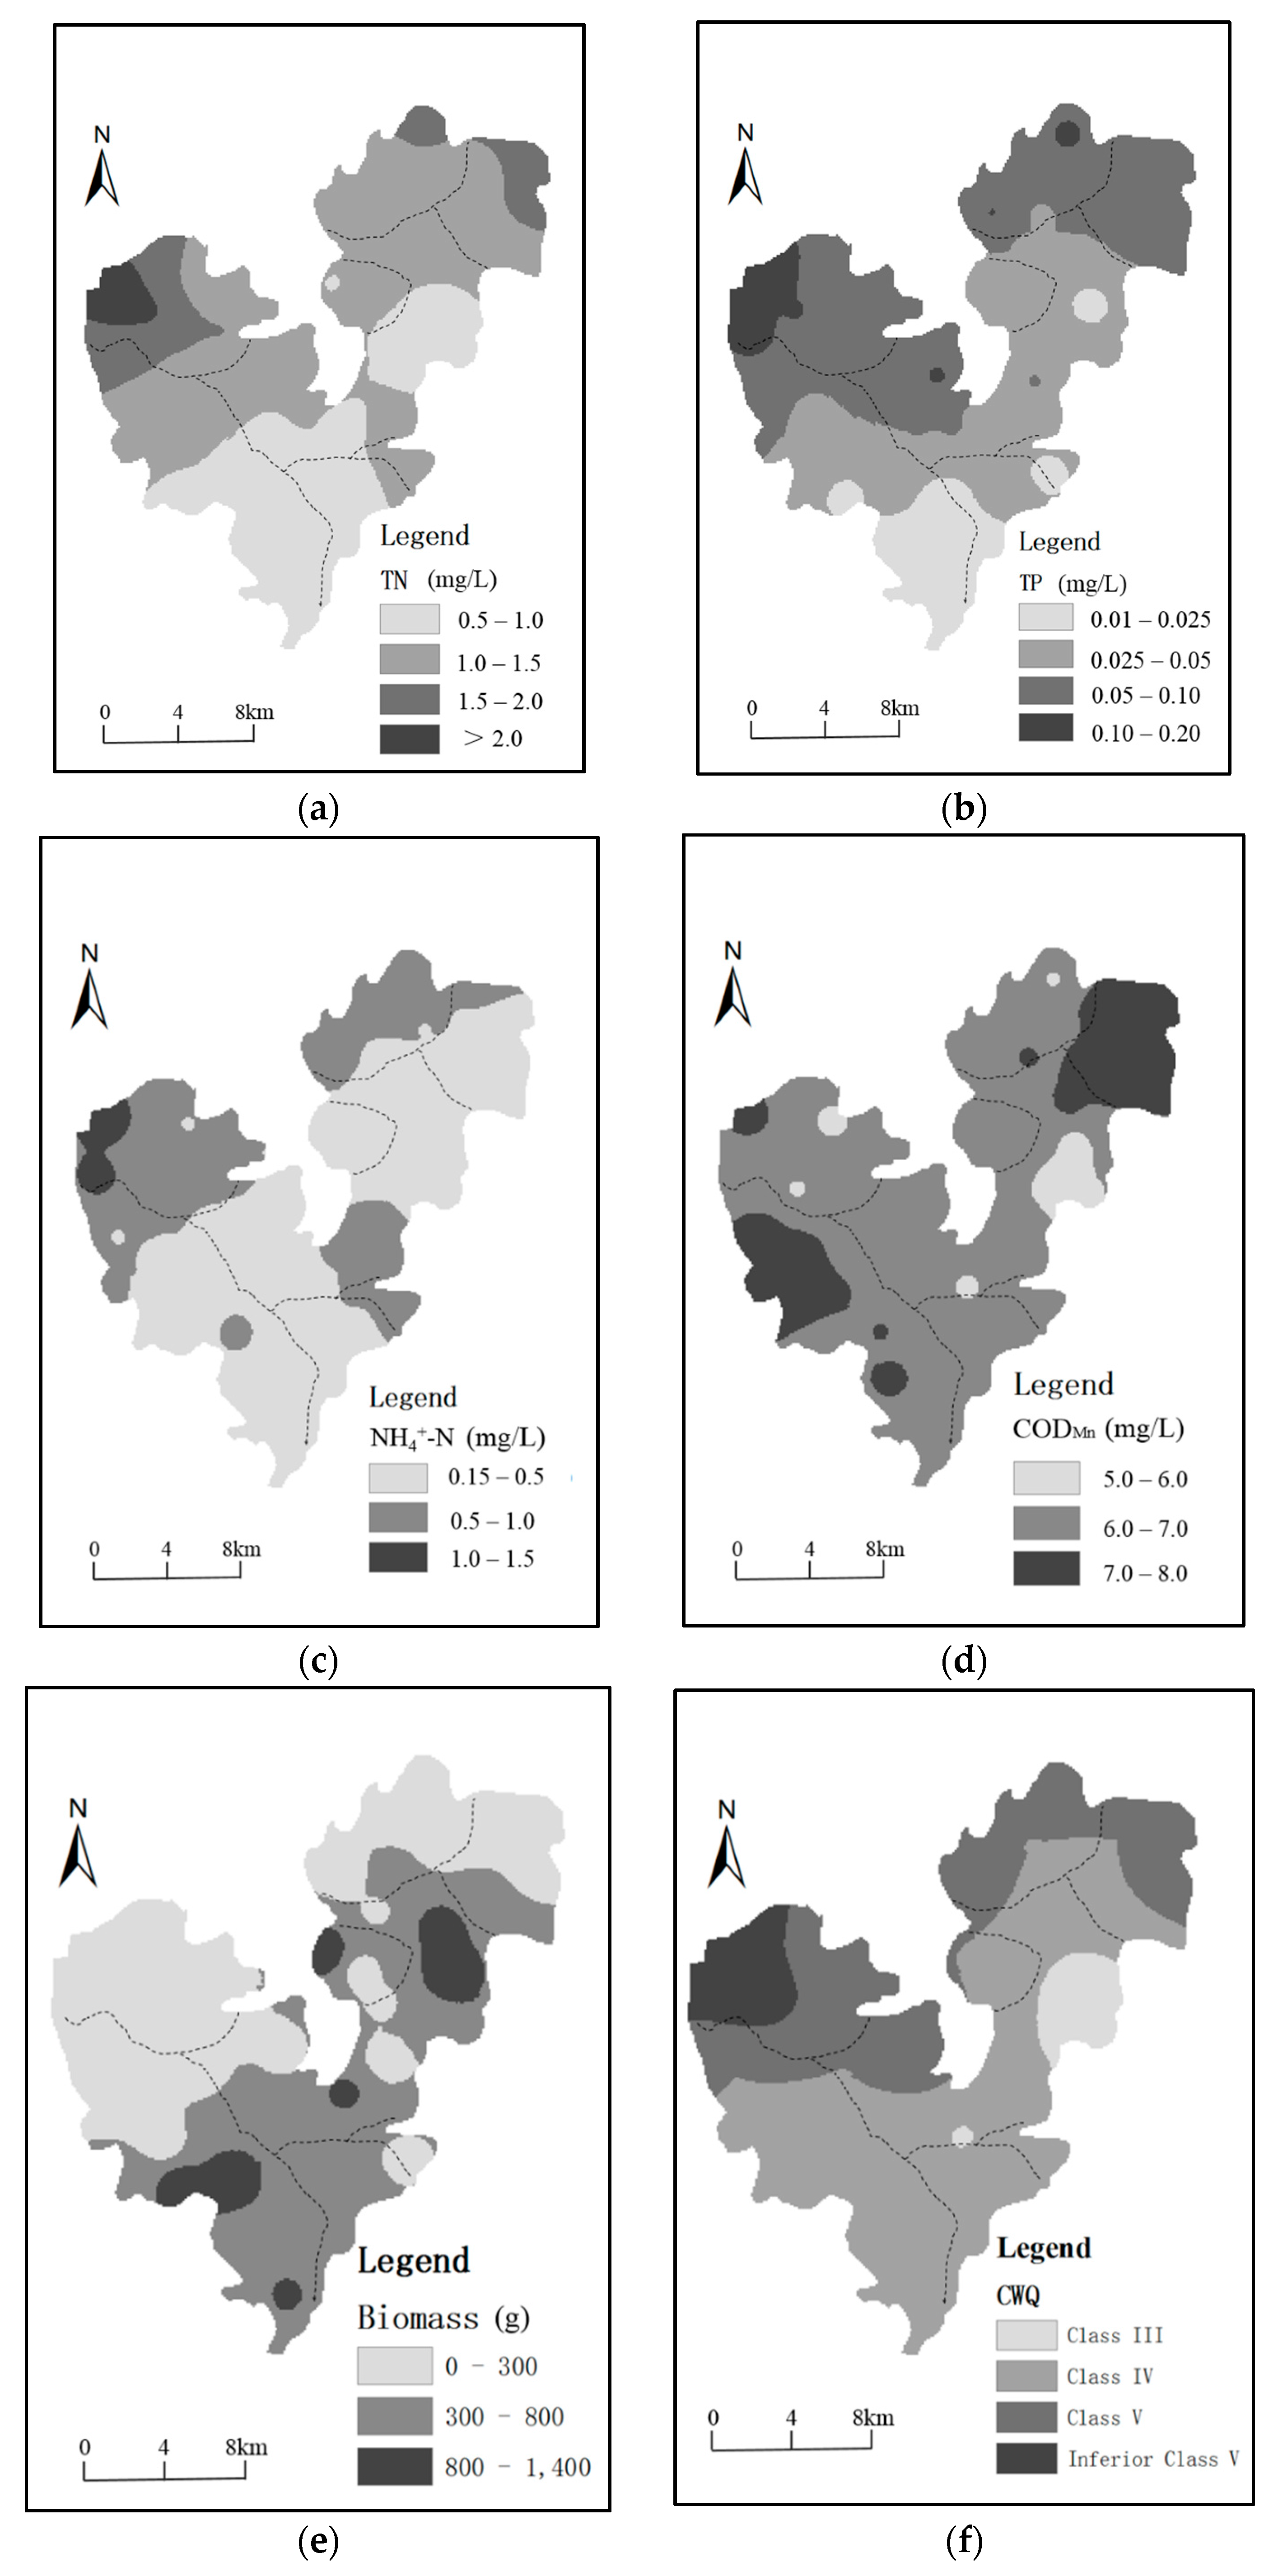
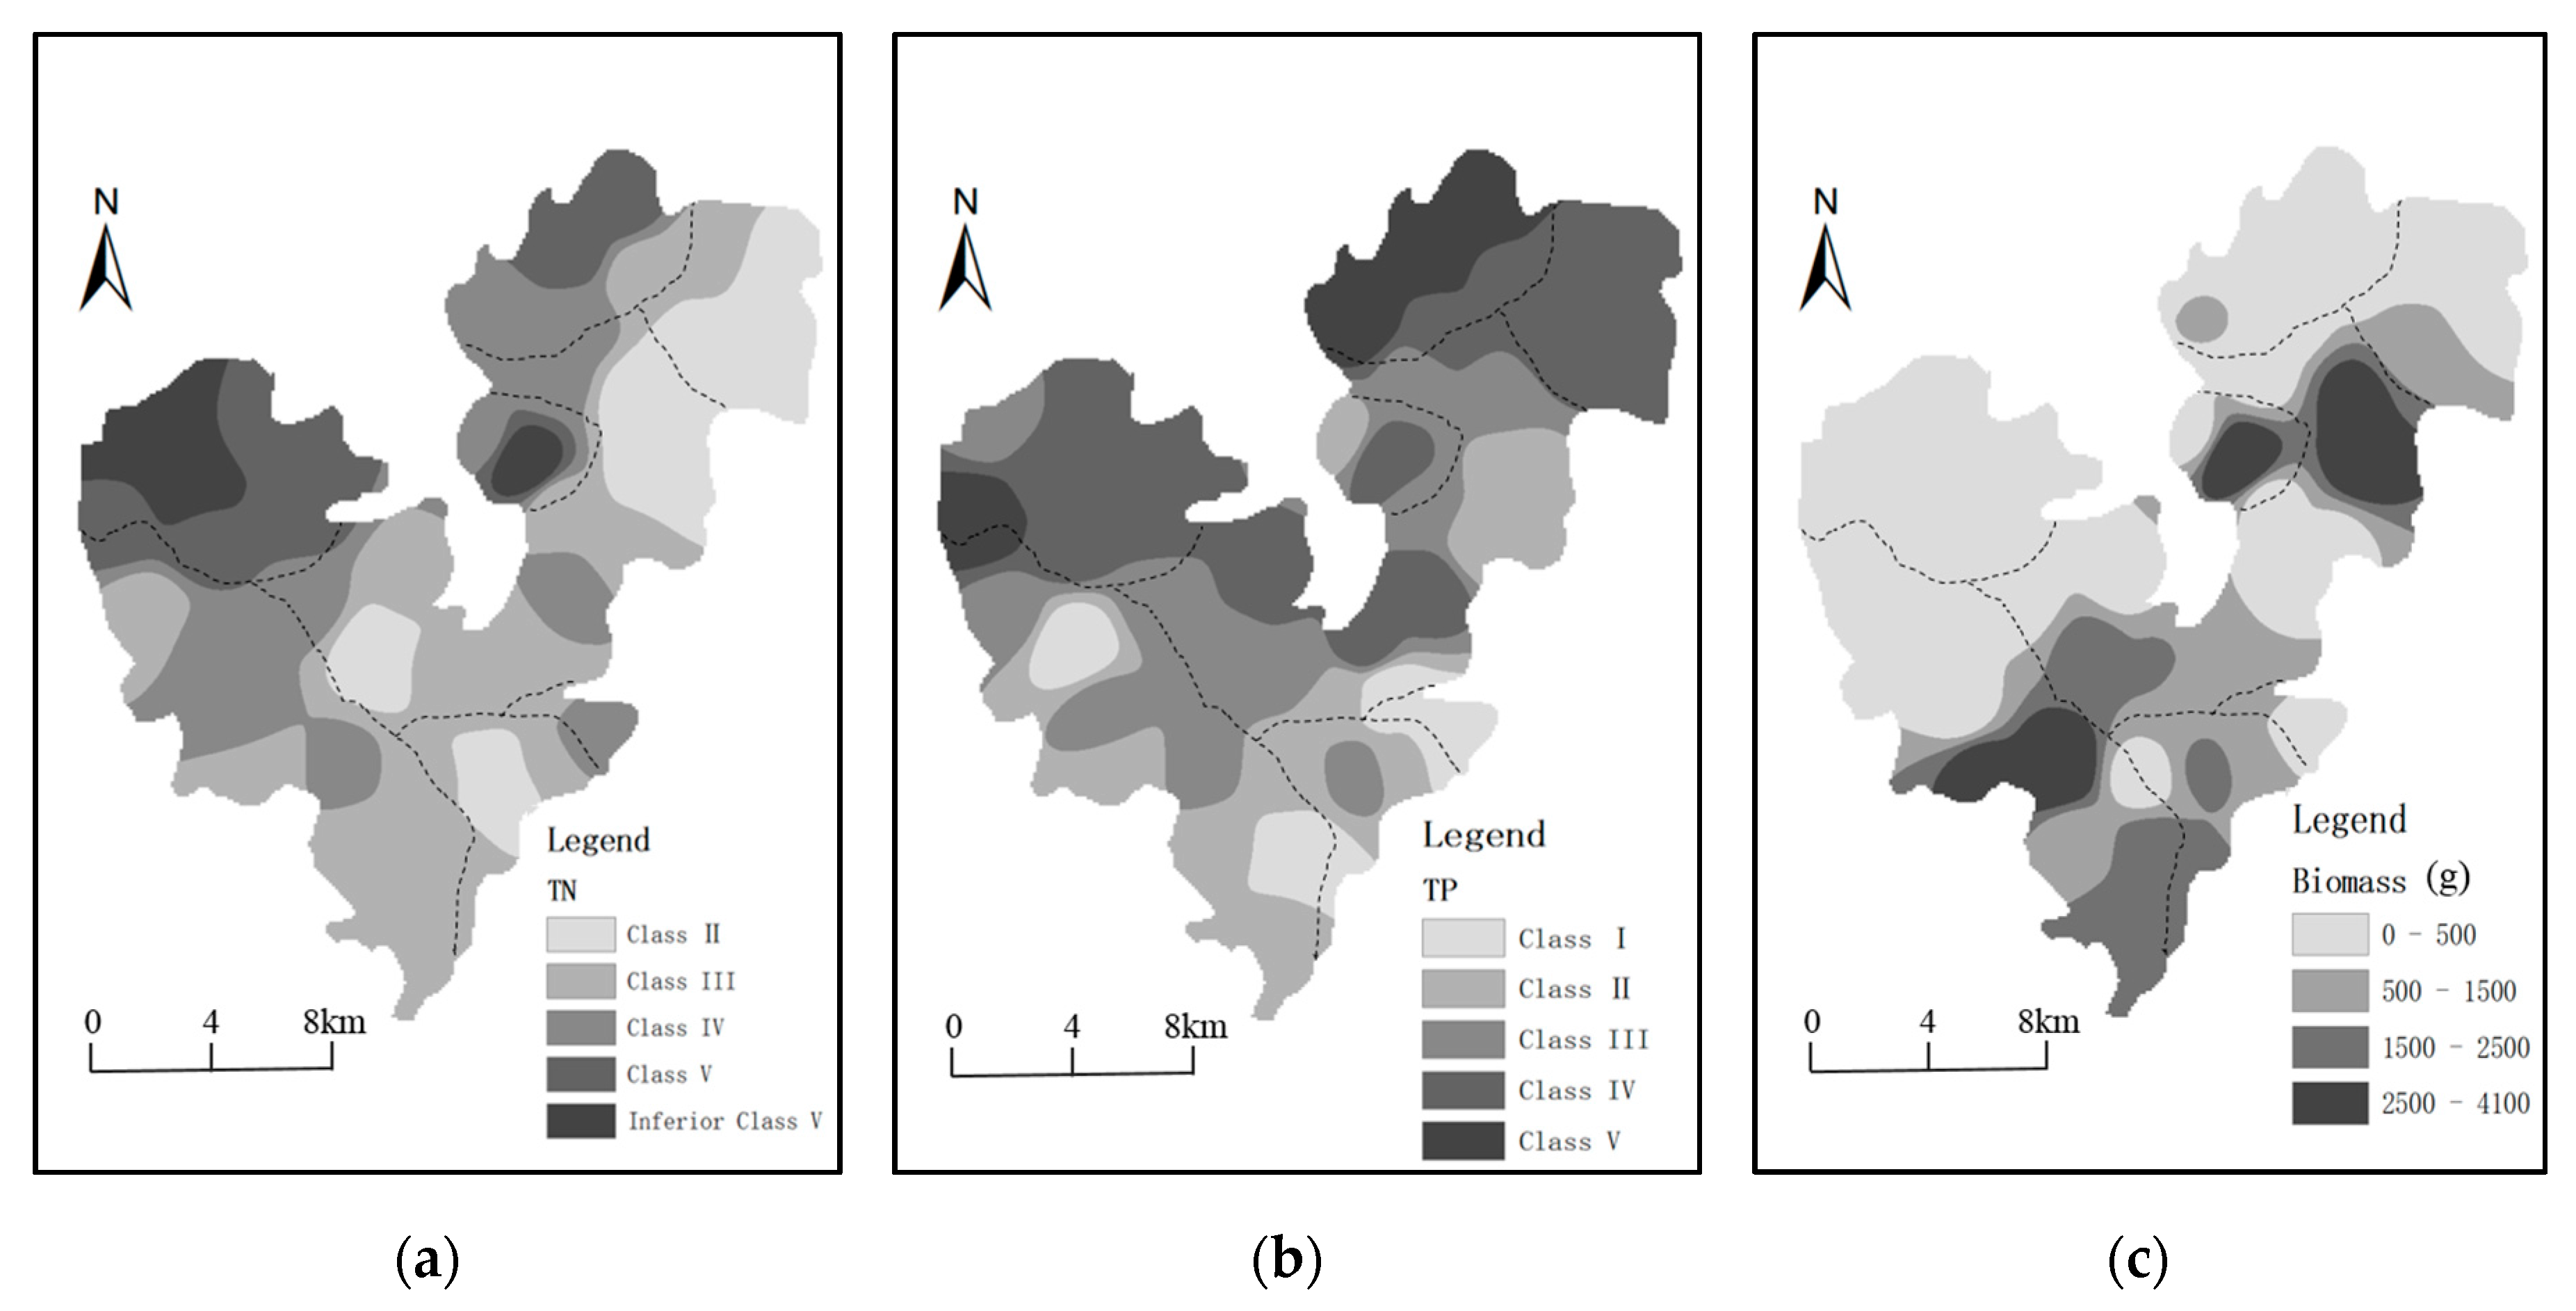
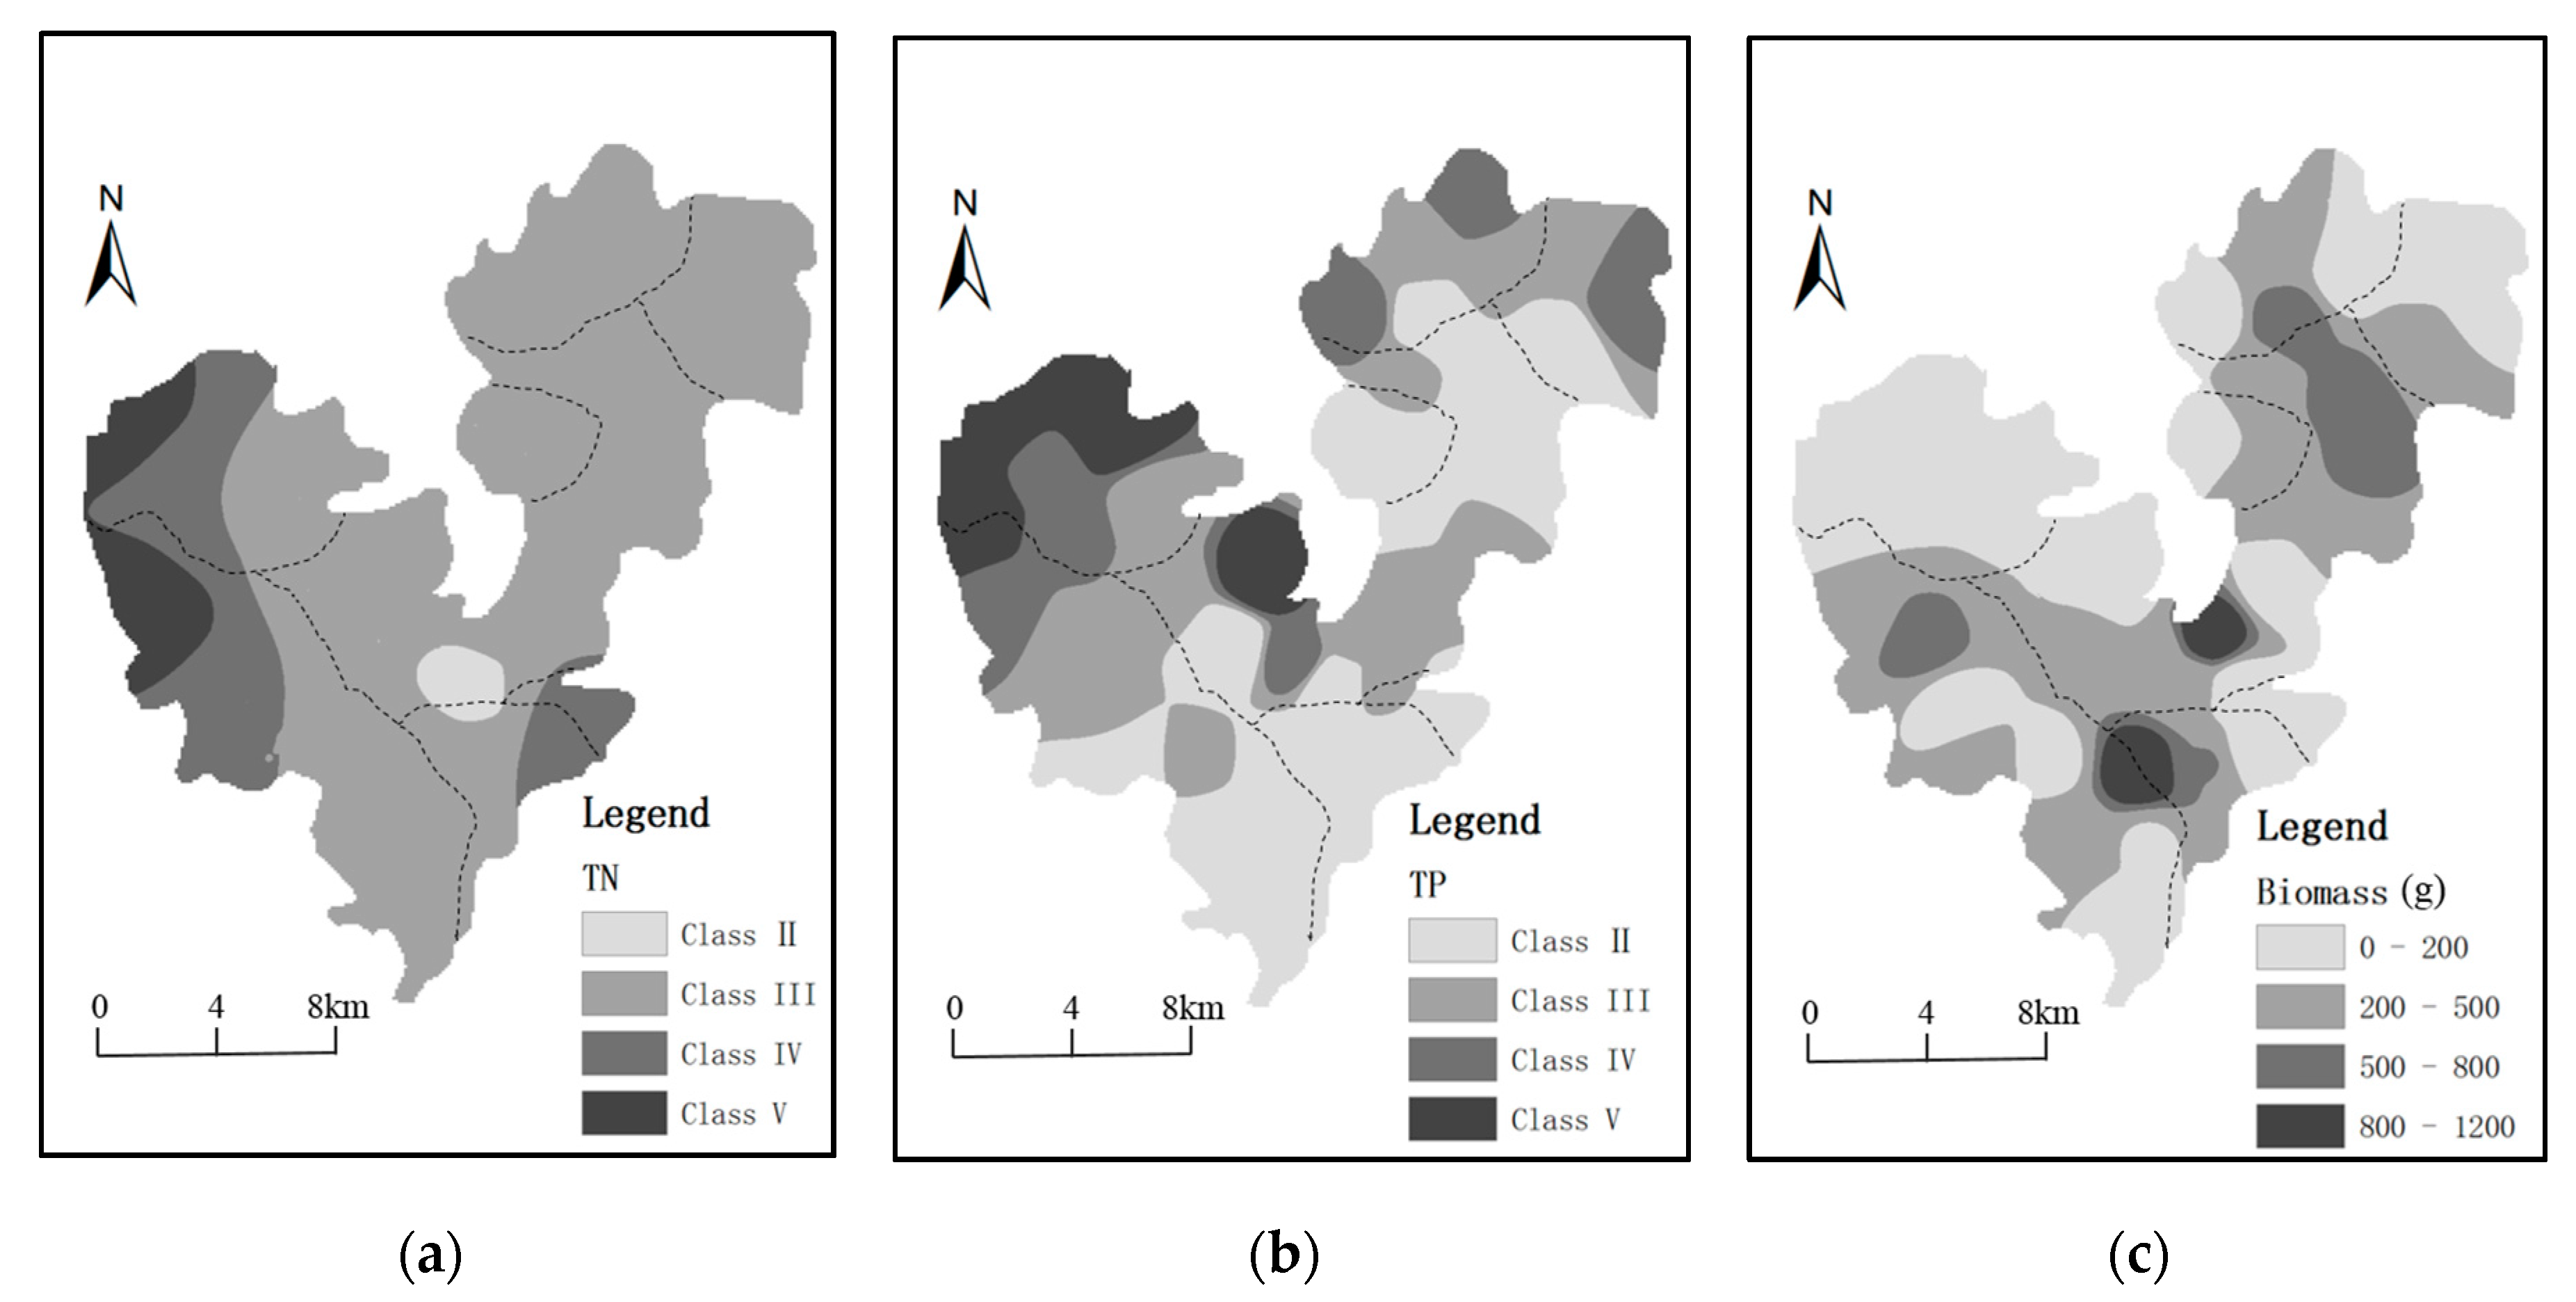
3.2. Spatial Dynamics of Water Quality Parameters and Submerged Aquatic Plant Biomass

The water quality parameter and submerged aquatic plant biomass values at the 41 sampling sites in Honghu Lake were used to obtain their spatial variation in the entire lake using the interpolation method in ArcGIS 10.0. As shown in Figure 4, the values of TN, TP, NH4+–N and CWQ presented similar spatial heterogeneities. The concentrations of TN and TP generally increased from east to west and from south to north over the three seasons. Their values in the river inflow areas were higher than those in other areas. The highest CODMn values were observed in the enclosure culture areas located in the northeastern and southwestern parts of the lake. The value of NH4+–N was consistently low, but it was relatively high in the northern area. Approximately 95.1% of the water samples reached the water quality target, as shown in Figure 4. The transparency was low in the river inflow areas and the area connecting to the Yangtze River in the wet season. Based on the CWQ, the water quality could only be graded as Class V and even inferior Class V in the river inflow areas in the northern area, and it gradually reached the target of Class III in the eastern area of Honghu Lake. Overall, different areas of Honghu Lake were polluted to varying degrees in the following order: river inflow areas > enclosure culture areas > open water area > lake protection area > area connecting to the Yangtze River.
However, the submerged aquatic plant biomass presented an opposite trend of TN and TP concentrations, with higher values in the enclosure culture areas and lower values in the river inflow areas (Figure 4). The spatial distributions of three dominant species were similar to the distribution of total biomass of submerged aquatic plants (Figure 5). Stuckenia pectinata (L.) Börner sago pondweed mainly concentrated in the enclosure culture areas and open water area in dry season. Myriophyllum verticillatum, Stuckenia pectinata (L.) Börner sago pondweed and Ceratophyllum demersum L. were mainly collected in the southern part and open water area in dry and wet seasons. Four other species, Potamogeton malaianus, Potamogeton maackianus, Vallisneria natans and Hydrilla verticillata, were mostly scattered in lake protection area and open water area in dry and wet seasons. In normal season, six kinds of submerged aquatic plants were collected, and most of them were scattered across the entire lake.

3.3. Preliminary Identification of Influencing Factors of Water Quality and Submerged Aquatic Plant Biomass Using PCA

A PCA was implemented to preliminarily identify the influencing factors of water quality and the major causes of the dynamics in submerged aquatic plant biomass over the three seasons. The results of the PCA are shown in Table 2 based on the correlation matrix of the variables. The values of the KMO and Bartlett’s sphericity test were 0.694, 0.650 and 0.545 in the dry, wet and normal seasons, respectively (p < 0.001). Three, four and three factors had eigenvalues greater than 1 in the dry, wet and normal seasons, explaining 74.16%, 80.71%, and 78.60% of the total variance, respectively.
F1 had strong positive correlations with NH4+–N, TN, and TP and a negative correlation with transparency, as shown in Table 2. This factor could explain approximately 40.95%, 34.99%, and 44.14% of the total variance in the dry, wet and normal seasons, respectively. These factors might be interpreted as the influences from point source pollution (e.g., discharge from wastewater and industrial effluents) and non-point source pollution (e.g., agricultural production) [1,37].
Although anthropogenic impacts are generally considered the main determinants of lake pollution, some climatic and geographical factors that reflect the capacity of the lake to buffer nutrient inputs could also play significant roles in explaining variation in water quality. For Honghu Lake, the results of the PCA indicated that F3 (12.68%) in the dry season, F2 (17.39%) and F3 (15.76%) in the wet season, and F2 (19.60%) in the normal season were all correlated with pH, DO and transparency (Table 2), which might be mainly influenced by climatic and geographical factors [38]. Transparency was lowest (between 0.5 m and 1 m) in the area connecting to the Yangtze River, which might be caused by the sediment being stirred up by waves during the frequent water exchange in the lake. The DO concentration ranged from 8.1 mg·L−1 to 11.3 mg·L−1 in the open water area, which might be caused by climatic factors, such as the northeast monsoon in winter and the southeast monsoon in summer [39]. The concentrations of TN and TP were lower than 1 mg·L−1 in the southern area during the three seasons, as the lake received large amounts of water with few pollutants from the Yangtze River. These results appeared to support the notion that climatic and geographical factors, such as water exchange and monsoons, were the main influencing factors in areas of Honghu Lake experiencing lower levels of human activities.

3.4. Correlations between Water Quality Parameters and Submerged Aquatic Plant Biomass

The correlation analyses shown in Table 3 suggest that the biomass of submerged aquatic plants was negatively related to the concentrations of TP and TN and positively associated with transparency in the wet season. These correlations were much stronger in the wet season than in the dry season. Moreover, transparency was negatively correlated to the concentrations of TN and TP. In the dry season, the biomass of submerged aquatic plants was negatively correlated with the concentrations of TP and NH4+–N but was not significantly related to the concentration of TN. However, no obvious correlation between water quality parameters and submerged aquatic plant biomass was observed in the normal season, and the mean biomass was lowest, at 80.2 g, in this season. The spatial distributions of the correlations between TN and TP with biomass in the wet and dry seasons are presented in Figure 6 and Figure 7. The concentrations of TN and TP were obviously higher in the northern area than in other areas, whereas the submerged aquatic plant biomass showed the opposite pattern. Indeed, other water bodies with relatively low concentrations of TN and TP generally have relatively high submerged aquatic plant biomass.
Further investigations were conduct to explore the effects of water quality variables on the growth of different submerged aquatic plants by stepwise multiple linear regression (MLR) method. Results suggested significant interactions between biomass of different submerged aquatic plants and water quality parameters during dry and wet seasons (Table 4). In dry season, biomass of submerged aquatic plants was significantly influenced by the concentrations of NH4+–N. The growth of Myriophyllum verticillatum and Ceratophyllum demersum L. was mainly affected by NH4+–N concentration, and Stuckenia pectinata (L.) Börner sago pondweed was significantly influenced by pH. In wet season, the biomass of Myriophyllum verticillatum, and Ceratophyllum demersum L. was closely associated with TN concentration, and Stuckenia pectinata (L.) Börner sago pondweed was closely related to the water transparency. In addition, the correlation between water quality parameters and biomass of Potamogeton malaianus, Potamogeton maackianus, Vallisneria natans and Hydrilla verticillata are not observed in the three seasons. Overall, it might be concluded that the concentrations of NH4+–N and TN had negative impacts on the growth of submerged aquatic plants, especially Myriophyllum verticillatum and Ceratophyllum demersum L. in dry and wet seasons, respectively, in Honghu Lake.

4. Discussion

4.1. The Close Relationship between Lake Water Quality and Land Use/Economic Development in Surrounding Areas

The water quality of lakes or rivers is affected by the combination of natural and anthropogenic factors, and many anthropogenic factors influence the broad processes of watershed land use or land cover change [40]. Investigations of the relationship between land cover and water quality are particularly useful when considering diffuse source pollution [1]. However, the anthropogenic forces driving the various land–water linkages in different areas of a lake are less studied [41]. Our results suggest that different human activities, such as land use/land cover around the lake, have significant influences on the spatial and seasonal variations in water quality and submerged aquatic plant growth in our study area.

4.1.1. Influences of Agricultural and Social Development on Water Quality

Lakes play a major role in assimilating and transporting industrial and domestic wastewater and surface runoff from agricultural fields. Pollution from agricultural activities is regarded as the major cause of surface water quality degradation, and has attracted growing public concern [42]. Heavy fertilizer application is generally used to increase crop yields, and the subsequent nutrient losses to streams and lakes have serious effects on freshwater ecosystems around the world [40]. In Honghu Lake, the concentrations of TN and TP were highest in river inflow areas (the northern area), where a large number of villages and much agricultural land is located. The annual discharge of TN, TP and NH4+–N in rural domestic wastewater was 905.5 t, 64.9 t and 779.4 t in 2012, respectively [43]. According to a field investigation, there are still no sewage collection or treatment facilities in the rural areas surrounding Honghu Lake, which could result in the direct discharge of untreated industrial and domestic sewage into the lake [30].
In 2012, the rice cultivation area was 46,667 ha and 73,133 ha in Honghu City and Jianli City, respectively, which accounted for 51.8% and 42.5% of the total area of food production. Large quantities of P and N fertilizers were applied to paddy fields and dry land during seeding (in April) and the growing season (in August), and the fertilizer utilization rate was merely 30% (Jingzhou statistical yearbook, 2013). As a result, the concentrations of TN and TP at the entrance to the lake in the northern area increased to 2.692 mg·L−1 and 0.182 mg·L−1, respectively, during the wet season. In addition, the Pearson’s correlation coefficients between TN and TP were 0.411, 0.628 and 0.945 during the dry, wet, and normal seasons, respectively (Table 3), which suggested that the TN and TP might be affected by the same pollution sources. Overall, the dynamics of nutrient levels across regions and seasons in this study might depend on various social and agricultural factors [31,44,45]. In addition, the excessive nutrients from inflowing rivers and surface runoff degraded the water quality in the lake, which is similar to other eutrophic lakes, such as Norrviken Lake in Sweden, Washington Lake in the USA, and Chaohu Lake and Taihu Lake in China [11,46,47].

4.1.2. Influences of Aquaculture Development on Water Quality

The impacts of aquaculture development on the water environment in large shallow lakes have been well documented [31]. One of the most significant effects is the enrichment of the water with phosphorous, organic matter and other nutrients, as well as a decrease in dissolved oxygen. Intensified fish farming has been reported to be a major source of pollution in Honghu Lake [45]. Even though many purse nets have been dismantled in Honghu Lake since 2000, the remaining enclosure culture areas was approximately 9333 ha in 2012, which still exceeded the suggested limit by approximately 6000 ha [43]. In the enclosure culture areas, as the water had little interaction with the inflowing rivers, the concentrations of TN and TP were mainly influenced by the enclosure aquaculture. Similarly, organic nutrients from aquaculture development might increase the concentrations of CODMn, which could be further supported by the results of the PCA, as shown in Table 2. The influencing factors F2 (20.53%) in the dry season, F4 (12.57%) in the wet season and F3 (14.86%) in the normal season were all correlated with CODMn and biomass. However, CODMn was only positively correlated with TN and NH4+–N during the dry season and showed no obvious correlation with TP in any of the three seasons (Table 3). This is different from the results of other studies concerning 103 Chinese lakes, which indicated that CODMn was positively correlated with TN and TP [7]. This discrepancy might have been caused by the large number of baits that contained abundant organic matter in this area, as the numerous purse nets and dense mesh hindered the diffusion of the pollutants. Overall, in the enclosure culture areas, aquaculture was the principal contributor to the pollution of the water.

4.2. Influencing Factors of the Growth of Submerged Aquatic Plants in Different Seasons

Submerged aquatic plants are important components of freshwater ecosystems. The composition of submerged aquatic plants integrates the chemical, biological and spatiotemporal characteristics of their surrounding environments, which could reflect the nutrient supplies of freshwater ecosystems affected by anthropogenic impacts [12,48]. Previous studies demonstrated that nitrogen and phosphorus had significantly adverse effects on the growth of submerged aquatic plants, and the effects of N were even more significant when TP concentration was not high [49,50]. Our results suggested that the submerged aquatic plant biomass was negatively influenced by the concentrations of NH4+–N and TN in dry and wet seasons. Generally, the response of different submerged aquatic plant species to the water quality parameters is not the same in a lake [51,52]. In Honghu Lake, NH4+–N and TN concentrations were dominant water quality variables that limited the growth of Ceratophyllum demersum L. and Myriophyllum verticillatum in dry and wet seasons, respectively. The pH and water transparency were significant factors positively influencing the growth of Stuckenia pectinata (L.) Börner sago pondweed in dry and wet seasons, respectively. It has been demonstrated in many systems that submerged aquatic plant growth can be seasonally inhibited by periphyton growing on their leaves [53], and water transparency can be negatively affected by algal growth in the water column, again affecting the ability of submerged aquatic plants to grow [54,55]. Therefore, in shallow lakes, increased N and P concentrations could raise the productivity of phytoplankton and periphyton [49], and then influence the growth of submerged aquatic plants in different seasons. As far as Honghu Lake is concerned, the reduction in both N and P loads is essential for the growth of submerged aquatic plants and long-term management of eutrophication in water system [56].
In our study area, the submerged aquatic plant biomass was also influenced by the change in temperature, light and water level. The biomass of submerged aquatic plants in summer is directly related to the peak in solar radiation peak and the enrichment of nutrients [57]. The florescence and fruiting periods of Stuckenia pectinata (L.) Börner sago pondweed, as well as the fruiting period of Ceratophyllum demersum L. and Myriophyllum verticillatum, generally occur during the wet season [58,59]. Similarly, these plants could assimilate a large amount of pollutants in the water during this season. In agreement with this, the average concentrations of TN, TP and CODMn declined from 1.25 mg·L−1, 0.057 mg·L−1 and 4.63 mg·L−1 in 2011 to 1.15 mg·L−1, 0.052 mg·L−1 and 4.45 mg·L−1, respectively, during the wet season in 2012. During the cold season, reduced water temperatures, water level and light intensity are unfavorable for the growth of aquatic plants [60], and the biomass decreased to the lowest level in Honghu Lake.

4.3. Implications for Future Water Quality Management in Honghu Lake

The spatial and seasonal variations in water quality and submerged aquatic plant biomass were related to the regional characteristics and development of the Honghu Lake Basin, and their spatial characteristics were consistent with the functional zoning suggested by a previous study [32]. Our analyses provide insight regarding how nutrient concentrations have changed over time in the lake and how natural features and human activities have contributed to this variation. With increasing demand from urbanization and industrialization, the growing inputs of pollutants, mainly arising from sewage discharges and fertilizer runoff or aquaculture, have resulted in the significant degradation of water quality in freshwater ecosystems [61]. To alleviate the water pollution in Honghu Lake, the discharge of industrial and domestic sewage near the northern area should be controlled, and the development of aquaculture and the application of fertilizers or pesticides should be reduced. In addition, further studies are needed to investigate the correlation between long-term changes in land use and water quality at multiple scales in this watershed. Remote sensing techniques are useful for mapping and monitoring the variation in water quality and aquatic vegetation over long periods and at large scales.

5. Conclusions

Here, Honghu Lake in China was used as a case study to illustrate the spatial and seasonal variations in water quality and the growth of aquatic plants, as well as their influencing factors using a combination of GIS interpolation and PCA methods. The results indicate that water quality and submerged aquatic plant biomass showed significant spatial and seasonal variations, especially in areas near the outlets of inflowing rivers and those surrounded by human settlements and agricultural activities. The influencing factors of water quality changed over space and time. The point and non-point sources of pollution caused by human activities were the main factors influencing the water quality in the river inflow areas. The water quality in the enclosure culture areas was mainly influenced by organic pollution from nearby aquaculture development. The relatively clean water in the open water area, lake protection area and area connecting to the Yangtze River was mainly caused by climatic and geographical factors (e.g., monsoons and water exchange). In addition, the growth and distribution of submerged aquatic plants were closely correlated with climatic factors and nutrient concentrations in different areas, and high concentration of N caused by anthropogenic activities might limit the growth of submerged aquatic plants. These findings provide important information for the future management of water quality in this lake or even the entire lake basin.

Supplementary Materials

The following are available online at www.mdpi.com/2073-4441/9/9/707/s1, Table S1: The mean values of raw date for water quality parameters at all sampling sites in 14–15 April 2013 (dry season), Table S2: The mean values of raw date for water quality parameters at all sampling sites in 20–21 August 2012 (wet season), Table S3: The mean values of raw date for water quality parameters at all sampling sites in 12–13 December 2012 (normal season), Table S4: Summary statistics of measured variables for Honghu Lake during dry, wet and normal seasons, Table S5: Summary statistics of submerged aquatic plants biomass (g) for Honghu Lake during dry, wet and normal seasons.

Acknowledgments

This research was financially supported by the National Key Research and Development Program of China (No. 2016YFC0502705), the Key Program of the National Social Science Foundation of China (Grant No. 14ZDB140) and the National Natural Science Foundation of China (No. 41501194). We acknowledge the Environmental Protection Bureau and Environment Science Institute of Jingzhou City for providing data. We express our thanks to the students and teachers of Hubei University for assistance in analyzing the water samples in the laboratory.

Author Contributions

Kun Li and Zhaohua Li conceived and designed the experiments; Kun Li and Ling Wang performed the experiments; Kun Li and Qing Fang analyzed the data; Kun Li contributed reagents/materials/analysis tools; and Kun Li, Yujing Xie and Xiangrong Wang wrote the paper.

Conflicts of Interest

The authors declare no conflict of interest.

Appendix A

Table A1. The environmental guidelines (GB3838-2002) of water quality for Honghu Lake.
ParametersEnvironmental Guidelines
Class IClass IIClass IIIClass IVClass V
pH6–9
Transparency (m)-
DO (mg/L)>7.56532
NH4+–N (mg/L)<0.150.51.01.52.0
TN (mg/L)<0.20.51.01.52.0
TP (mg/L)<0.010.0250.050.10.2
CODMn (mg/L)<2451015
Biomass (g)-

References

  1. Mouri, G.; Takizawa, S.; Oki, T. Spatial and temporal variation in nutrient parameters in stream water in a rural-urban catchment, Shikoku, Japan: Effects of land cover and human impact. J. Environ. Manag. 2011, 92, 1837–1848. [Google Scholar] [CrossRef] [PubMed]
  2. Zhu, M.; Zhu, G.; Zhao, L.; Yao, X.; Zhang, Y.; Gao, G.; Qin, B. Influence of algal bloom degradation on nutrient release at the sediment—Water interface in Lake Taihu, China. Environ. Sci. Pollut. Res. 2013, 20, 1803–1811. [Google Scholar] [CrossRef] [PubMed]
  3. Mainstone, C.P.; Parr, W. Phosphorus in rivers-ecology and management. Sci. Total Environ. 2002, 282, 25–47. [Google Scholar] [CrossRef]
  4. Poquet, J.M.; Mezquita, F.; Rueda, J.; Miracle, M.R. Loss of Ostracoda biodiversity in Western Mediterranean wetlands. Aquat. Conserv. Mar. Freshw. Ecosyst. 2008, 18, 280–296. [Google Scholar] [CrossRef]
  5. Le, C.; Zha, Y.; Li, Y.; Sun, D.; Lu, H.; Yin, B. Eutrophication of lake waters in China: Cost, causes, and control. Environ. Manag. 2010, 45, 662–668. [Google Scholar] [CrossRef] [PubMed]
  6. Wang, M.; Shi, W.; Tang, J. Water property monitoring and assessment for China’s inland Lake Taihu from MODIS-Aqua measurements. Remote Sens. Environ. 2011, 115, 841–854. [Google Scholar] [CrossRef]
  7. Liu, W.; Zhang, Q.; Liu, G. Lake eutrophication associated with geographic location, lake morphology and climate in China. Hydrobiologia 2010, 644, 289–299. [Google Scholar] [CrossRef]
  8. Chang, B.; Li, R.; Zhu, C.; Liu, K. Quantitative impacts of climate change and human activities on water-surface area variations from the 1990s to 2013 in Honghu Lake, China. Water 2015, 7, 2881–2899. [Google Scholar] [CrossRef]
  9. Nyairo, W.N.; Owuor, P.O.; Kengara, F.O. Effect of anthropogenic activities on the water quality of Amala and Nyangores tributaries of River Mara in Kenya. Environ. Monit. Assess. 2015, 187, 691. [Google Scholar] [CrossRef] [PubMed]
  10. Fatema, K.; Maznah, W.W.; Isa, M. Spatial variation of water quality parameters in a mangrove estuary. Int. J. Environ. Sci. Technol. 2015, 12, 2091–2102. [Google Scholar] [CrossRef]
  11. Shang, G.; Shang, J. Spatial and temporal variations of eutrophication in Western Chaohu Lake, China. Environ. Monit. Assess. 2007, 130, 99–109. [Google Scholar] [CrossRef] [PubMed]
  12. Lacoul, P.; Freedman, B. Environmental influences on aquatic plants in freshwater ecosystems. Environ. Rev. 2006, 14, 89–136. [Google Scholar] [CrossRef]
  13. Lewis, W.M.; Wurtsbaugh, W.A. Control of lacustrine phytoplankton by nutrients: Erosion of the phosphorus paradigm. Int. Rev. Hydrobiol. 2008, 93, 446–465. [Google Scholar] [CrossRef]
  14. Kurunc, A.; Ersahin, S.; Sonmez, N.K.; Kaman, H.; Uz, I.; Uz, B.Y.; Aslan, G.E. Seasonal changes of spatial variation of some groundwater quality variables in a large irrigated coastal Mediterranean region of Turkey. Sci. Total Environ. 2016, 554, 53–63. [Google Scholar] [CrossRef] [PubMed]
  15. Ionita, M.; Lohmann, G.; Rimbu, N.; Chelcea, S.; Dima, M. Interannual to decadal summer drought variability over Europe and its relationship to global sea surface temperature. Clim. Dyn. 2012, 38, 363–377. [Google Scholar] [CrossRef]
  16. Lehner, B.; Döll, P. Development and validation of a global database of lakes, reservoirs and wetlands. J. Hydrol. 2004, 296, 1–22. [Google Scholar] [CrossRef]
  17. Borics, G.; Nagy, L.; Miron, S.; Grigorszky, I.; László-Nagy, Z.; Lukács, B.A.; László, G.; Várbíró, G. Which factors affect phytoplankton biomass in shallow eutrophic lakes? Hydrobiologia 2013, 714, 93–104. [Google Scholar] [CrossRef] [Green Version]
  18. Hampton, S.E.; Izmest, E.; Lyubov, R.; Moore, M.V.; Katz, S.L.; Dennis, B.; Silow, E.A. Sixty years of environmental change in the world’s largest freshwater lake–Lake Baikal, Siberia. Glob. Chang. Biol. 2008, 14, 1947–1958. [Google Scholar] [CrossRef]
  19. Drevnick, P.E.; Engstrom, D.R.; Driscoll, C.T.; Swain, E.B.; Balogh, S.J.; Kamman, N.C.; Long, D.T.; Muir, D.G.; Parsons, M.J.; Rolfhus, K.R. Spatial and temporal patterns of mercury accumulation in lacustrine sediments across the Laurentian Great Lakes region. Environ. Pollut. 2012, 161, 252–260. [Google Scholar] [CrossRef] [PubMed]
  20. Tsugeki, N.K.; Urabe, J.; Hayami, Y.; Kuwae, M.; Nakanishi, M. Phytoplankton dynamics in Lake Biwa during the 20th century: Complex responses to climate variation and changes in nutrient status. J. Paleolimnol. 2010, 44, 69–83. [Google Scholar] [CrossRef]
  21. Zhang, X.; Liu, M. Assessing the spatial and temporal patterns of seasonal precipitation extremes and the potential influencing factors in Dongting Lake basin, China. Water 2016, 8, 558. [Google Scholar] [CrossRef]
  22. Chen, Y.; Zhao, K.; Wu, Y.; Gao, S.; Cao, W.; Bo, Y.; Shang, Z.; Wu, J.; Zhou, F. Spatio-Temporal Patterns and Source Identification of Water Pollution in Lake Taihu (China). Water 2016, 8, 86. [Google Scholar] [CrossRef]
  23. Liu, W.; Yu, H.L.; Chung, C. Assessment of water quality in a subtropical alpine lake using multivariate statistical techniques and geostatistical mapping: A case study. Int. J. Environ. Res. Public Health 2011, 8, 1126–1140. [Google Scholar] [CrossRef] [PubMed]
  24. Shen, P.; Shi, Q.; Hua, Z.; Kong, F.; Wang, Z.; Zhuang, S.; Chen, D. Analysis of microcystins in cyanobacteria blooms and surface water samples from Meiliang Bay, Taihu Lake, China. Environ. Int. 2003, 29, 641–647. [Google Scholar] [CrossRef]
  25. Chen, Y.; Qin, B.; Teubner, K.; Dokulil, M.T. Long-term dynamics of phytoplankton assemblages: Microcystis-domination in Lake Taihu, a large shallow lake in China. J. Plankton Res. 2003, 25, 445–453. [Google Scholar] [CrossRef]
  26. Pla, S.; Paterson, A.M.; Smol, J.P.; Clark, B.J.; Ingram, R. Spatial variability in water quality and surface sediment diatom assemblages in a complex lake basin: Lake of the Woods, Ontario, Canada. J. Gt. Lakes Res. 2005, 31, 253–266. [Google Scholar] [CrossRef]
  27. Malik, R.N.; Nadeem, M. Spatial and temporal characterization of trace elements and nutrients in the Rawal Lake Reservoir, Pakistan using multivariate analysis techniques. Environ. Geochem. Health 2011, 33, 525–541. [Google Scholar] [CrossRef] [PubMed]
  28. Hu, L.; Hu, W.; Zhai, S.; Wu, H. Effects on water quality following water transfer in Lake Taihu, China. Ecol. Eng. 2010, 36, 471–481. [Google Scholar] [CrossRef]
  29. Razmkhah, H.; Abrishamchi, A.; Torkian, A. Evaluation of spatial and temporal variation in water quality by pattern recognition techniques: A case study on Jajrood River (Tehran, Iran). J. Environ. Manag. 2010, 91, 852–860. [Google Scholar] [CrossRef] [PubMed]
  30. Li, T.; Cai, S.; Yang, H.; Wang, X.; Wu, S.; Ren, X. Fuzzy comprehensive-quantifying assessment in analysis of water quality: A case study in Lake Honghu, China. Environ. Eng. Sci. 2009, 26, 451–458. [Google Scholar] [CrossRef]
  31. Zhang, T.; Ban, X.; Wang, X.; Cai, X.; Li, E.; Wang, Z.; Yang, C.; Zhang, Q.; Lu, X. Analysis of nutrient transport and ecological response in Honghu Lake, China by using a mathematical model. Sci. Total Environ. 2017, 575, 418–428. [Google Scholar] [CrossRef] [PubMed]
  32. Wang, X.; Li, E.; Yu, J.; Deng, F. Aquatic vegetation landscape anisotropy and its dynamic change of Honghu Lake in response to ecological restoration. Wetl. Sci. 2010, 8, 105–109. (In Chinese) [Google Scholar]
  33. Meng, Q.; Liu, Z.; Borders, B.E. Assessment of regression kriging for spatial interpolation-comparisons of seven GIS interpolation methods. Cartogr. Geogr. Inf. Sci. 2013, 40, 28–39. [Google Scholar] [CrossRef]
  34. Murphy, R.R.; Curriero, F.C.; Ball, W.P. Comparison of spatial interpolation methods for water quality evaluation in the Chesapeake Bay. J. Environ. Eng. 2009, 136, 160–171. [Google Scholar] [CrossRef]
  35. Chen, T.; Ren, L.; Yuan, F.; Yang, X.; Jiang, S.; Tang, T.; Liu, Y.; Zhao, C.; Zhang, L. Comparison of Spatial Interpolation Schemes for Rainfall Data and Application in Hydrological Modeling. Water 2017, 9, 342. [Google Scholar] [CrossRef]
  36. Berhanu, B.; Seleshi, Y.; Demisse, S.S.; Melesse, A.M. Flow regime classification and hydrological characterization: A case study of Ethiopian Rivers. Water 2015, 7, 3149–3165. [Google Scholar] [CrossRef]
  37. Huang, F.; Wang, X.; Lou, L.; Zhou, Z.; Wu, J. Spatial variation and source apportionment of water pollution in Qiantang River (China) using statistical techniques. Water Res. 2010, 44, 1562–1572. [Google Scholar] [CrossRef] [PubMed]
  38. Wilbers, G.J.; Becker, M.; Nga, L.T.; Sebesvari, Z.; Renaud, F.G. Spatial and temporal variability of surface water pollution in the Mekong Delta, Vietnam. Sci. Total Environ. 2014, 485, 653–665. [Google Scholar] [CrossRef] [PubMed]
  39. Dykoski, C.A.; Edwards, R.L.; Cheng, H.; Yuan, D.; Cai, Y.; Zhang, M.; Lin, Y.; Qing, J.; An, Z.; Revenaugh, J. A high-resolution, absolute-dated Holocene and deglacial Asian monsoon record from Dongge Cave, China. Earth Planet. Sci. Lett. 2005, 233, 71–86. [Google Scholar] [CrossRef]
  40. Lee, S.; Hwang, S.; Lee, S.; Hwang, H.; Sung, H. Landscape ecological approach to the relationships of land use patterns in watersheds to water quality characteristics. Landsc. Urban Plan. 2009, 92, 80–89. [Google Scholar] [CrossRef]
  41. Zhao, W.; Zhu, X.; Sun, X.; Shu, Y.; Li, Y. Water quality changes in response to urban expansion: Spatially varying relations and determinants. Environ. Sci. Pollut. Res. 2015, 22, 16997–17011. [Google Scholar] [CrossRef] [PubMed]
  42. Wu, Y.; Chen, J. Investigating the effects of point source and nonpoint source pollution on the water quality of the East River (Dongjiang) in South China. Ecol. Indic. 2013, 32, 294–304. [Google Scholar] [CrossRef]
  43. Statistical Yearbooks of Jingzhou City 2013. Available online: http://www.stats-hb.gov.cn/upload/nj/jz2013.pdf (accessed on 14 September 2017).
  44. Van Drecht, G.; Bouwman, A.; Harrison, J.; Knoop, J. Global nitrogen and phosphate in urban wastewater for the period 1970 to 2050. Glob. Biogeochem. Cycles 2009, 23, 73. [Google Scholar] [CrossRef]
  45. Gui, F.; Yu, G. Numerical simulations of nutrient transport changes in Honghu Lake Basin, Jianghan Plain. Chin. Sci. Bull. 2008, 53, 2353–2363. [Google Scholar] [CrossRef]
  46. Routh, J.; Choudhary, P.; Meyers, P.A.; Kumar, B. A sediment record of recent nutrient loading and trophic state change in Lake Norrviken, Sweden. J. Paleolimnol. 2009, 42, 325–341. [Google Scholar] [CrossRef]
  47. Arhonditsis, G.; Brett, M.; Frodge, J. Environmental control and limnological impacts of a large recurrent spring bloom in Lake Washington, USA. Environ. Manag. 2003, 31, 603–618. [Google Scholar] [CrossRef] [PubMed]
  48. Demars, B.O.; Edwards, A. Tissue nutrient concentrations in freshwater aquatic macrophytes: High inter-taxon differences and low phenotypic response to nutrient supply. Freshw. Biol. 2007, 52, 2073–2086. [Google Scholar] [CrossRef]
  49. Sondergaard, M.; Lauridsen, T.L.; Johansson, L.S.; Jeppesen, E. Nitrogen or phosphorus limitation in lakes and its impact on phytoplankton biomass and submerged macrophyte cover. Hydrobiologia 2017, 795, 35–48. [Google Scholar] [CrossRef]
  50. Zeng, L.; He, F.; Zhang, Y.; Liu, B.; Dai, Z.; Zhou, Q.; Wu, Z. How submerged macrophyte restoration promotes a shift of phytoplankton community in a shallow subtropical lake. Pol. J. Environ. Stud. 2017, 26, 1363–1373. [Google Scholar] [CrossRef]
  51. Dai, Y.; Jia, C.; Liang, W.; Hu, S.; Wu, Z. Effects of the submerged macrophyte ceratophyllum demersum l. On restoration of a eutrophic waterbody and its optimal coverage. Ecol. Eng. 2012, 40, 113–116. [Google Scholar] [CrossRef]
  52. Jones, J.I.; Young, J.O.; Eaton, J.W.; Moss, B. The influence of nutrient loading, dissolved inorganic carbon and higher trophic levels on the interaction between submerged plants and periphyton. J. Ecol. 2002, 90, 12–24. [Google Scholar] [CrossRef]
  53. Pettit, N.E.; Ward, D.P.; Adame, M.F.; Valdez, D.; Bunn, S.E. Influence of aquatic plant architecture on epiphyte biomass on a tropical river floodplain. Aquat. Bot. 2016, 129, 35–43. [Google Scholar] [CrossRef]
  54. Olsen, S.; Chan, F.; Li, W.; Zhao, S.; Sondergaard, M.; Jeppesen, E. Strong impact of nitrogen loading on submerged macrophytes and algae: A long-term mesocosm experiment in a shallow Chinese lake. Freshw. Biol. 2015, 60, 1525–1536. [Google Scholar] [CrossRef]
  55. Xu, Y.; Shao, M.; Cao, M.; Zhou, S.; Cai, Q. Using temporal coherence to determine the responses of water clarity to hydrological processes in a giant subtropical canyon-shaped reservoir (China). Quat. Int. 2010, 226, 151–159. [Google Scholar] [CrossRef]
  56. Paerl, H.W.; Hall, N.S.; Calandrino, E.S. Controlling harmful cyanobacterial blooms in a world experiencing anthropogenic and climatic-induced change. Sci. Total Environ. 2011, 409, 1739–1745. [Google Scholar] [CrossRef] [PubMed]
  57. Vézie, C.; Rapala, J.; Vaitomaa, J.; Seitsonen, J.; Sivonen, K. Effect of nitrogen and phosphorus on growth of toxic and nontoxic microcystis strains and on intracellular microcystin concentrations. Microb. Ecol. 2002, 43, 443–454. [Google Scholar] [CrossRef] [PubMed]
  58. Peng, K.; Luo, C.; Lou, L.; Li, X.; Shen, Z. Bioaccumulation of heavy metals by the aquatic plants potamogeton pectinatus L. and potamogeton malaianus Miq. and their potential use for contamination indicators and in wastewater treatment. Sci. Total Environ. 2008, 392, 22–29. [Google Scholar] [CrossRef] [PubMed]
  59. Bauer, N.; Blaschke, U.; Beutler, E.; Gross, E.; Jenett-Siems, K.; Siems, K.; Hilt, S. Seasonal and interannual dynamics of polyphenols in myriophyllum verticillatum and their allelopathic activity on anabaena variabilis. Aquat. Bot. 2009, 91, 110–116. [Google Scholar] [CrossRef]
  60. Li, Y.; Tang, C.Y.; Yu, Z.B.; Acharya, K. Correlations between algae and water quality: Factors driving eutrophication in Lake Taihu, China. Int. J. Environ. Sci. Technol. 2014, 11, 169–182. [Google Scholar] [CrossRef]
  61. Haygarth, P.M.; Jarvie, H.P.; Powers, S.M.; Sharpley, A.N.; Elser, J.J.; Shen, J.; Peterson, H.M.; Chan, N.; Howden, N.J.; Burt, T. Sustainable phosphorus management and the need for a long-term perspective: The legacy hypothesis. Environ. Sci. Technol. 2014, 48, 8417–8419. [Google Scholar] [CrossRef] [PubMed]
Figure 1. Location, sample sites and different areas of Honghu Lake: A: river inflow areas; B: enclosure culture areas; C: open water area; D: lake protection area; and E: area connecting to the Yangtze River.
Water 09 00707 g001
Figure 2. Degree of pollution for different water quality parameters in Honghu Lake.
Water 09 00707 g002
Figure 3. The annual mean values of water quality parameters and biomass in dry, wet and normal seasons.
Water 09 00707 g003
Figure 4. Spatial variability in water quality parameters, biomass, and composite water quality: (a) TN; (b) TP; (c) NH4+–N; (d) CODMn; (e) Biomass; and (f) CWQ.
Water 09 00707 g004
Figure 5. The distribution of submerged aquatic plants biomass for different species in three seasons. (a): dry season; (b): wet season; (c): normal season. Species 1: Myriophyllum verticillatum; Species 2: Stuckenia pectinata (L.) Börner sago pondweed; and Species 3: Ceratophyllum demersum L.
Water 09 00707 g005
Figure 6. Spatial variability in TN, TP and biomass in the wet season: (a) TN; (b) TP; and (c) Biomass.
Water 09 00707 g006
Figure 7. Spatial variability in TN, TP and biomass in the dry season: (a) TN; (b) TP; and (c) Biomass.
Water 09 00707 g007
Table 1. Summary statistics of measured variables and water quality class categories for Honghu Lake.
ParametersAnnual Mean
Min.Max.MeanCV (%)
pH7.398.697.924.7
Transparency (m)0.301.550.7333.7
DO (mg/L)8.28 (I)13.51 (I)11.02 (I)10.7
NH4+–N (mg/L)0.319 (II)1.228 (IV)0.530 (III)37.6
TN (mg/L)0.625 (III)2.153 (Inferior Class V)1.150 (IV)32.3
TP (mg/L)0.011 (II)0.132 (V)0.053 (IV)61.3
CODMn (mg/L)5.11 (IV)7.78 (IV)6.54 (IV)8.9
Biomass (g)01369.33399.37106.8
Note: CV, coefficient of variation.
Table 2. Factor loadings of eight variables based on PCA in three seasons.
Dry SeasonFactorWet SeasonFactorNormal SeasonFactor
1231234123
pH−0.320.550.46pH0.100.870.190.02pH0.100.280.15
Transparency−0.810.09−0.24Transparency−0.710.44−0.30−0.01Transparency−0.610.560.06
DO−0.060.640.53DO−0.260.390.77−0.004DO−0.510.350.46
NH4+–N0.860.040.21NH4+–N0.560.35−0.450.36NH4+–N0.89−0.020.13
TN0.750.40−0.34TN0.800.210.13−0.11TN0.900.250.25
TP0.82−0.150.23TP0.870.13−0.160.16TP0.900.320.11
CODMn0.610.55−0.41CODMn−0.12−0.220.340.89CODMn0.03−0.840.08
Biomass−0.410.65−0.28Biomass−0.700.24−0.430.23Biomass−0.21−0.260.86
Variance (%)40.9520.5312.68Variance (%)34.9917.3915.7612.57Variance (%)44.1419.6014.86
Table 3. Correlation coefficients between biomass and water quality parameters.
Dry SeasonpHTransparencyDONH4+–NTNTPCODMnBiomass
pH1-------
Transparency0.2021------
DO0.30500.0171-----
NH4+–N−0.091−0.645 **0.0001----
TN−0.184−0.456 **0.0870.566 **1---
TP−0.289−0.680 **−0.0160.690 **0.411 **1--
CODMn0.032−0.312 *0.0420.447 **0.743 **0.2941-
Biomass0.2440.331 *0.278−0.369 *−0.044−0.331 *0.1041
Wet SeasonpHTransparencyDONH4+-NTNTPCODMnBiomass
pH1-------
Transparency0.2041------
DO0.2870.1051-----
NH4+–N0.177−0.164−0.2181----
TN0.188−0.448 **−0.0320.351 *1---
TP0.162−0.465 **−0.2850.567 **0.628 **1--
CODMn−0.077−0.0680.128−0.045−0.149−0.0431-
Biomass0.0110.615 **0.007−0.065−0.459 **−0.468 **0.0581
Normal SeasonpHTransparencyDONH4+-NTNTPCODMnBiomass
pH1-------
Transparency0.1541------
DO0.2220.382 *1-----
NH4+–N0.132−0.414 **−0.479 **1----
TN0.165−0.378 *−0.2250.760 **1---
TP0.129−0.382 *−0.1820.742 **0.945 **1--
CODMn−0.022−0.350 *−0.0740.05−0.095−0.131-
Biomass0.0150.0550.164−0.035−0.076−0.2470.1051
Notes: * Correlation is significant at the 0.05 level (2-tailed); ** Correlation is significant at the 0.01 level (2-tailed).
Table 4. Responses of biomass of different submerged aquatic plants to various water quality parameters by multiple linear regression (MLR) method.
SeasonsBiomass of SpeciesRegression EquationsR2Significance
Dry season7 speciesy = −283.539 − 1536.863 NH4+–N0.2270.002
Myriophyllum verticillatumy = 307.792 − 555.584 NH4+–N0.1410.015
Stuckenia pectinata (L.) Börner sago pondweedy = −3913.209 + 500.465 pH0.1050.038
Ceratophyllum demersum L.y = 199.575 − 383.492 NH4+–N0.2070.003
Wet season7 speciesy = 2240.620 − 1230.157 TN0.2670.001
Myriophyllum verticillatumy = 332.717 − 201.019 TN0.1200.026
Stuckenia pectinata (L.) Börner sago pondweedy = 11.220 + 206.353 Transparency0.3550.000
Ceratophyllum demersum L.y = 1350.020 − 675.030 TN0.1240.024

