A Novel Calendar-Based Method for Visualizing Water Quality Change: The Case of the Yangtze River 2006–2015


1
School of Resource and Environmental Science, Wuhan University, Wuhan 430079, China
2
The Bartlett Centre for Advanced Spatial Analysis, University College London, London WC1E 6BT, UK
3
Network Information Center, Changjiang Water Resource Committee, Wuhan 430010, China
*
Author to whom correspondence should be addressed.
Water 2017, 9(9), 708; https://doi.org/10.3390/w9090708
Submission received: 17 August 2017
/
Revised: 10 September 2017
/
Accepted: 13 September 2017
/
Published: 15 September 2017
Abstract
:Mapping water quality change is helpful in the study of the water environment of a region. Using visual methods, interpretation of water condition and pollution issues can be intuitive and easy to understand. In this paper, we present a map to represent the spatial and temporal variation of water quality change in the Yangtze River during the period from 2006 to 2015. The calendar view was developed to explore the water quality condition and water pollutants for sections of the Yangtze River. A “W” construction was proposed to arrange the weekly water quality data in a continuous logic, and qualitative colors were designed to identify the change in major pollutants throughout the period. This map provides a promising visual analytical approach to investigate the water quality status and reveal the spatial and temporal patterns of water quality change in the Yangtze River.
1. Introduction
The change in the water quality of the Yangtze River has attracted extensive attention, as the Yangtze River is the largest river in China and feeds more than 400 million local people living in the basin. During the process of urbanization and industrialization in the Yangtze River basin, human activities, e.g., hydrological alterations, toxic chemical emission, and land use change, have dramatically affected the water’s physicochemical properties [1,2,3,4]. Though efforts have been made to improve the treatment of the water and environment, many studies indicate that the water quality tends to deteriorate and raise various environmental problems, such as eutrophication [5,6], endemic diseases [7], and drinking water issues [8,9]. Identifying the water quality status and investigating the spatial and temporal changes are important to promote environmental governance and increase public awareness of water environmental protection.
The studies on water quality change are generally based on numerical models and statistical techniques. Various chemical indices, such as ammonia nitrogen (NH3-N), permanganate index (CODMn), phosphorus (P), nitrogen (N), heavy metals, dissolved oxygen (DO), and total organic carbon (TOC), were measured to evaluate the water quality in each period [10,11,12]. These indices were then used to explore the spatial and temporal patterns of water quality by adopting multivariate statistical methods, such as the Mann–Kendall test to estimate the trend homogeneity of water quality among monitoring sites [13,14,15], factor analysis and principal component analysis (FA/PCA) to transform the water quality indices into a new group of varifactors and to evaluate the incidence of each group in the overall water quality change [16,17], discriminant analysis (DA) to implement the classification with prior knowledge [17], and hierarchical cluster analysis to evaluate the similarities between sites and divide the sites into groups (clusters) based on similarities within the group and dissimilarities between groups [14,17]. Note that all of these analyses require complex mathematical algorithms and parameters. It is still difficult to identify the status of water quality and its evolution trend, particularly for the public who do not have sufficient domain knowledge [18,19].
Mapping the water quality change can make the interpretation of water environment issues intuitive and readable. One example is the Srivastava’s heat maps [20], which represented the river pollution potentiality based on the spatial interpolation of pre- and post-monsoonal water quality indices. In a number of water environmental information systems, dynamic maps were developed with animation and interaction techniques to visualize water quality over a time span or at any point in time [19,21,22,23,24]. However, as most mapping methods present the time-varying data of water quality on either a few canvases or a series of animation frames, the characteristics of water quality change could not be aware of all at once. A map reader has to switch back and forth between different views and then make connections between them.
Our study aimed to develop a visual method with a map to explore the status and the spatial and temporal variation of water quality in the Yangtze River. In this paper, a calendar-based visualization is advanced to address the time characteristic of water quality data [25]. Special attention is paid to constructing the calendar hybrid of water quality and major pollutants for sections of the Yangtze River and to implementing qualitative and quantitative analysis on the spatial and temporal changes of water quality using the calendar view.
2. Materials and Methods
2.1. Materials
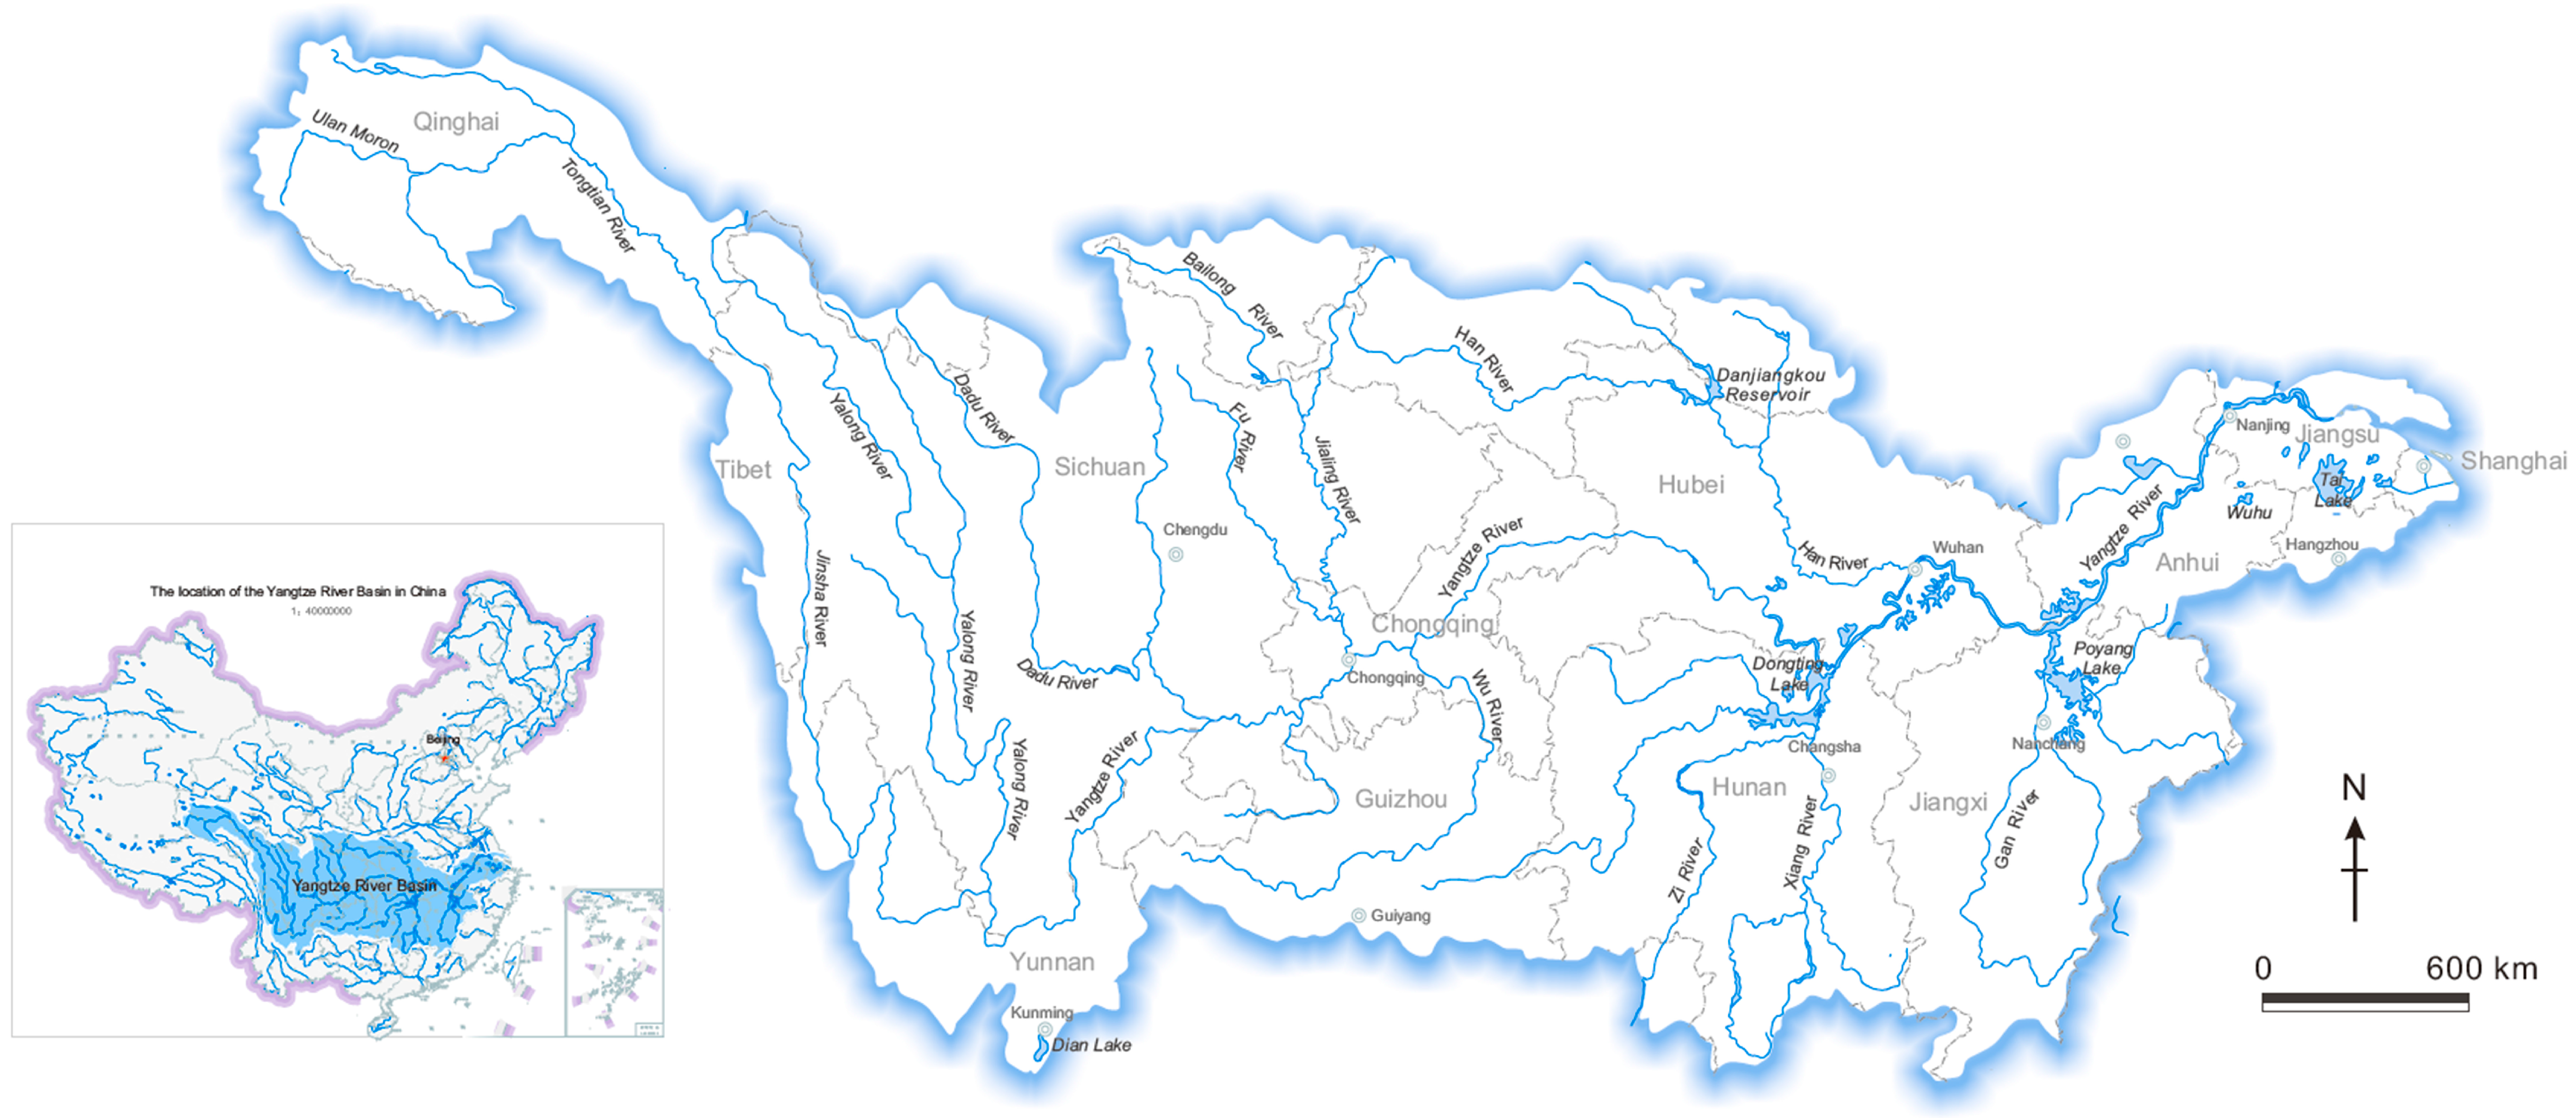
The Yangtze River starts in the Tanggula Mountains, Qinghai-Tibet Plateau, in the southwest of China and flows generally through the middle part and then east of the mainland into the East China Sea. As shown in Figure 1, the hydrographic network of the Yangtze River consists of more than 40 tributaries, including the Yalong River, the Min River, the Jialing River, the Wu River, the Han River, the Xiang River, and the Gan River. The total catchment area is approximately 1.8 million km2 and covers 17 provinces, involving Sichuan, Yunnan, Hubei, Hunan, Jiangxi, Anhui, and Jiangsu, and two municipalities, Chongqing and Shanghai. With the sustainable economic growth in China, there are three national urban agglomerations developing along the Yangtze River, i.e., Yangtze River Delta Urban Agglomerations, including the cities of Shanghai, Nanjing, and Yangzhou; the Triangle of Central China, including the cities of Wuhan, Changsha, NanChang, and Jiujiang; and the Chengyu city group, including the cities of Chengdu, Chongqing, Luzhou, and Yibin.
The National Environmental Monitoring Centre of China has published data on the weekly water quality of the Yangtze River for decades. Several physicochemical indices, including temperature, pH, DO, electrical conductivity, turbidity, CODMn, TOC, NH3-N, and two reservoir indices, total phosphorus (TP) and total nitrogen (TN), are measured and uploaded from 42 monitoring sites located in the Yangtze River basin. Among them, pH, DO, CODMn and NH3-N are provided as the four primary water pollutant indices by the National Surface Water Quality Automatic Monitoring System.
To facilitate understanding of the water quality issue by the public, the general water quality level (WQL) is graded based on the Chinese Environmental Quality Standards for Surface Water (GB 3838–2002). The WQL is defined as follows:
where WQL_i is the water quality level of index . The grading thresholds for the water quality indices are listed in Table 1.
2.2. Calendar Construction
As time is the inherent characteristic of the water quality data, data collection can be arranged into a calendar structure [26,27]. The rectangle in the calendar view can be used for a certain level of temporal precision, e.g., daily, weekly, or monthly. Next, the arrangement of rectangles reasonably represents the duration of our time series data.
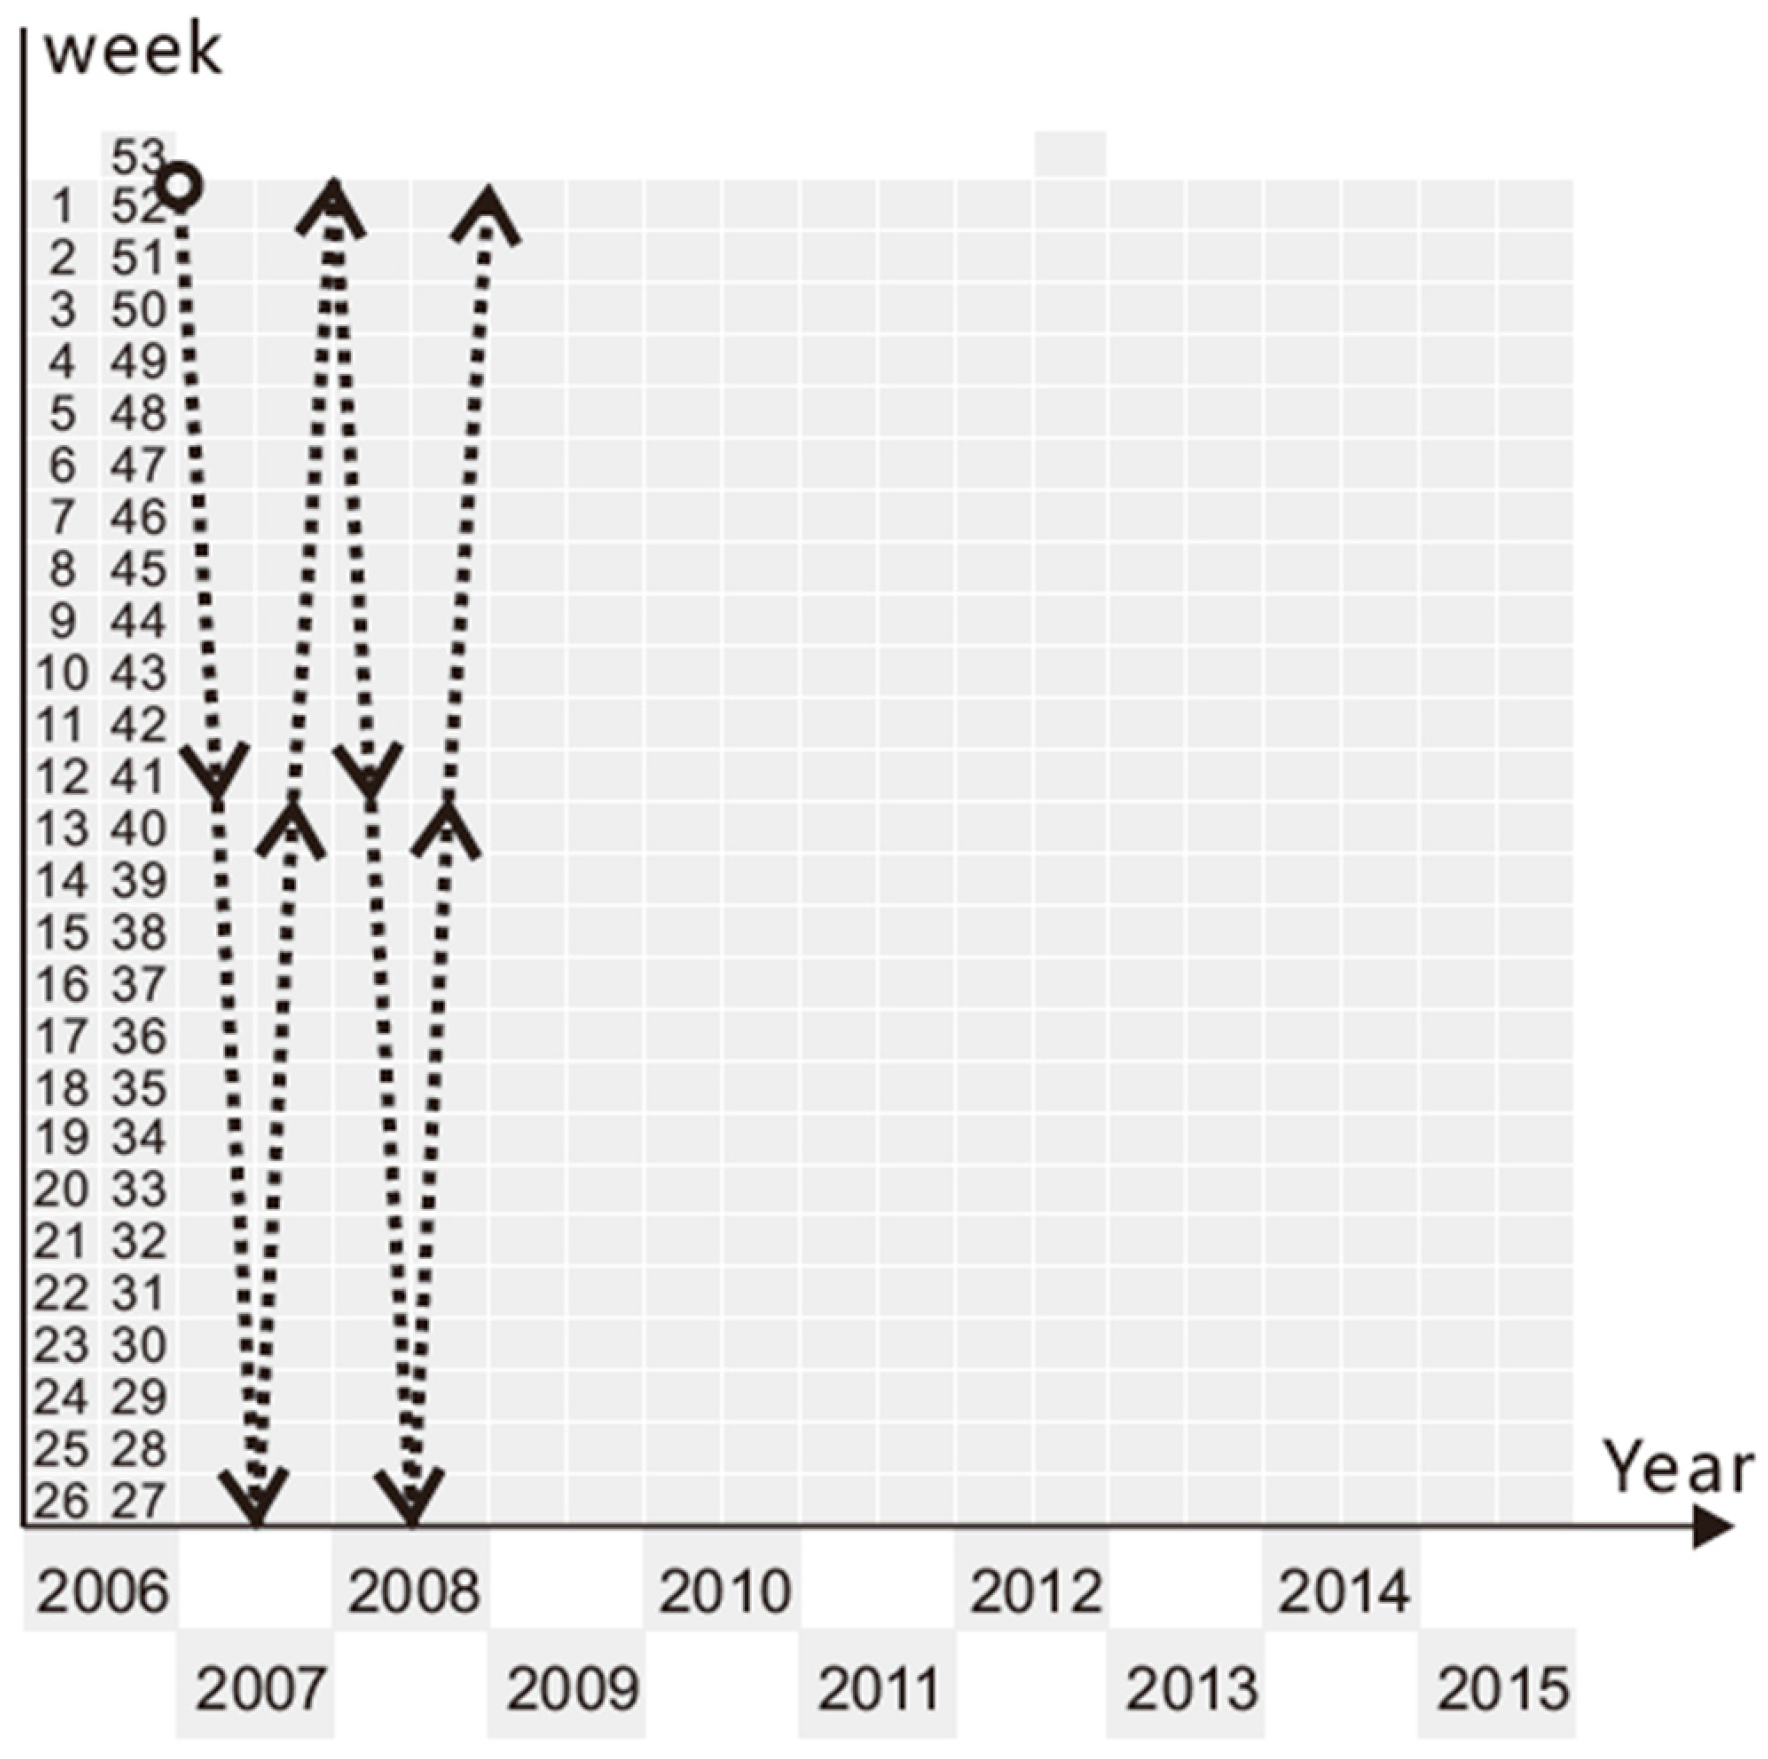
For the purpose of exploring the temporal variations in the water quality data, we propose a cyclic structure of time to construct the calendar view. As shown in Figure 2, the weeks of one year are assembled in two reverse columns. Thus, the weekly collection of water quality from 2006 to 2015 can be accommodated in a “W” construction. In such a calendar view, the temporal schemas of month, season, and year are also easy to retrieve.
2.3. Rendering Rule
Qualitative colors are designed to encode the water quality based on Color Brewer [28]. As illustrated in Table 2, blue is used when the general WQLs are at Grade I, implying that the water is an excellent drinking source and aquatic habitat. For the other WQLs, sequential colors are adopted corresponding to various pollutants.
In our study, an excessive ratio is introduced to identify the major pollutant. According to the Assessment of Surface Water Environmental Quality (Trial) in China, the excessive ratio can be expressed as
where is the excessive ratio of the water quality index , is the grading thresholds of refers to the current water quality level, and is the concentration of measured at the relevant section. The major pollutant is defined using the water quality index that has the largest .
3. Results and Discussion
Using the proposed calendar structure and rendering rule, we produced a Map of Water Quality Change in the Yangtze River over the Period 2006–2015 (see Figure S1 in Supplementary Materials). The main map contains the hydrographic network of the Yangtze River and the monitoring sites accompanying the calendar panels of water quality. To describe the water environment quality in more detail, a series of lake areas among the Yangtze River, i.e., Poyang Lake, Dongting Lake, Tai Lake, Chao Lake, Liangzi Lake, and Dian Lake, are presented. All of the calendar views represent the water quality for the entire period from 2006 to 2015. A portion of calendars are defective because of the lack of data.
The proposed map was produced using two software packages. The calendar views of the water quality for sections of the Yangtze River were created and rendered by a web-based application developed with JavaScript and the D3.js library [29,30]. Next, the map symbolization and cartographic enhancement were performed in CorelDRAW X6 [31].
3.1. Spatial Change of the Water Quality
The water quality map provides a quick insight into the spatial variation of water environment in the Yangtze River. Figure 3 illustrates the spatial change of water quality in the Yangtze River basin. In light of the calendar views, the water quality of the Yangtze River can be categorized roughly into three groups. The first group includes a few sections in the upper reaches of the Yangtze River and that of tributaries, i.e., Dragon Cave, Qingfeng Canyon, Hujialing, and Taocha, which are in a relatively good condition. Most of the WQL rectangles in the corresponding calendar are rendered in blue, indicating that the water quality usually ranks at Grade I. However, the water quality in certain sections, for example, Taocha in Nanyang, still remains vulnerable. Sometimes, the concentrations of CODMn and NH3-N exceed the limits, and the DO declines. The second group includes the sections in the middle and lower reaches of the river. The colors of the WQL rectangles vary among yellow, green, and magenta, indicating that the water quality usually levels at Grades II and III. In contrast, sections in South Dian, Luojiaying, the Xiyuan tunnel, Guanyin Hill in Kunming, Wangjiangjing, Xielu Port in Jiaxing, and Jishui Port in Qingpu are regarded as the third group. For these sections, the calendar views are deep-colored. The water quality has been seriously polluted and usually levels at Grade IV and even poor V.
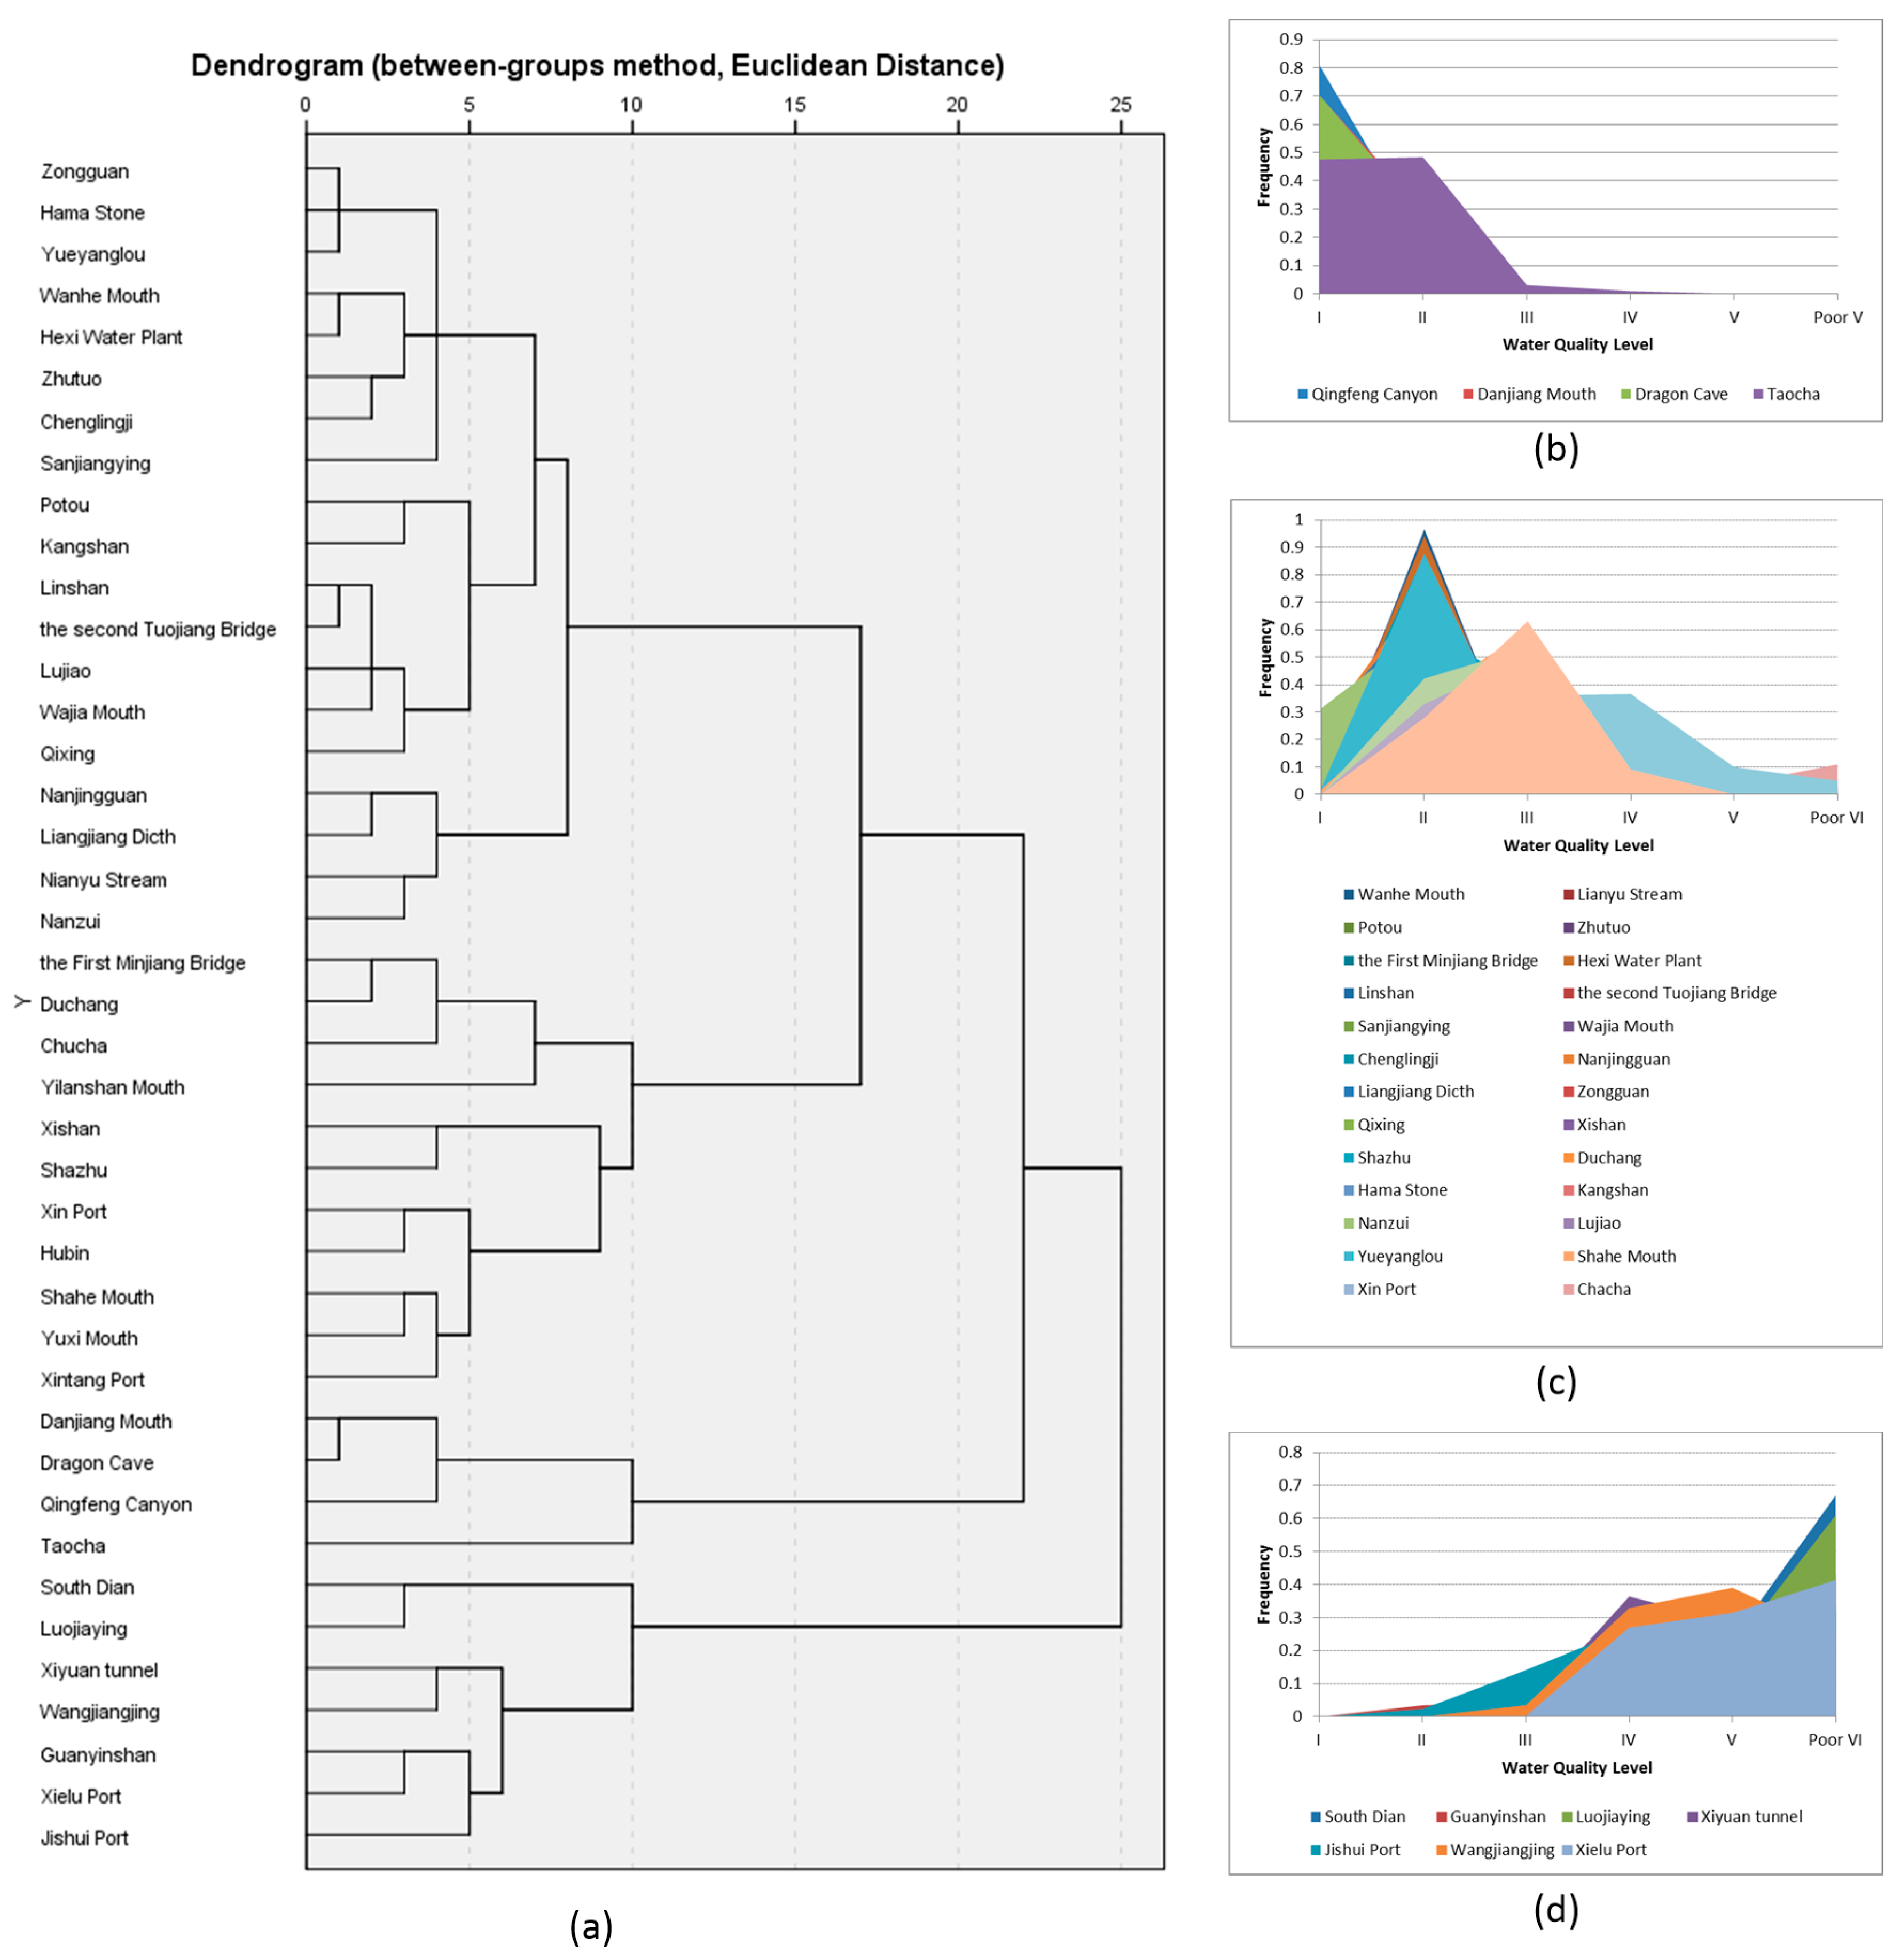
A hierarchical cluster analysis was carried on the WQL frequency using the between-groups method based on the Euclidean distance. As shown in Figure 4, the clustering results are demonstrated in a dendrogram on the left, and the total days corresponding to each WQL are presented as colored graphs on the right. The findings from the water quality map are consistent with the results of the cluster analysis. All the sections belonging to Groups 2 and 3, in particular the heavily polluted sections, are distributed in the important urban agglomerations along the Yangtze River. This corroborates the hypothesis that the urbanization has dramatically affected the water quality of the Yangtze River. In general, domestic sewage, agriculture sewage, and industrial wastewater are considered three primary sources of water pollution in these areas [32,33,34].
As observed from the water quality map, the major pollutants in different sections of the Yangtze River basin are diverse. In the drainage network area, NH3-N is the common major pollutant, although high concentrations of DO and CODMn occur from time to time. Scientists have found that the NH3-N in the Yangtze River mainly comes from the decomposition products of organic matter in the sewage, farmland drainage, and industrial wastewater [5]. In the lake area, the pollution by CODMn is much more serious. Accordingly, the lake area can be divided into four groups. The first group refers to Dian Lake and Liangzi Lake, including South Dian Lake, Luojia Yin, the Xiyuan tunnel, Guanyin Hill, and Qixing, where the common pollutant is almost always CODMn. Dian Lake has heavier CODMn pollution than does Liangzi Lake, as the CODMn concentration generally levels at Grade V and poor V, implying that the amount of organic compounds in the water has far exceeded the recommended limit. The second group refers to Poyang Lake, Chao Lake, and Tai Lake, including Hama Stone, Hubin, Yuxi Mouth, Shazhu, Yilan Hill Mouth, Xi Hill, and Xintang Port, where CODMn and NH3-N are indicated as the common major pollutants. The third group mainly refers to Dongting Lake, including South Mouth, Yueyang Lou, and Lujiao. In these areas, CODMn is rarely the major pollutant, but NH3-N pollutions emerge most of the time. Then, several areas in Poyang Lake and Tai Lake, including Duchang, Kan Hill, Jishui Port, Wangjiangjing, and Xielu Port, can be viewed as the fourth group, where pollution by CODMn and NH3-N appears alternately, making the water environments of these areas quite different from those of the other groups.
3.2. Temporal Change of the Water Quality
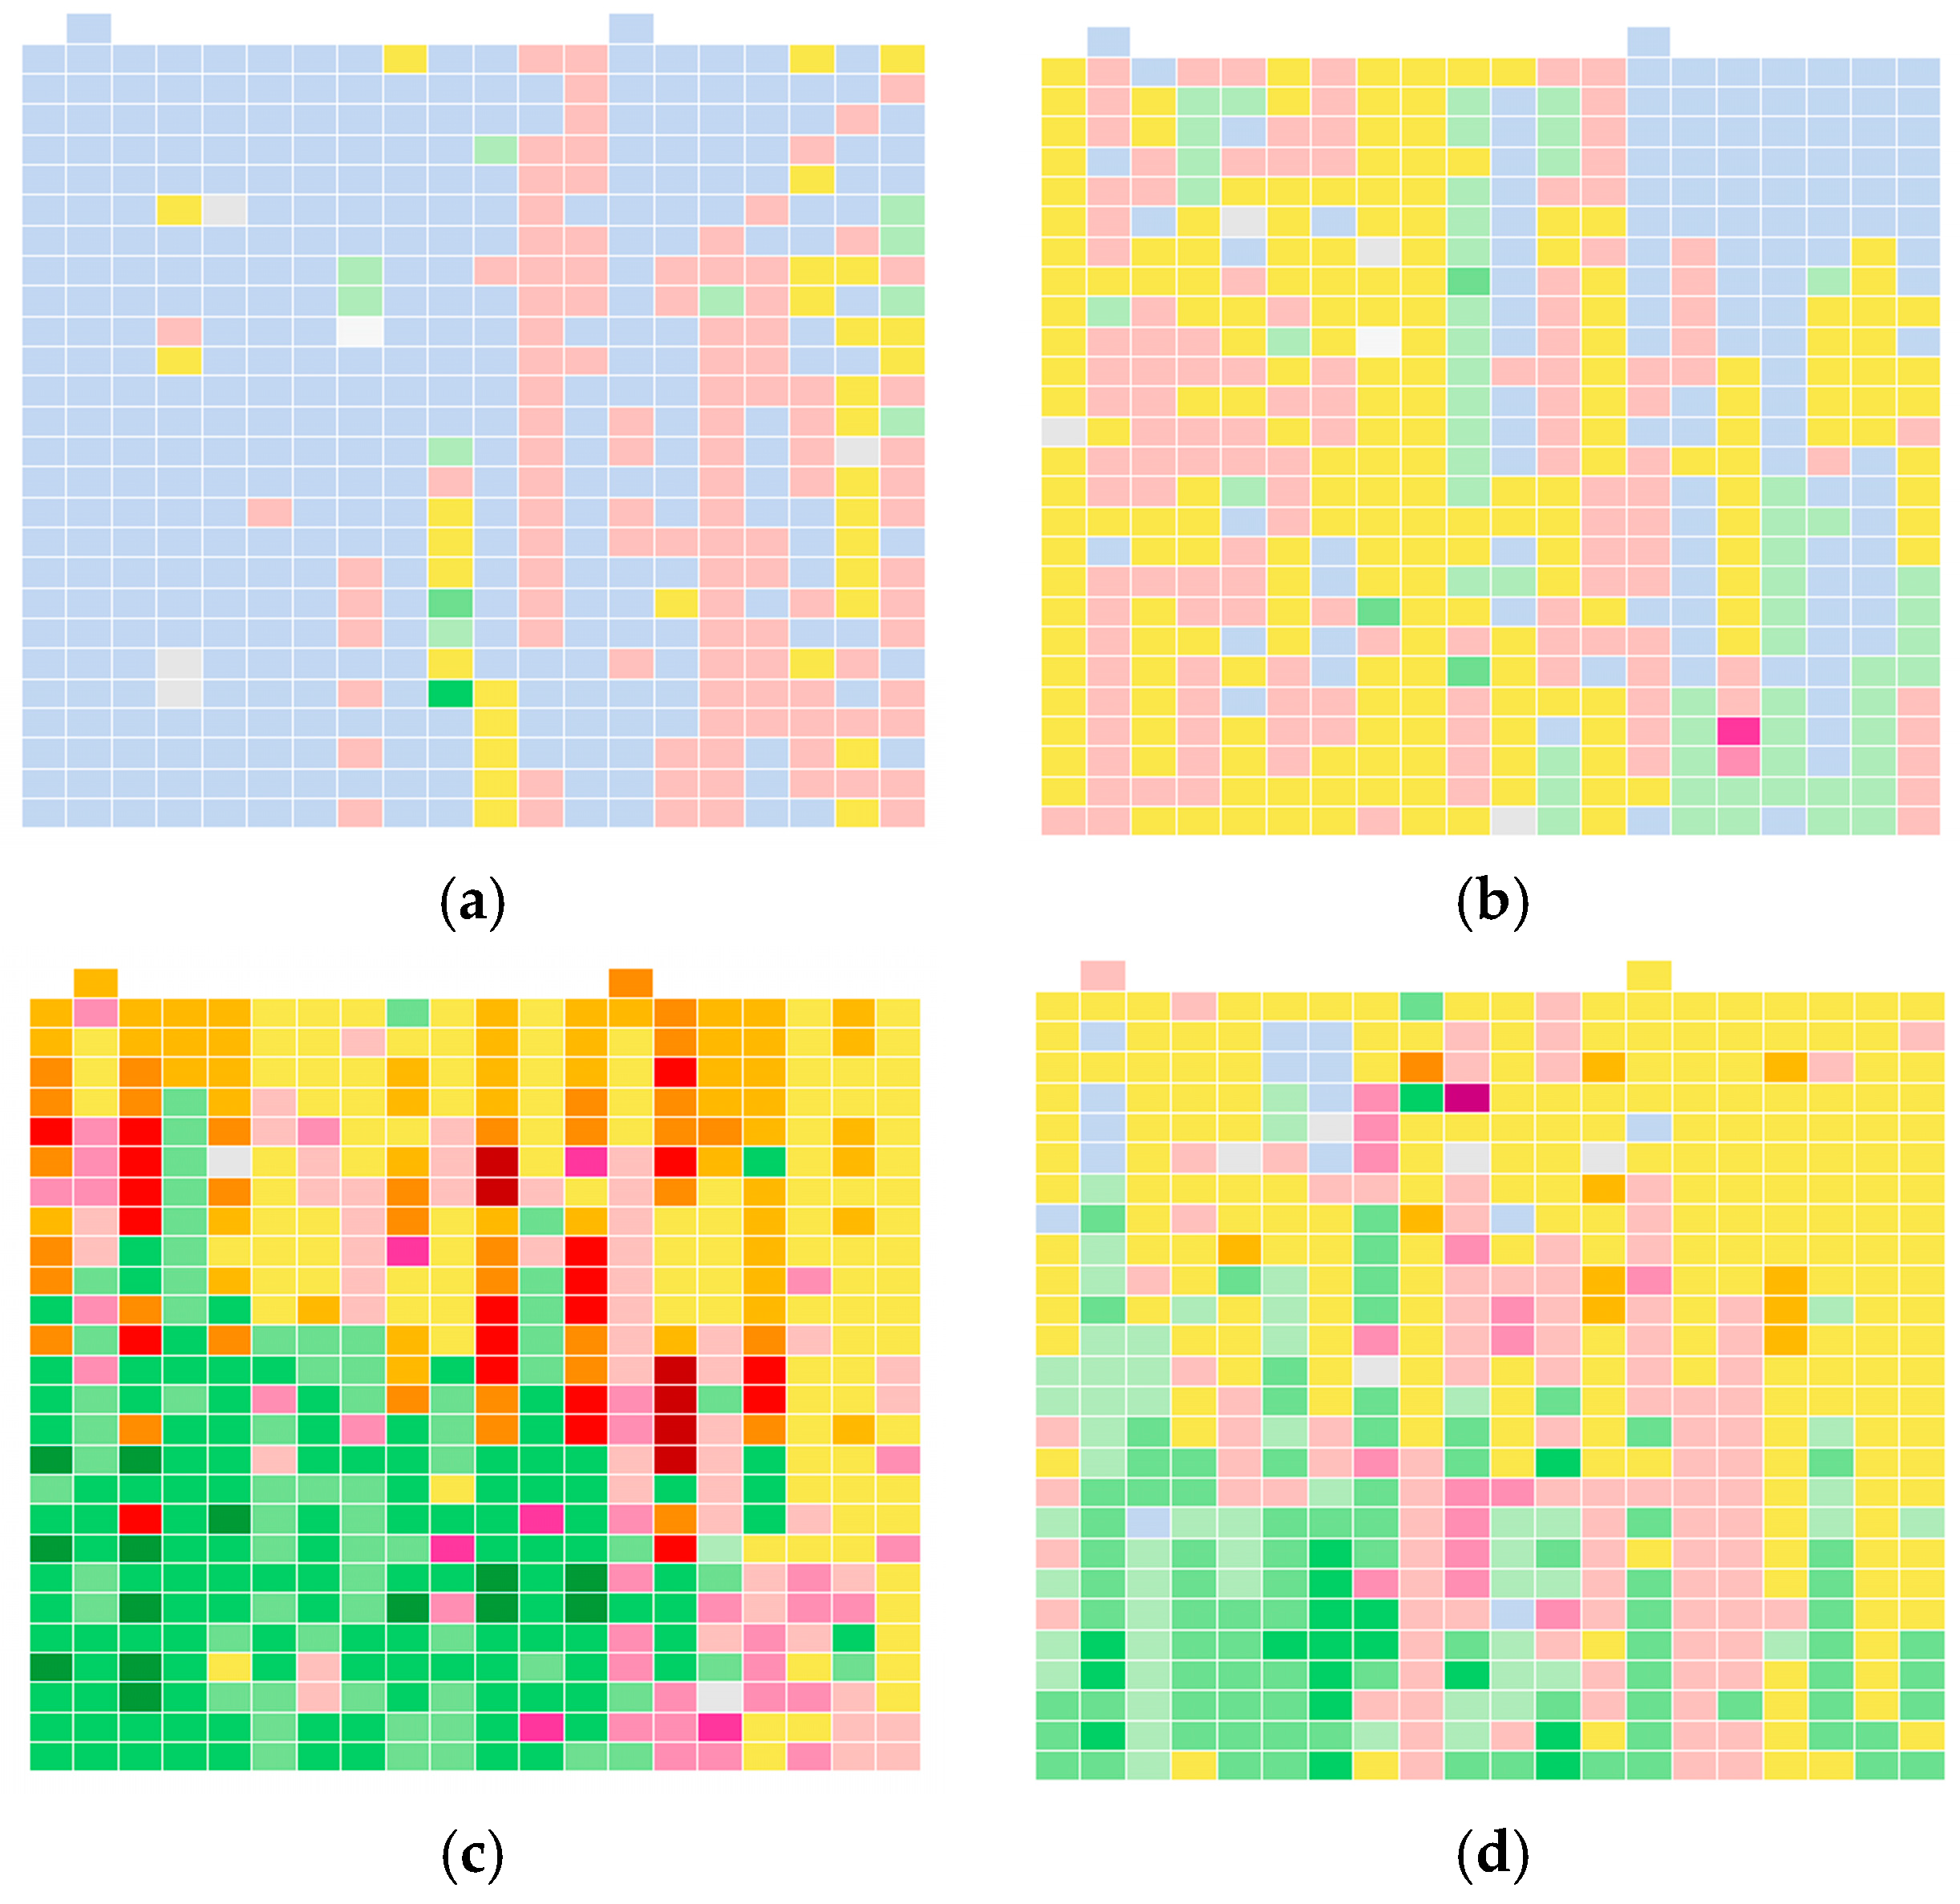
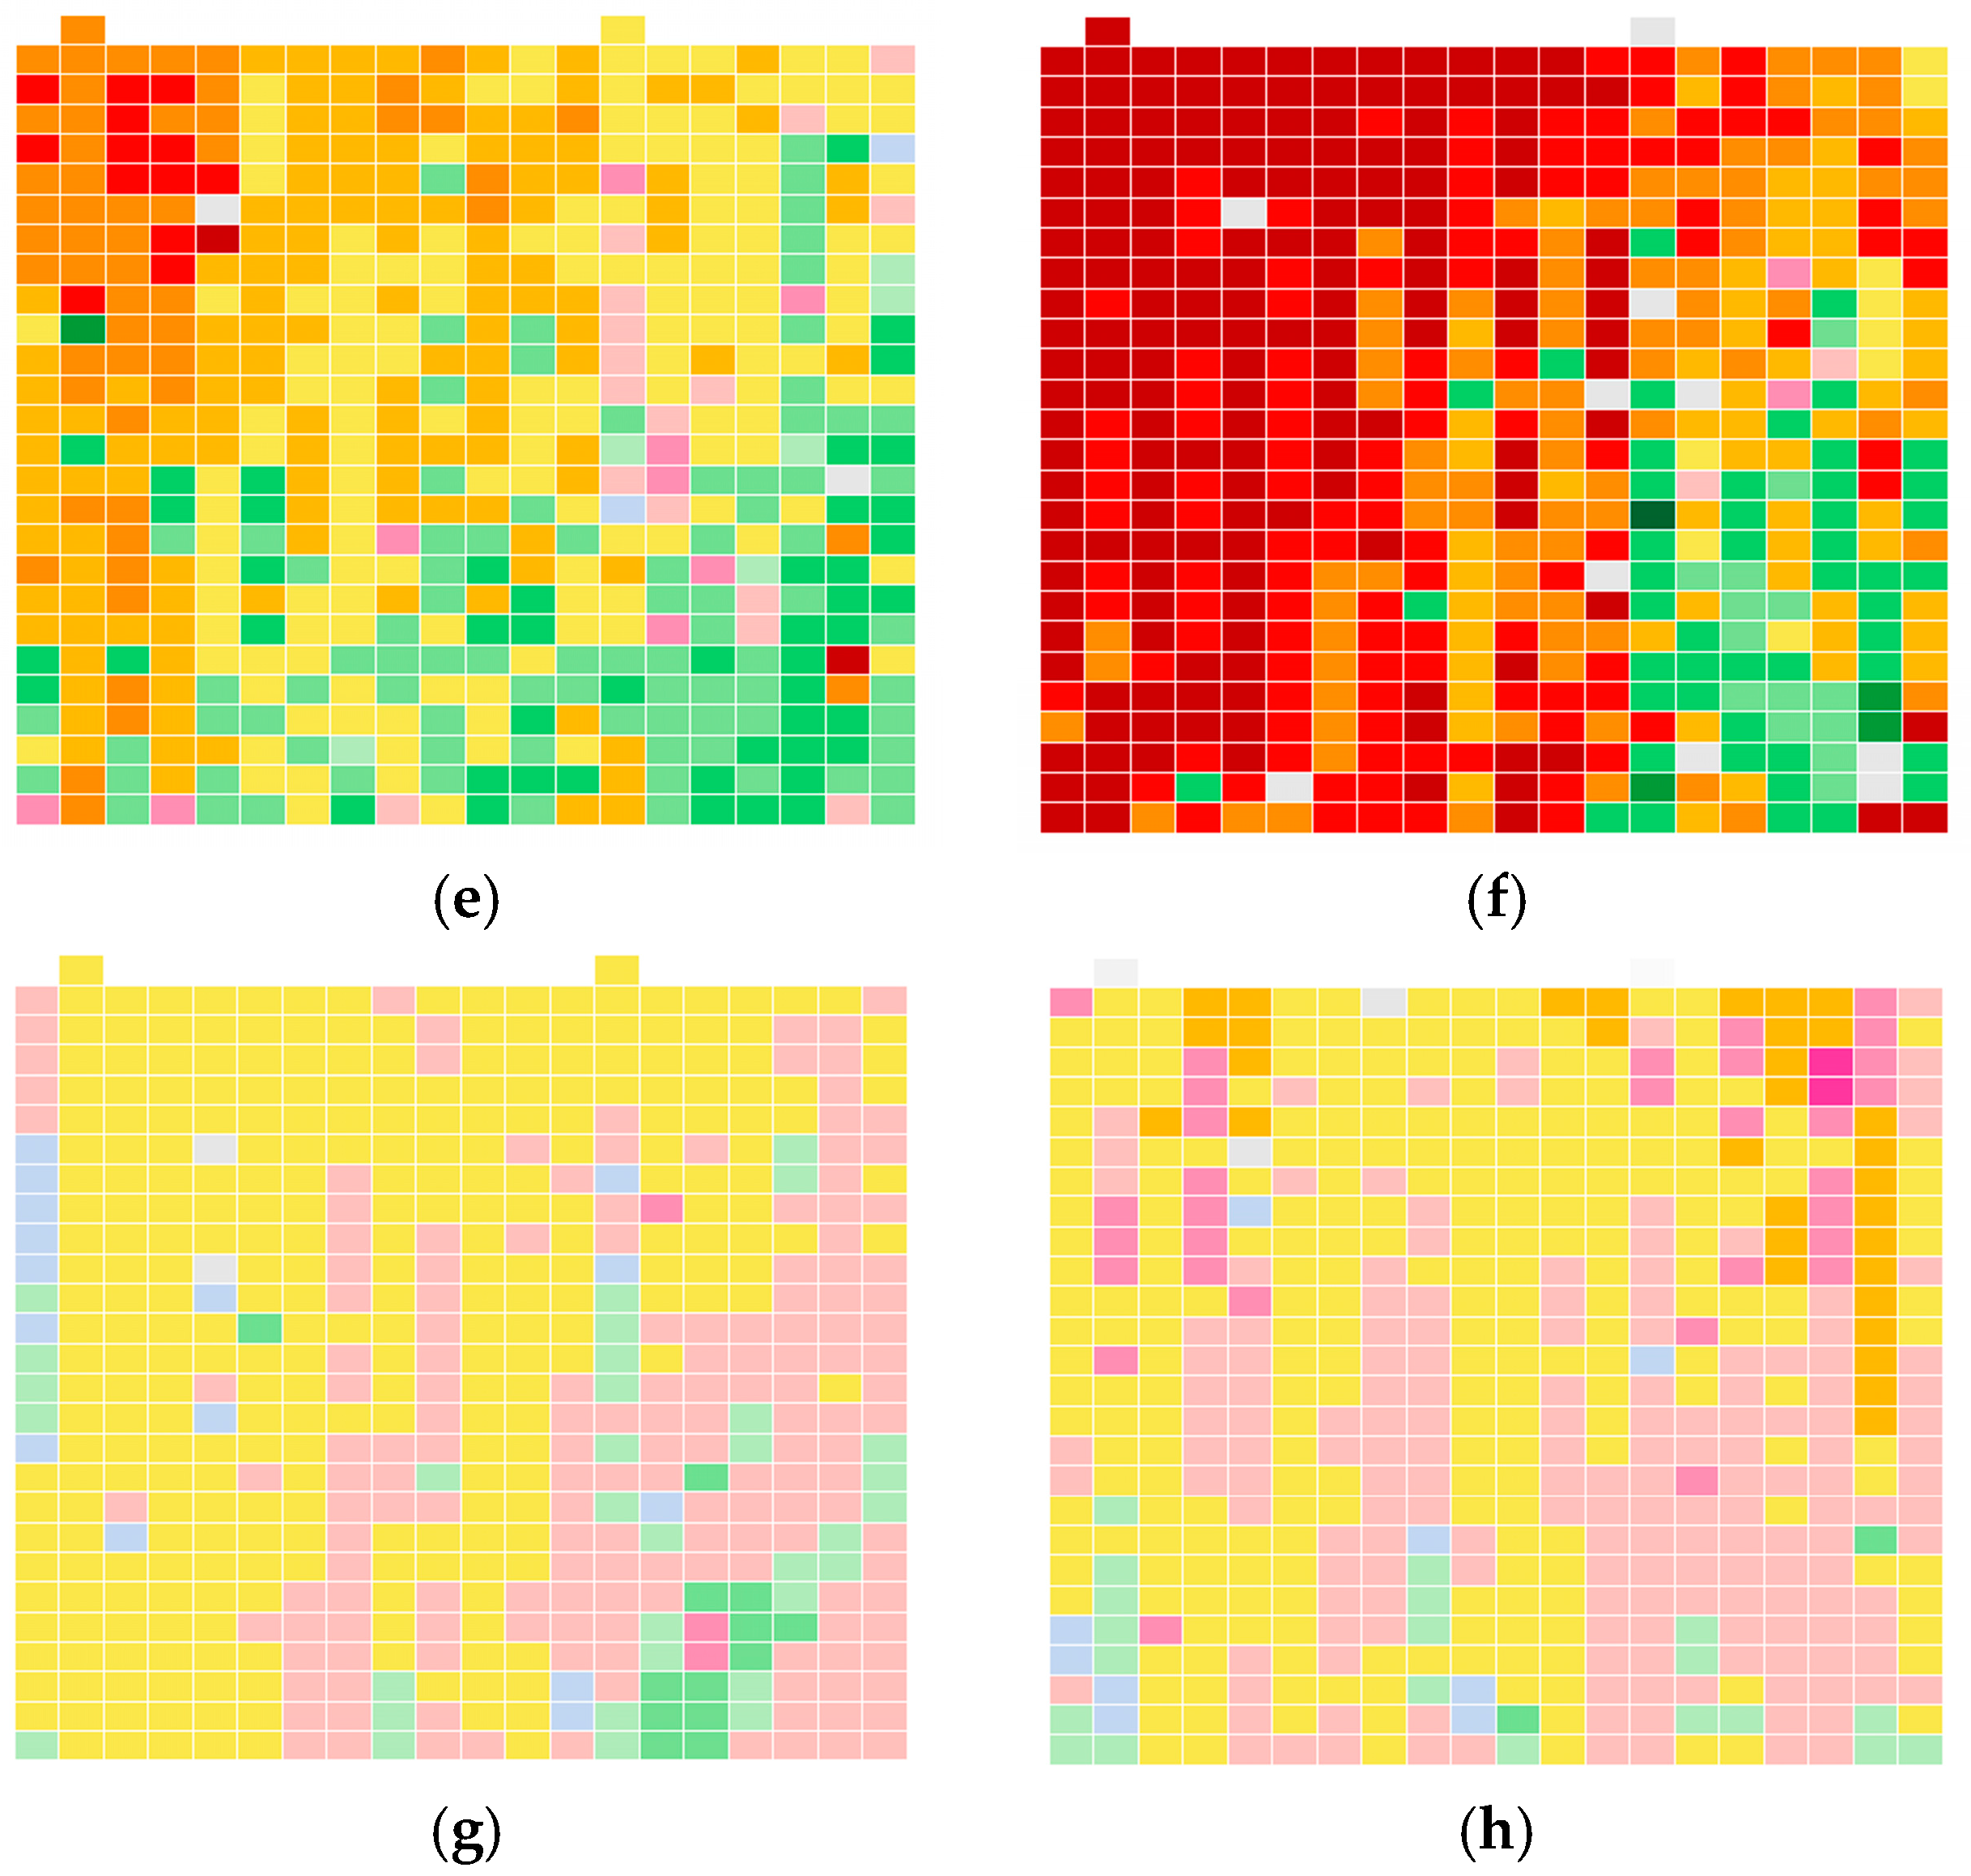
The water quality map also demonstrates an intuitive overview of the temporal variation in the water environment of the Yangtze River. Figure 5 shows the temporal change of water quality in a several sections of the Yangtze River. Note that there is obvious water degradation in Danjiang Mouth, which is one of the essential water sources for the famous South-to-North Water Diversion Project in China. During the period from 2006 to 2011, the water quality generally leveled at Grade I, but in the consequent years from 2012 to 2015, the water leveled at Grade II most of the time, with light pollution of CODMn and NH3-N. Comparatively, there is a clear and encouraging sign of water restoration in the Nanjingguan area, where the water quality consistently leveled at Grade II from 2006 to 2011, suffering CODMn and NH3-N pollutions, and then improved gradually and has frequently leveled at Grade I since 2012.
According to the water quality map, the change of major pollutants had remarkable seasonal and annual patterns in many sections of the Yangtze River. A significant seasonal pattern can be found when DO and NH3-N are present as the major pollutants. The DO pollution always concentrates in the summer and autumn, while the NH3-N pollution tends to be serious in the spring and winter. Some of the examples include the First Minjiang Bridge, Xin Port, Duchang, and Chucha. However, such a seasonal pattern may not be common to the CODMn pollution. In several sections, i.e., Dragon Cave and Qixing, the high CODMn concentrations are more likely to rise in the autumn. However, in most other sections, the high CODMn concentrations remain present throughout the year.
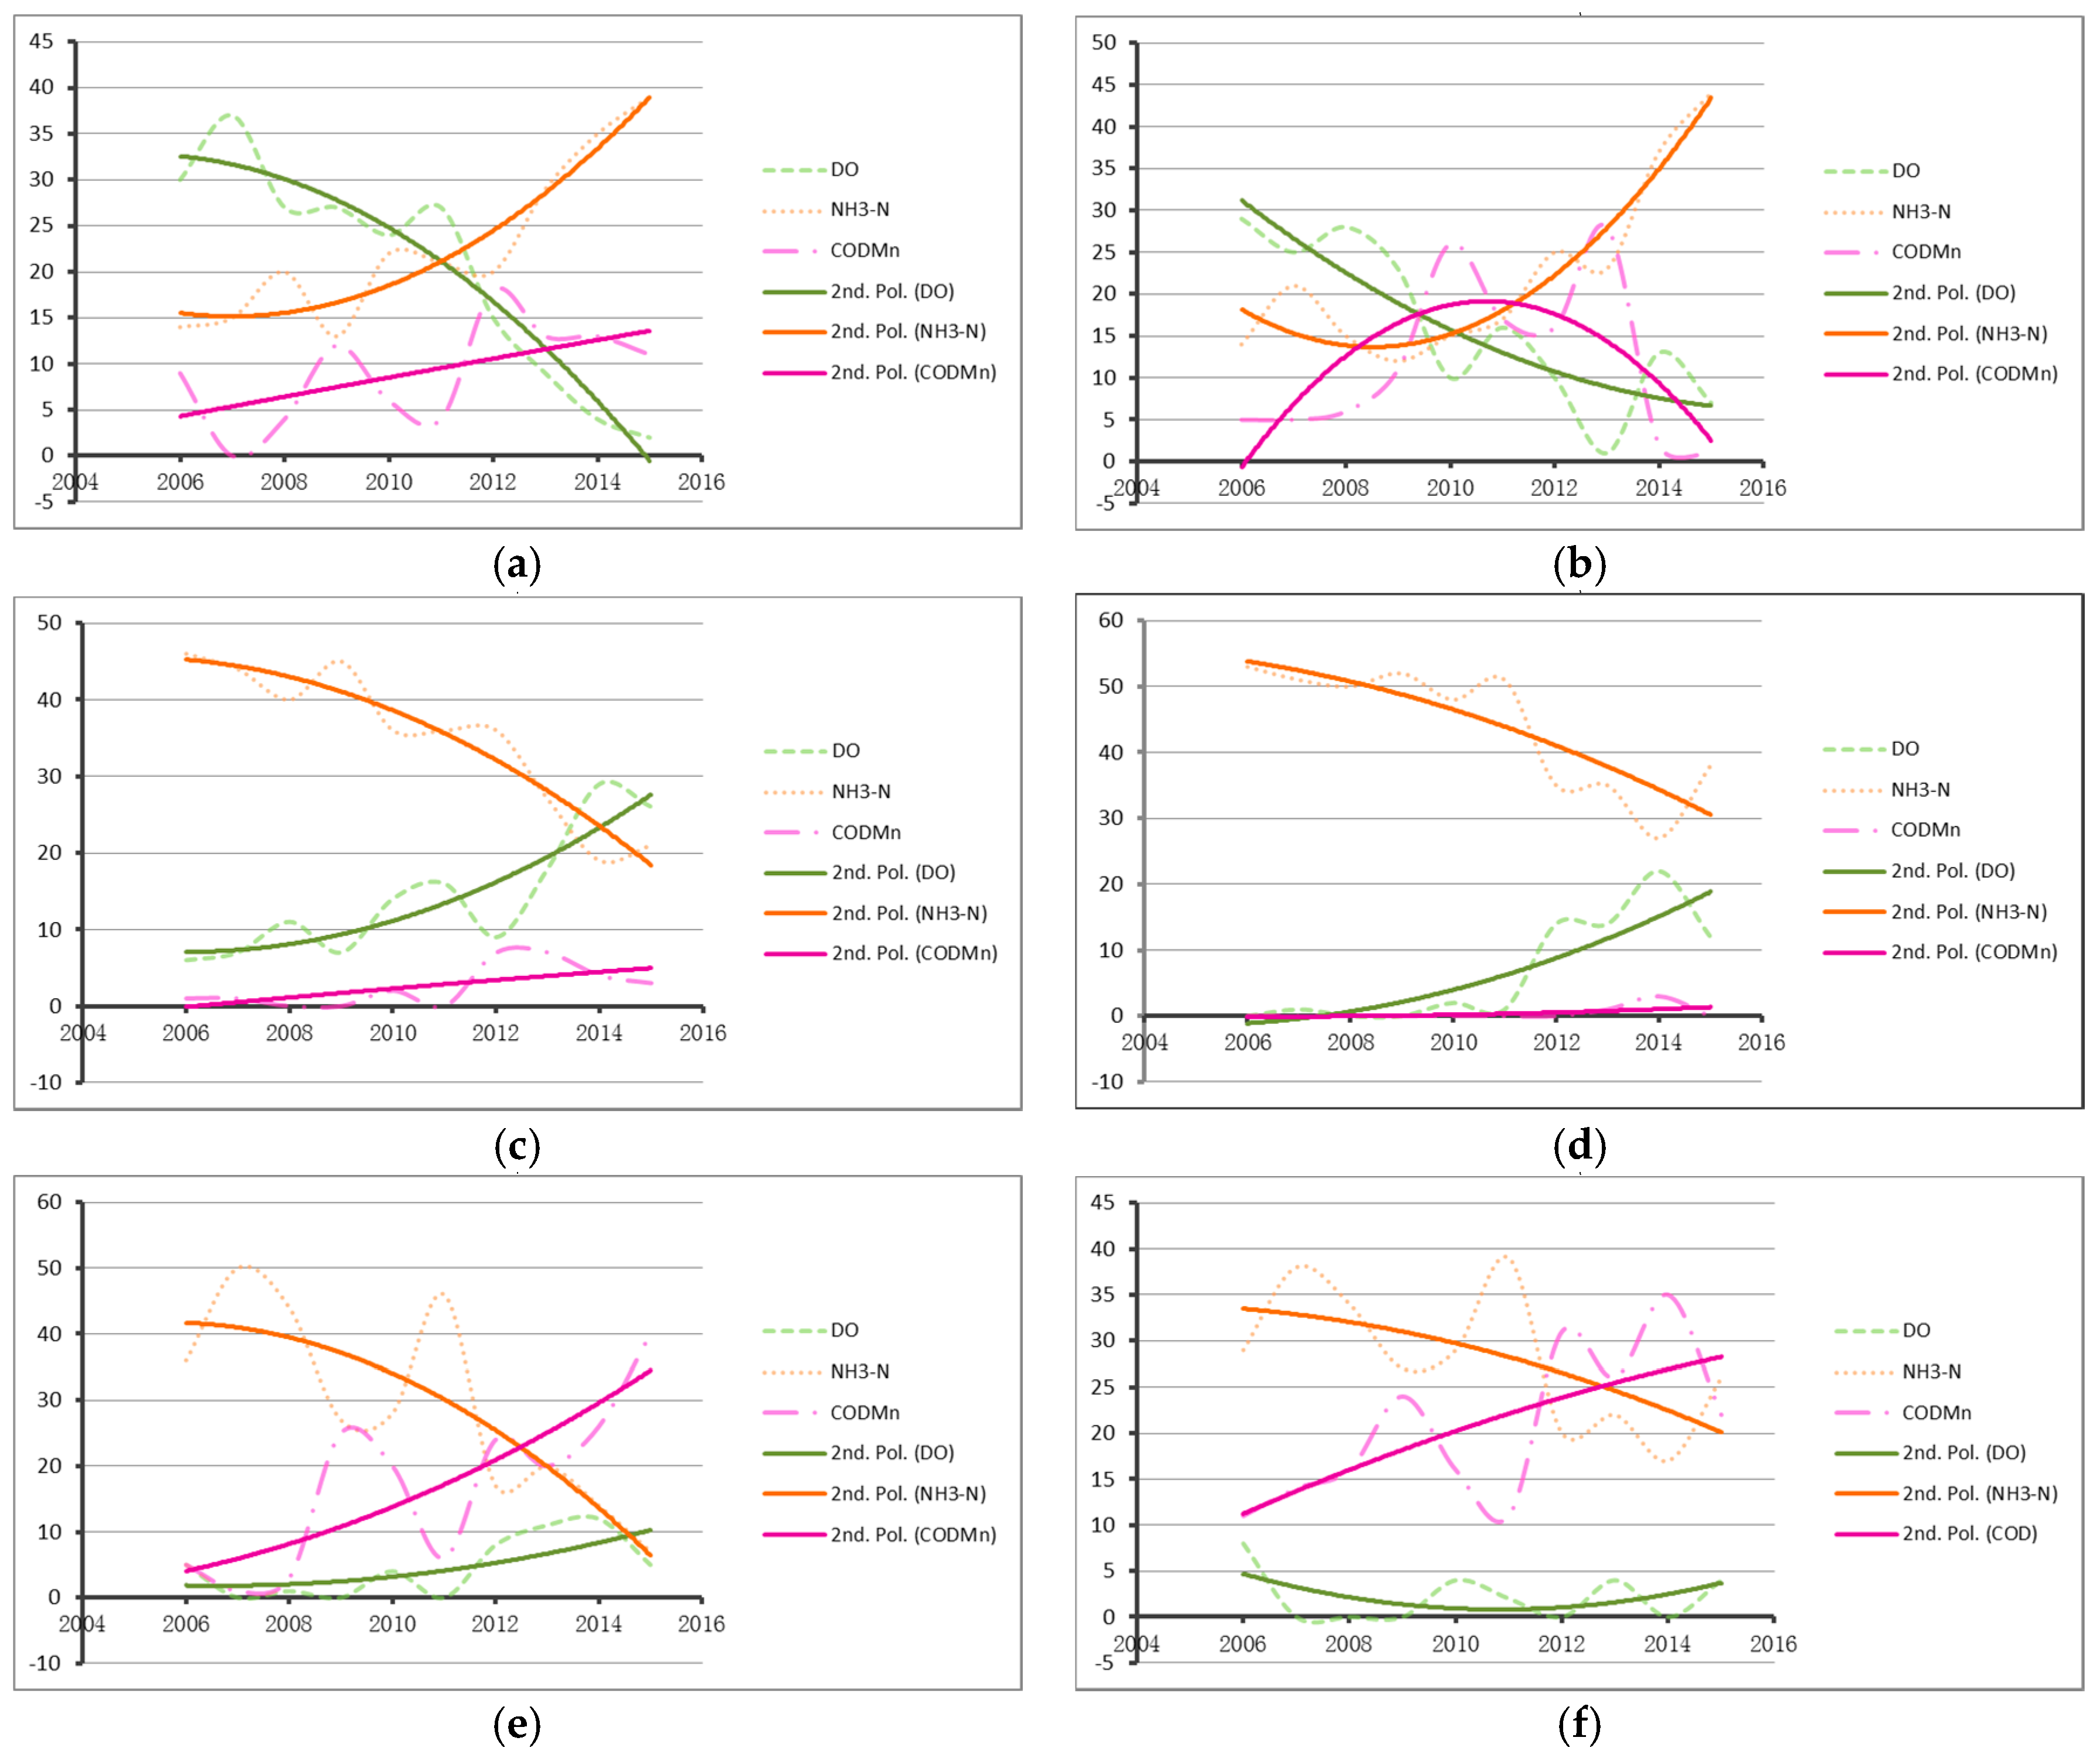
Generally, three types of annual patterns can be observed from the temporal distribution of major pollutants in different sections. One is characterized in the First Minjiang Bridge and Linshan, where the major pollutant transition shows a reduction tendency with DO. During the period of 2006–2015, the major pollutant in these sections generally alternated between DO and NH3-N at first, until NH3-N became the common major pollutant. Another annual pattern is characterized in Xin Port and Jishui Port, illustrating an increasing tendency with DO in contrast. NH3-N was the major pollutant in 2006, having much heavier concentration in the beginning and end of the year. By the year 2015, DO and NH3-N became the two major pollutants, while NH3-N always appeared in the beginning and end of the year and DO in the middle. In addition, a distinct conversion from NH3-N to CODMn pollution was observed in the sections of the Hexi Water Plant, the Wanhe Mouth, the Second Tuojiang Bridge, Yueyang Lou, and Hama Stone; the major pollutant was NH3-N in around 2006, then the major pollutant became CODMn by around 2015. A statistical analysis was carried out as well to inspect the annual change of major pollutants for relevant sections. As shown in Figure 6, the results illustrate the same temporal patterns as those on the map.
Furthermore, it is remarkable that the water pollution in the Dian Lake and Tai Lake areas has been serious for years and presently faces a severe situation. In spite of ongoing efforts for water restoration, the WQLs remain below Grade III. There is a strong need to adopt more effective water protection measures and strengthen the control of wastewater discharge in these areas.
4. Conclusions
In this study, the Map of Water Quality Change in the Yangtze River over the Period 2006–2015 provided an intuitive interface to understand the water quality condition of the Yangtze River from 2006 to 2015. Using the calendar view, the spatial variation of water quality and water pollutants in the Yangtze River was explicitly presented. Qualitative colors were designed to identify water quality levels and major water pollutants. A “W” construction was also introduced to make the arrangement of the weekly data logical and continuous. It was helpful to investigate both the seasonal and annual temporal pattern of the river’s water quality change. Several conclusions can be drawn as follows:
- (1)
- The calendar-based map provides a promising visual analytic approach to identify the water quality issues of the Yangtze River. Using the calendar, it is possible to reveal the spatial and temporal patterns in the massive monitoring data without using complex analysis models.
- (2)
- According to the map, the upper reaches of the Yangtze River and tributaries have relatively good water quality, while the other sections, especially where urban agglomerations are developing, e.g., South Dian and Guanyinshan in Kunming, Xielu Port in Jiaxing, and Jishui Port in Qingpu, are seriously polluted.
- (3)
- The major pollutants in the Yangtze River have multi-scale temporal patterns. At the seasonal scale, DO is the major pollutant in the summer and autumn, and NH3-N tends to be serious in the spring and winter. At the annual scale, at least three patterns can be observed, i.e., from alternating between DO and NH3-N to mainly in NH3-N, from mainly NH3-N to alternating between DO and NH3-N, and switching from NH3-N to CODMn.
So far, we have produced the water quality map through two stages, i.e., collecting the data from the environmental monitoring center and arranging the data in map form. Our future work will focus on the interactive generation of the water quality map online. A real-time mapping system may be developed based on standard web protocols to access the latest water quality data upon demand [35]. It will provide a number of calendar templates to represent either qualitative information, i.e., the WQLs and major pollutants, or the quantitative information, i.e., the concentration of each water quality index and the relative change rate, or both, so that the public can customize the map and better understand the status and change tendency of the water quality of the Yangtze River. In addition, as the current calendar-based method is proposed to visualize the water quality change and make the interpretation of water condition intuitive, the proposed method can also be applied to the water resources community so as to evaluate how effective it is in communicating water quality with the public. Social surveys could be conducted to compare our method with other communicating methods, such as statistical charts [14,17], heat maps [20], dynamic maps [22,24], and information graphs [36], from the aesthetics, efficiency, and accuracy aspects.
Supplementary Materials
The following are available online at www.mdpi.com/2073-4441/9/9/708/s1.
Acknowledgments
This work was supported by the National Key Research and Development Program of China (Grant No. 2017YFB0503500), the Fund for Fostering Talents in Basic Science of the National Natural Science Foundation of China (Grant No. J1103409), and the Special Foundation for Fundamental Work of Science and Technology of China (Grant No. 2013FY112800).
Author Contributions
Lina Huang designed the calendar-based map, developed the web-based application to generate calendar views of water quality change in the Yangtze River, performed the experiments, and wrote the manuscript; Mengyin Zhong contributed the map symbolization and cartographic enhancement; Qiyao Gan prepared the water quality data for the visual analysis and map generation; Yanfang Liu improved the map and modified the manuscript.
Conflicts of Interest
The authors declare no conflict of interest.
References
- Ma, X.; Wang, L.; Wu, H.; Li, N.; Ma, L.; Zeng, C.; Zhou, Y.; Yang, J. Impact of yangtze river water transfer on the water quality of the Lixia River watershed, China. PLoS ONE 2015, 10, e0119720. [Google Scholar] [CrossRef] [PubMed]
- Hang, X.; Wang, H.; Zhou, J.; Ma, C.; Du, C.; Chen, X. Risk assessment of potentially toxic element pollution in soils and rice (oryza sativa) in a typical area of the Yangtze River delta. Environ. Pollut. 2009, 157, 2542–2549. [Google Scholar] [CrossRef] [PubMed]
- Müller, B.; Berg, M.; Yao, Z.P.; Zhang, X.F.; Wang, D.; Pfluger, A. How polluted is the Yangtze River? Water quality downstream from the three gorges dam. Sci. Total Environ. 2008, 402, 232–247. [Google Scholar] [CrossRef] [PubMed]
- Qin, C.; Tian, Y.; Wu, Y.; Huang, J.; Ndakeva, H. International Conference on Environmental Science and Information Application Technology. In Research on the Human-Water Relationship in the Middle Reaches of Yangtze River, Proceedings of the International Conference on Environmental Science and Information Application Technology, Wuhan, China, 4–5 July 2009; Guerrero, J.E., Ed.; IEEE Computer Society: Washington, DC, USA, 2009; pp. 15–19. [Google Scholar]
- Liu, C.; Watanabe, M.; Wang, Q. Changes in nitrogen budgets and nitrogen use efficiency in the agroecosystems of the Changjiang River basin between 1980 and 2000. Nutr. Cycl. Agroecosyst. 2007, 80, 19–37. [Google Scholar] [CrossRef]
- Holbach, A.; Wang, L.; Chen, H.; Hu, W.; Schleicher, N.; Zheng, B.; Norra, S. Water mass interaction in the confluence zone of the Daning River and the Yangtze River—A driving force for algal growth in the three gorges reservoir. Environ. Sci. Pollut. Res. 2013, 20, 7027–7037. [Google Scholar] [CrossRef] [PubMed]
- Zhao, Y.; Xia, X.H.; Yang, Z.F.; Wang, F. Assessment of water quality in Baiyangdian Lake using multivariate statistical techniques. Procedia Environ. Sci. 2012, 13, 1213–1226. [Google Scholar] [CrossRef]
- Zhao, D.; Cheng, S.; Wu, B.; Zhang, Y.; Zhang, X.; Li, W.; Cui, Y. Toxicity of the Yangtze River source of drinking water on reproductive system of male mice (Mus musculus). Ecotoxicology 2009, 18, 729–735. [Google Scholar] [CrossRef] [PubMed]
- Hu, X.; Shi, W.; Cao, F.; Hu, G.; Hao, Y.; Wei, S.; Wang, X.; Yu, H. Bioanalytical and instrumental analysis of estrogenic activities in drinking water sources from Yangtze River delta. Chemosphere 2013, 90, 2123–2128. [Google Scholar] [CrossRef] [PubMed]
- Wang, Q.; Koshikawa, H.; Liu, C.; Otsubo, K. 30-year changes in the nitrogen inputs to the Yangtze River basin. Environ. Res. Lett. 2014, 9, 115005. [Google Scholar] [CrossRef]
- Jia, C.-R.; Zhang, J. Based on fuzzy weight matter element to evaluate the water quality of Jialing River in Nanchong, China. Procedia Environ. Sci. 2011, 11, 631–636. [Google Scholar]
- Qu, B.; Sillanpää, M.; Zhang, Y.; Guo, J.; Wahed, M.S.M.A.; Kang, S. Water chemistry of the headwaters of the Yangtze River. Environ. Earth Sci. 2015, 74, 1–16. [Google Scholar] [CrossRef]
- Naddeo, V.; Scannapieco, D.; Zarra, T.; Belgiorno, V. River water quality assessment: Implementation of non-parametric tests for sampling frequency optimization. Land Use Policy 2013, 30, 197–205. [Google Scholar] [CrossRef]
- Xin, X.K.; Li, K.F.; Finlayson, B.; Yin, W. Evaluation, prediction, and protection of water quality in Danjiangkoureservoir, China. Water Sci. Eng. 2015, 8, 30–39. [Google Scholar] [CrossRef]
- Bouza-Deaño, R.; Ternero-Rodríguez, M.; Fernández-Espinosa, A.J. Trend study and assessment of surface water quality in the Ebro River (Spain). J. Hydrol. 2008, 361, 227–239. [Google Scholar] [CrossRef]
- Alberto, W.D.; Diaz, M.d.P.; Amé, M.V.; Fabiana, P.S.; Hued, A.C.; De Los Ángeles, B.M. Pattern recognition techniques for the evaluation of spatial and temporal variations in water quality. A case study: Suquı́a River basin (Córdoba–Argentina). Water Res. 2001, 35, 2881–2894. [Google Scholar] [CrossRef]
- Singh, K.P.; Malik, A.; Mohan, D.; Sinha, S. Multivariate statistical techniques for the evaluation of spatial and temporal variations in water quality of Gomti River (India)—A case study. Water Res. 2004, 38, 3980–3992. [Google Scholar] [CrossRef] [PubMed]
- Dunn, G.; Henrich, N.; Holmes, B.; Harris, L.; Prystajecky, N. Microbial water quality communication: Public and practitioner insights from British Columbia, Canada. J. Water Health 2014, 12, 584–595. [Google Scholar] [CrossRef] [PubMed]
- Demir, I.; Jiang, F.; Walker, R.V.; Parker, A.K.; Beck, M.B. Information systems and social legitimacy scientific visualization of water quality. In Proceedings of the IEEE International Conference on Systems, Man and Cybernetics, San Antonio, TX, USA, 11–14 October 2009; pp. 1067–1072. [Google Scholar]
- Srivastava, P.K.; Mukherjee, S.; Gupta, M.; Singh, S.K. Characterizing monsoonal variation on water quality index of River Mahi in India using geographical information system. Water Qual. Expo. Health 2011, 2, 193–203. [Google Scholar] [CrossRef]
- Best, D.M.; Lewis, R.R. Gwvis: A tool for comparative ground-water data visualization. Comput. Geosci. 2010, 36, 1436–1442. [Google Scholar] [CrossRef]
- Demir, I.; Krajewski, W.F. Towards an integrated flood information system: Centralized data access, analysis, and visualization. Environ. Model. Softw. 2013, 50, 77–84. [Google Scholar] [CrossRef]
- Halls, J.N. River run: An interactive GIS and dynamic graphing website for decision support and exploratory data analysis of water quality parameters of the lower Cape Fear river. Environ. Model. Softw. 2003, 18, 513–520. [Google Scholar] [CrossRef]
- Ziolkowska, J.R.; Reyes, R. Geological and hydrological visualization models for digital earth representation. Comput. Geosci. 2016, 94, 31–39. [Google Scholar] [CrossRef]
- Aigner, W.; Miksch, S.; Müller, W.; Schumann, H.; Tominski, C. Visual methods for analyzing time-oriented data. IEEE Trans. Vis. Comput. Graph. 2008, 14, 47–60. [Google Scholar] [CrossRef] [PubMed]
- Van Wijk, J.J.; Van Selow, E.R. Information Visualization. In Cluster and Calendar Based Visualization of Time Series Data, Proceedings of the IEEE Symposium on Information Visualization (INFOVIS'99), San Francisco, California, CA, USA, 24–29 October 1999; Wills, G., Keim, D., Eds.; IEEE Computer Society: Washington, DC, USA, 1999; pp. 4–9. [Google Scholar]
- Zhou, M.; Wang, R.; Mai, S.; Tian, J. Spatial and temporal patterns of air quality in the three economic zones of China. J. Maps 2016, 1–7, 156–162. [Google Scholar] [CrossRef]
- Brewer, C.A.; Hatchard, G.W.; Harrower, M.A. Colorbrewer in print: A catalog of color schemes for maps. Cartogr. Geogr. Inf. Sci. 2003, 30, 5–32. [Google Scholar] [CrossRef]
- JS. Available online: www.javascript.com (accessed on 15 September 2017).
- D3 Data-Driven Documents. Available online: d3js.org (accessed on 15 September 2017).
- Corel. Available online: www.corel.com/cn/ (accessed on 15 September 2017).
- Hu, Y.; Cheng, H. Water pollution during China’s industrial transition. Environ. Dev. 2013, 8, 57–73. [Google Scholar] [CrossRef]
- Zhao, H.; Duan, X.; Stewart, B.; You, B.; Jiang, X. Spatial correlations between urbanization and river water pollution in the heavily polluted area of Taihu Lake basin, China. J. Geogr. Sci. 2013, 23, 735–752. [Google Scholar] [CrossRef]
- Stone, R. China aims to turn tide against toxic lake pollution. Science 2011, 333, 1210–1211. [Google Scholar] [CrossRef] [PubMed]
- Yamamoto, A.; Fujita, T.; Tateno, N.; Hareyama, M. Data visualization and web map server (WMS) system for Kaguya (Selene). In Proceedings of the 42nd Lunar and Planetary Science Conference (2011), The Woodlands, TX, USA, 7–11 March 2011. [Google Scholar]
- Walker, D.; Jakovljević, D.; Savić, D.; Radovanović, M. Multi-criterion water quality analysis of the Danube River in Serbia: A visualisation approach. Water Res. 2015, 79, 158–172. [Google Scholar] [CrossRef] [PubMed]
Figure 1.
Location and the main topographic features of the Yangtze River.

Figure 2.
Cyclic structure of the calendar view at weekly precision.

Figure 3.
The spatial change of water quality in the Yangtze River basin. (The water quality data of the Yangtze River during 2006–2015 are represented using the proposed calendar method. According to the rendering rule defined in Table 2, the colors in calendar view indicate the major water pollutants and the corresponding water quality levels qualitatively.
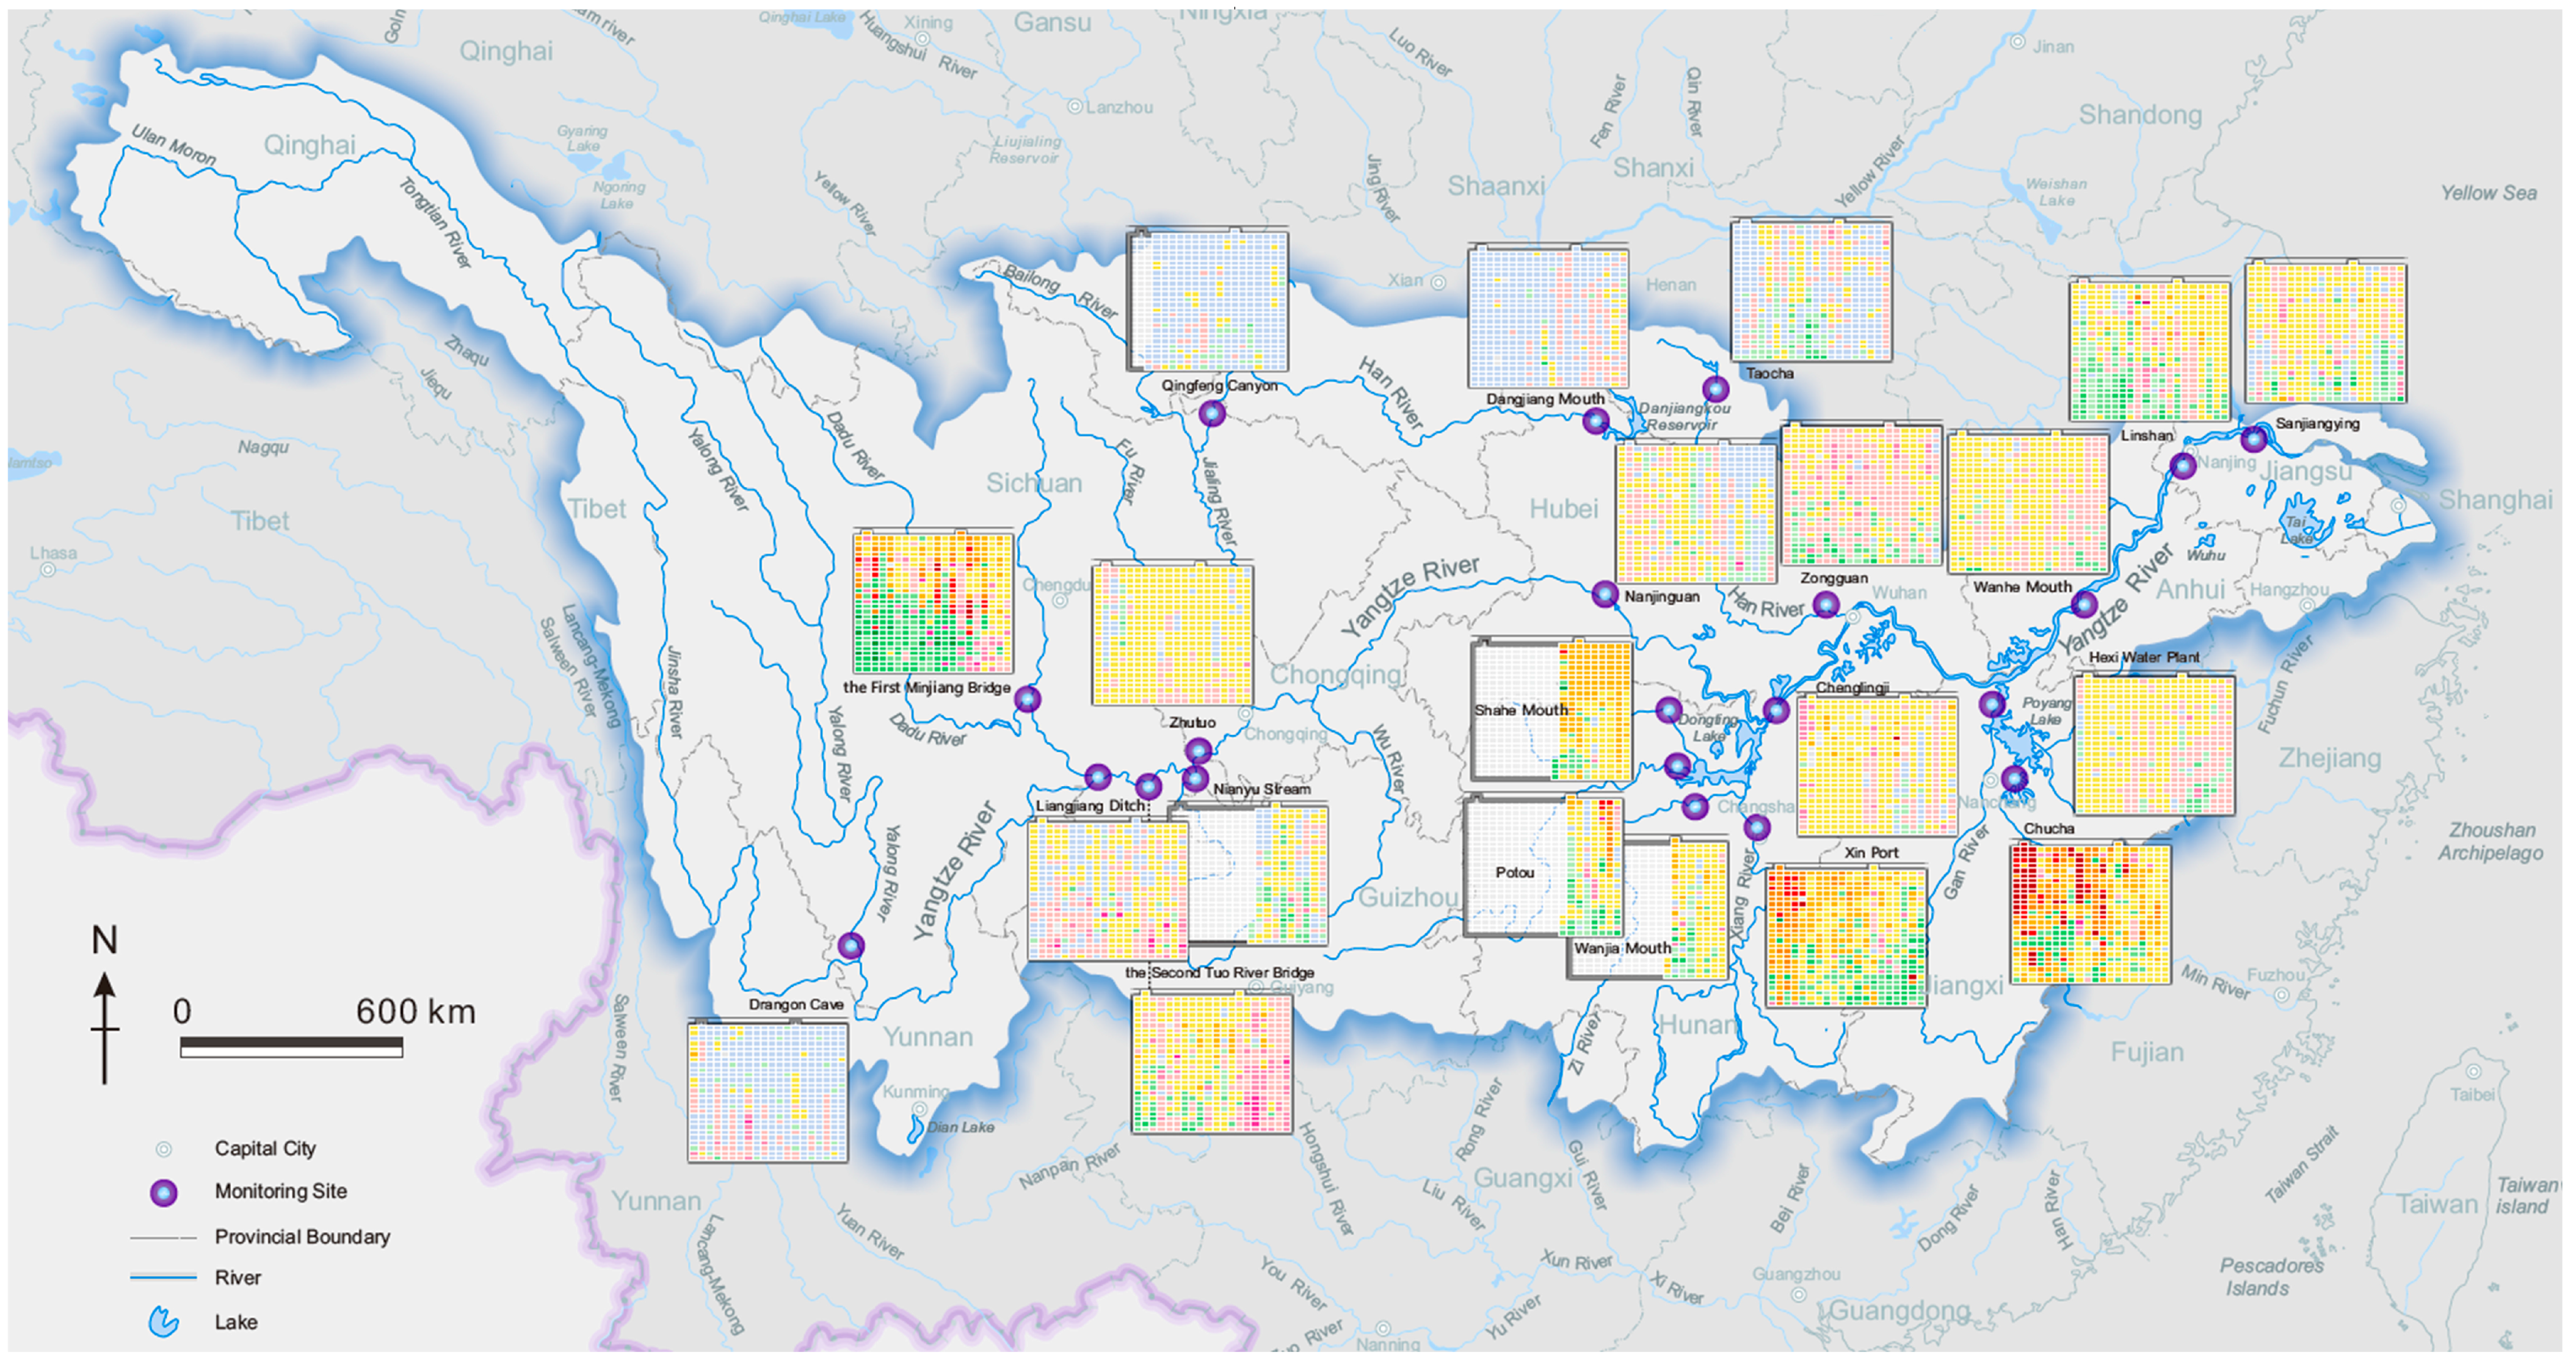
Figure 4.
The result of hierarchical cluster analysis on spatial pattern of water quality in the Yangtze River. (a) Dendrogram for the WQL frequency of water quality monitoring sections in the Yangtze River. (b) Cluster viewer for the water quality level of monitoring section belongs to Group 1. (c) Cluster viewer for the water quality level of monitoring section belongs to Group 2. (d) Cluster viewer for the water quality level of monitoring section belongs to Group 3.

Figure 5.
The temporal change of water quality in several sections of the Yangtze River. (a) Danjiang Mouth; (b) Nanjingguan; (c) the First Minjiang Bridge; (d) Linshan; (e) Xin Port; (f) Jishui Port; (g) Hexi Water Plant; (h) Hama Stone.
Figure 5.
The temporal change of water quality in several sections of the Yangtze River. (a) Danjiang Mouth; (b) Nanjingguan; (c) the First Minjiang Bridge; (d) Linshan; (e) Xin Port; (f) Jishui Port; (g) Hexi Water Plant; (h) Hama Stone.


Figure 6.
The annual pattern of major pollutant change in a few sections of the Yangtze River. (a) the First Minjiang Bridge; (b) Linshan; (c) Xin Port; (d) Jishui Port; (e) Hexi Water Plant; (f) Hama Stone.
Figure 6.
The annual pattern of major pollutant change in a few sections of the Yangtze River. (a) the First Minjiang Bridge; (b) Linshan; (c) Xin Port; (d) Jishui Port; (e) Hexi Water Plant; (f) Hama Stone.


Table 1.
The grading thresholds for several water quality indices.
| WQL | Category | pH | DO (≥ mg/L) | CODMn (≤ mg/L) | NH3-N (≤ mg/L) | TP (≤ mg/L) | TN (≤ mg/L) |
|---|---|---|---|---|---|---|---|
| I | Excellent | 6~9 | 7.5 | 2 | 0.15 | 0.02 | 0.2 |
| II | Lightly polluted | 6 | 4 | 0.5 | 0.1 | 0.5 | |
| III | Moderately polluted | 5 | 6 | 1.0 | 0.2 | 1.0 | |
| IV | Seriously polluted | 3 | 10 | 1.5 | 0.3 | 1.5 | |
| V | Terrible polluted | 2 | 15 | 2.0 | 0.4 | 2.0 | |
| Poor V | Cannot be used | - 1 | <2 | >15 | >2.0 | >0.4 | >2.0 |
Notes: 1 In our study, the Poor V was defined based on the Chinese Environmental Quality Standards for Surface Water, which only provides the grading thresholds corresponding to WQL I–V. As the pH thresholds are not classified in the standers, we didn’t define a specific pH value for the Poor V.
Table 2.
Qualitative colors for ranking the primary water quality indices.
| I | II | III | IV | V | Poor V | No Data | |
|---|---|---|---|---|---|---|---|
| pH | - | ||||||
| DO |  |  |  |  |  | ||
| CODMn |  |  |  |  |  |  |  |
| NH3-N |  |  |  |  |  | ||
© 2017 by the authors. Licensee MDPI, Basel, Switzerland. This article is an open access article distributed under the terms and conditions of the Creative Commons Attribution (CC BY) license (http://creativecommons.org/licenses/by/4.0/).
Share and Cite
MDPI and ACS Style
Huang, L.; Zhong, M.; Gan, Q.; Liu, Y. A Novel Calendar-Based Method for Visualizing Water Quality Change: The Case of the Yangtze River 2006–2015. Water 2017, 9, 708. https://doi.org/10.3390/w9090708
AMA Style
Huang L, Zhong M, Gan Q, Liu Y. A Novel Calendar-Based Method for Visualizing Water Quality Change: The Case of the Yangtze River 2006–2015. Water. 2017; 9(9):708. https://doi.org/10.3390/w9090708
Chicago/Turabian StyleHuang, Lina, Mengyin Zhong, Qiyao Gan, and Yanfang Liu. 2017. "A Novel Calendar-Based Method for Visualizing Water Quality Change: The Case of the Yangtze River 2006–2015" Water 9, no. 9: 708. https://doi.org/10.3390/w9090708
Note that from the first issue of 2016, this journal uses article numbers instead of page numbers. See further details here.