Article

Changes in Phytoplankton and Water Quality during Sustainable Restoration of an Urban Lake Used for Recreation and Water Supply

by
Anna Kozak
1,*,
Ryszard Gołdyn
1,
Renata Dondajewska
1,
Katarzyna Kowalczewska-Madura
1 and
Tomasz Holona
2
1
Department of Water Protection, Faculty of Biology, Adam Mickiewicz University in Poznań, Umultowska 89, Poznań 61-614, Poland
2
Szczecin City Office, ZDiTM, Armii Krajowej 1, Szczecin 70-456, Poland
*
Author to whom correspondence should be addressed.
Water 2017, 9(9), 713; https://doi.org/10.3390/w9090713
Submission received: 19 May 2017 / Revised: 8 September 2017 / Accepted: 11 September 2017 / Published: 18 September 2017

Abstract

:
Groundwater intake near Lake Głębokie, situated in the city of Szczecin in Northwestern Poland, resulted in a distinct decrease in the lake water level. Water intake from a river and a neighboring urban area led to eutrophication and a strong cyanobacterial water bloom. Both the water intake and recreation were threatened due to the possible influence of cyanobacterial toxins. The lake was subjected to three sustainable restoration methods: aeration of sediment-water; iron addition to precipitate P, and; biomanipulation. The goal of our study was to determine the changes in the taxonomic composition of phytoplankton and chemical water variables during restoration measures. A comparison of the data obtained during this research with the pre-restoration data showed that, as a result of the treatments orthophosphates decreased, rarely exceeding 0.06 mg P·L−1, and cyanobacterial water blooms disappeared. Cyanobacteria were found in the lake but they were not abundant. Chrysophytes and diatoms were the most abundant in springtime of each year. Green algae, desmids and chrysophytes were particularly abundant in summer, while cryptophytes predominated in autumn. Algae from all these groups do not pose a threat to either recreation or water intake. The deep chlorophyll maximum occurring in summer at a depth of 5 m as a result of restoration confirms the lower trophic status of the lake, alluding to mesotrophic conditions.

1. Introduction

Artificial aeration of degraded lakes is a restoration method aiming at the improvement of oxygen conditions in the near-bottom water layer [1]. Usually this method involves supplying the hypolimnion with compressed air or oxygenated water from the surface, leading to thermal destratification of the water column [2]. The effectiveness of water aeration is well documented due to numerous applications of these methods in eutrophied lake ecosystems [3,4,5,6,7,8]. However, the negative result of such water mixing is moving the nutrient-rich hypolimnetic waters up to the surface, which stimulates primary production [1]. This disadvantage can be avoided by the use of hypolimnetic aeration as performed by McQueen and Lean [9], who stated that well-designed aerators should not cause significant destratification or warming of hypolimnetic waters. An increase of oxygen concentration at the sediment-water interface and a simultaneous decrease of hydrogen sulfide, methane and ammonia content, together with a decrease of internal phosphorus loading, were the main results. Therefore, hypolimnetic aeration leads to an improvement in water quality and is one of the basic methods of lake restoration [10]. The most economically advantageous is the use of wind-driven pulverizing aerators [11].
The most commonly used chemical treatment for decreasing phosphorus content in the water column is to use a solution of iron or aluminum compounds. Typically, high doses of chemicals (ca. 1 ton ha−1) are applied, which lead to coagulation of the total suspension, and phosphorus removal by adsorption [12,13]. Such strong interference by chemicals in the lake ecosystem is often unacceptable to lake users, so recently a new, sustainable method of iron addition has been used in which only small doses of chemicals are introduced (4–15 kg ha−1) for precipitation of phosphorus. This method does not have a direct influence on the biota, including phytoplankton. However, a reduction in the concentration of phosphates in the water column leads to a limitation of phytoplankton growth [11].
Biomanipulation involves stocking the lake with predatory species or removing zooplanktivorous and benthivorous fish [14,15]. However, as a result of a number of feedback mechanisms, this method fails when used separately [16,17,18]. Therefore, it is often used as a complementary method, together with physical and chemical methods [11,19].
In each case, it is important to apply the protection methods of the lake to be restored, by sewage diversion and limiting spatial sources of pollution, including, inter alia, the sewage entering the lake from leaky septic tanks [13].
Phytoplankton in restored lakes is dependent on many factors, related both to the type of restoration method used, as well as natural factors specific to a particular waterbody [20,21]. This is especially true for shallow lakes, which are very sensitive to external factors [22,23]. Thus, it is difficult to construct a universal model to describe phytoplankton depending on the method of lake restoration. This is especially so because there is still not enough long-term data on the variability of phytoplankton in such lakes [19,24]. Restoration efforts can have effects on physico-chemical variables of water quality. Such effects lead to changes in phytoplankton production and community composition. Biomanipulation, for example, the removal of benthi- and planktivorous fish or stocking of piscivorous fish, could change the zooplankton community and increase the density of herbivorous zooplankton (mainly Daphnia). Increase of grazing pressure can cause changes in phytoplankton abundance and share of taxonomic groups. The increase of chlorophytes, diatoms and cryptophytes were noted in Danish biomanipulated lakes [25]. As was reported by Schriver and others [26], cryptophytes tend to dominate in systems characterized by high zooplankton grazing. Some phytoplankton groups may be favored by additions of iron complexes used in the precipitation of P. As an example, heterocytous cyanobacterial species are promoted by iron in restored lakes [27]. Iron addition experiments with freshwater green algae showed lower growth rates after additions of Fe compared to control conditions without iron addition [28]. Also, the water aeration system has been noticed as changing phytoplankton dynamics, causing a decrease in cyanobacteria proportion and abundance, and an increase in other phytoplankton groups, for example, chlorophytes, diatoms, cryptophytes and chrysophytes, in small waterbodies [29]. The aim of our study was to analyze the response of phytoplankton composition and abundance in the light of three sustainable restoration methods, applied simultaneously in the shallow, partly stratified Lake Głębokie.

2. Materials and Methods
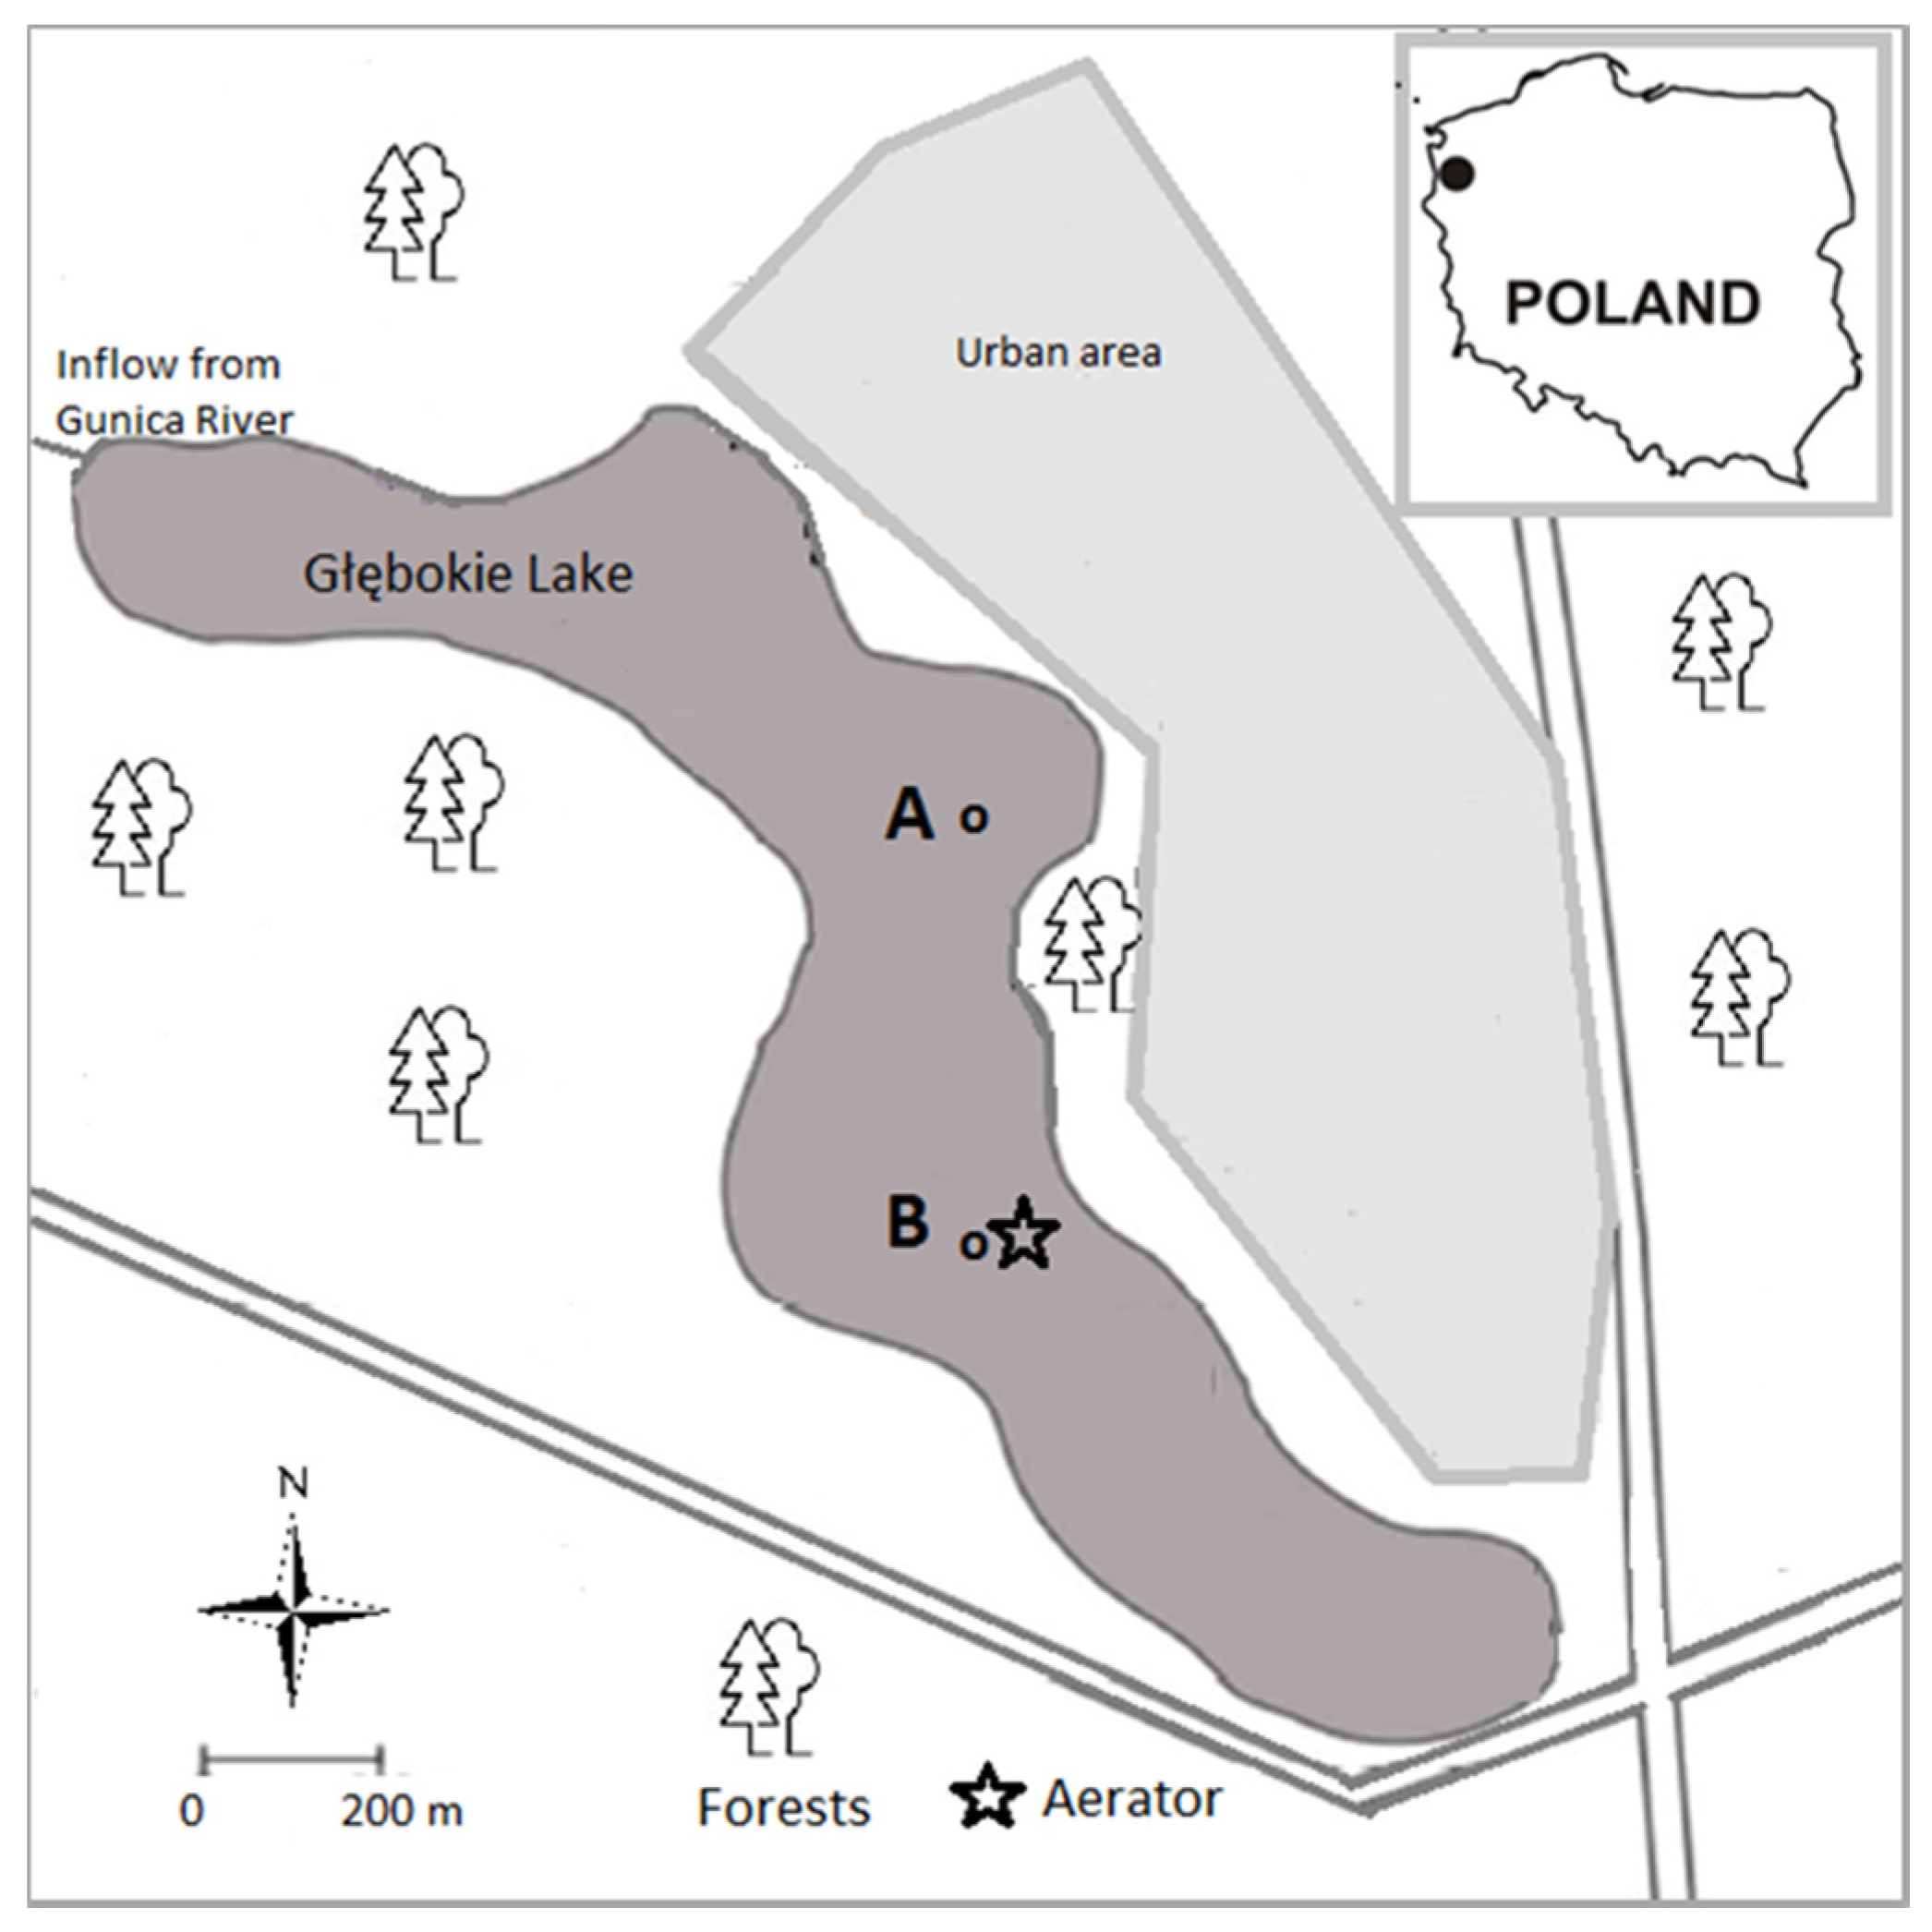
2.1. Study Area

Lake Głębokie (53°28’N, 14°29’E) is a natural lake localized in Szczecin (NW Poland, Figure 1). It has no natural inflows or outflows. Since 1997, the lake has been artificially supplied with water from the River Gunica (from October to April), using a pipe located in its northwest part. This prevents the lowering of the water level due to intake of groundwater for water supply from wells nearby. The lake covers an area of 31 ha. It has an average depth 2.4 m, and its maximum depth reaches 6 m [30]. The lake was polluted by sewage leakage from septic tanks in a residential area located in the vicinity and by intensive recreational use. The increase of nutrient concentrations led to the intensive growth of phytoplankton and the appearance of water cyanobacterial blooms [31]. Both the water intake from the wells situated near the shoreline and recreation were threatened due to the possible influence of cyanobacterial toxins. Eighty percent of the catchment area of Lake Głębokie is covered by forest, however, and almost 19% is occupied by a residential area [32]. It is a popular local attraction as a place for leisure and recreation, therefore proper water quality is vital. The average air temperature (April–October) in subsequent years was the highest in 2011 (14.97 °C), but the maximum value was found in 2010. Precipitation was the highest in 2011 and the lowest in 2012 [33], (Figure 2).

2.2. Restoration Treatments

The restoration of the Lake Głębokie began in 2008, when a wind-driven pulverizing aerator was installed. A Savonius wind turbine is used to drive the paddle wheel, which pulverizes water taken from the near bottom area. Hydrogen sulphide and other gases are released in this process and replaced by oxygen from the air. The aerated water sinks to the bottom through a special pipe, without any mixing of the surface water [34].
The second method of restoration was iron addition. Periodically, small doses of coagulant PIX-112 (iron sulphate III) were used for the precipitation of phosphorus from the water column to the bottom sediments [35]. These applications were performed with the use of a mobile vessel in doses adjusted to the phosphorus content in lake water, which was monitored during the restoration [35,36]. This chemical was used twice in 2008 (300 and 450 kg), four times in 2009 (300, 350 and 250 kg twice), once in 2010 (450 kg) and six times in 2011 (mean 350 kg). Additionally, biomanipulation was used as a third method of restoration to obtain top-down effects of predatory fish on phytoplankton and water transparency. The lake was stocked in 2009 with 50,000 hatching pike (Esox lucius), 9000 summer fry of pikeperch (Sander lucioperca) and 3000 autumn fry of catfish (Silurus glanis). In 2010 it was stocked with 9000 summer pikeperch and 2210 autumn catfish fry, in 2011 31 kg of summer pikeperch fry, 3000 autumn catfish and 71 kg of autumn pike fry were introduced, while in 2012 a total of 5000 catfish summer fry, 60,000 pike summer fry and 800 autumn pike fry were brought into the lake. The leakage of the largest loads of nitrogen and phosphorus from the direct catchment area to Lake Głębokie were stopped in the meantime due to the construction of a sewer and discharge of effluent to a wastewater treatment plant [36].

2.3. Sampling and Analysis

The phytoplankton composition and selected water variables were analyzed in the years 2009–2012. Water for chemical and phycological analyses was usually sampled between February and November with differing frequency: four times in 2009 and 2012; six times in 2011, and; eight times in 2010. Winter samples were impossible to collect due to the thin ice. Two sampling stations were located along the longitudinal axis of the lake (A and B-near aerator) in the deepest part of the lake (Figure 1). Water samples were collected in depth profile from 1 m to a depth of 5 m in 1 m intervals. Nutrient concentrations: ammonium, nitrite and nitrate nitrogen, orthophosphates and total phosphorus (TP) were analyzed in preserved samples according to the ISO Standard Methods [37]. Dissolved reactive phosphorus (DRP) and total phosphorus (TP) were analyzed spectrophotometrically using the molybdate method with ascorbic acid as a reducer (TP after the persulfate digestion procedure), ammonium nitrogen—using the Nessler method, nitrate N—the salicylate method, nitrite N—the diazotization method with sulfanilic acid. In the years 2011–2012 the concentration of total nitrogen (TN) was also analyzed, due to organic nitrogen analyzing using the Kjeldahl digestion method. Throughout the research period the amount of total suspended solids (TSS) and chlorophyll-a (Chl-a) concentrations were measured after water filtration, using GF/C Whatman filters. TSS was calculated as the weight difference of the dry mass of the filter before and after filtration, and chlorophyll a concentration was analyzed using the Lorenzen method after acetone extraction [37,38].

2.4. Statistical Analyses
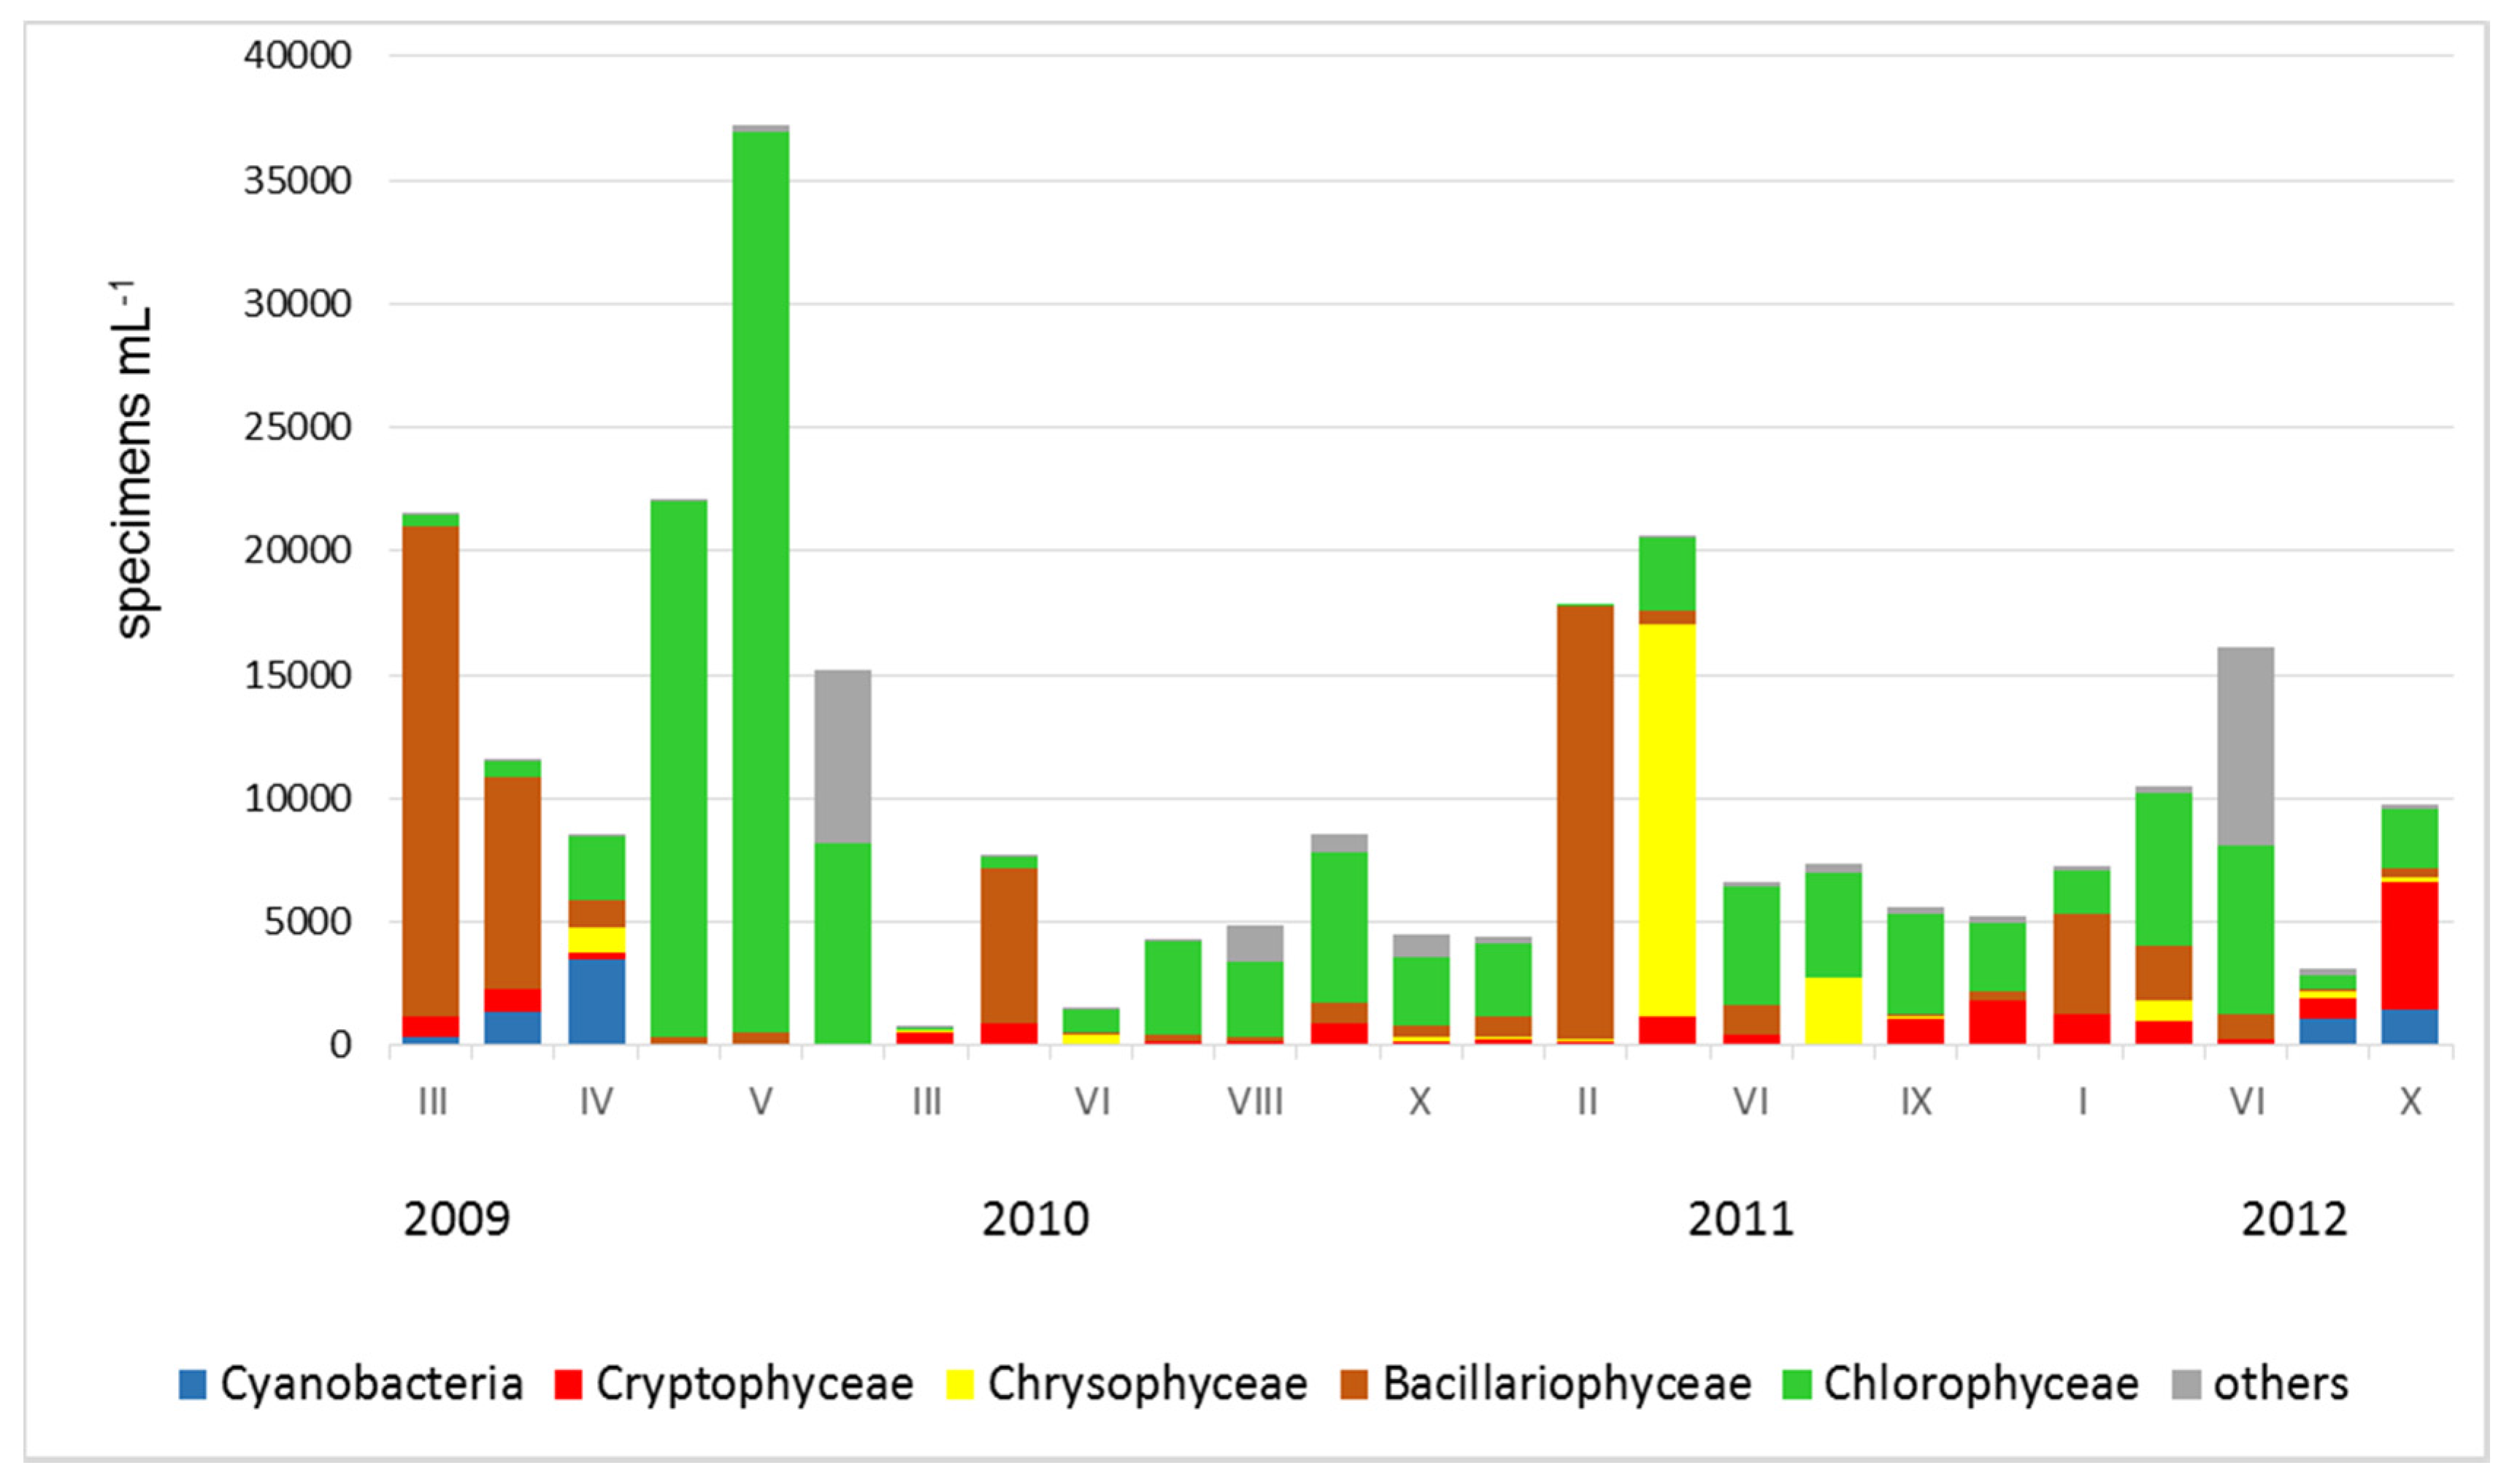
Phytoplankton composition and abundance was analyzed in 0.67 mL Sedgwick-Rafter chambers with an Olympus microscope in samples preserved with Lugol’ solution, using 400× magnification. Phytoplankton abundance was expressed as number of specimens (cell/colony/filament/coenobium) per milliliter. Phytoplankton diversity was calculated according to the Shannon-Weaver formula using the software for scientific analysis Past software 3.16 [39]. Data concerning the phytoplankton and nutrient concentration from one station in the year 2011 had already been taken for comparisons with other lakes [24].
Differences between phytoplankton abundance and its biodiversity in the individual studied years were tested by the non-parametric ANOVA Kruskal-Wallis Rank test, while differences between phytoplankton abundance at stations A and B were tested with the Mann-Witney test (Past software) [39]. To ascertain the environmental variables in determining the abundance of phytoplankton the Canonical Correspondence Analysis (CCA) was applied [40]. CCA was used to create models explaining relationships between phytoplankton taxonomical groups vs physico-chemical variables and meteorological (air temperature and precipitation) parameters. The nine taxonomic phytoplankton groups and individual taxa appearing in high density (mean > 30% in the total phytoplankton abundance) were correlated with the physico-chemical variables. The results obtained from two sampling stations were tested. The Monte Carlo permutation was used to assess statistical significance in the regression.

3. Results

During the period of research the water temperature and oxygen concentration did not have any visible long-term trends (Figure 3). Oxygen depletion was noted during summer, influencing the concentrations of nutrients, for example, ammonium nitrogen. Its content in the water column varied from 0.51 to 6.18 mg N-NH4·L−1. Higher values were noted in 2009 at the beginning of restoration, exceeding 3 mg N-NH4·L−1 at a depth of 5 m at station B and reached almost 2 mg N-NH4·L−1 at station A (Figure 4, Figure 5A). It was lower in the following years and the mean vales were similar at both research stations. Ammonium nitrogen content was usually lower than 1 mg N-NH4·L−1 in the depth of 1 m. Higher values were occasionally noted in 2009 and 2012. There were no statistically important differences between stations A and B (p > 0.05, Kruskal-Wallis test).
Nitrite nitrogen concentration was below 0.01 mg N-NO2·L−1 in all the analyzed years. Slightly higher values were occasionally noted at a depth of 5 m (Figure 4). In the case of nitrate nitrogen, noted values were usually below the sensitivity of the applied analytical method. Only in March 2010 and February 2011 was an increase of content noted, respectively, up to 1.9 and 1.200 mg N-NO3·L−1.
TN content was visibly higher in 2011, both in the case of maximum values exceeding 4 mg N·L−1 and mean annual values (ca. 3 mg N·L−1). In 2012 mean TN content was scarcely 1.740 mg N·L−1 at station A and 1.700 mg N·L−1 at station B (Figure 5B).
A slight variability in the mean annual concentrations of orthophosphates was noted in the analyzed period—from a minimum of 0.023 mg P O4·L−1 in 2009 to a maximum of 0.035 mg PO4·L−1 in 2010 (Figure 5C). The highest value in all the analyzed samples, reaching 0.150 mg P O4·L−1, was observed in 2012 at station A, although this appeared to be an individual phenomenon. The orthophosphate concentration in most samples was lower than 0.050 mg P O4·L−1. Orthophosphate concentration in the water column varied from zero to 0.074 mg P O4·L−1, and from 0.010 to 0.150 mg P O4·L−1 in the water layer at the depth of 5 m, reflecting changes in oxygen and temperature conditions in vertical profile throughout the year.
TP content was lower in 2009 in the case of mean annual value, reaching 0.055 mg P·L−1. Mean concentrations increased in the following years, reaching 0.072 mg P·L−1 in 2012 (Figure 5D). The maximum value of phosphorus content was reached in 2012, exceeding 0.200 mg P·L−1 at station A. Mean annual values in the water column ranged from below 0.055 mg P·L−1 in 2009 up to 0.065 mg P·L−1 in successive years. Mean annual values at a depth of 5 m showed the same variation, changing from 0.082 to 0.100 mg P·L−1. N:P (mineral forms) ratio showed the downward trend from 30.6 in 2009 to 11.1 in 2012.
Chlorophyll-a (Chl-a) concentrations were similar at both stations in 2009, varying from 4.0 to 39.6 µg·L−1. Mean annual values reached ca 21 µg·L−1. In 2010 mean content decreased below 15 µg·L−1, although the range of values increased (Figure 5E). The highest maximum Chl-a content was noted in 2011, exceeding 64 µg·L−1 at both stations. A visible decrease in the range of values was noted in 2012, while the mean values remained at the same level of ca 16 µg·L−1.
TSS content was higher in 2009 (mean values over 8 mg·L−1 at both stations) and decreased in the following years (Figure 5F). In 2010–2012 mean annual values varied from 5.3 to 7.0 mg·L−1. Slightly higher values were usually noted at station A. TSS values in the 1-m water layer ranged from 1.2 to 11.3 mg·L−1, while in the case of the water layer at a depth of 5 m TSS content was significantly higher in 2009, especially at station A, reaching a maximum of 36.5 mg·L−1.
Phytoplankton was represented by 165 taxa of prokaryotic and eukaryotic algae (Figure 6) belonging to nine systematic groups. The dominant group was green algae (mainly members of Chlorococcales), which accounted for 44% of the total number of taxa, diatoms 14% and cyanobacteria 13%. Other groups were infrequent and represented by a smaller number of taxa (1–9%). The richness of phytoplankton species showed an upward trend in the analyzed period, from 84 taxa in 2009 to 133 in 2012.
The Shannon-Weaver diversity index varied from 0.25 to 3.00 (Figure 7). There were no significant differences in diversity between station A and B (p > 0.05, Mann-Witney test). Mean values of the index increased in subsequent years and reached 1.22 in 2009, 2.00 in 2010, 2.03 in 2011 and 2.32 in 2012, however, the differences were significant only in 2011 and 2012 (p < 0.05, Kruskal-Wallis test).
Phytoplankton abundance decreased from a mean annual value of ca 20.4 × 10³ specimens mL−1 in 2009 to ca. 5.7 × 10³ spec. mL−1 in 2010. An increase in phytoplankton abundance was noted in 2011, as the mean value reached 10.3 × 10³ spec. mL−1, and slightly decreased in 2012 when the mean value reached 8.6 × 10³ spec. mL−1 (Figure 8). Differences between phytoplankton abundance of the individual studied years were significant (p < 0.05, Kruskal-Wallis test). The differences between stations A and B were not statistically significant (p > 0.05, Mann-Witney test).
The highest abundance of phytoplankton organisms was found in February 2011. The most abundant were centric diatoms then, mainly small-sized taxa such as Cyclotella minutula, Cyclotella sp. and Stephanodiscus sp. Centric diatoms were more abundant in cold months, that is, in March 2009, April 2010 and January 2012. There were also representatives of the pennate group, but stated in other periods, for example, Ulnaria acus, Fragilaria crotonensis, Asterionella formosa, especially noted in April 2009, October 2010, and June 2011 and 2012.
Green algae were the most numerous in 2009 (Figure 9), achieving a maximum value of 37.4 × 10³ spec. mL−1. The most numerous species were Tetraedron minimum, Scenedesmus ecornis, S. raciborski, S. armatus, S. acuminatus and Didimocystis sp. The abundance of green algae in the years 2010–2012 was significantly lower (p < 0.05, Kruskal-Wallis test).
Besides chlorophytes small conjugatophytes also increased their participation in October 2009, especially Cosmarium bioculatum var. depressum. This group was also abundant in August 2010 and in June 2012.
Cyanobacteria were found only at the beginning and the end of the studied period, achieving 6.3 × 10³ spec. mL−1 in April 2009 and 1.8 × 10³ spec. mL−1 in September 2012, although at that time they were not the dominant group (Figure 8). The most numerous species were Aphanizomenon gracile, Limnothrix redekei and Planktolyngbya limnetica. Less abundant were Cuspidothrix issatschenkoi and Merismopedia tenuissima, especially in deeper water layers.
The participation of cryptophytes and chrysophytes such as Erkenia subaequiciliata, Cryptomonas marssonii, C. reflexa, Rhodomonas lacustris and Rh. lens was observed in cold months, especially in April and October of 2010–2012.
The CCA diagram showed that the abundance of phytoplankton taxonomic groups such as chrysophytes, diatoms and cryptophytes were negatively correlated with temperature (Figure 10A). Chlorophytes, conjugatophytes and Dinophytes were positively correlated with water temperature, while negatively with pH and NO3-N. The ordination diagram of CCA explained 29.9% of variance of phytoplankton groups. Environmental and meteorological variables such as temperature, dissolved oxygen, NO3-N, NO2-N, N:P ratio, pH, precipitation and air temperature had a significant effect on phytoplankton distribution (Monte Carlo test, p < 0.01). The environmental variable such as NH4-N and PO4-P had no significant effect (p > 0.05) on phytoplankton group abundance (Table 1).
A few taxa, for example, Aphanizomenon gracile and Rhodomonas lacustris, negatively correlated with air and water temperature and precipitation (Figure 10B). The Cyclotella species negatively correlated with NH4-N and positively with NO3-N. Tetraedron minimum, present in all the studied months, positively correlated with PO4-P. The ordination diagram of CCA explained 51.9% of variance of phytoplankton taxa. The Monte Carlo permutation test selected environmental variables that had a significant effect on distribution of dominant taxa of phytoplankton (p < 0.05) such as air and water temperature, N:P ratio, NH4-N, NO3-N and pH and insignificant (p > 0.05) PO4-P, NO2-N and dissolved oxygen (Table 1).

4. Discussion

Lake Głębokie as a shallow lake has partial thermal stratification (epi- and metalimnion) observed only in summer. This phenomenon affected the changes of oxygen and nutrient concentrations in the depth profile [32]. In summer months the lake suffers from oxygen depletion in the near bottom water layer, which also influences nutrient content. The amount of ammonia nitrogen and phosphorus increase at the depth of 5 m, indicating the sediments as the main source of these nutrients for the water column. Water circulation in the entire vertical profile during autumn results in increasing nitrogen and phosphorus concentrations in the surface water layer. Such seasonal changes point to the role of sediments in nutrient cycling in the lake and the phenomenon of internal loading [41]. In shallow lakes such as Lake Głębokie, two-way phosphorus exchange on the interphase water-sediment is much more significant due to the great area of sediments in relation to water volume [42,43]. The contact of sediment with the water column in the long-term circulation period brings about the influence of various environmental conditions on sediments (water temperature, pH, oxygen content or redox potential), which are highly variable in time [44]. This significant role of sediments rich in organic matter and, consequently, in nutrients, hampers lake restoration. Inadequate inactivation of phosphorus resulting from an autochthonous supply is a frequently observed “bottleneck” in lake restoration [17,45]. Sediment withdrawal should be considered as the most beneficial method but at the same time it is the most costly, therefore other restoration methods were undertaken in Lake Głębokie.
Water aeration using a wind-driven aerator together with the iron addition method aimed to achieve permanent and effective precipitation of phosphorus by increasing the amount of oxygen in deep waters and the water-sediment interphase. This resulted in a marked reduction in phosphorus concentrations in comparison with 2008 before restoration, when the concentration of total phosphorus was in the range of 0.110–0.140 mg·L−1 [46]. The content of phosphorus, both in the total form and in the orthophosphates, remained generally stable in Lake Głębokie throughout the restoration period, especially in the case of mean annual values. Periodic higher concentrations of this element were probably related to interim lower efficiency of aeration, due to lack of wind. The effectiveness of aeration might be also limited by the lake catchment characteristics, as it is surrounded by forest, which may decrease the wind speed and therefore the efficiency of aeration. Similar conditions were stated for restored Lake Góreckie in Wielkopolski National Park [47], where the location of the lake in a depression as well as the geomorphology and forest cover in its surroundings cause a reduction in wind speed.
A decrease of ammonium nitrogen was noted in Lake Głębokie during the restoration period, especially at the lower depths near the bottom. This may indicate that oxygen transported by the aerator is used in the nitrification process, leading to nitrate availability for autotrophic organisms. In some of summer months in 2010 and 2011 an increase of Chl-a content was stated at a depth of 5 m up to 72 µg·L−1, while the amount of the pigment in the subsurface water layer was several times lower. This phenomenon is known as the deep chlorophyll maximum (DCM), which is characteristic of mesotrophic lakes [48]. Phytoplankton grows intensively in the metalimnion or even in the upper part of the hypolimnion due to the higher nutrient content, more so than in the epilimnetic zone. The most numerous species to form DCM in Lake Głębokie were Cosmarium bioculatum var. depressum, Tetraedron minimum, Scenedesmus ecornis, Coelastrum reticulatum and Didimocystis sp.
Chl-a concentration in depth profile diminished comparing the data from 2009 and 2012, especially in the case of maximum values. A visible decrease was observed in relation to the content of pigment noted before restoration, which then reached 129.3 µg·L−1 [46]. This was a result of the difference in phytoplankton abundance and composition. Intensive water blooms caused by cyanobacteria were noted in Lake Głębokie in the years before restoration. The dominant species were Limnothrix redekei, Planktolyngbya limnetica and Pseudanabaena limnetica at that time, and in cold months also Planktothrix rubescens [46]. From the beginning of the restoration a set of dominant species has been reconstructed. Species of green algae most often dominated, followed by diatoms, sometimes also chrysophytes. Cyanobacteria appeared only in the spring of 2009 and autumn 2012, however, they were not dominant. Cyanobacteria are organisms that most commonly form water blooms, and due to their high plasticity for adaptation to new conditions, they are sometimes very resistant to removal. There are many examples of lakes and reservoirs in which cyanobacteria dominate the phytoplankton composition in spite of restoration measures [49,50,51,52,53]. Water blooms caused by cyanobacteria are unfavorable especially for lakes used for water supply and for recreational purposes. They can pose a health threat owing to the potential production of toxins, which can lead to serious health problems [54,55,56,57]. An efficient method for removing cyanotoxins from water is essential [58]. Aphanizomenon gracile, in particular, noted in Lake Głębokie in 2012, is known to be a cylindrospermopsin-producing cyanobacterium in Polish lakes [59]. This toxin exhibits cytotoxic influence on a variety of groups of organisms of aquatic and terrestrial ecosystems.
An increase in species richness was observed during the period of lake restoration. This is a result of disturbances caused by restoration measures, which according to intermediate disturbance hypothesis [60] enhances species diversity, facilitating the gradual rebuilding of phytoplankton composition. It is in the opposition to unsustainable methods (e.g., high doses of polyaluminium precipitants), which are destructive to the ecosystem. Among the 165 phytoplankton taxa, the dominant one in this study were green algae (73 taxa), followed by diatoms (26 taxa), mostly small-cell species of r-selection strategy with a high growth rate, which are typical for unstable environments [60]. The obtained data showed the qualitative and quantitative differences in the phytoplankton community occurring in subsequent years. They were the result of organisms adapting to environmental changes. These changes were caused by many factors, such as temperature, light availability, quantity of nutrients and presence of other biota [61,62]. Within the period of spring overturn a large participation of diatoms, cryptophytes and chrysophytes occurred. Centric diatoms dominated, but also some pennate diatoms such as Ulnaria acus and Fragilaria crotonensis were observed, which are indicators of eutrophic conditions [61]. A significant increase in the abundance of centric diatoms was noted in February 2011, influencing the mean annual abundance of phytoplankton as well as the content of Chl-a. However, the highest phytoplankton abundance was in 2009, which over the following years began to decrease, thereby indicating a decrease in the trophic status of the lake. A similar increase in diversity with a concomitant decrease in the abundance of phytoplankton in subsequent years of sustainable restoration was observed in Lake Durowskie [11].
The value of the mean Shannon-Weaver diversity index in Lake Głębokie slightly increased in successive years (2009–2012) and ranged from 1.22 to 2.32. This may reflect an improvement in the environmental condition caused by restoration, as the index is frequently used to assess water quality [63,64,65]. The presence of some genera, for example, Cosmarium, that was quite abundant, Coenochloris and Staurodesmus that were less abundant in Głębokie Lake, indicate directional changes in the trophic state, as they are reported as tolerant or indicative of oligotrophic conditions in the lakes [66]. Additionally, Monoraphidium griffithii and Oocystis species recorded in studied lake, acc. to Hutchinsson are believed as indicators of oligotrophic conditions [67]. These taxa may indicate an improvement in water quality.
Besides the restoration measures, atmospheric conditions may also affect phytoplankton community structure [68]. According to CCA, both precipitation and air temperature had a statistically significant effect on abundance of phytoplankton taxonomic groups and dominating species (Figure 10A). However, high atmospheric precipitation near the examined lake in 2010 and 2011, and also high summer air temperature, did not cause an increase in the abundance of cyanobacteria, which was observed in sustainably restored Swarzędzkie Lake [69]. The appearance of cyanobacteria in 2012 in Głębokie Lake may have been caused by a low N:P ratio that is favored by this group [70,71,72]. The latter was confirmed by CCA in the present study (Figure 10A).
Despite the yearly stocking of the lake with predatory fish species, top-down control was not very effective. This is evidenced by numerous species of r-selection strategy in the phytoplankton, which can serve as a food source for large cladocerans [73,74,75,76], especially in 2009 and 2011. The stocking with hatching of pike in 2009, though intense, was not very effective, as survival from such hatching is very limited [76]. According to Skov et al. [77] the mortality of such stocked small fry is noticeably high (62–89%). In 2011 numerous small phytoplankton specimens appeared in spring, when large crustaceans in the zooplankton had not yet developed. This was the response of phytoplankton to the external nutrient load supplied with water pumped from the River Gunica.

5. Conclusions

The sustainable restoration of the lake led to the gradual phytoplankton reconstruction. Compared to pre-restoration data, it results in the decreasing of trophic status, which was evidenced by decreasing of nutrient concentrations and presence of deep chlorophyll maximum occurring in summer, and especially by the disappearance of cyanobacterial water blooms. The differences observed in each year of restoration were minor, caused mainly by natural fluctuations, which are the result of annual variation of meteorological conditions.

Acknowledgments

The research was partly financed by the grant No. NN305 372838 from the Ministry of Science and Higher Education (Poland). The open access costs were covered by the statutory founds of the Faculty of Biology.

Author Contributions

A.K. made the algological analyses; ran the statistical analyses, elaborated the data and wrote the manuscript; R.D., K.K.-M. made the chemical analyses; T.H. collected the samples and made the field measurements; A.K., R.G. contributed its revisions.

Conflicts of Interest

The authors declare no conflict of interest.

References

  1. Lossow, K.; Gawrońska, H.; Jaszczułt, R. Attempts to use wind energy for artificial destratification of Lake Starodworskie. Pol. J. Environ. Stud. 1998, 7, 221–227. [Google Scholar]
  2. Klapper, H. Technologies in lake restoration. J. Limnol. 2003, 62, 73–90. [Google Scholar] [CrossRef]
  3. Ashley, K.I. Hypolimnetic aeration of a naturally eutrophic lake: Physical and chemical effects. Can. J. Fish. Aquat. Sci. 1983, 40, 1343–1359. [Google Scholar] [CrossRef]
  4. Beutel, M.W.; Horne, A.J. A review of the effects of hypolimnetic oxygenation on lake and reservoir water quality. Lake Reserv. Manag. 1999, 15, 285–297. [Google Scholar] [CrossRef]
  5. Burns, F.L. Case study: Blue-green algal control in australia by year-round automatic aeration. Lake Reserv. Manag. 1994, 10, 61–67. [Google Scholar] [CrossRef]
  6. Brzozowska, R.; Gawrońska, H. The influence of a long-term artificial aeration on the nitrogen compounds between sediments and water in Lake Długie. Oceanol. Hydrobiol. Stud. 2009, 38, 113–119. [Google Scholar] [CrossRef]
  7. Garrel, M.H.; Confer, J.C.; Kirschner, D.; Fast, A.W. Effects of hypolimnetic aeration on nitrogen and phosphorus in a eutrophic lake. Water Res. 1977, 13, 343–347. [Google Scholar] [CrossRef]
  8. Grochowska, J.; Gawrońska, H. Restoration effectiveness of a degraded lake using multi-year artificial aeration. Pol. J. Environ. Stud. 2004, 13, 671–681. [Google Scholar]
  9. McQueen, D.J.; Lean, D.R.S. Hypolimnetic aeration: an overview. Water Qual. Res. J. Can. 1986, 21, 205–217. [Google Scholar]
  10. Gafsi, M.; Kettab, A.; Benmamar, S.; Benziada, S. Comparative studies of the different mechanical oxygenation systems used in the restoration of lakes and reservoirs. J. Food Agric. Environ. 2009, 7, 815–822. [Google Scholar]
  11. Gołdyn, R.; Podsiadłowski, S.; Dondajewska, R.; Kozak, A. The sustainable restoration of lakes—Towards the challenges of the WFD. Ecohydrol. Hydrobiol. 2014, 14, 68–74. [Google Scholar] [CrossRef]
  12. Łopata, M.; Gawrońska, H. Phosphorus immobilization in Lake Głęboczek following treatment with polyaluminum chloride. Oceanol. Hydrobiol. Stud. 2008, 37, 99–105. [Google Scholar] [CrossRef]
  13. Ryding, S.O.; Rast, W. The Control of Eutrophication of Lakes and Reservoirs; Man and the Biosphere Series; UNESCO: Paris, France, 1989; Volume 1, pp. 1–314. [Google Scholar]
  14. Søndergaard, M.; Lauridsen, T.L.; Johansson, L.S.; Jeppesen, E. Repeated Fish Removal to Restore Lakes: Case Study of Lake Væng, Denmark—Two Biomanipulations during 30 Years of Monitoring. Water 2017, 9, 43. [Google Scholar] [CrossRef]
  15. Özkan, K.; Jeppesen, E.; Davidson, T.A.; Bjerring, R.; Johansson, L.S.; Søndergaard, M.; Lauridsen, T.L.; Svenning, J.-C. Long-term trends and temporal synchrony in plankton richness, diversity and biomass driven by re-oligotrophication and climate across 17 Danish Lakes. Water 2016, 8, 427. [Google Scholar] [CrossRef]
  16. Anttila, S.; Ketola, M.; Kuoppmaki, K.; Kairesalo, T. Identification of a biomanipulation-driven regime shift in Lake Vesijärvi: Implications for lake management Source of the Document. Freshw. Biol. 2013, 58, 1494–1502. [Google Scholar] [CrossRef]
  17. Gulati, R.D.; Pires, L.M.D.; Van Donk, E. Lake restoration studies: Failures, bottlenecks and prospects of new ecotechnological measures. Limnologica 2008, 38, 233–247. [Google Scholar] [CrossRef]
  18. Ofir, E.; Heymans, J.J.; Shapiro, J.; Goren, M.; Spanier, E.; Gal, G. Predicting the impact of Lake Biomanipulation based on food-webmodeling—Lake Kinneret as a case study. Ecol. Model. 2017, 348, 14–24. [Google Scholar] [CrossRef]
  19. Kozak, A.; Gołdyn, R.; Dondajewska, R. Phytoplankton composition and abundance in restored Maltański reservoir under the influence of physico-chemical variables and zooplankton grazing pressure. PLoS ONE 2015, 10, e0124738. [Google Scholar] [CrossRef] [PubMed]
  20. Urrutia-Cordero, P.; Ekvall, M.K.; Hansson, L.A. Controlling harmful cyanobacteria: Taxa-Specific responses of cyanobacteria to grazing by large-bodied daphnia in a biomanipulation scenario. PLoS ONE 2016, 11, e0153032. [Google Scholar] [CrossRef] [PubMed]
  21. Padisák, J.; Hajnal, E.; Naselli-Flores, L.; Dokulil, M.T.; Nõges, P.; Zohary, T. Convergence and divergence in organization of phytoplankton communities under various regimes of physical and biological control. Hydrobiologia 2010, 639, 205–220. [Google Scholar] [CrossRef]
  22. Borics, G.; Nagy, L.; Miron, S.; Grigorszky, I.; László-Nagy, Z.; Lukács, B.A.; Tóth, L.G.; Várbíró, G. Which factors affect phytoplankton biomass in shallow eutrophic lakes? Hydrobiologia 2013, 714, 93–104. [Google Scholar] [CrossRef] [Green Version]
  23. Katsiapi, M.; Moustaka-Gouni, M.; Vardaka, E.; Kormas, K.A.R. Different phytoplankton descriptors show asynchronous changes in a shallow urban lake (L. Kastoria, Greece) after sewage diversion. Fundam. Appl. Limnol. 2013, 182, 219–230. [Google Scholar] [CrossRef]
  24. Kozak, A.; Dondajewska, R.; Kowalczewska-Madura, K.; Gołdyn, R.; Holona, T. Water quality and phytoplankton in selected lakes and reservoirs under restoration measures in Western Poland. Pol. J. Natur. Sc. 2013, 28, 217–226. [Google Scholar]
  25. Søndergaard, M.; Liboriussen, L.; Pedersen, A.R.; Jeppesen, E. Lake Restoration by Fish Removal: Short- and Long-Term Effects in 36 Danish Lakes. Ecosystems 2008, 11, 1291–1305. [Google Scholar] [CrossRef]
  26. Schriver, P.; Bøgestrand, J.; Jeppesen, E.; Søndergaard, M. Impact of submerged macrophytes on fish-zooplankton-phytoplankton interactions: Large-scale enclosure experiments in a shallow eutrophic lake. Freshw. Biol. 1995, 33, 255–270. [Google Scholar] [CrossRef]
  27. Bakker, E.S.; Van Donk, E.; Immers, A.K. Lake restoration by in-lake iron addition: A synopsis of iron impact on aquatic organisms and shallow lake ecosystems. Aquat. Ecol. 2016, 50, 121–135. [Google Scholar] [CrossRef]
  28. Keller, A.A.; Garner, K.; Miller, R.J.; Lenihan, H.S. Toxicity of nano-zero valent iron to freshwater and marine organisms. PLoS ONE 2017, 7, e43983. [Google Scholar] [CrossRef] [PubMed]
  29. Zębek, E.; Napiórkowska-Krzebietke, A. Response of phytoplankton to protective-restoration treatments enhancing water quality in a shallow urban lake. Environ. Monit. Assess. 2016, 188, 623. [Google Scholar] [CrossRef] [PubMed]
  30. Jańczak, J. Atlas of Polish Lakes; Bogucki Wydawnictwo Naukowe: Poznań, Poland, 1996; pp. 98–99. [Google Scholar]
  31. Holona, T. Rekultywacja Jeziora Głębokie (Lake Głębokie restoration). In Rekultywacja i Rewitalizacja Terenów Zdegradowanych (Restoration and Revitalization of Demoted Areas); Malina, G., Ed.; PZITS, Oddział Wielkopolski: Poznań, Poland, 2010; pp. 91–102. [Google Scholar]
  32. Nędzarek, A.; Tórz, A.; Kubiak, J. Oxygen conditions and trophic state of Lake Głębokie (Szczecin, Poland) in the years 2008–2010. Limnol. Rev. 2010, 10, 163–172. [Google Scholar] [CrossRef]
  33. WeatherOnline. Available online: https://www.weatheronline.pl (accessed on 29 January 2017).
  34. Osuch, E.; Podsiadłowski, S. Efficiency of pulverizing aeration on Lake Panieńskie. Limnol. Rev. 2012, 12, 139–145. [Google Scholar] [CrossRef]
  35. Podsiadłowski, S. Method of precise phosphorus inactivation in lake waters. Limnol. Rev. 2008, 8, 51–56. [Google Scholar]
  36. Holona, T.; Gołdyn, R. Rekultywacja Jeziora Głębokiego w Szczecinie w latach 2008–2011 [Restoration of Lake Głębokie in Szczecin in years 2008–2011]. Gaz Woda i Tech. Sanit. 2012, 2, 75–77. (In Polish) [Google Scholar]
  37. Dojlido, J.R.; Hermanowicz, W. Physico-chemical analysis of water and sewage; Arkady Publ.: Warsaw, Poland, 1999; p. 555. (In Polish) [Google Scholar]
  38. Wetzel, R.G.; Likens, G.E. Limnological Analyses; Springer-Verlag: New York, NY, USA, 1991; p. 391. [Google Scholar]
  39. Hammer, Ø. PAST. Paleontological Statistics. Reference manual. Natural History Museum. University of Oslo. 1999–2016. 2016. Available online: http://folk.uio.no/ohammer/past/past3manual.pdf (accessed on 12 January 2017).
  40. ter Braak, C.J.F.; Šmilauer, P. CANOCO Reference Manual and CanoDraw for Windows User’s Guide: Software for Canonical Community Ordination (Version 4.5); TNO Institute of Applied Computer Science: Wageningen, The Netherlands, 2002. [Google Scholar]
  41. Kowalczewska-Madura, K.; Gołdyn, R.; Dondajewska, R. Phosphorus release from the bottom sediments of Lake Rusałka (Poznań, Poland). Oceanol. Hydrobiol. Stud. 2010, 39, 135–144. [Google Scholar] [CrossRef]
  42. Søndergaard, M.; Jensen, J.P.; Jeppesen, E. Role of sediment and internal loading of phosphorus in shallow lakes. Hydrobiologia 2003, 506, 135–145. [Google Scholar] [CrossRef]
  43. Søndergaard, M.; Jensen, J.P.; Jeppesen, E. Retention and internal loading of phosphorus in shallow, eutrophic lakes. Sci. World J. 2001, 1, 427–442. [Google Scholar] [CrossRef] [PubMed]
  44. Boström, B.; Andersen, J.M.; Fleischer, S.; Jansson, M. Exchange of phosphorus across the sediments-water interface. Hydrobiologia 1988, 170, 229–244. [Google Scholar] [CrossRef]
  45. Verdonschot, P.F.M.; Spears, B.M.; Feld, C.K.; Brucet, S.; Keizer-Vlek, H.; Borja, A.; Elliott, M.; Kernan, M.; Johnson, R.K. A comparative review of recovery processes in rivers, lakes, estuarine and coastal waters. Hydrobiologia 2013, 704, 453–474. [Google Scholar] [CrossRef]
  46. Wierzchowska, E. Wyniki Monitoringu Badawczego Wód Jeziora Głębokie z Roku 2008; The results of investigative monitoring of waters of Lake Głębokie from the year 2008; Regional Inspectorate for Environmental Protection in Szczecin: Szczecin, Poland, 2009; WIOŚ-WM-0712/04/2009. (In Polish) [Google Scholar]
  47. Sobczyński, T.; Joniak, T.; Pronin, E. Assessment of the multi-directional experiment to restore Lake Góreckie (Western Poland) with particular focus on oxygen and light conditions: First results. Pol. J. Environ. Stud. 2012, 21, 1025–1031. [Google Scholar]
  48. Selmeczy, G.; Tapolczai, K.; Casper, P.; Krienitz, L.; Padisák, J. Spatial- and niche segregation of DCM-forming cyanobacteria in Lake Stechlin (Germany). Hydrobiologia 2015, 764, 229–240. [Google Scholar] [CrossRef]
  49. Dunalska, J.A.; Staehr, P.A.; Jaworska, B.; Górniak, D.; Gomułka, P. Ecosystem metabolism in a lake restored by hypolimnetic withdrawal. Ecol. Eng. 2014, 73, 616–623. [Google Scholar] [CrossRef]
  50. Jaworska, B.; Gawrońska, H.; Łopata, M. Changes in the phytoplankton community of a lake restored with phosphorus inactivation (Lake Głęboczek, northern Poland). Oceanol. Hydrobiol. Stud. 2009, 38, 93–101. [Google Scholar] [CrossRef]
  51. Kozak, A. Seasonal changes occurring over four years in a reservoir’s phytoplankton composition. Pol. J. Environ. Stud. 2005, 14, 451–465. [Google Scholar]
  52. Kozak, A.; Gołdyn, R. Zooplankton versus phyto- and bacterioplankton in the Maltański Reservoir (Poland) during an extensive biomanipulation experiment. J. Plankton Res. 2004, 26, 37–48. [Google Scholar] [CrossRef]
  53. Triest, L.; Stiers, I.; van Onsem, S. Biomanipulation as a nature-based solution to reduce cyanobacterial blooms. Aquat. Ecol. 2016, 50, 461–483. [Google Scholar] [CrossRef]
  54. Backer, L.C. Cyanobacterial harmful algal blooms: Developing a public health response. Lake Reserv. Manag. 2002, 18, 20–31. [Google Scholar] [CrossRef]
  55. Grabowska, M.; Mazur-Marzec, H. The effect of cyanobacterial blooms in the Siemianówka Dam Reservoir on the phytoplankton structure in the Narew River. Oceanol. Hydrobiol. Stud. 2011, 40, 19–26. [Google Scholar] [CrossRef]
  56. Liang, H.; Zhou, W.; Zhang, Y.; Qiao, Q.; Zhang, X. Are fish fed with cyanobacteria safe, nutritious and delicious? A laboratory study. Sci. Rep. 2015, 5, 15166. [Google Scholar] [CrossRef] [PubMed]
  57. Zagajewski, P.; Gołdynm, R.; Fabiśm, M. Cyanobacterial volume and microcystins concentration in recreational lakes (Poznań–Western Poland). Oceanol. Hydrobiol. Stud. 2009, 38, 113–120. [Google Scholar]
  58. Jurczak, T.; Tarczynska, M.; Izydorczyk, K.; Mankiewicz, J.; Zalewski, M.; Meriluoto, J. Elimination of microcystins by water treatment processes—Examples from Sulejow Reservoir, Poland. Water Res. 2005, 39, 2394–2406. [Google Scholar] [CrossRef] [PubMed]
  59. Kokociński, M.; Mankiewicz-Boczek, J.; Jurczak, T.; Spoof, L.; Meriluoto, J.; Rejmonczyk, E.; Hautala, H.; Vehniäinen, M.; Pawełczyk, J.; Soininen, J. Aphanizomenon gracile (Nostocales), a cylindrospermopsin-producing cyanobacterium in Polish lakes. Environ. Sci. Pollut. Res. 2013, 20, 5243–5264. [Google Scholar] [CrossRef] [PubMed]
  60. Reynolds, C.S.; Padisák, J.; Sommer, U. Intermediate disturbance in the ecology of phytoplankton and the maintenance of species diversity: A synthesis. Hydrobiologia 1993, 249, 183–188. [Google Scholar] [CrossRef]
  61. Kawecka, B.; Eloranta, P.V. Zarys Ekologii Glonów Wód Słodkich i Środowisk Lądowych (An Outline of Alga of Freshwater and Land Ecosystems); PWN: Warsaw, Poland, 1994. [Google Scholar]
  62. Kuczyńska-Kippen, N.; Joniak, T. Zooplankton diversity and macrophyte biometry in shallow water bodies of various trophic state. Hydrobiologia 2016, 774, 39–51. [Google Scholar] [CrossRef]
  63. Sakset, A.; Chankaew, W. Phytoplankton as a Bio-indicator of Water Quality in the Freshwater Fishing Area of Pak Phanang River Basin (Southern Thailand). Chiang Mai J. Sci. 2013, 40, 344–355. [Google Scholar]
  64. Yap, S.Y. Classifcation of a Malaysian river using biological indices: A preliminary attempt. Environmentalist 1997, 17, 79–86. [Google Scholar] [CrossRef]
  65. Ejsmont-Karabin, J.; Kuczyńska-Kippen, N. Urban rotifers: Structure and densities of rotifer communities in water bodies of the Pozna´n agglomeration area (western Poland). Hydrobiologia 2001, 153, 165–171. [Google Scholar] [CrossRef]
  66. Reynolds, C. The Ecology of Phytoplankton; Cambridge University Press: Cambridge, UK, 2006. [Google Scholar]
  67. Pajchrowska, M.; Szpakowska, B. Assessment of occurrence microphytes and trophic status of a small water body in the Wielkopolska Region (Western Poland). Pol. J. Natur. Sc. 2014, 29, 17–33. [Google Scholar]
  68. Padisák, J.; Reynolds, C.S. Selection of phytoplankton associations in Lake Balaton, Hungary, in response to eutrophication and restoration measures, with special reference to the cyanoprokaryotes. Hydrobiologia 1998, 384, 41–53. [Google Scholar] [CrossRef]
  69. Rosińska, J.; Kozak, A.; Dondajewska, R.; Gołdyn, R. Cyanobacteria blooms before and during the restoration process of a shallow urban lake. J. Environ. Manag. 2017, 198, 340–347. [Google Scholar] [CrossRef] [PubMed]
  70. Dokulil, M.T.; Treubner, K. Cyanobacterial doninance in lakes. Hydrobiologia 2000, 438, 1–12. [Google Scholar] [CrossRef]
  71. Shapiro, J. Current beliefs regarding dominance blue greens: The case for the importance of CO2 and pH. Verhandlungen des Internationalen Ver. Limnologie 1990, 24, 38–54. [Google Scholar]
  72. Reynolds, C.S. What factors influence the species composition of phytoplankton in lakes of different trophic status? Hydrobiologia 1998, 369, 11–26. [Google Scholar] [CrossRef]
  73. Gerasimova, T.N.; Pogozhev, P.I. The role of zooplankton in phytoplankton biomass decline and water transparency regulation in a water body subject to high organic and mineral load. Water Res. 2010, 37, 796–806. [Google Scholar] [CrossRef]
  74. Peretyatko, A.; Teissier, S.; De Backer, S.; Triest, L. Biomanipulation of hypereutrophic ponds: When it works and why it fails. Environ. Monit. Assess. 2012, 184, 1517–1531. [Google Scholar] [CrossRef] [PubMed]
  75. Sikora, A.; Dawidowicz, P. Do the presence of filamentous cyanobacteria and an elevated temperature favor small-bodied Daphnia in interspecific competitive interactions? Fundam. Appl. Limnol. 2014, 185, 307–314. [Google Scholar] [CrossRef]
  76. Skov, C.; Koed, A. Habitat use of 0+ year pike in experimental ponds in relation to cannibalism, zooplankton, water transparency and habitat complexity. J. Fish Biol. 2004, 64, 448–459. [Google Scholar] [CrossRef]
  77. Skov, C.; Lousdal, O.P.; Johansen, H.; Berg, S. Piscivory of 0+ pike (Esox lucius L.) in a small eutrophic lake and its implication for biomanipulation. Hydrobiologia 2003, 506, 481–487. [Google Scholar] [CrossRef]
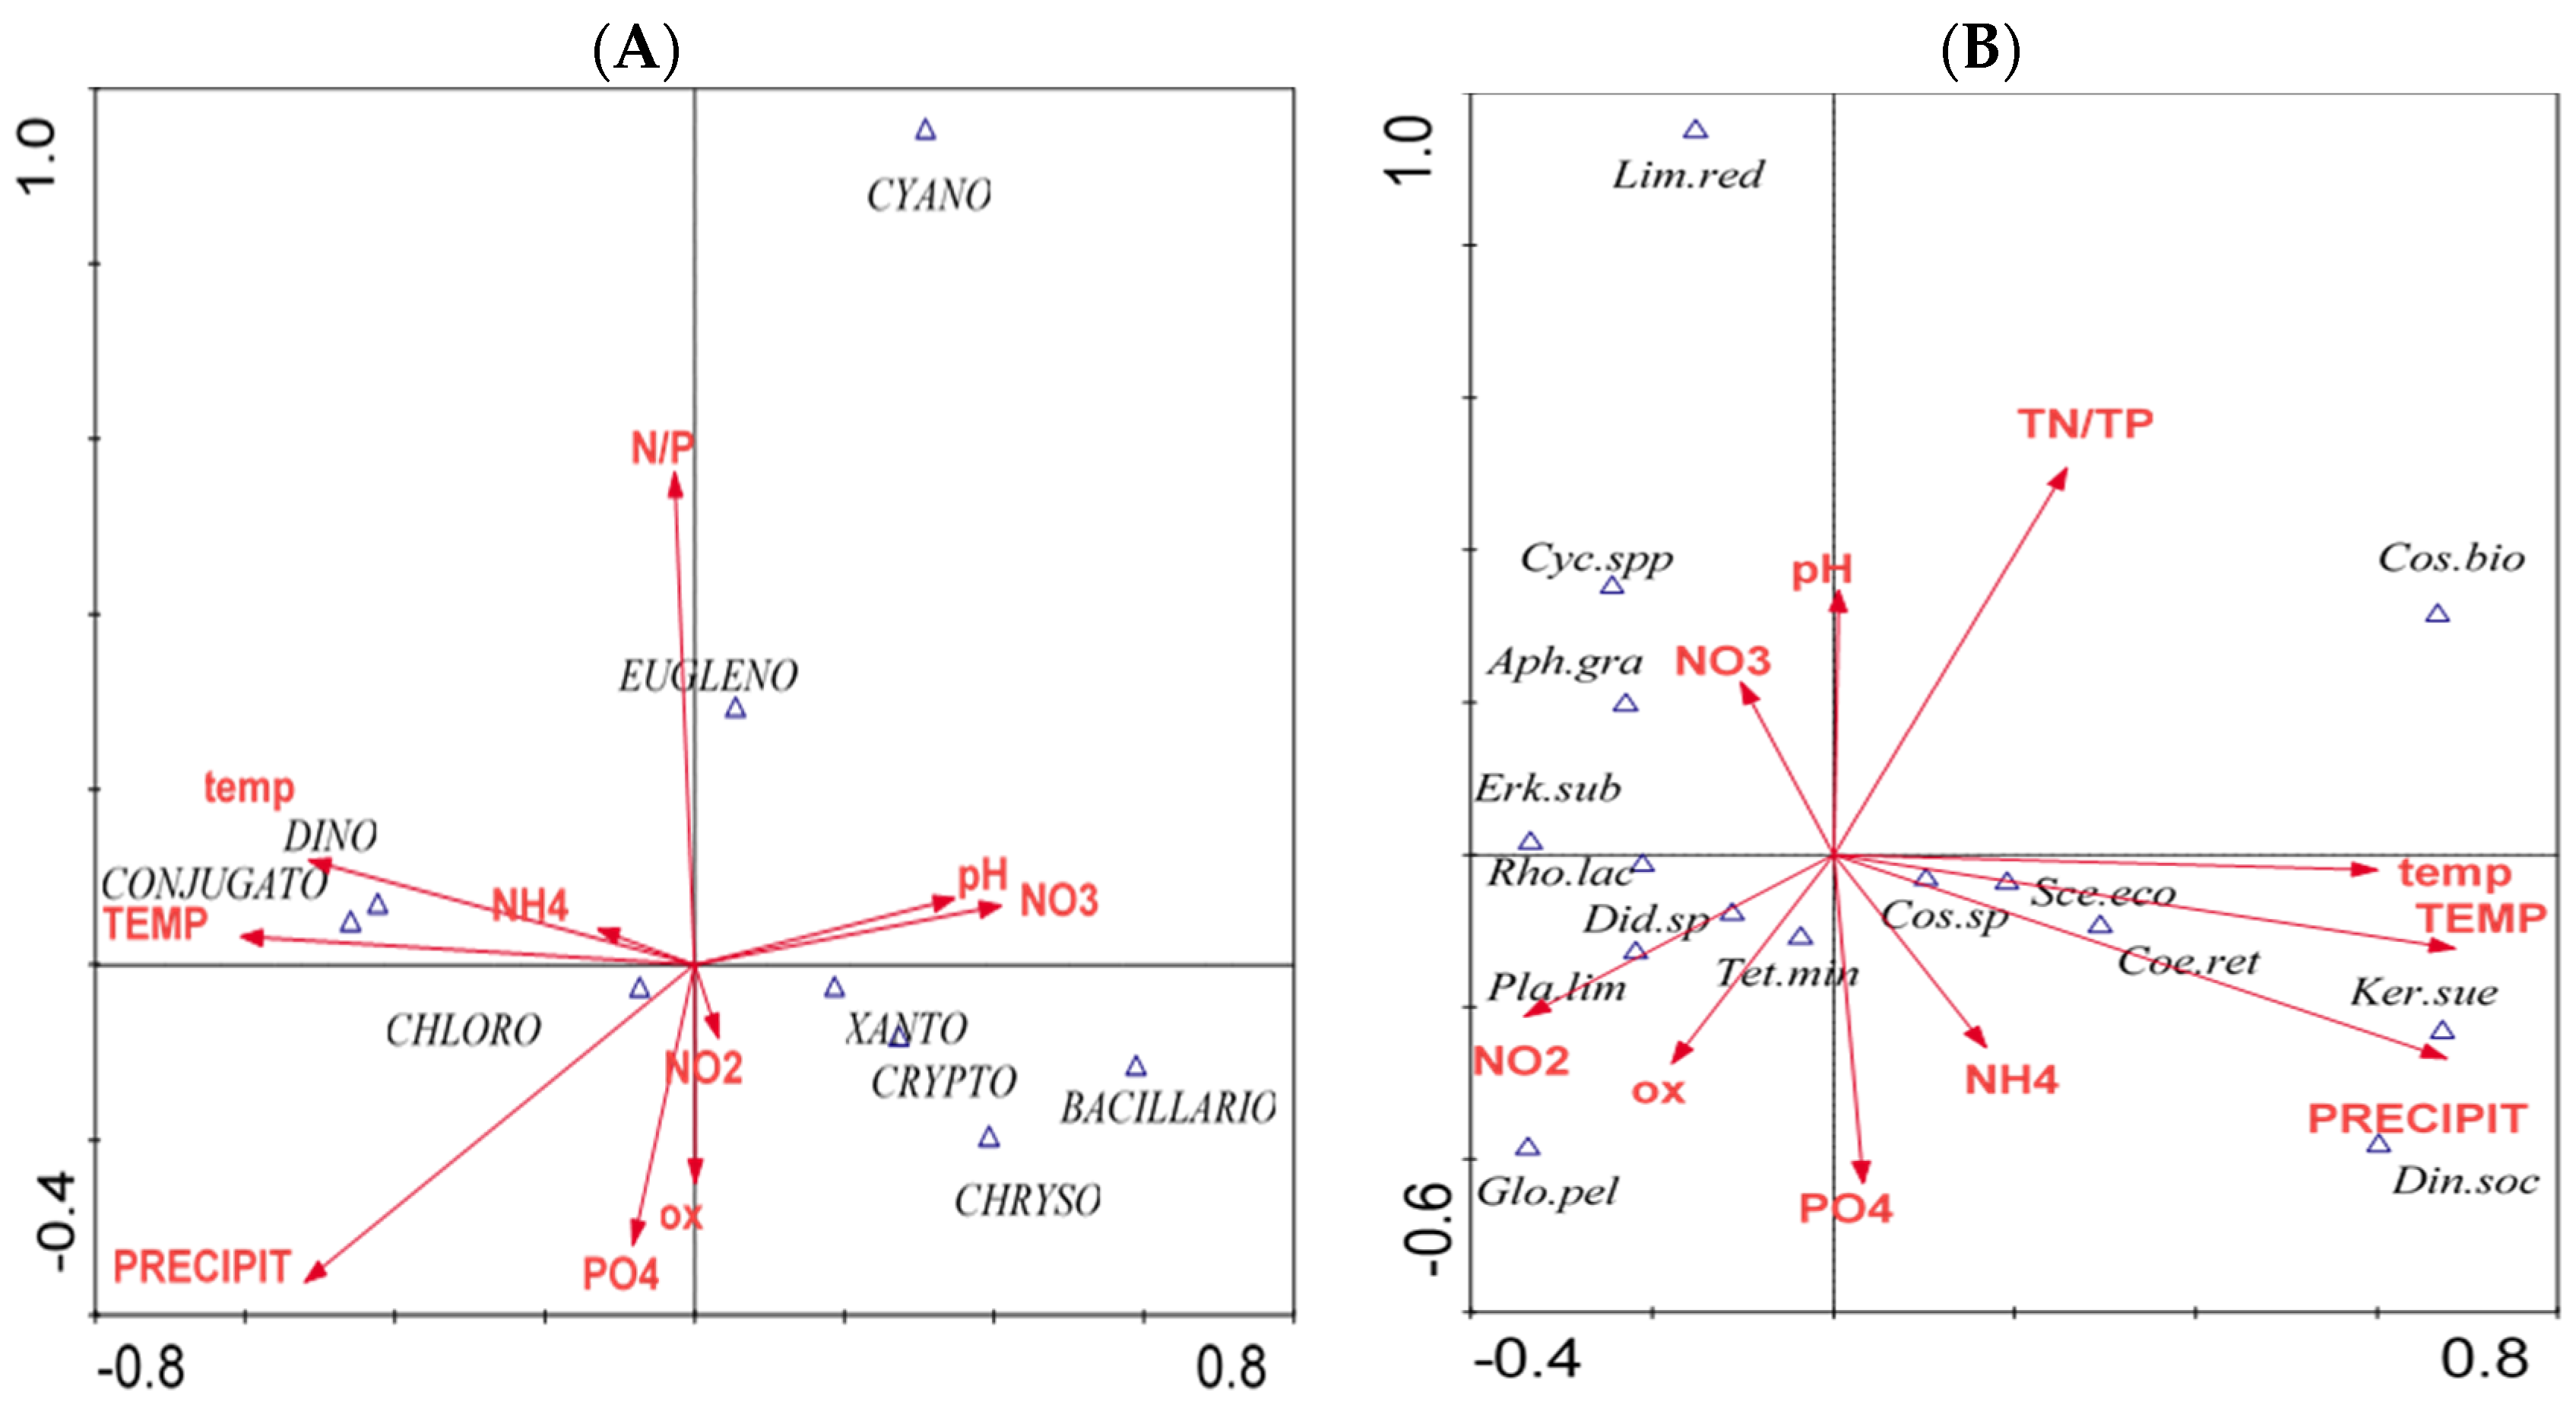
Figure 1. The location of sampling stations at Lake Głębokie in Szczecin (city is marked in the map of Poland).
Water 09 00713 g001
Figure 2. Monthly values of mean air temperature and sum of precipitation (according to [33]).
Water 09 00713 g002
Figure 3. Changes of water temperature and oxygen concentration in vertical profile (1–5 m) of Głębokie Lake.
Water 09 00713 g003
Figure 4. Concentration of ammonium, nitrite, nitrate nitrogen and orthophosphates in vertical profile at station A.
Water 09 00713 g004
Figure 5. Mean concentration, standard deviation and max-min values of analyzed water quality variables: (A) ammonium nitrogen; (B) total nitrogen; (C) orthophosphates; (D) total phosphorus; (E) chlorophyll-a; (F) total suspended solids.
Water 09 00713 g005
Figure 6. Number of identified taxa in Głębokie Lake.
Water 09 00713 g006
Figure 7. The diversity index of the phytoplankton in the studied period.
Water 09 00713 g007
Figure 8. Mean values of phytoplankton abundance, standard deviation and min-max at both stations.
Water 09 00713 g008
Figure 9. Contribution of taxonomical groups in the phytoplankton abundance, an example from the depth of 1 m at station A.
Water 09 00713 g009
Figure 10. Canonical Correspondence Analysis (CCA) diagrams showing the relationships between: (A) environmental variables and abundance of phytoplankton groups; (B) environmental variables and phytoplankton dominating taxa. Abbreviations: Aph.graAphanizomenon gracile; Coel.retCoelastrum reticulatum; Cos.bioCosmarium bioculatum; Cos.sp—Cosmarium sp.; Cyc.spp—Cyclotella sp.; Did.sp.—Didymocystis sp.; Din.socDinobryon sociale; Erk.subErkenia subaequiciliata; Glo.pelGloeotila pelagica; Ker.sueKeratococcus suecicus; Lim.redLimnothrix redekei; Plb.limPlanktolyngbya limnetica; Rho.lacRhodomonas lacustris; Sce.ecoScenedesmus ecornis; Tet.minTetraëdron minimum.
Water 09 00713 g010
Table 1. Results of the Monte Carlo permutation test.
VariableRelationships between Environmental Variables and Abundance of Phytoplankton GroupsRelationships between Environmental Variables and Phytoplankton Dominating Taxa
p-valueF-ratiop-valueF-ratio
Precipitation0.00213.420.0023.43
Air temperature0.0029.090.0023.97
Water temperature0.0045.270.0302.05
Dissolved oxygen0.0044.970.3961.06
N:P (mineral forms) ratio0.0029.580.0063.09
NH4-N0.2301.340.0042.72
NO2-N0.0044.380.1961.42
NO3-N0.00216.010.0022.97
pH0.0044.500.0382.06
PO4-P0.2041.320.0941.75

