Bedload and Suspended Load Transport in the 140-km Reach Downstream of the Mississippi River Avulsion to the Atchafalaya River


School of Renewable Natural Resources, Louisiana State University Agricultural Center, 227 Highland Road, Baton Rouge, LA 70803, USA
*
Author to whom correspondence should be addressed.
Water 2017, 9(9), 716; https://doi.org/10.3390/w9090716
Submission received: 14 August 2017
/
Revised: 10 September 2017
/
Accepted: 15 September 2017
/
Published: 18 September 2017
(This article belongs to the Special Issue Recent Progress in Research on River Deltas)
Abstract
:The Mississippi River Delta has been continuously losing land since the 1930s due to several factors, chief of which is the reduced sediment supply. A few recent studies have estimated individual components of short-term sediment transport, i.e., bedload and suspended load, separately for some locations along the Lowermost Mississippi River (LmMR, commonly considered as the last 500-km reach of the Mississippi River before entering the Gulf of Mexico). However, the combined effects of both components on the long-term sediment supply along the river reach are still unclear. One of the major obstacles here hindering our understanding is that it is difficult and impractical to accurately measure bedloads in large alluvial rivers, such as the Mississippi. In this study, we estimated bedloads of three medium grain sizes (D50 = 0.125, 0.25 and 0.5 mm) for three locations along the uppermost 140-km reach of the LmMR: Tarbert Landing (TBL) at river kilometer (rk) 493, St Francisville (St F) at rk 419, and Baton Rouge (BTR) at rk 367.5 during 2004–2015. We also estimated suspended loads at St F during 1978–2015 and at BTR during 2004–2015 in order to discern the interactive relationship between bedloads and suspended loads. We found gradually increasing bedloads for all the three medium grain sizes from TBL (83, 41.5 and 20.75 million tons (MT), respectively) to BTR (96, 48 and 24 MT). We also found that suspended loads at TBL (reported previously) were significantly higher than those at St F and BTR during corresponding overlapping periods. Bedloads increased almost linearly with suspended loads, river discharge and river stage at the upstream locations (TBL and St F); however, such a relationship was not evident downstream at BTR. The total sediment load (bedload + suspended sediment load) was substantially higher at TBL (931 MT), while lower and nearly equal at other two downstream locations (550 MT at St F and 544 MT at BTR) during 2004–2010 (the matching period of availability of both loads). These findings indicate that the uppermost 20–25 km LmMR reach (covering TBL) has potentially entrapped substantial suspended load over the last three to four decades, while bedload transport prevails in the lower reach (covering St F and BTR). We suggest that future sediment management in the river should seek engineering solutions for moving trapped coarse sediments downstream towards the coast for the Mississippi River Delta restoration.
1. Introduction
Studies have found that sediment supply from many rivers in the world to the oceans has decreased substantially in the past several decades [1,2,3]. The reduction estimates are mostly reported in suspended sediment load; for instance, Meade and Parker [4] reported 3.5 times decline in suspended sediment load of the Colorado River from the 1930s to the 2000s; Yang et al. [5] reported 100 megatons (MT)/year decline in sediment load of the Yangtze River from the 1950s to the 1990s; and Meade and Moody [6] noted a 3.5 times decrease in sediment load of the Mississippi River from the early to the late 20th century. These studies have improved our understanding of the trend of riverine suspended sediment loads to the world’s coasts; however, our knowledge of bed sediment transport in these rivers is very limited. One of the major obstacles hindering our understanding is that it is difficult and impractical to accurately measure bed sediment transport, especially in large alluvial rivers. However, such knowledge is important and can greatly aid in assessing riverine sediment transport, channel morphodynamics and long-term future of the river deltas.
Bed sediment loads can vary largely from 1% to 33% of the suspended loads in alluvial rivers, depending on sediment particle size [7,8,9]. Direct measurements of bed sediment transport are difficult and scarce in most alluvial rivers globally [7,10]. Bed sediments are generally intermixed with sand particles (coarser sediment particles >0.063 mm in diameter) of different sizes [7]. Coarser sediments varying from 0.063 to 1.2 mm in sizes are difficult to be distinguished as true bedloads or suspended loads because sometimes they move by traction (rolling, sliding) and/or saltation and sometime they move by suspension [7,11]. Leopold and Emmett [12] emphasized the problem of intractability between bedloads and suspended loads because they did not find any sampling device that provided reliable bedload measurements moving along the riverbed. Therefore, bedloads are generally reported in terms of their transport rates which can be defined as the mass of bed sediment moving across a wetted riverbed for a given discharge regime in unit time [13]. Bedload transport rates, suspended sediment loads, and suspended sand loads have mostly been studied separately. Their combined effect on the total sediment supply in rivers, however, still needs to be investigated. Such an analysis can provide relevant information for river engineering and sediment management.
The total sediment supply constitutes of both bedload and suspended load and contributes substantially to spatiotemporal changes in channel adjustment and morphology in alluvial rivers [14,15,16]. However, many previous studies on sediment supply have either ignored bedload [17,18,19] or applied it as a fixed fraction of the sediment load [20,21,22]. In all latter studies, bedload was given a fixed percentage based on tables proposed by Maddock and Borland [23] and further expanded by Lane and Borland [24]. Both Maddock and Borland [23] and Lane and Borland [24] put the tables as best estimates of bedload percentage in different river systems. However, their estimates could possibly be subjected to considerable errors as they did not measure and/or quantify either the suspended loads or bedloads in any of the river types. In addition to these limitations in suspended load and bedload partitioning, interactive relationship between the two components also remains poorly understood. Quantifying bedload transport and investigating the relationship between bedload and suspended load can be especially beneficial for sediment management along regulated alluvial rivers with reduced sediment supply.
The final 500 km stretch of the Mississippi River from its diversion to the Atchafalaya River at the Old River Control Structure to the Gulf of Mexico in the southern USA is a renowned example of alluvial rivers with reduced sediment supply over time. The reduced sediment supply has contributed to land loss in the Mississippi River Delta Plain (MRDP) over the last several decades [25,26,27]. Meade and Moody [6] concluded that mean annual sediment load for the Lowermost Mississippi River (LmMR) at its uppermost location, Tarbert Landing (TBL) [at 493 river kilometers (rk) above the river’s Gulf outlet] reduced by about 3.5 times [from ~400 million tons (MT)/year to 115 MT/year] from pre- to post-human interference period (early to late 20th century). Rosen and Xu [28] estimated annual sediment loads at Tarbert Landing for 1980–2010 and noticed a 12 MT/year decline in the loads from 1993. Horowitz [29] estimated annual sediment loads at Tarbert Landing and the next downstream location of the LmMR, St Francisville (St F) at rk 419 (about 71 rk downstream of Tarbert Landing) for 1980–2007. The study reported that the mean annual sediment load at Tarbert Landing and at St Francisville declined by 21 and 41 MT, respectively after 1993. Long-term trends for suspended sand load have also been reported previously [30,31], but only at Tarbert Landing. The critical role of suspended sand loads in building new lands for the MRDP has been previously recognized [32,33,34]. Thus, quantification of sand loads at locations downstream from Tarbert Landing can help in clarifying their potential sand storage and delta building capacity.
Recently, Wang and Xu [35] assessed channel bars and Joshi and Xu [36] assessed river stages and cross-sections along the uppermost 10 and 140 km reaches of the LmMR below its diversion to the Atchafalaya River (near the Old River Control Structure, or ORCS), respectively. Both studies found that the reaches had potentially trapped substantial amount of sediments over the last three decades. They argued about a need for quantifying long term bed and suspended loads at the locations in which riverbed adjustment was found, i.e., Tarbert Landing, Bayou Sara (BS) (at rk 427) (about 8 rk upstream of St Francisville) and Baton Rouge (BTR) (at rk 367.5). The United States Geological Survey (USGS) data for suspended sediment concentrations upon which sediment and sand load calculations are based can be found for at least four decades (1973–2015) at Tarbert Landing and one decade (2004–2015) at Baton Rouge, but no such data is available for Bayou Sara. Nearest long term data (1978–2015) which can analogue sediment loads at Bayou Sara are available at St Francisville, about 8 rk upstream from Bayou Sara.
Majority of the long term suspended sediment and sand load budgets for the LmMR have only been carried out at Tarbert Landing. There are limited and discontinuous studies of flow and sediment transport between Tarbert Landing and Baton Rouge. Allison and Meselhe [37] and Horowitz [29] analyzed sediment budgets at St Francisville during 1981–2004 and 1981–2007, respectively. Further, studies quantifying suspended loads for the other locations downstream from St. Francisville are scarce and are limited to very short periods (three years in maximum). For example, Allison et al. [38] carried out a short-term suspended load budget investigation at four sites covering approximately 372 km of the LmMR reach during 2008–2010. With respect to bedload, Nittrouer et al. [11] estimated bedform transport rates in the LmMR but only for its lowermost reach between rk 167 (near New Orleans) and 0 (near the river’s gulf outlet). In addition, Nittrouer et al. [11] did not consider water discharge, river velocity and sediment transport equations in their analysis. Pereira et al. [39] applied a 1-dimensional mobile-bed model (HECRAS 4.0) along the LmMR reach from Tarbert Landing to Venice (about 17 km above the river’s gulf outlet). However, their study compared between several bedload equations only and did not quantify bedload trends for any period. Nittrouer et al. [40] estimated the bedload transport rates along the LmMR reach, however, their analysis only considered backwater flow velocities with no consideration of size of bed sediments. Recently, Knox and Latrubesse [41] quantified bedload at Tarbert Landing for 2003–2011. To our best knowledge, no study exists on quantifying multi-decadal suspended loads synchronously at multiple locations along the uppermost 140 km of the LmMR. Similarly, comprehensive analysis of decadal trends in bedloads based on cross-sectional area, river discharge and stage, river velocity, and grain size are also unavailable along the uppermost LmMR.
Hence, this study aims to assess sediment transport by quantifying bedload and suspended load along the first 140 km of the Lowermost Mississippi River below its diversion at the Old River Control Structure to the Atchafalaya River. The assessment can help in comparing spatiotemporal trends between bedloads and suspended loads, understanding their interactive relation, and allocating sites with maximum sediment trapping capacity, which can have relevant implications for the ongoing sediment diversion projects (both executed and planned) [42,43] and deltaic land restoration efforts. The specific objectives of this study include: (1) quantifying bedload transport at three locations of the uppermost 140 km reach of the LmMR (including Tarbert Landing); (2) analyzing long term daily, seasonal and annual suspended sediment and sand loads at two locations downstream of Tarbert Landing; (3) assessing suspended load transport from Tarbert Landing to Baton Rouge; and (4) investigating the relationship between bedload and suspended load along the studied river reach.
2. Methods
2.1. Study Site
This study focused on three locations covering the first 140 km of the LmMR: Tarbert Landing, St Francisville and Baton Rouge (Figure 1). The first location is approximately 10–15 km downstream of the river’s diversion to the Atchafalaya River. The diversion is facilitated by an engineering complex, the Old River Control Structure (ORCS), which was constructed in 1963 for preventing the Atchafalaya River (AR) from capturing the bulk of Mississippi River water (>30%). Post-ORCS construction, about 25% of the Mississippi River water is diverted into the Atchafalaya River artificially under normal flow conditions.
The three locations consist of monitoring stations jointly managed by the United States Geological Survey (USGS) and United States Army Corps of Engineers (USACE). The duration and availability of daily discharge, daily river stage and sediment records useful for this study vary according to the locations specifically (see Section 2.2 and Section 2.3). Since long-term sediment and sand-load analyses have been carried about at Tarbert Landing previously, this site was used only for bedload estimation. However, sediment load, sand load and bedload were analyzed at St Francisville and Baton Rouge.
2.2. River Stage, Discharge and Bathymetric Data
Daily River Stage records (RSd in m) for Tarbert Landing were collected from the USACE gauge station at Red River Landing (about 4 rk downstream from Tarbert Landing) during 1973–2015, while RSds for St Francisville were collected at Bayou Sara (about 8 rk upstream of St Francisville) during 1978–2015. In addition, RSds were also collected at Baton Rouge during 2004–2015 from USACE. Similarly, daily discharge records (Qd in cms) were collected from 1 January 1978 to 31 December 2015 and 1 January 2004 to 31 December 2015 at Tarbert Landing (from USACE) and Baton Rouge (from USGS) respectively. Both USACE and USGS did not have daily discharge records for St Francisville. However, the Qds at Tarbert Landing were used for daily sediment and sand load estimations at St Francisville because the river discharge is approximately same for corresponding river stages at Tarbert Landing and St Francisville [36]. River discharge measurements were used for suspended load analysis specifically and both river stage and discharge measurements were used for bedload analysis.
For this study, bathymetric data were collected at Tarbert Landing, St Franciville and Baton Rouge during 2004 and 2013 from USACE. USACE conducted hydrographic surveys along the LmMR reach from Black Hawk, Louisiana (rk 521.4, just above the ORCS) to the river’s Gulf Outlet at Head of Passes (rk 0) in 1992, 2004 and 2013. The surveys consist of river channel cross-sections (CS) at 400 m intervals collected using single beam fathometer and multibeam side scan sonar. Each CS runs across the river (perpendicular to the river flow) at a given point and includes river bank and river bed elevation at given widths. The annual bed elevation was deduced from the bathymetric measurements of three cross-sections, which were further used to quantify bed load transport rates at the sites.
2.3. Sediment and Sand Concentration Data
Records on suspended sediment concentration (SSC) (mg/L) and percentage of silt clay fractions in SSC (particles with diameter <0.0625 mm) were collected from USGS at St Francisville (during 1978–2015) and Baton Rouge (during 2004–2015). USGS uses depth-integrated suspended sampling measures with the help of several isokinetic point samplers for collecting SSC records in the sites. A total of 437 SSC samples were collected at St Francisville, while 149 SSC samples were collected at Baton Rouge during their corresponding sampling periods, respectively. The sampling records are assumed to be sufficient and unbiased across all years, seasons and flow regimes because USGS had carried out 1 to 3 sediment measurements for each month during sampling periods at the corresponding sites. More details about SSC collection, processing techniques, error adjustments and reliability of the records can be found in several reports published by USGS [44,45,46].
2.4. Bedload Transport Estimation
In this study, we used the Engelund-Hansen [47] sediment transport equation to estimate daily bedload transport rates at Tarbert Landing, St Francisville and Baton Rouge of the uppermost 140 km of the LmMR reach during 2004–2015. This equation ignores the use of critical shear stress and has been reported by other studies (e.g., [48,49,50]) to be more accurate than other sediment transport equations. Engelund-Hansen used the stream power concept [51] and the similarity principle to develop the following relationship between friction factor (f), dimensionless bedload discharge (Φ) and dimensionless bed shear stress (θ) for alluvial channels (as noted in its simplest and most direct form by Stevens and Yang [52]):
The components f, ɸ, and ϴ in Equation (2) can be given by the following formulae:
where g is the acceleration due to gravity (9.81 m/s2); S is the slope of the channel; d is the channel depth in meters; V is the water velocity along the channel in m/s; qs is the bedload transport rate in kilogram/sec per meter of width (kg/sec-m); Υs is the specific weight of the sediment (2650 kg/m3); D50 is the grain size (i.e., average diameter for corresponding sediment particles in meter); and Sg is the specific gravity of sediment (2.68).
Furthermore, the bedload transport rate can be calculated by substituting for f, ɸ, ϴ, and Υs in Equation (1) as follows:
Finally, the daily bedload transport rate (in tons/day) at the three locations along the LmMR was calculated by:
where 95.24 is a unit conversion factor for converting bedload in kg/s-m to tons/day-m and RW is the daily river width at the location.
Qs = 95.24 × RW × qs
The methods for estimating channel depth, slope, flow velocity, river width, and grain-size in Equations (5) and (6) are explained in the following Section 2.4.1, Section 2.4.2, Section 2.4.3, Section 2.4.4 and Section 2.4.5.
2.4.1. River Depth (d)
The daily river depth at Tarbert Landing, St Francisville and Baton Rouge during 2004–2015 was obtained by subtracting the average annual riverbed elevation (REbed) at a given location from the daily river stage in the location. The average annual REbed at each location was obtained from USACE bathymetric measurements for the years 2004 and 2013 (see Section 2.2). At all locations, riverbed elevations were further interpolated for each year during 2005–2012 and during 2014–2015 considering the following two criteria:
- (a)
- If REbed in 2004 <REbed in 2013, REbed was increasing.
- (b)
- If REbed in 2004 >REbed in 2013, REbed was decreasing.
Finally, the rate of increase (ROI) in REbed was added consecutively from 2004 to 2015 in increasing riverbeds (i.e., REbed in 2005 = REbed in 2004 + ROI, REbed in 2006 = REbed in 2005 + ROI and so on), while the rate of decrease (ROD) in REbed was subtracted consecutively in decreasing riverbeds (i.e., REbed in 2005 = REbed in 2004 − ROD, REbed in 2006 = REbed in 2005 − ROD and so on).
2.4.2. Riverbed Slope (S)
Riverbed slope between two consecutive cross-sections at a given location is the difference between riverbed elevations of both cross-sections (higher–lower) divided by the distance between the cross-sections (400 m—see Section 2.2). For this study, riverbed slopes were calculated annually for each location during 2004–2015.
2.4.3. Average Flow Velocity (V)
The velocity of water discharge (in m/s) at Tarbert Landing, St Francisville and Baton Rouge for each day during the period 2004–2015 was calculated as:
where Qd is the daily water discharge in cms and A is the daily cross-sectional area of the river channel at each location in m2. The daily cross-sectional area at each location during the period was further calculated as the product of daily river depth (d in meter—see Section 2.4.1) and daily river width (RW in meter—see Section 2.4.4 below).
2.4.4. River Width (RW)
River width measurements are not available for any of the three sites along the LmMR. Therefore, to estimate the daily river width, Landsat 7 Satellite images with geographic references (in .tiff format) were first collected during 2004–2015 using the USGS Earth Explorer tool (Figure 2). USGS Earth Explorer had 2–4 images for each month during 2004–2015, such that each image was captured on separate days. For this study, 55 images of LmMR at Tarbert Landing, 37 images at St Francisville and 42 images at Baton Rouge were collected during 2004–2015. The images were collected for days representing the lowest to highest river stages at Tarbert Landing, St Francisville and Baton Rouge along the LmMR. All images were opened in ArcMap 10.2 and the corresponding river widths at all locations were measured using the ‘Measure’ tool. Now, a linear-trend line was fitted between the river widths (dependent: y) and their corresponding river stages (independent: x) at each location. Thus obtained were trend-line equations at Tarbert Landing, St Francisville and Baton Rouge (Table 1). These equations gave robust R2 values (more than 0.8) and considerably less root mean square errors (RMSE) between measured and predicted river widths at all locations (Table 1); therefore, we did not consider using other trend-line functions (such as polynomial, power, exponential and/or moving average). The equations were further used to estimate daily river widths at these locations during 2004–2015 respectively.
2.4.5. Representative Grain Sizes
The representative grain sizes (D50) for each site for the calculation of bedload transport rates were deduced from the information table (Table 1) provided by Nordin and Queen [53]. According to their data, 1.7% coarser sediments (>0.063 mm) in the LmMR were between 0.063 and 0.125 mm in size, 96.2% coarser sediments were between 0.125 and 0.25 mm, and 99.9% of the coarser sediments were between 0.25 and 0.5 mm. Therefore in this study, we used three sediment sizes of 0.125, 0.25 and 0.5 mm for all study sites to represent 99.9% of the bedload sediments in the river reach.
2.5. Development of Discharge-Sediment and Discharge-Sand Rating Curves
We followed the procedure used by Joshi and Xu [31] to develop discharge-sediment and discharge-sand rating curves at St Francisville and Baton Rouge, respectively. Daily sediment load (DSL in tonnes/day) was computed by multiplying SSC with the corresponding Qd for all the sampling dates at both sites as:
where 0.0864 is a unit conversion factor for converting the sand mass to tons per day.
DSL = Qd × SSC × 0.0864
Similarly, sand concentration (SSCs in mg/L) was calculated by subtracting silt/clay concentration [SSCf (mg/L) = % silt/clay × SSC] from SSC. Then SSC in Equation (8) was replaced by SSCs for calculating daily sand loads (DSLs in tonnes/day) for all sampling dates at both sites.
The dependent variables, DSL or DSLs (y) and the independent variable, Qd (x) were transformed to their natural logarithm (ln), and the relationship between them was evaluated by subjecting them to various linear and polynomial rating curves. Then, the “log transformed (ln) Qds” were fitted in the rating curve equations to get “predicted ln DSL and DSLs”. Then, the “predicted ln DSL and DSLs” were transformed back (by taking their exponential values) to attain the “predicted DSL and DSLs”. Correction factor (CF) given by Gray et al. [54] as a modification of Duan [55] was applied to check the potential log-biasing in the retransformation procedure. Finally, all rating curves were evaluated according to the following four criteria: regression coefficient of the curves (R2 ≥ 0.8), root mean square errors of the predicted DSL and DSLs (RMSE) (the lower the better), standard error (SE) of the curves (in ln units) (also, the lower the better) and a graphical assessment (good visual agreement between corresponding calibrated and predicted DSLs and DSLss respectively) [31,56,57].
At first, single linear and polynomial sediment and sand rating curves were applied for the corresponding whole periods at both stations (i.e., 1978–2015 at St Francisville and 2004–2015 at Baton Rouge). At St Francisville, the four evaluation criteria did not meet for single sediment and sand rating curves: low R2 (0.7 and 0.75 for linear and polynomial sediment rating curves; 0.74 and 0.78 for linear and polynomial sand rating curves) (Table 2 and Table 3); comparatively higher RMSE (186,620 and 174,238 for linear and polynomial sediment rating curves; 66,486 and 59,781 for linear and polynomial sediment rating curves) and SE (0.805 for sediment and 0.496 for sand rating curves) (Table 4 and Table 5); and a poor visual agreement between corresponding measured and predicted DSLs and DSLss (Figure 3 and Figure 5). Therefore, approximately decadal linear and polynomial rating curves were further applied at this station because decadal intervals have been previously reported to minimize both intra- and inter-annual variability in sediment samples [30,31]. At Baton Rouge, interestingly, single polynomial rating curves met all four evaluation criteria (Table 2, Table 3, Table 4 and Table 5, Figure 3 and Figure 5).
Finally, all the evaluation criteria were met at St Francisville using polynomial sediment rating curves during the periods: 1978–1987, 1988–1997, 1998–2007 and 2008–2015, and polynomial sand rating curves during the periods: 1978–1987, 1988–1996, 1998–2007, 2008–2015. They gave the predicted DSLs and DSLss most approximate to their corresponding calibrated measurements from USGS (Table 4 and Table 5, Figure 4 and Figure 6). We also found that the use of a correction factor improved the RMSEs and decreased differences between predicted and calibrated DSLs, while overestimated DSLss (Table 4 and Table 5). Hence, we used correction factors for sediment rating curves only at this station. The year 1997 had a very low R2 for sand rating curves (Lin: 0.58 and Poly: 0.61) which was reducing R2s and increasing RMSEs and SEs when combined with its preceding or succeeding decade (i.e., 1988–1996 and 1998–2007). Therefore, DSLs for 1997 at St Francisville was calculated using a non-rating curve approach (described in the following Section 2.6). Similarly, at Baton Rouge a single polynomial rating curve with no correction factor gave the best approximation between predicted and calibrated DSLs and DSLss, respectively (Table 4 and Table 5, Figure 3 and Figure 5).
Figure 3.
Comparison of sediment loads calculated from SSC records measured, processed, and calibrated by USGS (Measured SL) with those predicted from single sediment rating curves [either linear (Lin) or polynomial (poly)] (Predicted SL) at St Francisville during 1978–2015 (a–d) and Baton Rouge along the Lowermost Mississippi River during 2004–2015 (e–h). It is to note that Duan correction factors were applied for the curves denoted by “CF” in the figure (b, d, f, h), while the remaining curves denoted by “No CF” in the figure were analyzed without correction factors (a, c, e, g).
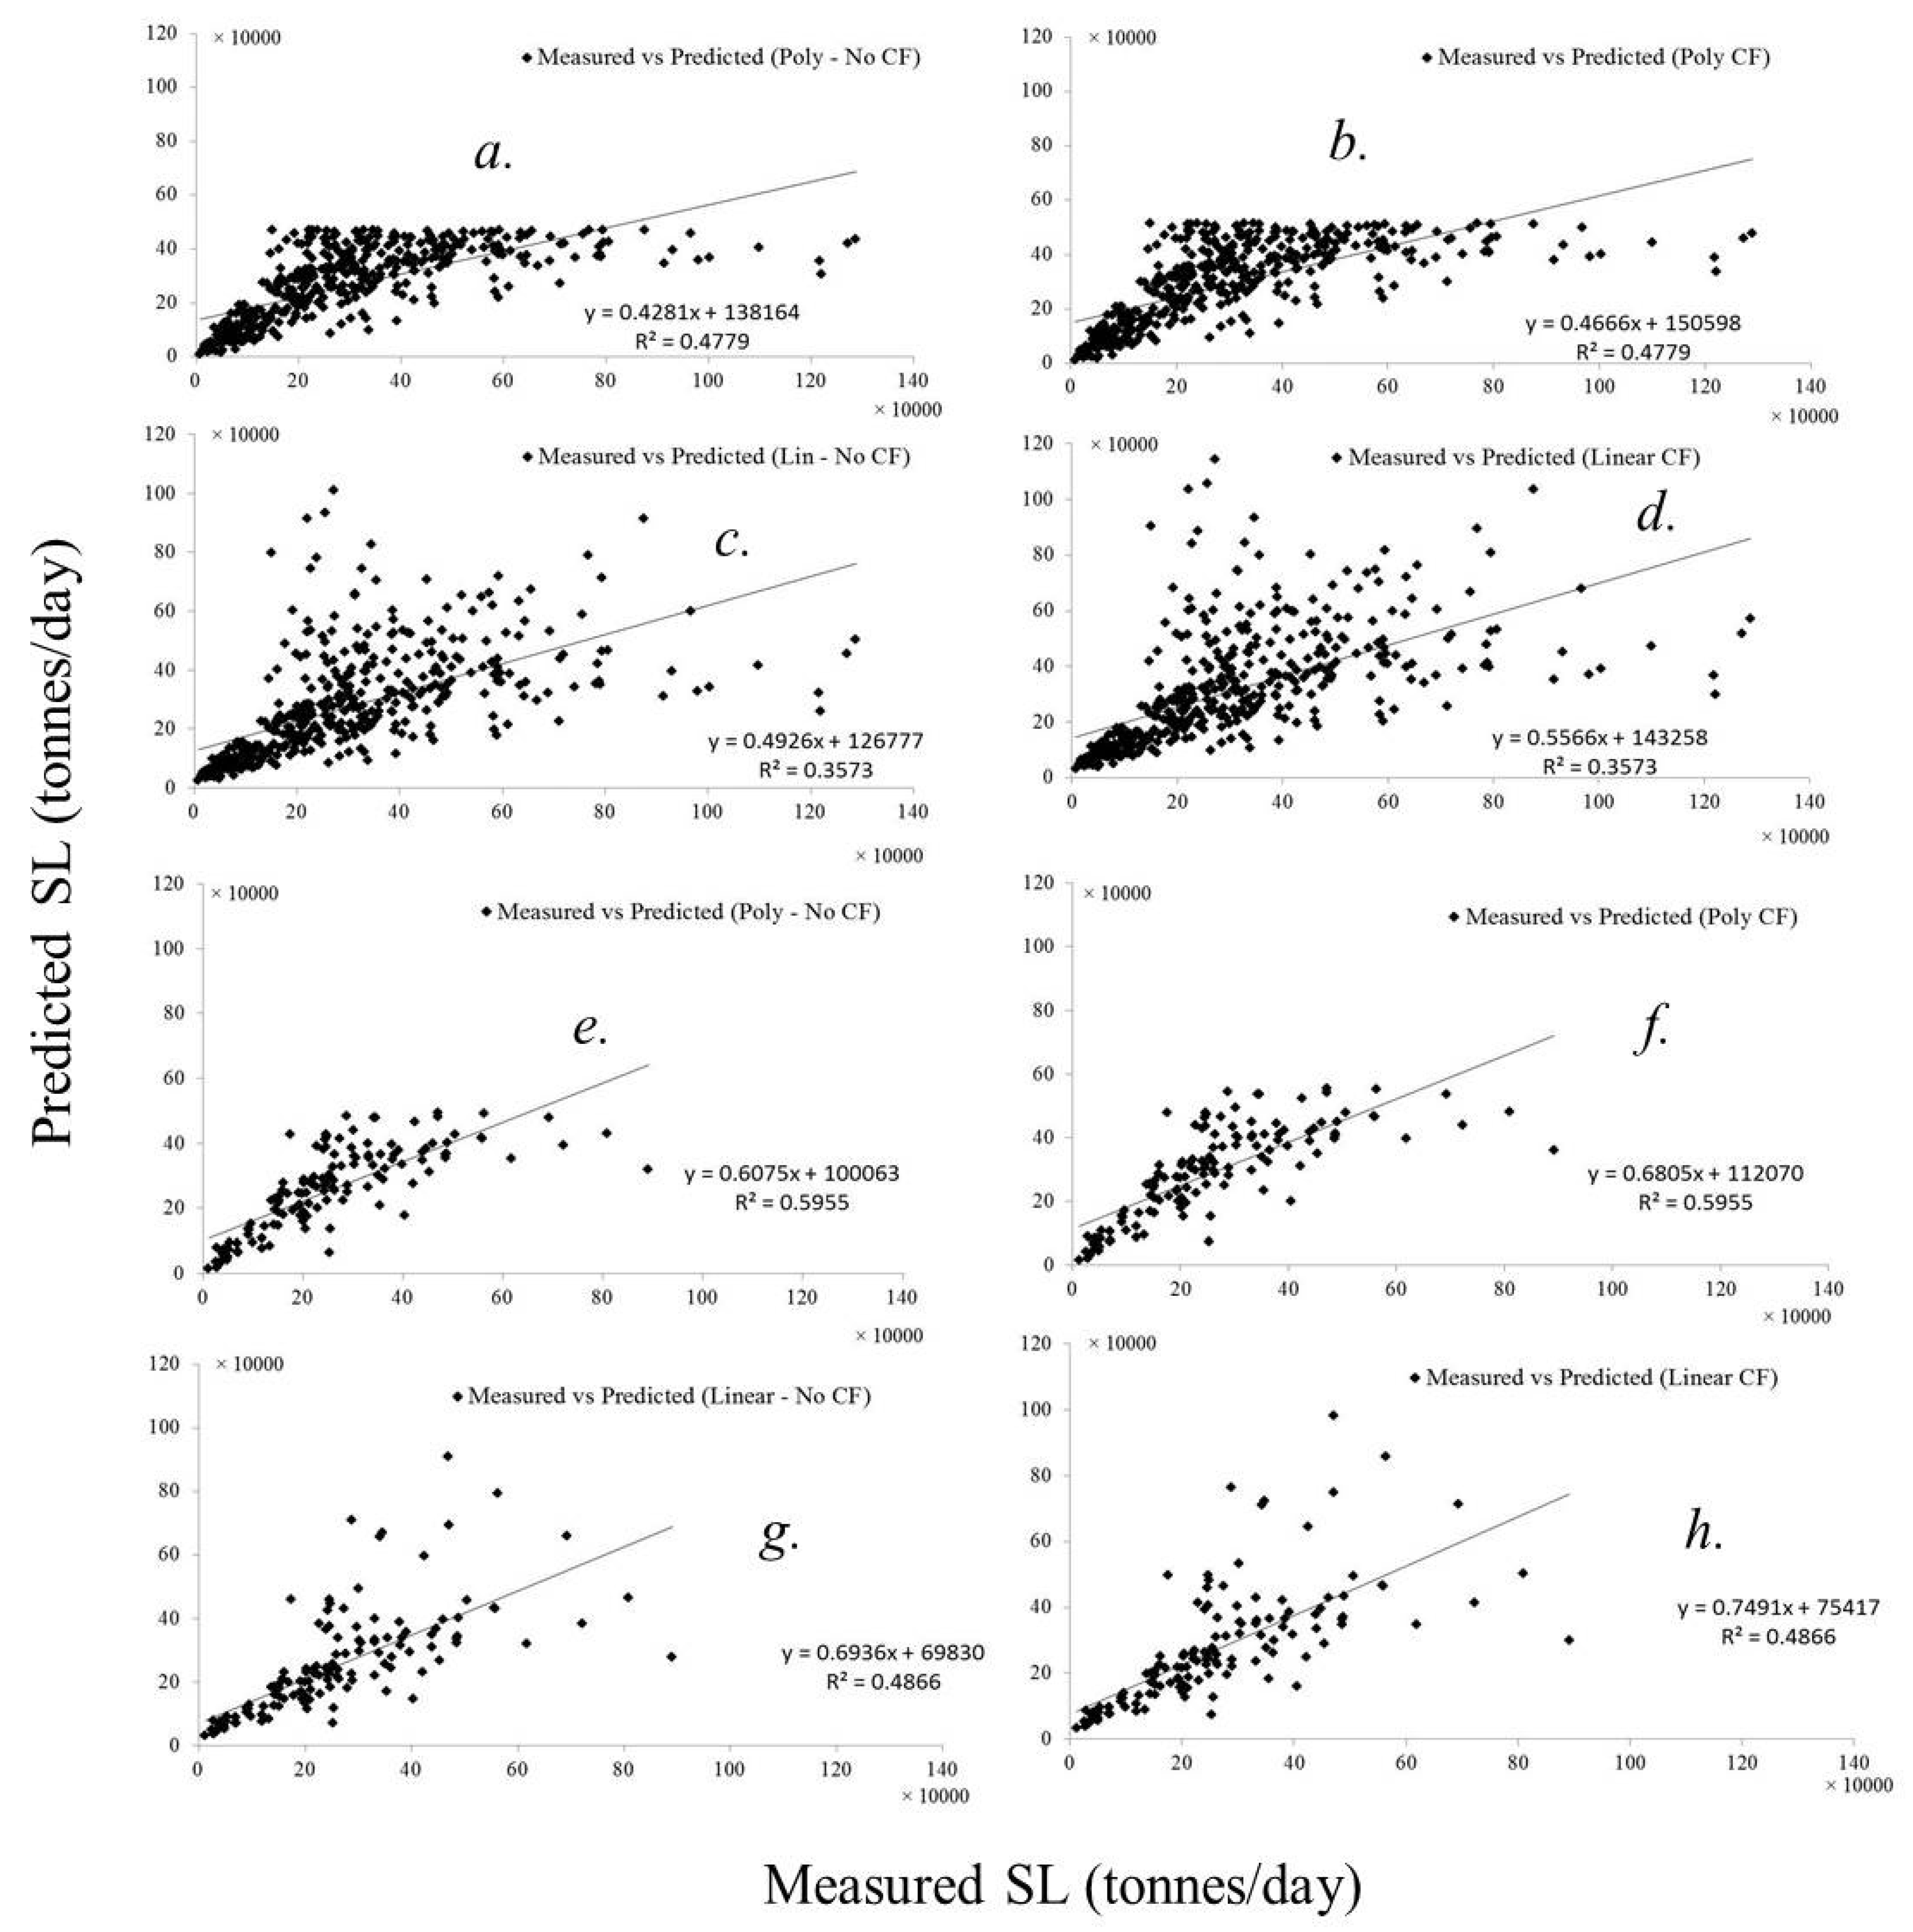
Figure 4.
Comparison of Measured SL (please see caption of Figure 3 for definition) with those predicted from several sediment rating curves (Predicted SL) at St Francisville of the Lowermost Mississippi River during 1978–2015. Specific terminologies found in this figure such as Lin, Poly, CF, and No CF are same as explained in Figure 3.
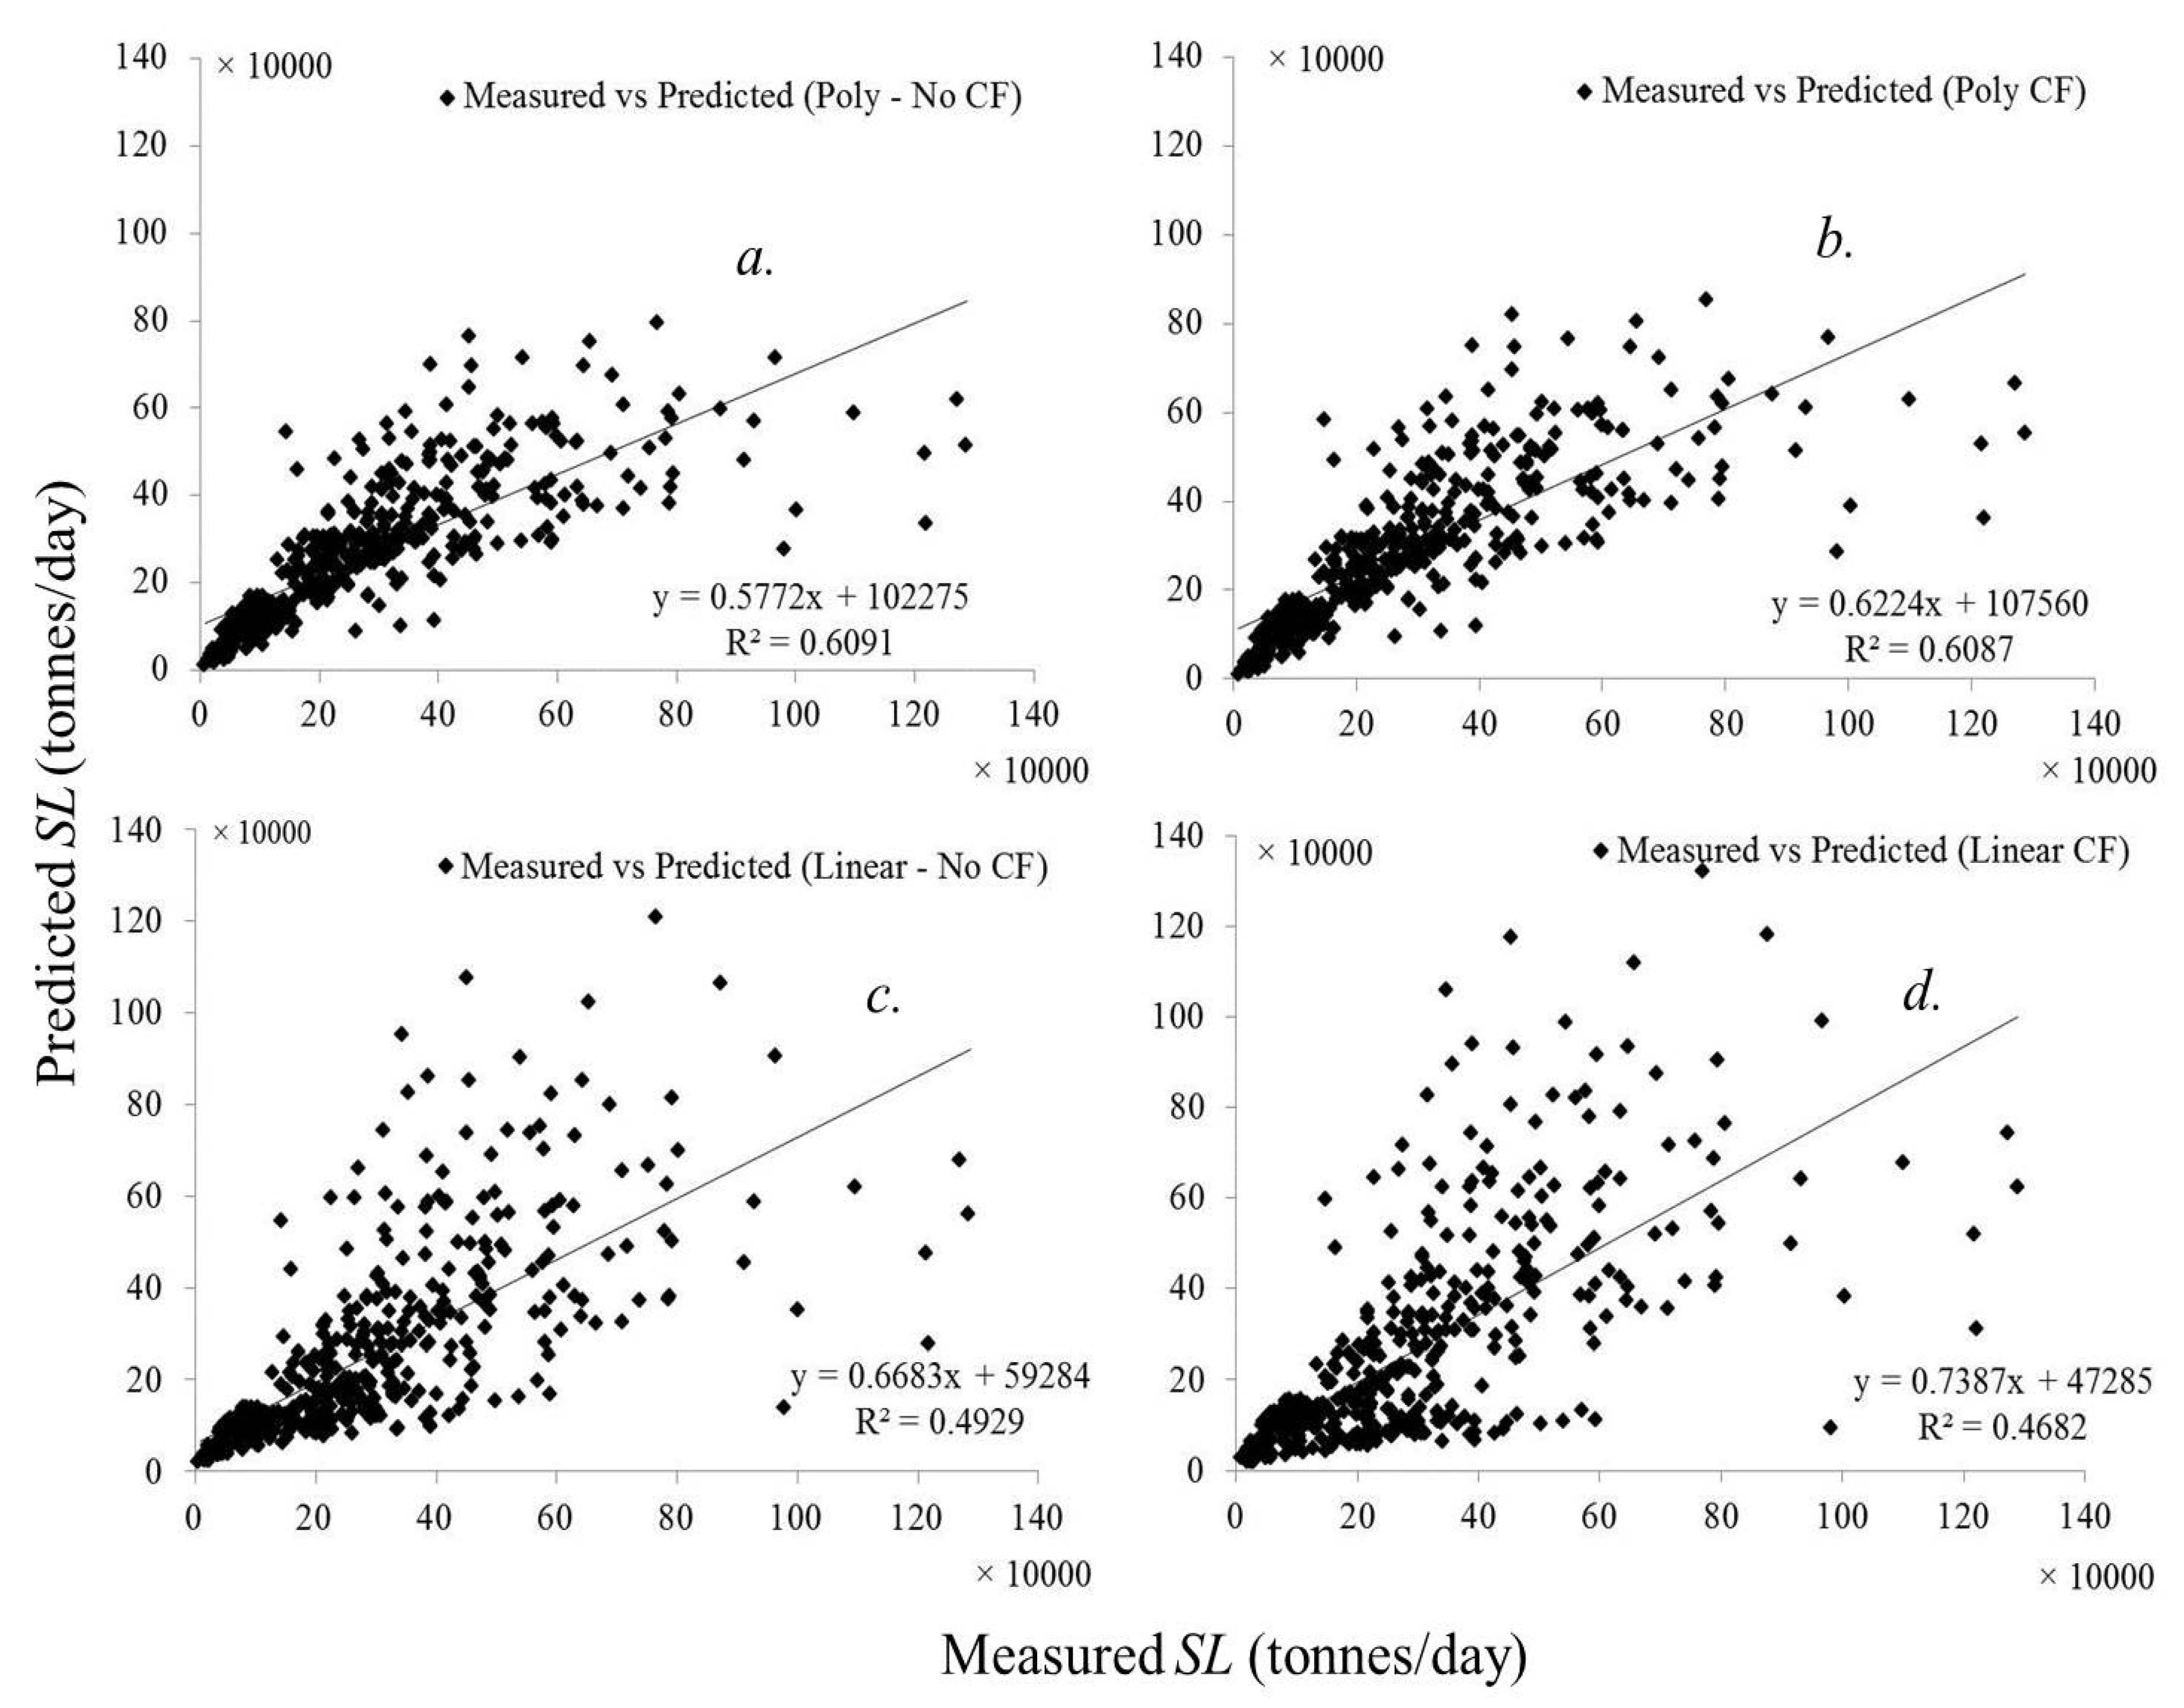
Figure 5.
Comparison of sand loads calculated from SSC records measured, processed and calibrated by USGS (Measured SLs) with those predicted from single sediment rating curves [either linear (Lin) or polynomial (poly)] (Predicted SLs) at St Francisville of the Lowermost Mississippi River during 1978–2015 (a–d) and BTR during 2004–2015 (e–h). Specific terminologies found in this figure i.e., ‘CF’ and ‘No CF’ are same as explained in Figure 3.
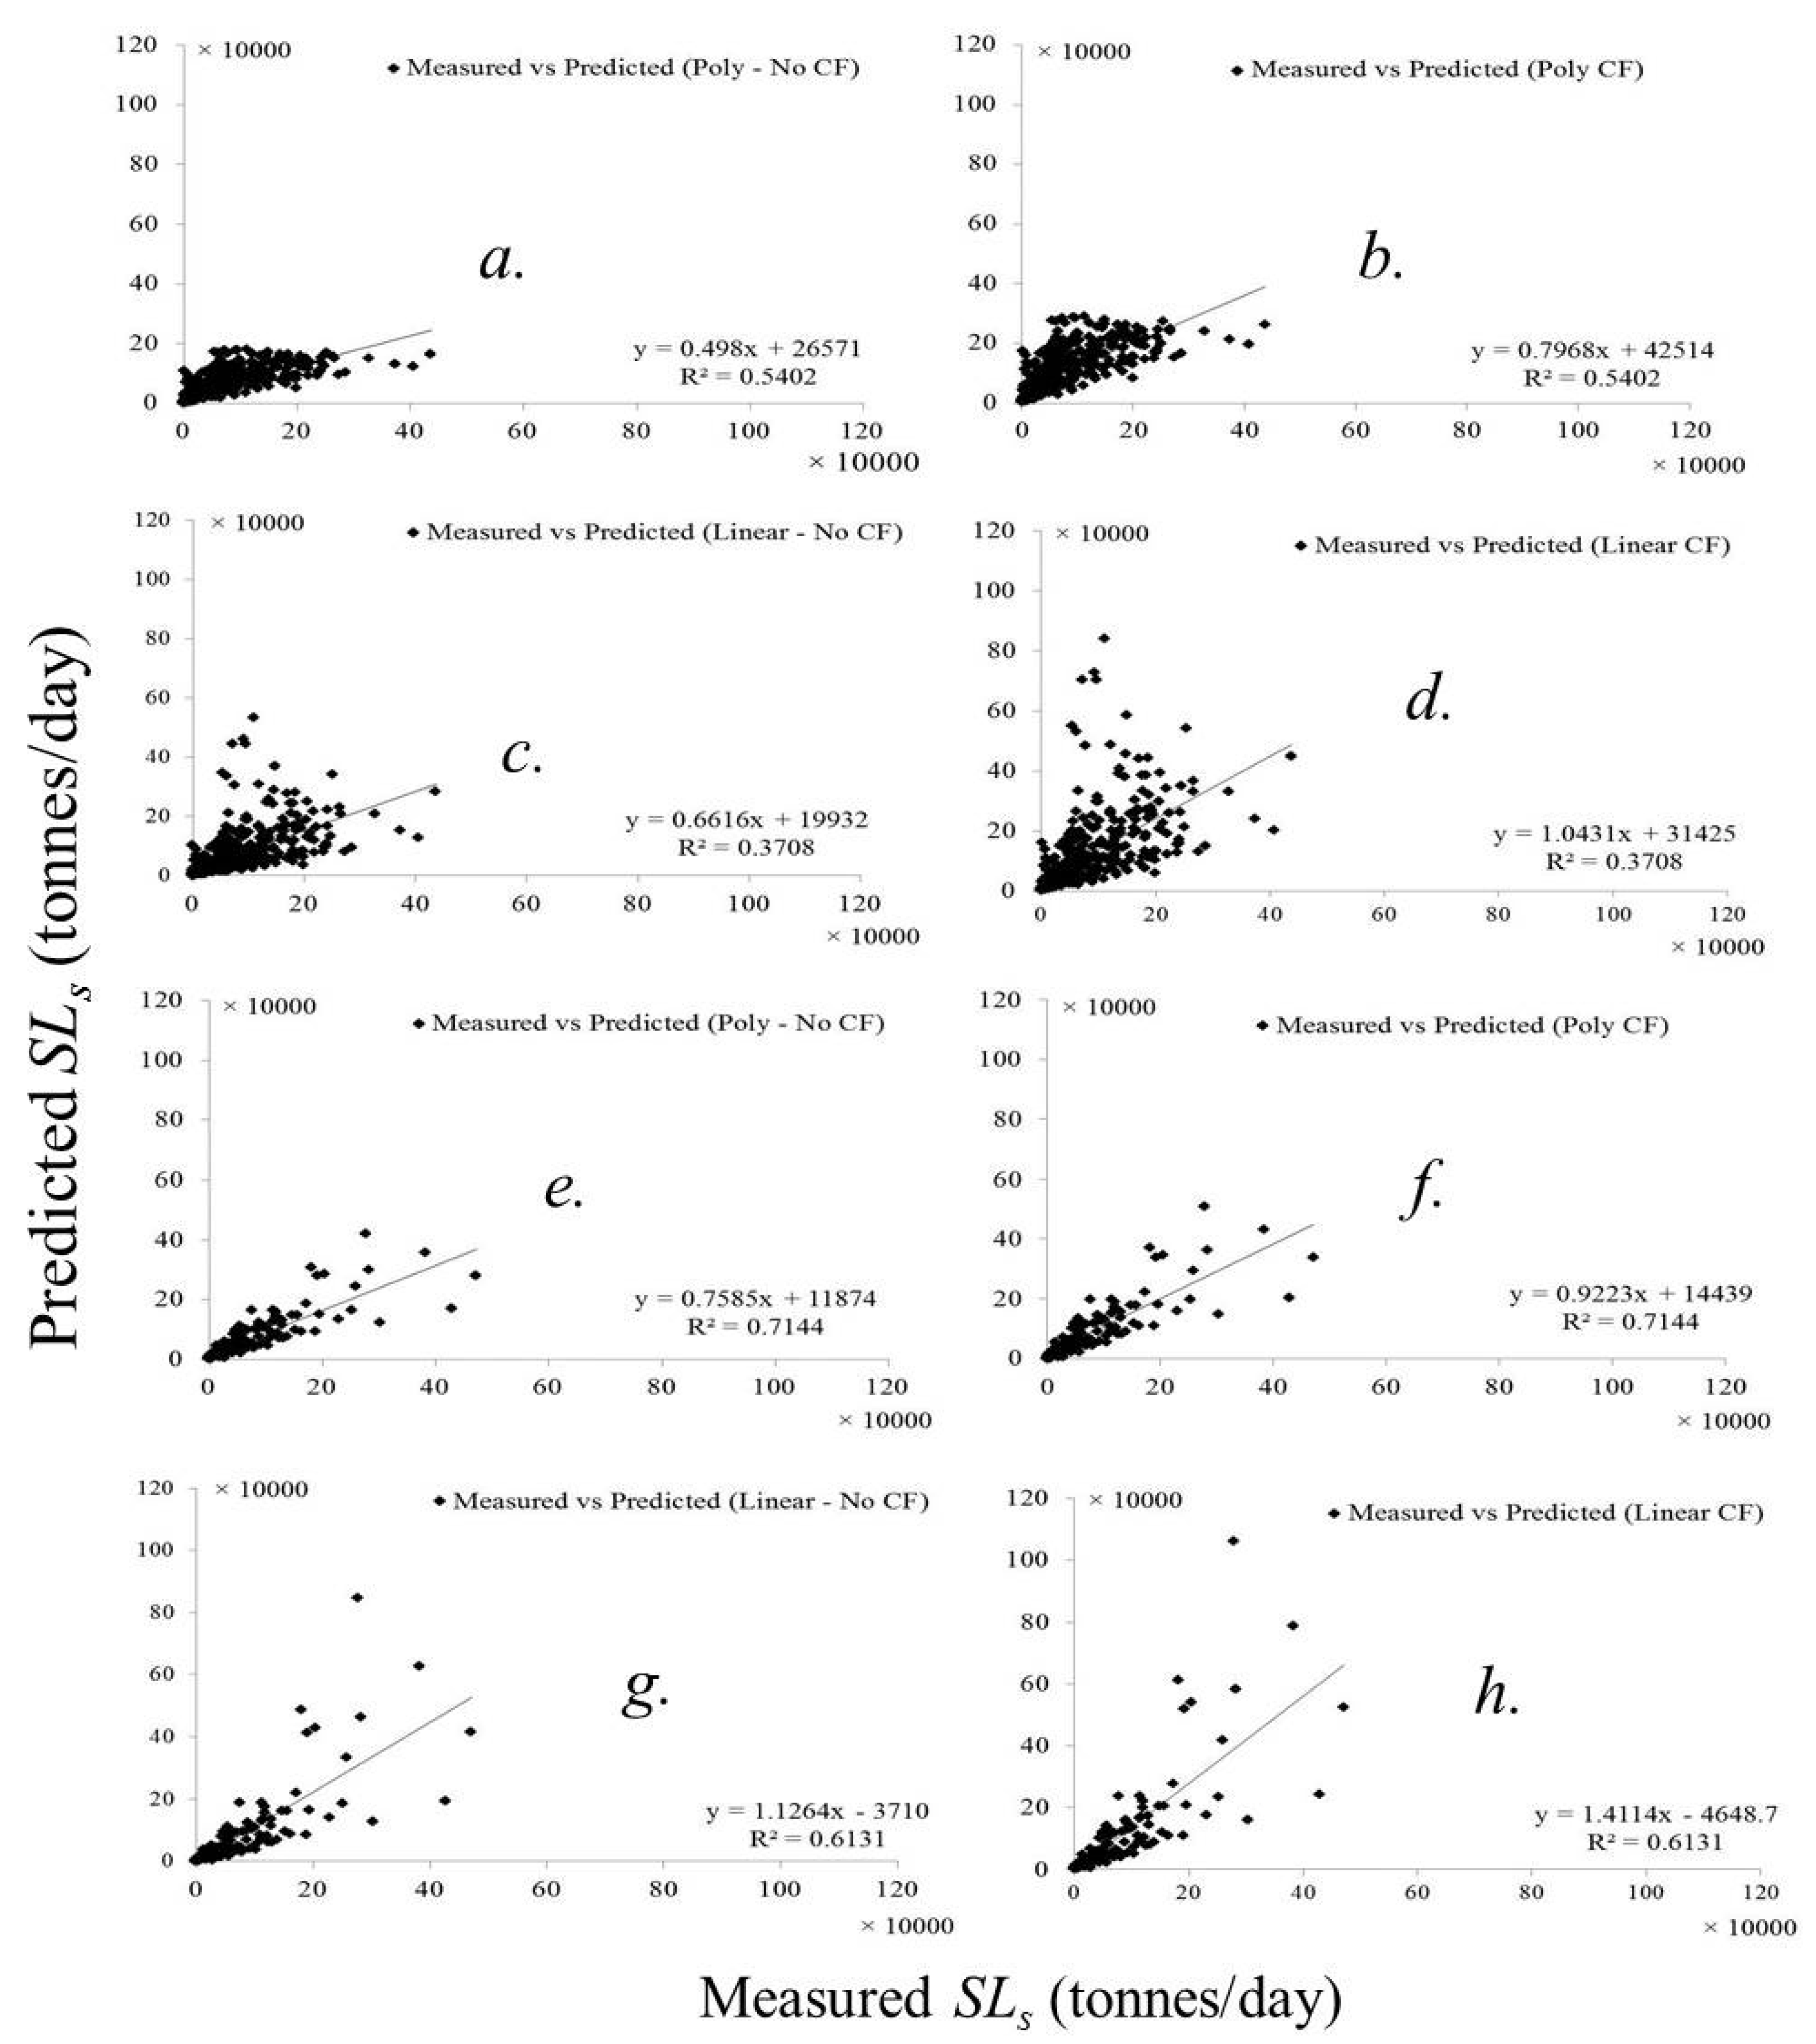
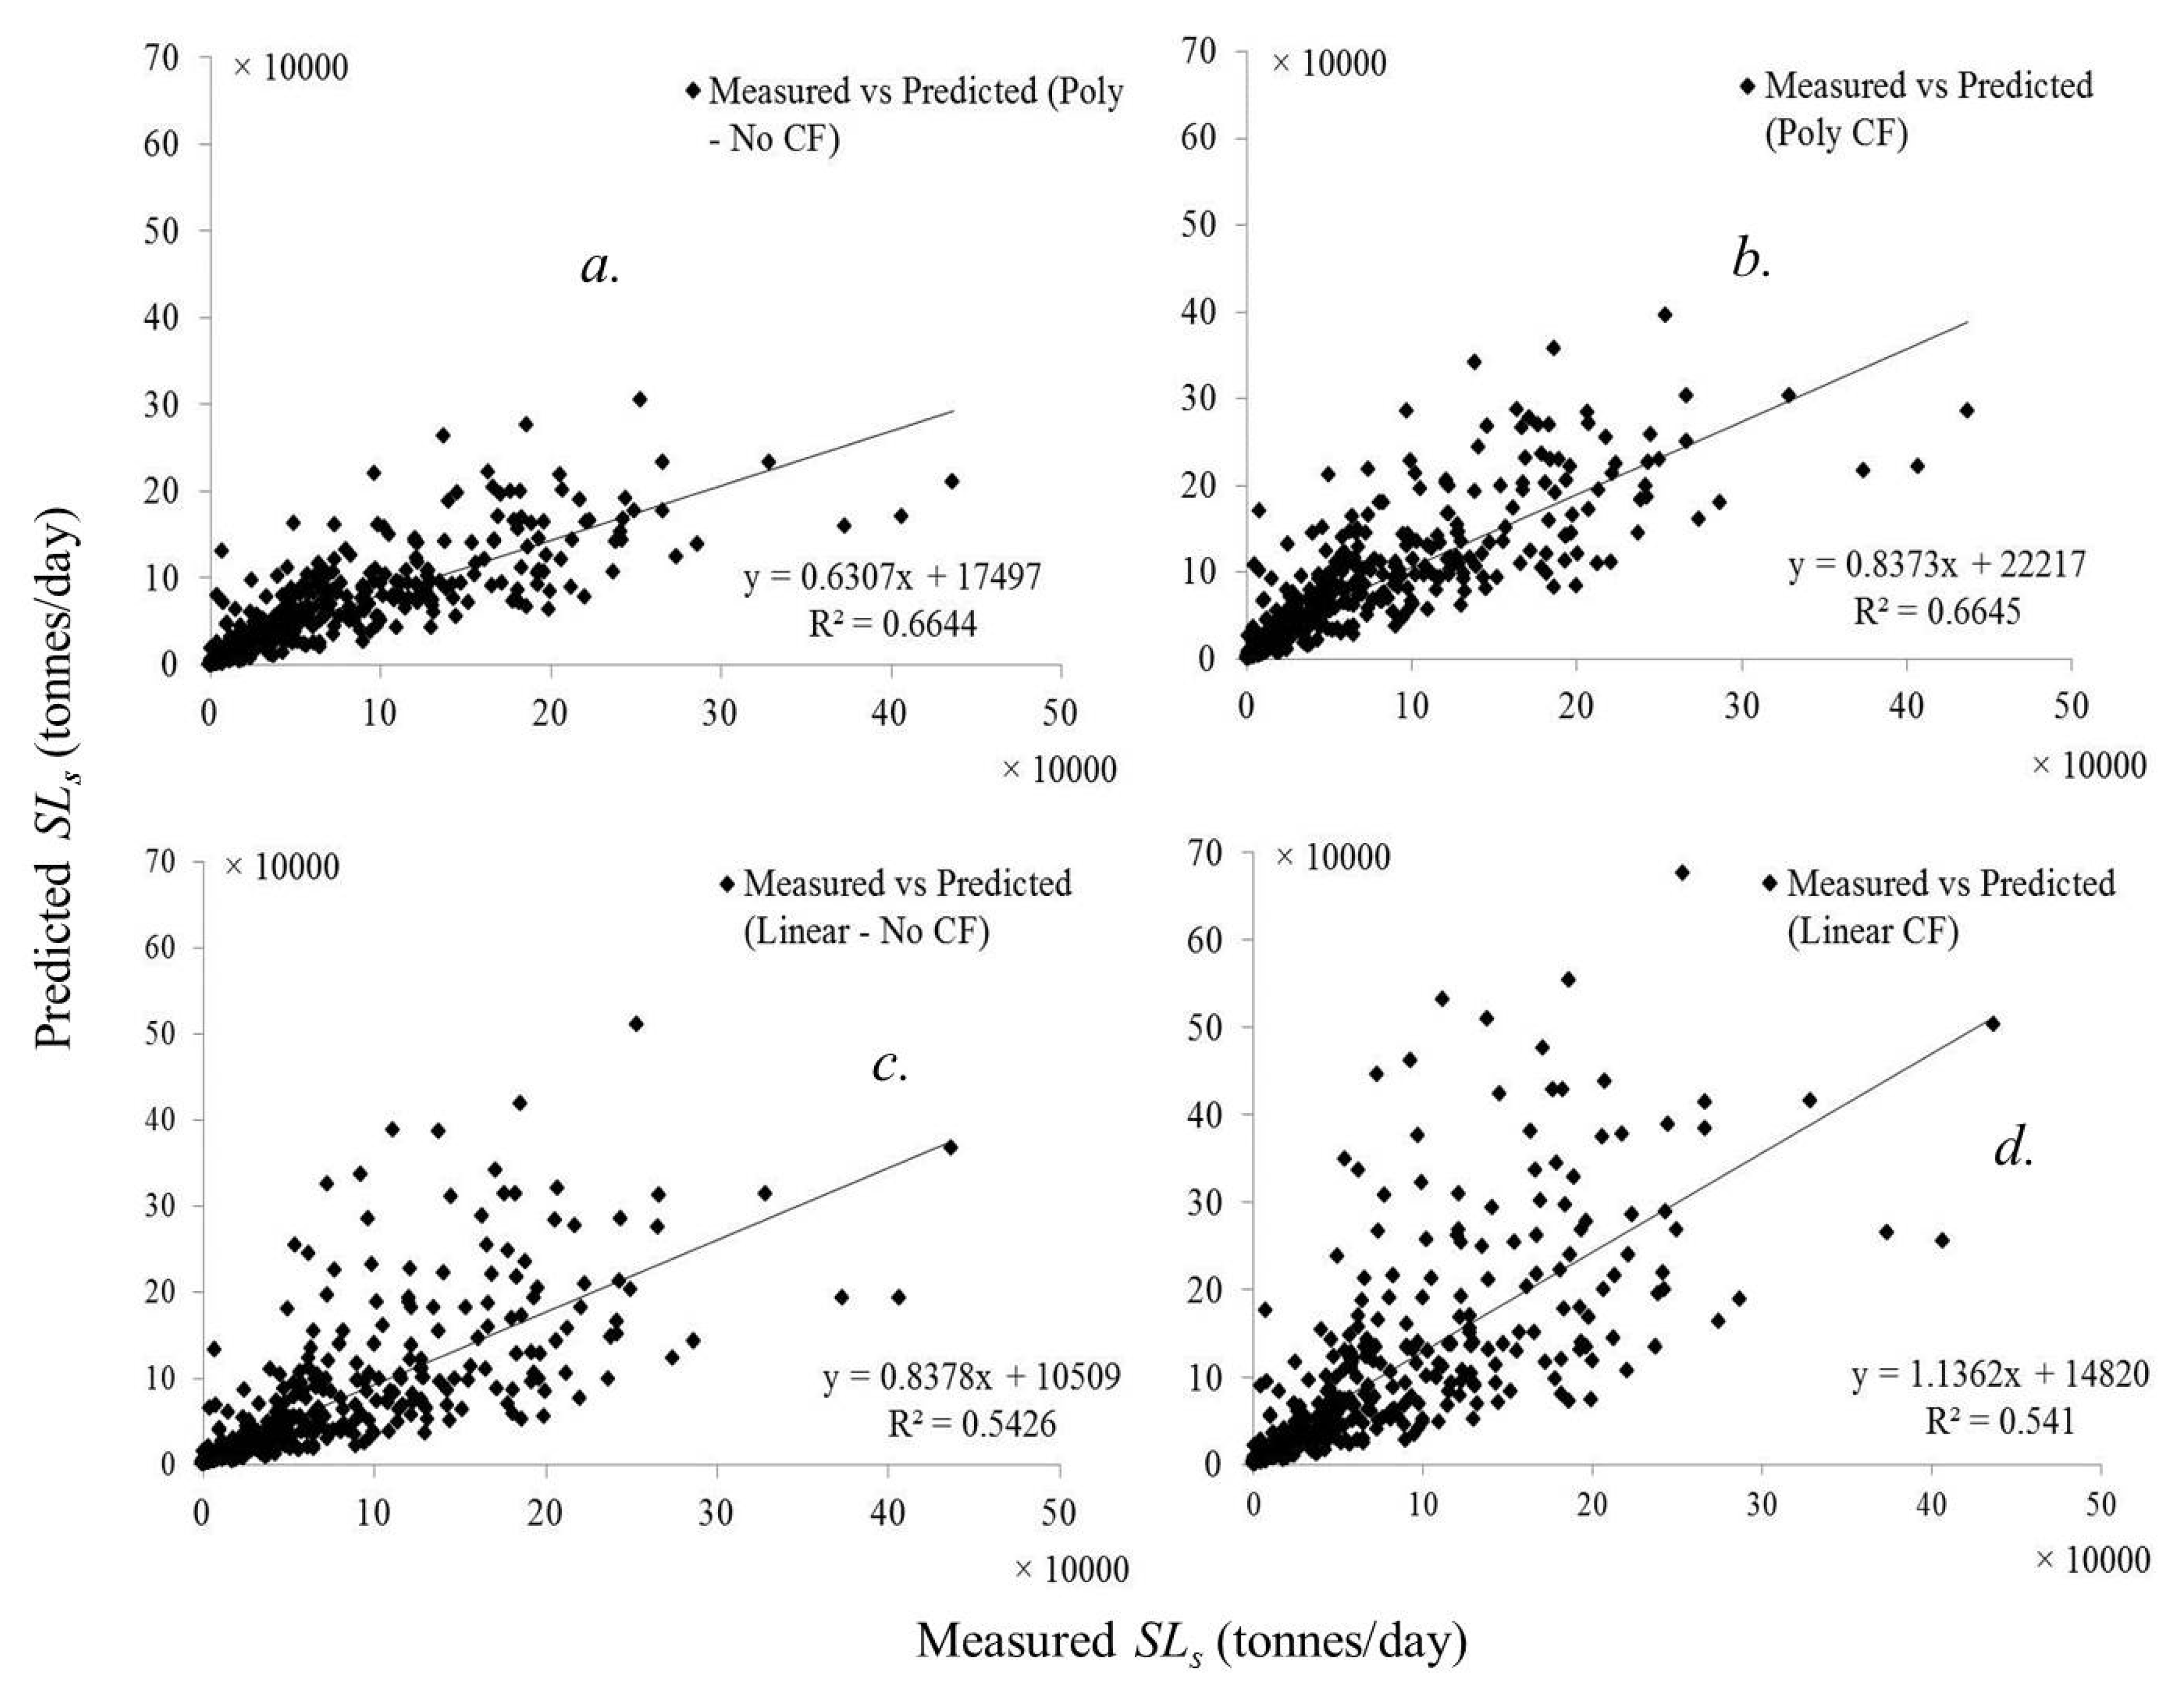
Figure 6.
Comparison of Measured SLs and Predicted SLs at St Francisville of the Lowermost Mississippi River during 1978–2015. Specific terminologies found in this figure such as Lin, Poly, CF, and No CF are same as explained in Figure 3. It is to note that both predicted and measured SLs during 1997 were eliminated in this comparison because of the low R2 value of both rating curves during this year (please see Table 2).
2.6. Non-Rating Curve Approach for Sand Load Calculation
A non-rating curve approach was used for prediction DSLs at St Francisville during 1997 because of the same reasons mentioned in Section 2.5. In this method, the sand concentration for the first sampling date of the year was supposed to be equal to all consecutive days of missing concentrations until the next sampling date. In addition, the concentration of the first sampling date was used for all non-available dates earlier that year. Finally, all DSLss during 1997 at St Francisville were calculated using Equation (8).
2.7. Annual and Seasonal Bedloads and Suspended Loads
We calculated annual bedload transport rates (Qs) at Tarbert Landing, St Francisville and Baton Rouge as the sum of daily Qs between 1 January and 31 December for the three locations. The error range value for annual bedload transport rates was considered as ±24% based on the accuracy of Engelund-Hansen equation noted by Van Rijn [49]. Van Rijn [49] reported that bedloads measured in three field sites and one lab condition were 61 to 87% (average 76%) of the corresponding bedloads computed from the Engelund-Hansen equation.
We also calculated annual suspended sediment and sand loads at St Francisville and Baton Rouge as the sum of DSL and DSLs between 1 January and 31 December for both sites. The error range value of ±18% given by Joshi and Xu [31] was used to adjust for errors in annual sediment and sand loads. These loads were used to analyze daily and annual sediment and sand load trends at both locations. Similarly, monthly sediment and sand loads were used to analyze their seasonal trends. The annual and monthly sediment and sand loads were also compared with pre-existing sediment and sand loads at Tarbert Landing for overlapping periods.
3. Results
3.1. Bedload Transport Rates
Total and annual bedload rates (Qs) increased gradually from Tarbert Landing to Baton Rouge along the LmMR during 2004–2015 for all representative grain sizes (Figure 7, Figure 8 and Figure 9). The total Qs for grain size of 0.125 mm were found to be 82.8, 83.6 and 96 MT at Tarbert Landing, St Francisville and Baton Rouge respectively during the 12 years (Figure 7, Figure 8, Figure 9 and Figure 10). Similarly, annual Qs for the same grain size of 0.125 mm averaged 6.9 million tons (MT)/year, ranging from 2.3 (in 2006) to 12.8 MT/year (in 2015) at Tarbert Landing (Figure 7 and Figure 10); 7 MT/year, ranging from 3.5 (in 2006) to 10.3 MT/year (in 2008) at St Francisville (Figure 8 and Figure 10); and 8.1 MT/year, ranging from 2.2 (in 2014) to 19.4 MT/year (in 2004) at Baton Rouge (Figure 9 and Figure 10). When the representative grain size decreased by half, the annual Qs for all three locations along the LmMR also decreased by half during 2004–2015 (Figure 7, Figure 8 and Figure 9). Therefore, the annual Qs for the grain size of 0.25 mm were half of the annual Qs for the grain size of 0.125 mm at Tarbert Landing, St Francisville and Baton Rouge in each of the 12 years during 2004–2015 (Figure 7, Figure 8 and Figure 9). Further, the annual Qs for the grain size of 0.5 mm were half of the annual Qs for the grain size of 0.25 mm in each year (Figure 7, Figure 8 and Figure 9).
Specifically, annual Qs for all grain sizes experienced an increasing trend at Tarbert Landing from 2006 to 2015 (2.3 MT in 2006 increased to 12.8 MT in 2015 for grain size of 0.125 mm; 1.2 MT in 2006 increased to 6.4 MT in 2015 for grain size of 0.25 mm; and 0.6 MT in 2006 increased to 3.2 MT in 2015 for grain size of 0.5 mm) (Figure 7). At Baton Rouge, the trends in bed load transport rates were exactly the opposite. In this location, annual Qs for all grain sizes experienced a decreasing trend throughout the study period (19.4 MT in 2004 decreased to 2.3 MT in 2015 for grain size of 0.125 mm; 9.7 MT in 2004 decreased to 1.2 MT in 2015 for grain size of 0.25 mm; and 4.8 MT in 2004 decreased to 0.6 MT in 2015 for grain size of 0.5 mm) (Figure 9). At St Francisville, the location between Tarbert Landing and Baton Rouge, annual Qs for all grain sizes did not experience any significant change during 2004–2015 (Figure 8). On a few occasions, annual Qs for all grain sizes increased or decreased abruptly for two to three years in continuum at all three locations (Figure 7, Figure 8, Figure 9 and Figure 10).
Monthly averages of daily bedload rates (Qs) along the LmMR during 2004–2015 showed linearly increasing trends with monthly averages of daily river discharge (Qd) and river stage (RSd) at Tarbert Landing and St Francisville respectively, however, the increasing trends with both variables were not eminent at Baton Rouge (Figure 11 and Figure 12). The rate of increase of Qss with both variables was highest at St Francisville (R2 = 0.95 for Qs vs. Qd linear trend line and 0.84 for Qs vs. RSd trend lines) (Figure 11 and Figure 12) and second highest at Tarbert Landing (R2 = 0.83 for Qs vs. Qd linear trend line and 0.77 for Qs vs. RSd trend lines) (Figure 11 and Figure 12). At Baton Rouge, however, the relationship of monthly Qs with monthly Qd and RSd appeared to be more scattered during the 12-year study period (R2 = 0.33 for Qs vs. Qd linear trend line and 0.32 for Qs vs. RSd trend lines) (Figure 11 and Figure 12). These relationships were noted down for representative grain size of 0.125 mm. Exactly same relationships of monthly Qs with monthly Qd and RSd were found for the other two grain sizes (0.25 and 0.5 mm) at each location along the LmMR during 2004–2015 (figures for these two grain sizes were not kept here to avoid repetition).
3.2. Suspended Sediment Loads
Annual sediment loads (SL) at St Francisville averaged 97.1 million tons (MT) from 1978 to 2015, ranging from 40 MT in 2012 to 178.7 MT in 1979 (Figure 13). The total sediment amount for the entire 38-year study period was found to be 3688.3 MT (Figure 13). Annual SL was lower than 50 MT for 3 of the 41 years (2000, 2006, and 2012), 50 to 100 MT for 19 years (including the Mississippi flood year of 2011), 100 to 150 MT for 12 years and more than 150 MT for the remaining 4 years (Figure 13). Annual SL was higher for approximately the first-half of the study period (117.3 MT from 1978 to 1999), however, it decreased substantially towards the latter-half (69 MT from 2000 to 2015) (Figure 13). Also, annual SL was more than 100 MT only for one year (103.4 MT in 2004) during this period. Long-term continuous increasing or decreasing trend (even for 3/4 years) in annual SL was not found at St Francisville despite a few instances of abrupt decrease during for 2 years in continuum (Figure 13).
At Baton Rouge, annual SL averaged 67.2 MT from 2004 to 2015 and ranged 28.3 MT (in 2006) to 92.9 MT (in 2009) (Figure 13). During this period, the total sediment amount was found to be 806.1 MT (Figure 13). Annual SL was lower than 50 MT for 2 out of 12 years (2006 and 2012), while either >50 or <100 MT for the remaining 10 years (Figure 13). The long-term continuous increasing or decreasing trends in annual SL were not found at this station (Figure 13). This result was similar to that of St Francisville.
Both sites had slightly different seasonal trends of average DSLs. At St Francisville, average DSL during 1978–2015 increased each year from January to its maximum in April (i.e., from 313,955 to 427,400 tonnes/day), then decreased from May to its minimum in September (from 401,143 to 99,043 tonnes/day), showing the highest sediment transport during early spring months (Figure 14). Average DSL increased again for the remaining three months of the year i.e., 110,000 tonnes/day in October to 287,000 tons/day in December (Figure 14). At Baton Rouge, however, average DSL during 2004–2015 decreased slightly from January to February (i.e., from 229,317 to 228,956 tonnes/day) (Figure 14). It further increased during the three spring months from 268,017 tonnes/day in March to 300,080 tonnes/day in May (Figure 14), followed by a drop to its minimum in mid-fall (i.e., from 252,035 tonnes/day in June to 75,735 tonnes/day in September) (Figure 14). The final three months had a continuous increase in average DSL like that found at St Francisville i.e., 79,789 tonnes/day in October to 179,541 tonnes/day in December (Figure 14).
3.3. Suspended Sand Loads
St Francisville had an annual sand load (SLs) averaging 19.9 million tons (MT) during 1978–2015, varying from 5 MT in 2006 to 43 MT in 1979 (Figure 15). The total SLs for the entire 38-year study period was 754 MT (Figure 15). Annual SLs was lower than 10 MT for 3 of 38 years (1997, 2000, and 2006), 10 to 25 MT for 26 years (including the Mississippi flood year of 2011), 25 to 40 MT for 6 years and more than 40 MT for the remaining 3 years (1979, 1983, and 1993) (Figure 15). Average annual SLs was higher for approximately the first-half of the study period (24 MT/year from 1978 to 1999), however, like annual SL, it decreased substantially towards the later-half (13.1 MT from 2000 to 2015) (Figure 15). In fact, annual SLs were less than 20 MT for all 16 years during the later-half as compared to 5 out of 22 years for the first-half. Like annual SL, annual SLs at St Francisville did not have any long-term increasing or decreasing trend (even for 3/4 years) (Figure 15).
At Baton Rouge, annual SLs averaged 16.1 MT during 2004–2015, ranging from 2.9 MT in 2006 to 28.3 MT in 2009 with the total sand amount of 193 MT (Figure 15). Annual SL was lower than 10 MT for 4 out of 12 years (2006, 2007, 2012, and 2014), 10 to 25 MT for 6 years and higher than 25 MT for the remaining 2 years (Figure 15). The continuous increasing or decreasing trend (even for 3/4 years) were not found in annual SLss at Baton Rouge as well (like its annual sediment loads and St Francisville’s annual sediment and sand loads) (Figure 15).
The seasonal trends of average DSLss varied little during April and May. At St Francisville, average monthly DSLs followed the same trend as average monthly DSL during 1978–2015: it increased from January to its maximum in April (i.e., 64,329 to 102,934 tonnes/day), then decreased from May to its minimum in September (97,724 to 9687 tonnes/day) (Figure 16). During the remaining three months, average monthly DSLs increased again i.e., 13,450 tonnes/day in October to 58,921 tonnes/day in December (Figure 16). At Baton Rouge, however, average DSLs during 2004–2015 increased from January to May (i.e., 48,953 tonnes/day in January to 105,280 tonnes/day in May) (Figure 16). Further, average monthly DSLs decreased steadily from June to its minimum in September (70,101 to 4971 tonnes/day) (Figure 16). The final three months experienced an increase in average DSLs at Baton Rouge like all other average monthly DSLs and DSLss (i.e., 8265 tonnes/day in October to 38,235 tonnes/day in December) (Figure 16).
4. Discussion
4.1. Spatial and Temporal Variation in Bedload and Suspended Load along the LmMR
We found gradual increase in estimated bedload transport rates (Qs) from Tarbert Landing to Baton Rouge during 2004–2015. In addition, the 12 years showed significantly higher Qs at Baton Rouge and lower and nearly equal Qs at Tarbert Landing and St Francisville for all grain sizes. We further found increase in Qs with increase in riverbed elevation and decrease in cross-sectional area and grain-sizes at all locations. Therefore, we suggest that lower cross-sectional area (based on lower river widths), higher bed elevation and finer bottom sediments could have contributed to higher Qs at Baton Rouge as compared to Tarbert Landing and St Francisville. The estimated daily river widths at Baton Rouge were at least 400 m less than the widths at Tarbert Landing and St Francisville in all river stages. Similarly, riverbed elevations for each year at Baton Rouge were at least 8 and 6 m higher than the corresponding riverbed elevations at Tarbert Landing and St Francisville respectively. Demas and Curwick [58] noted that particle size of coarser sediments proximate to the river-bottom decreased gradually from Tarbert Landing to the Bonnet Carre Spillway (about 163 km downstream of Baton Rouge). Similarly, higher Qs in lower CSAs can imply that bed load movement can speed up in smaller cross-sectional profiles across rivers due to the clustered nature of bed materials. In larger cross-sectional profiles bed materials are probably more scattered, thus reducing the bedload movement. Daily Qs increased almost linearly with daily river discharge and daily river stage at Tarbert Landing and St Francisville, but the trend was nearly unnoticeable at Baton Rouge. The bedload relationship with river discharge and stage at Tarbert Landing and St Francisville indicated that finer bed materials moved rapidly during higher river discharge and stage. However, bigger sized bed materials were probably difficult to transport especially during the low river stages in low discharge regimes. Also, proximity of low flows to the riverbed probably lowers their force in the bed materials, while higher flows can exert substantially more force in the materials [59,60]. However, substantially higher bed elevation at Baton Rouge probably negated the linear effects of discharge on bedload transport at this location. Furthermore, the river bed elevation increased at Tarbert Landing but decreased at Baton Rouge from 2004 to 2015 (1.95 m in 2004 increased to 2.04 m in 2015 at Tarbert Landing; 10.1 m in 2004 decreased to 9.9 m in 2015 at Baton Rouge), which may have caused continuously increasing bedloads at Tarbert Landing and decreasing bedloads at Baton Rouge during 2004–2015. However, the effects of river bed elevation were not evident on temporal bedload trends at St Francisville.
Subtle temporal variability in suspended loads (during overlapping periods) was found between the lower two locations (St Francisville and Baton Rouge) along the LmMR reach. Total annual sediment loads (SL) and sand loads (SLs) at both sites differed only by about 3 and 35 MT respectively during 2004–2015, with higher annual SL at St Francisville and higher annual SLs at Baton Rouge (Table 6 and Table 7). These differences fell considerably within the error range for suspended loads (±18%), thus could be statistically neglected. Allison et al. [38] in a recent study also reported similar proximate suspended loads at both locations, but for a very short period (2008–2010) (270.8 MT SL and 53 MT SLs at St Francisville; and 277.3 MT SL and 82.5 MT SLs at Baton Rouge). Suspended loads at both locations, however, were considerably lower than the previous reported loads at Tarbert Landing for the corresponding coinciding periods. The total SL at St Francisville was lower than Tarbert Landing by about 843 MT during 1980–2010 [3929 MT at Tarbert Landing (reported by Rosen and Xu [28]) as compared to 3086 MT at St Francisville (in this study) (Table 6)]. Similarly, total SLs at St Francisville was lower than Tarbert Landing by about 253 MT during 1978–2013 [979 MT at Tarbert Landing (reported by Joshi and Xu [31]) as compared to 726 MT at St Francisville (in this study) (Table 7)]. In addition, the total SL at Baton Rouge was lower than Tarbert Landing by approximately 427 MT during 2004–2010 [891 MT at Tarbert Landing (reported by Rosen and Xu [28]) as compared to 464 MT at Baton Rouge (in this study) (Table 6)], while total SLs at Baton Rouge was lower than Tarbert Landing by about 155 MT during 2004–2013 [314 MT at Tarbert Landing (reported by Joshi and Xu [31]) as compared to 159 MT at Baton Rouge (in this study) (Table 7)]. The seasonal trends in DSL and DSLs in these locations were identical to the trends of total and annual suspended loads i.e., noticeably higher average DSL and DSLs during each month at Tarbert Landing as compared to those of nearly similar monthly loads at St Francisville and Baton Rouge, respectively. Such notable reductions in suspended loads from upstream to downstream locations along a river stretch over one to four decades can imply that substantial sediment flow is likely to be restricted for long time periods by major artificial structures built at the upstream site.
Aforementioned trends in suspended loads at the three locations quantifiably support the findings made by Joshi and Xu [36] that the first 20–25 km LmMR reach below ORCS, covering Tarbert Landing and Red River Landing has experienced sediment deposition during the last three and half decades. Also, nearly equal suspended loads at St Francisville and Baton Rouge (during overlapping periods) support another of their conclusion that the reach from Bayou Sara (which is near St Francisville) to Baton Rouge experienced sediment erosion over the last three decades. Three factors that may have contributed most to the higher suspended loads at Tarbert Landing include: (1) diversion of ~25% of LmMR flow to the Atchafalaya River at the Old River Control Structure (ORCS) (~10 to 15 km upstream of Tarbert Landing) from 1963 [61] which may have reduced water velocity near Tarbert Landing due to its proximity to the ORCS and aided in settling down suspended sediments; (2) three channel bars near Tarbert Landing which could retain riverine sediments especially during major floods, as found by Horowitz [29], Wang and Xu [62], and Wang and Xu [35]; and (3) coarser bottom sediments at Tarbert Landing than those of St Francisville and Baton Rouge, as documented by Demas and Curwick [58] and Horowitz [29].
We found substantial decline in average annual SL and SLs at St Francisville after 1993 (the Mississippi River flood year). Annual SL and SLs at St Francisville averaged approximately 124 and 27 MT/year respectively during 1978–1993, while they averaged about 78 and 15 MT/year during 1994–2015 experiencing a decline of 46 and 12 MT/year, respectively post-1993. Previously, Horowitz [29] noted nearly equivalent decline of 39 MT/year in annual SLs at St Francisville during 1994–2007 as compared to 1981–1993. Sharp declines in the suspended loads at St Francisville post 1993 may have been caused by long overbank sedimentation followed by overbank floods along the upper and middle Mississippi River reach in 1993. Benedetti [63] reported that the 1993 flood left 30–80 mm of silty fine sand on the floodplains of Upper Mississippi River from Minneapolis, Minnesota to St. Louis, Missouri. Similarly, Gomez et al. [64] noted that the 1993 flood caused <4 mm of vertical accretion on leveed and unleveed floodplains along a 70-km reach of the Mississippi River near Quincy, Illionis. Gomez et al. [65] examined the river reach between St. Louis and Thebes (approximately from the confluence of the Missouri and Mississippi Rivers to the confluence of Ohio and Mississippi Rivers) and concluded that several levee breaks along this reach could have been caused by sediment and circumjacent sand deposits from the 1993 flood. The overbank sedimentation could have removed substantial stored bed/suspended sediments in the reach and eliminated several SSC sources for the LmMR reach [66]. There were no sediment records available to find the effects of 1993 flood on Baton Rouge suspended loads; however, we did not observe any significant trend in annual SL and SLs at this site during the last decade. Even the LmMR flood in 2011 did not seem to make a significant impact on the suspended loads at Baton Rouge, since there was negligible difference in average annual SL and SLs during the two periods: 2004–2011 (pre-2011 flooding) (mean annual SL and SLs = 67.7 and 17 MT respectively) and 2012–2015 (post-2011 flooding) (mean annual SL and SLs = 66.2 and 14.1 MT respectively). These intra-location pre- and post- flooding suspended load trends at St Francisville and Baton Rouge indicate that floods probably have substantial impacts on suspended loads for longer periods, while negligible impacts for shorter periods.
4.2. Relationship between Bedload and Suspended Load in the LmMR
Our monthly averages of daily bedload rates (Qs) along the LmMR showed linearly increasing trends with monthly averages of daily suspended sediment loads (DSL) and daily suspended sand loads (DSLs) at Tarbert Landing (during the corresponding matching periods: 2004–2010 for Qs–DSL trends and 2004–2013 for Qs–DSLs) and St Francisville (during 2004–2015), respectively (Figure 17 and Figure 18). However, monthly Qs showed more scattered trends with monthly DSL and DSLs respectively at Baton Rouge (during 2004–2015) (Figure 17 and Figure 18). These relationships were noted down for representative grain size of 0.125 mm and were exactly same for other grain sizes of 0.25 and 0.5 mm. The trends of Qs with DSL, DSLs, river discharge and river stage (see Section 3.1 for the latter two) possibly imply that bedload is more dependent on suspended load (specially suspended sand load), river discharge and river stage in upstream river locations with shallower beds, while the dependence gradually decreases as the river moves downstream and the bed elevation increases continuously.
Total and annual bedload rates (Qs) for grain sizes 0.125, 0.25 and 0.5 mm at Tarbert Landing were about 4, 2 and 1% of the suspended sediment load and 18, 9 and 4.5% of the suspended sand load respectively during 2004–2010 (matching period for both loads at Tarbert Landing) (Figure 19). Furthermore, total and annual Qs at St Francisville for the aforementioned grain sizes were respectively about 10, 5 and 2.5% of its suspended sediment load and 53, 26.5 and 13% of its suspended sand load during 2004–2015 (matching period for both loads at St Francisville) (Figure 19). Finally, the total and average annual Qs at Baton Rouge for these grain sizes were approximately 12, 6 and 3% of its suspended sediment load and 50, 25 and 12.5% of its suspended sand load respectively during 2004–2015 (Figure 19). Most of these values were within the ranges of percentage of bedload in suspended sediment (1% to 10%) and suspended sand load (10% to 33%) noted by previous studies ([7,8,9]; see Section 1). However, the only noticeable outliers in this regard were substantially higher percentage of Qs in suspended sand load of St Francisville and Baton Rouge for grain size of 0.125 mm. These higher ranges were likely because of higher bed elevation at these two locations, gradually decreasing grain sizes from upstream to downstream in the LmMR (as explained in first paragraph of Section 4.1) and substantially lower suspended sand loads in both locations as compared to the upstream location at Tarbert Landing (see Section 4.1).
The findings for bedload transport in this study are opposite to the trends found for total suspended load along the LmMR. Apart from the probable reasons listed for corresponding trends in both, the contrasting differences could also be possible because suspended loads were estimated from sediment/sand-water discharge rating curves, while bedload transport rates were quantified using the concept of boundary and critical shear stresses and pre-studied sediment transport equations. Nittrouer et al. [40] found opposite spatial trends in Qs than the findings of this study along the LmMR reach (i.e., gradual increase from Baton Rouge to Tarbert Landing) but only in specific river discharges limited to 11,750 and 17,500 cms. They estimated negligible differences in Qs during high flows throughout the reach (from Tarbert Landing to Baton Rouge). The differences in the Qs estimates of the two studies could be because they considered back water flows in the LmMR which were ignored in this study.
The total sediment supply (bedload + suspended sediment load) for all grain sizes during the overlapping period of 2004–2010 at all locations was highest at Tarbert Landing (931, 911 and 893 MT for grain sizes of 0.125, 0.25, 0.5 respectively), and decreased gradually at two downstream locations along the LmMR (550, 525 and 500 MT at St Francisville and 544, 504 and 485 MT at Baton Rouge for the three aforementioned grain sizes respectively) (Figure 19). Furthermore, for the two locations downstream of Tarbert Landing, the total sediment loads were a little higher at Baton Rouge than St Francisville for the grain sizes of 0.125 and 0.25 mm respectively (904 MT for a grain size of 0.125 mm and 855 MT for 0.25 mm at Baton Rouge as compared to 893 for 0.125 mm and 850 MT for 0.25 mm at St Francisville) during 2004–2015 (the matching period for both locations) (Figure 19). For the remaining grain size of 0.5 mm the total suspended loads were almost equal at both locations during the 12-year period (~830 MT) (Figure 19).
4.3. Sediment Trapping in the LmMR
From this analysis, it seems likely that the first 20–25 km reach of the LmMR just below its diversion to the Atchafalaya River (covering Tarbert Landing) has been a major sediment trapping location over the last four decades. Lower bedload transport along this reach during the last decade suggests that bedloads possibly acted as sources of sand loads near the riverbed because both loads can be intermixed especially in laterally migrating sand dunes under low and medium flows [40,67,68]. However, the sand particles possibly get trapped in the sediment channel bars present along this reach. Wang and Xu [35] noted high three-decadal sediment accumulation in the three sediment bars present at 18, 24 and 26 km downstream of the Old River Control Structure respectively (total sediment load of 36 million tons during 1985–2013). This may have been the primary reason of lower proportion of sand outflow between Tarbert Landing and St Francisville as compared to sediment outflow over the last three and half decades (mean annual SL at Tarbert Landing was 27% higher than St Francisville during 1980–2010, while mean annual SLs was about 20% higher during the same period). The total sediment supply at Tarbert Landing was higher than St Francisville and Baton Rouge during 2004–2010 despite its lower Qs during the same period (Figure 19; Section 4.2). This observation can probably imply that the sediment trapping capacity gradually reduces downstream along the LmMR reach particularly below its uppermost 20–25 km stretch.
The importance of suspended loads for restoration of the MRDP has been previously well documented [32,33,34,69]. Continuous movement of suspended load is critical in long-term delta building and restoration processes [34,70]. Therefore, sediment management in the LmMR should focus on increasing outflow of suspended loads trapped in the uppermost 20–25 km reach to the downstream locations (especially to St Francisville) which can further help in planning and executing sediment diversion projects along the river subsequently. In addition, the bed and suspended load estimates in this study also indicate that significant spatiotemporal variability can occur in sediment supplies from upstream to downstream reaches of highly engineered alluvial rivers on a global scale. Information on long-term sediment supplies along several different sediment-starved rivers can benefit the river management practices.
4.4. Uncertainty and Constraints in Bedload Estimation
The estimation of bedloads (Qs) in this study is one of the few attempts in quantifying daily Qs at multiple sites along a large regulated alluvial river for more than a decade. Most previous studies quantifying Qs along the LmMR have applied measurements of bedform heights using multibeam echosounder surveys in their two or three dimensional models [11,41,71,72]. Since, we did not have such measurements; we only used Engelund-Hansen equation primarily developed for and tested in laboratory conditions. Furthermore, we did not have site-specific bedload measurements like suspended sediment concentrations to validate the estimates of bedload transport rates along the LmMR. This is a main uncertainty in the bedload estimates of this study.
There was a need to estimate annual riverbed elevation and other daily variables such as flow velocity, river width and cross-sectional area at the three sites for quantifying daily Qs from Equation (1). The calculations for all these parameters were subjected to potential errors. Riverbed elevations (Rebed) were only available for 2004 and 2013 at all locations; therefore, Rebed had to be interpolated for the period of 2005–2012 and of 2014–2015. In interpolation, the difference in Rebed for 2004–2013 was only considered as overall increase or decrease, but any specific increase or decrease in Rebed within the years between 2004 and 2013 was ignored. The uncertainty for average flow velocity was dependent on the errors for cross-sectional area. The calculation of daily cross-sectional area was subjected to the potential errors in estimating river width through earth explorer and arc map tools. Also, the daily cross-sectional areas at all locations were probably overestimated because the river channel was considered as rectangle and the cross-sectional areas were measured as a product of river depth and river width. This study could not find a method to measure the cross-sectional area such that it exactly coincided with the half oval shaped riverbed cross-section.
Despite the above-mentioned uncertainties, this study provides plausible estimates of bedload rates that are within previously reported Qs estimation ranges, i.e., 1% to 10% of suspended sediment load, or 10% to 33% of suspended sand load. A ±24% margin of error is given for all Qs estimates (see Section 2.7) to properly document estimation performance.
5. Conclusions
This study analyzed multi-decadal sediment transport along the first 140 kilometers of the Lowermost Mississippi River downstream of its diversion to the Atchafalaya River. The study found that in the past decade, bedload transport rates at Tarbert Landing upstream increased slightly, while the rates at Baton Rouge downstream declined largely. Over the past two decades, both suspended sediment and sand loads were consistently higher at Tarbert Landing than those at St Francisville and Baton Rouge. These results indicate an accumulation of coarser sediments in the uppermost river reach, i.e., 20–25 kilometers below the Old River Control Structure, covering Tarbert Landing. Bedloads seemed to increase with the increasing suspended loads, river discharge and river stage at upstream locations, i.e., at Tarbert Landing and St Francisville; however, such a relationship was not noticeable downstream at Baton Rouge. A clear decreasing trend in annual suspended loads was identified at St Francisville after the 1993 major flood, showing that floods play an important role in longer-term sediment transport. This study implies that substantial spatiotemporal variability can exist in sediment transport of a large alluvial river, and that future sediment management in the Lowermost Mississippi River should find solutions for mobilizing coarse sediments trapped in the studied river reach (i.e., the uppermost 140 kilometers of LmMR from Tarbert Landing to Baton Rouge) to the river reach below Baton Rouge for coastal restoration and new land building.
Acknowledgments
This study was financially supported through a National Science Foundation (NSF)—Coupled Natural Human Dynamics project (award number: 1212112). The study also benefited from a U.S. Department of Agriculture Hatch Fund project (project number: LAB94230). The statements, findings, and conclusions are those of the authors and do not necessarily reflect the views of the funding agencies The authors also acknowledge the United States Army Corps of Engineers and the United States Geological Survey for making the bathymetric surveys, the long-term river discharge, stage and sediment data and the Landsat 7 images along the Lowermost Mississippi River available for this study. We also thank Bo Wang for his assistance with satellite image assessment. We further gratefully acknowledge Paul Bell for his thorough language edits and two anonymous reviewers for their critical reviews in an earlier draft of the manuscript.
Author Contributions
Y.J.X. conceived and designed the study; S.J. performed data analysis and wrote the first draft of the manuscript; both authors revised and proofread the manuscript for publication.
Conflicts of Interest
The authors declare no conflict of interest.
References
- Walling, D.E.; Fang, D. Recent trends in the suspended sediment loads of the world’s rivers. Glob. Planet. Chang. 2003, 39, 111–126. [Google Scholar] [CrossRef]
- Vörösmarty, C.; Lettenmaier, D.; Leveque, C.; Meybeck, M.; Pahl-Wostl, C.; Alcamo, J.; Cosgrove, W.; Grassal, H.; Hoff, H.; Kabat, P.; et al. Humans transforming the global water system. Eos Trans. 2004, 85, 509–514. [Google Scholar] [CrossRef]
- Syvitski, J.P.M.; Saito, Y. Morphodynamics of deltas under the influence of humans. Glob. Planet. Chang. 2007, 57, 261–282. [Google Scholar] [CrossRef]
- Meade, R.H.; Parker, R.S. Sediment in rivers of the United States. Natl. Water Summ. USGS Water Suppl. Pap. 1985, 2275, 49–60. [Google Scholar]
- Yang, S.L.; Belkin, I.M.; Belkina, A.I.; Zhao, Q.Y.; Zhu, J.; Ding, P.X. Delta response to decline in sediment supply from the Yangtze River: Evidence of the recent four decades and expectations for the next half-century. Estuar. Coast. Shelf Sci. 2003, 57, 689–699. [Google Scholar] [CrossRef]
- Meade, R.H.; Moody, J.A. Causes for the decline of suspended-sediment discharge in the Mississippi River system, 1940–2007. Hydrol. Process. 2010, 24, 35–49. [Google Scholar] [CrossRef]
- Gomez, B. Bedload transport. Earth-Sci. Rev. 1991, 31, 89–132. [Google Scholar] [CrossRef]
- Kesel, R.H.; Yodis, E.G.; McCraw, D.J. An approximation of the sediment budget of the lower Mississippi River prior to major human modification. Earth Surf. Process. Landf. 1992, 17, 711–722. [Google Scholar] [CrossRef]
- Church, M. Bed material transport and the morphology of alluvial river channels. Annu. Rev. Earth Planet. Sci. 2006, 34, 325–354. [Google Scholar] [CrossRef]
- Holmes, R.R., Jr. Measurement of Bedload Transport in Sand-Bed Rivers: A Look at Two Indirect Sampling Methods; Bedload-surrogate Monitoring Technologies, USGS Scientific Investigations Report 5091; Gray, J.R., Laronne, J.B., Marr, J.D.G., Eds.; U.S. Geological Survey: Rolla, MO, USA, 2010; pp. 236–252.
- Nittrouer, J.A.; Allison, M.A.; Campanella, R. Bedform transport rates for the lowermost Mississippi River. J. Geophys. Res. Earth Surf. 2008, 113, F03004. [Google Scholar] [CrossRef]
- Leopold, L.B.; Emmett, W.W. Bedload and River Hydraulics—Inferences from the East Fork River, Wyoming; Professional Paper; USGS: Rolla, MO, USA, 1997; Volume 1583, p. 64.
- Southard, J. Introduction to Fluid Motions, Sediment Transport, and Current-Generated Sedimentary Structures; Course Textbook, MIT Open Courseware; Massachusetts Institute of Technology: Cambridge, MA, USA, 2012. [Google Scholar]
- Montgomery, D.R.; Buffington, J.M. Channel-reach morphology in mountain drainage basins. Geol. Soc. Am. Bull. 1997, 109, 596–611. [Google Scholar] [CrossRef]
- Parker, G.; Wilcock, P.R.; Paola, C.; Dietrich, W.E.; Pitlick, J. Physical basis for quasi-universal relations describing bankfull hydraulic geometry of single-thread gravel bed rivers. J. Geophys. Res. 2007, 112, F04005. [Google Scholar] [CrossRef]
- Turowski, J.M.; Rickenmann, D.; Dadson, S.J. The partitioning of the total sediment load of a river into suspended load and bedload: A review of empirical data. Sedimentology 2010, 57, 1126–1146. [Google Scholar] [CrossRef]
- Holeman, J.N. The sediment yield of major rivers of the world. Water Resour. Res. 1968, 4, 737–747. [Google Scholar] [CrossRef]
- Milliman, J.D.; Meade, R.H. World-wide delivery of river sediment to the oceans. J. Geol. 1983, 91, 1–2. [Google Scholar] [CrossRef]
- Milliman, J.D.; Syvitski, J.P.M. Geomorphic/tectonic control of sediment discharge to the ocean: The importance of small mountainous rivers. J. Geol. 1992, 100, 525–544. [Google Scholar] [CrossRef]
- Hindall, S.M. Measurement and Prediction of Sediment Yields in Wisconsin Streams; USGS Water Resources Investigation: Rolla, MO, USA, 1976; pp. 54–75.
- Griffiths, G.A.; McSaveney, M.J. Sedimentation and river containment on Waitangitaona alluvial fan—South Westland, New Zealand. Z. Für Geomorphol. 1986, 30, 215–230. [Google Scholar]
- Whipple, K.X.; Tucker, G.E. Implications of sediment-flux-dependent river incision models for landscape evolution. J. Geophys. Res. 2002, 107(B2), 2039. [Google Scholar] [CrossRef]
- Maddock, T.; Borland, W.M. Sedimentation Studies for the Planning of Reservoirs by the Bureau of Reclamation; Technical Report; United States Department of the Interior, Bureau of Reclamation, Branch of Project Planning: Washington, DC, USA, 1950; p. 44.
- Lane, E.W.; Borland, W.M. Estimating bed load. Eos Trans. Am. Geophys. Union 1951, 32, 121–123. [Google Scholar] [CrossRef]
- Craig, N.J.; Turner, R.E.; Day, J.W. Land loss in coastal Louisiana (USA). Environ. Manag. 1979, 3, 133–144. [Google Scholar] [CrossRef]
- Gagliano, S.M.; Meyer-Arendt, K.J.; Wicker, K.M. Land loss in the Mississippi River Deltaic Plain. Trans. Gulf Coast Assoc. Geol. Soc. 1981, 20, 295–300. [Google Scholar]
- Couvillion, B.R.; Barras, J.A.; Steyer, G.D.; Sleavin, W.; Fischer, M.; Beck, H.; Nadine, T.; Griffin, B.; Heckman, D. Land Area Change in Coastal Louisiana from 1932 to 2010; USGS Scientific Investigations Map 3164, Scale 1:265,000; United States Geological Survey: Reston, VA, USA, 2011; p. 12.
- Rosen, T.; Xu, Y.J. A hydrograph-based sediment availability assessment: Implications for Mississippi River sediment diversion. Water 2014, 6, 564–583. [Google Scholar] [CrossRef]
- Horowitz, A.J. A quarter century of declining suspended sediment fluxes in the Mississippi River and the effect of the 1993 flood. Hydrol. Process. 2010, 24, 13–34. [Google Scholar] [CrossRef]
- Nittrouer, J.A.; Viparelli, E. Sand as a stable and sustainable resource for nourishing the Mississippi River delta. Nat. Geosci. 2014, 7, 350–354. [Google Scholar] [CrossRef]
- Joshi, S.; Xu, Y.J. Assessment of Suspended Sand Availability under Different Flow Conditions of the Lowermost Mississippi River at Tarbert Landing during 1973–2013. Water 2015, 7, 7022–7044. [Google Scholar] [CrossRef]
- Roberts, H.H. Dynamic changes of the Holocene Mississippi River Delta plain: The delta cycle. J. Coast. Res. 1997, 13, 605–627. [Google Scholar]
- Coleman, J.M.; Roberts, H.H.; Stone, G.W. Mississippi River delta: An overview. J. Coast. Res. 1998, 14, 699–716. [Google Scholar]
- Roberts, H.H.; Coleman, J.M.; Bentley, S.J.; Walker, N. An embryonic major delta lobe: A new generation of delta studies in the Atchafalaya-Wax Lake Delta system. Gulf Coast Assoc. Geol. Soc. Trans. 2003, 53, 690–703. [Google Scholar]
- Wang, B.; Xu, Y.J. Long-term geomorphic response to flow regulation in a 10-km reach downstream of the Mississippi–Atchafalaya River diversion. J. Hydrol. Reg. Stud. 2016, 8, 10–25. [Google Scholar] [CrossRef]
- Joshi, S.; Xu, J.Y. Recent changes in channel morphology of a highly engineered alluvial river—The Lower Mississippi River. Phys. Geogr. 2017, 1–26. [Google Scholar] [CrossRef]
- Allison, M.A.; Meselhe, E.A. The use of large water and sediment diversions in the lower Mississippi River (Louisiana) for coastal restoration. J. Hydrol. 2010, 387, 346–360. [Google Scholar] [CrossRef]
- Allison, M.A.; Demas, C.R.; Ebersole, B.A.; Kleiss, B.A.; Little, C.D.; Meselhe, E.A.; Powell, N.J.; Pratt, T.C.; Vosburg, B.M. A water and sediment budget for the lower Mississippi-Atchafalaya River in flood years 2008–2010: Implications for sediment discharge to the oceans and coastal restoration in Louisiana. J. Hydrol. 2012, 432, 84–97. [Google Scholar] [CrossRef]
- Pereira, J.F.; McCorquodale, J.A.; Meselhe, E.A.; Georgiou, I.Y.; Allison, M.A. Numerical simulation of bed material transport in the Lower Mississippi River. J. Coast. Res. 2009, 56, 1449. [Google Scholar]
- Nittrouer, J.A.; Shaw, J.; Lamb, M.P.; Mohrig, D. Spatial and temporal trends for water-flow velocity and bed-material sediment transport in the lower Mississippi River. Geol. Soc. Am. Bull. 2011, 124, 400–414. [Google Scholar] [CrossRef]
- Knox, R.L.; Latrubesse, E.M. A geomorphic approach to the analysis of bedload and bed morphology of the Lower Mississippi River near the Old River Control Structure. Geomorphology 2016, 268, 35–47. [Google Scholar] [CrossRef]
- Coastal Protection and Restoration Authority of Louisiana (CPRA). Louisiana’s Comprehensive Master Plan for a Sustainable Coast; Coastal Protection and Restoration Authority of Louisiana: Baton Rouge, LA, USA, 2012; p. 234.
- Dean, R.G.; Wells, J.T.; Fernando, H.; Goodwin, P. Sediment Diversions on the Lower Mississippi River: Insight from Simple Analytical Models. J. Coast. Res. 2013, 30, 13–29. [Google Scholar] [CrossRef]
- Beverage, J.P. Determining true depth of samplers suspended in deep, swift rivers. In A Study of Methods and Measurement Analysis of Sediment Loads in Streams; Report GG; Federal Interagency Sedimentation Project: Minneapolis, MN, USA, 1987; pp. 1–56. [Google Scholar]
- Edwards, T.K.; Glysson, G.D. Field methods for measurement of fluvial sediment. In Techniques of Water-Resources Investigations; U.S. Geological Survey: Reston, VA, USA, 1999; Book 3, Chapter C2; pp. 1–87. [Google Scholar]
- Skinner, J. A Spreadsheet Analysis of Suspended Sediment Sampling Errors. In Federal Interagency Sedimentation Project, Waterways Experiment Station; Report TT; Waterways Experiment Station: Vicksburg, MS, USA, 2007; pp. 1–16. [Google Scholar]
- Engelund, F.; Hansen, E. A Monograph on Sediment Transport in Alluvial Streams; Technisk Vorlag: Copehagen, Denmark, 1967; p. 62. [Google Scholar]
- Engelund, F.; Fredsøe, J. A Sediment Transport Model for Straight Alluvial Channels. Hydrol. Res. 1976, 7, 293. [Google Scholar]
- Van Rijn, L.C. Sediment transport, part I: Bed load transport. J. Hydraul. Eng. 1984, 110, 1431–1456. [Google Scholar] [CrossRef]
- Bates, P.D.; Lane, S.N.; Ferguson, R.I. Computational Fluid Dynamics: Applications in Environmental Hydraulics; John Wiley & Sons: Hoboken, NJ, USA, 2005; p. 540. [Google Scholar]
- Bagnold, R.A. An Approach to the Sediment Transport Problem from General Physics; Professional Paper 422-1; USGS: Rolla, MO, USA, 1966; p. 37.
- Stevens, H.H., Jr.; Yang, C.T. Summary and Use of Selected Fluvial Sediment-Discharge Formulas; USGS Water-Resources Investigations Report 89-4026; USGS: Rolla, MO, USA, 1989; p. 125.
- Nordin, C.F.; Queen, B.S. Particle Size Distribution of Bed Sediments along the Thalweg of the Mississippi River, Cairo, Illinois, to Head of Passes; USACE Waterways Experiment Station, Vicksburg, Mississippi, Potamology Program (P-1) Report 7; USGS: Rolla, MO, USA, 1992; p. 95.
- Gray, A.B.; Pasternack, G.B.; Watson, E.B.; Warrick, J.A.; Goni, M.A. Effects of antecedent hydrologic conditions, time dependence, and climate cycles on the suspended sediment load of the Salinas River, California. J. Hydrol. 2015, 525, 632–649. [Google Scholar] [CrossRef]
- Duan, N. Smearing estimate—A nonparametric retransformation method. J. Am. Stat. Assoc. 1983, 78, 605–610. [Google Scholar] [CrossRef]
- Sykes, A.O. An Introduction to Regression Analysis; Coase-Sandor Institute for Law & Economics Working Paper No. 20; University of Chicago Law School: Chicago, IL, USA, 1993; pp. 1–33. [Google Scholar]
- Phillips, J.M.; Webb, B.W.; Walling, D.E.; Leeks, G.J.L. Estimating the suspended sediment loads of rivers in the LOIS study area using infrequent samples. Hydrol. Process. 1999, 13, 1035–1050. [Google Scholar] [CrossRef]
- Demas, C.R.; Curwick, P.B. Suspended-Sediment, Bottom Material, and Associated-Chemical Data from the Lower Mississippi River, Louisiana; Water Resources Basic Records Report No. 14; Louisiana Department of Transportation and Development: Baton Rouge, LA, USA, 1987; p. 117.
- Lepold, L.B.; Wolman, M.G. River Channel Patterns: Braided, Meandering and Straight; Professional Paper. 282-B; USGS: Rolla, MO, USA, 1957; pp. 39–85.
- Leopold, L.B.; Wolman, M.G. Rivers and River Terraces; Dury, G.H., Ed.; Palgrave Macmillan: London, UK, 1970; pp. 197–237. [Google Scholar]
- Copeland, R.R.; Thomas, W.A. Lower Mississippi River Tarbert Landing to East Jetty Sedimentation Study, Numerical Model Investigation; Technical Report HL-92-6; Department of the Army Waterways Experiment Station, Corps of Engineers: Vicksburg, MS, USA, 1992; p. 106. [Google Scholar]
- Wang, B.; Xu, Y.J. Sediment Trapping by Emerged Channel Bars in the Lowermost Mississippi River during a Major Flood. Water 2015, 7, 6079–6096. [Google Scholar] [CrossRef]
- Benedetti, M.M. Controls on overbank deposition in the Upper Mississippi River. Geomorphology 2003, 56, 271–290. [Google Scholar] [CrossRef]
- Gomez, B.; Mertes, L.A.K.; Phillips, J.D.; Magilligan, F.J.; James, L.A. Sediment characteristics of an extreme flood: 1993 upper Mississippi River valley. Geology 1995, 23, 963–966. [Google Scholar] [CrossRef]
- Gomez, B.; Phillips, J.D.; Magilligan, F.J.; James, L.A. Floodplain sedimentation and sensitivity: Summer 1993 flood, Upper Mississippi River Valley. Earth Surf. Process. Landf. 1997, 22, 923–936. [Google Scholar] [CrossRef]
- Horowitz, A.J. The effect of the “Great Flood of 1993” on subsequent suspended sediment concentrations and fluxes in the Mississippi River Basin, USA. IAHS Pub. 2006, 306, 110–119. [Google Scholar]
- Nittrouer, J.A.; Mohrig, D.; Allison, M. Punctuated sand transport in the lowermost Mississippi River. J. Geophys. Res. 2011, 116, F04025. [Google Scholar] [CrossRef]
- Ramirez, M.T.; Allison, M.A. Suspension of bed material over sand bars in the Lower Mississippi River and its implications for Mississippi delta environmental restoration. J. Geophys. Res. Earth Surf. 2013, 118, 1085–1104. [Google Scholar] [CrossRef]
- Blum, M.D.; Roberts, H.H. Drowning of the Mississippi Delta due to insufficient sediment supply and global sea-level rise. Nat. Geosci. 2009, 2, 488–491. [Google Scholar] [CrossRef]
- Paola, C.; Twilley, R.R.; Edmonds, D.A.; Kim, W.; Mohrig, D.; Parker, G.; Viparelli, E.; Voller, V.R. Natural processes in delta restoration: Application to the Mississippi Delta. Annu. Rev. Mar. Sci. 2011, 3, 67–91. [Google Scholar] [CrossRef] [PubMed]
- Abraham, D.; Pratt, T.; Sharp, J. Measuring Bedload Transport on the Missouri RiverUsing Time Sequenced Bathymetric Data. In Proceedings of the 2nd Joint Federal Interagency Conference, Las Vegas, NV, USA, 27 June 2010; p. 9. [Google Scholar]
- Abraham, D.; Kuhnle, R.A.; Odgaard, A.J. Validation of bed-load transport measurements with time-sequenced bathymetric data. J. Hydraul. Eng. 2011, 137, 723–728. [Google Scholar] [CrossRef]
Figure 1.
The Lowermost Mississippi River (LmMR) and three locations used in this study to analyze bedload and suspended load below the Old River Control Structure (ORCS): (1) Tarbert Landing (TBL) at river kilometer (or rk) 493, (2) St Francisville (St F) at rk 419, and (3) Baton Rouge (BTR) at rk 367.5. The Red River Landing (RRL) (at rk 486.5) just below TBL consists of long term river stage records from USGS gauge present at the site. Also, Bayou Sara (BS) (at rk 427) (about 9 rk above St F) is the nearest reference station for long term river stage at St F. The Bonnet Carre Spillway (BCS) is about 19 rk upstream of New Orleans.

Figure 2.
Screenshot of the Landsat 7 Satellite image for Tarbert Landing of the Lowermost Mississippi River. The image was collected in .tiff format using the USGS Earth Explorer tool. The red horizontal line represents the river width of the LmMR at Tarbert Landing on the date of imagery. The image was directly opened in Arc Map 10.2 and then the river width was measured using the ‘Measure’ tool. The same procedure was followed for measuring river width at Tarbert Landing, St Francisville and Baton Rouge for, respectively, 55, 37 and 42 days during 2004–2015.
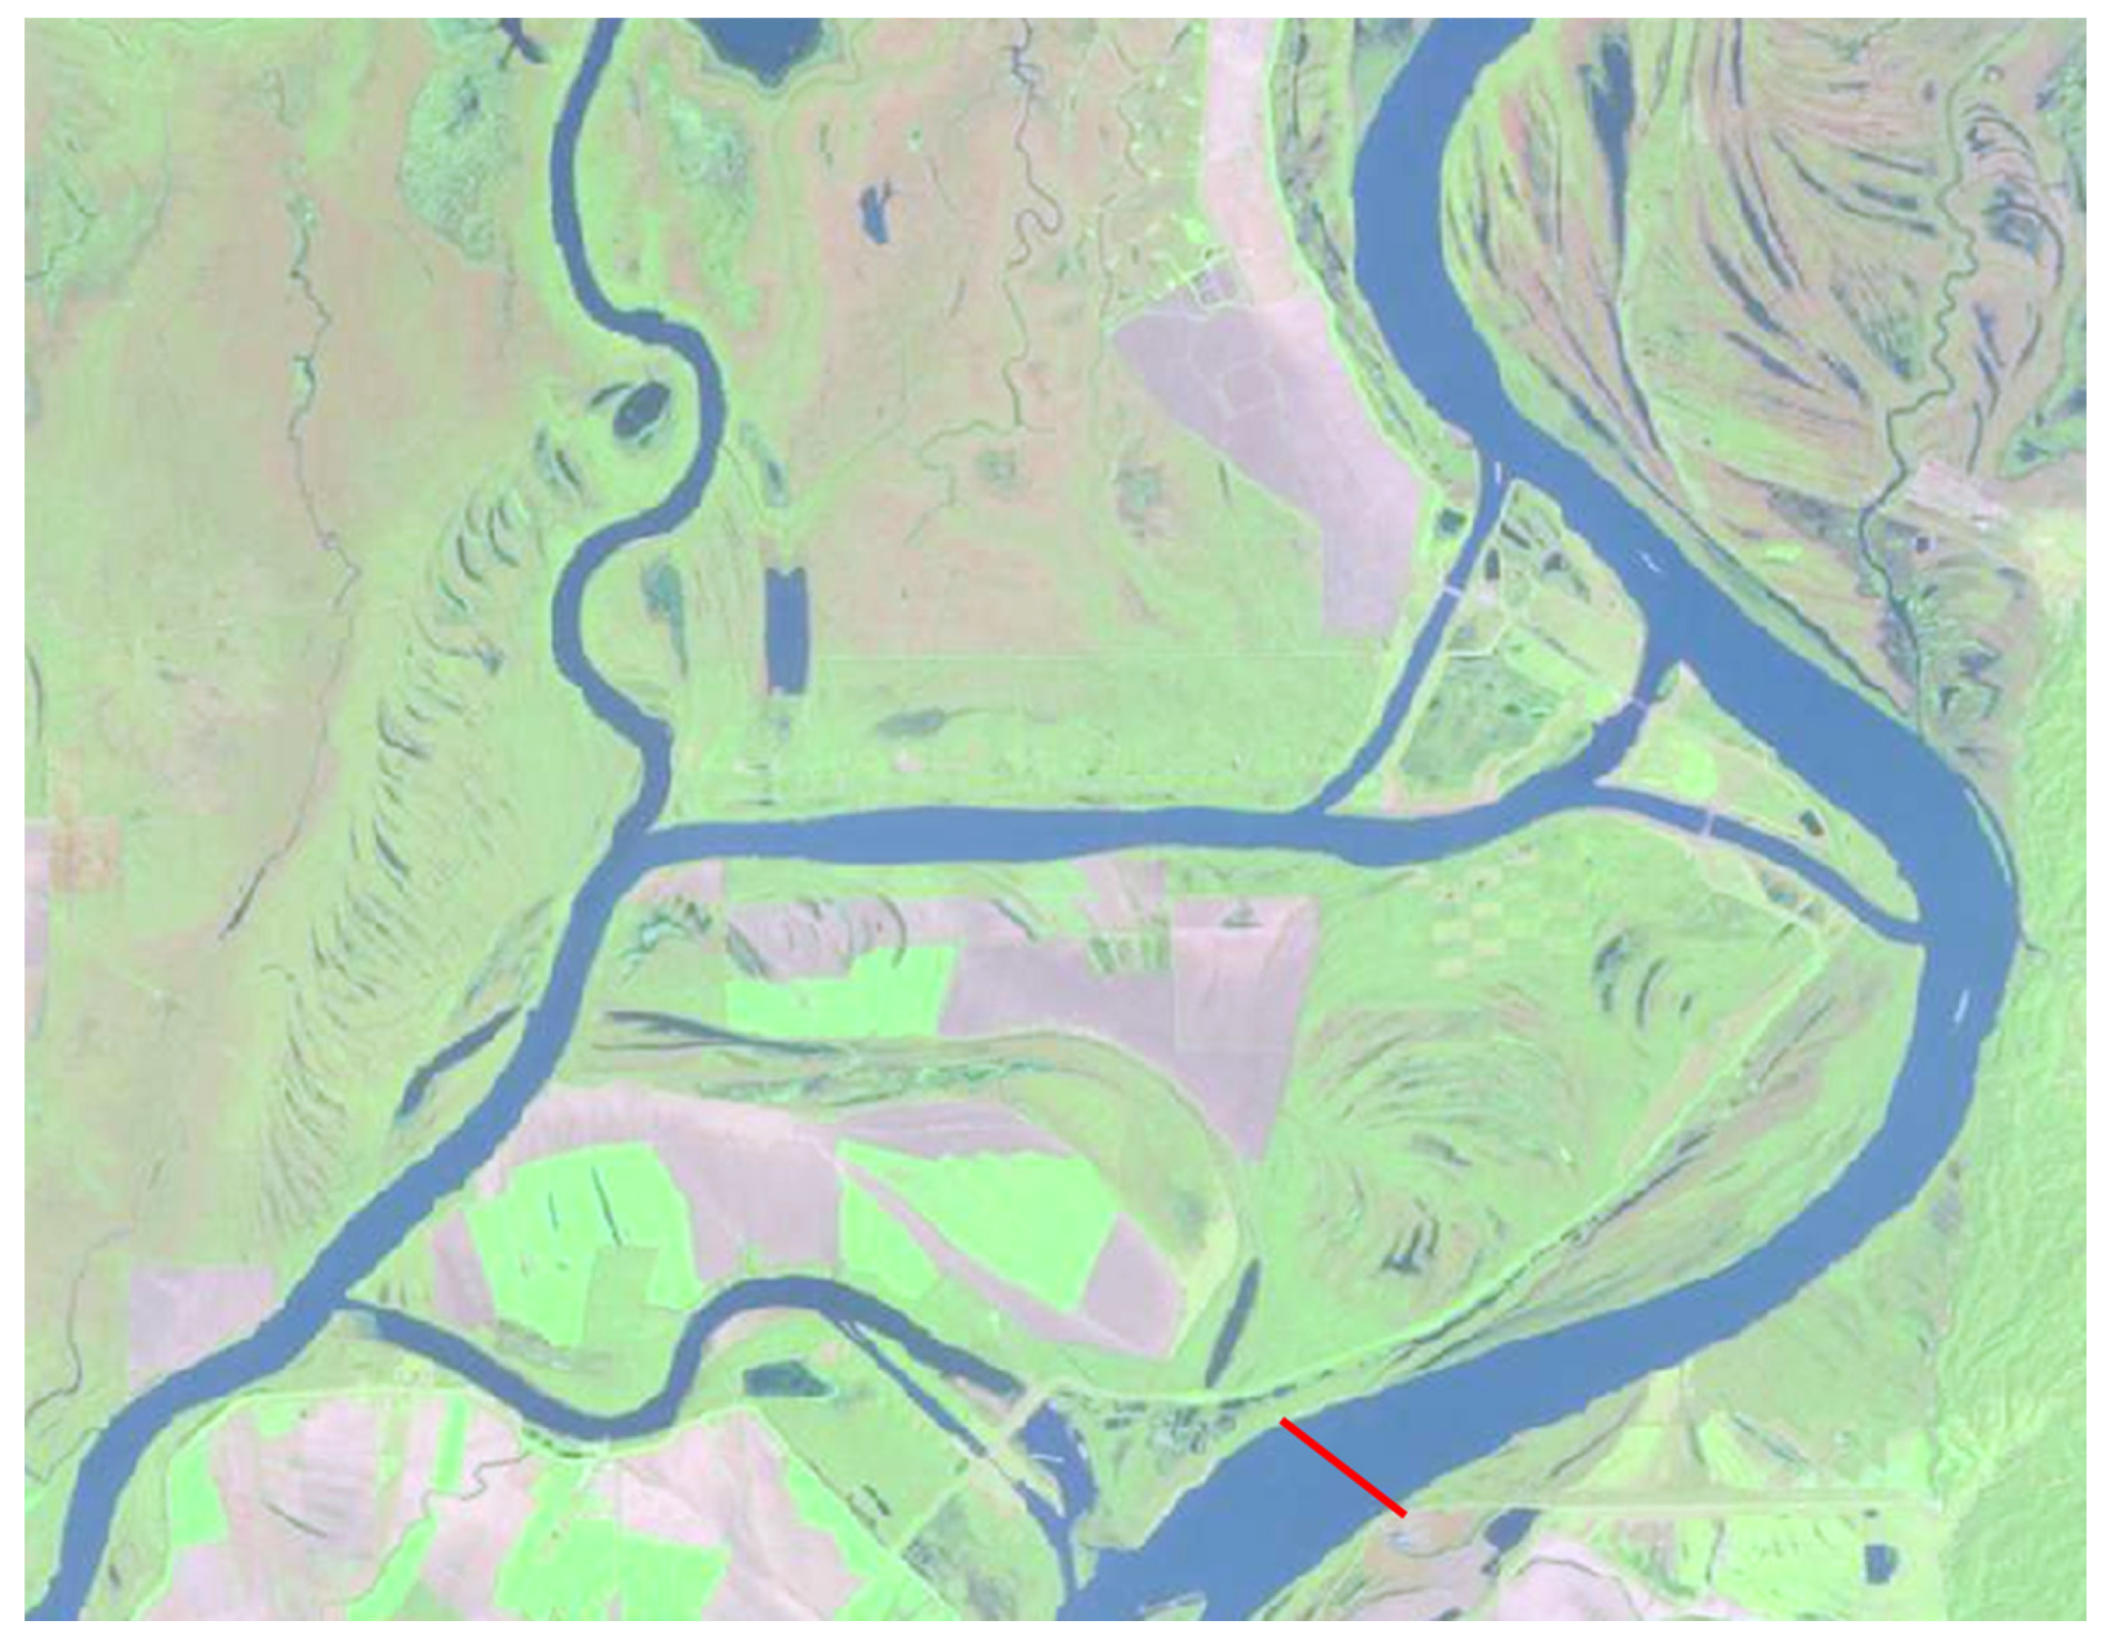
Figure 7.
Annual bedload transport rates (Qs) at Tarbert Landing of the Lowermost Mississippi River. Note: A, B and C represent the transport rates for representative grain size (D50) of 0.125, 0.25 and 0.5 mm respectively as selected for this analysis (please see Section 2.4.5).
Figure 7.
Annual bedload transport rates (Qs) at Tarbert Landing of the Lowermost Mississippi River. Note: A, B and C represent the transport rates for representative grain size (D50) of 0.125, 0.25 and 0.5 mm respectively as selected for this analysis (please see Section 2.4.5).
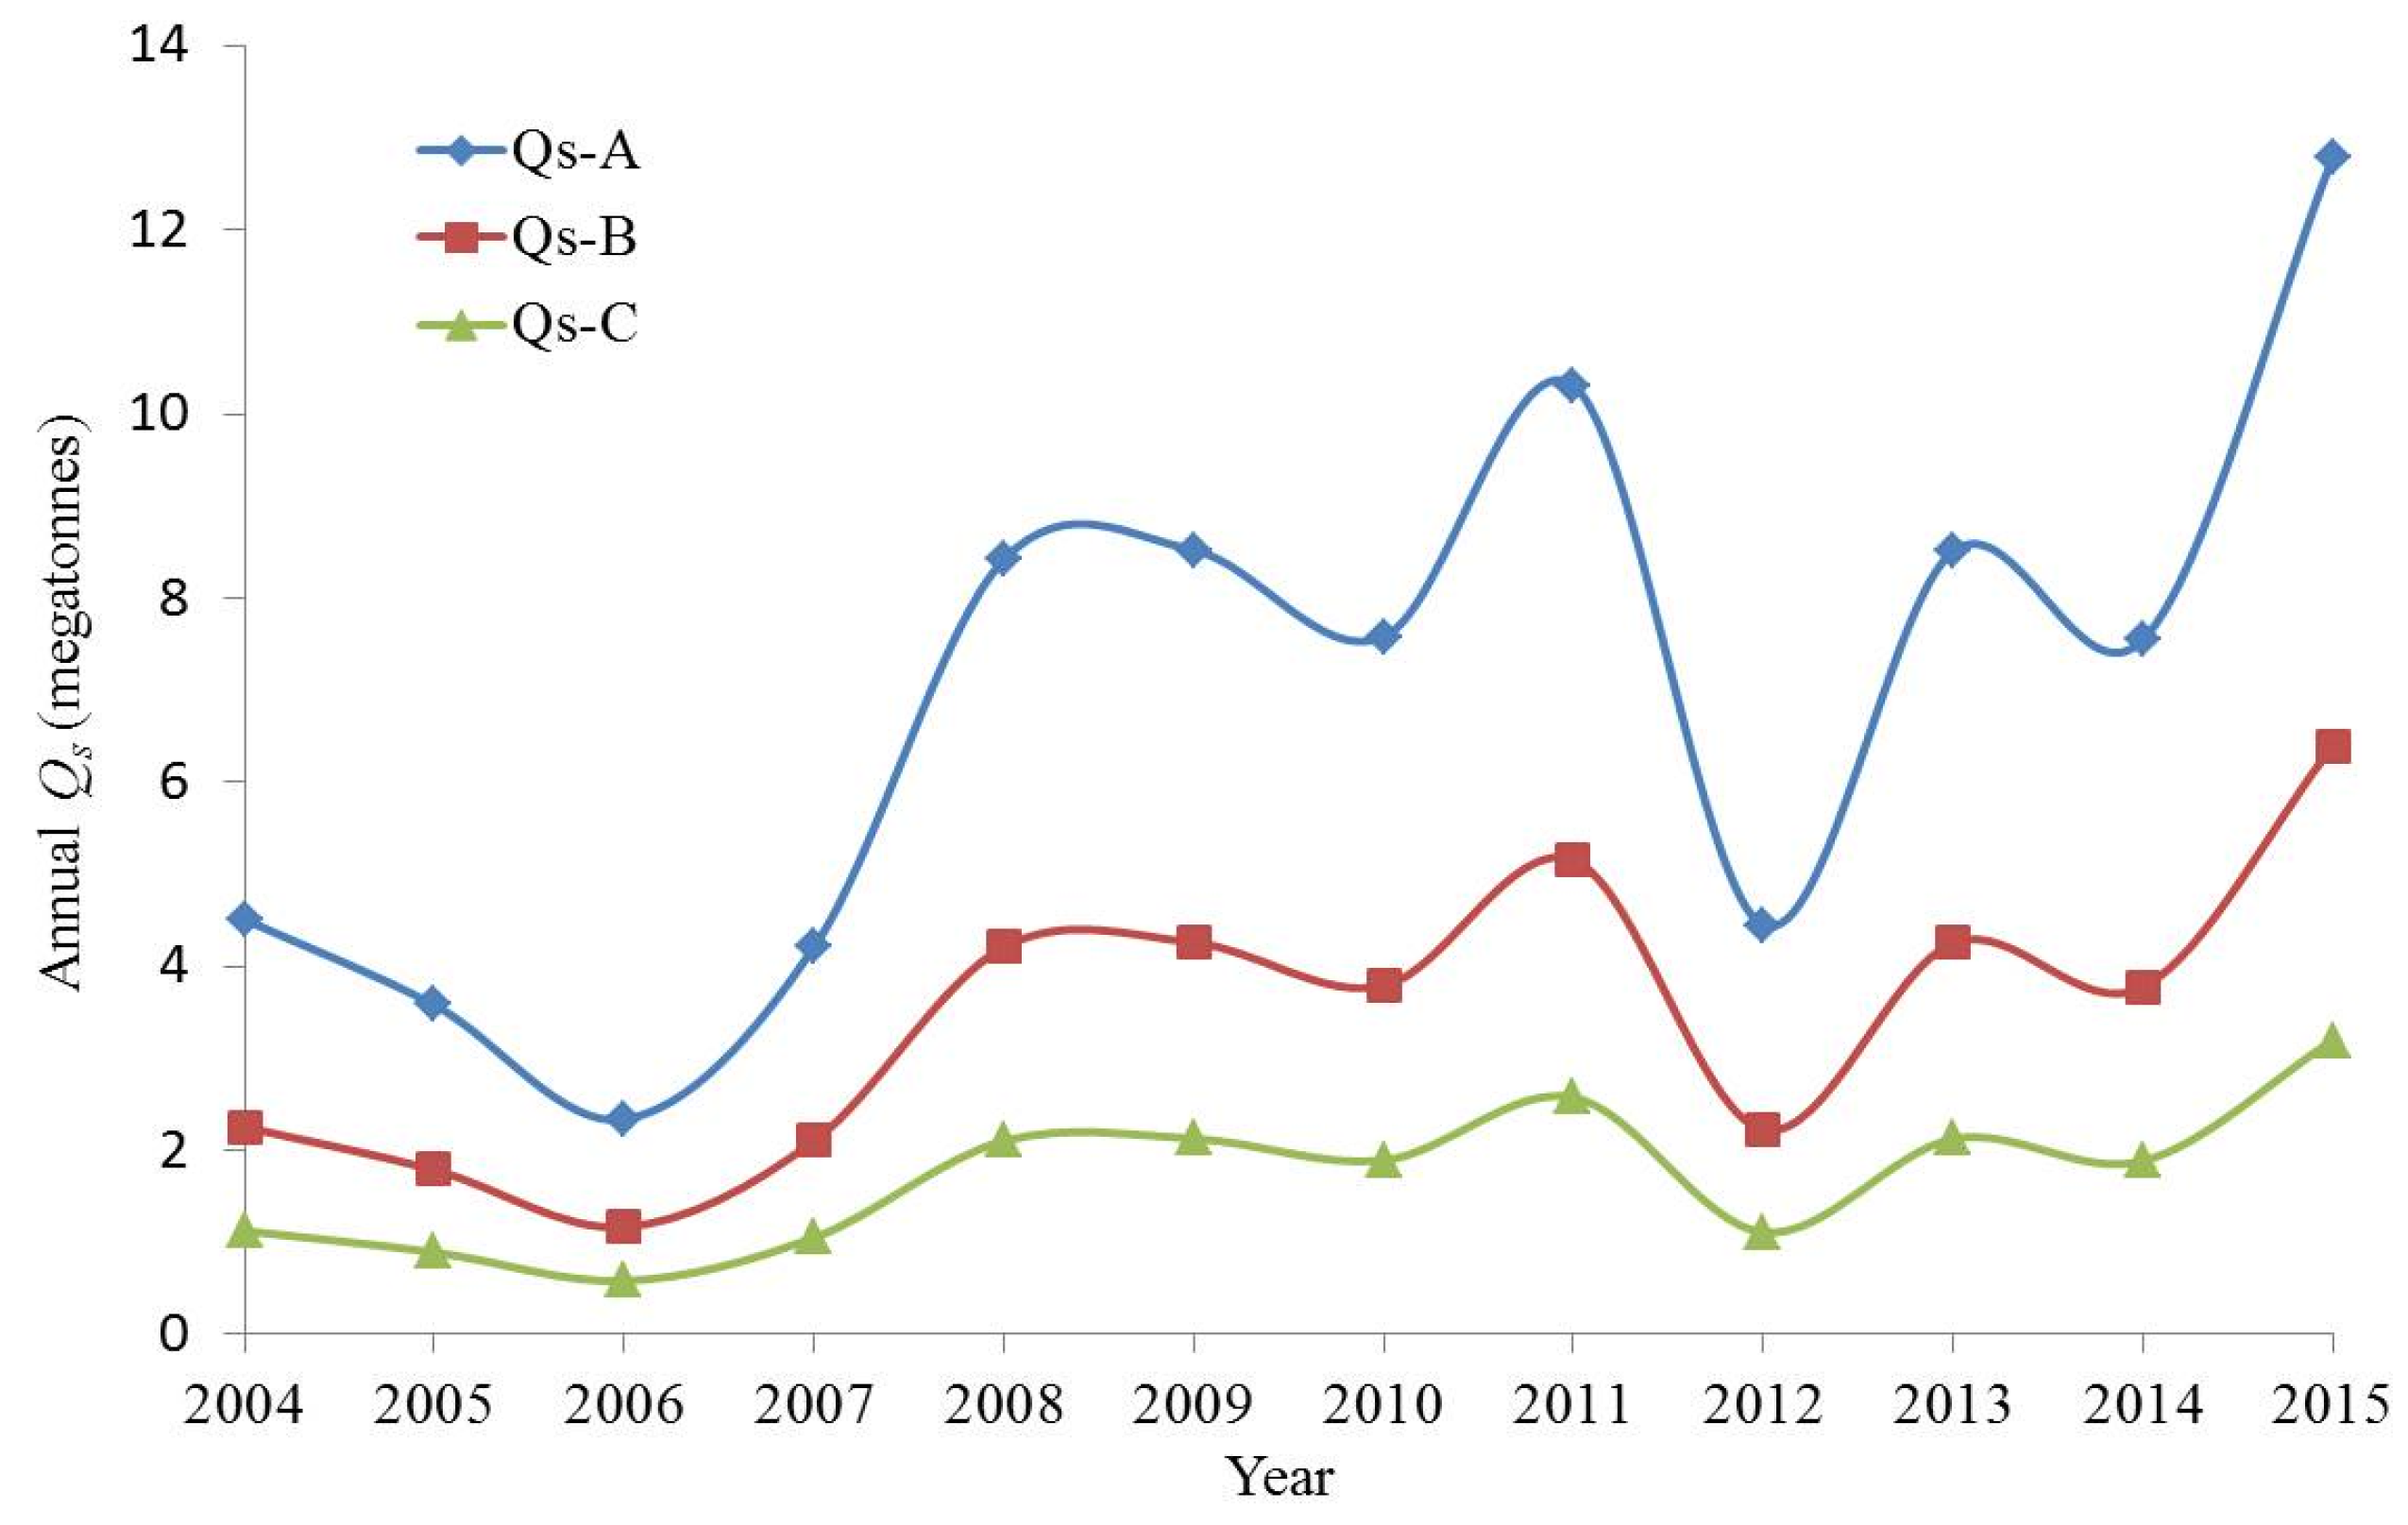
Figure 8.
Annual bedload transport rates (Qs) at St Francisville of the Lowermost Mississippi River. Note: A, B and C represent the transport rates for representative grain size (D50) of 0.125, 0.25 and 0.5 mm respectively as selected for this analysis (please see Section 2.4.5).
Figure 8.
Annual bedload transport rates (Qs) at St Francisville of the Lowermost Mississippi River. Note: A, B and C represent the transport rates for representative grain size (D50) of 0.125, 0.25 and 0.5 mm respectively as selected for this analysis (please see Section 2.4.5).
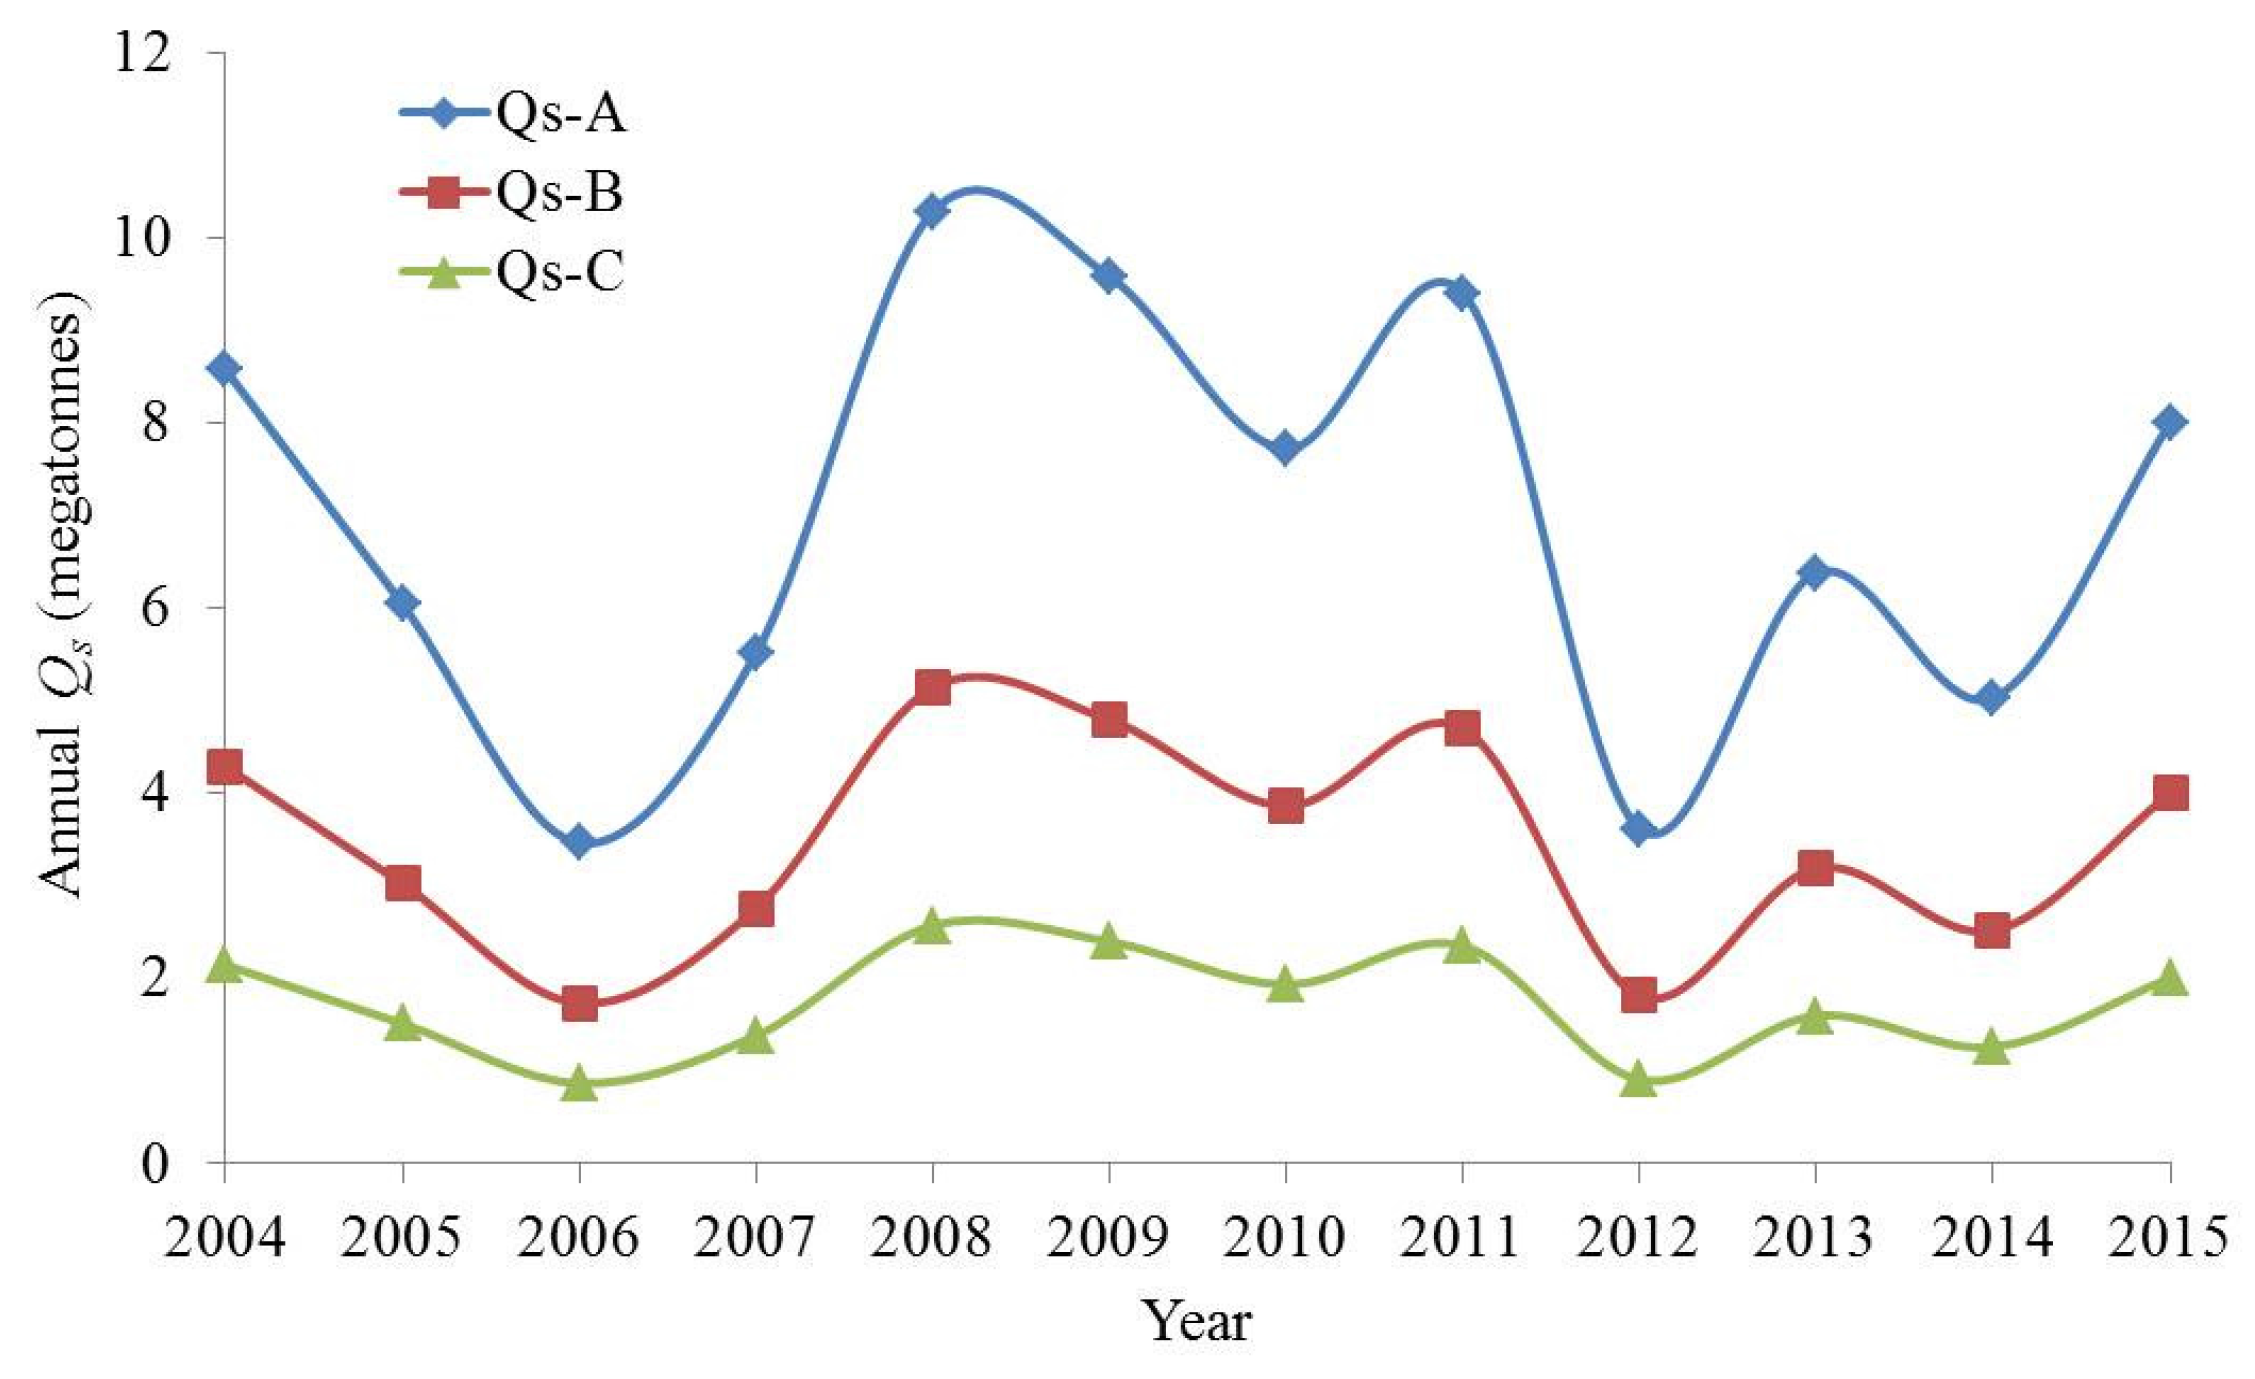
Figure 9.
Annual bedload transport rates (Qs) at Baton Rouge of the Lowermost Mississippi River. Note: A, B and C represent the transport rates for representative grain size (D50) of 0.125, 0.25 and 0.5 mm respectively as selected for this analysis (please see Section 2.4.5).
Figure 9.
Annual bedload transport rates (Qs) at Baton Rouge of the Lowermost Mississippi River. Note: A, B and C represent the transport rates for representative grain size (D50) of 0.125, 0.25 and 0.5 mm respectively as selected for this analysis (please see Section 2.4.5).
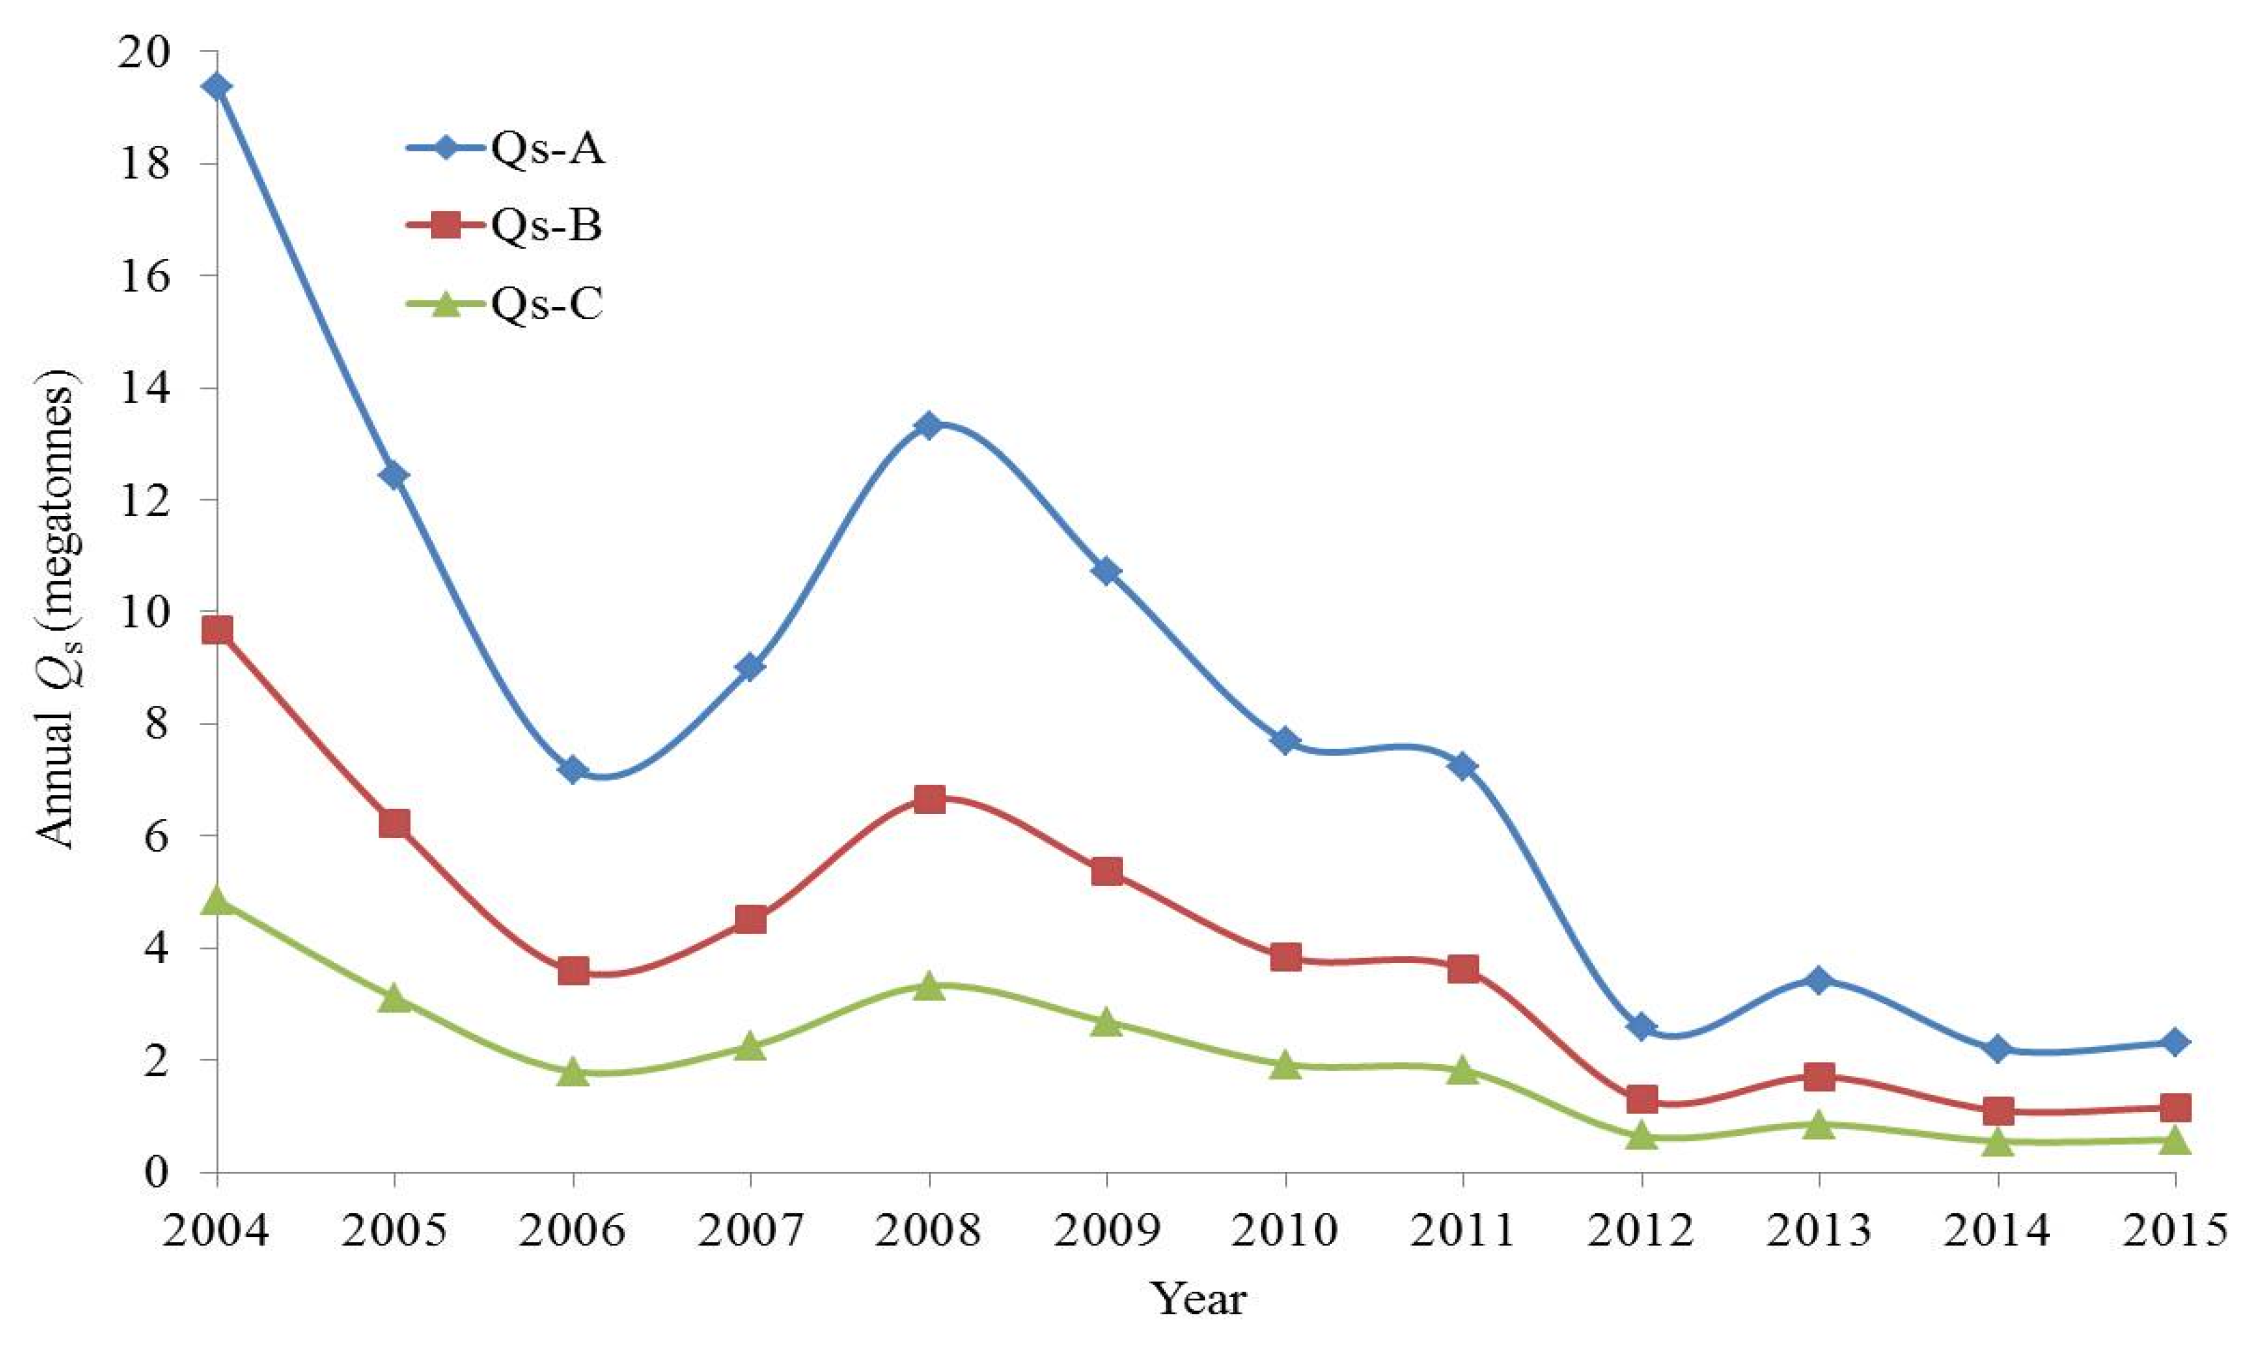
Figure 10.
Annual bedload transport rates (Qs) at Tarbert Landing (TBL), St Francisville (St F), and Baton Rouge (BTR) of the Lowermost Mississippi River for a grain size (D50) of 0.125 mm. Note: Annual Qs for grain size of 0.25 mm were exactly half of annual Qs for grain size of 0.125 mm, while annual Qs for grain size of 0.5 mm were exactly half of annual Qs for grain size of 0.25 mm at all stations. Therefore, annual Qs for grain sizes of 0.25 and 0.5 mm had similar trends as annual Qs for grain size of 0.125 mm at all locations.

Figure 11.
Relationship of monthly average of daily discharge (Qd in cms) with the monthly average of daily bedload transport rates (Qs in tons/day) for representative grain-size of 0.125 mm (A) at Tarbert Landing (TBL), St Francisville (St F) and Baton Rouge (BTR) of the Lowermost Mississippi River during 2004–2015.

Figure 12.
Relationship of monthly average of daily river stages (RSd in m) with the monthly average of daily bedload transport rates (Qs in tons/day) for representative grain-size of 0.125 mm (A) at Tarbert Landing (TBL), St Francisville (St F), and Baton Rouge (BTR) of the Lowermost Mississippi River during 2004–2015.
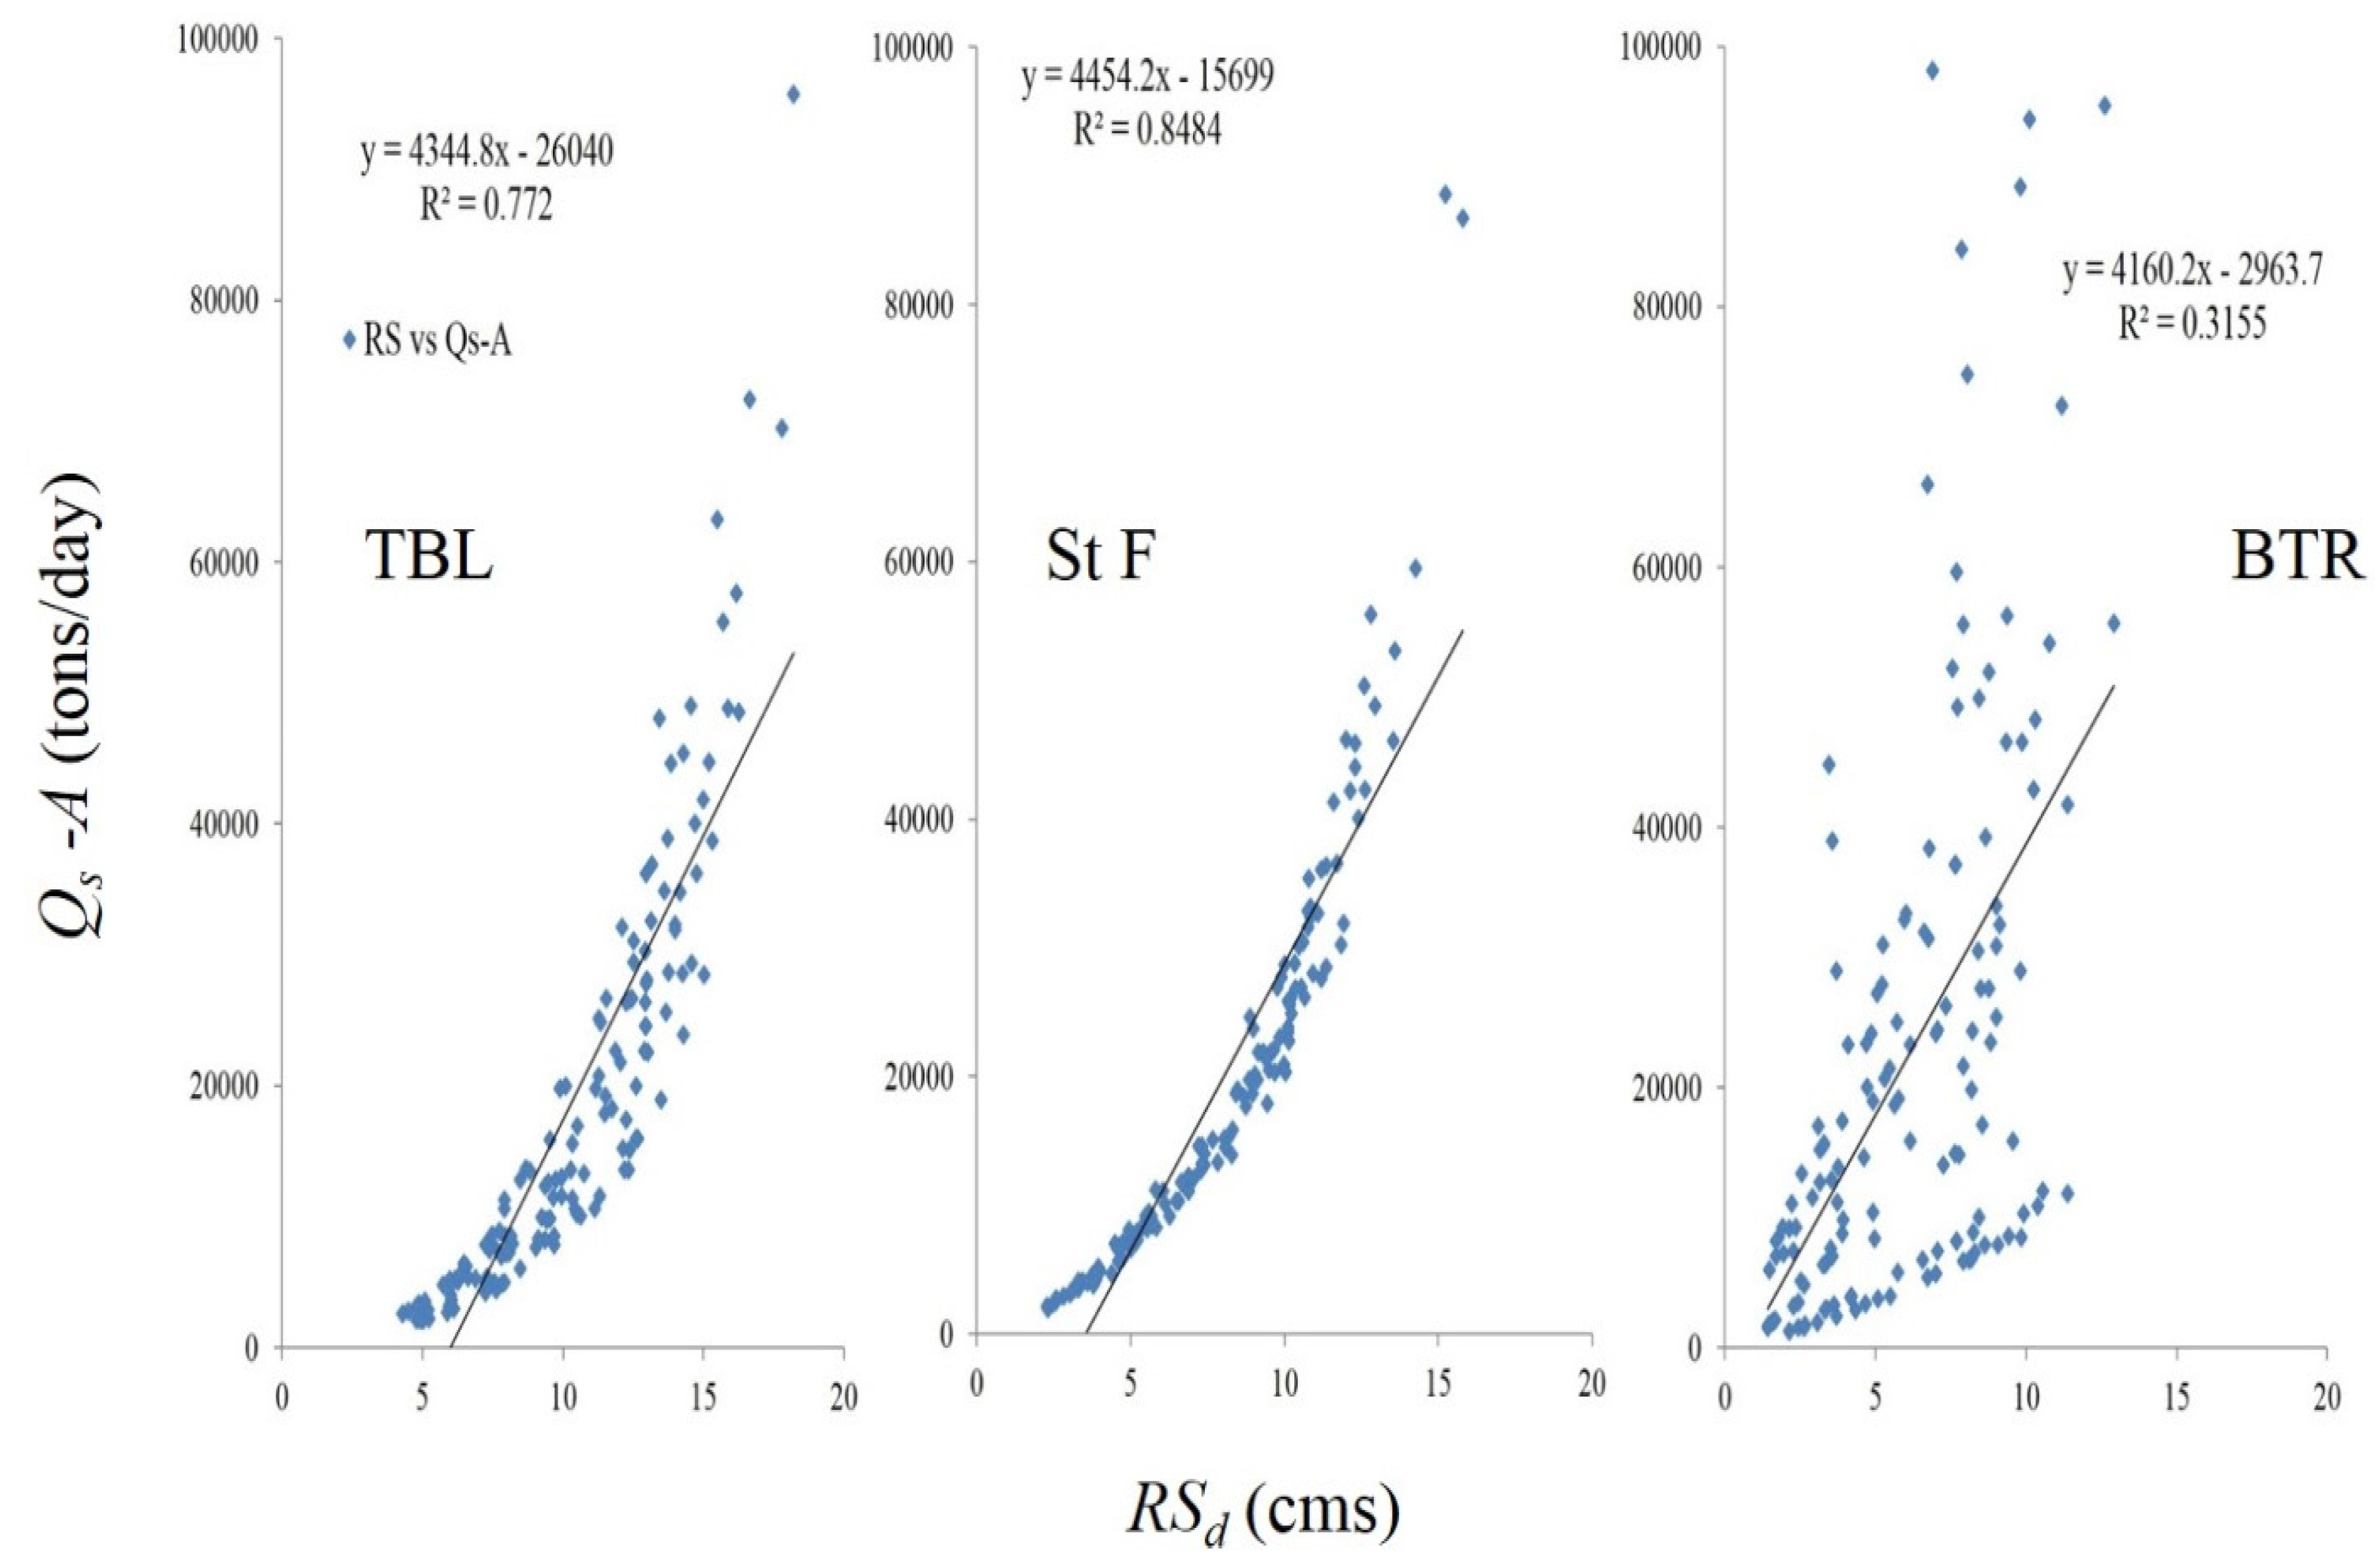
Figure 13.
Annual Sediment Loads (SL) at Tarbert Landing (TBL), St Francisville (St F) and Baton Rouge (BTR) of the Lowermost Mississippi River. Note: The annual SLs at Tarbert Landing were taken from Rosen and Xu [28].
Figure 13.
Annual Sediment Loads (SL) at Tarbert Landing (TBL), St Francisville (St F) and Baton Rouge (BTR) of the Lowermost Mississippi River. Note: The annual SLs at Tarbert Landing were taken from Rosen and Xu [28].
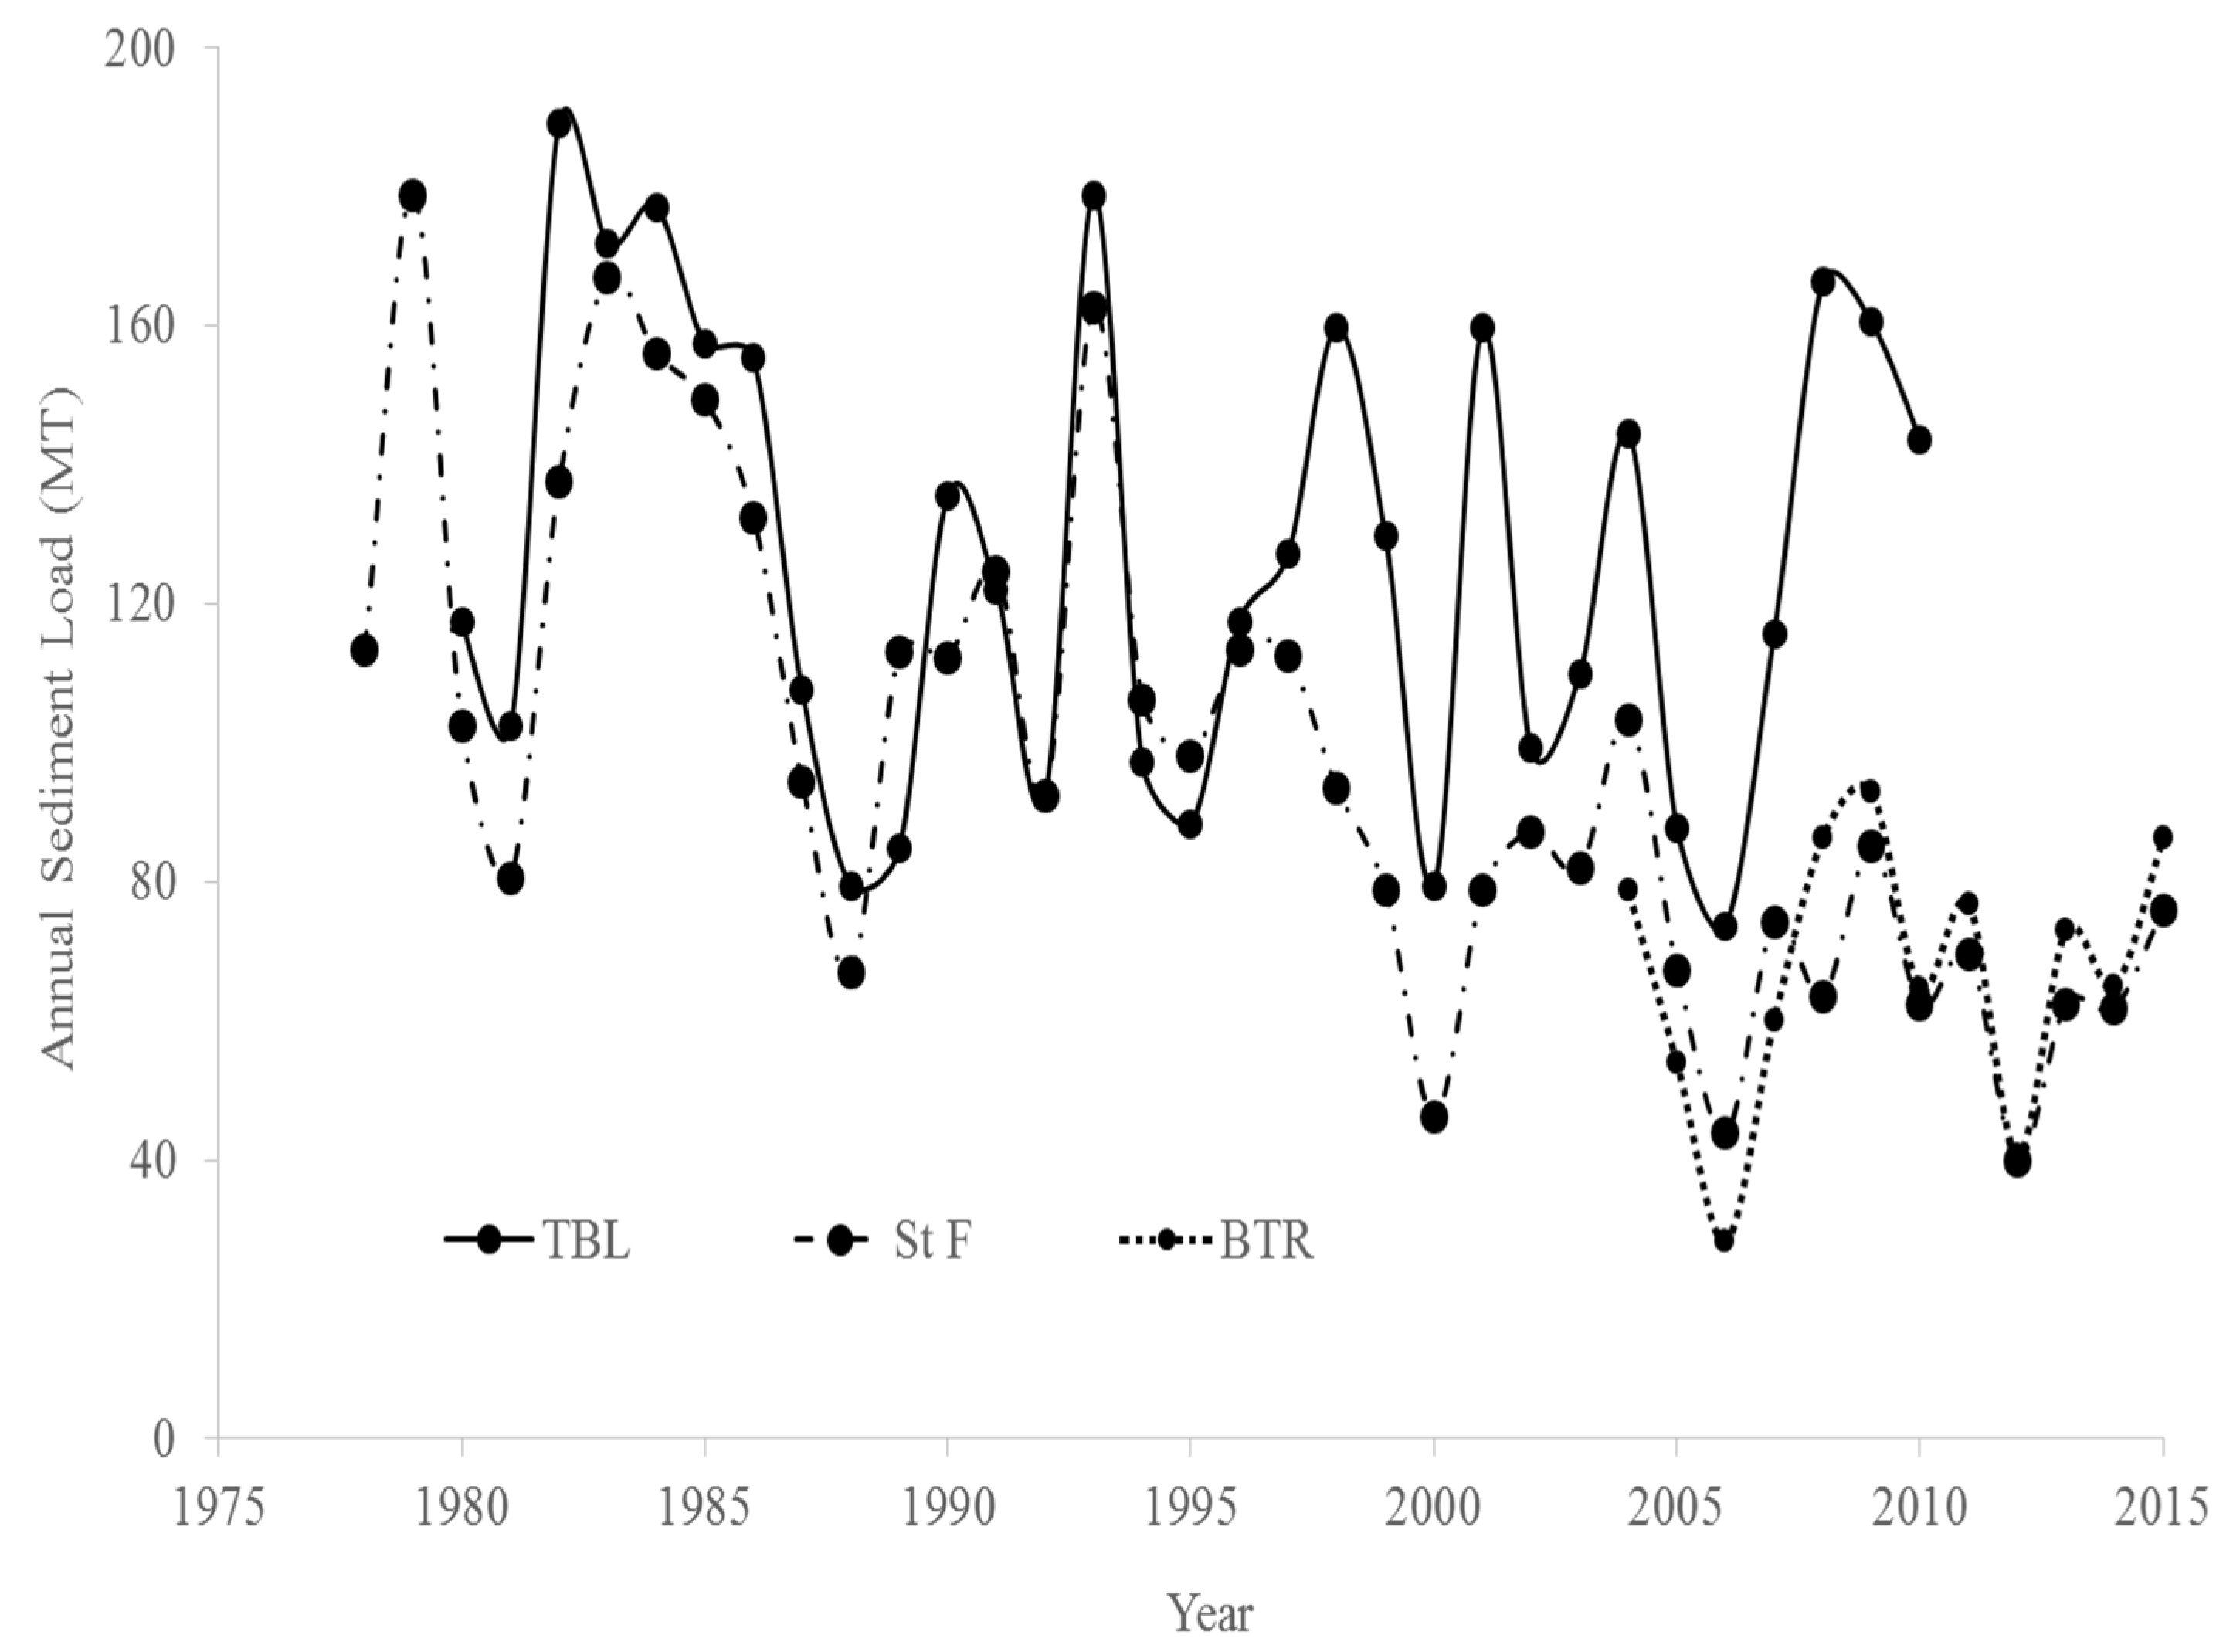
Figure 14.
Monthly averages of daily sediment loads at Tarbert Landing (TBL, during 1980–2010), St Francisville (St F, during 1978–2015) and Baton Rouge (BTR, during 2004–2015) of the Lowermost Mississippi River. Note: The seasonal trends of DSL at Tarbert Landing were taken from Rosen and Xu [28].
Figure 14.
Monthly averages of daily sediment loads at Tarbert Landing (TBL, during 1980–2010), St Francisville (St F, during 1978–2015) and Baton Rouge (BTR, during 2004–2015) of the Lowermost Mississippi River. Note: The seasonal trends of DSL at Tarbert Landing were taken from Rosen and Xu [28].
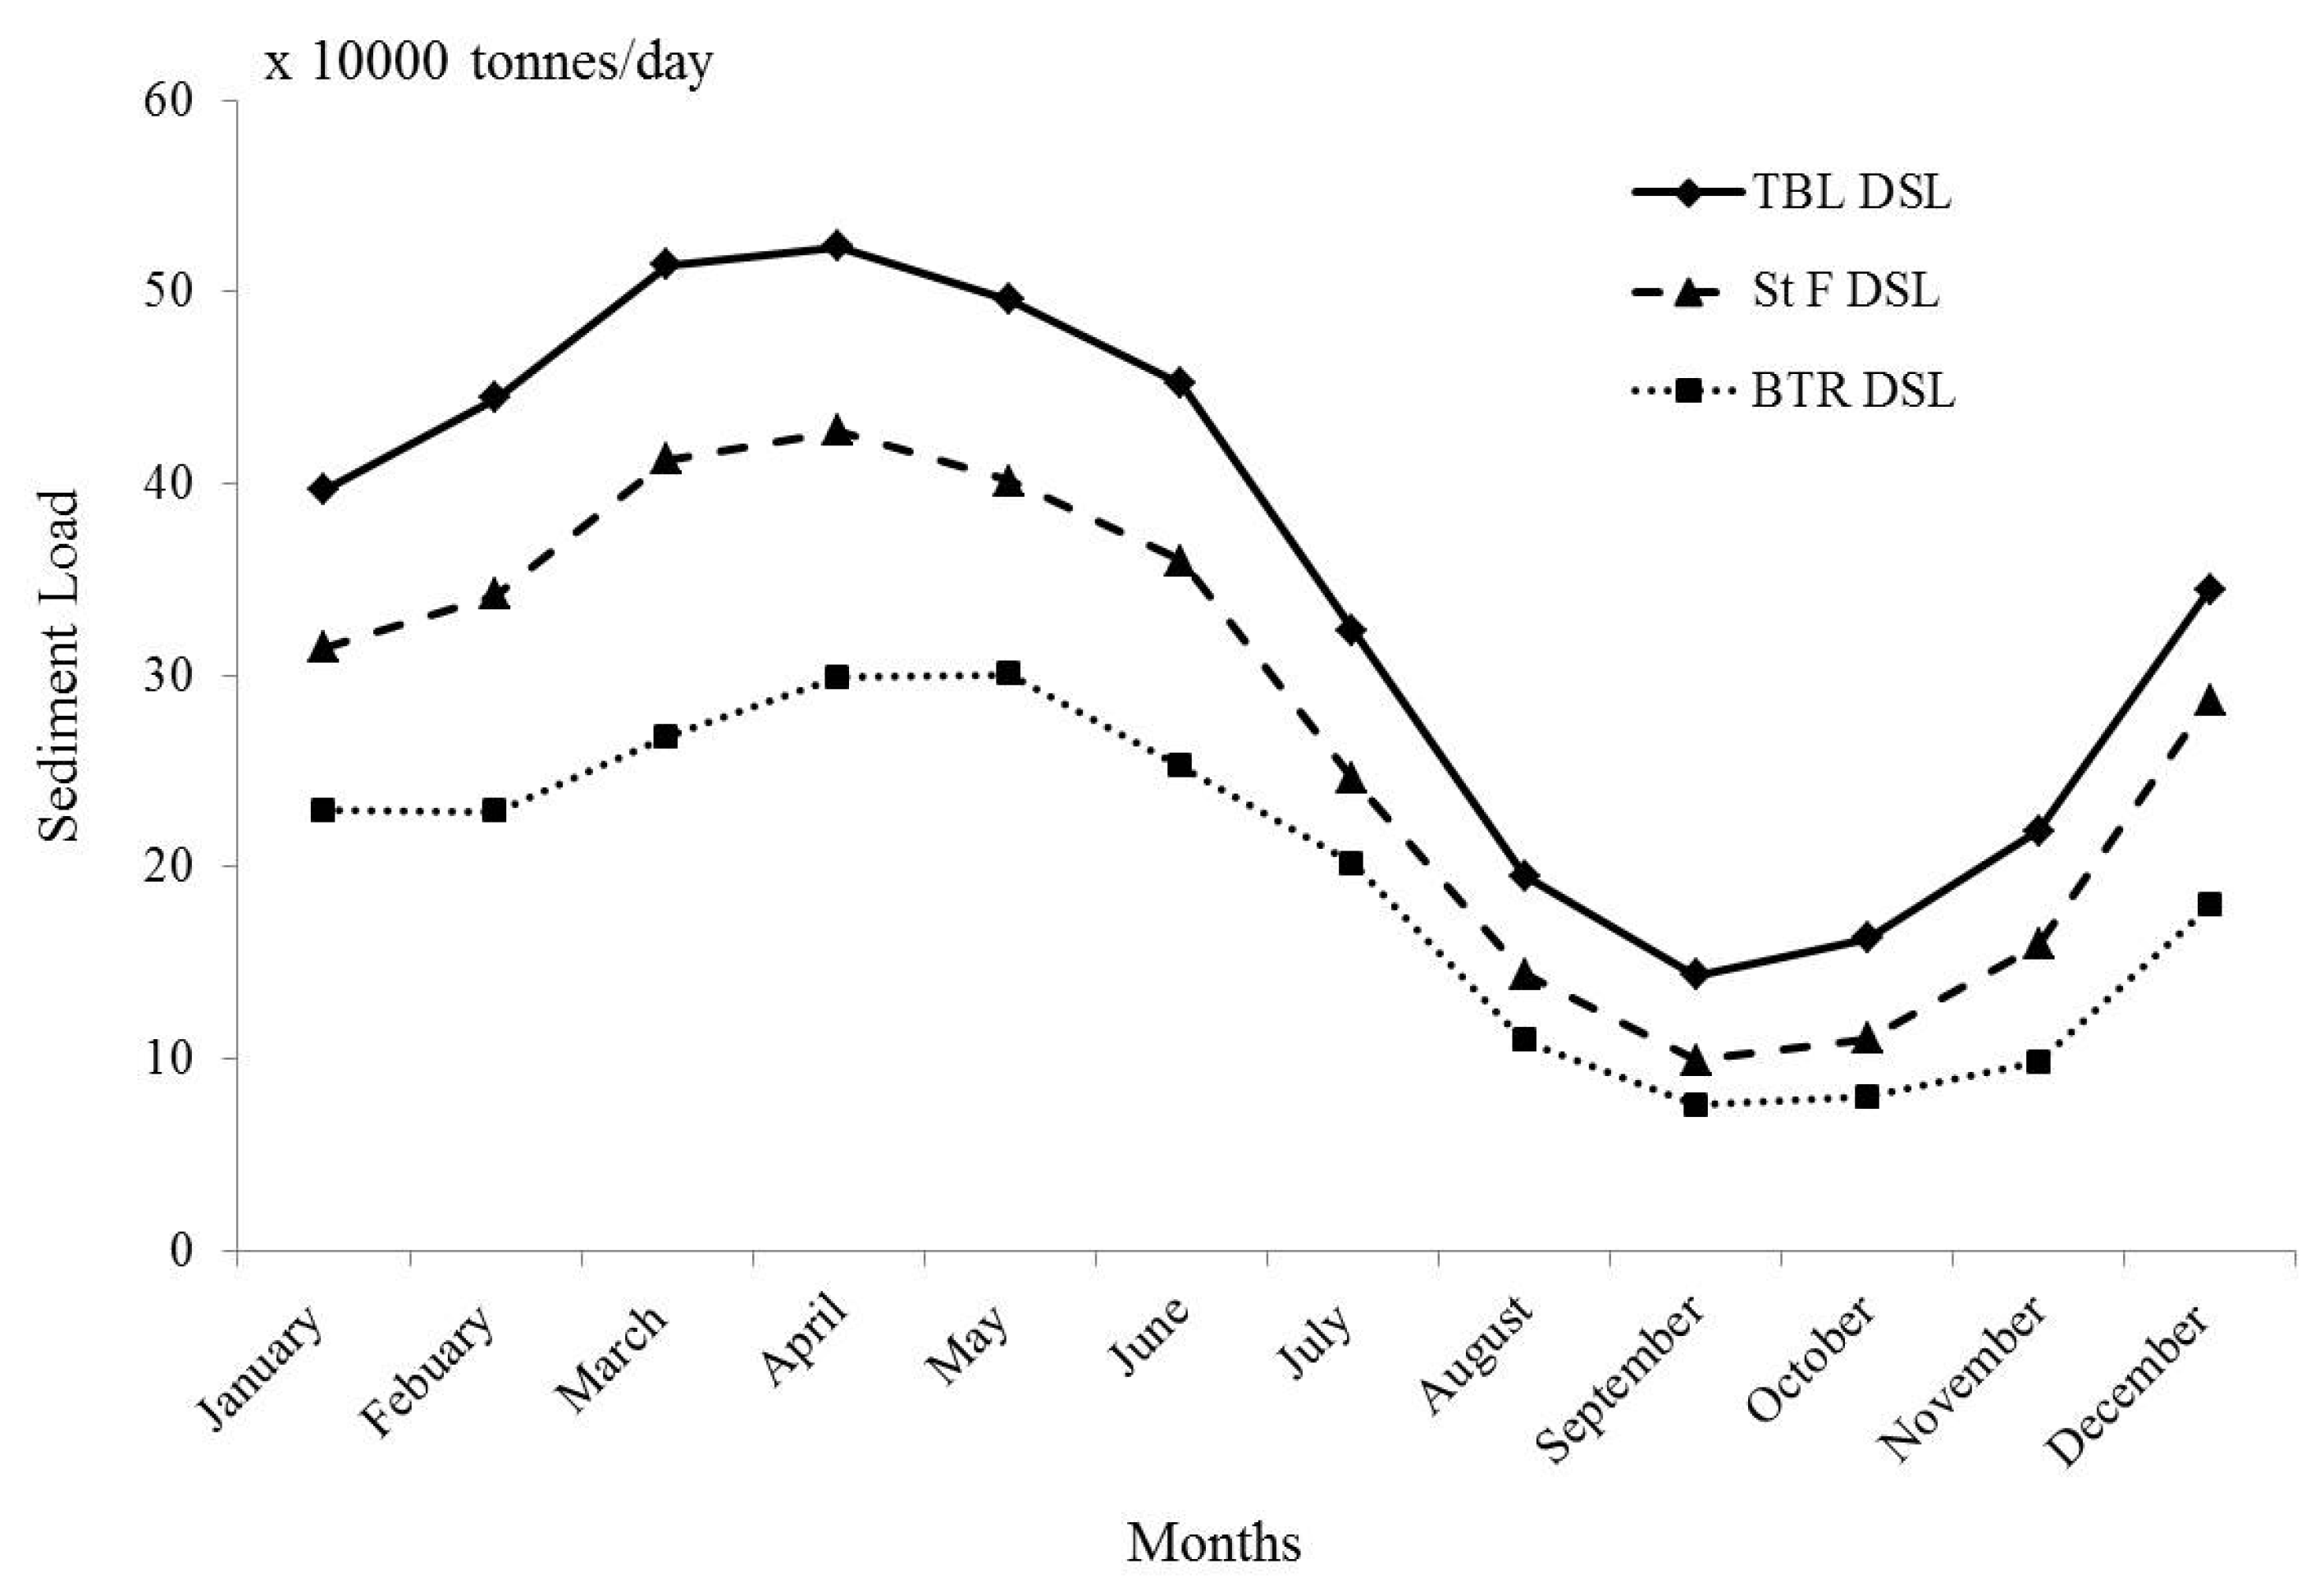
Figure 15.
Annual Sand Loads (SLs) at Tarbert Landing (TBL), St Francisville (St F) and Baton Rouge (BTR) of the Lowermost Mississippi River. Note: The annual SLss at TBL were taken from Joshi and Xu [31].
Figure 15.
Annual Sand Loads (SLs) at Tarbert Landing (TBL), St Francisville (St F) and Baton Rouge (BTR) of the Lowermost Mississippi River. Note: The annual SLss at TBL were taken from Joshi and Xu [31].

Figure 16.
Monthly averages of daily sand load at Tarbert Landing (TBL, during 1973–2013), St Francisville (St F, during 1978–2015) and Baton Rouge (BTR, during 2004–2015) of the Lowermost Mississippi River. Note: The seasonal trend for DSLs at Tarbert Landing was taken from Joshi and Xu [31].
Figure 16.
Monthly averages of daily sand load at Tarbert Landing (TBL, during 1973–2013), St Francisville (St F, during 1978–2015) and Baton Rouge (BTR, during 2004–2015) of the Lowermost Mississippi River. Note: The seasonal trend for DSLs at Tarbert Landing was taken from Joshi and Xu [31].
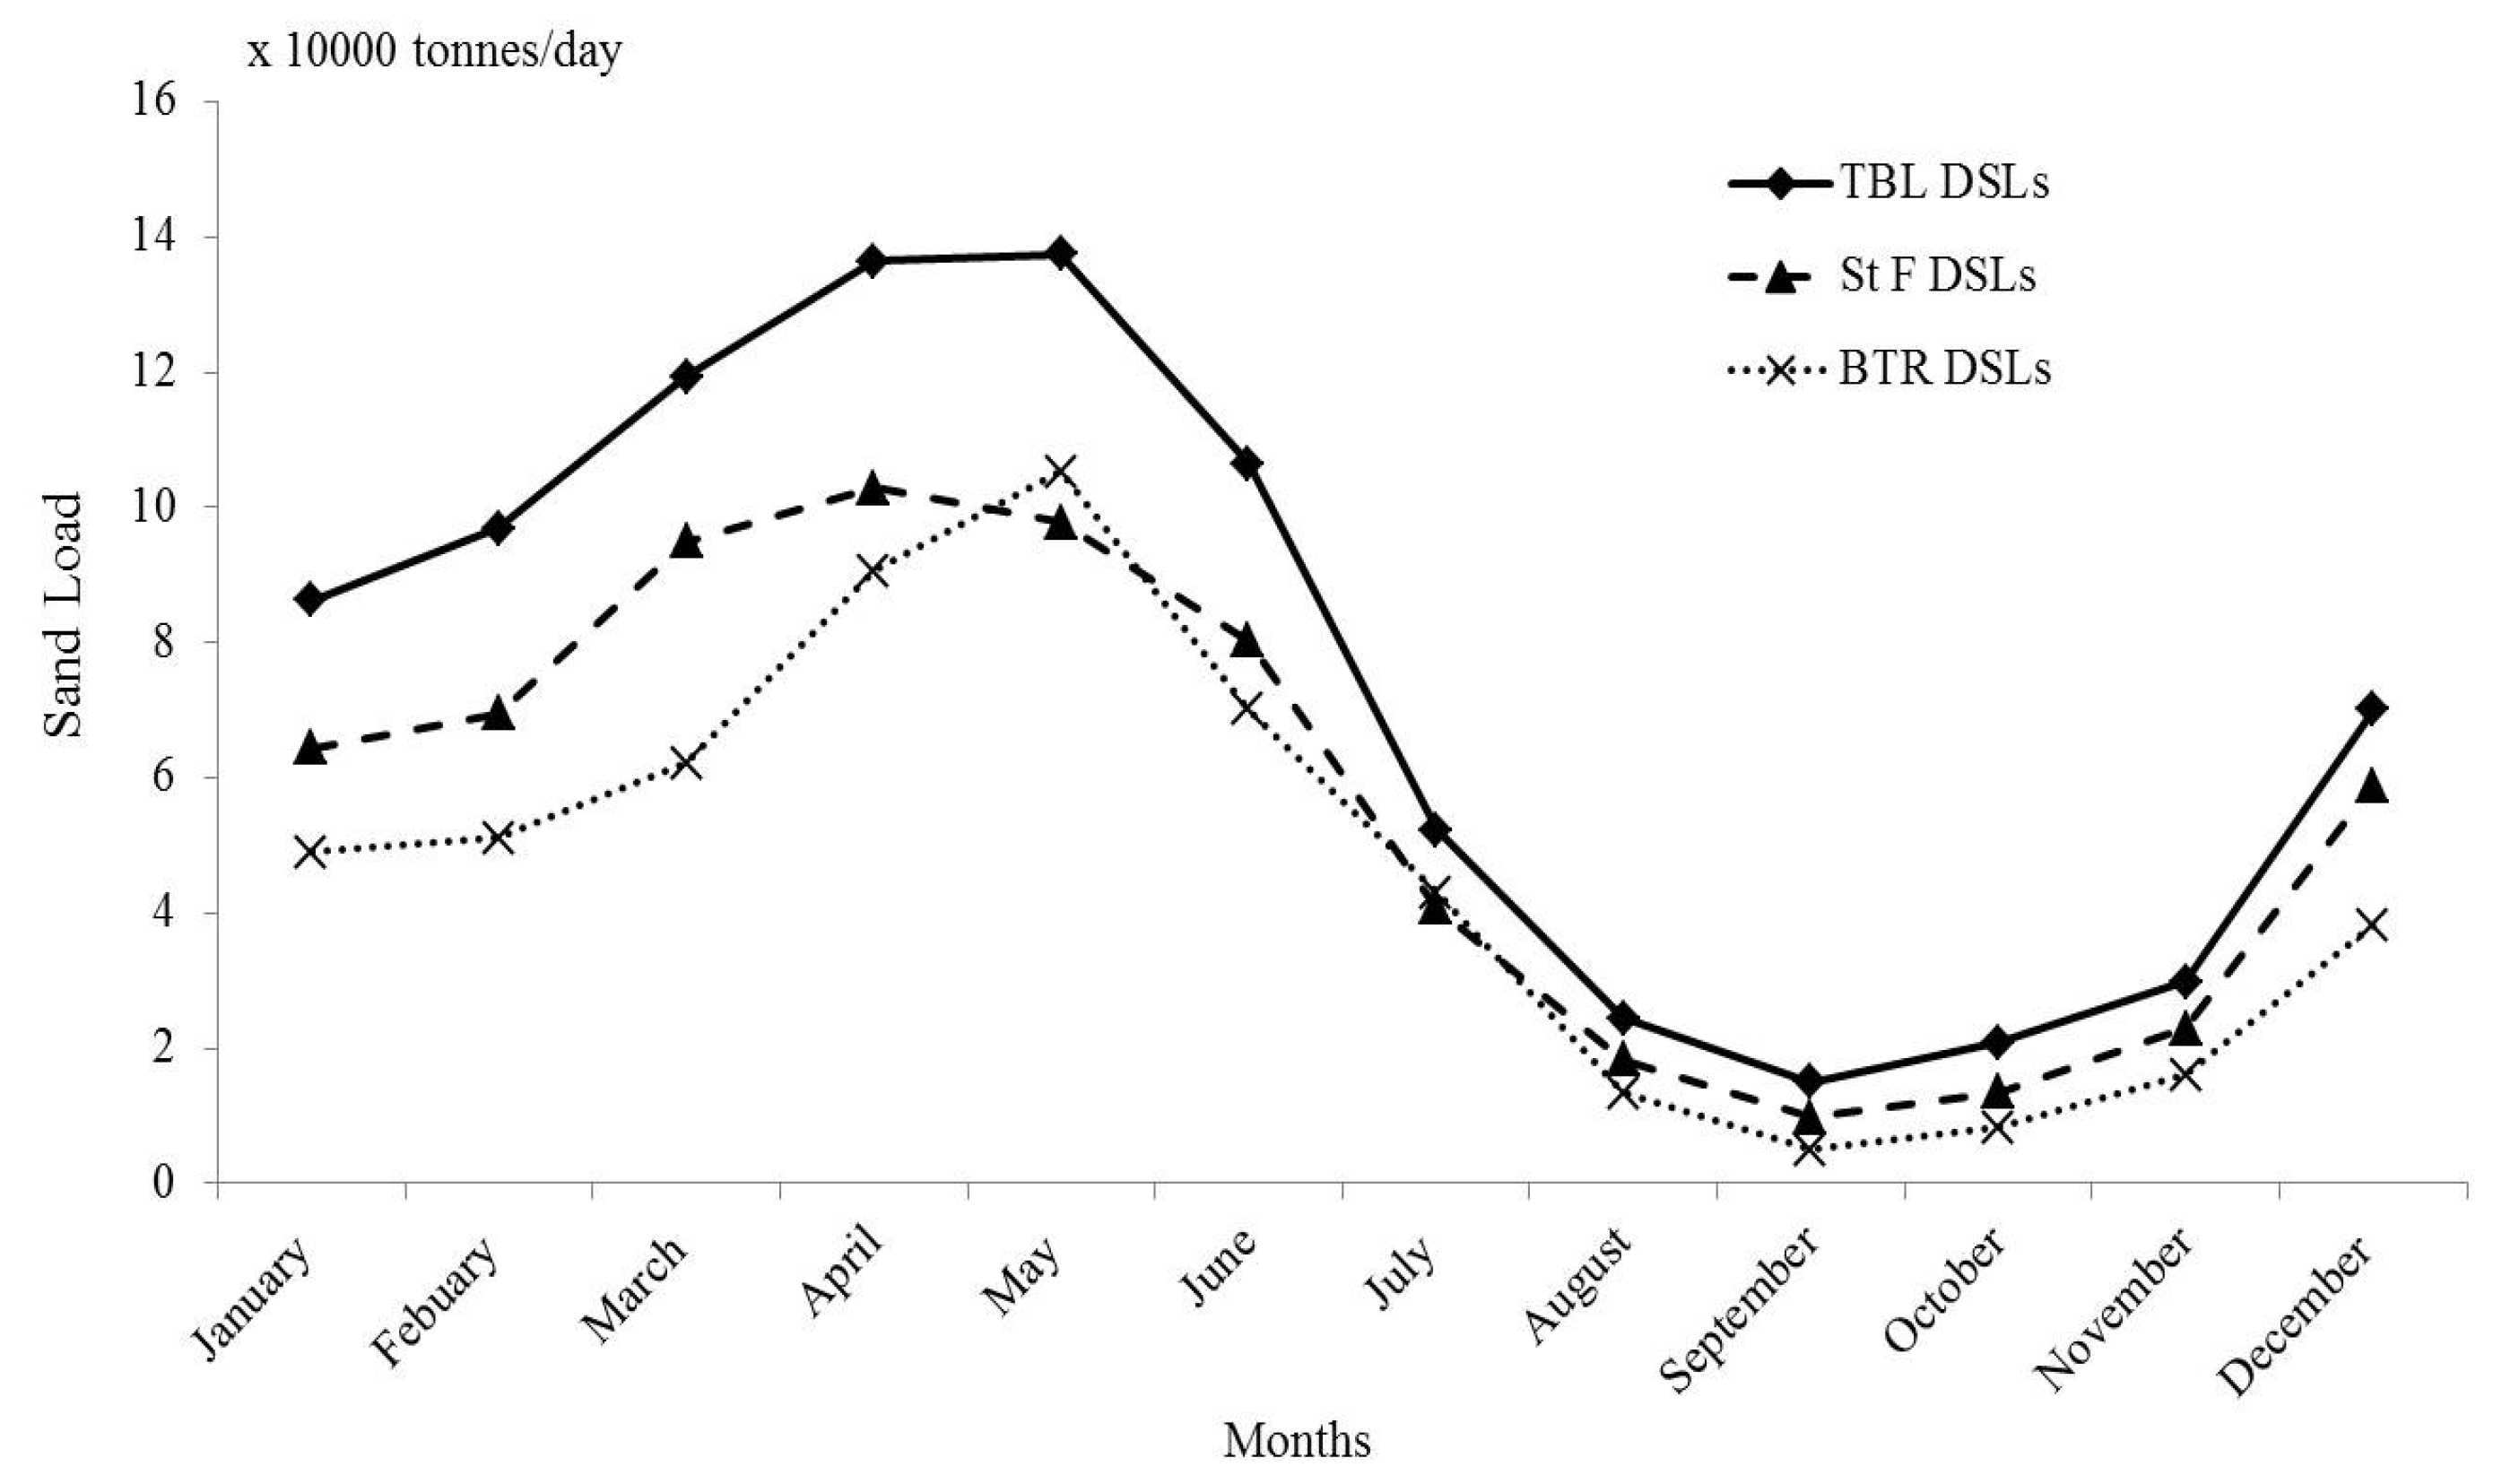
Figure 17.
Relationship of monthly average of daily suspended sediment load (DSL in tons/day) with the monthly average of daily bedload transport rates (Qs in tons/day) for representative grain-size of 0.125 mm (A) at Tarbert Landing (TBL), St Francisville (St F), and Baton Rouge (BTR) of the Lowermost Mississippi River during. The relationship for monthly DSL and monthly Qs was during 2004–2010 at TBL (taken from Rosen and Xu [28]) and during 2004–2015 at St F and BTR.

Figure 18.
Relationship of monthly average of daily suspended sand load (DSLs in tons/day) with the monthly average of daily bedload transport rates (Qs in tons/day) for representative grain-size of 0.125 mm (A) at Tarbert Landing (TBL), St Francisville (St F), and Baton Rouge (BTR) of the Lowermost Mississippi River during 2004–2015. The relationship for monthly DSLs and monthly Qs was during 2004–2013 at TBL (taken from Joshi and Xu [31]) (2015) and during 2004–2015 at St F and BTR.
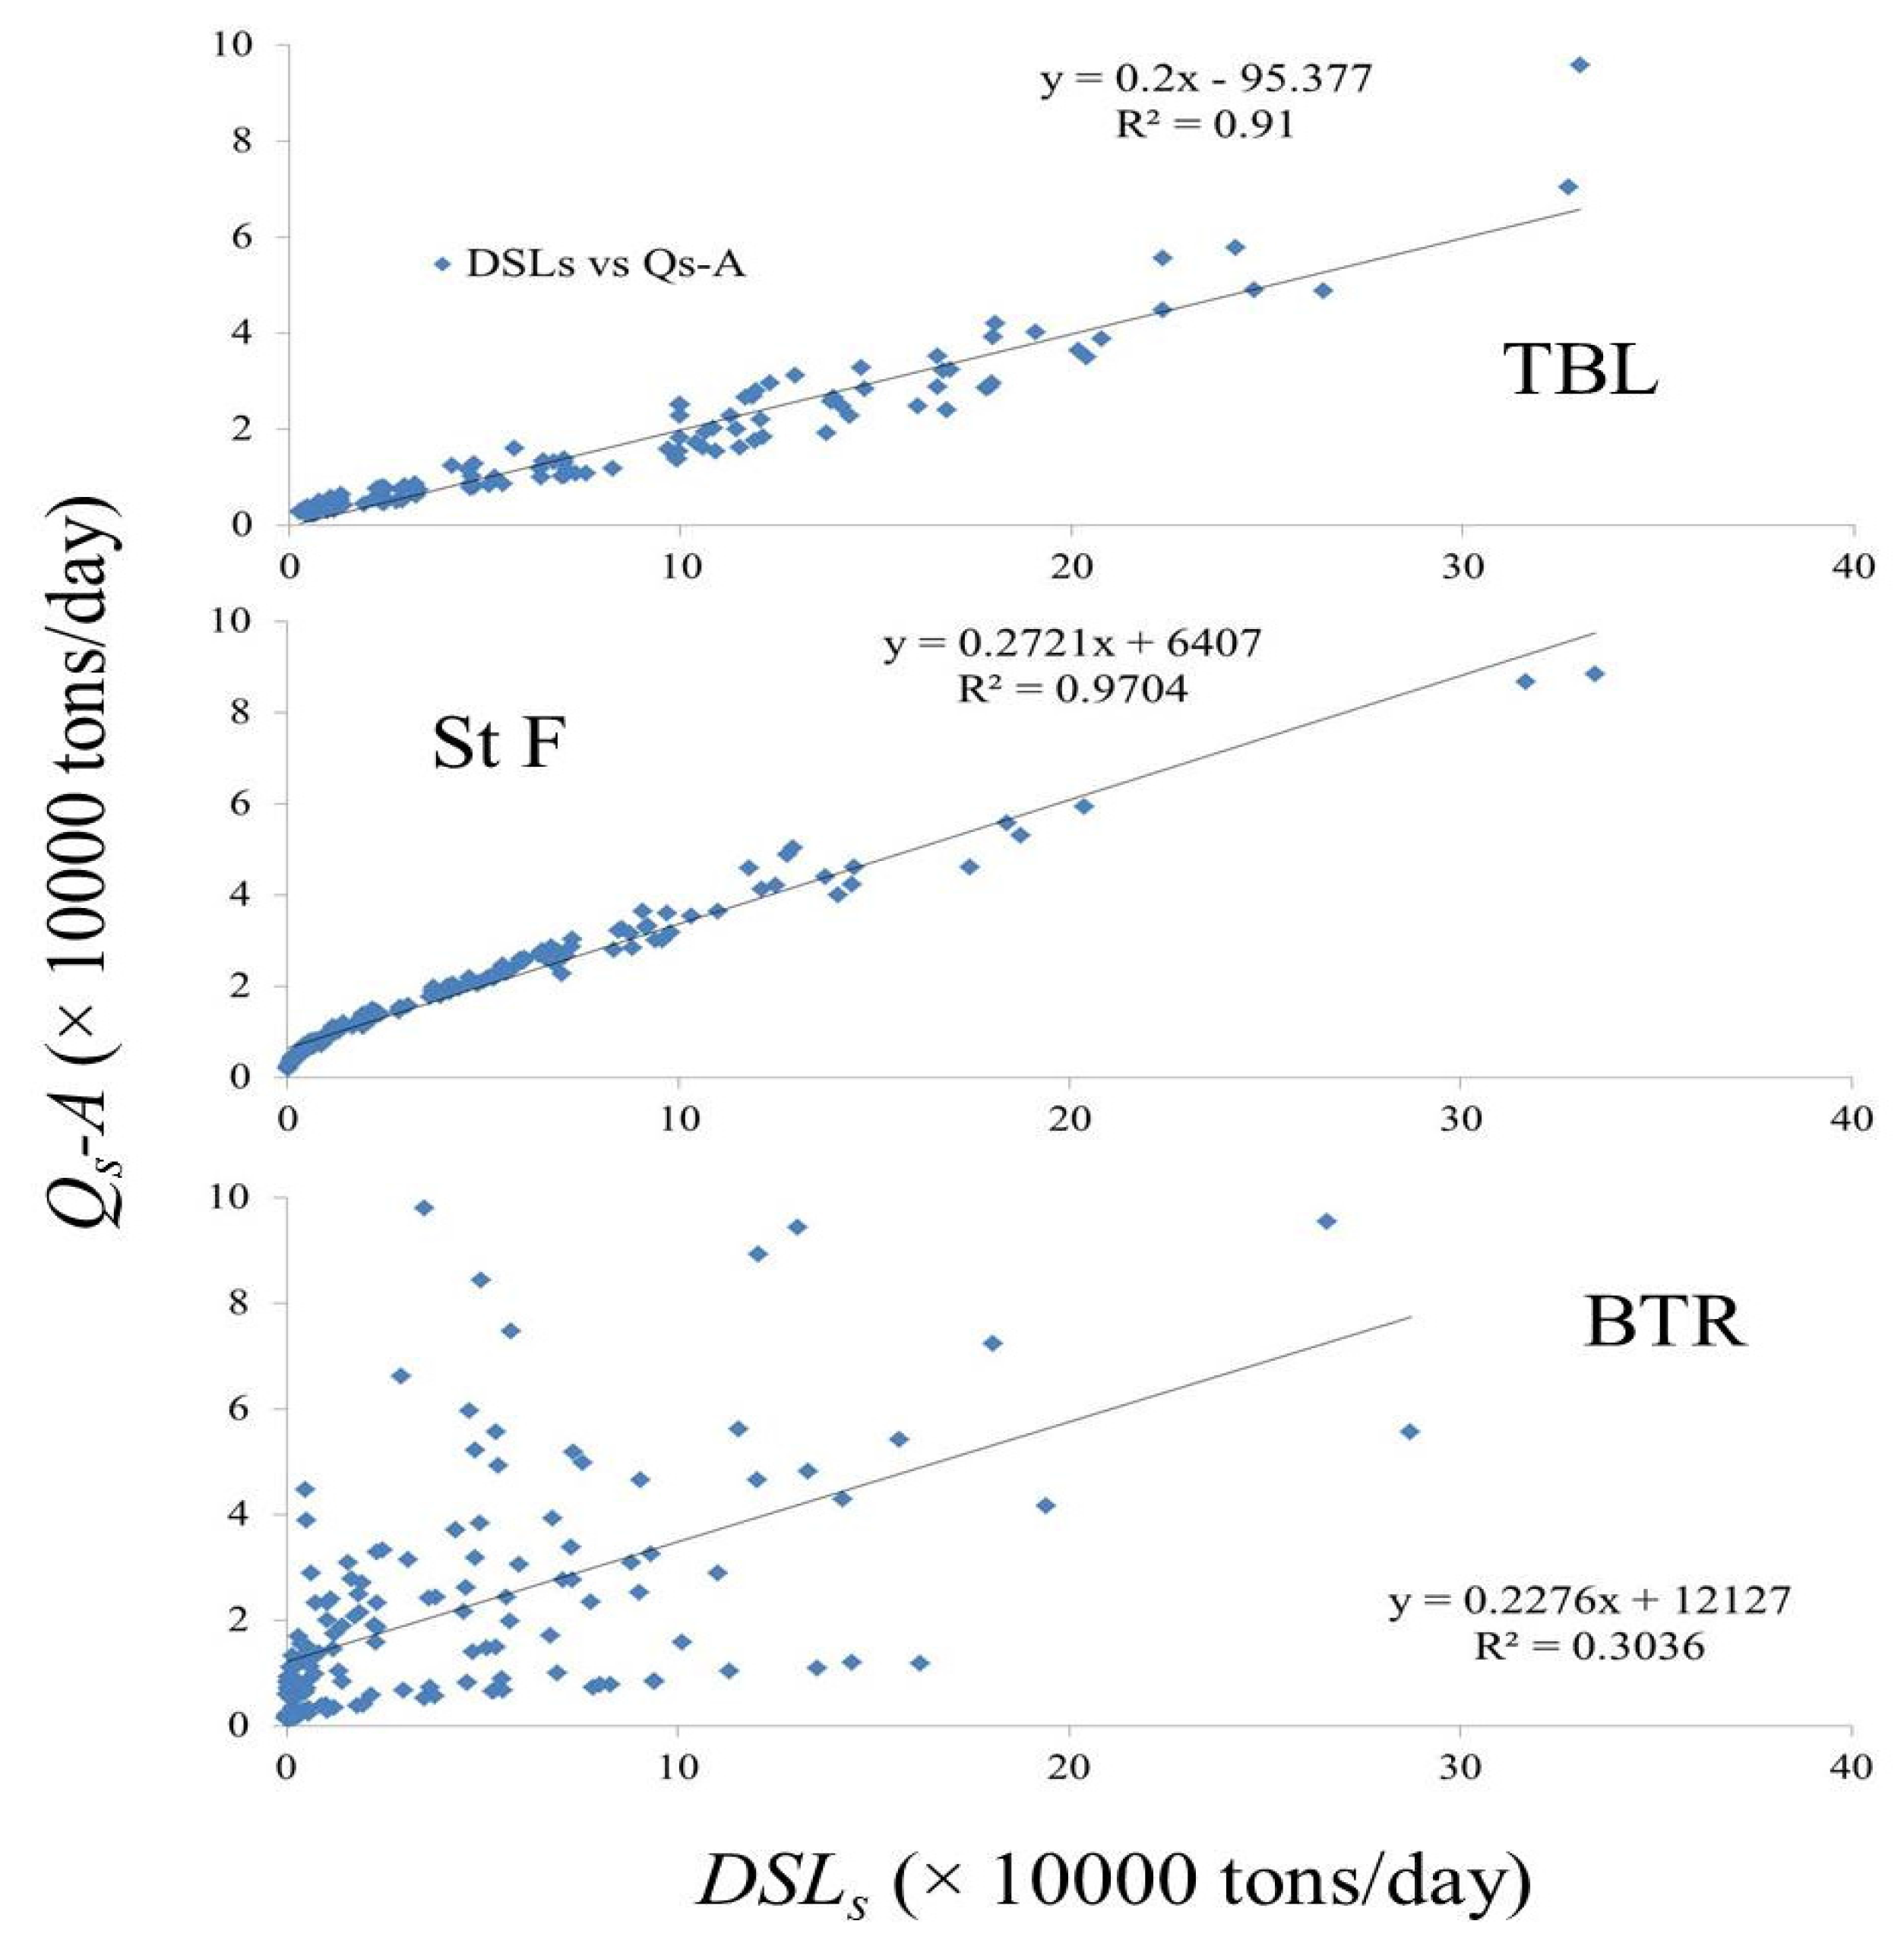
Figure 19.
Difference between total bedload transport rates (Qs) for representative grain size of 0.125 mm (A), suspended sediment and sand loads, and total supply at Tarbert Landing [TBL, at river kilometer (rk) 490)], St Francisville (St F, rk 419), and Baton Rouge (BTR, rk 367.5) along the Lowermost Mississippi River during 2004–2010 (the matching period for these components at all three locations). X-axis distances are distance of the sites from the Head of the Passes (rk 0) near the LmMR’s Gulf of Mexico outlet. Note: the suspended sand load is a coarser subset of suspended sediment load, hence, the total sediment supply at a given location along the river was calculated as the sum of total bedload and total suspended sediment load at the location.


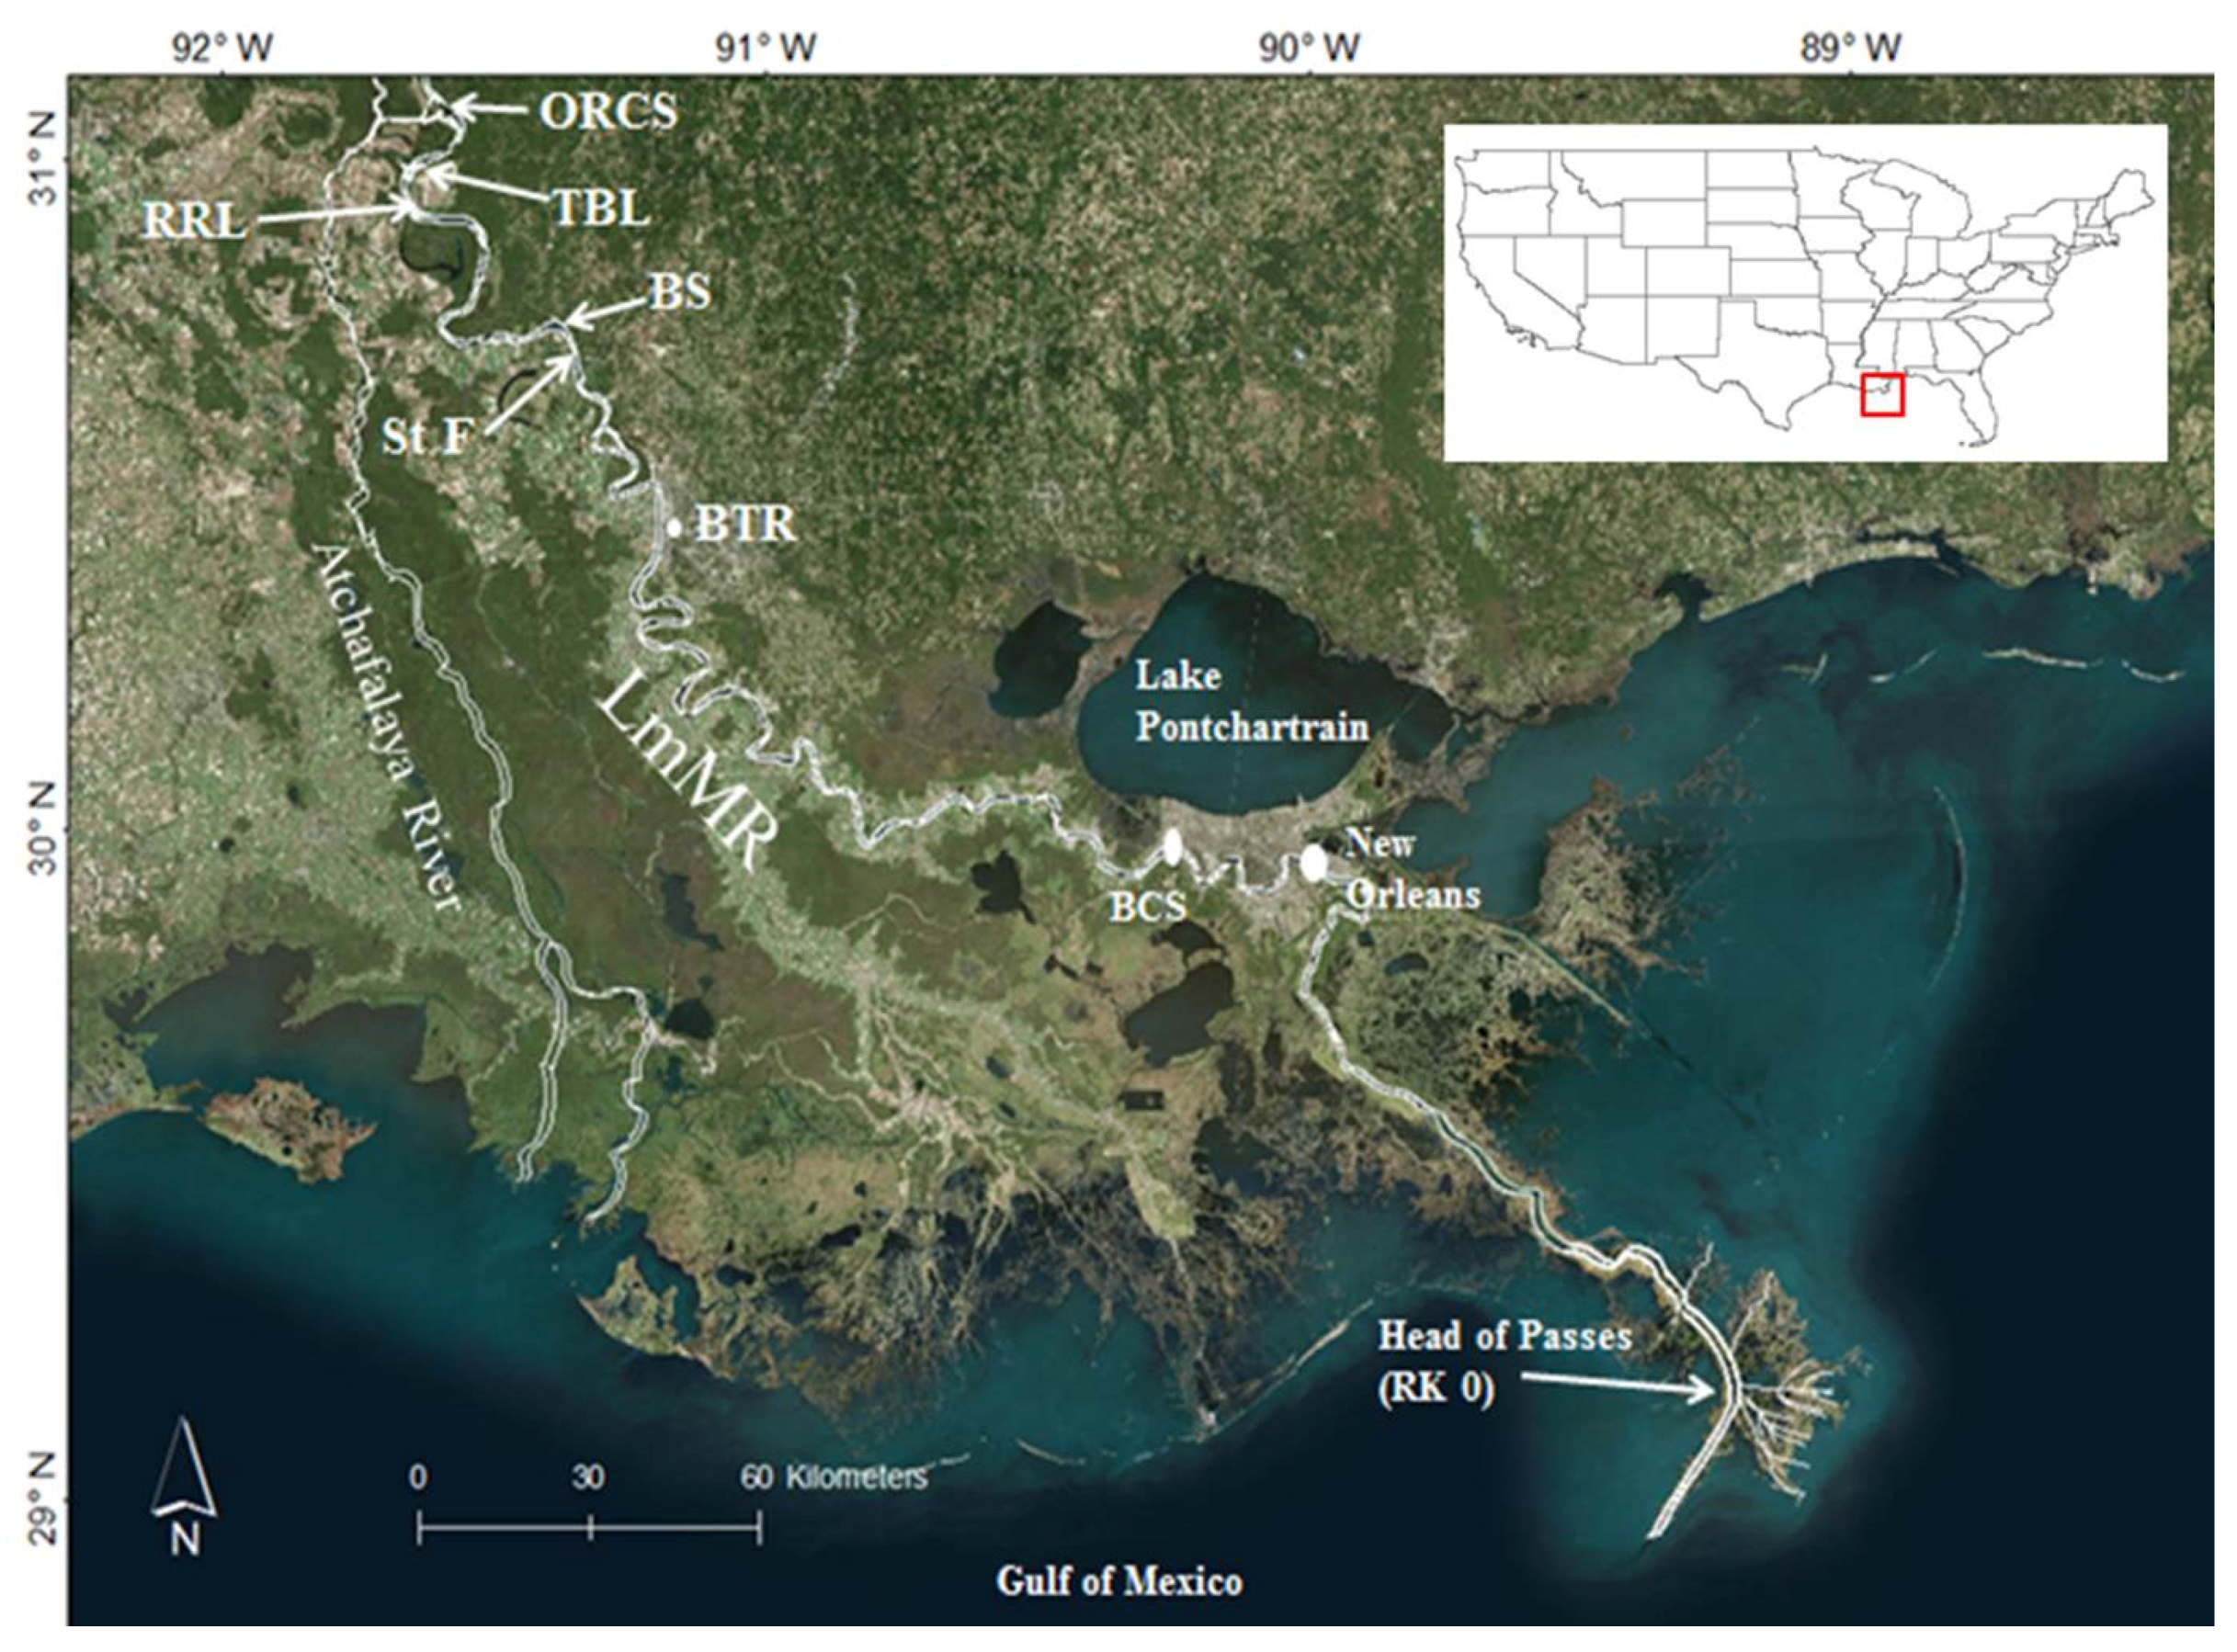
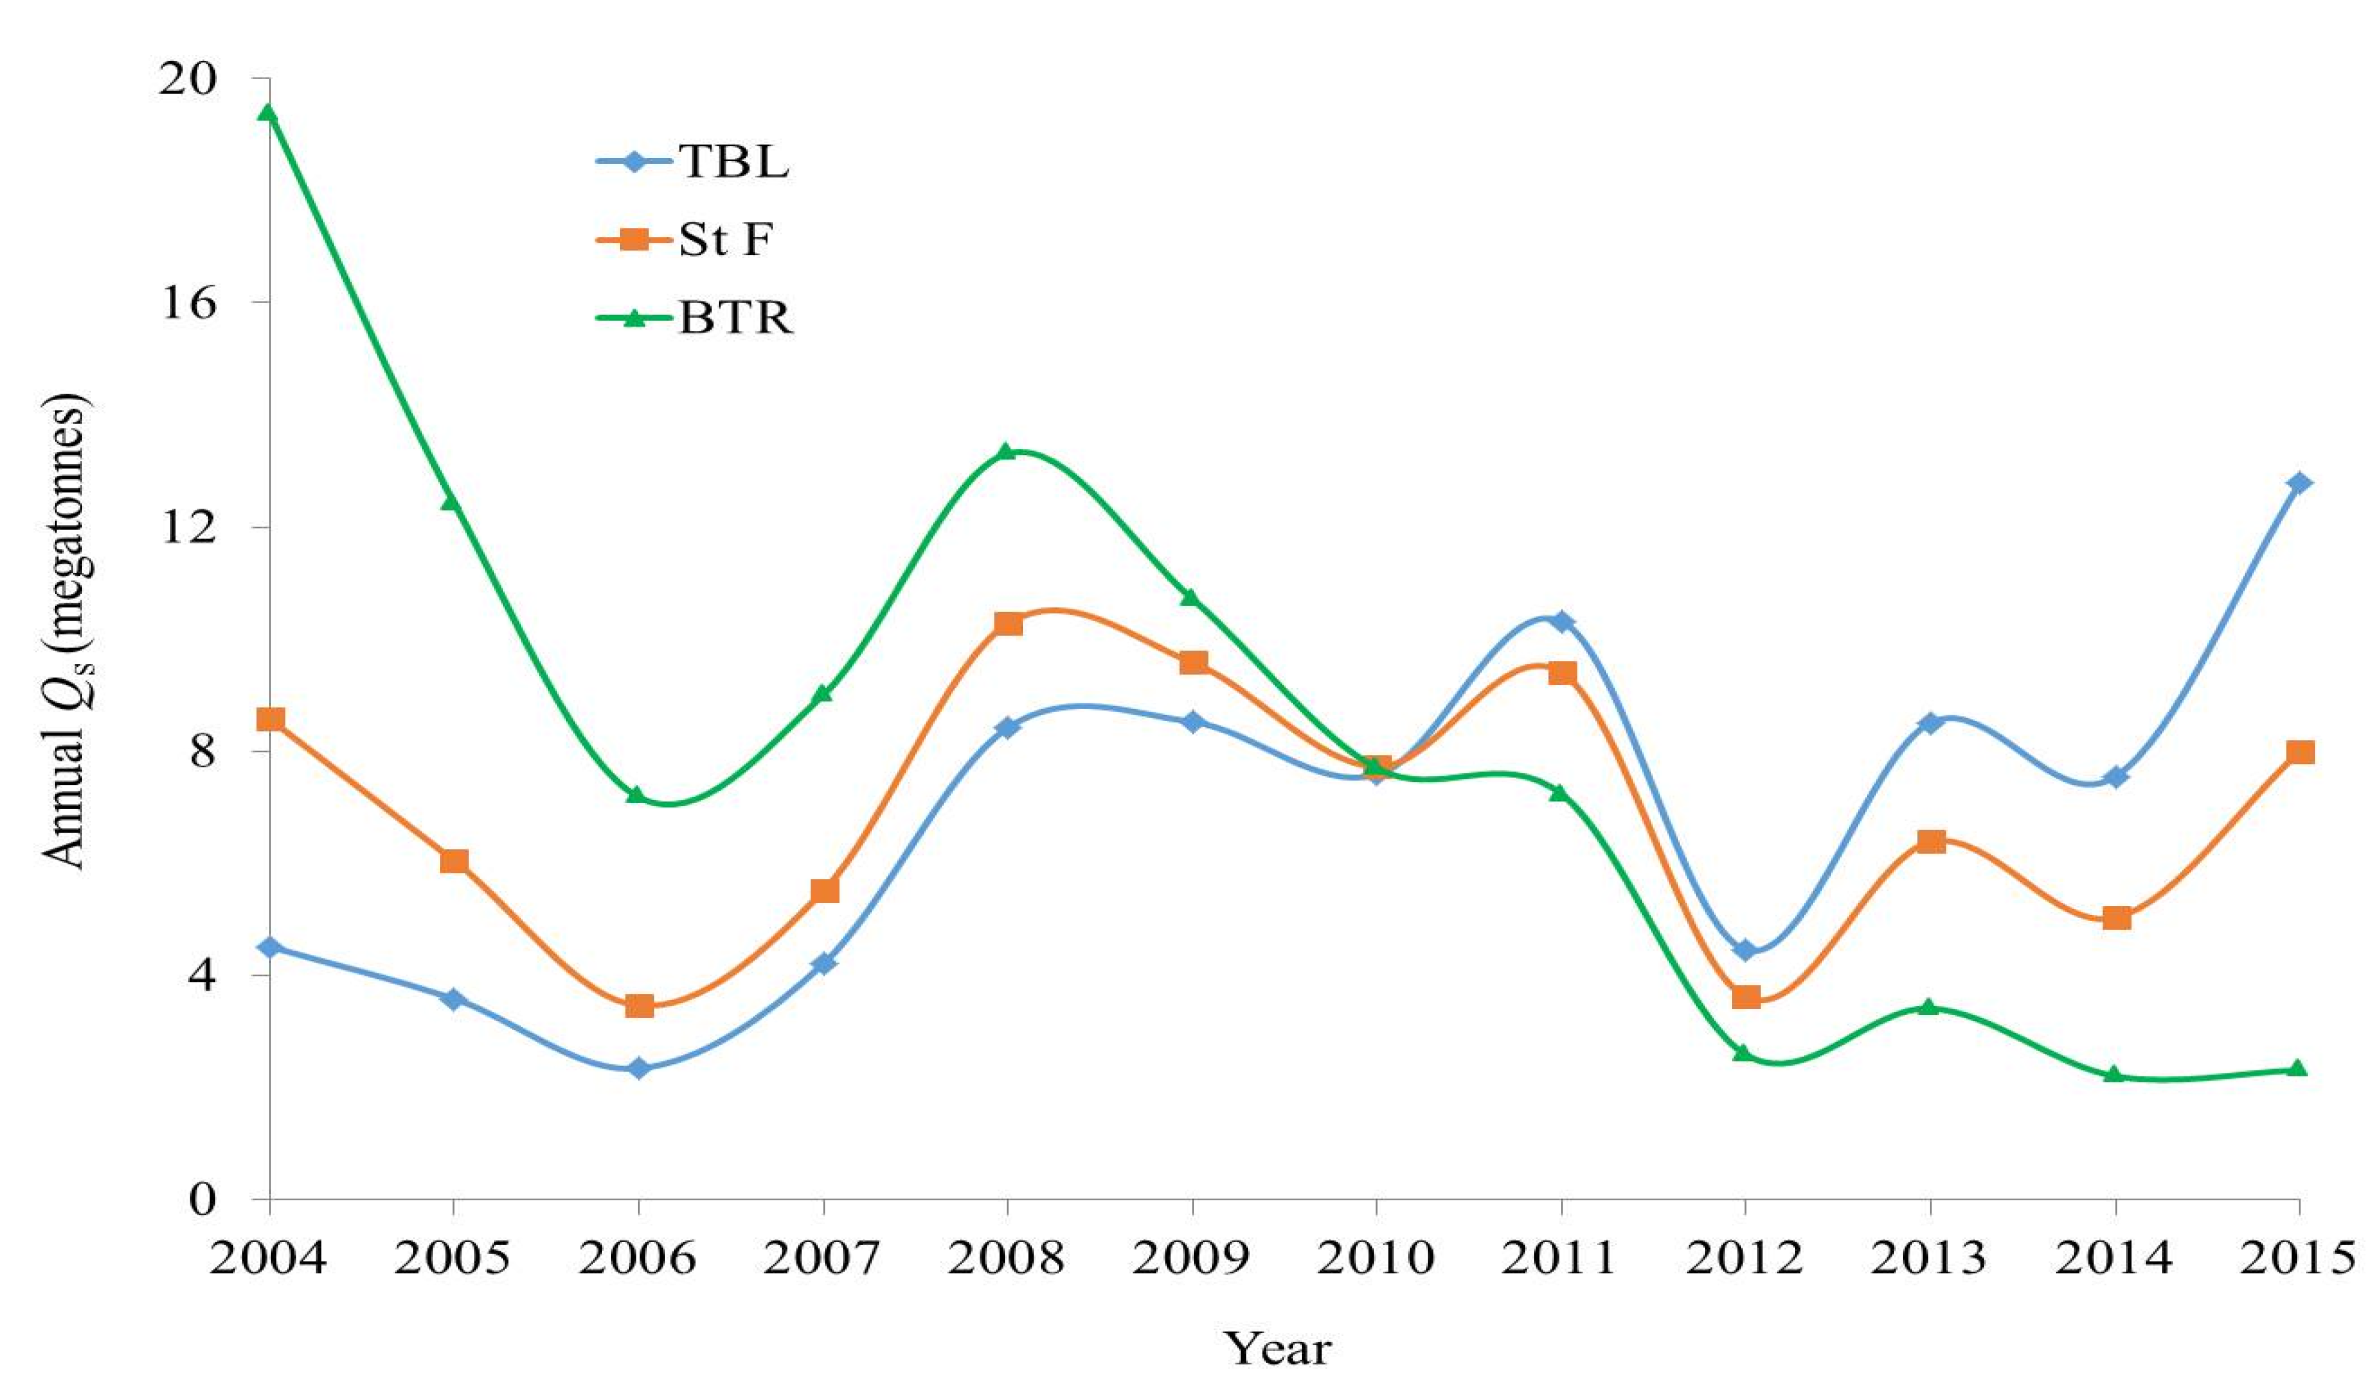
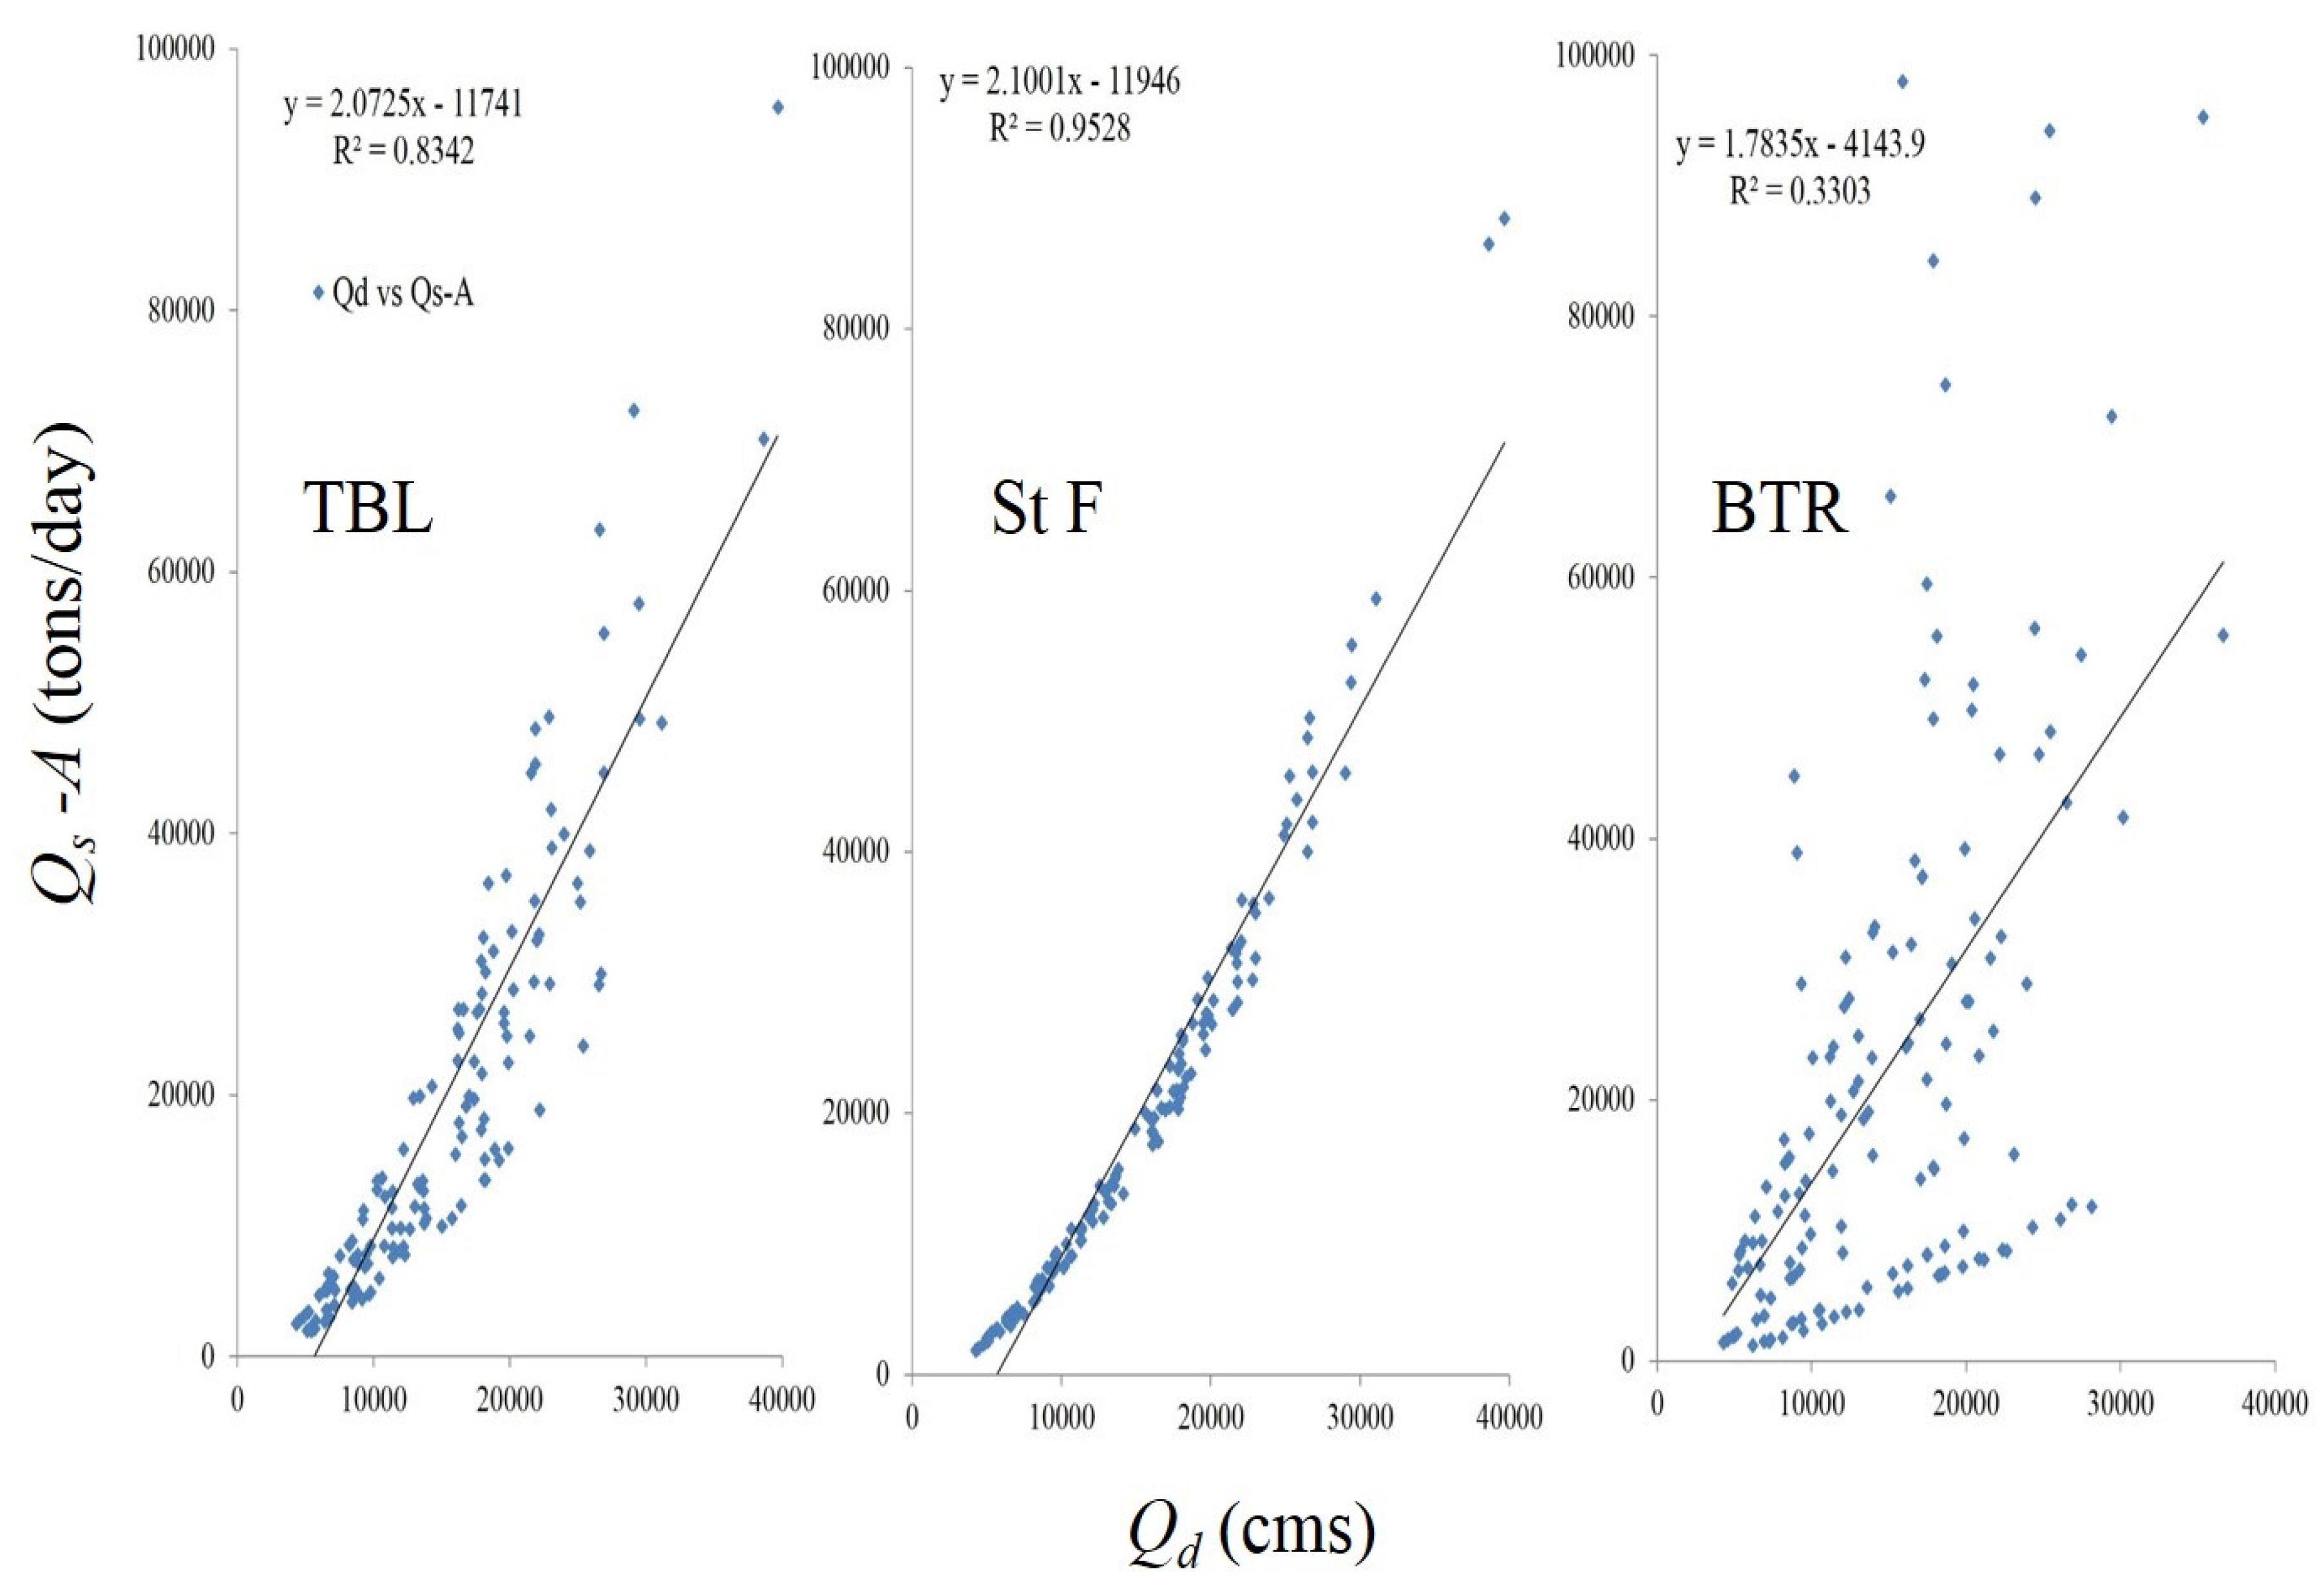
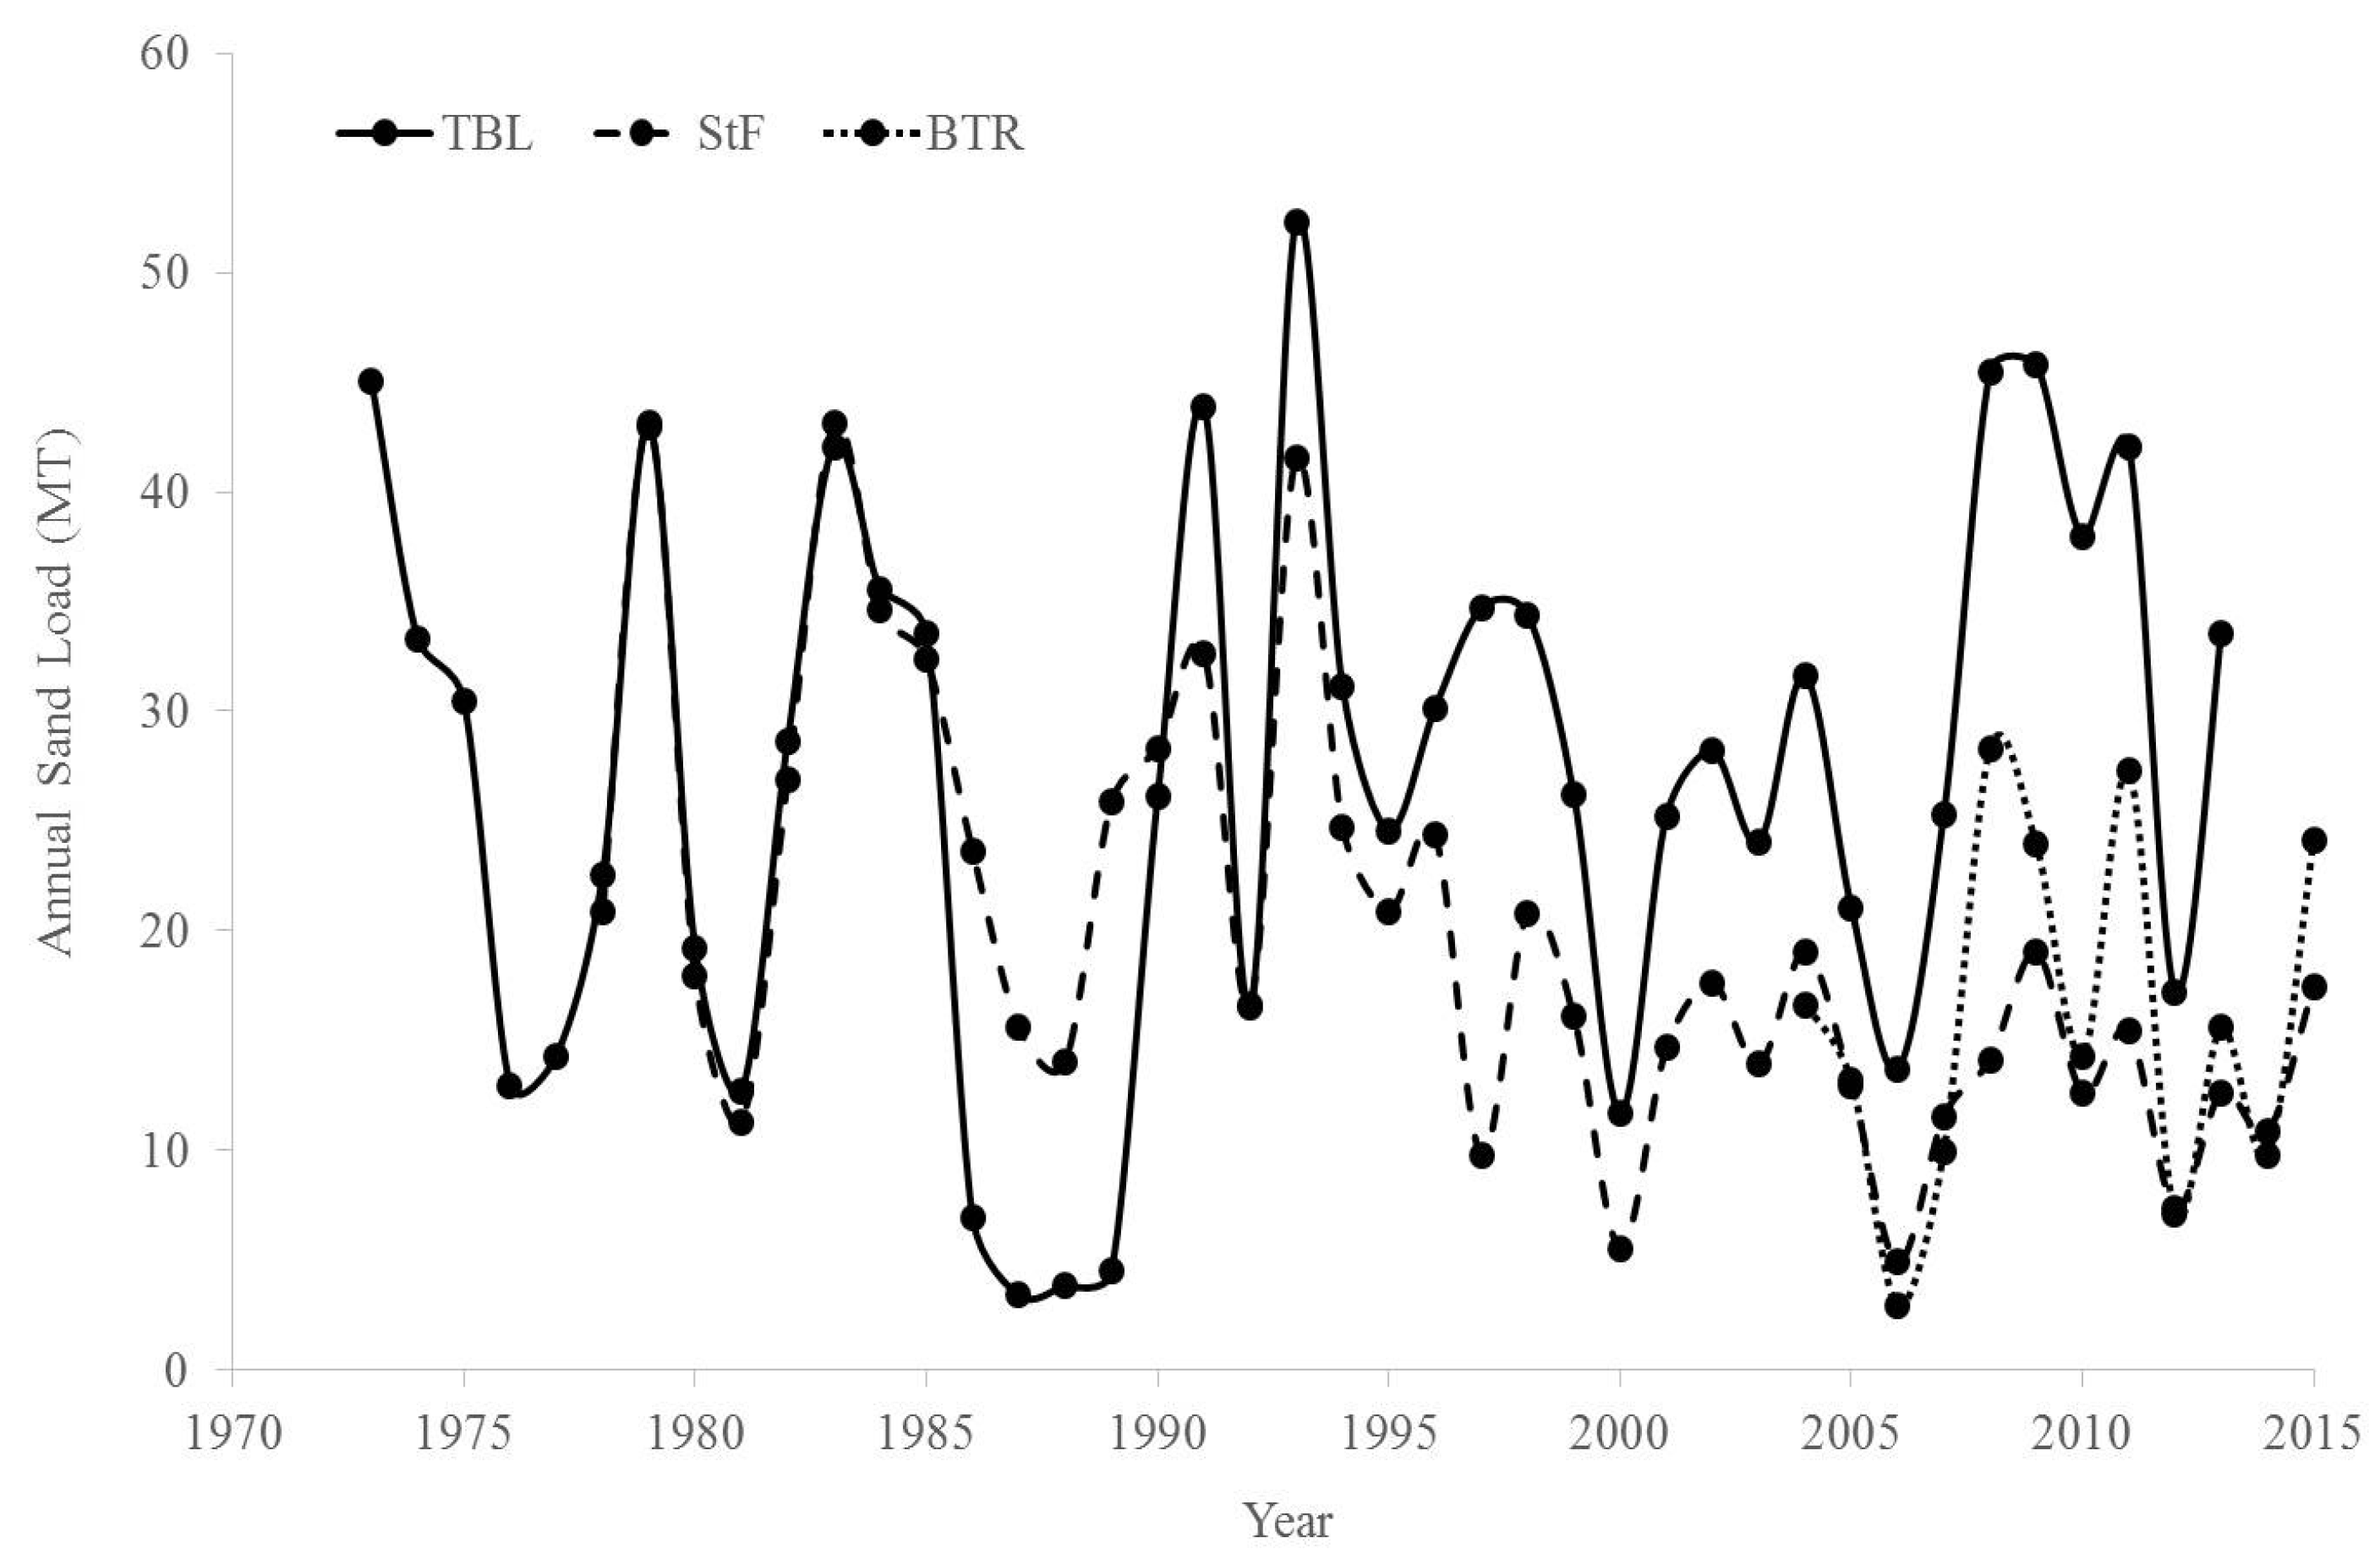
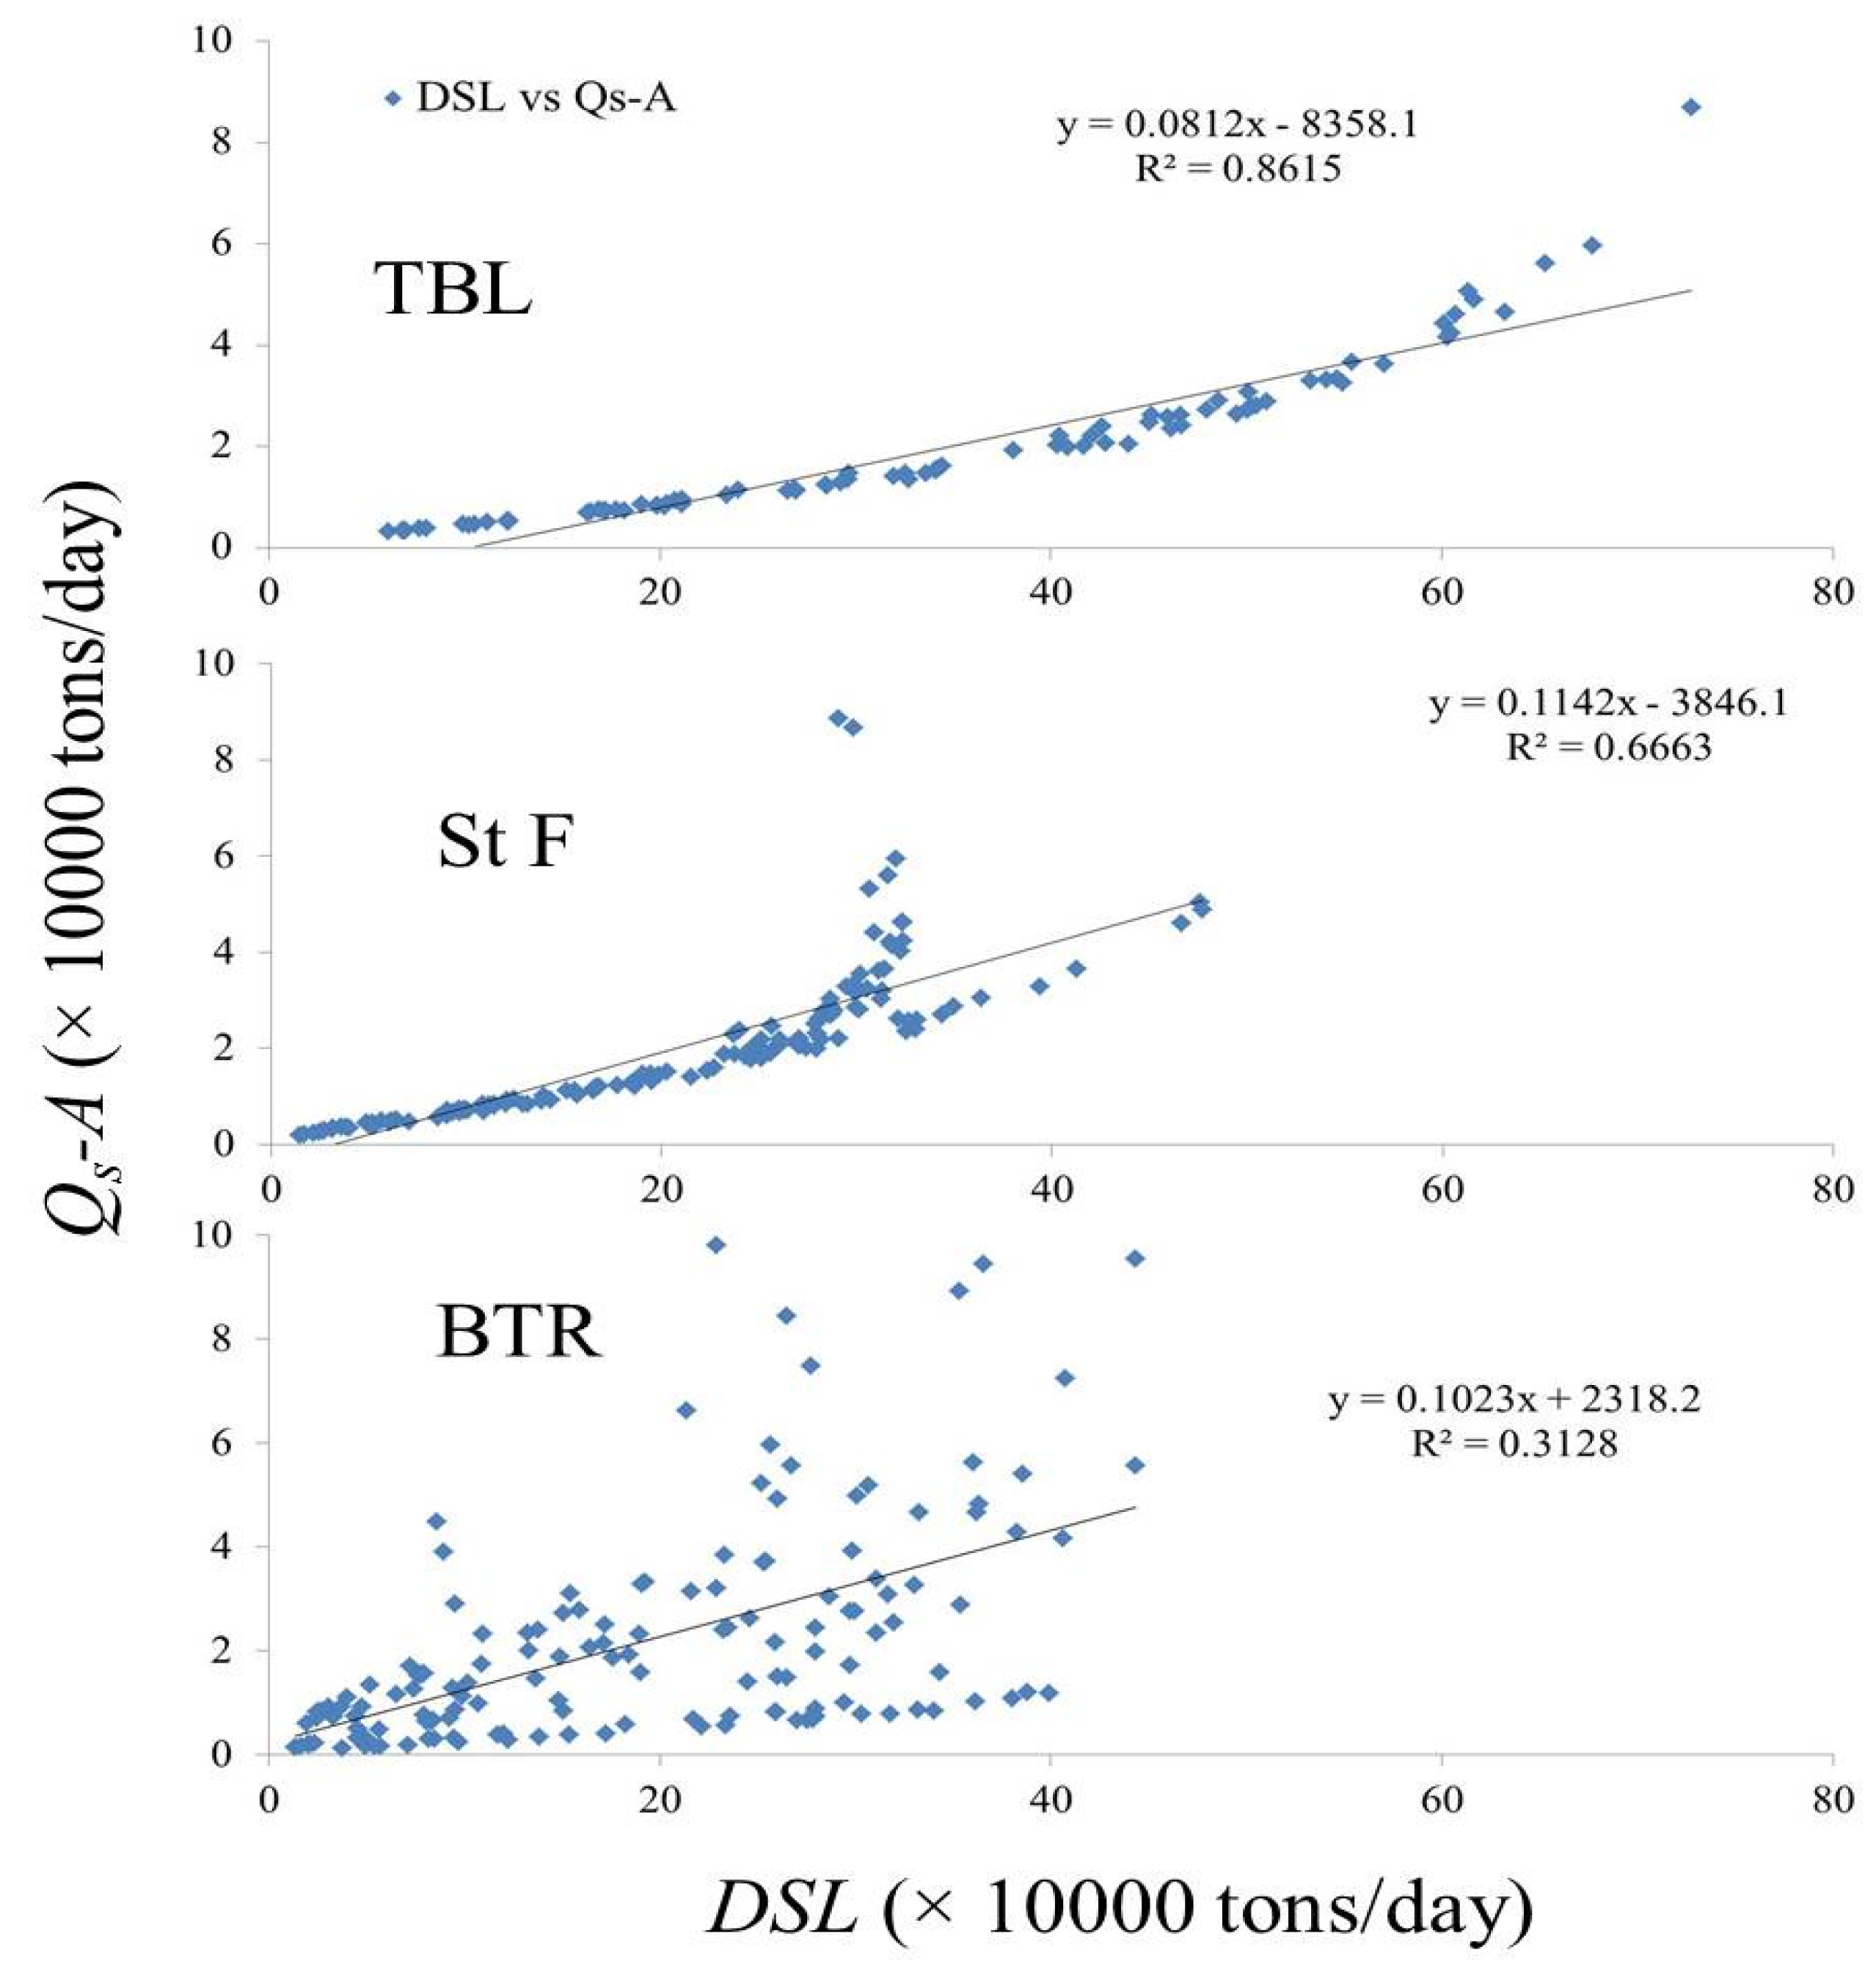
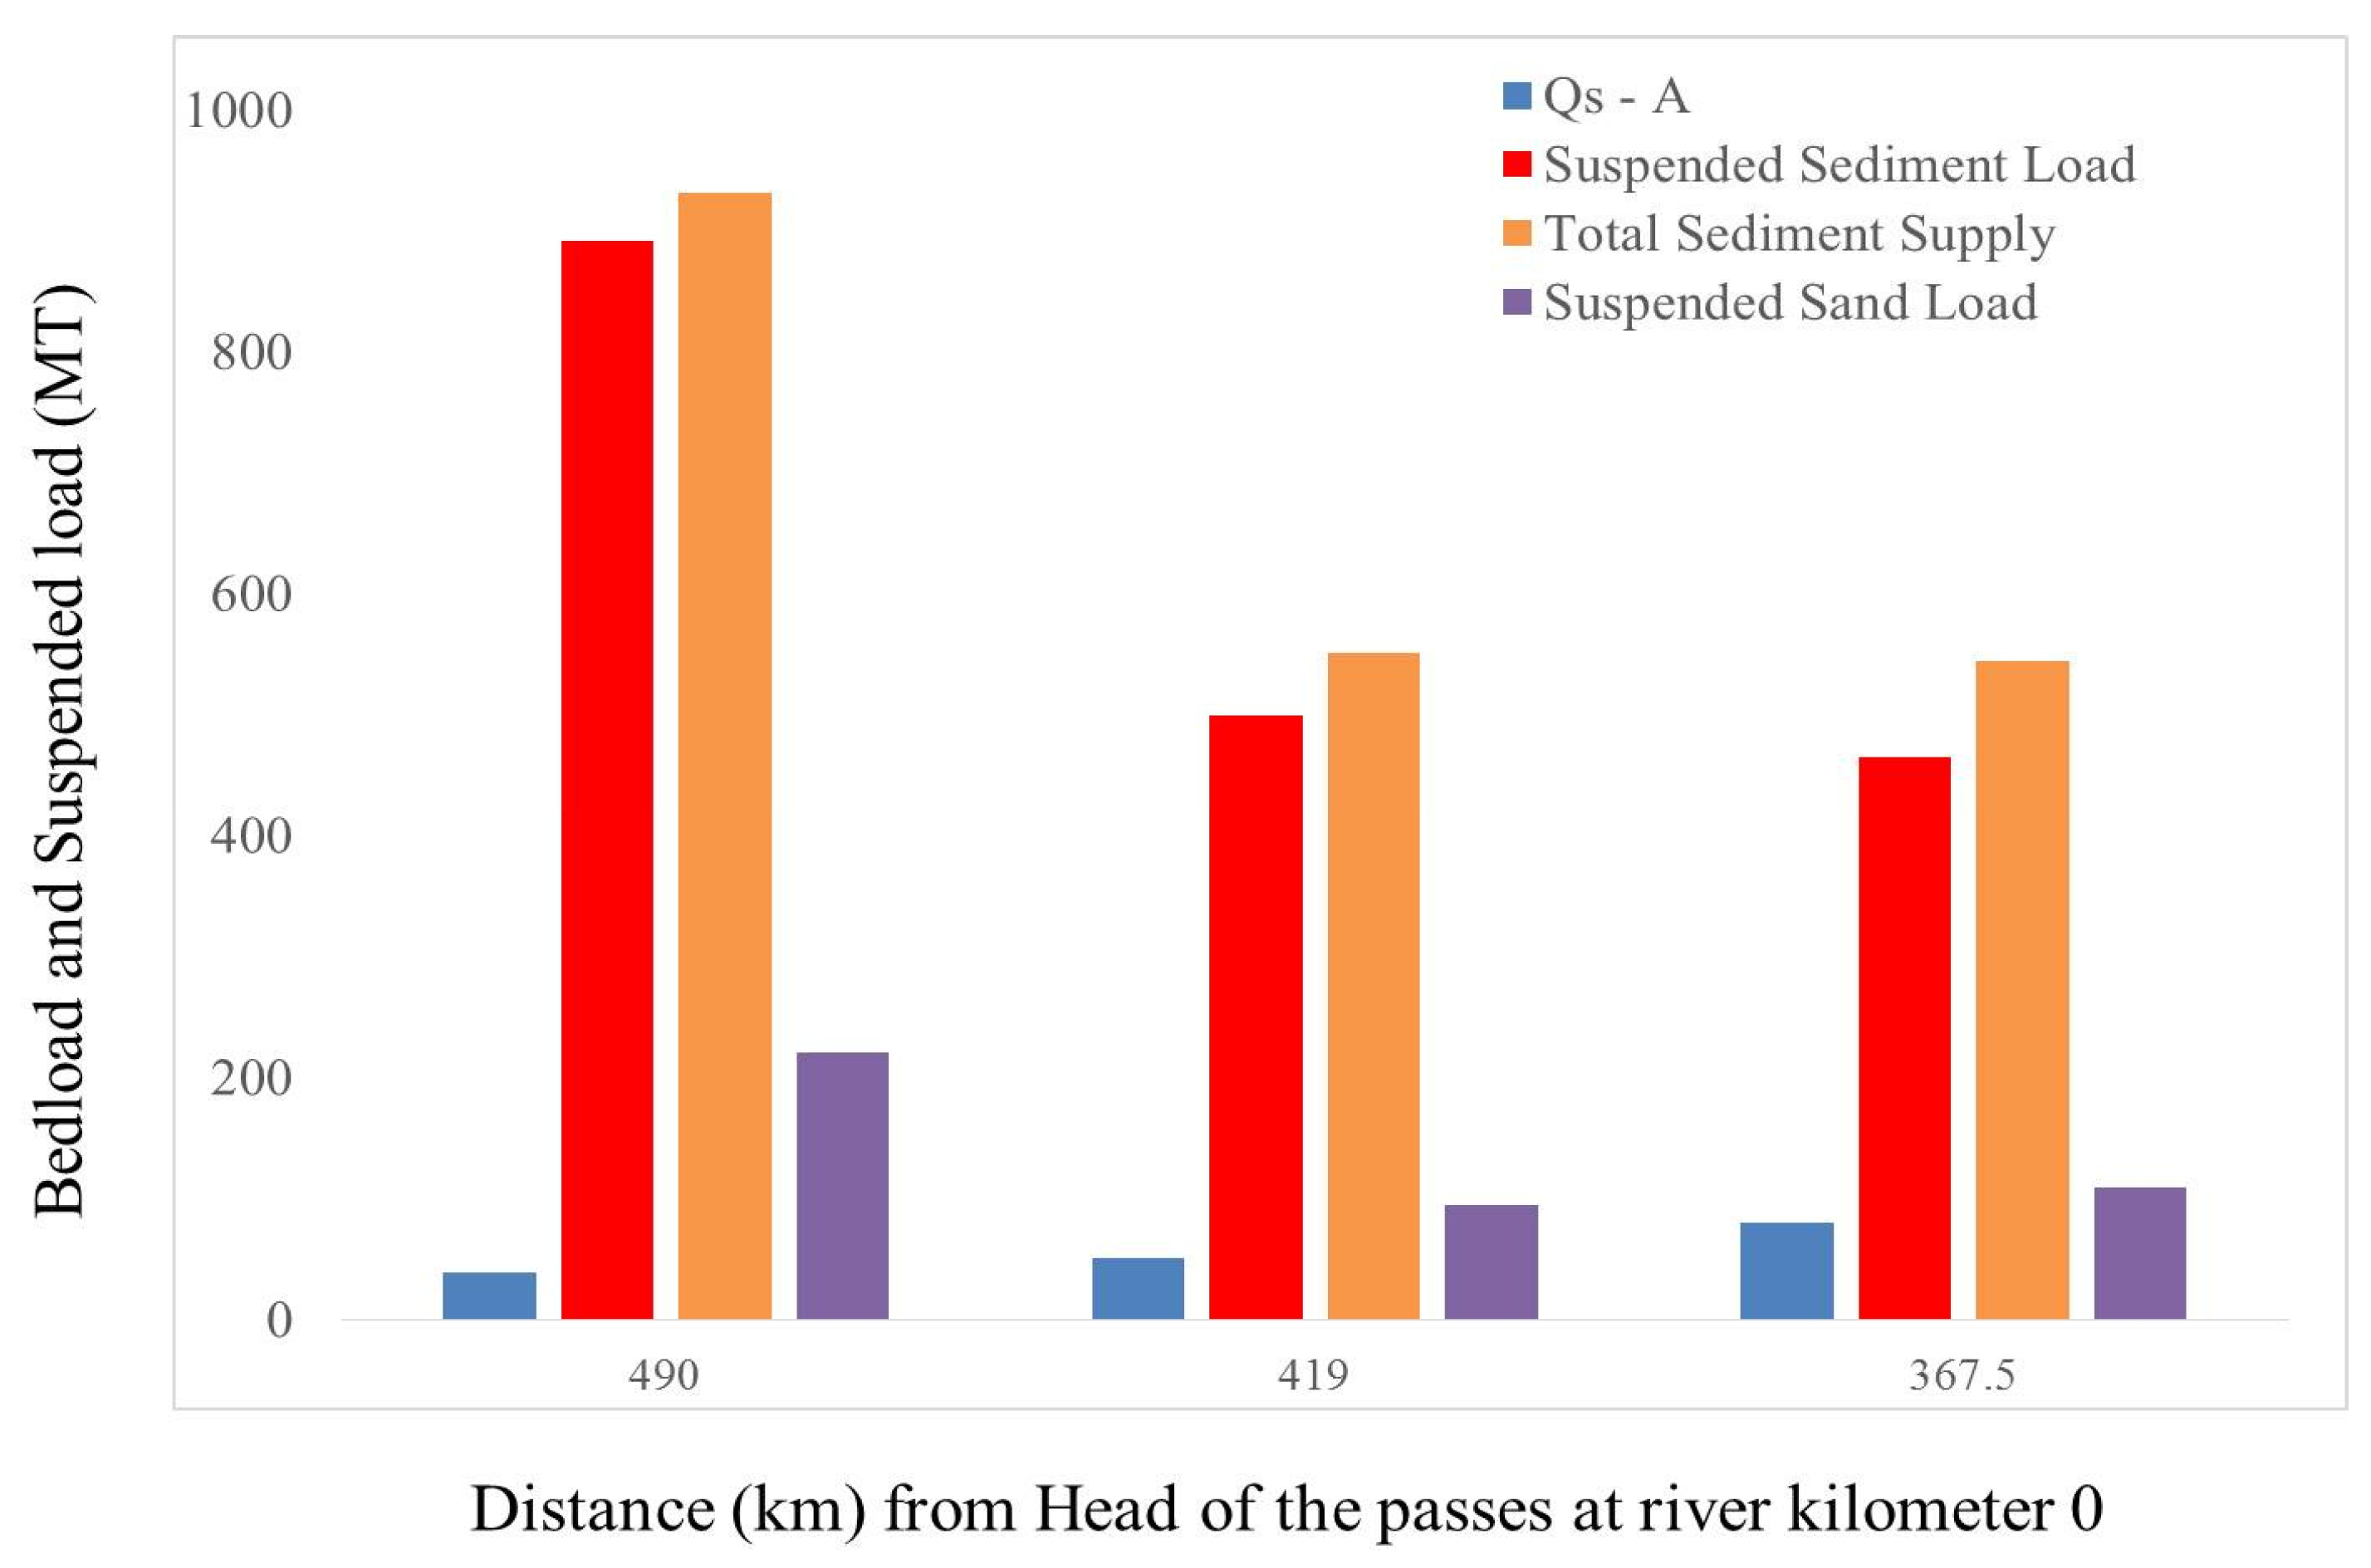
Table 1.
Trend-line equations between river width (y: dependent) and river stage (x: independent) for Tarbert Landing (TBL), St Francisville (St F) and Baton Rouge (BTR) of the LmMR during 2004–2015. These equations were further used for estimating daily river width from daily river stages at the three locations.
| Station | Trend-Line Equation | R2 | RMSE (m) |
|---|---|---|---|
| TBL | y = 20.258x + 1122.8 | 0.85 | 34.6 |
| St F | y = 12.881x + 1165.9 | 0.82 | 24.2 |
| BTR | y = 30.218x + 428.3 | 0.93 | 27.8 |
Table 2.
Discharge-suspended sediment load rating curves developed for St Francisville (St F) and Baton Rouge (BTR) of the LmMR. Here, ln (Qd) is the independent variable and ln (DSL) is the dependent variable.
Table 2.
Discharge-suspended sediment load rating curves developed for St Francisville (St F) and Baton Rouge (BTR) of the LmMR. Here, ln (Qd) is the independent variable and ln (DSL) is the dependent variable.
| Station | Period | Discharge—Sediment Load Rating Curve | Model | R2 |
|---|---|---|---|---|
| St F | 1978–2015 | ln (DSL) = 1.3785 ln (Qd) − 1.403 | Linear | 0.7 |
| ln (DSL) = −0.6481 [ln (Qd)]2 + 13.681 ln (Qd) − 59.14 | Polynomial | 0.75 | ||
| 1978–1987 | ln (DSL) = 1.4571 ln (Qd) − 1.3486 | Linear | 0.79 | |
| ln (DSL) = −0.4501 [ln (Qd)]2 + 9.9418 ln (Qd) − 41.202 | Polynomial | 0.81 | ||
| 1988–1997 | ln (DSL) = 1.4832 ln (Qd) − 1.9091 | Linear | 0.77 | |
| ln (DSL) = −0.6171 [ln (Qd)]2 + 13.218 ln (Qd) − 57.489 | Polynomial | 0.82 | ||
| 1998–2007 | ln (DSL) = 1.6499 ln (Qd) − 3.624 | Linear | 0.81 | |
| ln (DSL) = −0.5798 [ln (Qd)]2 + 12.599 ln (Qd) − 55.148 | Polynomial | 0.84 | ||
| 2008–2015 | ln (DSL) = 1.1938 ln (Qd) + 0.5659 | Linear | 0.66 | |
| ln (DSL) = −0.8644 [ln (Qd)]2 + 17.718 ln (Qd) − 78.173 | Polynomial | 0.81 | ||
| BTR | 2004–2015 | ln (DSL) = 1.4679 ln (Qd) − 2.0093 | Linear | 0.77 |
| ln (DSL) = −0.6416 [ln (Qd)]2 + 13.751 ln (Qd) − 60.636 | Polynomial | 0.82 |
Table 3.
Discharge-suspended sand load rating curves developed for St Francisville (St F) and Baton Rouge (BTR) of the LmMR. Here, ln (Qd) is the independent variable and ln (DSLs) is the dependent variable.
Table 3.
Discharge-suspended sand load rating curves developed for St Francisville (St F) and Baton Rouge (BTR) of the LmMR. Here, ln (Qd) is the independent variable and ln (DSLs) is the dependent variable.
| Station | Period | Discharge—Sand Load Rating Curve | Model | R2 |
|---|---|---|---|---|
| St F | 1978–2015 | ln (DSLs) = 2.4916 ln (Qd) − 13.512 | Linear | 0.74 |
| ln (DSLs) = −0.949 [ln (Qd)]2 + 20.491 ln (Qd) − 98.512 | Polynomial | 0.78 | ||
| 1978–1987 | ln (DSLs) = 2.4591 ln (Qd) − 12.768 | Linear | 0.81 | |
| ln (DSLs) = −0.5452 [ln (Qd)]2 + 12.737 ln (Qd) − 61.046 | Polynomial | 0.82 | ||
| 1988–1996 | ln (DSLs) = 2.5655 ln (Qd) − 14.027 | Linear | 0.81 | |
| ln (DSLs) = −0.8396 [ln (Qd)]2 + 18.465 ln (Qd) − 89.021 | Polynomial | 0.84 | ||
| 1997 | ln (DSLs) = 2.3645 ln (Qd) − 13.001 | Linear | 0.58 | |
| ln (DSLs) = −1.1882 [ln (Qd)]2 + 25.326 ln (Qd) − 123.47 | Polynomial | 0.62 | ||
| 1998–2007 | ln (DSLs) = 2.8754 ln (Qd) − 17.322 | Linear | 0.81 | |
| ln (DSLs) = −0.7322 [ln (Qd)]2 + 16.701 ln (Qd) − 82.383 | Polynomial | 0.82 | ||
| 2008–2015 | ln (DSLs) = 2.4618 ln (Qd) − 13.512 | Linear | 0.74 | |
| ln (DSLs) = −1.4879 [ln (Qd)]2 + 30.908 ln (Qd) − 149.05 | Polynomial | 0.86 | ||
| BTR | 2004–2015 | ln (DSLs) = 3.2306 ln (Qd) − 20.967 | Linear | 0.85 |
| ln (DSLs) = −0.6648 [ln (Qd)]2 + 15.957 ln (Qd) − 81.709 | Polynomial | 0.86 |
Table 4.
Root mean square errors (RMSEs) (tonnes) of Daily Sediment Loads (DSL) predicted through discharge-sediment load rating curves for each period at St Francisville (St F) and Baton Rouge (BTR) as shown in Table 1. Here, SE is the standard error and CF-Poly is the Duan correction factor used in polynomial rating curves, while CF-Lin is the Duan correction factor used in linear rating curves. “No CF” represents DSLs calculated without applying correction factors during their retransformation from predicted ln DSLs while “CF” represents DSLs calculated by applying the correction factors during the retransformation procedure.
| Station | Period | RMSE—No CF (Polynomial) | RMSE—No CF (Linear) | SE | CF-Poly | CF-Lin | RMSE-CF (Polynomial) | RMSE-CF (Linear) |
|---|---|---|---|---|---|---|---|---|
| St F | 1978–2015 | 174,238 | 186,620 | 0.496 | 1.099 | 1.13 | 170,877 | 193,579 |
| 1978–1987 | 171,919 | 198,282 | 0.418 | 1.076 | 1.091 | 169,392 | 205,935 | |
| 1988–1997 | 162,465 | 187,405 | 0.472 | 1.081 | 1.109 | 160,521 | 197,703 | |
| 1998–2007 | 122,371 | 139,538 | 0.414 | 1.075 | 1.084 | 121,050 | 144,344 | |
| 2008–2015 | 101,945 | 162,710 | 0.434 | 1.04 | 0.65 | 100445 | 197,449 | |
| BTR | 2004–2015 | 105,616 | 129,019 | 0.401 | 1.123 | 1.081 | 111393 | 134,824 |
Table 5.
Root mean square errors (RMSEs) (tonnes) of Daily Sand Loads (DSLs) predicted through discharge-sand load rating curves for each period at St Francisville (St F) and Baton Rouge (BTR) as shown in Table 1. Specific terminologies in the table i.e., No CF, SE, CF-Poly, CF-Lin, are same as explained in Table 4.
| Station | Period | RMSE—No CF (Polynomial) | RMSE—No CF (Linear) | SE | CF-Poly | CF-Lin | RMSE-CF (Polynomial) | RMSE-CF (Linear) |
|---|---|---|---|---|---|---|---|---|
| St F | 1978–2015 | 59,781 | 66,486 | 0.805 | 1.6 | 1.57 | 61,998 | 104,085 |
| 1978–1987 | 54,362 | 69,469 | 0.655 | 1.291 | 1.324 | 58,797 | 92,190 | |
| 1988–1996 | 50,127 | 53,568 | 0.705 | 1.343 | 1.369 | 52,548 | 78,803 | |
| 1998–2007 | 35,912 | 41,464 | 0.738 | 1.408 | 1.398 | 40,349 | 61,274 | |
| 2008–2015 | 29,785 | 60,848 | 0.743 | 1.204 | 1.374 | 30,397 | 86,911 | |
| BTR | 2004–2015 | 46,263 | 77,483 | 0.683 | 1.216 | 1.253 | 51,084 | 105,184 |
Table 6.
Suspended sediment loads discharged Tarbert Landing (TBL), St Francisville (St F) and Baton Rouge (BTR) of the LmMR during overlapping periods between each site. Sediment loads for TBL were taken from Rosen and Xu [28].
Table 6.
Suspended sediment loads discharged Tarbert Landing (TBL), St Francisville (St F) and Baton Rouge (BTR) of the LmMR during overlapping periods between each site. Sediment loads for TBL were taken from Rosen and Xu [28].
| Sites | Matching Periods | Higher DSL (MT) (Site) | Lower DSL (MT) (Site) | Difference (MT) | Difference/Year (MT) |
|---|---|---|---|---|---|
| TBL-St F | 1980–2010 | 3929.11 (TBL) | 3086.45 (St F) | 842.66 | 27.18 |
| TBL-BTR | 2004–2010 | 891.86 (TBL) | 464.64 (BTR) | 427.22 | 61.03 |
| St F-BTR | 2004–2015 | 809.30 (St F) | 806.08 (BTR) | 3.22 | 0.27 |
Table 7.
Sand loads discharged at Tarbert Landing (TBL), St Francisville (St F) and Baton Rouge (BTR) of the LmMR during overlapping periods between each site. Sand loads for TBL were taken from Joshi and Xu [31].
Table 7.
Sand loads discharged at Tarbert Landing (TBL), St Francisville (St F) and Baton Rouge (BTR) of the LmMR during overlapping periods between each site. Sand loads for TBL were taken from Joshi and Xu [31].
| Sites | Matching Periods | Higher DSLs (MT) (Site) | Lower DSLs (MT) (Site) | Difference (MT) | Difference/Year (MT) |
|---|---|---|---|---|---|
| TBL-St F | 1978–2013 | 978.71 (TBL) | 726.08 (St F) | 252.63 | 7.017 |
| TBL-BTR | 2004–2013 | 313.75 (TBL) | 159.09 (BTR) | 154.66 | 15.47 |
| St F-BTR | 2004–2015 | 192.96 (BTR) | 157.89 (St F) | 35.07 | 2.92 |
© 2017 by the authors. Licensee MDPI, Basel, Switzerland. This article is an open access article distributed under the terms and conditions of the Creative Commons Attribution (CC BY) license (http://creativecommons.org/licenses/by/4.0/).
Share and Cite
MDPI and ACS Style
Joshi, S.; Xu, Y.J. Bedload and Suspended Load Transport in the 140-km Reach Downstream of the Mississippi River Avulsion to the Atchafalaya River. Water 2017, 9, 716. https://doi.org/10.3390/w9090716
AMA Style
Joshi S, Xu YJ. Bedload and Suspended Load Transport in the 140-km Reach Downstream of the Mississippi River Avulsion to the Atchafalaya River. Water. 2017; 9(9):716. https://doi.org/10.3390/w9090716
Chicago/Turabian StyleJoshi, Sanjeev, and Y. Jun Xu. 2017. "Bedload and Suspended Load Transport in the 140-km Reach Downstream of the Mississippi River Avulsion to the Atchafalaya River" Water 9, no. 9: 716. https://doi.org/10.3390/w9090716
Note that from the first issue of 2016, this journal uses article numbers instead of page numbers. See further details here.