A Multi-Dimensional Equilibrium Allocation Model of Water Resources Based on a Groundwater Multiple Loop Iteration Technique

1
College of Water Conservancy and Hydropower Engineering, Hohai University, Nanjing 210098, China
2
Department of Water Resources, China Institute of Water Resources and Hydropower Research, Beijing 100038, China
3
Construction and Administration Bureau of South-to-North Water Diversion Middle Route Project, Beijing 100038, China
*
Author to whom correspondence should be addressed.
Water 2017, 9(9), 718; https://doi.org/10.3390/w9090718
Submission received: 4 August 2017
/
Revised: 8 September 2017
/
Accepted: 14 September 2017
/
Published: 19 September 2017
(This article belongs to the Special Issue Planning and Operations of Multi-Objective River and Reservoir Systems)
Abstract
:In this paper, a multi-dimensional equilibrium allocation model of water resources was developed based on the groundwater multiple loop iteration technique. The proposed model is an integrated framework of three modules respectively corresponding to the input layer, operation layer, and feedback layer in the allocation process. Firstly, a prediction model integrating the genetic algorithm-back propagation (GA-BP) model, the general regression neural network (GRNN) model, and the support vector machine (SVM) model was built to predict the future reservoir runoff, and the results were entered into the database of an optimal allocation model. Furthermore, taking exploitable groundwater as the feedback factor, the water resource optimal allocation model was continuously optimized. Also, the groundwater multiple loop iteration technique was applied to the feedback process. The proposed model was successfully applied to a typical region in Jinan, Eastern China. The uncertainties of future reservoir runoff and exploitable groundwater were taken into account. The results revealed that groundwater represented 36.6% of water supply in the base year, indicating that it is the main water source in Jinan. However, the amount of groundwater mining was decreased after considering the exploitable groundwater. The developed framework provides a comprehensive approach towards optimal future allocation of water resources, especially for the regions with overexploited groundwater.
1. Introduction
In the 21th century, due to an explosive growth of population and unreasonable utilization of water resources, as well as serious water pollution and a deteriorating ecological environment, water shortage is increasingly replacing the oil crisis as a severe worldwide problem. Water resource allocation is one of the most effective methods for addressing this issue, and it can provide a relatively harmonious environment with respect to water resource, social and economic, and eco-environmental systems.
Due to computer technology and systematic analysis methods, more in-depth research on water resource allocation is being performed. Most of researchers put focus on the modification of the allocation model and its optimization algorithm [1,2]. Dong et al. [3] developed a two-stage regional multi-water source allocation model to determine the characteristics of water supply sources, which consist of surface water, groundwater, and transit water. Similarly, Zeng et al. [4] introduced scenario-based interval-stochastic fraticle optimization with Laplace criterion method which can tackle the uncertainties presented as interval parameters and probability distributions for sustainable water resources allocation and water quality management under multiple uncertainties. Meanwhile, the coupling of the water resource allocation model with the economic model, the hydrological model, and the water management model, is becoming the new trend of development. Minsker et al. [5] presented a multi-objective analysis model of water resources to simulate the various uncertainties in water resources system under the consideration of hydrological uncertainty and multi-objective characteristics. Similarly, Yang et al. [6] analyzed the coupling technology of the groundwater model and the water resource allocation model, and then built the multi-objective water resource allocation model. Some other researchers, such as Rosegrantm et al. [7], coupled the hydrological model with the economic development model to improve the economic benefits of water resource utilization. Geographic Information System (GIS) technology has been widely utilized in recent years and in 2003, MiKinney and Cai [8] developed the multi-objective water resource optimal allocation model in the Aral Sea Basin based on a coupling between GIS technology and water management technology. In China, many attempts have been made to modify the allocation model. Wei et al. [9,10,11] combined the water quality model and the groundwater model with the water resource optimal allocation model to construct water resource total factor optimal allocation which considered the whole factors in the water resource system. Many researchers have noticed the impacts of the market economic system, water rights trade, and organizational management on water allocation. In 2007, Wang et al. [12] applied the game theory to the areas of water rights trade and the water market, and built the water resource allocation model based on water rights allocation. In 2012, Kucukmehmetoglu [13] introduced the game theory and Pareto optimization theory to the cross-border river basin and proposed a new idea of water resource allocation at the national strategic level. Similarly, in 2013, Jafarzadegan et al. [14] studied water rights allocation and its policy among all water users based on systematic dynamics. For riparian countries of transboundary river, the problem of water sharing is still a great challenge. Avarideh et al. [15] has developed a new conceptual model which was applied to the Sirwan-Diyala transboundary river shared by Iran and Iraq. Some indicators are developed and quantified for the determination of water shares and different scenarios considering extreme and equal weights of the factors are defined.
In summary, a general survey has been carried out on the research results of water resource allocation since the beginning of the 21th century, focusing mainly on modifications of the optimization algorithm and their theoretical basis. For water resource conditions, most studies only considered the impacts from existing conditions. However, the allocation implements of water resources are not only affected by future water resource conditions, but also have some impacts on them. Hence, this study aims to comprehensively consider the changes of future reservoir runoff, as well as the dynamic changes of exploitable groundwater in the process of water resource optimal allocation. Taking the water resource optimal allocation model as the core, the multi-dimensional equilibrium allocation model of water resources based on groundwater multiple loop iteration technique was proposed effectively. This study considers the uncertainties of future reservoir runoff and exploitable groundwater in the process of macroscopically allocating water resources to some extent. An integrated prediction model will be constructed firstly to predict the future reservoir runoff and the results will be considered as part of the input data for the water resource allocation model. Furthermore, a groundwater equilibrium model will be adopted to feedback the allocation results. Through the multiple loop iteration technique, water resource allocation results will be continuously optimized until the exploitable groundwater meets the requirements.
The structure of this paper is organized as follows: the next section describes the methodology, including model generalization and multiple loop iteration technique. Section 3 describes the case study, which consists of study area, data collection and water resource deployment network chart. Section 4 shows the main results and discussion, and this is followed by the conclusions in the final section.
2. Methodology
2.1. Model Generalization
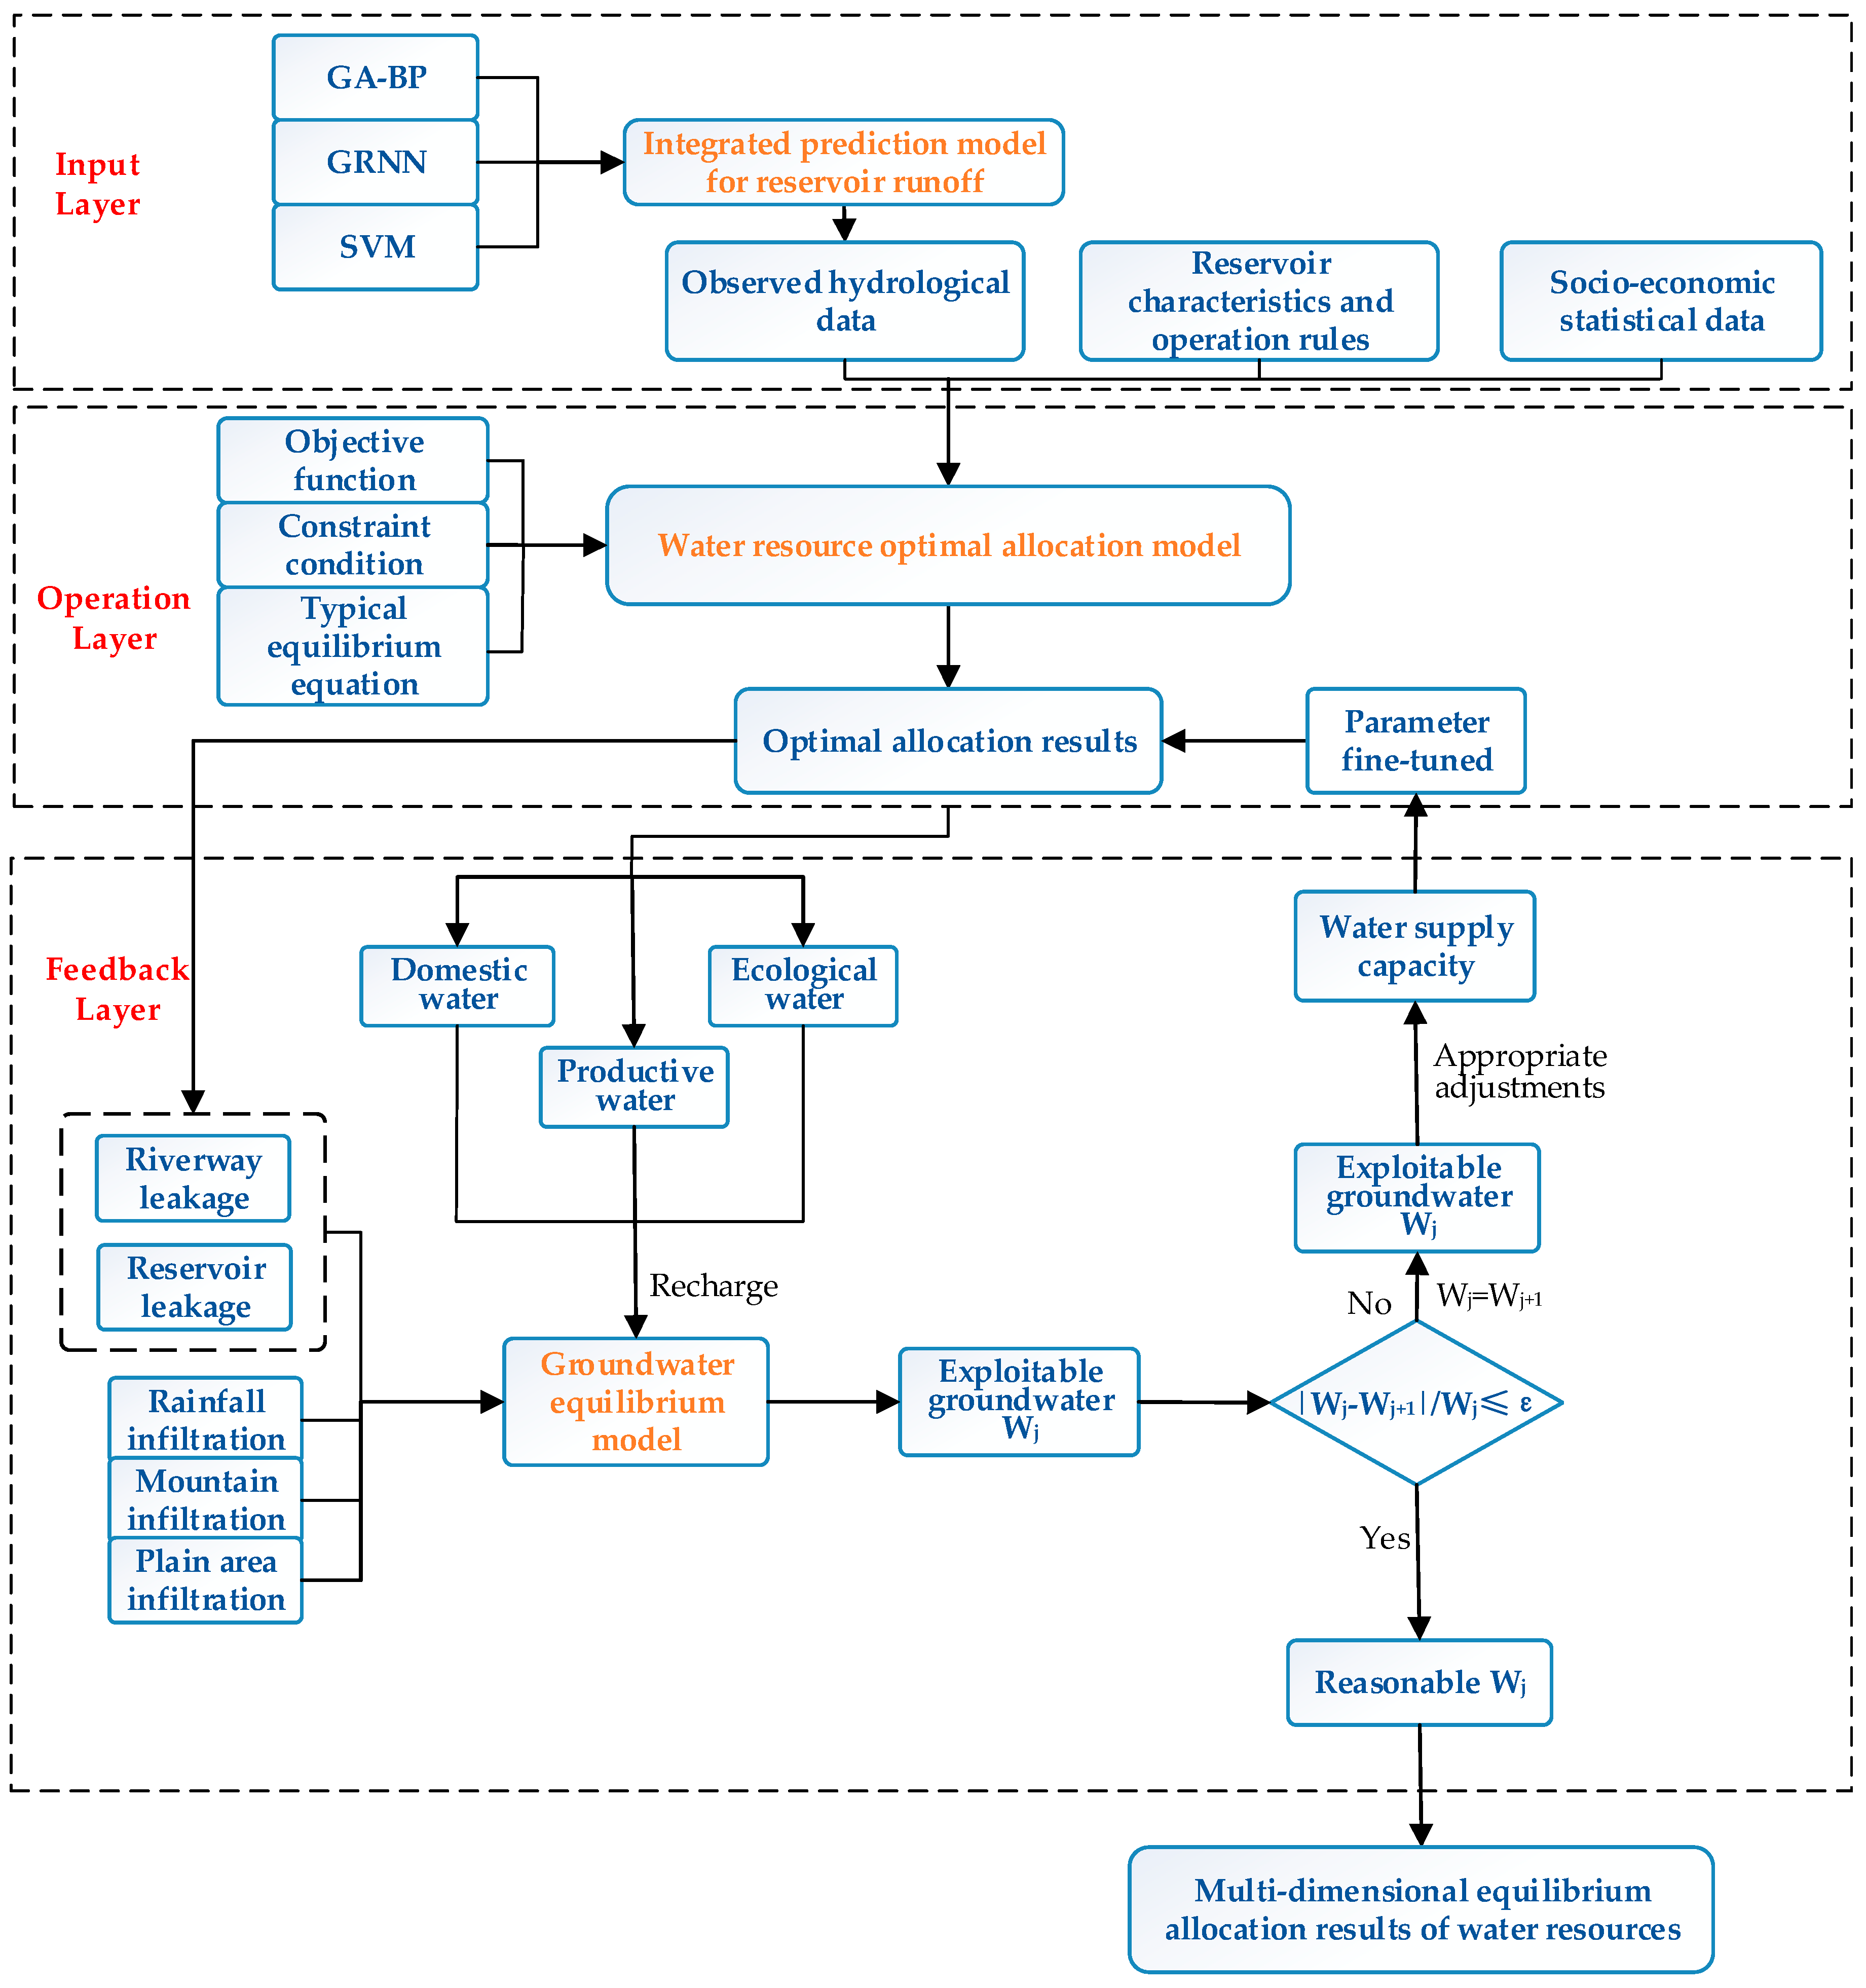
The framework that we propose to allocate water resources effectively and fairly is shown in Figure 1. The proposed multi-dimensional equilibrium allocation model of water resources comprises three modules: (a) an integrated prediction module for reservoir runoff; (b) a water resource optimal allocation module; (c) a groundwater equilibrium module. The three modules correspond to the input layer, operation layer and feedback layer, respectively. Furthermore, the layers responds to one another well. It is worth noting that this study focuses on the internal response relationships of these three modules and the integration technology of the multi-dimensional equilibrium allocation model, rather than the single water resource optimal allocation model. Hence, detailed introduction of this module is omitted.
1. Input Layer: The Integrated Prediction Module for Reservoir Runoff.
Factors such as climate, underlying surface condition, and water project construction may affect future allocation plans of water resources. Therefore, it is necessary to predict the quantities of water which will flow into the reservoirs before the optimal allocation of water resources and set the new series of reservoir runoff as the inputs of allocation model.
Many single models have been adopted to predict the reservoir runoff in recent years. Nevertheless, the disadvantages of single models under their own operational principles are obvious. Taking the genetic algorithm-back propagation (GA-BP) model [16] as an example, the ability of the algorithm to adapt the input samples is higher than some other prediction models in previous research, rather, its accuracy is almost the lowest. Hence, the integrated prediction model was employed from three single models to develop their complementary advantages.
The accuracy of prediction model is the most widely accepted indicator which can reflect the difference level between the model prediction value and the measured value. The generalization of prediction model is the most appropriate indicator, which can represent the ability of the algorithm to adapt the input samples. Hence, these two indicators were selected to qualitatively identify the single model weights, and then the integrated prediction model for reservoir runoff was constructed based on the following integration technology [17,18].
where and are the integrated model prediction value and the single model prediction value, respectively (106 m3). is the number of single prediction models. In this study, the GA-BP model, general regression neural network (GRNN) model [19] and the support vector machine (SVM) model [20] were separately chosen to predict the future reservoir runoff and then . is the model weight for each single model and can be calculated based on the following analysis.
The average relative error (ARE) is selected as the specific indicator to represent the model accuracy. The smaller the ARE is, the higher model accuracy there is. Meanwhile, the ratio of root-mean-square error (RMSE) to determination coefficient (R2) is selected as the generalization () of prediction model. The bigger is, the greater the model generalization is. The specific calculation can be expressed as:
where and are the measured value and model prediction value of reservoir runoff (106 m3), respectively. and are the average values of measured series and predicted series (106 m3). is the length of sample series. The single model weights under each indicator can be calculated by the method of normalization expressed as follows.
Weight calculation of the single models under the indicator of accuracy:
Weight calculation of the single models under the indicator of generalization:
Comprehensive weight calculation of the single models:
where is the comprehensive weight of the ith single model. and are the weights of the ith single model under the indicator of accuracy and generalization. and are the weights of the indicator of accuracy and generalization.
2. Operation Layer: The Water Resource Optimal Allocation Module.
Taking the water resource optimal allocation model as the core [21], the water resource deployment network chart [22] is drawn firstly and the first water resource optimal allocation plan is developed based on some relative data, such as the observed hydrological data, reservoir characteristics and operation rules, and socio-economic statistical data, as well as the predetermined optimal rules, constraint conditions, objective functions, and typical equilibrium equations. The purpose of the first optimal allocation is to initially determine the model parameters and simulate the groundwater recharge for the feedback layer.
According to the actual situation in Jinan, the water sources in the allocation model should comprise surface water (SW), groundwater (GW), reclaimed water (RW), and transferred water (TW). Three parts form the objective function: (1) the minimum water deficit of society, economy and eco-environment; (2) the maximum water supply benefit; and (3) the minimum reservoir abandonment. The specific computational formulas of the three sub-objective functions, constraint conditions, and typical equilibrium equations can be found in the referenced literature [23,24].
where represents the comprehensive object of the optimal allocation model. , and represent the sub-objective functions of abovementioned three parts, respectively. , and are the weights of the three sub-objects, respectively.
3. Feedback Layer: The Groundwater Equilibrium Module.
The purpose of feedback layer is to modify the water resource optimal allocation results to meet the requirements of multi-dimensional equilibrium. The groundwater equilibrium model was chosen to feedback the exploitable groundwater. The relative results (seen as the groundwater recharge in Figure 1) from the operation layer should be applied as the input data to the groundwater equilibrium model, such as the recharge amounts of pipe network leakage, riverway and reservoir leakage, and field infiltration and well irrigation regression. The exploitable quantity of groundwater can be calculated according to Formulas (10)–(12), and is then fed back to the operation layer. The groundwater modeling system (GMS) was selected as the groundwater simulation tool and the equilibrium formulas are as follows:
For unconfined groundwater:
For confined groundwater:
where represents the groundwater recharge which consists of rainfall infiltration, mountain and plain area infiltration, pipe network and riverway leakage, and field infiltration and well irrigation regression (104 m3). represents the groundwater discharge, which consists of the lateral outflow, spring water discharge, evaporation discharge of phreatic water, and artificial extraction amounts (104 m3). is the groundwater level variation (m). and are the specific yield for unconfined groundwater and the elastic storativity for confined groundwater, respectively. is the intake area (m2). is the time length (s).
The mining coefficient method was adopted as follows:
where represents the exploitable quantity of groundwater (104 m3). is the coefficient of allowable withdrawal and it is related to the long-term series data of groundwater, the aquifer type, the mining conditions, and the actual mining status. The calculation of has been made in our previous research and for Jinan, in mountain area, in plain area.
2.2. Multiple-Loop Iteration Technique
The multi-dimensional equilibrium allocation model of water resources proposed in this study is actually driven by the input data and modified by the multiple loop iteration technique of groundwater. Through the monthly calculation and analysis, the water resource optimal allocation plans can meet the requirements of society, economy, and eco-environment, as well as the groundwater balance of exploitation and supplement. The specific operating steps for the multiple loop iteration technique of groundwater can be summarized as follows:
Step 1: According to the regional conditions of water resources, present economic and social situations, and future development planning, the water supply and demand scenarios in different planning periods are set, and the initial optimal allocation model is entered along with the other data. Among which, the integrated prediction results for reservoir runoff are chosen as one of the input data. The initial exploitable quantity of groundwater should be set as , .
Step 2: Through the monthly calculation from the water resource optimal allocation model, the first allocation results for the base year, the short-term (2020), and long-term (2030) periods are obtained initially.
Step 3: Taking the recharge amounts of pipe network leakage, riverway and reservoir leakage, field infiltration and well irrigation regression into the groundwater equilibrium model, the total amount of groundwater recharge can be obtained. Then, the exploitable quantity of groundwater under the first allocation can be calculated according to Formula (12). If (), then proceed to Step 4. Otherwise, set and repeat the previous calculation until it meets the condition.
Step 4: Stop the loop iterative calculation and export the final water resource allocation results. The final results should consist of the water balance between water supply and demand in the base year, the short-term and long-term periods, and the water usage and consumption in all industries, as well as the water supply from all sources.
3. Case Study
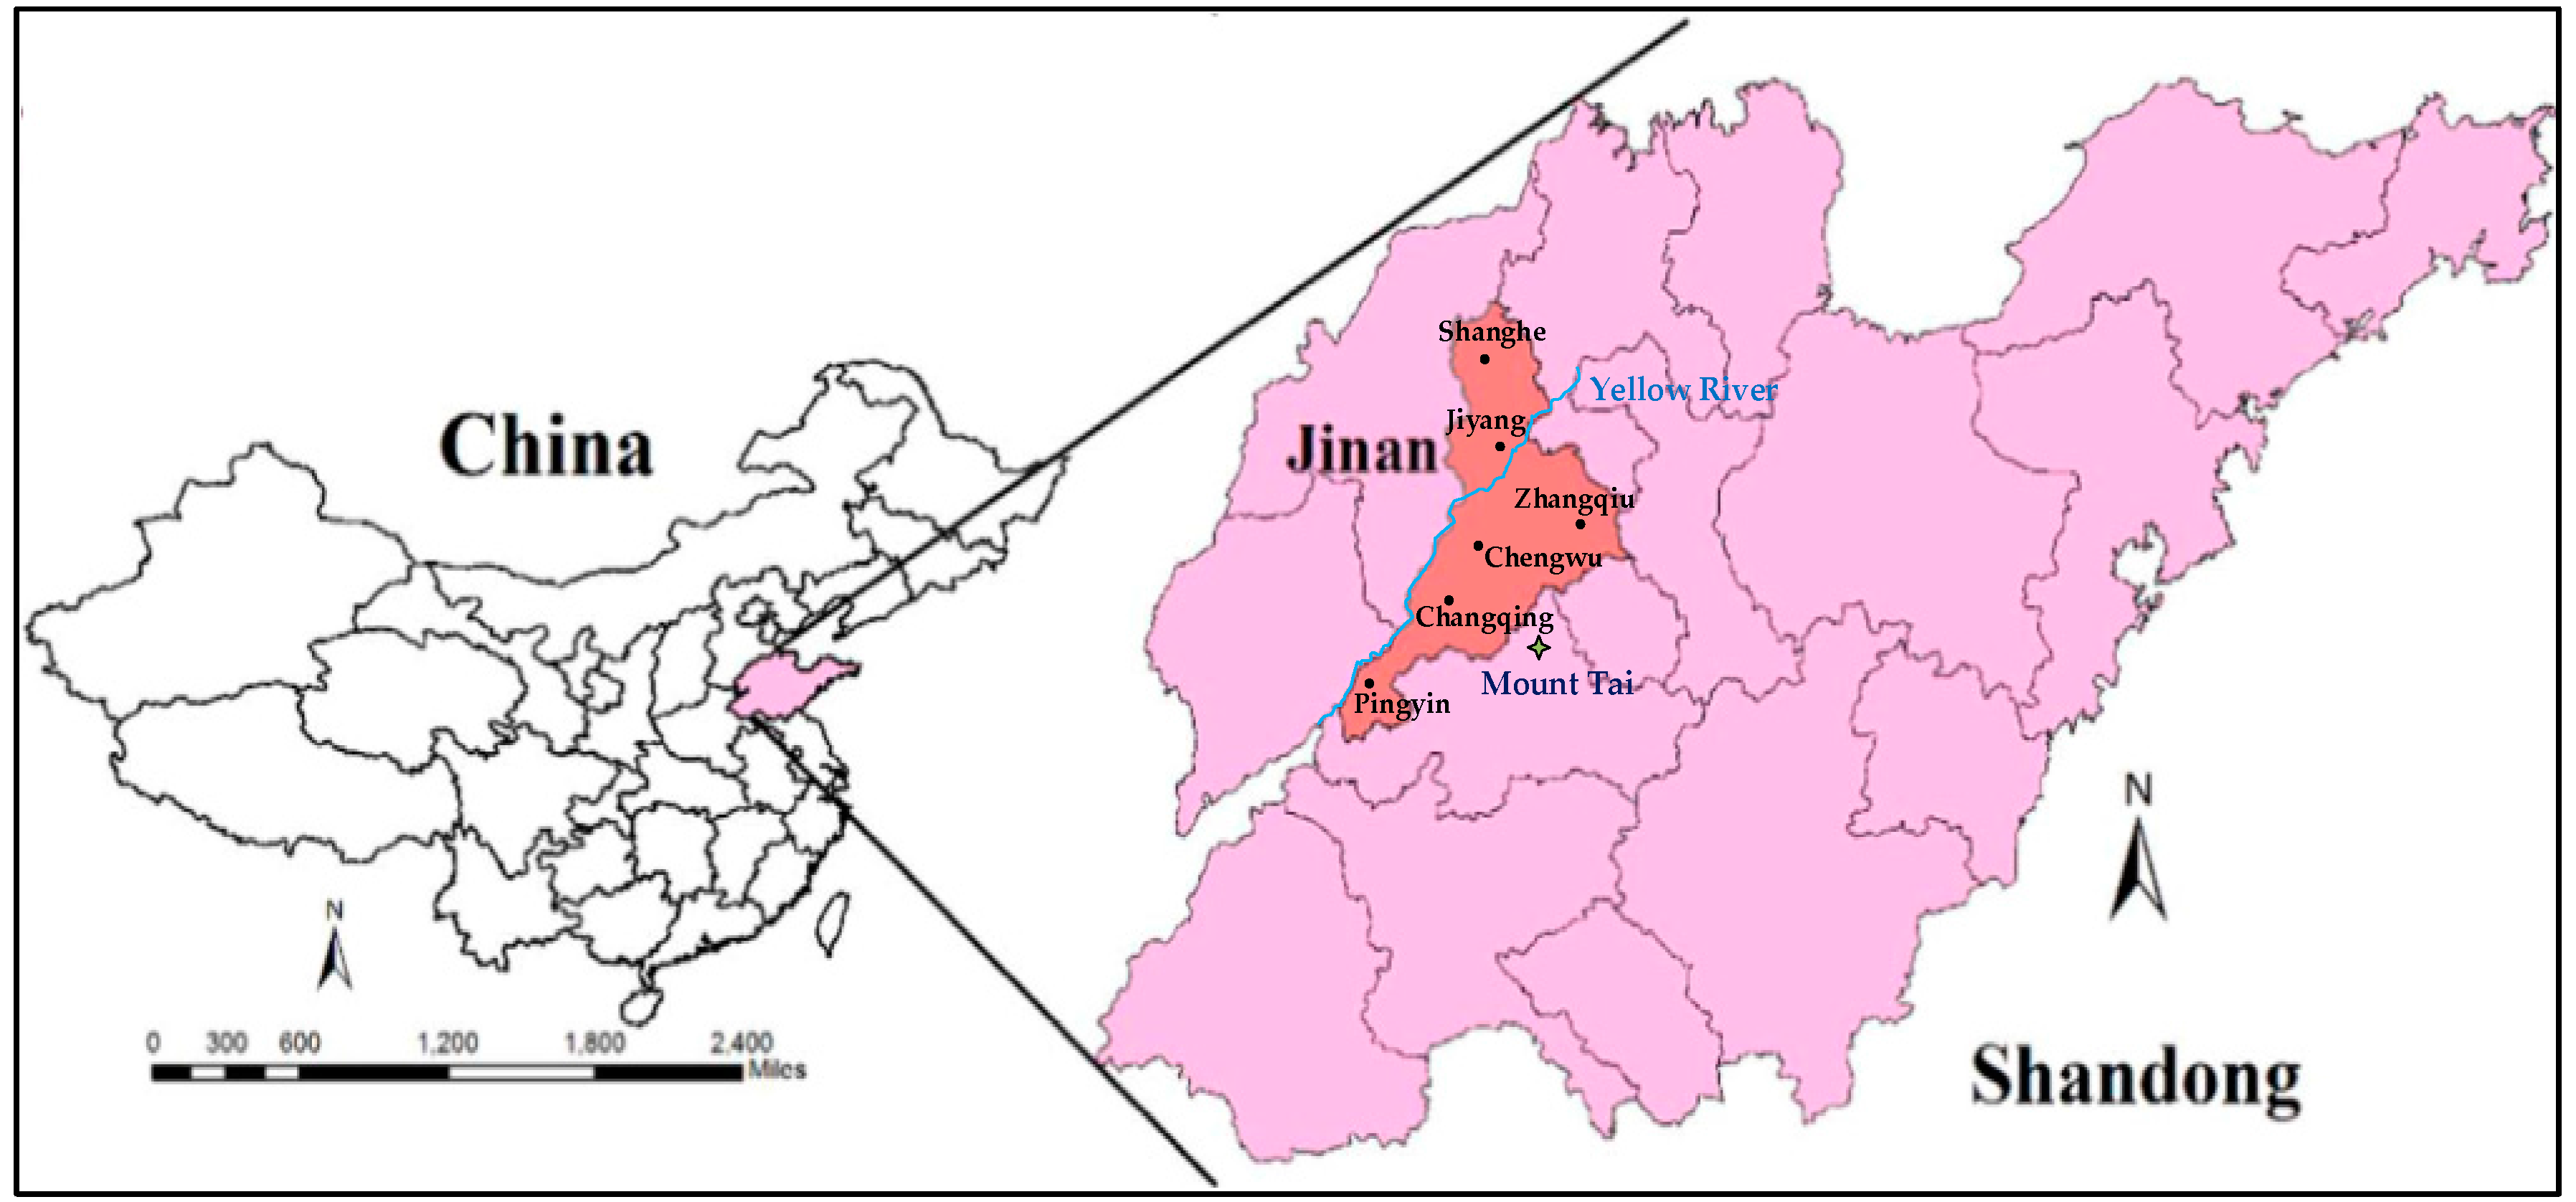
3.1. Study Area
The developed framework is applied to a real case study to demonstrate its feasibility and applicability. Jinan, the capital of Shandong Province, China, is located north of Mount Tai and across the Yellow River (geographical coordinates, 36°40′ N and 117°00′ E, see Figure 2). As the first pilot city of water ecological civilization construction named by the Ministry of Water Resources in 2013, Jinan is dubbed the “Spring City” due to its large number of diversiform springs. There are six districts, one city, and three counties in Jinan, which are called the Lixia District, Shizhong District, Tianqiao District, Huaiyin District, Licheng District, Changqing District, Zhangqiu City, Pingyin County, Shanghe County, and Jiyang County. Also, the first five districts are known in general as the Chengwu District. Three basins flow through Jinan, which are known as the Haihe Basin, the Huaihe Basin and the Yellow River Basin. Jinan covers an area of 8177 km2 and had a total population of 7.07 million, with a gross domestic product of 5770.6 billion yuan in 2014. The annual average precipitation is 648 mm and it is unevenly distributed in space which presents the decline trend from southeast to northwest.
3.2. Data Collection
The year 2014 was set as the base year, and the years 2020 and 2030 as the two planning periods, i.e., short-term and long-term periods, respectively. The statistical data for social and economic developments came from the Jinan Statistical Yearbook (2014) [25] and National Economic and Social Development Statistical Bulletin (2014) released by the Jinan Statistical Information Network [26]. Historical inflows of reservoirs over 1956–2014 and their characteristics and operation rules, as well as water quality and quantity basic data, were collected from the network of Hydrological Information Port of Jinan [27] and other related data.
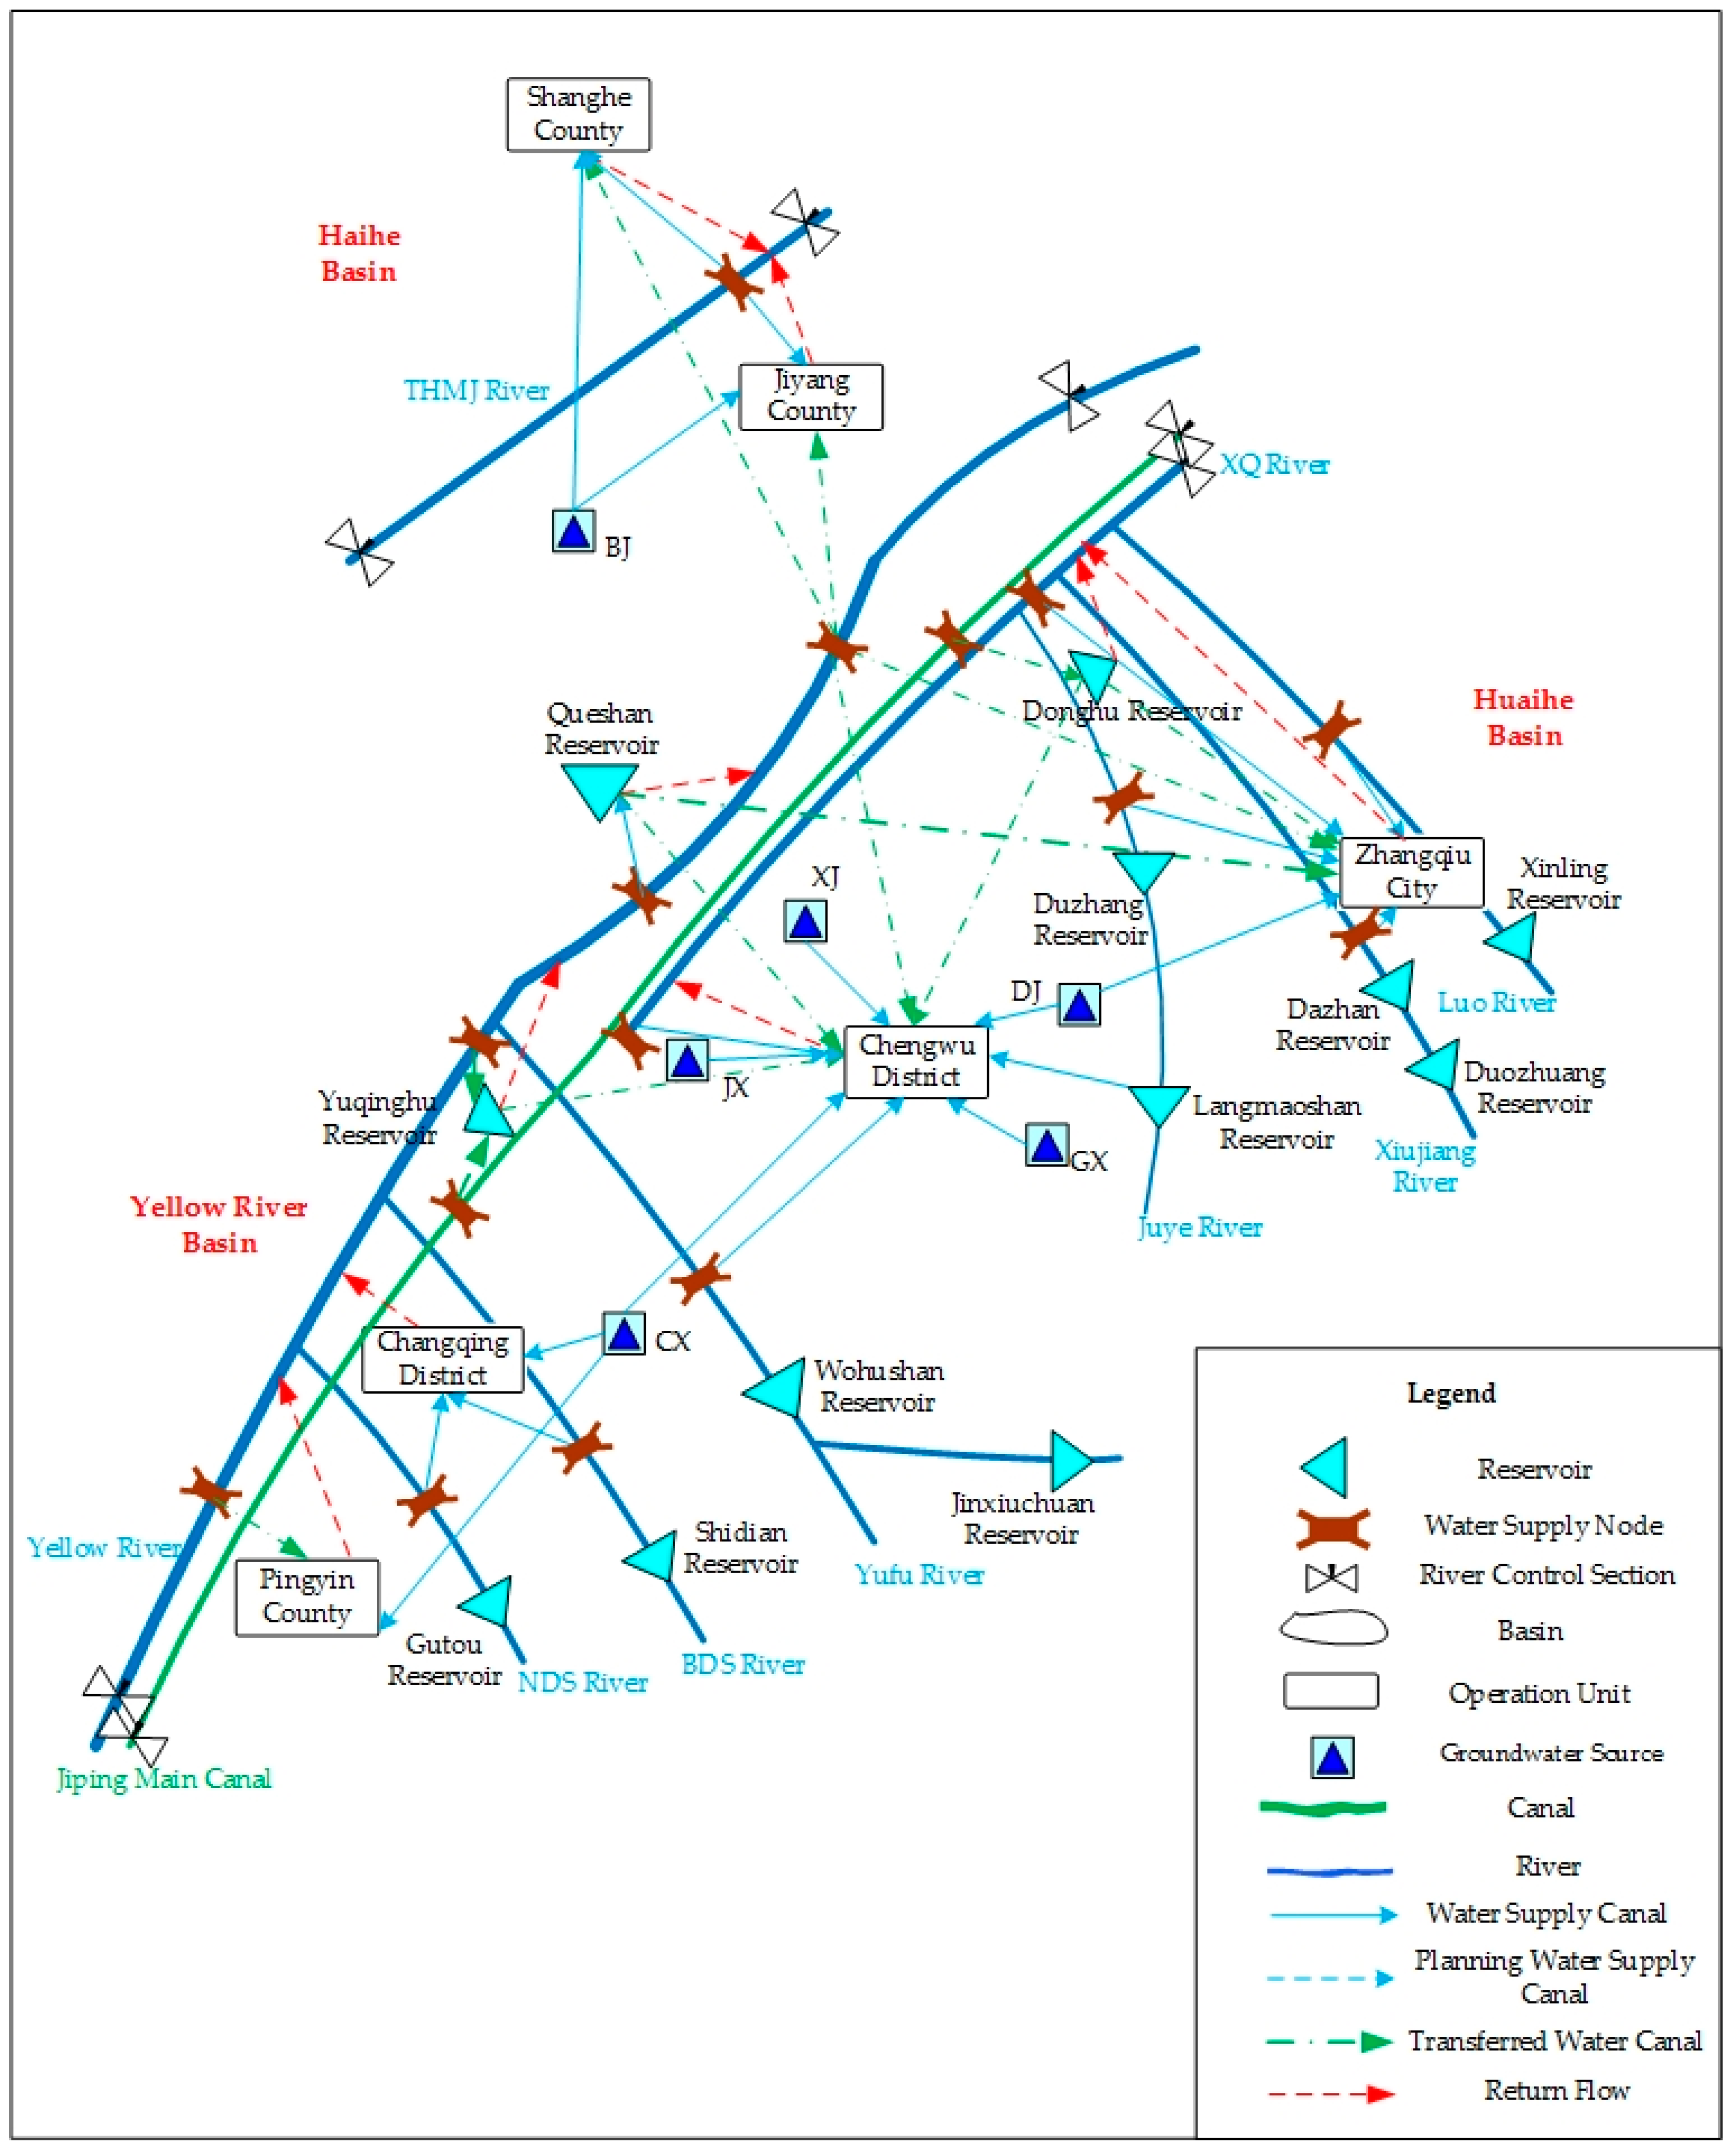
3.3. Water Resource Deployment Network Chart
To construct the multi-dimensional equilibrium allocation model of water resources, the deployment network chart is divided into 6 units and 22 basic engineering nodes depicted in Figure 3 according to intersections of both watershed and administrative county regions. There are 12 reservoirs in this network chart, three of which are plain reservoirs.
4. Results Analysis and Discussion
4.1. Integrated Prediction for Reservoir Runoff
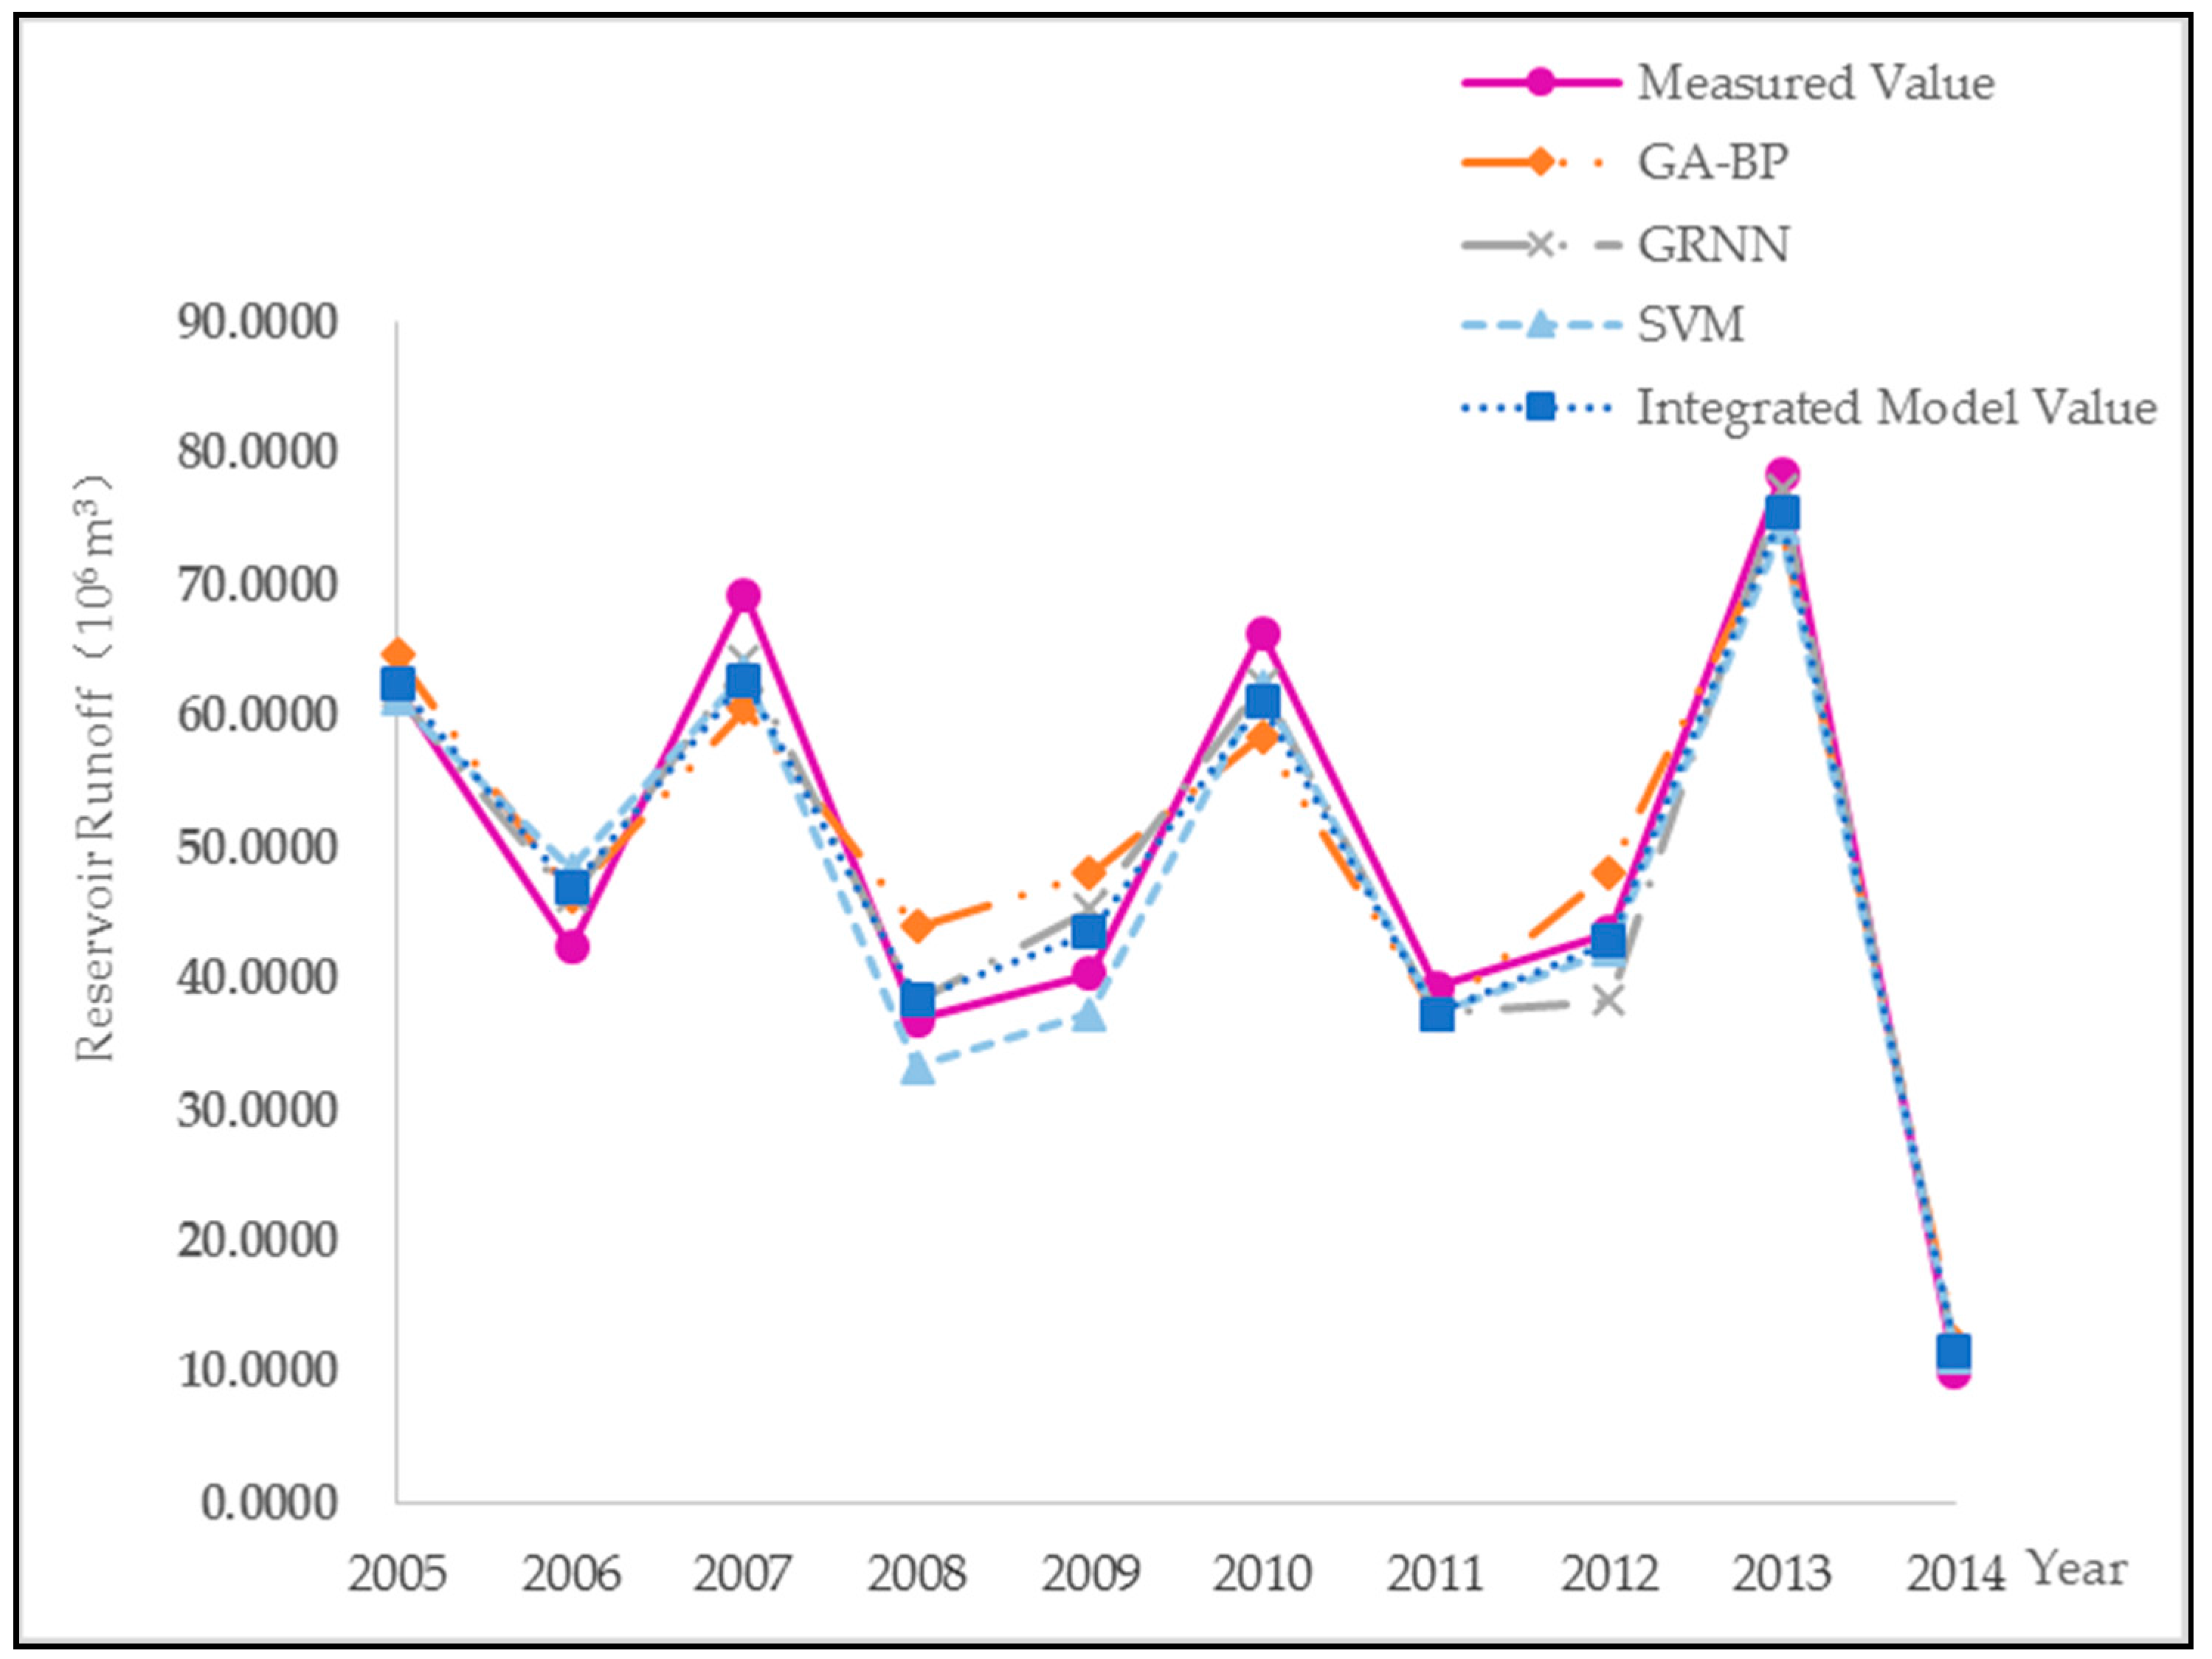
In this section, the Wohushan Reservoir, as the representative water conservancy project in Jinan, was selected as an example to analyze the superiority and applicability of the integrated prediction model relative to other single prediction models by the prediction of its runoff.
The Wohushan Reservoir, built in 1960, began to fill in the same year. Taking the long series of reservoir runoff data as the basis as well as the time series prediction mode, 50 groups of sample pairs were assigned out by setting the reservoir runoff data in the first five years as the independent variables (five inputs) and that in the next year as the dependent variable (one output). Among the 50 groups of sample pairs, we set the first forty groups as the training samples and the last 10 groups as the testing samples. Under the runtime environment of MATLAB R2014a, the simulated training results of the Wohushan Reservoir under the three single models are displayed in Figure 4.
The indicator weights of these three single models and the integrated model can be calculated according to Formulas (2)–(8), depicted in Table 1.
The prediction results of the Wohushan Reservoir under the integrated model can be calculated according to the prediction results under these three single models and their weights, depicted in Table 2. The comparison results among the measured values as well as the GA-BP, GRNN, SVM, and integrated model values can be found in Figure 4.
It can be concluded from Table 1 and Table 2 that the generalization values of these three single models are 5.8013, 3.4749 and 3.7274, respectively, while that of the integrated model is 4.5152. The generalization values of the GRNN model and SVM model are lower than that of the integrated model. Also, the accuracy of these three single models (GA-BP, GRNN, and SVM) and the integrated model are 0.1181, 0.0703, 0.0725 and 0.0666, respectively. We can conclude that the proposed integrated model is far superior to these single models in accuracy. The internal reason of the results can be summarized as follows: The integrated approach changes the weights of each single model according to its advantages and disadvantages in prediction accuracy and generalization. In other words, for the single model, such as the GA-BP model, the weight of prediction accuracy has been decreased followed by Formula (6) because its accuracy is the lowest among these three single models. In contrast, the weight of its generalization has been increased followed by Formula (7) due to the advantages among three single models.
In summary, the integrated prediction model is superior to these single prediction models for reservoir runoff from the perspective of generalization and accuracy. Hence, the runoff for nine mountain reservoirs in Jinan was predicted by applying the proposed integrated model and results are shown in Table 3.
4.2. Iterative Calculation of Exploitable Groundwater
The groundwater equilibrium model was established according to the 3D strata model and parameter partitioning [28]. On this basis, the groundwater recharge from the first optimal allocation was input and then the exploitable quantity of groundwater could be calculated according to the multiple loop iteration technique in Section 2.2. An average annual groundwater recharge from 1956 to 2014 was applied as the initial inputs before the first optimal allocation of water resources. The detailed calculation process can be found in Table 4.
It is observed from Table 4 that the terminal condition (, ) can be met until the fourth iteration. The total exploitable quantities of groundwater in the base year are 708.2 million m3. Of the areas, Zhangqiu City and the Chengwu District have the most exploitable quantities of groundwater, with the amounts of 194.3 million m3 (27.4%) and 183.8 million m3 (26.0%), respectively. Correspondingly, Pingyin County has the lowest amount, at 67.9 million m3 (9.6%). The amounts of groundwater recharge in the future will be changed with the change of regional water allocation pattern, and it reflects that the field infiltration will be decreased along with the improvement of water utilization coefficient of agricultural irrigation. In other words, the iterative calculation of exploitable groundwater in the planning periods can be achieved according to the water utilization coefficient of agricultural irrigation.
4.3. Water Balance Analysis in the Base Year
For the base year, we simulated the annual mean case of rainfall. The off-stream water balance between water supply (WS) and demand (WD) in the base year was firstly analyzed to estimate the deficiencies of water allocation pattern in Jinan and provide the basis for future allocation. For in-stream ecological water demand, the Tennant method [29] is applied to guarantee the healthy in-stream environment for the survival of aquatic wildlife and satisfy other ecological use. A long-time series dataset for the years 1956–2014 has been input to the multi-dimensional equilibrium allocation model.
It is observed from Table 5 that the total water demand for the mean annual case in Jinan is 1796.6 million m3, while the total water supply is 1766.1 million m3. The average water deficit ratio is 1.7% in Jinan. Furthermore, except for Zhangqiu City and Pingyin County, the water deficits of the other regions are not serious under the circumstances of the balance of groundwater between exploitation and supplement. It can also be concluded that the water supply from groundwater occupies 36.6% in the base year, which indicates groundwater is the main water source in Jinan. Hence, it is of great importance to recognize the exploitable groundwater and how to reasonably and effectively exploit the limited groundwater.
Table 6 illustrates the off-stream water usage and consumption in the base year. We can conclude that the agricultural water consumption occupies 71% of the total water consumption in the base year, where the industrial and domestic water consumption account for 13% and 11%, respectively. Furthermore, the total water consumption ratio in Jinan is 0.68, among which the domestic, industrial, agricultural and ecological water consumption ratios are 0.48, 0.42, 0.81, and 0.81, respectively. In summary, the industrial structural layout in Jinan should be adjusted to the water demand of water ecological civilization construction. For example, a crop with high water consumption might be arranged in a water-sufficient area. Also, agricultural irrigation methods should be water-saving and suitable for regional agriculture development.
4.4. Multi-Dimensional Equilibrium Allocation of Water Resources
In this section, the aforementioned multi-dimensional equilibrium allocation model of water resources was applied to allocate the future water resources in Jinan according to the exploitable groundwater multiple loop iteration technique. As the agricultural quota is related to the annual effective precipitation, several typical frequencies defined as P = 50% (the normal year), 75% (the moderate dry year) and 95% (the extreme dry year) were adopted in this study. The higher frequency the annual precipitation has, the drier the year is, and the more supplementary water drawn from rivers or reservoirs is needed. After repeating equilibrium simulations three times, the optimal allocation results of water resources in the short-term and long-term planning period are listed in Table 7.
It is observed from Table 7 that the water deficit ratio is increasing following the water demand in the planning period. However, it is within a controllable range. Compared with the base year, the amount of groundwater mining is decreased after considering the exploitable groundwater, as well as the amount of surface water. Conversely, the amounts of transferred water and reclaimed water are increasing to take place of groundwater. Taking the normal year as an example, we can conclude that the occupied ratios of water supply for surface water, groundwater, reclaimed water, and transferred water in the base year are 24.0%, 37.2%, 4.6% and 34.2%, respectively. For the short-term planning period, the total amount of water supply is 1939 million m3. The occupied ratios for these water sources are 21.6%, 33.4%, 10.6% and 34.4%, respectively, and for the long-term planning period, the occupied ratios have been changed to 19.3%, 30.0%, 16.1% and 34.7%, respectively. Under the exploitable groundwater multiple-loop iteration technique, the composition structure of water supply has been optimized and it conforms to the fact of water sources in Jinan.
For the short-term planning period, the total water deficit ratios of Jinan in the normal year, moderately dry year and severely dry years are 1.6%, 4.1% and 6.9%, respectively. The water deficit ratios of Jiyang County and Shanghe County in the normal year exceed the average level of Jinan and reach up to 3.0% and 2.6%, respectively. It is obvious when there is less rainfall, as there are values of 5.7% and 4.4% in the moderately dry year and 7.1% and 8.2%, respectively in the severely dry year with insufficient water supply. Hence, the balance between water supply and demand in the normal year can be achieved under the measures of total water control and multi-water resources. For the moderately dry year and severely dry year, the water deficit ratios are still within 10% and they will not pose a challenge to regional water security.
For the long-term planning period, with the perfection of transferred water and reclaimed water projects, the total water deficit ratios demonstrate a decreasing trend which show 1.1%, 3.4% and 4.8%, respectively. The gaps between water supply and demand under all rainfall conditions of Jinan are narrowed. For Jiyang County and Shanghe County, the water shortage problems are still obvious, yet controlled.
5. Conclusions
In this paper, a multi-dimensional equilibrium allocation model of water resources based on the groundwater multiple-loop iteration technique was developed for short-term and long-term water resource allocation management. The proposed method is developed as an integrated framework based on an integrated prediction model for reservoir runoff, a water resource optimal allocation model, and a groundwater equilibrium model. These three parts are closely connected based on the following approach: Taking the water resource optimal allocation model as the core, the integrated prediction model for reservoir runoff provides the basic data for it. Also, the exploitable quantity of groundwater is calculated by multiplication according to the groundwater equilibrium model, and the allocation results from the optimal allocation model can be modified. Taking the GA-BP model, the GRNN model, and the SVM model as the basis, the integrated prediction model for reservoir runoff was developed and it was proved applicative and superior. Considering the changeable exploitable groundwater in the process of water resource allocation, the multiple loop iteration technique was employed to accurately calculate the exploitable quantities of groundwater.
The proposed method was successfully applied to the regional water resource allocation in Jinan of the Shandong Province, China. By the prediction of nine reservoirs runoff in the future of Jinan, as well as four-time iterations of exploitable groundwater, results of water resource allocation patterns in the base year and two planning periods were generated. Compared with the base year, the amount of groundwater mining is decreased after considering the exploitable groundwater, as well as the amount of surface water. Conversely, the amounts of transferred water and reclaimed water are increasing to take place of groundwater. The results are valuable for water resource managers to formulate desired management targets and effective plans with consideration of various uncertainties in complex water resource systems. The proposed method could be also effective in other water-stressed and especially groundwater-stressed areas to provide efficient decision-making support for water allocation management.
However, some limitations still exist in this developed model. For instance, although the uncertainties of future reservoir runoff and exploitable groundwater have been considered in this model, some other uncertainties, such as climate change have not been covered. This deserves further research in future studies.
Acknowledgments
This study was funded by the Scientific Research Special Fund Project of Public Welfare by Ministry of Water Resources, China (No. 201401003), the Innovation Project of Graduate Student Training in Jiangsu Province (No. 1044/B14054), the National Science Foundation for Young Scientists of China (No. 51609261) and the Critical Patented Projects in the Control and Management of the National Polluted Water Bodies (No. 2012ZX07201-006).
Author Contributions
All authors made a substantial contribution to this paper. Ting Wang, Guohua Fang and Xinmin Xie conceived and designed the methods and model; Ting Wang and Yu Liu performed the calculations and analyzed the results; Ting Wang wrote the paper and submitted it; Ting Wang and Zhenzhen Ma modified the manuscript.
Conflicts of Interest
The authors declare no conflict of interest.
References
- Mo, S.H.; Duan, H.N.; Shen, B. Interval two-stage stochastic integer programming for urban water resources management under uncertainty. J. Coast. Res. 2015, 73, 160–165. [Google Scholar] [CrossRef]
- Rothman, D.W.; Mays, L.W. Water resources sustainability: Development of a multi objective optimization model. J. Water Resour. Plan. Manag. 2013, 140, 04014039. [Google Scholar] [CrossRef]
- Liu, D.; Liu, W.T.; Fu, Q.; Zhang, Y.J.; Li, T.X.; Imran, K.M.; Abrar, F.M. Two-stage multi-water sources allocation model in regional water resources management under uncertainty. Water Resour. Manag. 2017, 31, 3607–3625. [Google Scholar] [CrossRef]
- Zeng, X.T.; Li, Y.P.; Huang, G.H.; Liu, J. Modeling of water resources allocation and water quality management for supporting regional sustainability under uncertainty in an arid region. Water Resour. Manag. 2017, 31, 3699–3721. [Google Scholar] [CrossRef]
- Minsker, B.S.; Padera, B.; Smalley, J.B. Efficient methods for including uncertainty and multiple objectives in water resources management models using genetic algorithms. In Proceedings of the XIII International Conference on Computational Methods in Water Resources, Calgary, AB, Canada, 25–29 June 2000; pp. 567–572. [Google Scholar]
- Yang, Y.S.; Kalin, R.M.; Zhang, Y.; Lin, X.; Zou, L. Multi-objective optimization for sustainable groundwater resource management in a semiarid catchment. Hydrol. Sci. J. 2009, 46, 55–72. [Google Scholar] [CrossRef]
- Rosegrant, M.W.; Ringler, C.; McKinney, D.C.; Cai, X.; Keller, A.; Donoso, G. Integrated economic-hydrologic water modeling at the basin scale: The Maipo River basin. Agric. Econ. 2000, 24, 33–46. [Google Scholar]
- McKinney, D.C.; Cai, X.M. Multi objective optimization model for water allocation in the Aral Sea Basin. In Proceedings of the American Institute of Hydrology-CIS, Tashkent, Uzbekistan, 22–27 September 1996. [Google Scholar]
- Wei, C.J. Analysis on ecological water consumption system in water resources deployment. J. China Inst. Water Resour. Hydropower Res. 2006, 4, 282–286. (In Chinese) [Google Scholar]
- Wei, C.J. Determination of construction scale of water supply projects using water resources allocation system. J. China Inst. Water Resour. Hydropower Res. 2007, 5, 55–58. (In Chinese) [Google Scholar]
- Wei, C.J.; Han, J.S.; Han, S.H. Key Technology and Demonstration of Basin or Regional Water Resources Total Factor Optimal Allocation; China Water Power Press: Beijing, China, 2012. (In Chinese) [Google Scholar]
- Wang, L.; Fang, L.; Hipel, K.W. Basin-wide cooperative water resources allocation. Eur. J. Oper. Res. 2008, 190, 798–817. [Google Scholar] [CrossRef]
- Kucukmehmetoglu, M. An integrative case study approach between game theory and Pareto frontier concepts for the transboundary water resources allocations. J. Hydrol. 2012, 450, 308–319. [Google Scholar] [CrossRef]
- Jafarzadegan, K.; Abed-Elmdoust, A.; Kerachian, R. A fuzzy variable least core game for inter-basin water resources allocation under uncertainty. Water Resour. Manag. 2013, 27, 3247–3260. [Google Scholar] [CrossRef]
- Avarideh, F.; Attari, J.; Moridi, A. Modelling Equitable and Reasonable Water Sharing in Transboundary Rivers: The Case of Sirwan-Diyala River. Water Resour. Manag. 2017, 31, 1191–1207. [Google Scholar] [CrossRef]
- Zhang, D.F. Application Design of Matlab Neural Network; China Machine Press: Beijing, China, 2009. (In Chinese) [Google Scholar]
- Li, K.F. Study on Methods of Multi-Objective Decision Making and Risk Analysis in Reservoir Operation. Ph.D. Thesis, North China Electric Power University, Lanzhou, China, June 2013. (In Chinese). [Google Scholar]
- Ming, B.; Huang, Q.; Wang, Y.M.; Xie, Y.Y. Combinational prediction for runoff based on GA-AHP. Water Resour. Power. 2014, 32, 6–10. (In Chinese) [Google Scholar]
- Specht, D.F. A general regression neural network. IEEE Trans. Neural Netw. 1991, 2, 568–576. [Google Scholar] [CrossRef] [PubMed]
- Kim, H.S.; Eykholt, R.; Salas, J.D. Nonlinear dynamics, delay times, and embedding windows. Phys. D Nonlinear Phenom. 1999, 127, 48–60. [Google Scholar] [CrossRef]
- Ji, L.; Sun, P.; Ma, Q.; Jiang, N.; Huang, G.H.; Xie, Y.L. Inexact Two-Stage Stochastic Programming for Water Resources Allocation under Considering Demand Uncertainties and Response—A Case Study of Tianjin, China. Water 2017, 9, 414. [Google Scholar] [CrossRef]
- Wei, C.J.; Wang, H. Generalization of regional water resources deployment network chart. J. Hydraul. Eng.-ASCE 2007, 38, 1103–1108. (In Chinese) [Google Scholar]
- Zhou, X.N. Research on Multi-Dimensional Coordinated Allocation Model of Water Resources and Its Application. Ph.D. Thesis, China Institute of Water Resources and Hydropower Research, Beijing, China, May 2015. (In Chinese). [Google Scholar]
- Hong, X.J.; Guo, S.L.; Wang, L.; Yang, G.; Liu, D.L.; Guo, H.J.; Wang, J. Evaluation water supply risk in the middle and lower reaches of Hanjiang River Basin based on an integrated optimal water resources allocation model. Water 2016, 8, 364. [Google Scholar] [CrossRef]
- Jinan Bureau of Statistics. 2014 Jinan Statistical Yearbook; China Statistics Press: Beijing, China, 2015. (In Chinese)
- Jinan Statistical Information Network. Available online: http://www.jntj.gov.cn/content.jsp?id=8139d61f5ada4e1b98f634227951dcb8&classid=4028813e4dad18a2014db398e02d02c4 (accessed on 27 July 2017). (In Chinese)
- Hydrological Information Port of Jinan. Available online: http://www.jnsww.com.cn:9090/jnsw/ (accessed on 27 July 2017). (In Chinese).
- Guyonnet-Benaize, C.; Lamarche, J.; Masse, J.P.; Villeneuve, M.; Viseur, S. 3D structural modelling of small-deformations in poly-phase faults pattern. Application to the Mid-Cretaceous Durance uplift, Provence. J. Geodyn. 2010, 50, 81–93. [Google Scholar] [CrossRef]
- Zheng, Z.H.; Zhang, Z.Z.; Huang, Q.; Qiu, L.; Li, Q.; Wei, M.H. Improvement and application on ecological water requirement Tennant method. J. Sichuan Univ. (Eng. Sci. Ed.) 2010, 42, 34–39. (In Chinese) [Google Scholar]
Figure 1.
Study framework for multi-dimensional equilibrium allocation model of water resources. GA-BP: genetic algorithm-back propagation; GRNN: general regression neural network; SVM: support vector machine.
Figure 1.
Study framework for multi-dimensional equilibrium allocation model of water resources. GA-BP: genetic algorithm-back propagation; GRNN: general regression neural network; SVM: support vector machine.

Figure 2.
Location of Jinan in Shandong Province, China.

Figure 3.
Water resource deployment network chart of Jinan.

Figure 4.
Simulated training results for the Wohushan Reservoir.


Table 1.
Weight calculation for three single models and the integrated model. ARE: average relative error.
Table 1.
Weight calculation for three single models and the integrated model. ARE: average relative error.
| Indicators | Indicator Weights | Indicator Values of the Single Model | Single Model Weights under Each Indicator | Single Model Weights under the Integrated Model | ||||||
|---|---|---|---|---|---|---|---|---|---|---|
| GA-BP | GRNN | SVM | GA-BP | GRNN | SVM | GA-BP | GRNN | SVM | ||
| ARE | 0.5500 | 0.1181 | 0.0703 | 0.0725 | 0.2321 | 0.3899 | 0.3780 | 0.3284 | 0.3347 | 0.3369 |
| ψ | 0.4500 | 5.8013 | 3.4749 | 3.7274 | 0.4461 | 0.2672 | 0.2866 | |||
Table 2.
Calculation results under the integrated model.
| Year | Measured Values (106 m3) | Integrated Model Values (106 m3) | ARE of the Integrated Model | ψ of Integrated Model |
|---|---|---|---|---|
| 2005 | 62.1582 | 62.5291 | 0.0666 | 4.5152 |
| 2006 | 42.4244 | 46.9242 | ||
| 2007 | 69.3255 | 62.7387 | ||
| 2008 | 36.8369 | 38.4466 | ||
| 2009 | 40.3286 | 43.4686 | ||
| 2010 | 66.4086 | 61.0486 | ||
| 2011 | 39.3810 | 37.2950 | ||
| 2012 | 43.4562 | 42.8327 | ||
| 2013 | 78.4014 | 75.4545 | ||
| 2014 | 10.0256 | 11.5514 |
Table 3.
Integrated prediction for reservoir runoff in Jinan (units: million m3).
| Year | Wohushan Reservoir | Jinxiuchuan Reservoir | Shidian Reservoir | Gutou Reservoir | Langmaoshan Reservoir | Duzhang Reservoir | Duozhuang Reservoir | Dazhan Reservoir | Xinling Reservoir |
|---|---|---|---|---|---|---|---|---|---|
| 2015 | 37.8271 | 18.9183 | 3.2819 | 5.2819 | 5.1929 | 7.3928 | 5.8172 | 23.2918 | 10.2917 |
| 2016 | 45.2618 | 22.1813 | 4.5171 | 7.2928 | 7.2918 | 8.8172 | 5.2817 | 22.1819 | 10.1829 |
| 2017 | 53.1813 | 27.1938 | 5.3928 | 8.2918 | 8.1927 | 9.2918 | 6.8271 | 25.2817 | 12.1971 |
| 2018 | 37.2814 | 19.3817 | 3.7191 | 6.2928 | 4.1927 | 5.2819 | 3.2917 | 13.2981 | 5.2918 |
| 2019 | 28.1841 | 14.1822 | 2.7917 | 4.2918 | 4.2917 | 5.6918 | 3.1817 | 12.1981 | 6.2918 |
| 2020 | 52.2819 | 27.1831 | 5.2918 | 9.2092 | 7.1927 | 7.5198 | 4.2917 | 17.2918 | 7.2918 |
| 2021 | 67.2718 | 33.1837 | 6.8192 | 10.2928 | 6.1927 | 7.2910 | 4.2817 | 16.2918 | 8.9811 |
| 2022 | 48.2913 | 24.2841 | 4.7191 | 7.2921 | 10.2816 | 11.2837 | 6.9181 | 25.2918 | 13.2918 |
| 2023 | 54.2814 | 27.1938 | 5.2819 | 9.0292 | 11.2917 | 13.1837 | 8.3918 | 33.4817 | 17.2918 |
| 2024 | 38.1937 | 19.2837 | 3.7918 | 6.2987 | 8.2917 | 9.4718 | 6.9282 | 25.2918 | 12.1927 |
| 2025 | 36.1839 | 18.9819 | 3.7918 | 6.2918 | 7.2038 | 8.2817 | 5.3827 | 22.3918 | 9.1019 |
| 2026 | 56.2914 | 28.2837 | 5.1948 | 9.2826 | 10.2927 | 12.0291 | 7.3227 | 29.2817 | 13.2918 |
| 2027 | 65.2814 | 32.1938 | 6.1833 | 10.2927 | 7.2917 | 8.3817 | 5.1920 | 22.2617 | 9.2918 |
| 2028 | 64.2819 | 31.3911 | 6.1089 | 10.2218 | 8.2917 | 9.2817 | 6.0181 | 25.1971 | 13.1028 |
| 2029 | 47.1931 | 24.2942 | 4.7191 | 8.2918 | 6.2918 | 7.4817 | 4.3928 | 18.2917 | 8.2918 |
| 2030 | 41.9831 | 20.1982 | 4.0917 | 6.7181 | 5.2918 | 6.2918 | 4.2918 | 17.2918 | 8.1019 |
Table 4.
Iterative calculation of exploitable groundwater (units for : million m3). Admin. Reg.: Administration Region.
Table 4.
Iterative calculation of exploitable groundwater (units for : million m3). Admin. Reg.: Administration Region.
| Admin. Reg. | Initial Input | Initial Optimal Allocation | Multiple Loop Iteration | Region Percentage | |||||||||||
|---|---|---|---|---|---|---|---|---|---|---|---|---|---|---|---|
| The First Iteration | The Second Iteration | The Third Iteration | The Fourth Iteration | Final Result | |||||||||||
| Recharge Amount in Mountain Area | Recharge Amount in Plain Area | ||||||||||||||
| Chengwu District | 163.2 | 0.61 | 155.6 | 0.55 | 185.1 | 184.4 | 0.004 | 184.0 | 0.002 | 183.8 | 0.001 | 182.3 | 0.008 | 183.8 | 26.0% |
| Changqing District | 113.7 | 0.61 | 35.8 | 0.55 | 89.0 | 83.3 | 0.064 | 79.0 | 0.052 | 76.8 | 0.028 | 76.3 | 0.007 | 76.8 | 10.7% |
| Zhangqiu City | 173.4 | 0.61 | 214.5 | 0.55 | 223.7 | 207.4 | 0.073 | 198.9 | 0.041 | 194.3 | 0.023 | 193.3 | 0.005 | 194.3 | 27.4% |
| Pingyin County | 102.4 | 0.61 | 18.9 | 0.55 | 72.9 | 70.3 | 0.035 | 68.6 | 0.024 | 67.9 | 0.011 | 67.4 | 0.007 | 67.9 | 9.6% |
| Jiyang County | 0.0 | 0.61 | 160.0 | 0.55 | 88.0 | 83.1 | 0.056 | 79.4 | 0.044 | 78.1 | 0.017 | 77.5 | 0.008 | 78.1 | 11.2% |
| Shanghe County | 0.0 | 0.61 | 214.7 | 0.55 | 118.1 | 113.2 | 0.041 | 109.9 | 0.038 | 107.3 | 0.015 | 106.7 | 0.006 | 107.3 | 15.1% |
| Total | 552.7 | 0.61 | 799.5 | 0.55 | 776.9 | 741.8 | 0.045 | 718.9 | 0.031 | 708.2 | 0.015 | 703.5 | 0.007 | 708.2 | 100.0% |
Table 5.
Off-stream water balance between water supply and demand in the base year (units: million m3).
Table 5.
Off-stream water balance between water supply and demand in the base year (units: million m3).
| Admin. Reg. | WD | WS | Water Deficit (WD-WS) | Water Deficit Ratio [(WD-WS)/WD] | ||||
|---|---|---|---|---|---|---|---|---|
| SW | GW | RW | TW | Total WS | ||||
| Chengwu District | 692.7 | 132.4 | 182.7 | 76.9 | 297.0 | 689.0 | 3.7 | 0.5% |
| Changqing District | 133.3 | 58.3 | 70.2 | 1.2 | 3.1 | 132.3 | 0.5 | 0.4% |
| Zhangqiu City | 343.2 | 83.3 | 176.3 | 1.0 | 69.7 | 330.3 | 12.9 | 3.8% |
| Pingyin County | 117.3 | 39.2 | 57.4 | 0.3 | 17.2 | 114.1 | 3.2 | 2.8% |
| Jiyang County | 310.5 | 81.4 | 75.6 | 2.1 | 147.3 | 306.4 | 4.1 | 1.3% |
| Shanghe County | 199.6 | 28.6 | 94.1 | 1.1 | 71.7 | 195.5 | 4.1 | 2.1% |
| Total | 1796.6 | 423.2 | 656.3 | 82.6 | 604.0 | 1766.1 | 30.5 | 1.7% |
Notes: WD: water demand; WS: water supply; SW: surface water; GW: groundwater; RW: reclaimed water; TW: transferred water. (The same as below.)
Table 6.
Off-stream water usage (WU) and consumption (WC) in the base year (units: million m3).
| Admin. Reg. | Domestic Water | Industrial Water | Agricultural Water | Ecological Water | Total Water | ||||||||||
|---|---|---|---|---|---|---|---|---|---|---|---|---|---|---|---|
| WU | WC | WC Ratio (WC/WU) | WU | WC | WC Ratio (WC/WU) | WU | WC | WC Ratio (WC/WU) | WU | WC | WC Ratio (WC/WU) | WU | WC | WC Ratio (WC/WU) | |
| Chengwu District | 174.7 | 90.2 | 52% | 265.3 | 106.0 | 40% | 156.9 | 114.2 | 73% | 59.0 | 46.4 | 79% | 655.9 | 356.8 | 54% |
| Changqing District | 17.9 | 3.7 | 21% | 8.4 | 2.7 | 32% | 94.6 | 64.7 | 68% | 0.7 | 0.5 | 72% | 121.5 | 71.5 | 59% |
| Zhangqiu City | 33.0 | 9.3 | 28% | 48.0 | 28.6 | 59% | 221.4 | 177.4 | 80% | 6.5 | 5.2 | 80% | 308.9 | 220.4 | 71% |
| Pingyin County | 7.8 | 4.7 | 61% | 12.4 | 3.1 | 25% | 74.8 | 67.6 | 90% | 6.7 | 6.0 | 90% | 101.7 | 81.4 | 80% |
| Jiyang County | 17.3 | 11.8 | 68% | 13.7 | 5.7 | 42% | 259.9 | 230.6 | 89% | 3.1 | 2.7 | 89% | 294.0 | 250.8 | 85% |
| Shanghe County | 12.4 | 6.7 | 54% | 5.8 | 1.8 | 32% | 167.1 | 138.2 | 83% | 3.45 | 3.1 | 90% | 188.7 | 149.9 | 79% |
| Total | 263.1 | 126.4 | 48% | 353.5 | 147.8 | 42% | 994.7 | 808.8 | 81% | 79.3 | 63.9 | 81% | 1690.6 | 1147.0 | 68% |
Table 7.
Off-stream water balance between water supply and demand based on the multi-dimensional equilibrium allocation model (units: million m3).
Table 7.
Off-stream water balance between water supply and demand based on the multi-dimensional equilibrium allocation model (units: million m3).
| Short-Term Planning Period (Year 2020) | Long-Term Planning Period (Year 2030) | ||||||||||||||||||
|---|---|---|---|---|---|---|---|---|---|---|---|---|---|---|---|---|---|---|---|
| P | Admin. Reg. | WD | WS | Water Deficit | Water Deficit Ratio | P | Admin. Reg. | WD | WS | Water Deficit | Water Deficit Ratio | ||||||||
| SW | GW | RW | TW | Total WS | SW | GW | RW | TW | Total WS | ||||||||||
| 50% | Chengwu District | 814 | 185 | 166 | 138 | 317 | 806 | 8 | 1.0% | 50% | Chengwu District | 963 | 195 | 166 | 232 | 364 | 957 | 7 | 0.7% |
| Changqing District | 154 | 67 | 69 | 13 | 3 | 152 | 2 | 1.5% | Changqing District | 176 | 67 | 68 | 27 | 13 | 176 | 0 | 0.0% | ||
| Zhangqiu City | 353 | 79 | 159 | 28 | 82 | 349 | 4 | 1.2% | Zhangqiu City | 378 | 57 | 159 | 49 | 105 | 370 | 7 | 1.9% | ||
| Pingyin County | 121 | 37 | 51 | 69 | 25 | 120 | 1 | 1.0% | Pingyin County | 132 | 43 | 51 | 12 | 25 | 131 | 1 | 0.8% | ||
| Jiyang County | 316 | 22 | 65 | 10 | 169 | 306 | 10 | 3.0% | Jiyang County | 349 | 33 | 75 | 18 | 189 | 345 | 3 | 0.9% | ||
| Shanghe County | 212 | 27 | 92 | 9 | 72 | 206 | 5 | 2.6% | Shanghe County | 241 | 31 | 94 | 17 | 72 | 235 | 6 | 2.5% | ||
| Total | 1970 | 418 | 647 | 206 | 668 | 1939 | 31 | 1.6% | Total | 2238 | 427 | 664 | 356 | 768 | 2214 | 24 | 1.1% | ||
| 75% | Chengwu District | 832 | 124 | 166 | 138 | 370 | 798 | 35 | 4.2% | 75% | Chengwu District | 981 | 168 | 166 | 232 | 384 | 950 | 31 | 3.2% |
| Changqing District | 163 | 72 | 68 | 13 | 3 | 156 | 8 | 4.6% | Changqing District | 184 | 47 | 68 | 27 | 35 | 177 | 7 | 3.9% | ||
| Zhangqiu City | 375 | 76 | 152 | 28 | 62 | 368 | 7 | 1.9% | Zhangqiu City | 400 | 76 | 163 | 49 | 62 | 390 | 10 | 2.4% | ||
| Pingyin County | 134 | 33 | 54 | 7 | 30 | 127 | 7 | 4.9% | Pingyin County | 144 | 33 | 57 | 12 | 35 | 138 | 6 | 4.0% | ||
| Jiyang County | 346 | 31 | 75 | 10 | 189 | 326 | 20 | 5.7% | Jiyang County | 377 | 30 | 75 | 18 | 220 | 363 | 14 | 3.7% | ||
| Shanghe County | 224 | 20 | 93 | 9 | 82 | 214 | 10 | 4.4% | Shanghe County | 253 | 22 | 93 | 17 | 100 | 242 | 11 | 4.3% | ||
| Total | 2075 | 356 | 691 | 206 | 736 | 1990 | 85 | 4.1% | Total | 2339 | 376 | 692 | 356 | 836 | 2261 | 79 | 3.4% | ||
| 95% | Chengwu District | 832 | 109 | 150 | 138 | 380 | 777 | 56 | 6.7% | 95% | Chengwu District | 981 | 109 | 150 | 232 | 449 | 940 | 41 | 4.2% |
| Changqing District | 163 | 30 | 80 | 13 | 33 | 156 | 8 | 4.6% | Changqing District | 184 | 30 | 71 | 27 | 50 | 178 | 6 | 3.2% | ||
| Zhangqiu City | 375 | 28 | 187 | 28 | 109 | 352 | 23 | 6.1% | Zhangqiu City | 400 | 60 | 187 | 49 | 82 | 378 | 22 | 5.4% | ||
| Pingyin County | 134 | 20 | 76 | 7 | 30 | 133 | 7 | 5.2% | Pingyin County | 144 | 24 | 64 | 12 | 35 | 135 | 9 | 6.2% | ||
| Jiyang County | 346 | 6 | 95 | 10 | 209 | 321 | 25 | 7.1% | Jiyang County | 377 | 23 | 95 | 18 | 220 | 356 | 21 | 5.5% | ||
| Shanghe County | 224 | 7 | 107 | 9 | 82 | 206 | 18 | 8.2% | Shanghe County | 253 | 14 | 107 | 17 | 100 | 239 | 15 | 5.7% | ||
| Total | 2075 | 201 | 696 | 206 | 843 | 1945 | 144 | 6.9% | Total | 2339 | 260 | 674 | 356 | 936 | 2226 | 113 | 4.8% | ||
Notes: P: the frequency of annual precipitation.
© 2017 by the authors. Licensee MDPI, Basel, Switzerland. This article is an open access article distributed under the terms and conditions of the Creative Commons Attribution (CC BY) license (http://creativecommons.org/licenses/by/4.0/).
Share and Cite
MDPI and ACS Style
Wang, T.; Fang, G.; Xie, X.; Liu, Y.; Ma, Z. A Multi-Dimensional Equilibrium Allocation Model of Water Resources Based on a Groundwater Multiple Loop Iteration Technique. Water 2017, 9, 718. https://doi.org/10.3390/w9090718
AMA Style
Wang T, Fang G, Xie X, Liu Y, Ma Z. A Multi-Dimensional Equilibrium Allocation Model of Water Resources Based on a Groundwater Multiple Loop Iteration Technique. Water. 2017; 9(9):718. https://doi.org/10.3390/w9090718
Chicago/Turabian StyleWang, Ting, Guohua Fang, Xinmin Xie, Yu Liu, and Zhenzhen Ma. 2017. "A Multi-Dimensional Equilibrium Allocation Model of Water Resources Based on a Groundwater Multiple Loop Iteration Technique" Water 9, no. 9: 718. https://doi.org/10.3390/w9090718
Note that from the first issue of 2016, this journal uses article numbers instead of page numbers. See further details here.