1. Introduction
The growing anthropogenic pressure on tropical ecosystems is continuously transforming landscapes, thereby threatening global climate change and livelihood systems [
1,
2,
3]. Of major concern is the clearing of tropical forests, which constitute a fundamental carbon store, as well as a source of food, fuel and utility products [
4]. According to recent reports, deforestation accounts for approximately 20% of global greenhouse gas (GHG) emissions, making it the second largest source after the energy sector [
5,
6]. Recognizing the negative impacts of GHG emissions on the global climate system, the international community under the auspices of the United Nations Framework Convention on Climate Change (UNFCCC) is currently negotiating initiatives to reduce emissions from deforestation and forest degradation in developing countries [
7].
Lao People’s Democratic Republic (PDR) is a landlocked country in the center of Indochina, rich in forest resources. The forestry sector contributes more than 3.2% of the gross domestic product (GDP), making it an important resource that generates employment, local and national budget revenues, as well as raw materials for the domestic timber processing industry [
8,
9]. In addition, forests protect the country’s biodiversity that is of national and global importance [
10]. Approximately 80% of the population living in rural areas depend primarily on agriculture, forestry and non-timber forest products (NTFPs) for their livelihoods. Although the country is endowed with a wide range of forest resources, forest areas declined from 70% of land area in 1940 to 41.5% in 2004 [
9,
10]. In light of the rapid deforestation, the Government of Lao PDR has increased its commitment to improving sustainable forest management since the First National Conference on Forests in 1989 [
8,
11]. While the Government has instituted important legal and regulatory framework in the forest sector, implementation of effective sustainable forest management remains problematic. This is due mainly to ineffective policy implementation, weak law enforcement and failure to address the underlying causes of land use changes among other factors [
8,
9,
12,
13,
14].
In order to improve sustainable forest management, the Lao Ministry of Agriculture and Forestry (MAF) is implementing a gamut of measures that include land and forest allocation, stabilization of shifting cultivation and participatory forestry management systems [
15,
16,
17]. Given that a decentralized sustainable forest management approach, which functions at the watershed or river basin scale has been adopted [
8,
15], appropriate monitoring and modeling tools that can be used to understand temporal and spatial forest cover changes are needed. Yet few studies have been undertaken to understand temporal and spatial forest cover changes, as well as implications of future forest cover changes on sustainable forest management. Spatial simulation models, which provide a scientific basis for supporting sustainable forest management based on different simulation scenarios (that is, explore “what if” scenarios) [
18,
19,
20,
21,
22,
23,
24] can be used to guide policy makers to set priorities for sustainable forest management. For example, the Markov-cellular automata (MCA) modeling approach can be used to gain insights into the current and future forest cover changes given its simplicity and flexibility, as well as its ability to model dynamic land use and forest cover changes.
The objective of this study is to simulate future forest cover changes in Pakxeng district, Lao People’s Democratic Republic (PDR) under the business-as-usual (BAU), pessimistic and optimistic scenarios. Future forest cover changes were simulated under different scenarios based on the MCA model, which combines the “weights of evidence” technique, Markov chain analysis and cellular automata (CA) in order to explore the implications of future forest cover changes on sustainable forest management. The “weights of evidence” technique was used to compute transition potential maps, while the Markov chain model was used to generate the transition probabilities. Dynamic adjustments of transition potential maps and transition probabilities were implemented in the CA model.
2. Study Area
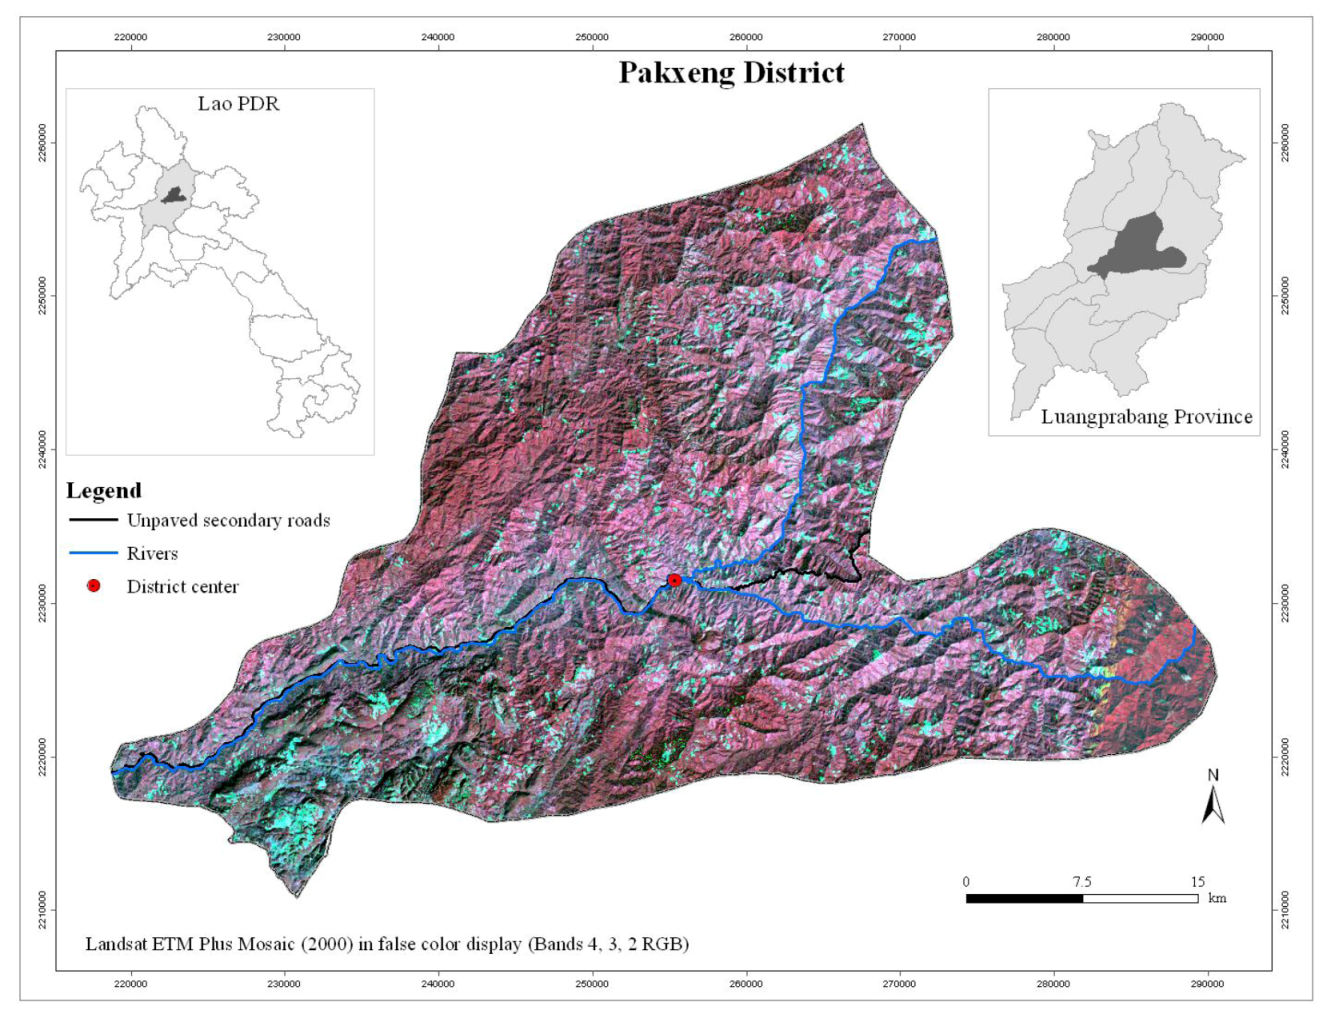
Pakxeng district, which covers an area of approximately 1,650 km
2, is located in the center of Luangprabang province, Lao PDR (
Figure 1). The altitude of the study area varies approximately from 200 m to 1,422 m above sea level. According to the Lao Department of Statistics [
25], the climate is characterized by a mean maximum temperature in the range of 30.9 °C to 33.5 °C with the highest temperatures occurring from March to October. The study area receives approximately 2,104 mm of rainfall annually. Forest cover maps produced in 2002 by the Forestry Inventory and Planning Division (FIPD) in Lao PDR show that the district is dominated by unstocked forests, which are previously forested areas characterized by a crown density less than 20% [
26].
Figure 1.
Pakxeng district in Luangprabang province, Lao Peoples’ Democratic Republic (PDR).
Figure 1.
Pakxeng district in Luangprabang province, Lao Peoples’ Democratic Republic (PDR).
The total population in Pakxeng district as of 2008 is about 22,294 inhabitants. Over the years, there has been a lot of pressure on the available forest and non-timber forest resources due to increasing population density. Pakxeng district was thus selected due to the decrease of natural forest areas and the dominance of shifting cultivation, which is typical in Luangprabang province [
22].
3. Methodology
3.1. Data
We used biophysical (forest cover and GIS maps) and socioeconomic data for simulating forest cover changes (
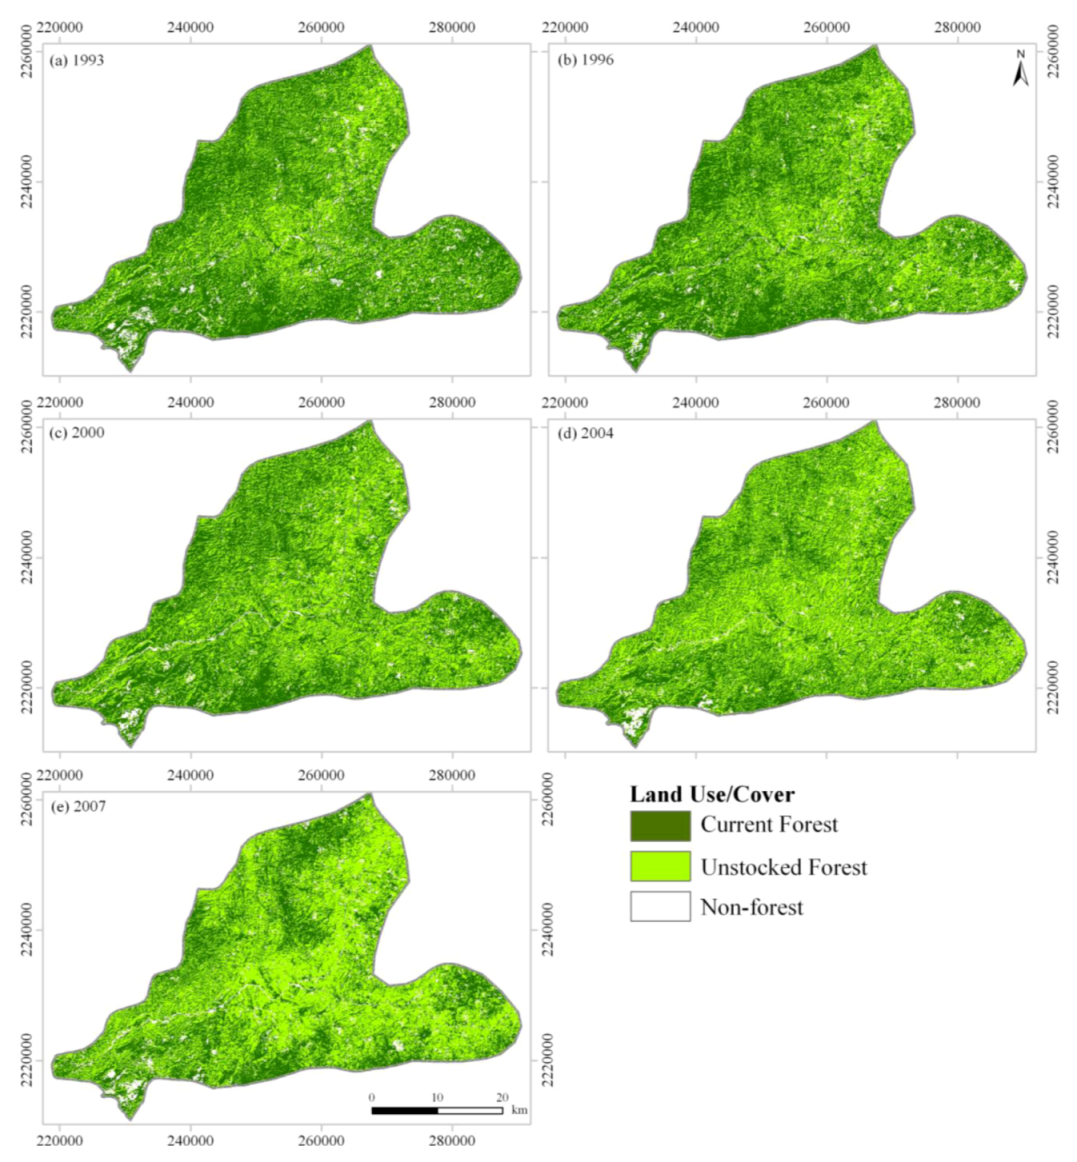
Table 1). Forest cover maps (
Figure 2 and
Table 2) were classified from satellite imagery for 1993, 1996, 2000, 2004 and 2007 using a hybrid approach that integrates supervised classification and decision trees [
27]. Overall classification accuracy levels for the five dates range from 86% to 90%. Road, river and village (settlements) datasets that were obtained from the National Geographic Department (NGD) in Lao PDR were used to generate static driving factors, such as “distance to unpaved secondary roads”, “distance to rivers” and “distance to district center” based on the Euclidean distance procedures available in ArcGIS 10. Elevation and slope were derived from SRTM (Shuttle Radar Topography Mission) data. Driving factors, such as “distance to deforested areas”, were defined as dynamic, because these were generated and updated during model iteration [
18]. In addition, socioeconomic data, such as number of people and fuelwood consumption, was collected from a household survey that was conducted in Pakxeng district in 2010. Finally, all input datasets were resampled to 90 m × 90 m spatial resolution in order to match the spatial resolution of the SRTM digital elevation (DEM) data.
Table 1.
Input data for the Markov CA model.
Table 1.
Input data for the Markov CA model.
| Data | Driving Factor |
|---|
| Biophysical | Forest cover maps (1993, 1996, 2000 and 2004) |
| Elevation (derived from DEM) |
| Distance to unpaved secondary roads |
| Distance to rivers |
| Distance to district center |
| Distance to deforested areas |
| Socioeconomic | Population density |
| Labor used in the household |
| Hired labor force |
| Livestock ownership |
| Rice produced (ton) |
| Fuelwood consumed (m3) |
Table 2.
Forest cover classes.
Table 2.
Forest cover classes.
| Forest Cover Class | Description |
|---|
| Current forest | Includes natural and plantation forest areas with crown density more than 20% and an area equal to or greater than 0.5 ha. Trees should reach a minimum height of 5 m. |
| Unstocked forest | Previously forested areas in which crown density has been reduced to less than 20% due to disturbances (e.g., shifting cultivation or logging). |
| Non-forest | Cropland, ray, grassland, settlement areas, roads, barren land, rocks, rivers and reservoirs. |
Figure 2.
Forest cover maps (Pakxeng district).
Figure 2.
Forest cover maps (Pakxeng district).
3.2. Model Calibration and Simulation Scenarios
First, the “weights of evidence” technique, which is based on the Bayes theorem of conditional probability [
28,
29,
30,
31,
32,
33] was used to compute transition potential (suitability) maps. Transition potential (suitability) maps represent the likelihood or the probability that the landscape would change from one forest cover class to another (e.g., forest to unstocked forest). Following the computation of transition potential maps, transition probabilities between the forest cover maps (e.g., 1993–1996) were calculated using the Markov chain analysis. The 1993 forest cover base map, transition potential maps and transition probability matrices (for 1993–1996, 1996–2000 and 2000–2004) were used to simulate forest cover map for 2007 based on the CA model available in Dinamica EGO [
28]. Note that the “1993–1996”, “1996–2000” and “2000–2004” were used for calibrating the MCA model in order to capture temporal heterogeneity, since the study area experience dynamic land use and forest cover changes due to shifting cultivation and both legal and illegal logging [
24]. The CA model employs an Expander transition function to expand or contract previous forest class patches, while the Patcher transition function is used to form new patches through a seeding mechanism [
20]. The model was calibrated by changing the internal parameters of the Expander and Patcher transition functions [
24]. The CA transition rules were defined from transition probabilities and transition potential maps using a 3 × 3 neighborhood size. Finally, MCA model iterations were specified according to the differences between the forest cover maps (e.g., 11-year iteration for the 1993–2004 period). For full details of the MCA model used in this study, refer to Kamusoko
et al. [
24].
Future forest cover changes were simulated under the business-as-usual (BAU), pessimistic and optimistic scenarios. The term “BAU” has various definitions and interpretations. In this study, BAU scenario refers to the projected future forest cover changes based on the historical forest cover changes, as well as current environmental, socioeconomic and cultural conditions. The BAU scenario assumed that historical forest cover trends observed between 1993 and 2004 under the current socioeconomic conditions would continue in the future. Therefore, this scenario used annual transition probabilities for (I) 1993–1996, (II) 1996–2000 and (III) 2000–2004, as well as biophysical and socioeconomic factors, such as elevation, “distance to unpaved secondary roads”, “distance to rivers”, “distance to district center”, “distance to deforested areas” and population density.
Under the pessimistic scenario, future forest cover changes were simulated under a scenario of increased infrastructure developments, such as paved secondary roads and reservoirs. In this scenario, we assumed that the current unpaved roads would have been upgraded to paved roads, while the proposed reservoirs would have been constructed in the study area. Therefore, additional driving factors, such as “distance to secondary paved roads” and reservoirs, were included for computing transition potential maps under the pessimistic scenario. In addition, we modified the transition probabilities for (I) 1993–1996, (II) 1996–2000 and (III) 2000–2004 to increase deforestation rates. In contrast, future forest cover changes were simulated under strict adherence to forestry law and forest management policies (that is, no deforestation in protected forest areas) in the optimistic scenario. Therefore, the protected forest area GIS coverage was used as a constraint to deforestation (for protecting current forest areas). In addition, the transition probability matrices (for 1993–1996, 1996–2000 and 2000–2004) were modified by decreasing the transition probabilities from current forest to unstocked and from current forest to non-forest.
Table 3 shows the input data for simulating the BAU, pessimistic and optimistic scenarios.
Table 3.
Input data for simulating forest cover changes under different scenarios at the district level.
Table 3.
Input data for simulating forest cover changes under different scenarios at the district level.
| Data | Driving Factor | BAUS | PS | OS |
|---|
| Biophysical | Forest cover maps (1993,1996, 2000 and 2004) | | * | * |
| Elevation | * | * | * |
| Distance to unpaved secondary roads | * | * | * |
| Distance to secondary paved roads | * | * | |
| Distance to rivers | | * | * |
| Distance to district center | * | * | * |
| Distance to deforested areas | * | * | |
| Reservoirs | * | * | |
| Protected forest areas | | | * |
| Socioeconomic | Population density | * | * | * |
| Labor used in the household | * | * | * |
| Hired labor force | * | * | * |
| Livestock ownership | * | * | * |
| Rice produced (ton) | * | * | * |
| Fuelwood consumed (m3) | * | * | * |
4. Results and Discussion
4.1. Forest Cover Changes
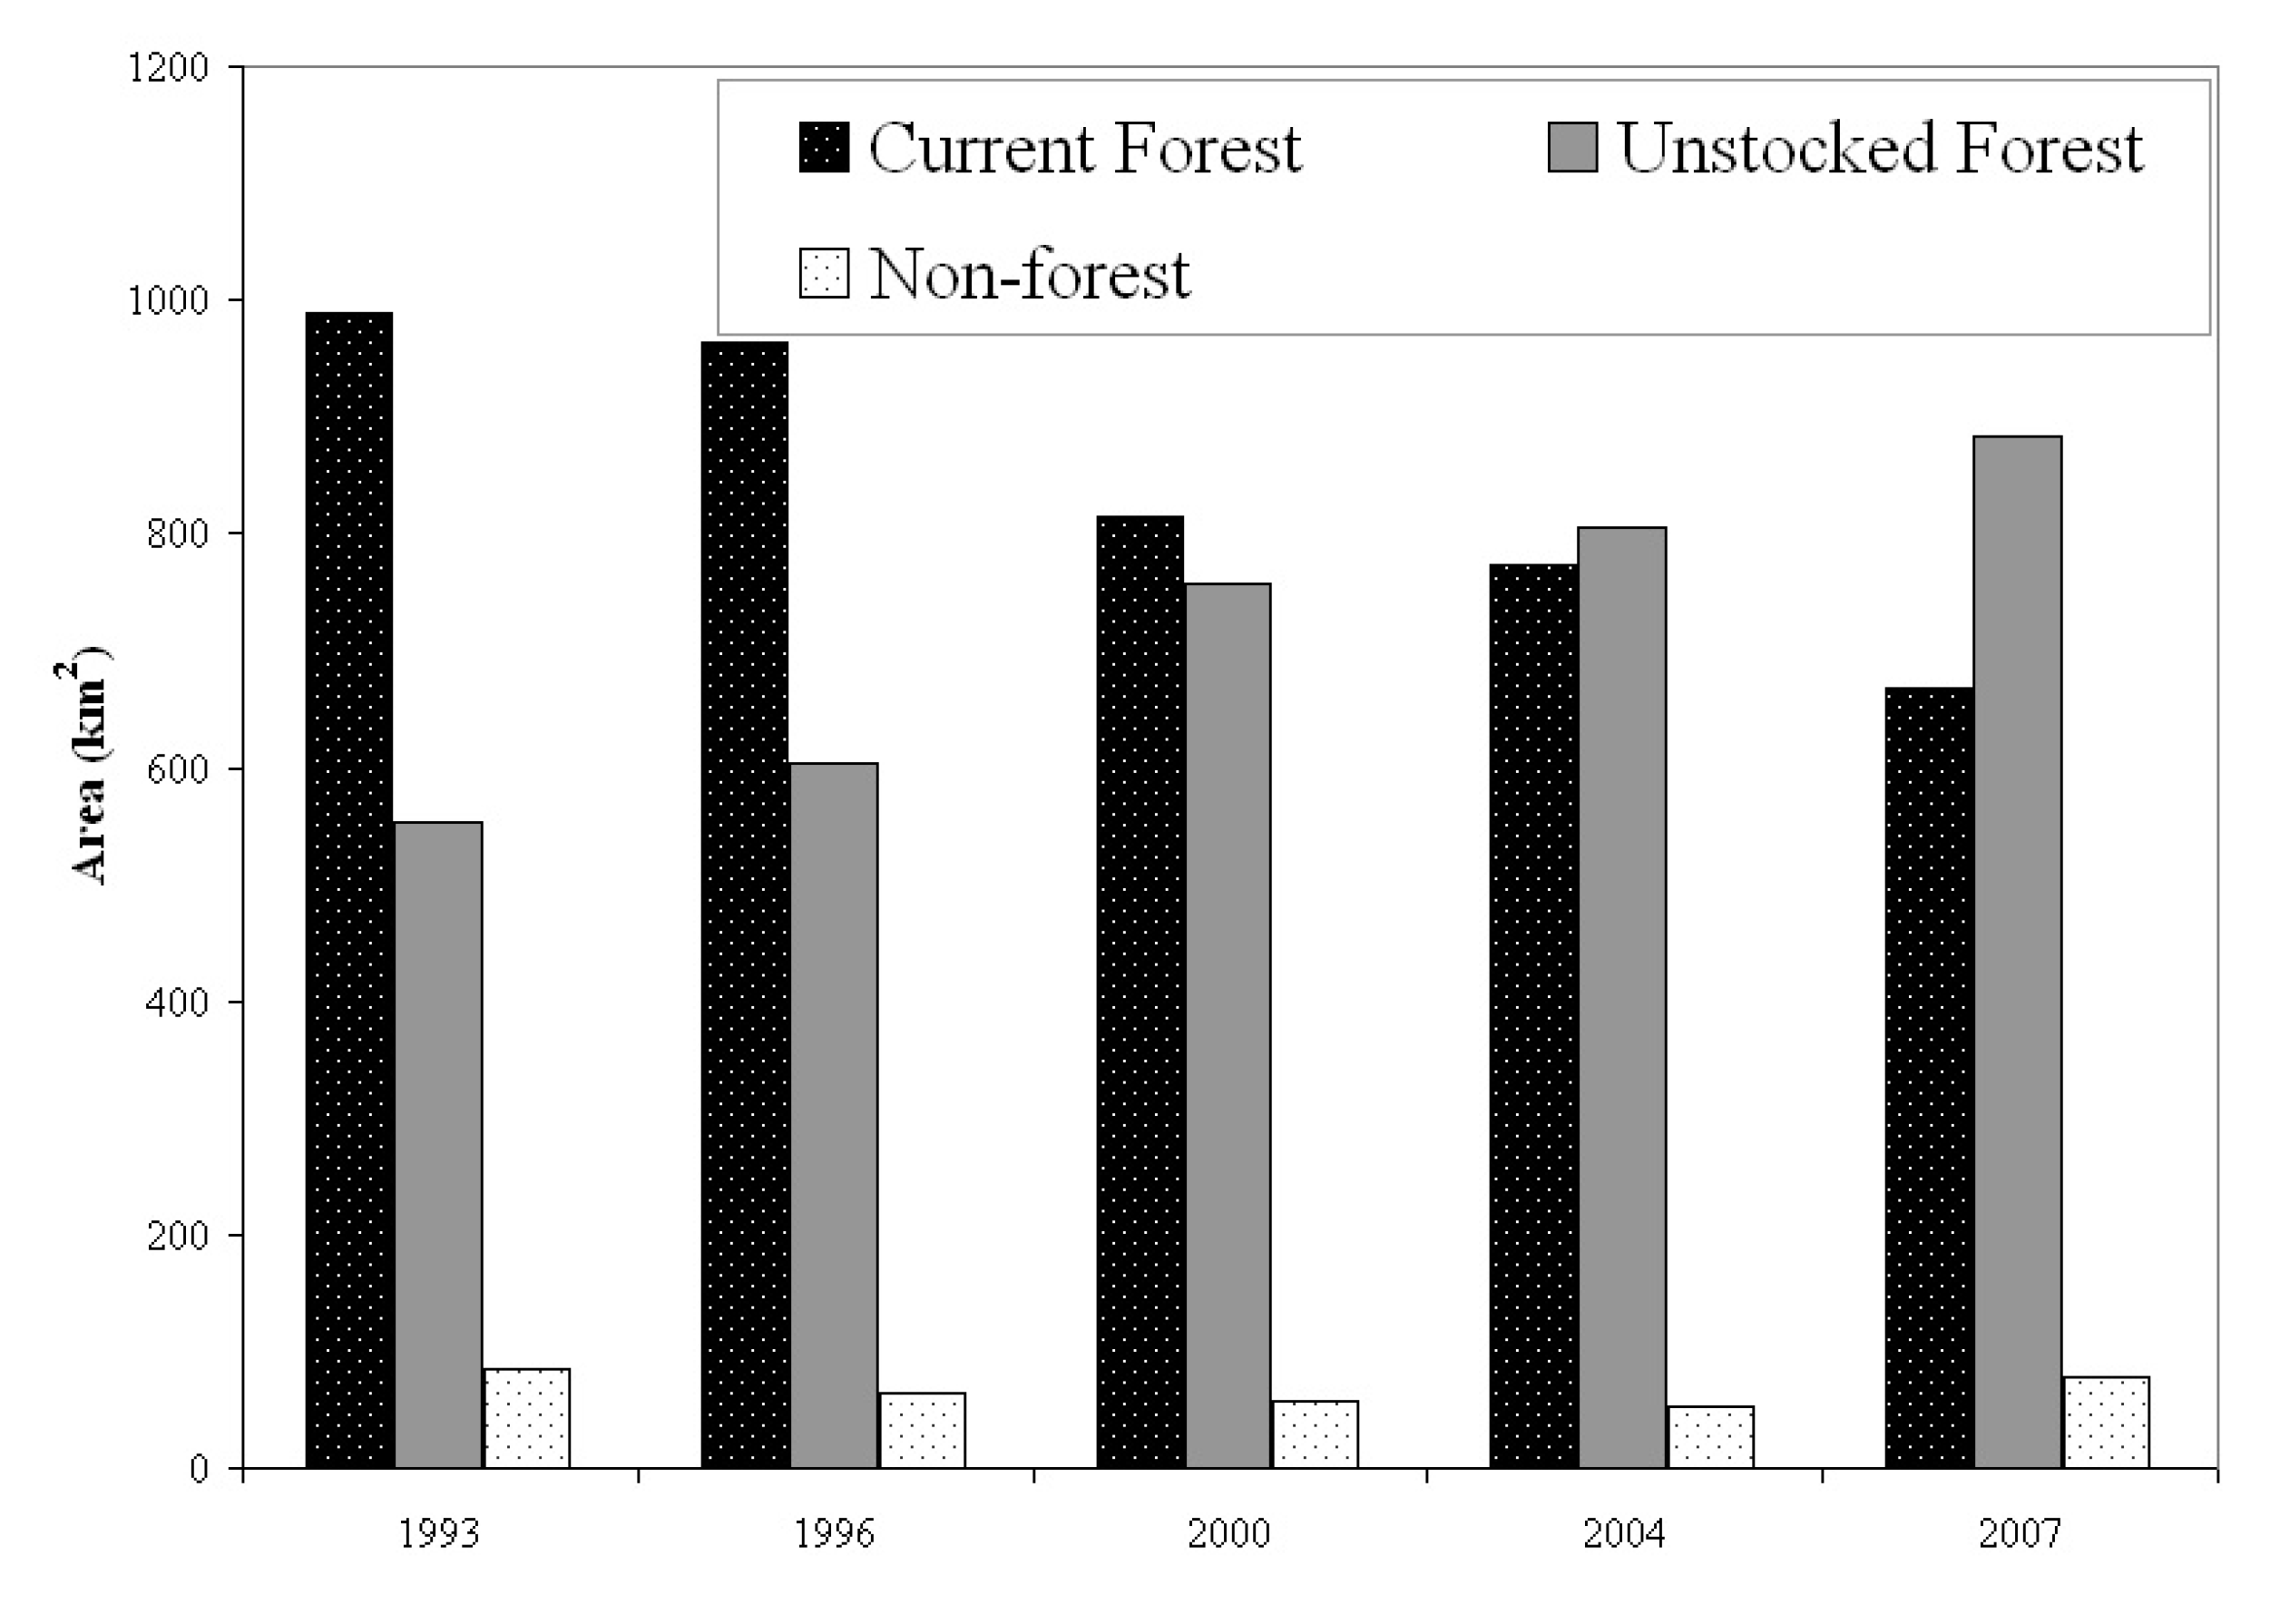
Forest cover maps show that the current forest and unstocked forest areas were dominant in the study area (
Figure 3). From 1993 to 1996, unstocked forest areas increased from 554 km
2 to 602 km
2, while current forest decreased from 989 km
2 to 965 km
2. Generally, non-forest areas decreased slightly from 86 km
2 to 63 km
2. However, between 1996 and 2000, unstocked forest areas increased from 602 km
2 to 757 km
2, whereas current forest decreased from 965 km
2 to 814 km
2. In addition, non-forest areas decreased slightly from 63 km
2 to 57 km
2 during the same period (1996–2000).
Further analysis revealed that unstocked forest areas increased from 757 km2 to 805 km2, while current forest decreased from 814 km2 to 772 km2 between 2000 and 2004. On the other hand, non-forest areas decreased slightly from 57 km2 to 53 km2. During the 2004 to 2007 period, unstocked forest areas increased from 805 km2 to 883 km2, whereas current forest decreased from 772 km2 to 668 km2. In contrast to the previous periods (1993–1996, 1996–2000, 2000–2004), non-forest areas increased slightly from 53 km2 to 77 km2 between 2004 and 2007.
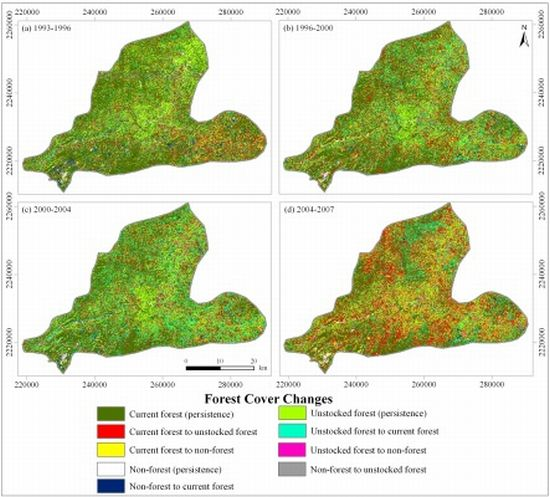
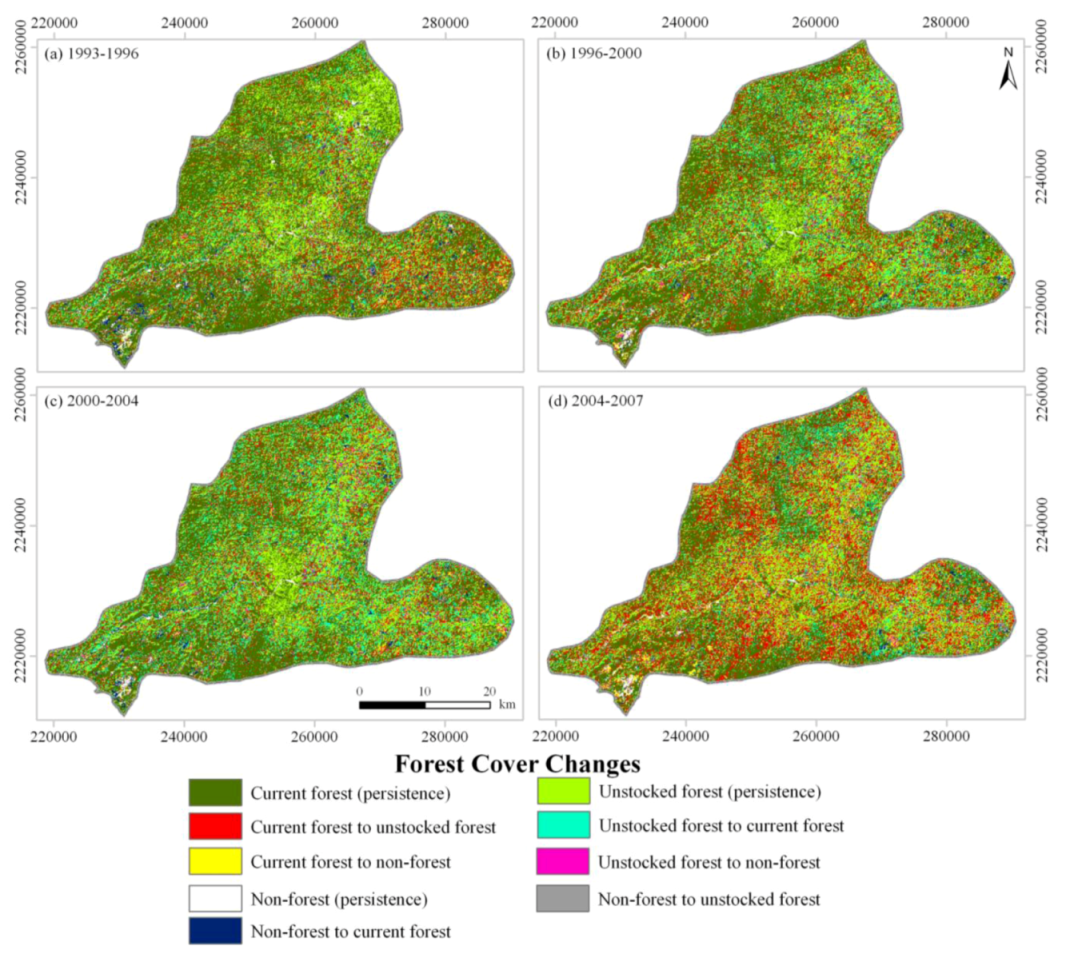
Table 4 shows that “current forest to unstocked forest” and “unstocked forest to current forest” were the major forest cover changes in Pakxeng district between 1993 and 2007. The high rate of “current forest to unstocked forest” changes compared to the low rate of “unstocked forest to current forest” changes for the 1993–1996 and 1996–2000 periods indicate significant loss of current forests (
Figure 4). However, between 2000 and 2004, the “unstocked forest to current forest” change rate was higher than the “current forest to unstocked forest” rate, which shows that more regrowth occurred in the study area. On the contrary, the 2004–2007 period was characterized by a high decline in current forest areas given the high “current forest to unstocked forest” change on one hand and a low “unstocked forest to current forest” change on the other hand.
Figure 4 shows that rapid forest cover changes occurred during the 2004–2007 period.
Figure 3.
Forest cover changes in km2.
Figure 3.
Forest cover changes in km2.
Table 4.
Forest cover changes (km2).
Table 4.
Forest cover changes (km2).
| Forest Cover Class | 1993–1996 | 1996–2000 | 2000–2004 | 2004–2007 |
|---|
| Current forest to unstocked forest | 196 | 239 | 181 | 398 |
| Current forest to non-forest | 25 | 28 | 24 | 40 |
| Unstocked forest to current forest | 137 | 181 | 239 | 133 |
| Unstocked forest to non-forest | 15 | 17 | 25 | 26 |
| Non-forest to current forest | 34 | 24 | 28 | 17 |
| Non-forest to unstocked forest | 31 | 25 | 17 | 32 |
Spatial analysis of the forest cover changes reveals a relatively similar pattern for the 1993–1996, 1996–2000 and 2000–2004 periods, particularly for the “current forest to unstocked forest” changes (
Figure 4). The “current forest to unstocked forest and non-forest” changes are distributed randomly (scattered) within Pakxeng district. This is partly attributed to shifting cultivation, which is dominant in the study area. However, most of the “current forest to unstocked forest” changes are mainly concentrated in the north-western, eastern and southern parts of the study area. In contrast to the 1993–1996, 1996–2000 and 2000–2004 periods, an intensification of the “current forest to unstocked forest” changes in the north-western, eastern and southern parts of the study area is observed between 2004 and 2007 (
Figure 4). These forest cover changes coincide with the construction of a bridge near the district center during the same period (
Figure 1).
Figure 4.
Forest cover changes for (a) 1993–1996, (b) 1996–2000, (c) 2000–2004 and (d) 2004-2007.
Figure 4.
Forest cover changes for (a) 1993–1996, (b) 1996–2000, (c) 2000–2004 and (d) 2004-2007.
4.2. Analysis of Transition Probabilities and Transition Potential (Suitability)
Table 5(a–c) shows the forest cover transition probabilities between 1993 and 2004, calculated on the basis of the frequency distribution of the observations. The diagonal of the transition probability represents the self-replacement probabilities, that is, the probability of a forest cover class remaining the same (shown in bold in
Table 5(a–c)), whereas the off-diagonal values indicate the probability of a change occurring from one forest cover class to another. The self-replacement probabilities for the current forest and unstocked forest classes were above 50%, while the self-replacement probability for non-forest class was lower than 50% during the 1993–1996 and 1996–2000 periods (
Table 5(a,b)). However, the self-replacement probabilities for the unstocked forest class was above 50%, while the self-replacement probabilities for current forest and non-forest classes were lower than 50% between 2000 and 2004, which suggests changes in the forest cover dynamics.
In general, the transition probabilities from current forest to unstocked forest were higher than the transition probabilities from unstocked forest to current forest over the three time periods (
Table 5(a–c)). For example, the transition probability from current forest to unstocked forest was 23%, whereas the transition probability from unstocked forest to current was 14% between 1993 and 1996. This implies that more deforestation than regrowth would continue in the future. On the contrary, the transition probabilities from both current and unstocked forest to non-forest were less than 10% over the three time periods. However, the transition probabilities from non-forest to both the unstocked forest and current forest classes were high. For instance, the transition probabilities from non-forest to unstocked forest were over 50% over the three time periods (
Table 5(a–c)), which suggests that under the current conditions, non-forest areas would decrease in the future. Although the Markov chain analysis depends on many assumptions, such as the stationarity of the transition matrix (that is, temporal homogeneity), they give the direction and magnitude of change that is of potential use for simulating forest cover changes [
34].
Table 5.
(a) Forest cover changes transition probabilities (1993–1996) under BAU scenario. (b) Forest cover changes transition probabilities (1996–2000) BAU scenario. (c) Forest cover changes transition probabilities (2000–2004) BAU scenario.
Table 5.
(a) Forest cover changes transition probabilities (1993–1996) under BAU scenario. (b) Forest cover changes transition probabilities (1996–2000) BAU scenario. (c) Forest cover changes transition probabilities (2000–2004) BAU scenario.
| | 1996 |
|---|
| | Current Forest | Unstocked Forest | Non-Forest |
|---|
| 1993 | Current forest | 0.75 | 0.23 | 0.02 |
| Unstocked forest | 0.14 | 0.83 | 0.03 |
| Non-forest | 0.16 | 0.52 | 0.32 |
| (a) |
| | 2000 |
| | Current Forest | Unstocked Forest | Non-Forest |
| 1996 | Current forest | 0.64 | 0.34 | 0.02 |
| Unstocked forest | 0.2 | 0.77 | 0.03 |
| Non-forest | 0.18 | 0.63 | 0.19 |
| (b) |
| | 2004 |
| | Current Forest | Unstocked Forest | Non-Forest |
| 2000 | Current forest | 0.49 | 0.49 | 0.02 |
| Unstocked forest | 0.17 | 0.79 | 0.04 |
| Non-forest | 0.09 | 0.68 | 0.23 |
| (c) |
Analysis of the “weights of evidence” results revealed that high deforestation propensity is influenced by fuelwood consumption and rice production, which had contrast values of 0.17 and 0.1, respectively. Contrast is the difference between the positive and negative weights (derived from the “weights of evidence” analysis) that is used to measure the correlation between a particular forest cover change and sampled training points for each driving factor variable [
20]. Furthermore, the “weights of evidence” results revealed that the decrease in current forest areas (that is, change from current forest to unstocked forest and non-forest) is also influenced by “distance to deforested areas”, as indicated by a contrast value of 0.23. However, other accessibility measures, such as “distance to unpaved secondary roads” and “distance to rivers”, as well as elevation, labor, livestock ownership and population density had negative contrast values indicating little influence on forest cover changes in the study area.
4.3. Validation of the MCA Model
Validation of the simulated forest cover map is critical, because it helps researchers to improve a model’s simulation capacity [
35,
36]. For model validation, we compared the simulated forest cover map for 2007 with the actual (observed) satellite-derived forest cover map for 2007 under the BAU scenario. The standard Kappa statistic, which measures overall simulation accuracy based on the percentage agreement between two forest cover maps, corrected for the fraction of agreement that can be expected by chance was used for model validation [
37]. Note that the standard Kappa statistic values range from 1 (that indicates a perfect agreement) to −1 (that indicates no agreement at all), while 0 indicates that the agreement is equal to the agreement, which can be expected by chance.
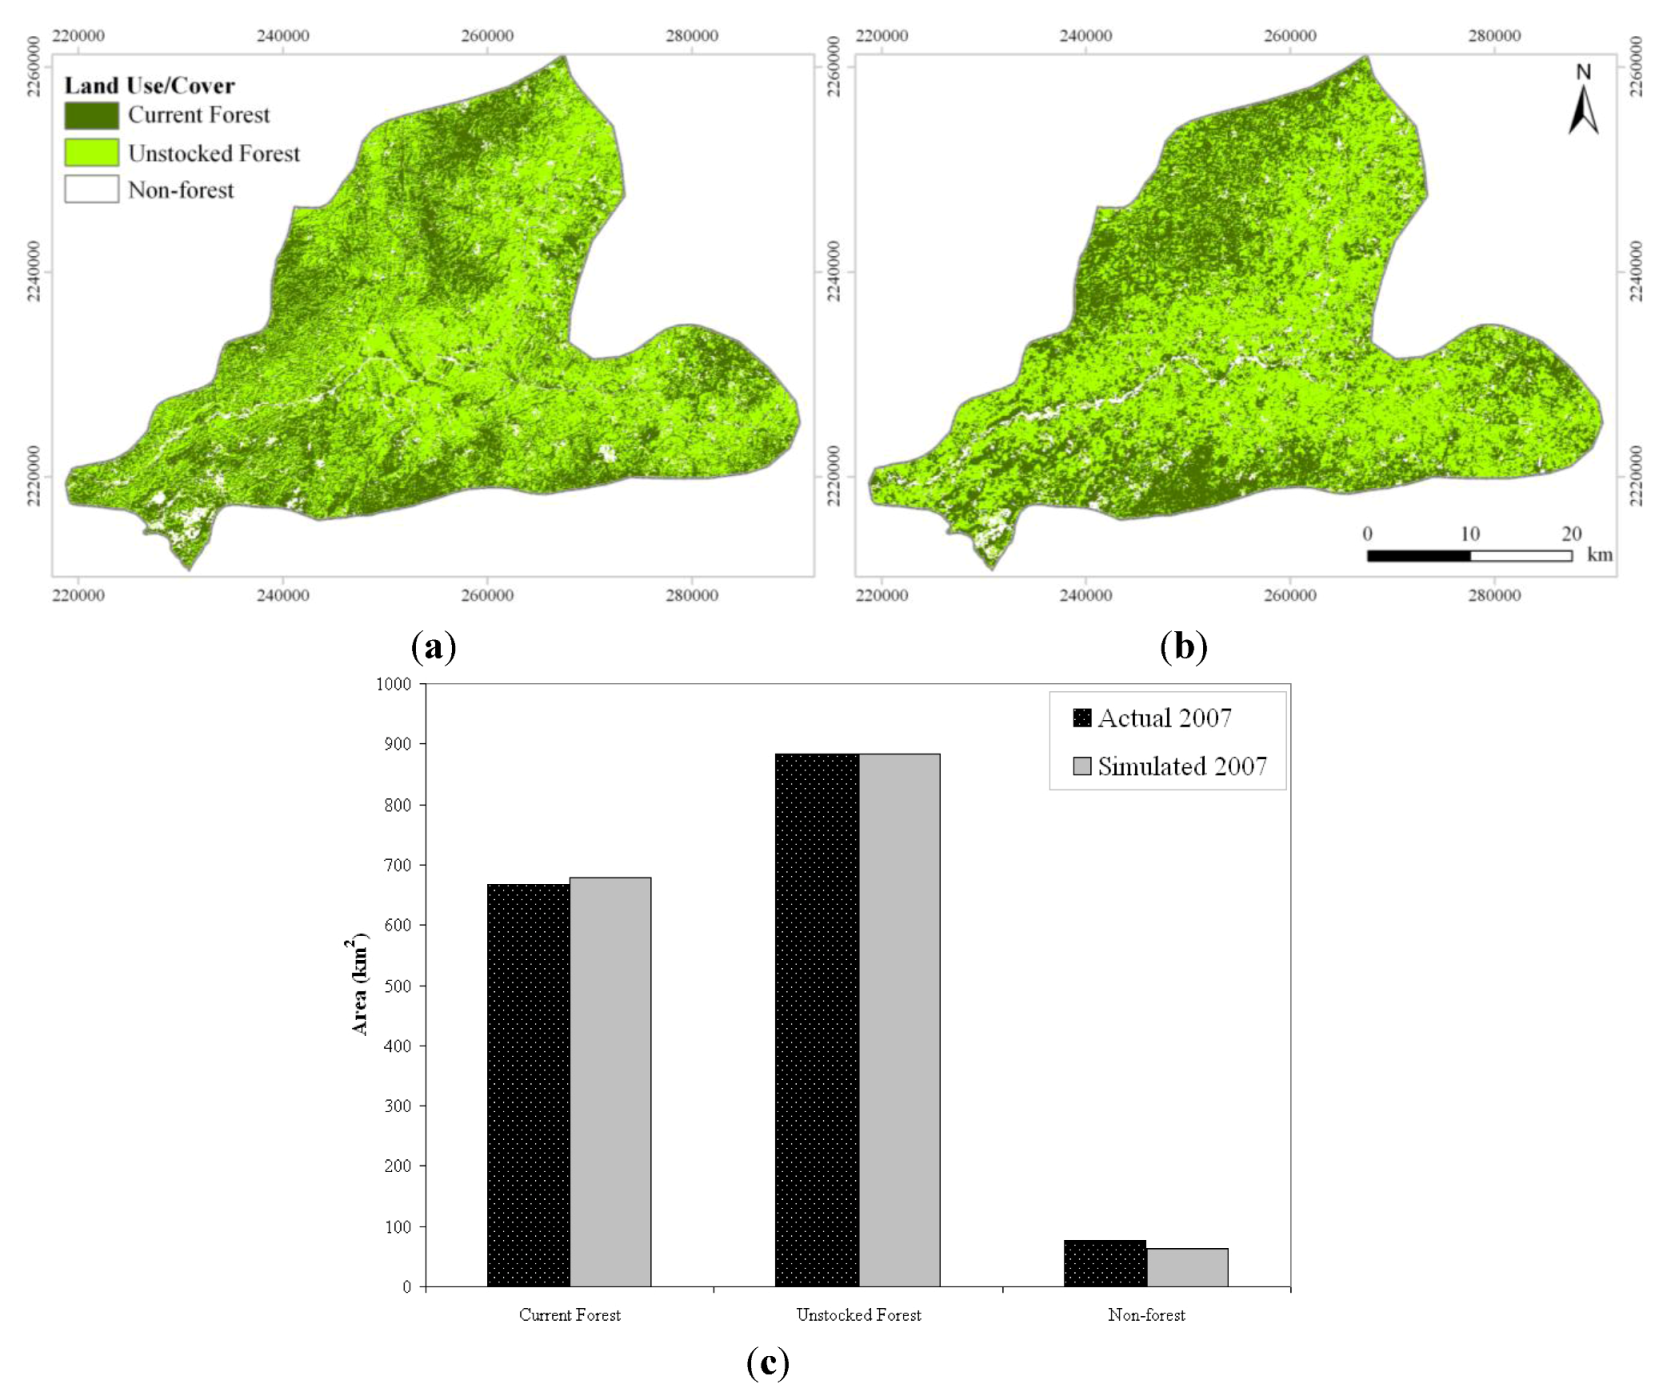
Visual analysis of the simulated forest cover map in 2007 revealed that the MCA model simulated unstocked forest areas relatively well (
Figure 5(a,b)).
Figure 5(c) shows that unstocked forest and current forest classes have the best agreement in terms of quantity. For example, the actual (observed) unstocked forest class was 883 km
2, while the corresponding simulated class was 884 km
2. On the other hand, the current forest class was 668 km
2, while the corresponding simulated class was 679 km
2. The observed non-forest class was 77 km
2 compared to the corresponding simulated forest class, which was 63 km
2.
The simulated forest cover map revealed that location was relatively underpredicted, particularly for the non-forest class (
Figure 5(a)). This is attributed to a number of factors. First, the MCA model applied in Pakxeng district assumed that land use and forest cover transitions are linear and spatially dependent (that is, new forest/non-forest patches are predicted near locations where those patches already exist). However, forest cover change analysis in the study area (
Figure 4) show that forest cover changes are non-linear and do not generally grow from existing forest/non-forest patches, particularly between 2004 and 2007. Consequently, the MCA model underpredicts the location of new patches that are not connected to existing patches [
38]. Second, the “weights of evidence” algorithm used the same “distance to unpaved secondary roads” parameter for calibrating the transition potential maps (for 1993–1996, 1996–2000 and 2000–2004) given the lack of updated road data. As a result, the effect of new constructed unpaved roads was not included during the calibration phase under the BAU scenario, which also increases locational inaccuracy. Finally, lack of GIS data, such as soil maps and other less quantifiable factors, such as government policy on logging concession, were not included, thus reducing the model’s predictive power. Despite these limitations, the MCA’s overall simulation success was 0.73 with a Kappa index of 0.67, which is relatively good for simulating future forest cover changes at the district level.
Figure 5.
Actual (a) versus simulated forest, (b) cover maps (2007), (c) actual versus simulated forest cover maps (2007).
Figure 5.
Actual (a) versus simulated forest, (b) cover maps (2007), (c) actual versus simulated forest cover maps (2007).
4.4. Simulated Future Forest Cover Changes
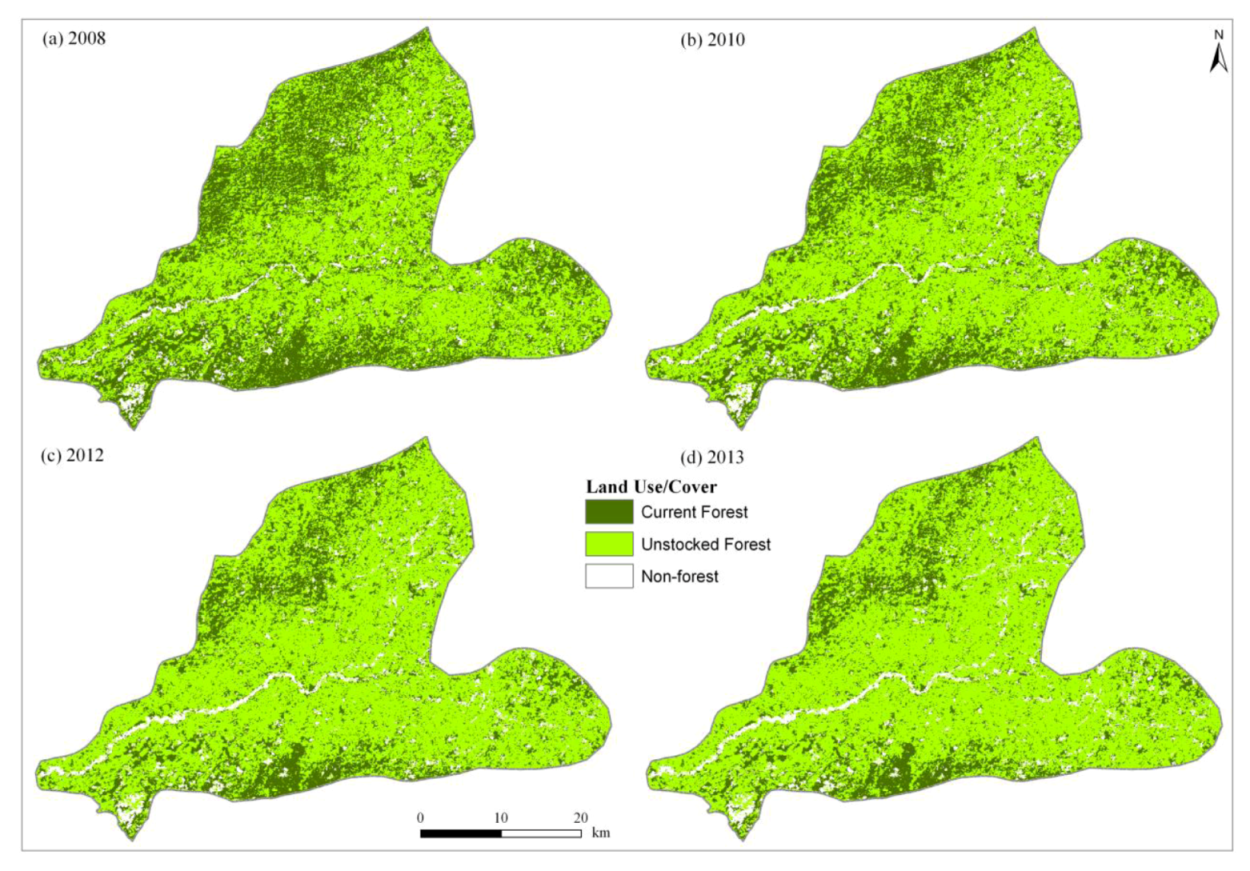
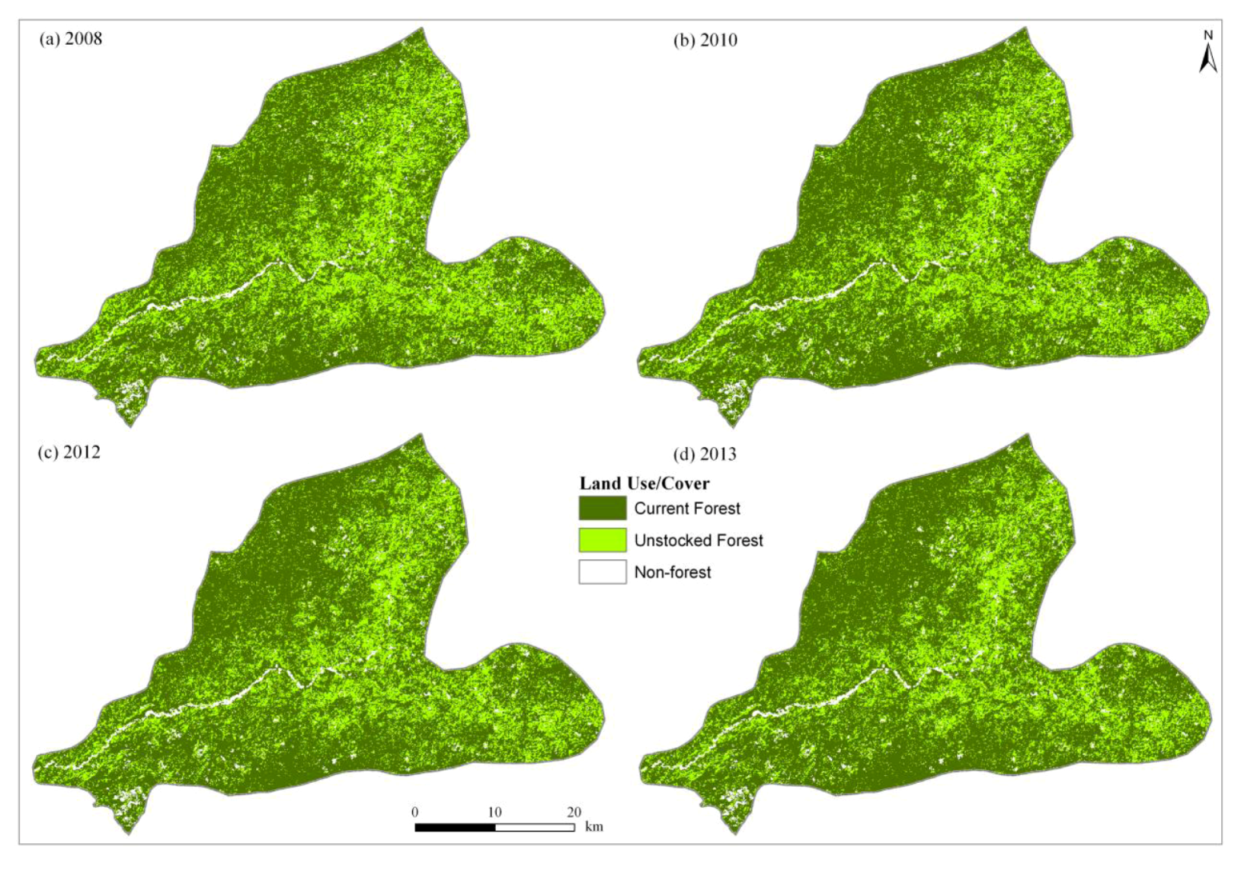
Figure 6 shows the simulated future forest cover changes under the BAU scenario. The MCA model projected that current forest areas would decrease from 668 km
2 in 2007 to 474 km
2 in 2013, while unstocked forest areas would increase substantially from 883 km
2 to 1,101 km
2 over the same period (
Figure 6). In addition, non-forest areas would decrease from 77 km
2 in 2007 to 42 km
2 in 2013. The spatial distribution of the simulated forest cover changes indicate that in the future, deforestation would be concentrated mainly to the north-western, eastern and southern parts of the study area. This pattern of simulated forest cover changes is consistent with the observed forest cover changes (
Figure 4), which reflects the dominance of the “current forest to unstocked forest” change.
Figure 6.
Simulated future forest cover changes under the BAU scenario.
Figure 6.
Simulated future forest cover changes under the BAU scenario.
Under the pessimistic scenario, the MCA model simulations projected that current forest areas would decrease significantly from 668 km
2 in 2007 to 335 km
2 in 2013, while unstocked forest areas would increase significantly from 883 km
2 to 1,187 km
2 over the same period (
Figure 7). In addition, non-forest areas would increase substantially from 77 km
2 in 2007 to 95 km
2 in 2013 (
Figure 7). The rapid decline in current forest areas on one hand and the increase in unstocked forest and non-forest areas on the other hand imply severe forest loss in the future. The spatial distribution of “current forest to unstocked forest” changes under the pessimistic scenario is similar to the BAU scenario. However, the forest cover changes, especially from current forest to unstocked forest areas, are more intensified under the pessimistic scenario.
In contrast to the BAU and pessimistic scenarios, the MCA model projected an increase in current forest areas (approximately from 668 km
2 in 2007 to 1,143 km
2 in 2013), while unstocked forest areas would decrease substantially from 883 km
2 in 2007 to 425 km
2 over the same period under the optimistic scenario (
Figure 8). However, non-forest areas would decrease significantly from 77 km
2 in 2007 to 50 km
2 in 2013 (
Figure 8). The MCA model indicated that current forest areas would increase in the future since the protected forest area coverage was used as a constraint to deforestation.
Figure 7.
Simulated future forest cover changes under the pessimistic scenario.
Figure 7.
Simulated future forest cover changes under the pessimistic scenario.
Figure 8.
Simulated future forest cover changes under the optimistic scenario.
Figure 8.
Simulated future forest cover changes under the optimistic scenario.
4.5. Implications for Sustainable Forest Management
More recently, the Government of Lao PDR, in collaboration with other international donor agencies, such as the Japan International Cooperation Agency (JICA) and Swedish International Development Cooperation Agency (SIDA), have intensified sustainable forest management activities [
39]. However, a multitude of challenges that include lack of clear scientific basis for evaluating different policy scenarios impede the effective implementation of sustainable forest management. In this regard, MCA spatial simulation models under the BAU, pessimistic and optimistic scenarios can be used to explore the implications of future forest cover changes for sustainable forest management [
40]. More importantly, the MCA model can be used to establish linkage between land use monitoring and forestry use policy formulation [
8].
The simulated future forest cover changes under the BAU and pessimistic scenarios indicate “hot spot” areas, where rapid decline in current forest areas would likely occur in the future. Thus, these scenarios implies increased forest loss and degradation in the future, which may lead to the scarcity of NTFP, as well as the intensification of natural disasters, such as floods or droughts, if no immediate mitigation measures are undertaken. It should be noted that the simulated scenarios considered in this study are conservative, because they are based only on the analysis of available data. For example, the impact of both legal and illegal forest logging was not directly included in the model. However, our approach has potential for sustainable forest management and planning purposes, especially in areas, such as Pakxeng district, where extensive data is not available or is difficult to collect. Therefore, the implementation of the land and forest allocation, stabilization of shifting cultivation and participatory forestry management systems could use the simulated future forest cover maps to target “hot spot” areas that need immediate interventions.
Under the optimistic scenario, current forest areas increased mainly due to forest regrowth. This suggests that sustainable forest management efforts should encompass strategies, such as strict enforcement of forestry laws, which would enhance forest regrowth. The implications of the simulated future forest cover changes under the optimistic scenario for sustainable forest management are critical, since the Government of Lao PDR aims to regenerate forest cover in the country to 70% by 2020 [
41]. The MCA model provide ‘what if’ scenarios, which can assist researchers, policy makers and other stakeholders in assessing the implications of land use and development policy alternatives on forest cover change patterns and trajectories. Within this context, the MCA model provides a cost-effective tool that addresses a number of possible factors hypothesized to affect forest cover path dependencies [
23].
5. Summary and Conclusions
Understanding future forest cover changes under different simulation scenarios has significant implications for sustainable forest management. Using Pakxeng district as a case study and a GIS-based MCA model, we simulated future forest cover changes under the BAU, pessimistic and optimistic scenarios in Pakxeng district. The 1993 forest cover map, transition probabilities and the transition potential maps were used to simulate forest cover map for 2007. In order to validate the accuracy of the MCA model, we compared the simulated forest cover map for 2007 and the actual (observed) forest cover map for 2007. The validation results revealed that unstocked forest and current forest classes were well simulated, while the non-forest class was slightly underpredicted. However, the model’s overall simulation success was 0.73, which is relatively good for simulating future forest cover changes at the district level.
After the successful calibration and validation of the MCA model, future forest cover changes were simulated (up to 2013) under the BAU, pessimistic and optimistic scenarios. Simulation results under BAU scenario indicated that current forest cover change trends, such as decrease in current forest areas and increase in unstocked forest areas, would continue to persist in the study area. In addition, the MCA simulations under pessimistic scenario revealed a rapid decrease in current forest areas and substantial increases in unstocked forest areas, which implies severe deforestation and forest degradation in the future. In contrast, an alternative optimistic scenario indicated that current forest areas would increase if forestry laws and policies respecting conservation are strictly enforced in protected forest areas.
This study has important implications for sustainable forest management in Pakxeng district, in particular, and Lao PDR, in general. First, the MCA model revealed that future forest cover losses under the BAU and pessimistic scenarios are concentrated mainly to the north-western, eastern and southern parts of the study area. Consequently, the one-size-fits-all approach, which is typically prescribed by policy makers, should be avoided. Rather, site specific sustainable forest management approaches tailored-made to suit different conditions of each village or area within Pakxeng district should be implemented. Second, our results have identified that high deforestation propensity is influenced by fuelwood consumption and rice production, as well as “distance to deforested areas” under the BAU scenario. Therefore, more sustainable forest management resources should be targeted to these “hot spot” areas, taking into account the effect of the driving factor variables, such as fuelwood consumption, rice production and accessibility measures. While this study has identified important driving factor variables, a more comprehensive analysis of the influence of the agents of land use/cover changes is needed for an integrated multiscale approach to sustainable forest management in Pakxeng district.
The MCA model applied in Pakxeng district has several strengths, which are of potential use for sustainable forest management. First, the model’s transition potential maps were calibrated with biophysical variables, as well as socioeconomic driving variables derived from a household survey. Therefore, it is one of the few studies in Lao PDR that has attempted to incorporate both biophysical and socioeconomic variables in the simulation of forest cover changes. Second, forestry laws and policies (particularly, the use of the protected areas as a constraint to deforestation) was incorporated in the MCA model under the optimistic scenario. By incorporating policy in the model, this study has thus provided useful insights of future sustainable forest development, which can be applied to the study area, as well as other areas experiencing similar forest cover changes in Lao PDR. Third, the MCA model’s calibration and validation functions permit the comparison of the simulated and actual (observed) forest cover changes, thus allowing for the improvement of the model. In this study, we separated the data used for MCA model calibration and validation. Lastly, four epoch forest cover maps were used for calibrating the MCA model in order to capture the temporal heterogeneity. This is important particularly in areas that experience dynamic land use and forest cover changes due to shifting cultivation and both legal and illegal logging. Despite the uncertainty involved, modeling studies that employ the MCA model [
42,
43,
44] are useful for simulating future forest cover changes under different scenarios, particularly in areas depicting complexity in forest cover changes in Lao PDR.


