On Demand, Development and Dependence: A Review of Current and Future Implications of Socioeconomic Changes for Integrated Water Resource Management in the Okavango Catchment of Southern Africa

Abstract
:1. Introduction

2. Methods
2.1. Approach
2.2. Data

| Data for Map of the Okavango Catchment | |||
| Name | Source | Refers to Year(s) | Scale |
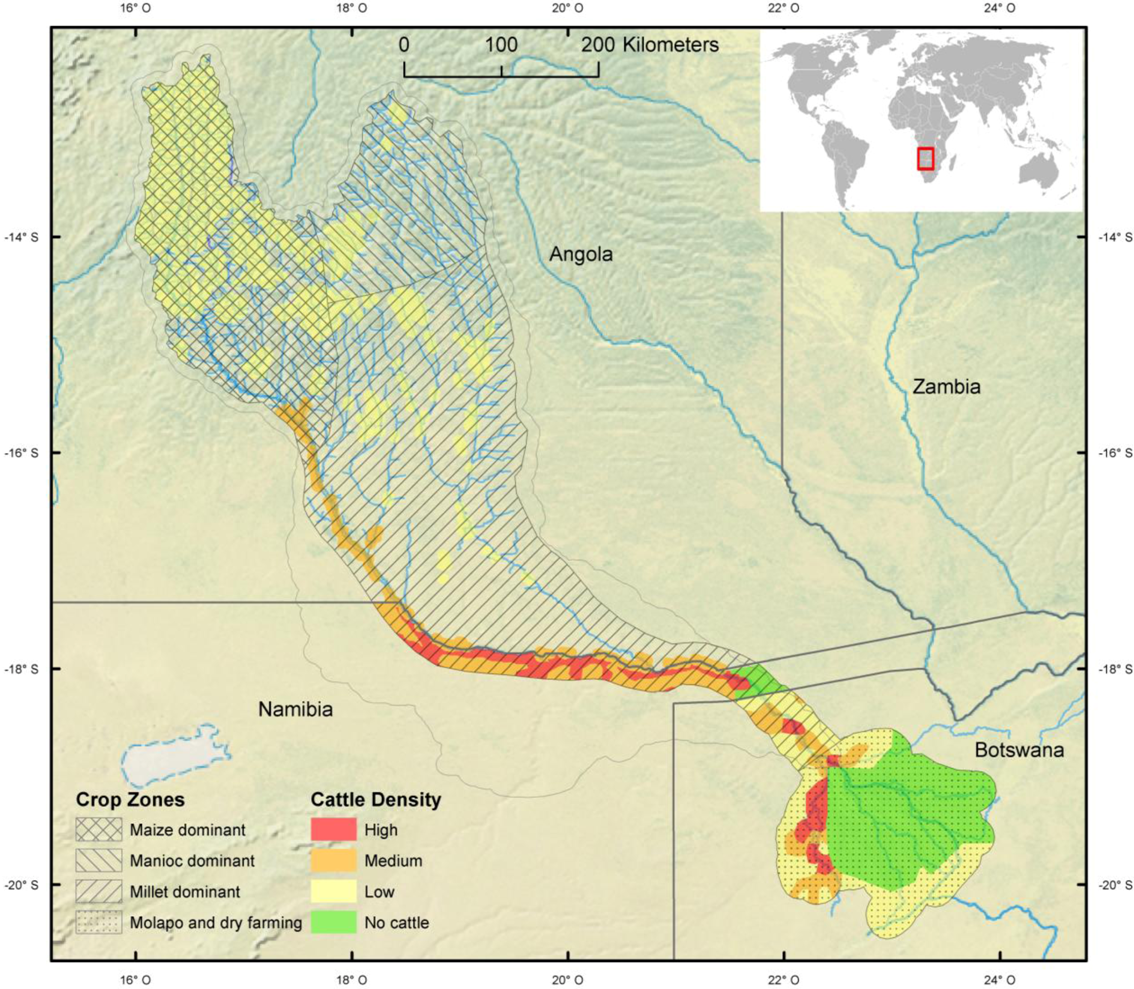
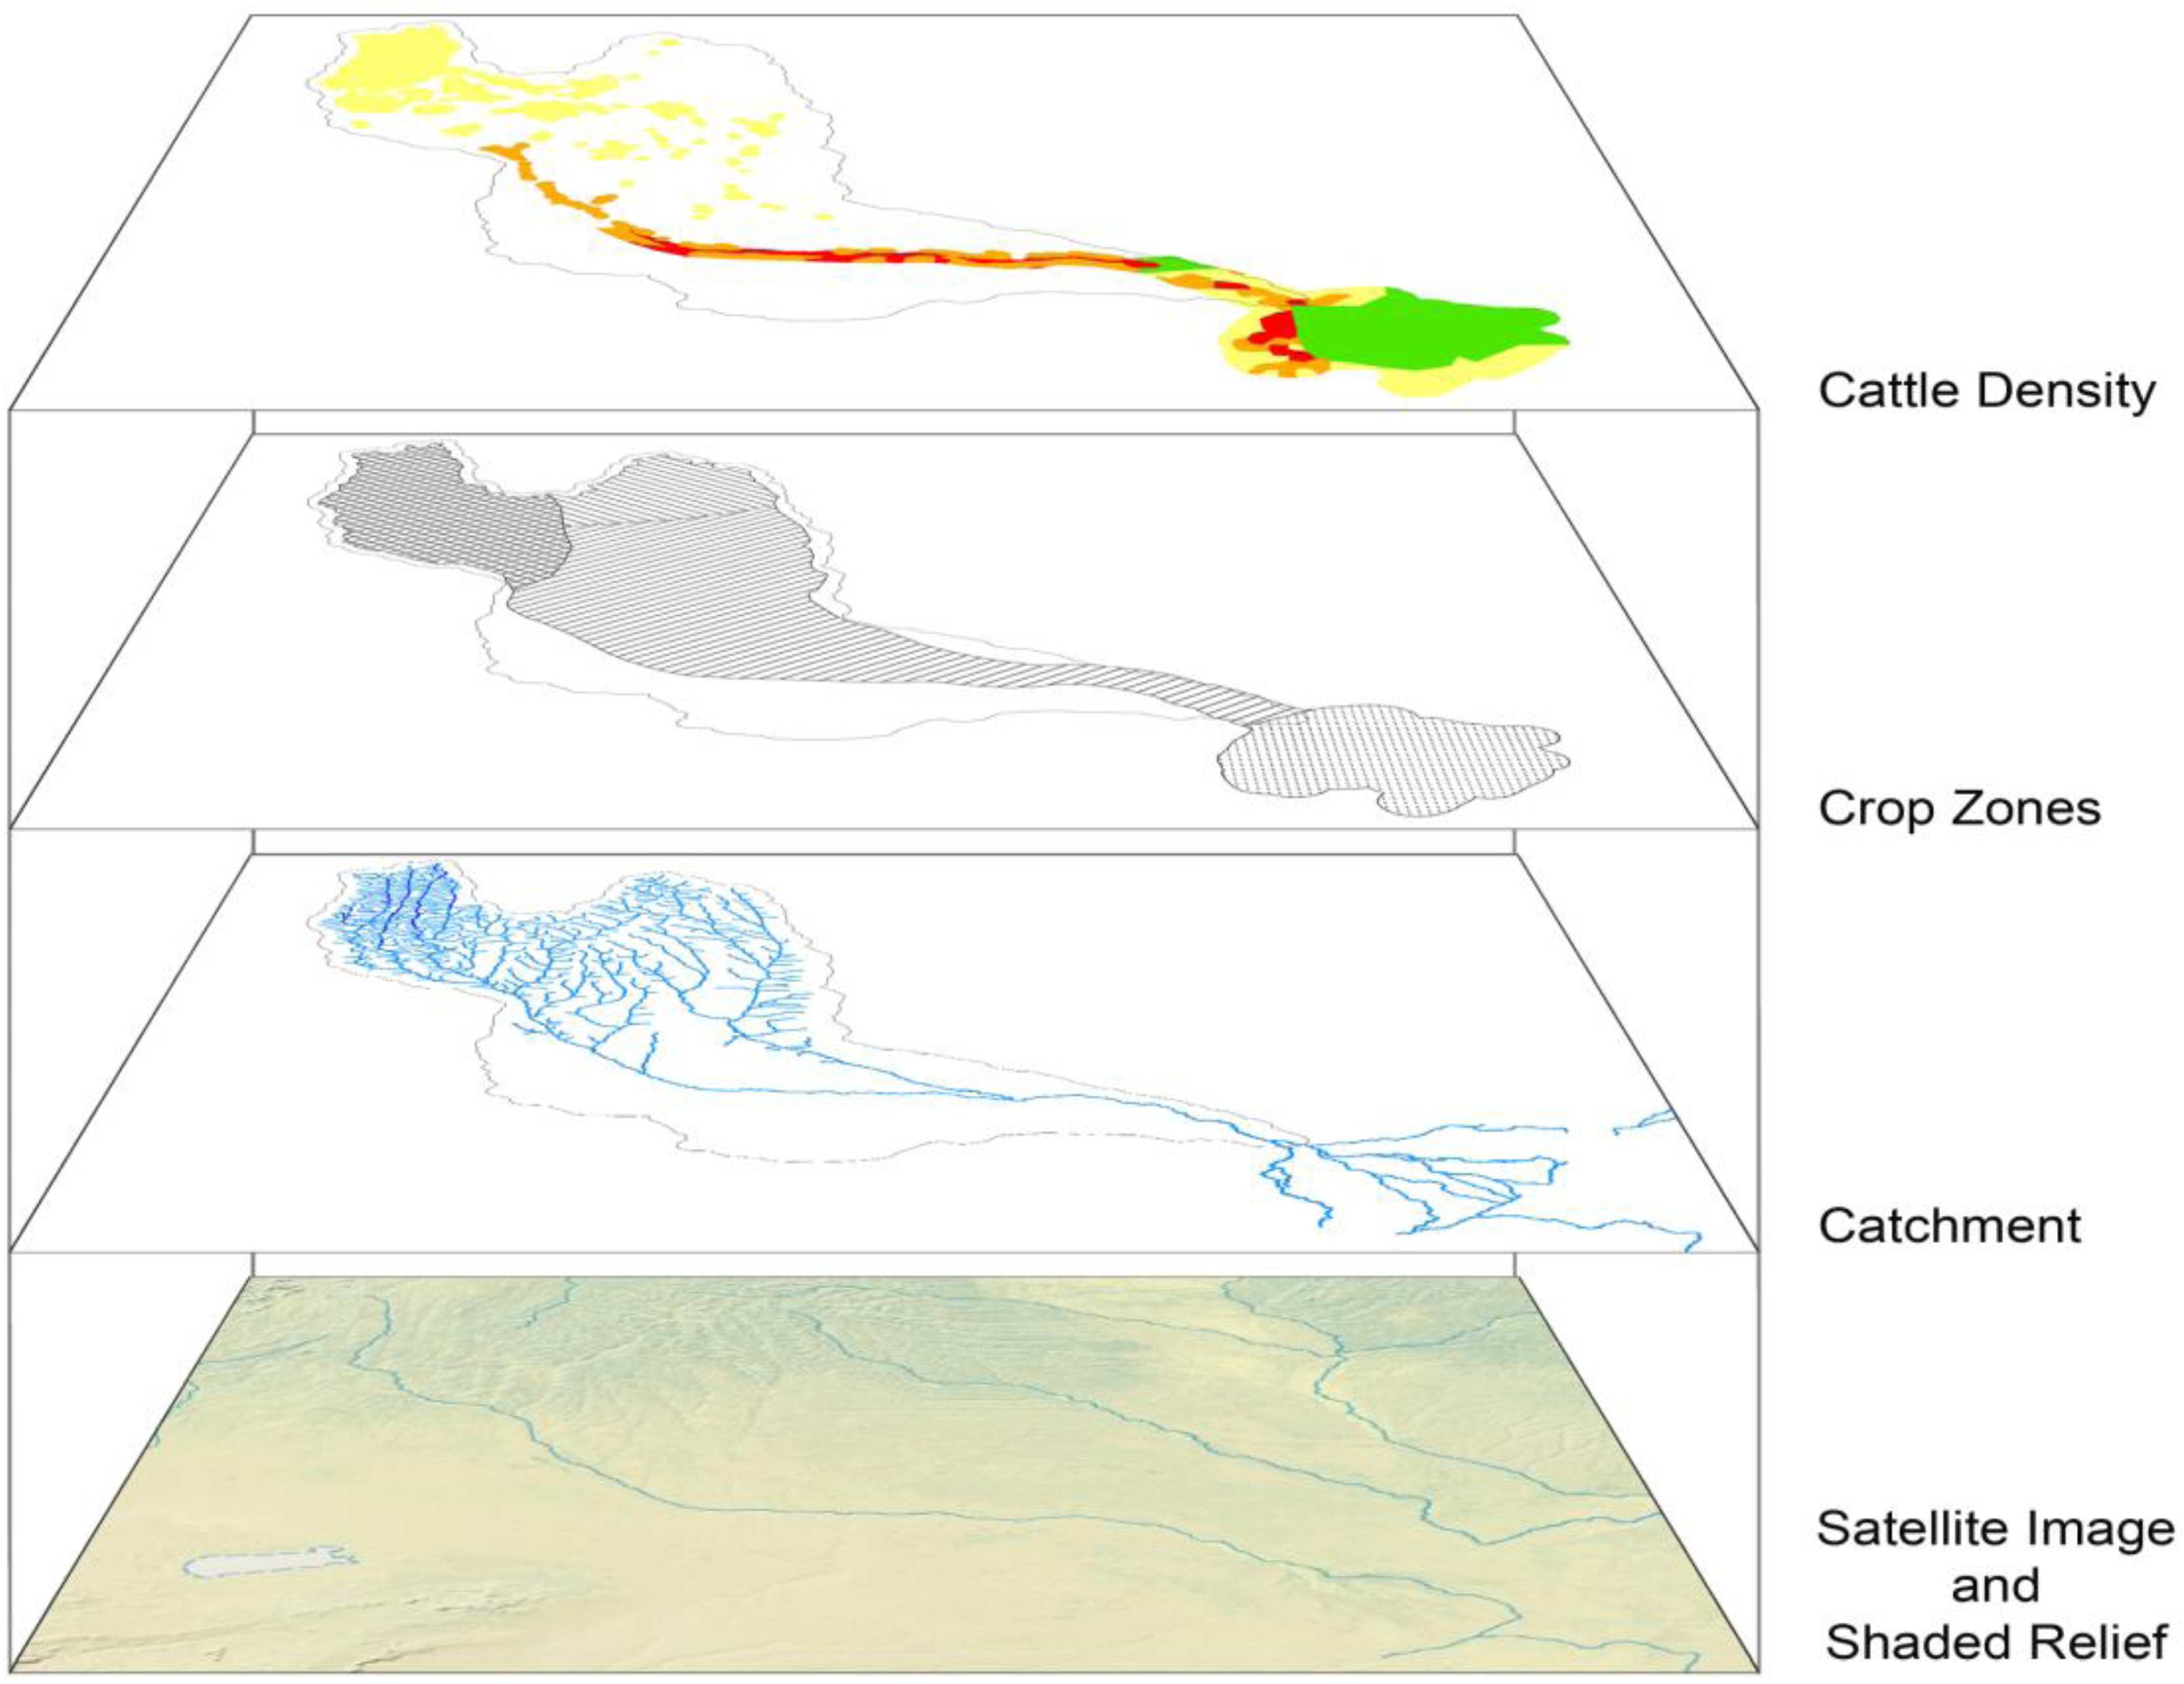
| Cattle density | Environmental Information Service Namibia 2002 [14] | 2002 | subnat. |
| Crop zones | Environmental Information Service Namibia 2004 [15] | 2004 | subnat. |
| Catchment/river drainage | Environmental Information Service Namibia 2004 [15] | 2004 | reg. |
| Satellite image with shaded relief | Natural Earth 2013 [16] | 2013 | reg. |
| Socioeconomic and Water Data | |||
| Name | Source | Refers to Year(s) | Scale |
| GDP in millions | CIA 2013 [18,19,20] | 2012 (est.) | nat. |
| GDP per capita | CIA 2013 [18,19,20] | 2012 (est.) | nat. |
| Gini index | World Bank 2013 [17], Republic of Botswana 2004 [21], Republic of Namibia 2012 (in [22]) | 2000, 2002/03,2009/10 | nat. |
| Human development index | UNDP 2011 [23] | 2011 | nat. |
| Pop. living < 1.25 USD/day | UNDP 2011 [23] | 2000, 2004, 2005 | nat. |
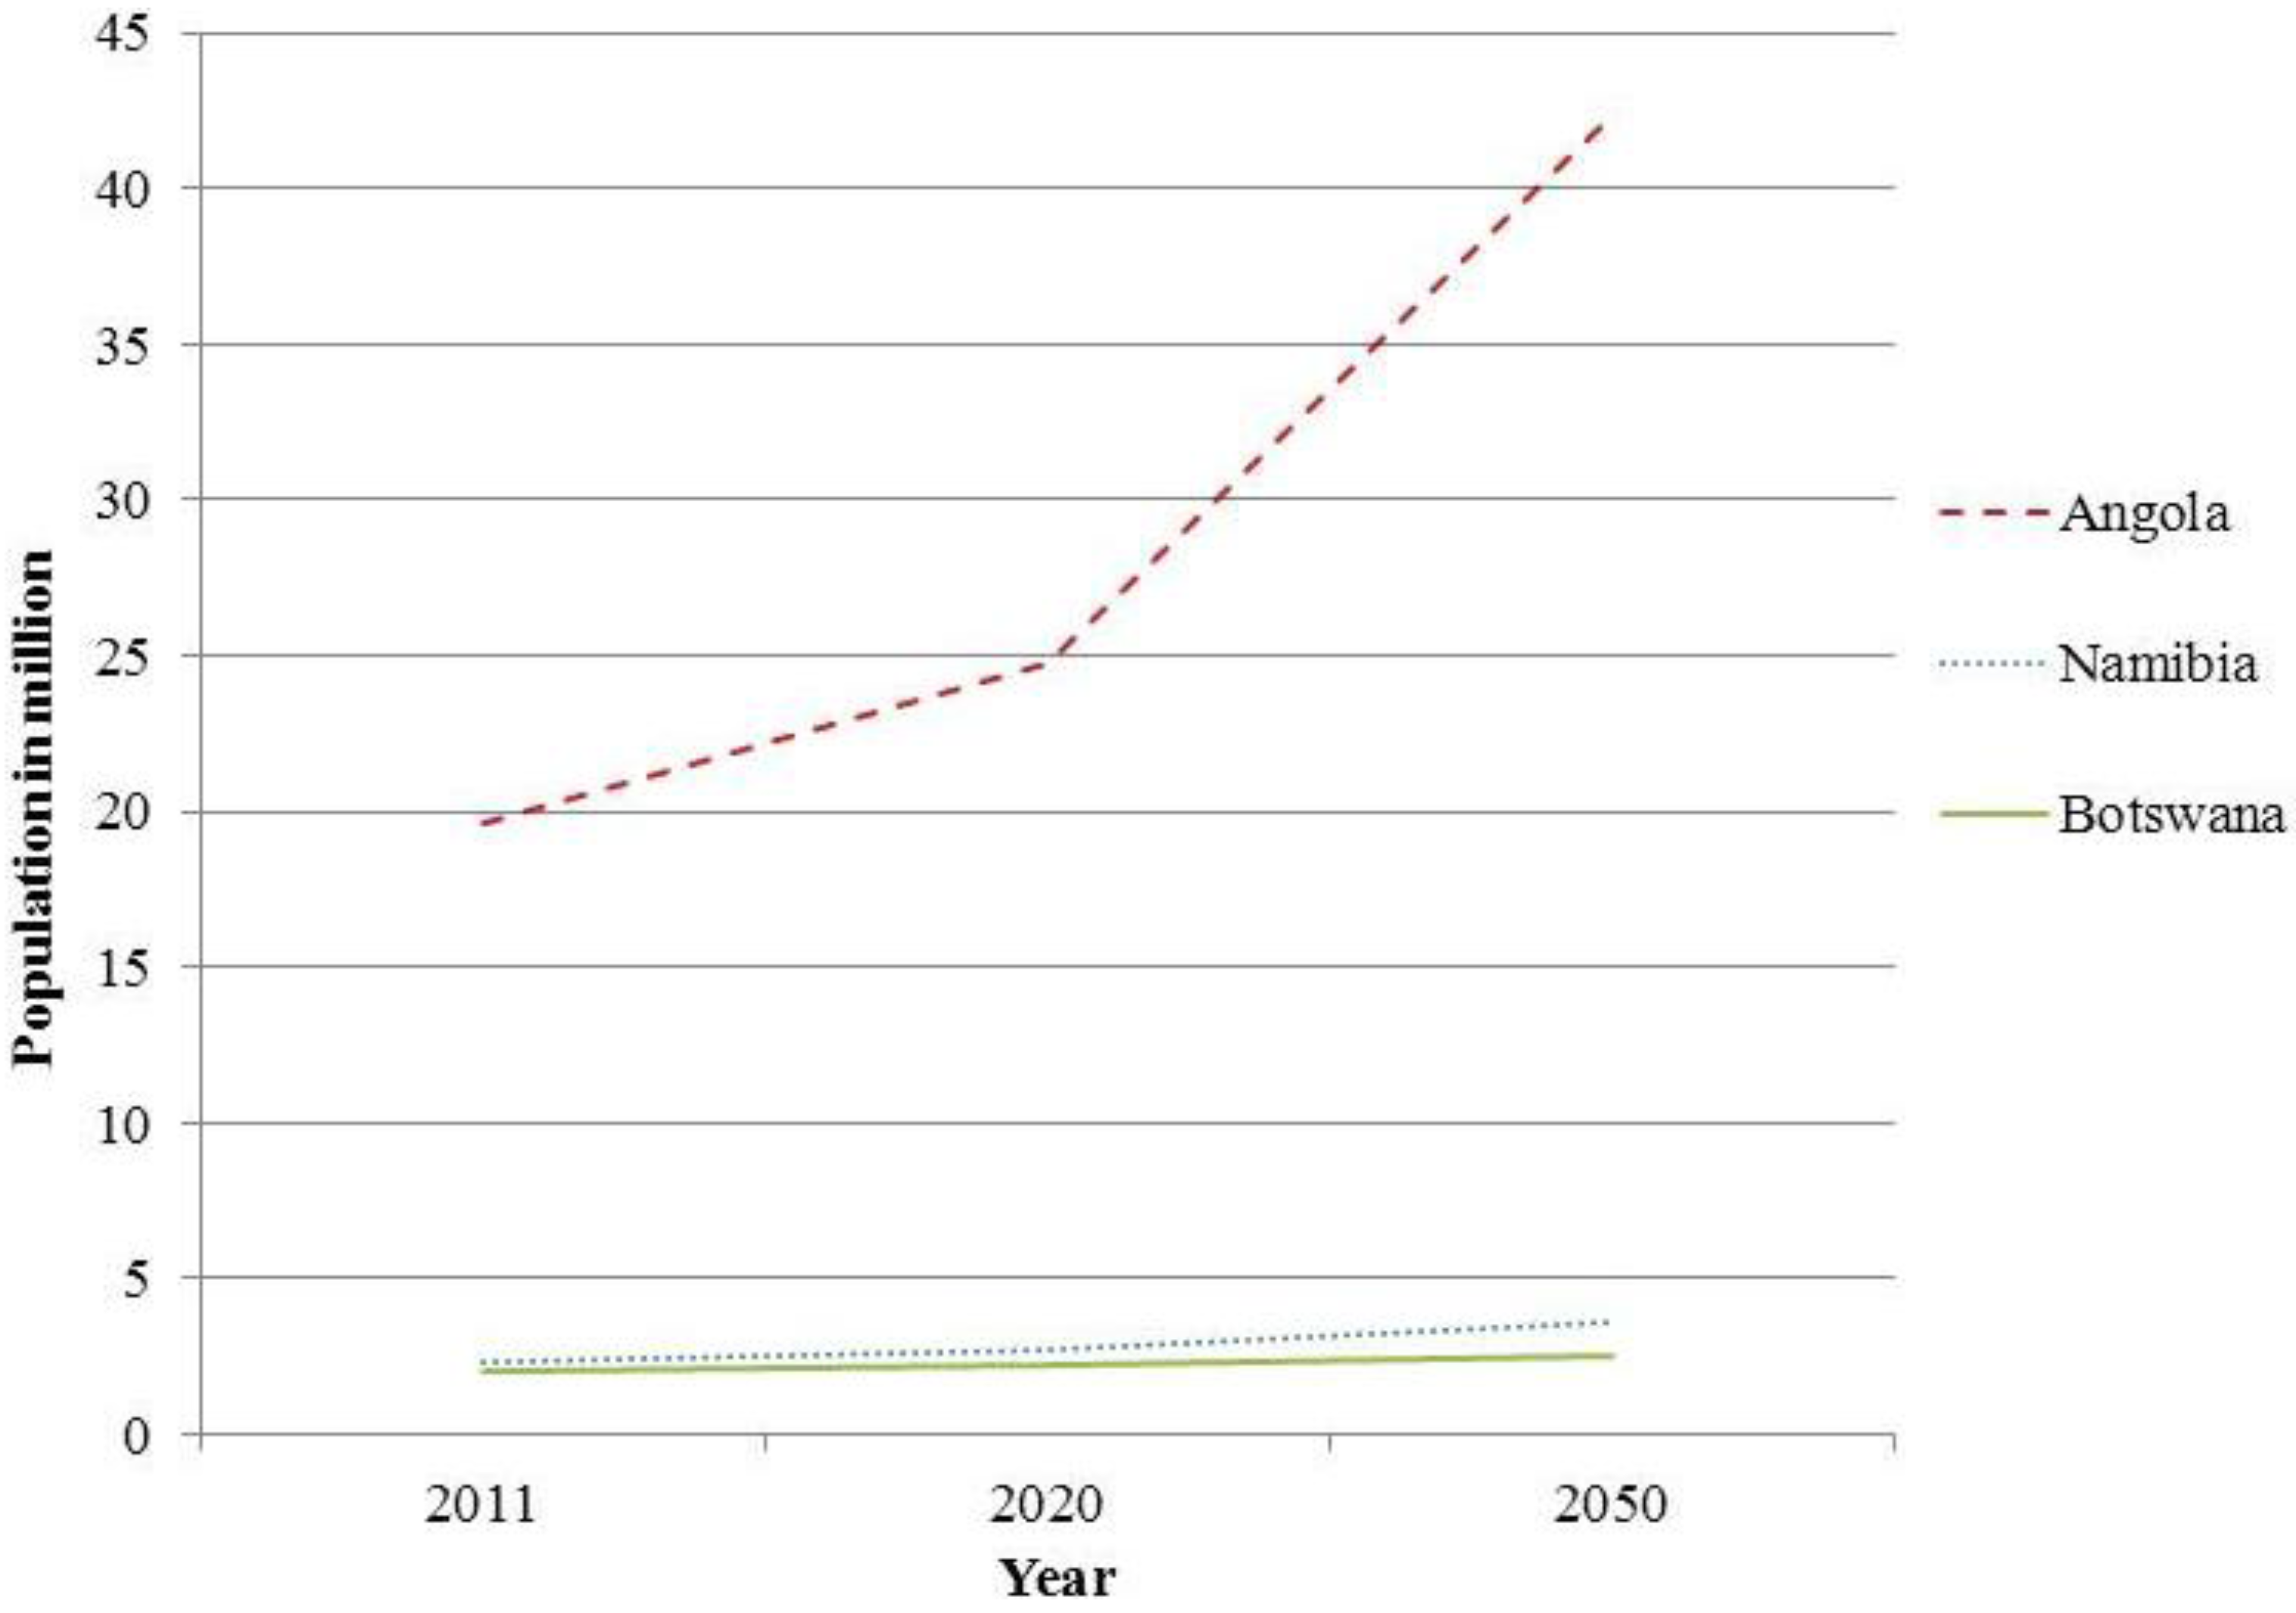
| Population in 2011 | FAO 2012 [24,25,26] | 2011 | nat. |
| Population projection for 2020 and 2050 | UN 2011 [27] | 2020, 2050 | nat. |
| Agriculture percentage of GDP (2011) | World Bank 2013 [17] | 2011 | nat. |
| Agriculture percentage of labor | CIA 2013 [18,20], UN 2012 [28] | 2003, 2005, 2008 | nat. |
| Tourist arrivals at national borders (2010) | World Bank 2013 [17] | 2010 | nat. |
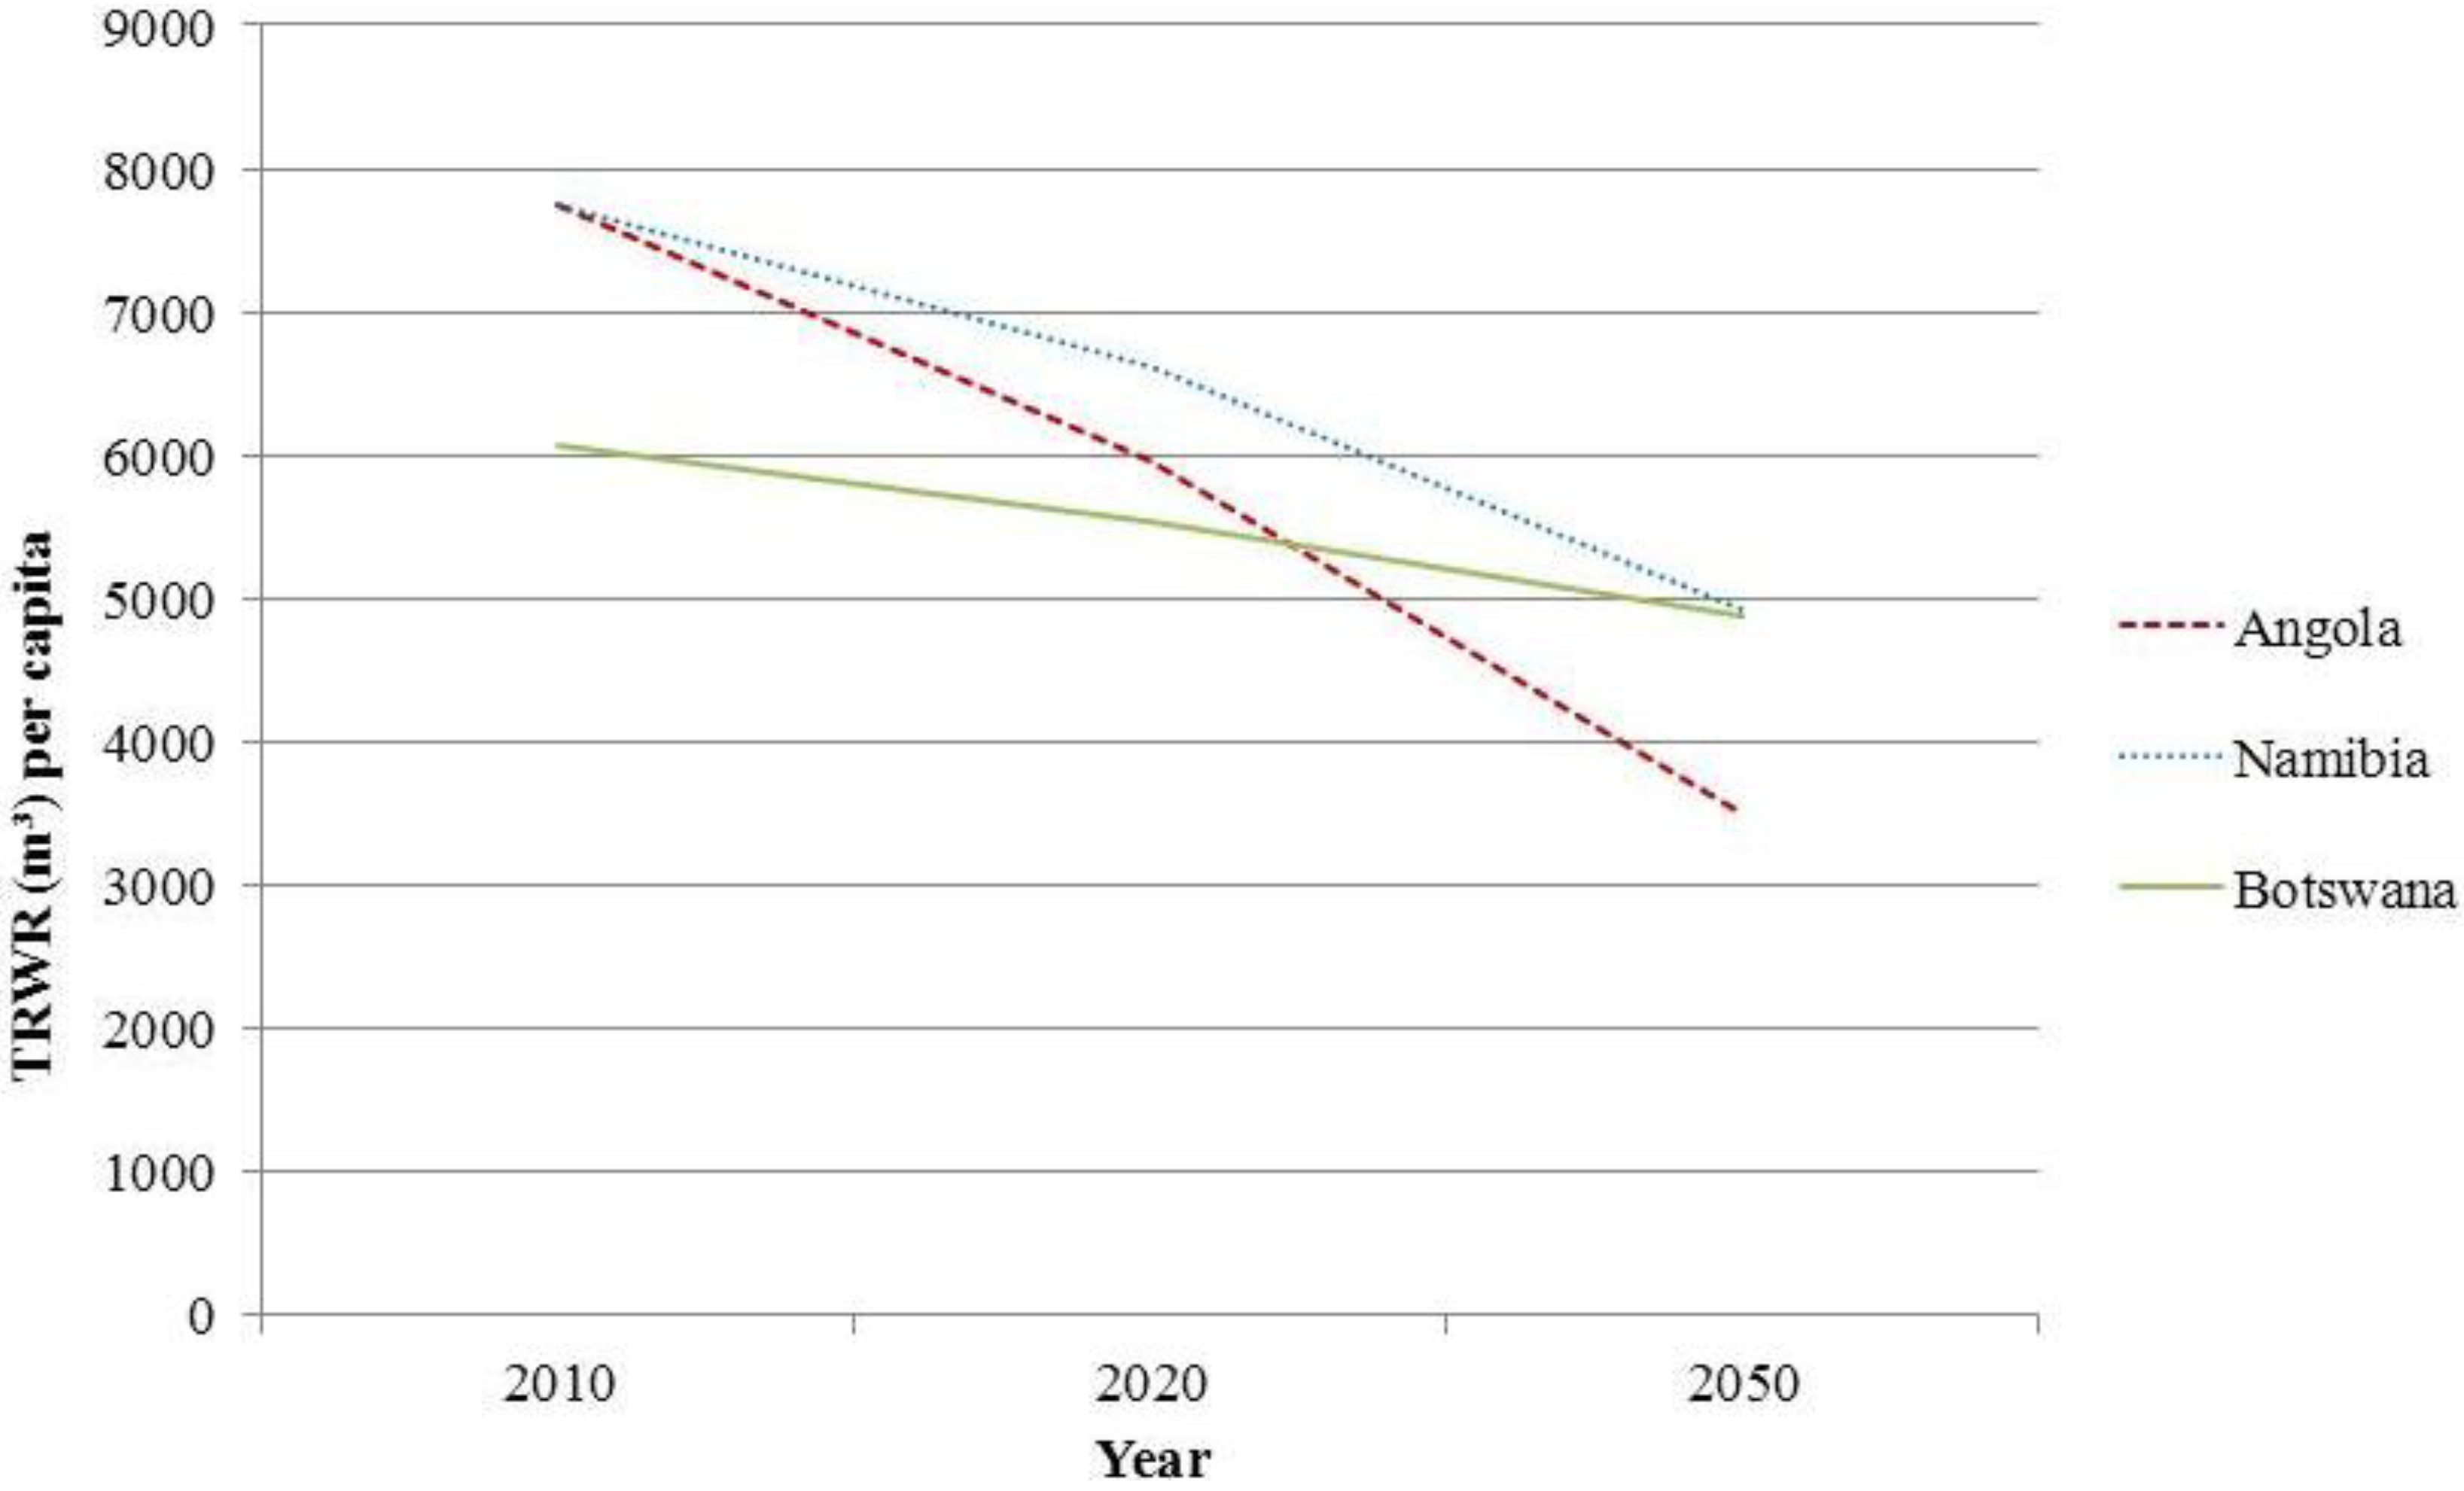
| Total renewable water resources (km3/yr) | FAO 2012 [24,25,26] | long term average | nat. |
| Total freshwater withdrawal | FAO 2012 [24,25,26] | 2000 | nat. |
| Water poverty index (2002) | Ahlenius 2005 [29] | 2002 | nat. |
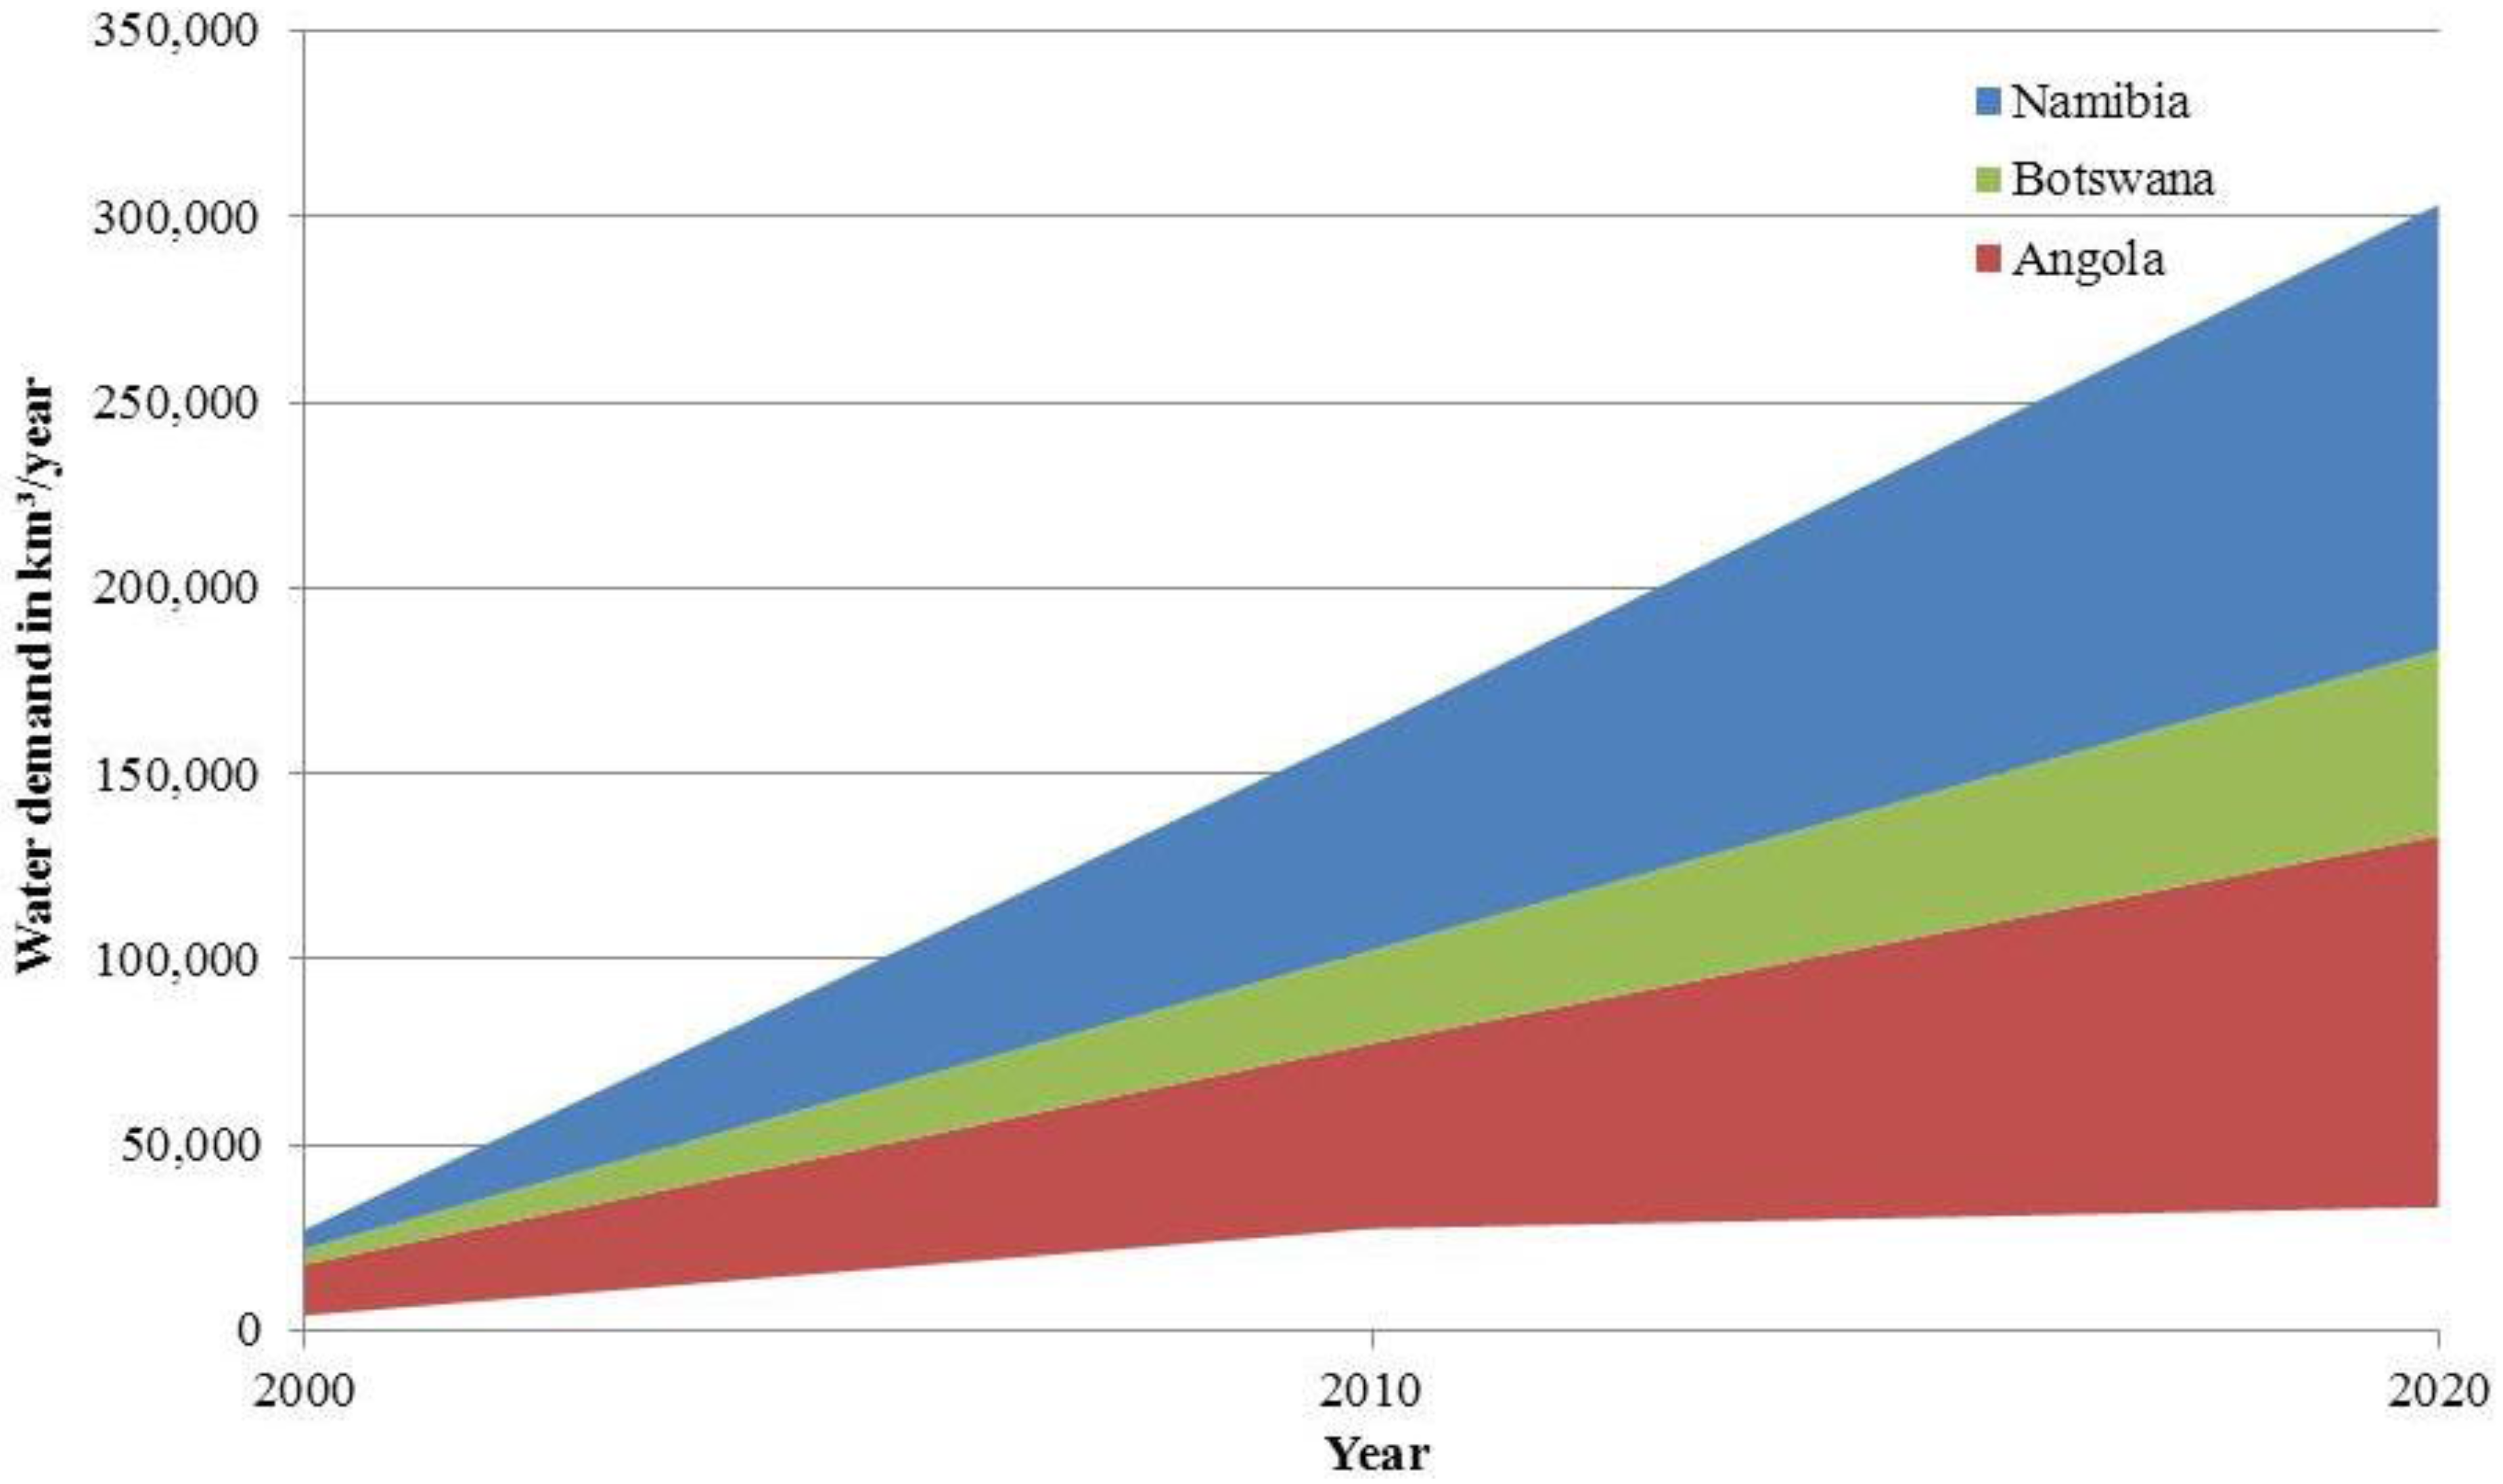
| Projected growth in consumptive water demand | Ashton 2003 [30] | 2000, 2010 (proj.), 2020 (proj.) | nat. |
3. Socioeconomic Background
3.1. Economy and Development
| GDP in Billions (ppp 2012 est.) | GDP per Capita (ppp 2012 est.) | Gini Index | HDI (2011) | Pop. Living < 1.25 USD/day | |
|---|---|---|---|---|---|
| Angola | 126.2 USD | 6,200 USD | 58.6 (2000) | 0.486 | 54.3% (2000) |
| Botswana | 31.5 USD | 16,800 USD | 57.3 (2002/03) | 0.633 | 23.1% (2005) |
| Namibia | 16.8 USD | 7,800 USD | 59.6 (2009/10) | 0.625 | 31.9% (2004) |
3.2. Population Growth
4. Dependence of the Riparian States on the Okavango Catchment
4.1. Economic Dependence
| Agriculture Percentage of GDP (2011) | Agriculture Percentage of Labor | Tourist Arrivals at National Borders (2010) | |
|---|---|---|---|
| Angola | 10.1 | 85.0 (2003) | 425,000 |
| Botswana | 2.5 | 29.9 (2005) | 2,145,000 |
| Namibia | 7.3 | 16.3 (2008) | 984,000 |
4.2. Livelihood Dependence
5. Current and Future Water Situation in the Riparian States
| Total Renewable Water Resources (km3/yr) | Total Freshwater withdrawal (2000) (km3) | Water Poverty Index (2002)* | |
|---|---|---|---|
| Angola | 148 | 0.64 | 41 |
| Botswana | 12.2 | 0.19 | 57 |
| Namibia | 17.7 | 0.3 | 60 |
5.1. Angola
5.2. Botswana
5.3. Namibia
5.4. Projected Water Situation
6. Implications for IWRM: Chances and Challenges
6.1. General Challenges, Principles and Key Strategies
- Securing water for people and food production;
- Protecting vital ecosystems;
- Dealing with variability of water in space and time;
- Managing water-associated risks;
- Creating popular awareness and understanding;
- Forging the political will to act;
- Ensuring collaboration across sectors and boundaries.
Integration
Decentralization
Participation
Economic and Financial Stability
6.2. Chances and Challenges for the Okavango Catchment
7. Conclusion
Acknowledgments
References
- Scudder, T. Okavango River Basin. In Management of Transboundary Rivers and Lakes; Varis, O., Biswas, A., Tortajada, C., Eds.; Springer: Berlin, Germany, 2008; pp. 81–103. [Google Scholar]
- Mendelsohn, J.; Obeid, S. Okavango River: The Flow of a Lifeline; Struik: Cape Town, South Africa, 2004. [Google Scholar]
- Alemaw, F.; Ashworth, J.M.; Hughes, D. Hydrology of the Okavango Delta; Department of Water: Gaborone, Botswana, 2003. [Google Scholar]
- Milzow, C.; Kgotlhang, L.; Bauer-Gottwein, P.; Meier, P.; Kinzelbach, W. Regional review: the hydrology of the Okavango Delta, Botswana—Processes, data and modelling. Hydrogeol. J. 2009, 17, 1297–1328. [Google Scholar] [CrossRef]
- Andersson, L.; Wilk, J.; Todd, M.C.; Hughes, D.A.; Earle, A.; Kniveton, D.; Layberry, R.; Savenije, H.H.G. Impact of climate change and development scenarios on flow patterns in the Okavango River. J. Hydrol. 2006, 331, 43–57. [Google Scholar] [CrossRef]
- Hammond, J.L. The resource curse and oil revenues in Angola and Venezuela. Sci. Soc. 2011, 75, 348–378. [Google Scholar] [CrossRef]
- Mbaiwa, J.E. Causes and possible solutions to water resource conflicts in the Okavango River Basin: The case of Angola, Namibia and Botswana. Phys. Chem. Earth A/B/C 2004, 29, 1319–1326. [Google Scholar] [CrossRef]
- Global Water Partnership (GWP). Integrated Water Resources Management; GWP: Stockholm, Sweden, 2000. Available online: http://www.gwp.org/Global/GWP-CACENA_Files/en/pdf/tec04.pdf (accessed on 6 December 2012).
- Pinheiro, I.; Gabaake, G.; Heyns, P. Cooperation in the Okavango River Basin: The OKACOM Perspective. In Transboundary Rivers, Sovereignty and Development: Hydropolitical Drivers in the Okavango River Basin; Turton, A., Ashton, P., Cloete, E., Eds.; African Water Issues Research Unit: Pretoria, South Africa, 2003; pp. 105–118. [Google Scholar]
- The Future Okavango (TFO). 2013. Available online: http://www.future-okavango.org (accessed on 11 February 2013).
- Scudder, T. Botswana’s Southern Okavango Integrated Water Development Project and Hydro-Québec’s Grande Baleine Project. 2003. Available online: http://www.hss.caltech.edu/~tzs/Okavango (accessed on 11 December 2012).
- Permanent Okavango River Basin Water Commission (OKACOM). 2012. Available online: http://www.okacom.org/ (accessed on 6 December 2012).
- Byers, B. Environmental Threats and Opportunities in Namibia: A Comprehensive Assessment; Ministry of Environment and Tourism: Windhoek, Namibia, 1997. [Google Scholar]
- Environmental Information Service Namibia Densities of Cattle. 2002. Available online: http://www.the-eis.com/searchresults.php?action=moreinfo&id=209 (accessed on 25 January 2013).
- Environmental Information Service Namibia Crop Production Okavango. 2004. Available online: http://www.the-eis.com/searchresults.php?action=moreinfo&id=3224 (accessed on 25 January 2013).
- Natural Earth Physical Vectors. 2013. Available online: http://www.naturalearthdata.com/downloads/10m-physical-vectors/ (accessed on 12 February 2013).
- World Bank World Development Indicators. 2013. Available online: http://data.worldbank.org/data-catalog/world-development-indicators (accessed on 12 February 2013).
- Central Intelligence Agency (CIA). The World Factbook—Angola. 2013. Available online: https://www.cia.gov/library/publications/the-world-factbook/geos/ao.html (accessed on 12 February 2013).
- Central Intelligence Agency (CIA). The World Factbook—Botswana. 2013. Available online: https://www.cia.gov/library/publications/the-world-factbook/geos/bc.html (accessed on 12 February 2013).
- Central Intelligence Agency (CIA). The World Factbook—Namibia. 2013. Available online: https://www.cia.gov/library/publications/the-world-factbook/geos/wa.html (accessed on 12 February 2013).
- Rebublic of Botswana Household Income and Expenditure Survey 2002/03. 2004. Available online: http://www.cso.gov.bw/templates/cso/file/File/2002-03hies_report.pdf (accessed on 6 December 2012).
- Namibian Sun Nam Gini-Coefficient now 0.59. 2012. Available online: http://www.namibiansun.com/content/business/nam-gini-coefficient-now-059 (accessed on 12 February 2013).
- United Nations Development Programme (UNDP). Regional and National Trends in the Human Development Index 1980–2011. 2011. Available online: http://hdr.undp.org/en/data/trends/ (accessed on 11 December 2012).
- Food and Agriculture Organization of the United Nations (FAO). Country Fact Sheet—Botswana. 2012. Available online: http://www.fao.org/nr/water/aquastat/data/factsheets/aquastat_fact_sheet_bwa_en.pdf (accessed on 11 December 2012).
- Food and Agriculture Organization of the United Nations (FAO). Country Fact Sheet—Namibia. 2012. Available online: http://www.fao.org/nr/water/aquastat/data/factsheets/aquastat_fact_sheet_nam_en.pdf (accessed on 11 December 2012).
- Food and Agriculture Organization of the United Nations (FAO). Country Fact Sheet—Angola. 2012. Available online: http://www.fao.org/nr/water/aquastat/data/factsheets/aquastat_fact_sheet_ago_en.pdf (accessed on 11 December 2012).
- World Population Prospects—The 2010 Revision: Highlights and Advance Tables. United Nations: New York, NY, USA, 2011.
- United Nations (UN). Data—Botswana. 2012. Available online: http://data.un.org/CountryProfile.aspx?crName=Botswana (accessed on 11 December 2012).
- Ahlenius, H. Water Poverty Index, by Country in 2002. 2005. Available online: http://www.grida.no/graphicslib/detail/water-poverty-index-by-country-in-2002_d6db (accessed on 11 December 2012).
- Ashton, P.J. The Search for an Equitable Basis for Water Sharing in the Okavango River Basin. In International Waters in Southern Africa; Nakamura, M., Ed.; United Nations University Press: Tokyo, Japan, 2003; pp. 164–188. [Google Scholar]
- Porto, J.; Clover, J. The Peace Dividend in Angola—Strategic Implications for Okavango Basin Cooperation. In Transboundary Rivers, Sovereignity and Development - Hydropolitical Drivers in the Okavango Basin; Turton, A., Ashton, P., Cloete, E., Eds.; Green Cross International: Pretoria, South Africa, 2003; pp. 65–81. [Google Scholar]
- USAID. Sharing Water: Towards a Transboundary Concensus on the Management of the Okavango Basin. 2005. Available online: http://pdf.usaid.gov/pdf_docs/pdacd456.pdf (accessed on 11 December 2012).
- UN, Angola: The Post-War Challenges; Common Country Assessment 2002. United Nations County Office: Luanda, Angola, 2002.
- Ashton, P.J.; Neal, M. Public Involvement in Water Resource Management Within the Okavango River Basin. In Public Participation in the Governance of International Freshwater Resources; Bruch, C., Ed.; United Nations University Press: Tokyo, Japan, 2005; pp. 169–195. [Google Scholar]
- Hillbom, E. Diamonds or development? A structural assessment of Botswana’s forty years of success. J. Mod. Afr. Stud. 2008, 46, 191–214. [Google Scholar] [CrossRef]
- Wasserman, H. Freedom’s just another word? Perspectives on media freedom and responsibility in South Africa and Namibia. Int. Comm. Gaz. 2010, 72, 567–588. [Google Scholar] [CrossRef]
- Pohamba, H. Statement by His Excellency Dr Hifikepunye Pohamba. 2011. Available online: http://209.88.21.36/opencms/export/sites/default/grnnet/OPDev1/Archive/Statements/2011/10th_Anniversary_of_Namibia_Tourism_Board.pdf (accessed on 7 December 2012).
- Department of Tourism Botswana Tourism Statistics 2006–2009. 2009. Available online: http://www.mewt.gov.bw/uploads/files/TOURISM%20STATISTICS%202006-2009_1.pdf (accessed on 7 December 2012).
- Ndlovu, J.; Nyakunu, E.; Heath, E.T. Strategies for developing domestic tourism: A survey of key stakeholders in Namibia. J. Manag. Case Stud. 2010, 12, 82–91. [Google Scholar]
- Namibian Sun Tourism’s Growth to Swell the GDP. 2011. Available online: http://sun.com.na/node/7929 (accessed on 7 December 2012).
- Mbaiwa, J.E. The Socio-economic Sustainability of Tourism Development in the Okavango Delta, Botswana. In Proceedings of Conference on Environmental Monitoring of Tropical and Subtropical Wetlands, Maun, Botswana, 4–6 December 2002.
- Mbaiwa, J.E. Tourism Development in the Okavango Delta. 2009. Available online: http://www.orc.ub.bw/downloads/FS8_tourism_v1.pdf (accessed on 11 December 2012).
- Kluge, T.; Liehr, S.; Lux, A.; Niemann, S.; Brunner, K. IWRM in Northern Namibia-Cuvelai Delta. 2006. Available online: http://www.cuvewaters.net/ftp/iwrm_final_report.pdf (accessed on 6 December 2012).
- Mbaiwa, J.E. The Socioeconomic and Environmental Impacts of Tourism Development in the Okavango Delta, North-western Botswana. J. Arid Environ. 2003, 54, 447–467. [Google Scholar] [CrossRef]
- Wolski, P.; Ramberg, l.; Magole, l.; Mazvimavi, D. Evolution of River Basin Management in the Okavango System, Southern Africa. In Handbook of Catchment Management; Ferrier, R.C., Jenkins, A., Eds.; Wiley-Blackwell: Hoboken, NJ, USA, 2009; pp. 457–476. [Google Scholar]
- Central Statistics Office of Botswana. Population and Housing Census. 2011. Available online: http://ecastats.uneca.org/aicmd/Portals/0/Census%202011%20Preliminary%20%20Brief%20Sept%2029%202011.pdf (accessed on 6 December 2012).
- University of Botswana Molapo Farming in the Okavango Delta. 2009. Available online: http://www.orc.ub.bw/downloads/FS7_molapo_v1.pdf (accessed on 26 January 2013).
- Kgathi, D.L.; Mmopelwa, G.; Mosepele, K. Assessing Natural Resource Scarcity in the Okavango Delta: Case Studies of Key Resources. 2003. Available online: http://www.globalwetlands.org/ConferenceBotswana/docs/5 (accessed on 11 December 2012).
- Mbaiwa, J.E.; Mbaiwa, O. The effects of veterinary fences on wildlife populations in Okavango Delta, Botswana. Int. J. Wilder. 2006, 12, 17–41. [Google Scholar]
- Folwell, S.; Farqhuarson, F. The Impacts of Climate Change on Water Resources in the Okavango Basin. In Climate Variability and Change—Hydrological Impacts; Demuth, S., Gustard, A., Planos, E., Scatena, F., Servat, E., Eds.; International Association of Hydrological Sciences (IAHS): Oxford, UK, 2006; pp. 382–388. [Google Scholar]
- McSweeney, C.; New, M.; Lizcano, G. UNDP Climate Change Country Profiles—Angola. 2012. Available online: http://www.geog.ox.ac.uk/research/climate/projects/undp-cp/UNDP_reports/Angola/Angola.lowres.report.pdf (accessed on 8 December 2012).
- Gaughan, A.E.; Waylen, P.R. Spatial and temporal precipitation variability in the Okavango–Kwando–Zambezi catchment, Southern Africa. J. Arid Environ. 2012, 82, 19–30. [Google Scholar] [CrossRef]
- Wright, D.; Sandsbraten, K.; Osvoll, O. Assessing Renewable Water Resources and Water Use in Angola. In Integrated Watershed Management; Beheim, E., Rajwar, G., Haigh, M., Krecek, J., Eds.; Springer: New York, NY, USA, 2010; pp. 144–159. [Google Scholar]
- Turton, A. Sea of Sand, Land of Water: a Synopsis of Some Strategic Developmental Issues Confronting the Okavango Delta. 1999. Available online: http://www.anthonyturton.com/admin/my_documents/my_files/Public_Participation_in_theDevelopment_of_a_Management_Plan_for_an_International_River_Basin.pdf (accessed on 11 December 2012).
- Ellery, W.N.; McCarthy, T.S. Principles for the sustainable utilization of the Okavango Delta ecosystem, Botswana. Biol. Conserv. 1994, 70, 159–168. [Google Scholar] [CrossRef]
- Van Wyk, J.A. River Dry, Mountain High: Water Security in Southern Africa. Conflict Trends 1998, 1, 11–14. [Google Scholar]
- Bendsen, H. Arable Agriculture and its Significance in Terms of Spatial Coverage, Job and Income Generation Potential; Harry Oppenheimer Okavango Research Centre: Maun, Botswana, 2002. [Google Scholar]
- Du Plessis, A.J.E.; Rowntree, K.M. Water resources in Botswana with particular reference to the savanna regions. S. Afr. Geogr. J. 2003, 85, 42–49. [Google Scholar] [CrossRef]
- FAO-UN. Aquastat-Botswana. 2005. Available online: http://www.fao.org/nr/water/aquastat/countries_regions/botswana/index.stm (accessed on 6 December 2012).
- Swatuk, L.; Rahm, D. Integrating policy, disintegrating practice: Water resources management in Botswana. Phys. Chem. Earth 2004, 29, 1357–1364. [Google Scholar] [CrossRef]
- Pallet, J. Sharing Water in Southern Africa; Desert Research Foundation Namibia: Windhoek, Namibia, 1997. [Google Scholar]
- Masire, K. Equitable and Sustainable Use of the Water Resources of the Okavango River Basin. In Transboundary Rivers, Sovereignity and Development: Hydropolitical Drivers in the Okavango Basin; Turton, A., Ashton, P., Cloete, E., Eds.; African Water Issues Research Unit: Pretoria, South Africa, 2003. [Google Scholar]
- Rebublic of Botswana SOER Factsheet 5: Water Resources. 2002. Available online: http://www.mewt.gov.bw/uploads/files/water_resourcess.pdf (accessed on 6 December 2012).
- Atlhopheng, J.R. Water Resources in Botswana. In Environmental Issues in Botswana; Atlhopheng, J.R., Totolo, O., Eds.; Lightbooks: Gaborone, Botswana, 1998; pp. 11–36. [Google Scholar]
- World Bank Namibia: Country Brief. 2012. Available online: http://go.worldbank.org/1B6KN88H10 (accessed on 11 December 2012).
- Wolski, P. Is the Okavango Delta Drying. 2005. Available online: http://www.orc.ub.bw/downloads/FS2_drying_v3.pdf (accessed on 11 December 2012).
- Ashton, P.J. Southern African Water Conflicts: Are They Inevitable or Preventable? In Water Wars: Enduring Myth or Impending Reality; Solomon, H., Turton, A., Eds.; African Centre for the Constructive Resolution of Disputes: Durban, South Africa, 2000; pp. 62–105. [Google Scholar]
- FAO-UN. Aquastat—Namibia. 2005. Available online: http://www.fao.org/nr/water/aquastat/countries_regions/NAM/index.stm (accessed on 6 December 2012).
- Grambow, M. Wassermanagement-Integriertes Wasser-Ressourcenmanagement von der Theorie zur Umsetzung; Vieweg: Wiesbaden, Germany, 2008. [Google Scholar]
- Cook, B.R.; Spray, C.J. Ecosystem services and integrated water resource management: Different paths to the same end? J. Environ. Manage. 2012, 109, 93–100. [Google Scholar] [CrossRef]
- Dzwairo, B.; Otieno, F.A.O.; Ochieng, G.M. Making a case for systems thinking approach to Integrated Water Resources Management (IWRM). Int. J. Water Resour. Environ. Eng. 2010, 1, 107–113. [Google Scholar]
- Xie, M. Integrated Water Resources Management (IWRM): Introduction to Principles and Practices. 2006. Available online: http://www.pacificwater.org/userfiles/file/IWRM/Toolboxes/introduction%20to%20iwrm/IWRM%20Introduction.pdf (accessed on 6 December 2012).
- Rahm, D.; Swatuk, L.; Matheny, E. Water resource management in Botswana: Balancing sustainability and economic development. Environ. Dev. Sustain. 2006, 8, 157–183. [Google Scholar] [CrossRef]
- Heyns, P. Water institutional reforms in Namibia. Water Pol. 2005, 7, 89–106. [Google Scholar]
- Unruh, J.D. The interaction between landmine clearance and land rights in Angola: A volatile outcome of non-integrated peacebuilding. Habit. Int. 2012, 36, 117–125. [Google Scholar] [CrossRef]
- Mbaiwa, J.E. Wildlife resource utilisation at Moremi Game Reserve and Khwai community area in the Okavango Delta, Botswana. J. Environ. Manage. 2005, 77, 144–156. [Google Scholar] [CrossRef]
- Kaynak, E.; Marandu, E.E. Tourism market potential analysis in Botswana: A Delphi Study. J. Trav. Res. 2006, 45, 227–237. [Google Scholar] [CrossRef]
- Davidsen, P.A. Hydrosolidarity as Water Security in the Okavango River Basin. In The Politics of Water: A Survey; Wegerich, K., Warner, J., Eds.; Third Millennium Publishing: London, Routledge, 2009; pp. 68–95. [Google Scholar]
- Turton, A.; Ashton, P.; Cloete, E. Transboundary Rivers, Sovereignity and Development: Hydropolitical Drivers in the Okavango Basin; Green Cross International: Pretoria, South Africa, 2003. [Google Scholar]
© 2013 by the authors; licensee MDPI, Basel, Switzerland. This article is an open access article distributed under the terms and conditions of the Creative Commons Attribution license (http://creativecommons.org/licenses/by/3.0/).
Share and Cite
Weinzierl, T.; Schilling, J. On Demand, Development and Dependence: A Review of Current and Future Implications of Socioeconomic Changes for Integrated Water Resource Management in the Okavango Catchment of Southern Africa. Land 2013, 2, 60-80. https://doi.org/10.3390/land2010060
Weinzierl T, Schilling J. On Demand, Development and Dependence: A Review of Current and Future Implications of Socioeconomic Changes for Integrated Water Resource Management in the Okavango Catchment of Southern Africa. Land. 2013; 2(1):60-80. https://doi.org/10.3390/land2010060
Chicago/Turabian StyleWeinzierl, Thomas, and Janpeter Schilling. 2013. "On Demand, Development and Dependence: A Review of Current and Future Implications of Socioeconomic Changes for Integrated Water Resource Management in the Okavango Catchment of Southern Africa" Land 2, no. 1: 60-80. https://doi.org/10.3390/land2010060