New Cropland on Former Rangeland and Lost Cropland from Urban Development: The “Replacement Land” Debate

Abstract
:1. Introduction


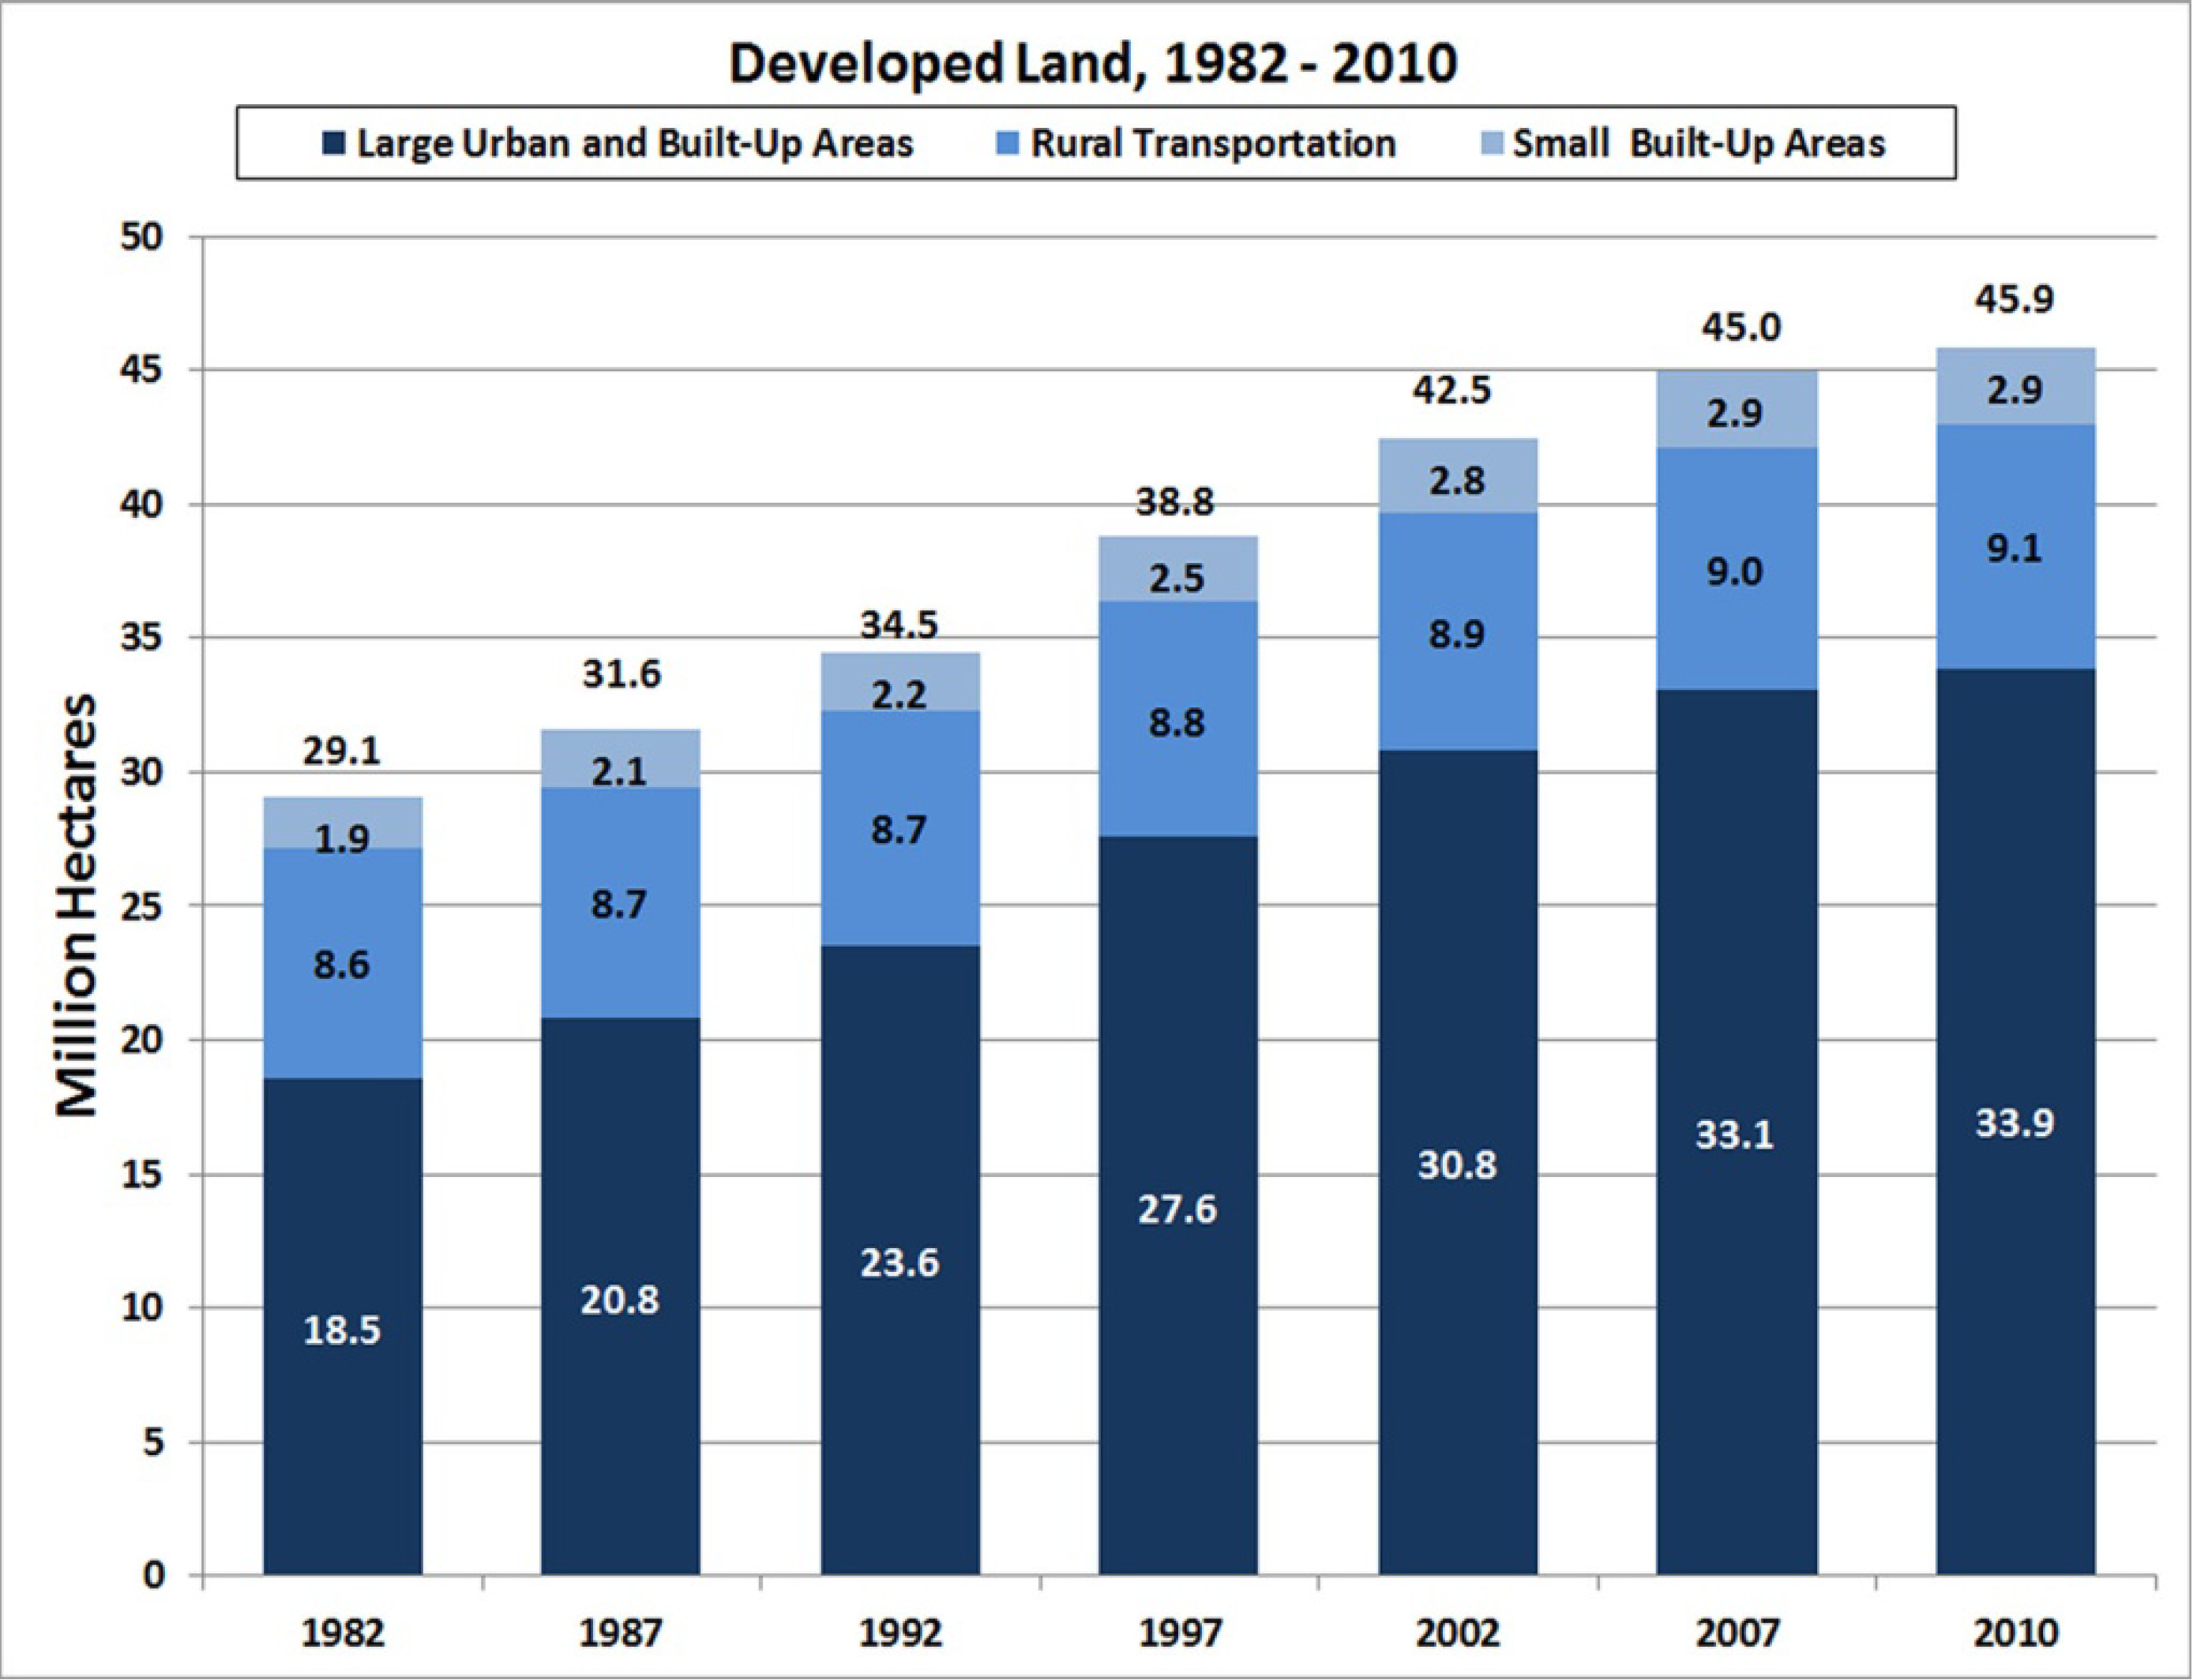
| 5 Year Intervals | Annual Increase (ha) |
|---|---|
| 1982–1987 | 500,000 |
| 1987–1992 | 600,000 |
| 1992–1997 | 900,000 |
| 1997–2002 | 700,000 |
| 2002–2007 | 500,000 |
| 2007–2010 | 300,000 |
2. Methods
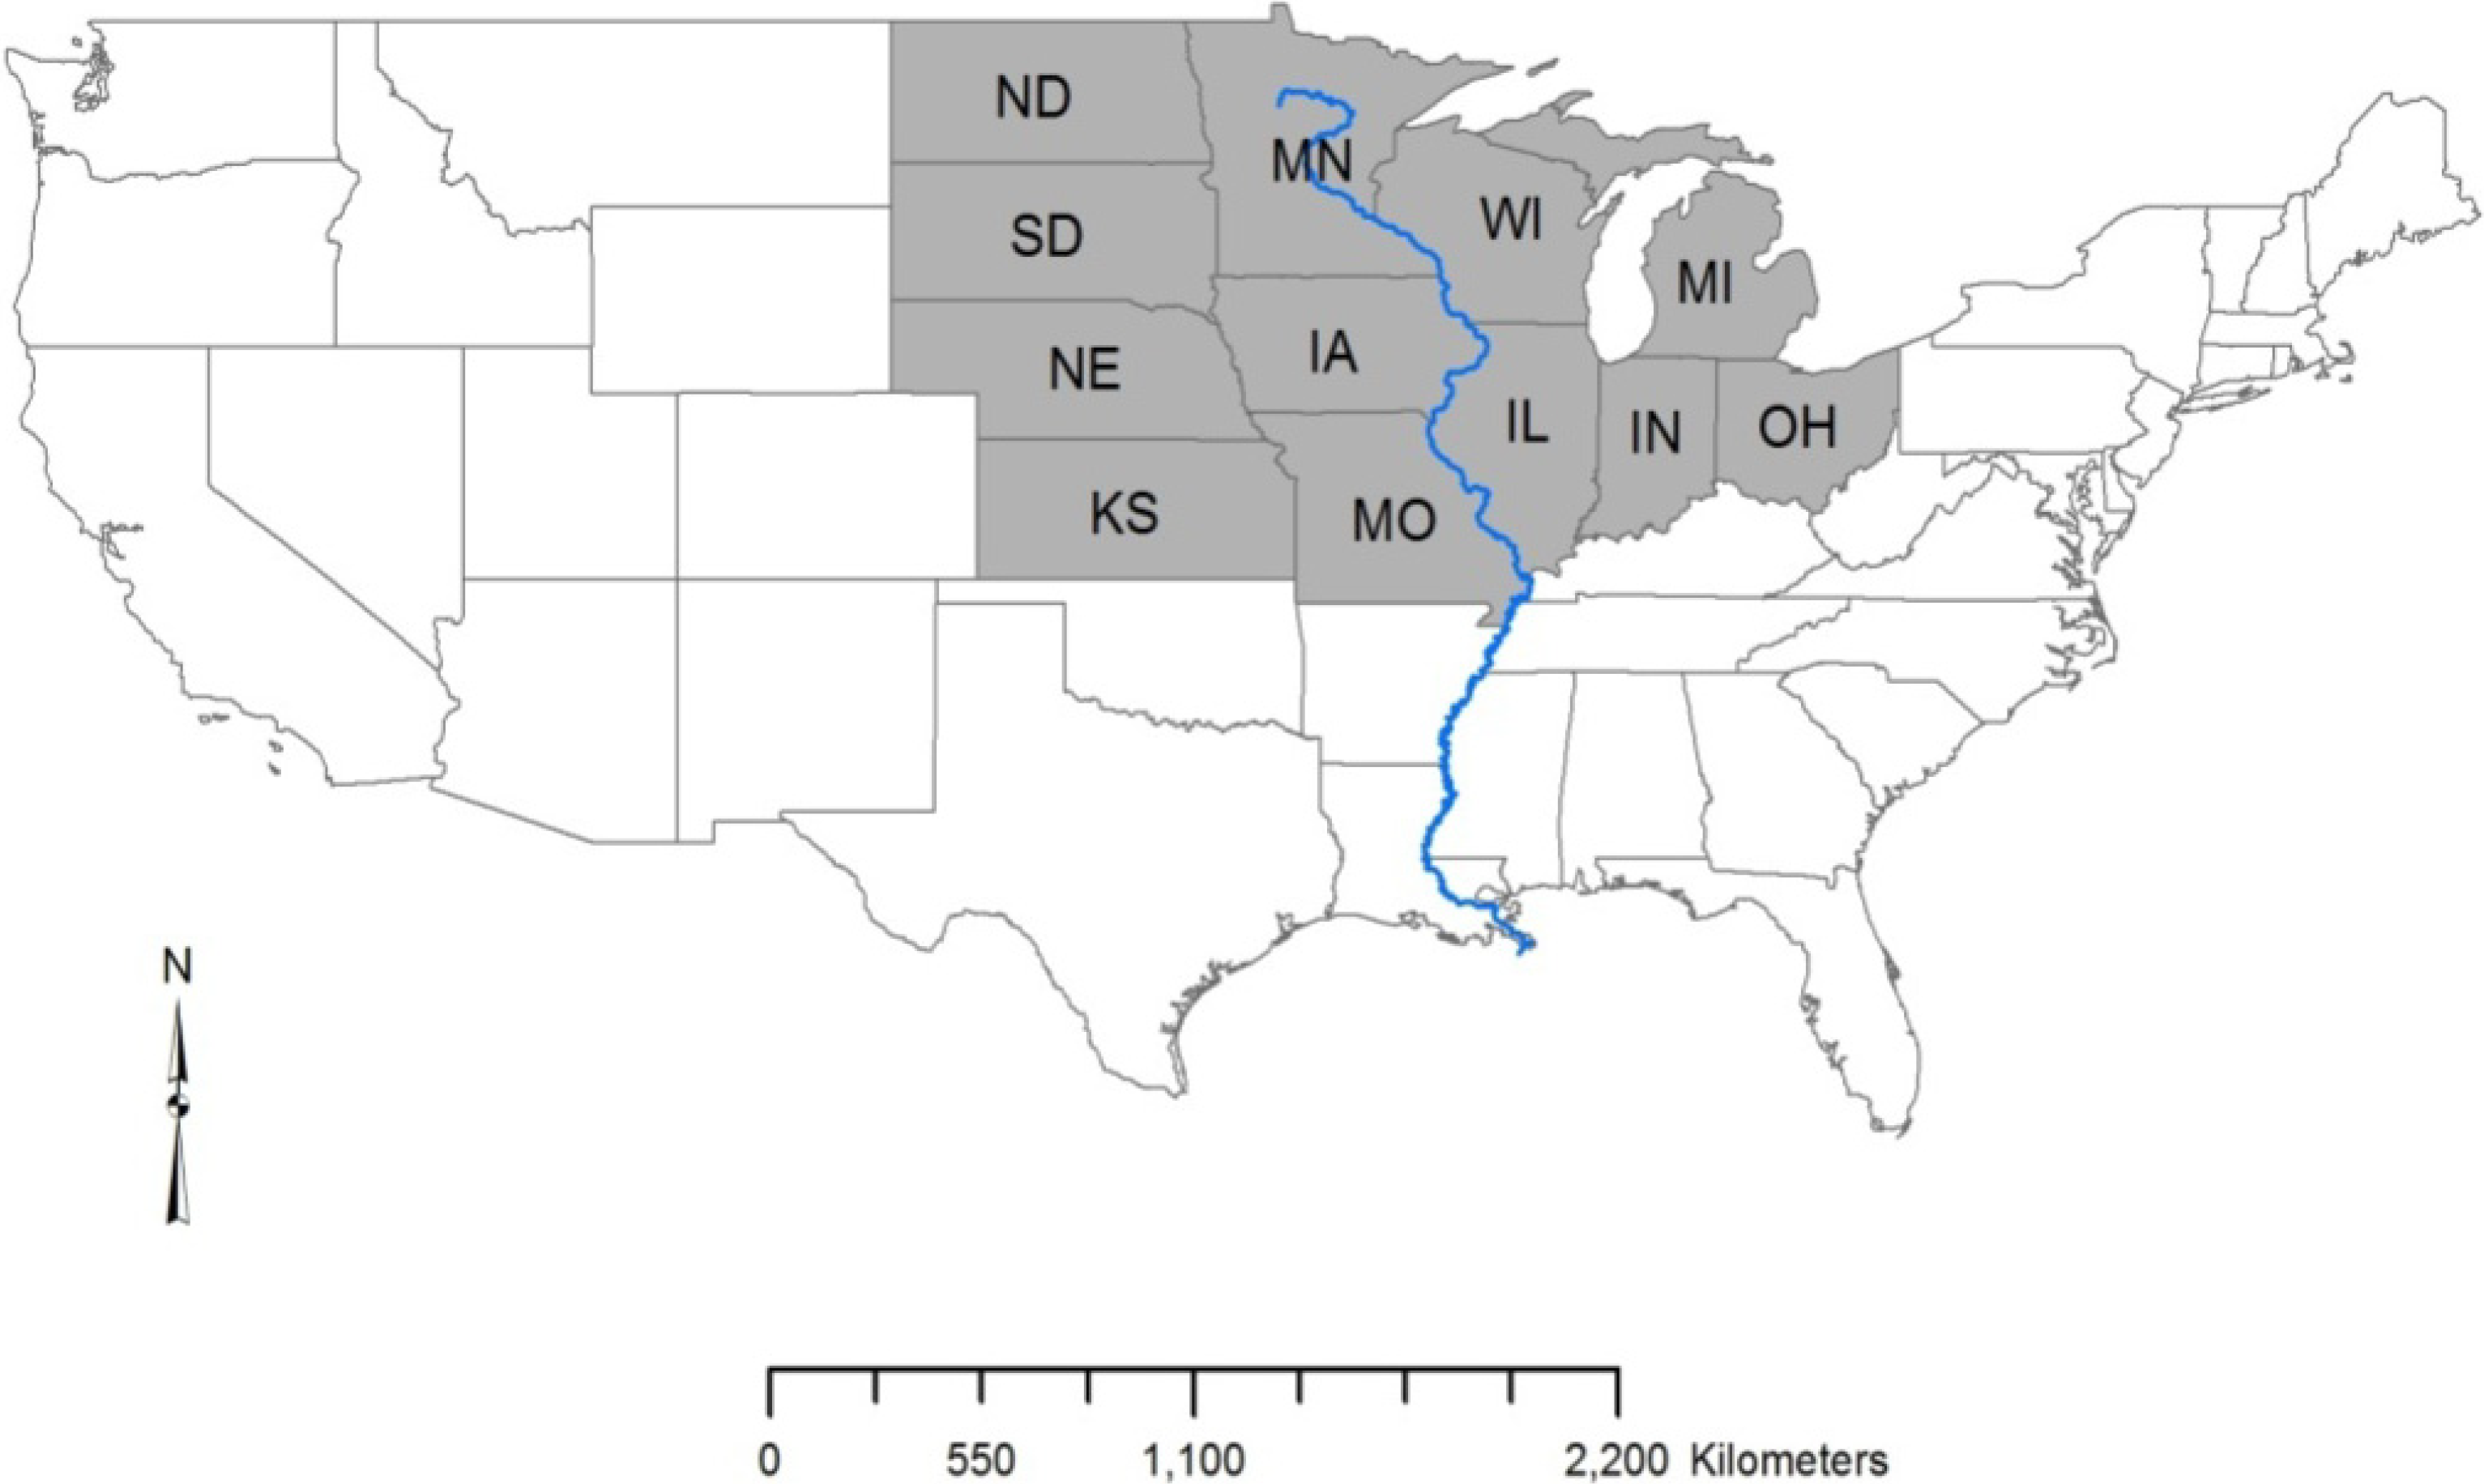
2.1. Study Area

2.2. Spatial Data
“Rangeland is defined by the NRI as a land cover/use category on which the climax or potential plant cover is composed principally of native grasses, grass-like plants, forbs, or shrubs suitable for grazing and browsing, and introduced forage species that are managed like rangeland. This includes areas where introduced hardy and persistent grasses, such as crested wheatgrass, are planted and such practices as deferred grazing, burning, chaining, and rotational grazing are used, with little or no chemicals or fertilizer being applied. Grasslands, savannas, many wetlands, some deserts, and tundra are considered to be rangeland. Certain communities of low forbs and shrubs, such as mesquite, chaparral, mountain shrub, and pinyon-juniper, are also included as rangeland” [24].
“The NRI definition has land cover attributes as illustrated by the physical descriptors such as grasses and shrubs, but it also includes land use descriptors such as management practices. Meanwhile the NLCD herbaceous grassland definition is physical as it is derived by remote sensing techniques: Areas dominated by graminoid or herbaceous vegetation, generally greater than 80% of total vegetation” [44].
2.3. Change Detection
| Major Land Use | NLCD Class |
|---|---|
| Cropland | Cultivated crops |
| Rangeland * | Grassland herbaceous |
| Forest | Deciduous, evergreen, mixed |
| Urban | Developed open, developed low intensity, developed medium intensity, developed high intensity |
| Other | Open water, perennial ice/snow, barren land, shrub/scrub, pasture/hay, woody wetlands, emergent herbaceous wetlands |
| Major Land Use 2001 | 2006 | Total (2001) | ||||
|---|---|---|---|---|---|---|
| Cropland | Rangeland | Forest | Urban | Other | ||
| Cropland | 76.11 | 0.04 | 0.003 | 0.13 | 0.13 | 76.41 |
| Rangeland | 0.11 | 36.53 | 0.005 | 0.02 | 0.08 | 36.76 |
| Forest | 0.02 | 0.08 | 32.45 | 0.04 | 0.11 | 32.70 |
| Urban | 1.03 × 10⁻⁵ | 8.46 × 10⁻⁶ | 1.89 × 10 −6 | 13.24 | 3.73 × 10 −5 | 13.24 |
| Other * | 0.07 | 0.17 | 0.02 | 0.06 | 38.88 | 39.19 |
| Total (2006) | 76.32 | 36.82 | 32.47 | 13.49 | 39.21 | 198.31 |

3. Results and Discussion
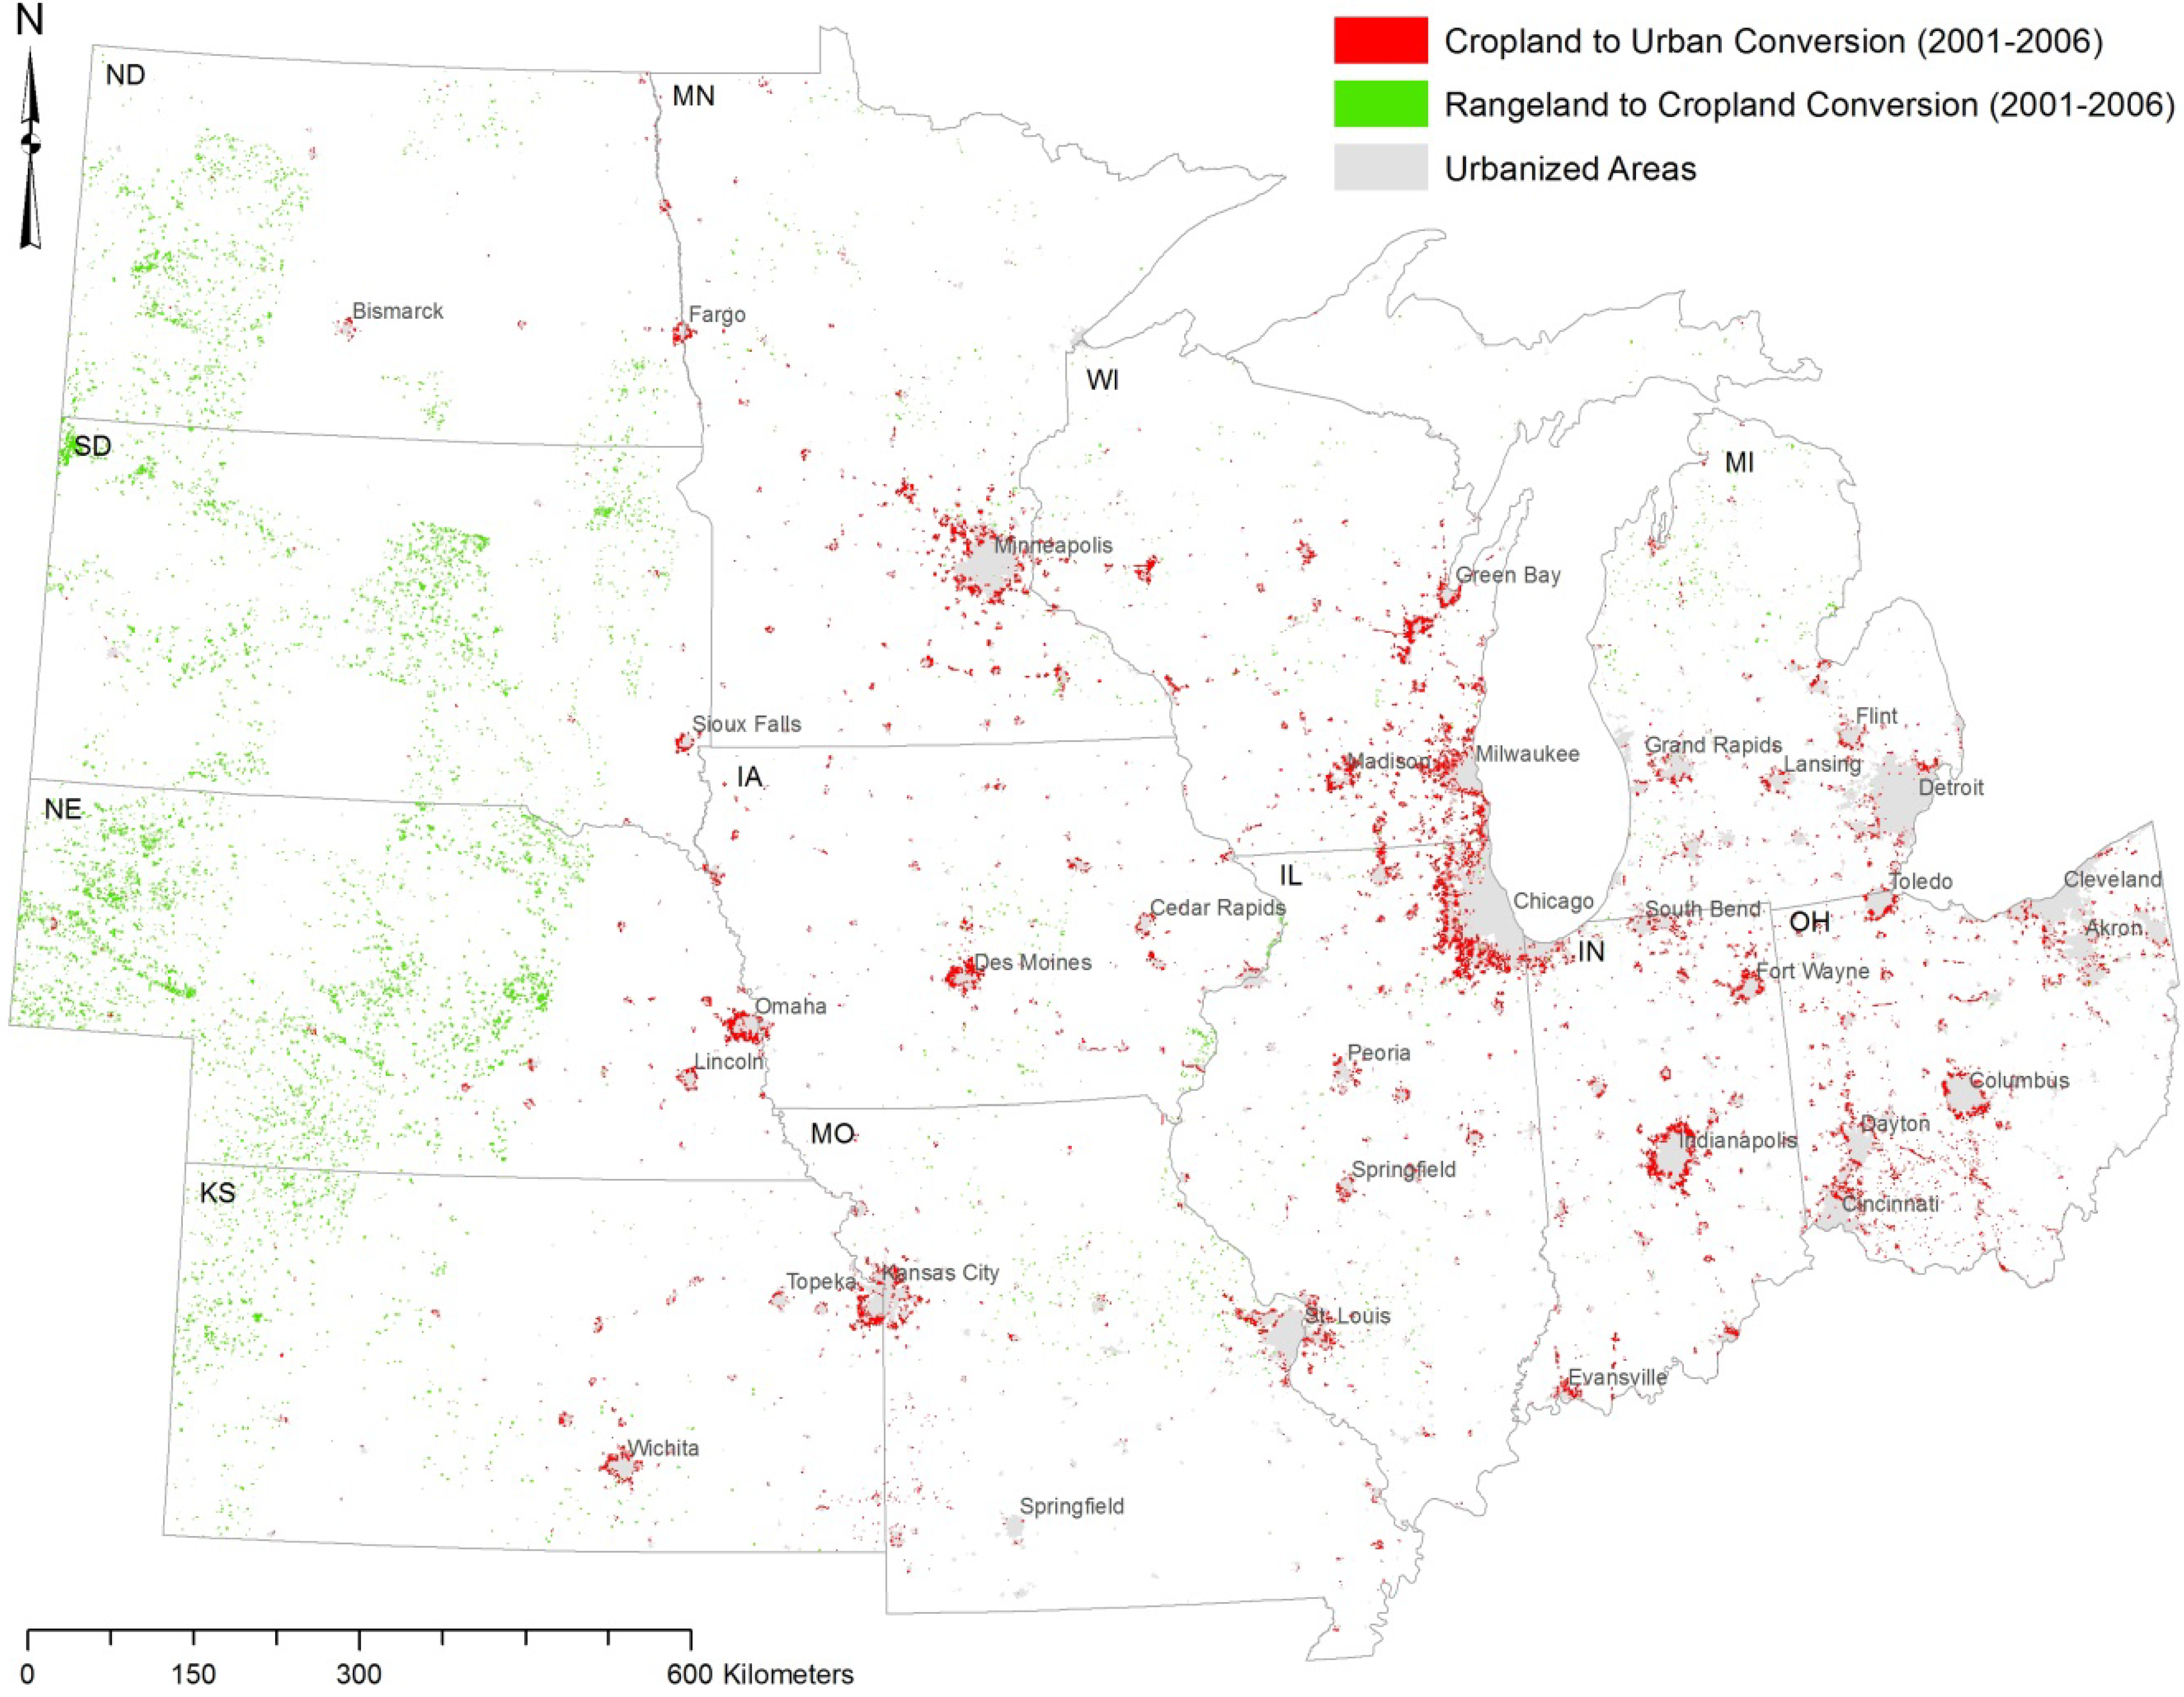
3.1. Land Cover Changes 2001–2006
3.2. Cropland to Urban Conversion and Replacement Rangeland to Cropland Conversion
| State | Rainfall (mm) 1 | Temperature (°C) 1 | Change in Irrigated Land (ha) | |||
|---|---|---|---|---|---|---|
| Annual | Growing Season 2 | Annual | Growing Season | 2002–2007 | 2007–2012 | |
| Iowa | 915 | 621 | 10.5 | 17.1 | +19,186 | −7228 |
| Minnesota | 704 | 466 | 6.1 | 13.2 | +20,844 | +7146 |
| Missouri | 1117 | 645 | 13.3 | 18.8 | +67,586 | −7727 |
| North Dakota | 453 | 327 | 6.1 | 13.2 | +13,485 | −7175 |
| South Dakota | 508 | 360 | 8.6 | 15.2 | −11,024 | +1957 |
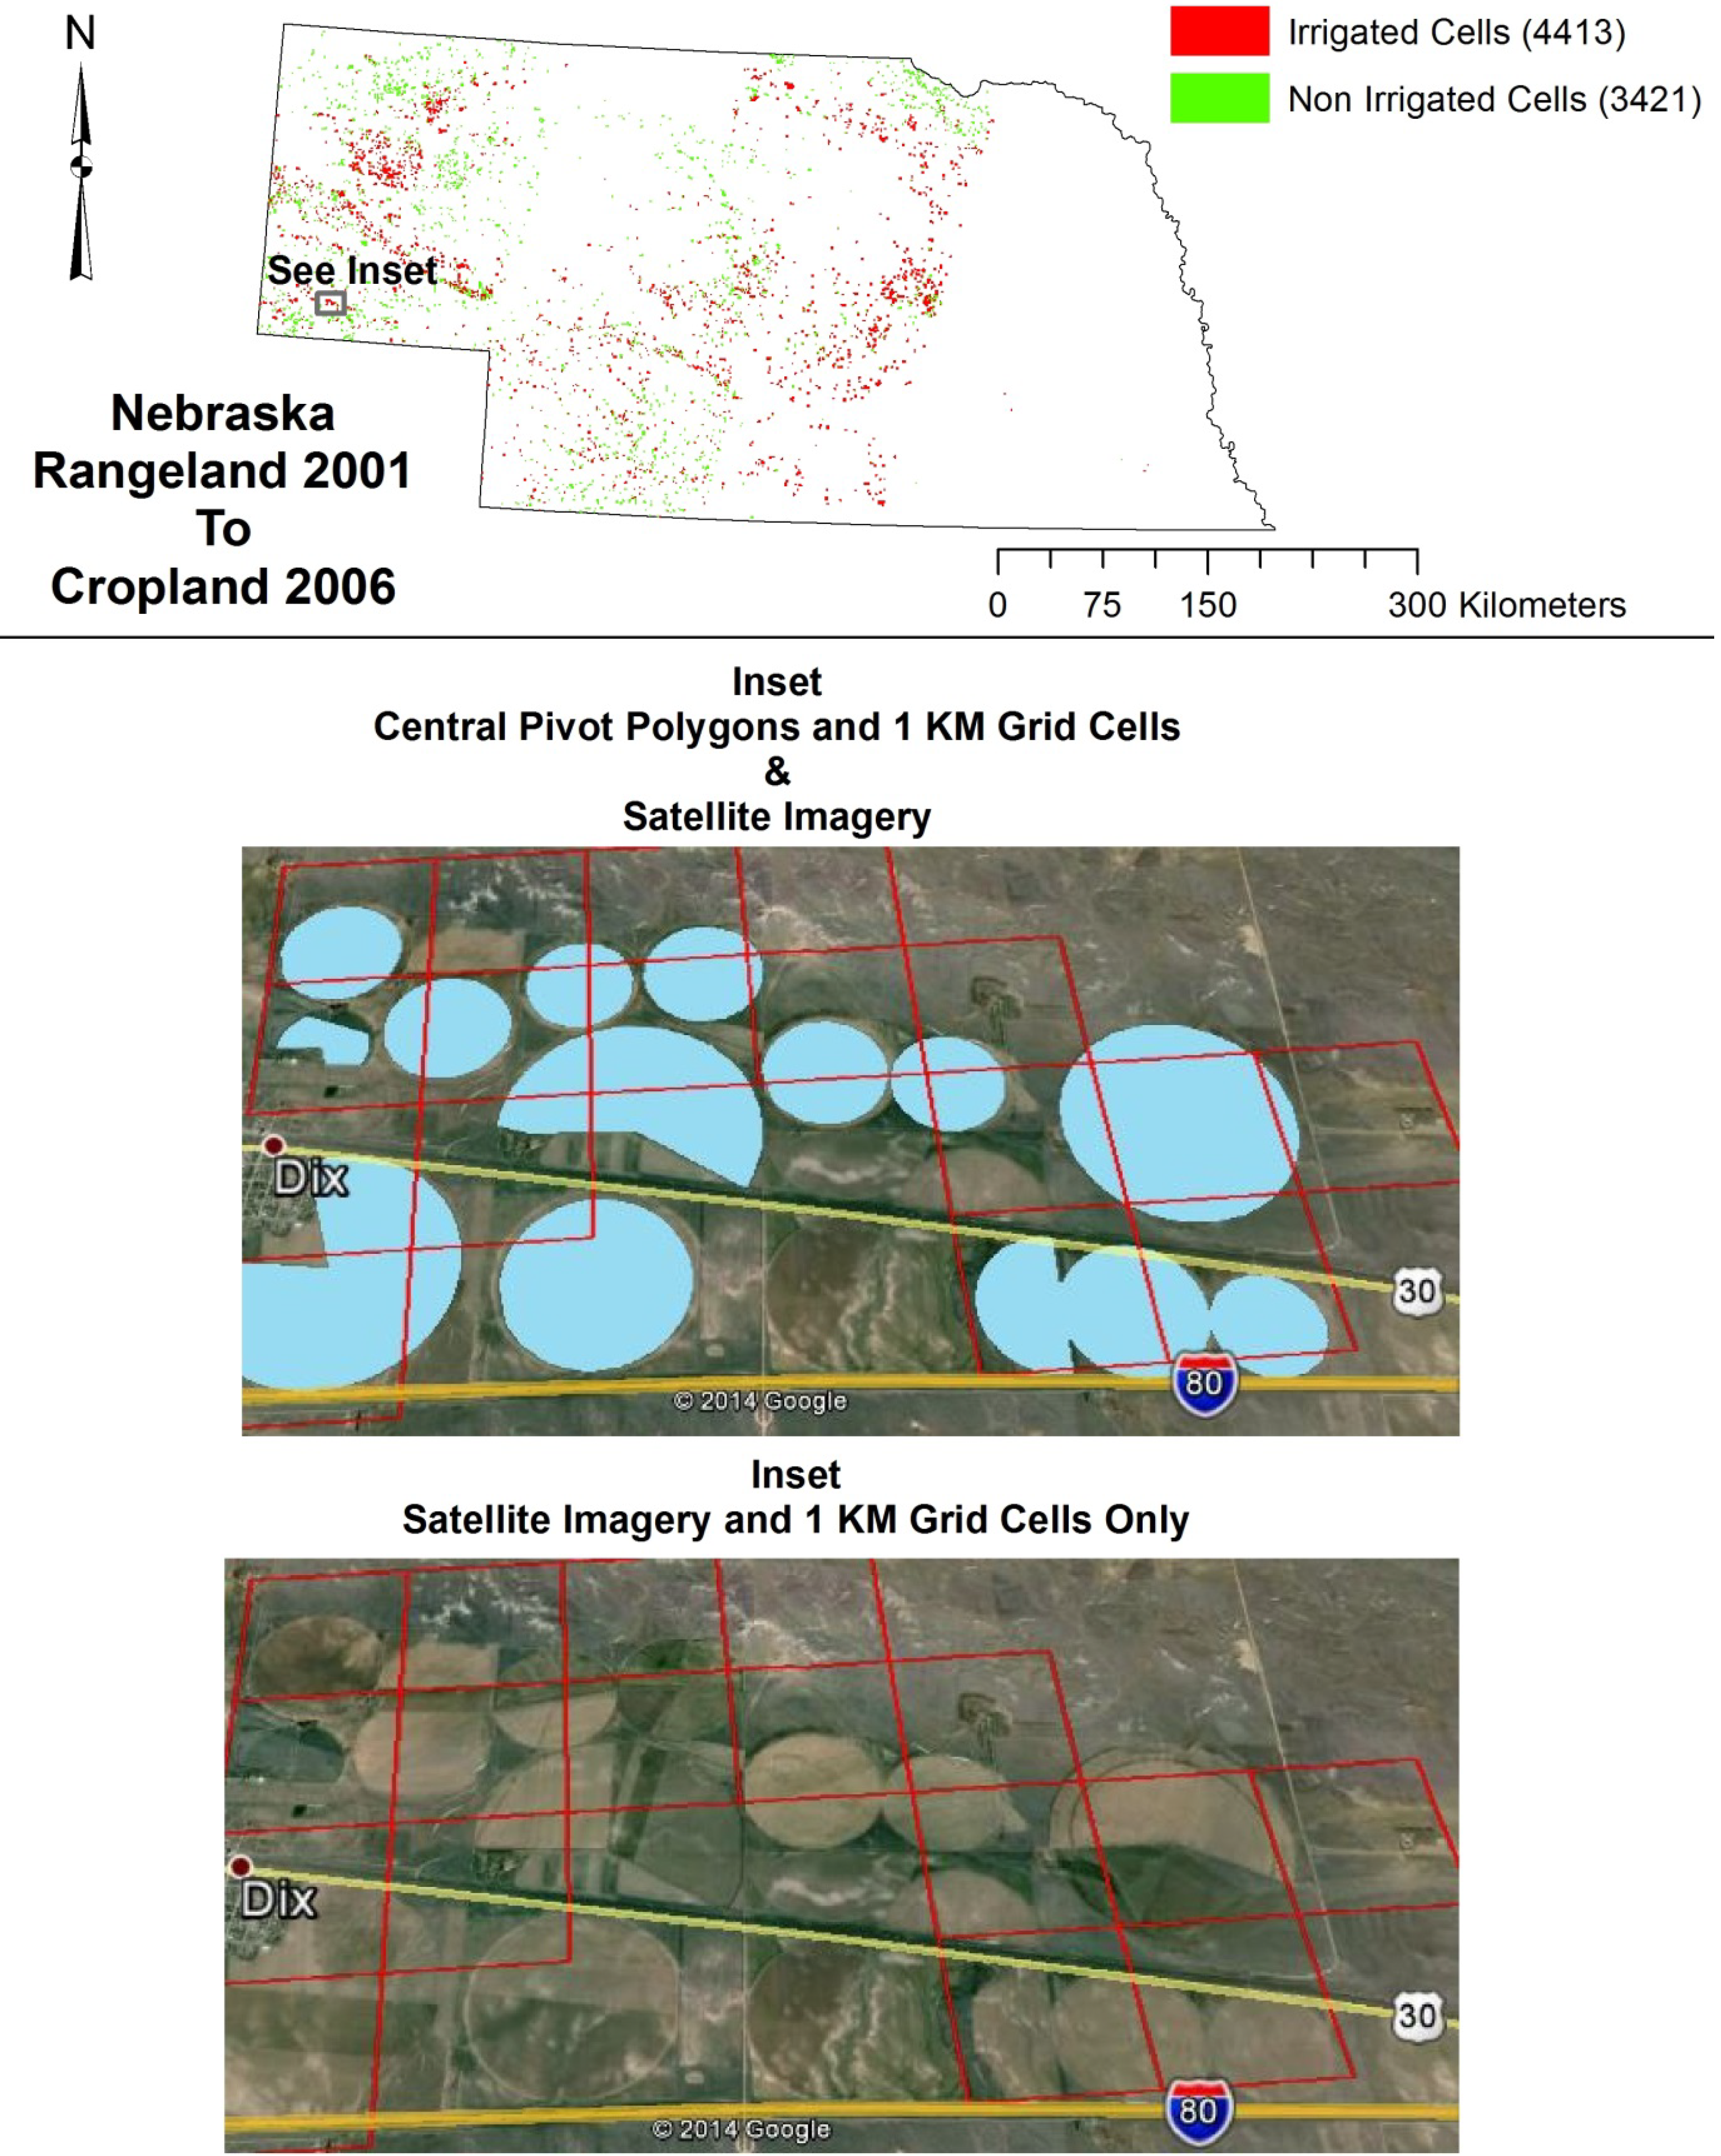
| Nebraska | 600 | 434 | 9.4 | 15.4 | +377,729 | −106,022 |
| Kansas | 771 | 541 | 13.3 | 19.3 | +34,184 | +47,973 |

3.3. Land Use Change
4. Conclusions
Acknowledgments
Author Contributions
Conflicts of Interest
References
- Cai, H.; Yang, X.; Xu, X. Spatiotemporal patterns of urban encroachment on cropland and its impacts on potential agricultural productivity in China. Remote. Sens. 2013, 5, 6443–6460. [Google Scholar] [CrossRef]
- Polimeni, J. Simulating agricultural conversion to residential use in Hudson River Valley: Scenario analyses and case studies. Agric. Hum. Values 2005, 22, 377–393. [Google Scholar] [CrossRef]
- Shalaby, A.A.; Ali, R.R.; Gad, A. Urban sprawl impact assessment on the agricultural land in Egypt using remote sensing and GIS: A case study, Qalubiya Governate. J. Land Use Sci. 2012, 7, 261–273. [Google Scholar] [CrossRef]
- Nickerson, C.; Ebel, R.; Borchers, A. Major Uses of Land in the United States, 2007. USDA Economic Information Bulletin No. (E1B-89). Available online: http://www.ers.usda.gov/media/177328/eib89_reportsummary.pdf (accessed on 12 August 2013).
- Clark, C.D.; Park, W.; Howell, J. Tracking farmland conversion and fragmentation using tax parcel data. J. Soil Water Conserv. 2006, 61, 243–249. [Google Scholar]
- Greene, R.P.; Stager, J. Rangeland to cropland conversions as replacement land for prime farmland lost to urban development. Soc. Sci. J. 2001, 38, 543–555. [Google Scholar] [CrossRef]
- Platt, R.H. Land Use Control: Geography, Law, and Public Policy; Prentice Hall: Englewood Cliffs, NJ, USA, 1991. [Google Scholar]
- White, S.E. Ogallala oases: Water use, population distribution, and policy implications in the high plains of western Kansas, 1980–1990. Ann. Assoc. Am. Geogr. 1994, 84, 29–44. [Google Scholar]
- Kettle, N.; Harrington, L.; Harrington, J. Groundwater depletion and agricultural land use in the High Plains: A case study from Wichita County, Kansas. Prof. Geogr. 2007, 59, 221–235. [Google Scholar] [CrossRef] [Green Version]
- Drummond, M.A.; Auch, R.F.; Karstensen, K.A.; Sayler, K.L.; Taylor, J.L.; Loveland, T.R. Land change variability and human-environment dynamics in the United States Great Plains. Land Use Policy 2012, 29, 710–723. [Google Scholar] [CrossRef]
- United States Department of Agriculture. Farm and Ranch Irrigation Survey 2008. Available online: http://www.agcensus.usda.gov/Publications/2007/Online_Highlights/Farm_and_Ranch_Irrigation_Survey/index.php (accessed on 14 August 2013).
- Greene, R.P.; Harlin, J.M. Threat to high market value agricultural lands from urban encroachment: A national and regional perspective. Soc. Sci. J. 1995, 32, 137–155. [Google Scholar] [CrossRef]
- Laingen, C. Delineating the 2007 Corn Belt region. Pap. Appl. Geogr. Conf. 2012, 35, 173–181. [Google Scholar]
- Claassen, R.F.; Carriazo, J.C.; Cooper, D.; Hellerstein, D.; Udea, K. Grassland to Cropland Conversion in the Northern Plains: The Role of Crop Insurance, Commodity, and Disaster Programs; Economic Research Report ERR-120; Economic Research Service, US Department of Agriculture: Washington, DC, USA, 2011. Available online: http://www.ers.usda.gov/media/128019/err120.pdf (accessed on 29 March 2014).
- Wright, C.K.; Wimberly, M.C. Recent land use change in the western Corn Belt threatens grassland and wetlands. Proc. Natl. Acad. Sci. USA 2013, 110, 4134–4139. [Google Scholar] [CrossRef]
- Johnston, C.A. Agricultural expansion: Land use shell game in the U.S. Northern Plains. Landsc. Ecol. 2014, 29, 81–95. [Google Scholar] [CrossRef]
- Secchi, S.; Gassman, P.W.; Tha, J.; Kurkalova, L.; Klinge, C.L. Potential water quality changes due to corn expansion in the Upper Mississippi River Basin. Ecol. Appl. 2011, 21, 1068–1084. [Google Scholar]
- Wu, Y.; Liu, S.; Zhengpeng, L. Identifying potential areas for biofuel production and evaluating the environmental effects: A case study of the James River basin in the Midwestern United States. GCB Bioenerg. 2012, 4, 875–888. [Google Scholar] [CrossRef]
- United States Congress. Energy Independence and Security Act of 2007. Proceedings of H.R.6 110th Congress, Washington, DC, USA, 4 January 2007; Available online: http://www.gpo.gov/fdsys/pkg/BILLS-110hr6enr/pdf/BILLS-110hr6enr.pdf (accessed on 21 March 2014).
- Searchinger, T.; Heimlich, R.; Houghton, R.A.; Dong, F.; Elobeid, A.; Fabiosa, J.; Tokgoz, S.; Hayes, D.; Yu, T. Use of U.S. cropland for biofuel increases greenhouse gases through emissions from land use change. Science 2008, 319, 1238–1240. [Google Scholar] [CrossRef]
- Nizeyimana, E.L.; Petersen, G.W.; Imhoff, M.L.; Sinclair, H.R.; Waltman, S.W.; Reed-Margetan, D.S.; Levine, E.R.; Russo, J.M. Assessing the impact of land conversion to urban use on soils with different productivity levels in the USA. Soil Sci. Soc. Am. J. 2001, 65, 391–402. [Google Scholar] [CrossRef]
- Richardson, H.W.; Bae, C-H.C. (Eds.) Urban Sprawl in Western Europe and the United States; Ashgate Publishing Ltd.: Burlington, VT, USA, 2004.
- Alig, R.J.; Kline, J.D.; Lichtenstein, M. Urbanization on the US landscape: Looking ahead in the 21st century. Landsc. Urban Plan. 2004, 69, 219–234. [Google Scholar] [CrossRef]
- U.S. Department of Agriculture. Summary Report: 2010 National Resources Inventory. Available online: http://www.nrcs.usda.gov/Internet/FSE_DOCUMENTS/stelprdb1167354.pdf (accessed on 4 July 2014).
- Radeloff, V.C.; Hammer, R.B.; Stewart, S.I.; Fried, J.S.; Holcomb, S.S.; McKeefry, J.F. The wildland-urban interface in the United States. Ecol. Appl. 2005, 15, 799–805. [Google Scholar] [CrossRef]
- Pijanowski, B.C.; Robinson, K.D. Rates and patterns of land use change in the upper Great Lakes states, USA: A framework for spatial temporal analysis. Landsc. Urban Plan. 2011, 102, 102–116. [Google Scholar] [CrossRef]
- Liu, D.; Cai, S. A spatial-temporal modeling approach to reconstructing land-cover change trajectories from multi-temporal satellite imagery. Ann. Assoc. Am. Geogr. 2012, 102, 1329–1347. [Google Scholar] [CrossRef]
- Nusser, S.M.; Breidt, F.J.; Fuller, W.A. Design and estimation for investigating the dynamics of natural resources. Ecol. Appl. 1998, 8, 234–245. [Google Scholar] [CrossRef]
- Levia, D.F.; Page, D.R. The use of cluster analysis in distinguishing farmland prone to residential development: A case study of Sterling, Massachusetts. Environ. Manag. 2000, 25, 541–548. [Google Scholar] [CrossRef]
- Hasse, J.E.; Lathrop, R.G. Land resource impact indicators of urban sprawl. Appl. Geogr. 2003, 23, 159–175. [Google Scholar] [CrossRef]
- Rashford, B.S.; Walker, J.A.; Bastian, C.T. Economics of grassland conversion to cropland in the Prairie Pothole region. Conserv. Biol. 2010, 25, 276–284. [Google Scholar]
- Sohl, T.L.; Sleeter, B.M.; Sayler, K.L.; Bouchard, M.A.; Reker, R.R.; Bennett, S.L.; Sleeter, R.R.; Kanengieter, R.L.; Zhu, Z. Spatially explicit land-use and land-cover scenarios for the Great Plains of the United States. Agric. Ecosyst. Environ. 2012, 153, 1–15. [Google Scholar] [CrossRef]
- Thompson, A.W.; Prokopy, LS. Tracking urban sprawl: Using spatial data to inform farmland preservation policy. Land Use Policy 2009, 26, 194–202. [Google Scholar]
- Hart, J.F. Half a century of cropland change. Geogr. Rev. 2001, 91, 525–543. [Google Scholar]
- Definition of the Midwest Region, United States Census Bureau. Available online: https://www.census.gov/geo/www/geo_defn.html (accessed on 12 August 2013).
- Batelle, Technology Partnership Practice. Power and Promise: Agbioscience in the North Central United States. Available online: http://www.midwesterngovernors.org/Midwest/battellefull2.pdf (accessed on 21 March 2014).
- Mehaffey, M.; van Remortel, R.; Smith, E.; Bruins, R. Developing a dataset to assess ecosystem services in the Midwest United States. Int. J. Geogr. Inf. Sci. 2011, 25, 681–695. [Google Scholar]
- Doraiswamy, P.C.; Akhmedov, B.; Stern, A.J. Crop classification in the U.S. Corn Belt using MODIS imagery. In Proceedings of the International Geoscience and Remote Sensing Symposium of the Conference (IGARSS), Barcelona, Spain, 23–27 July 2007.
- Steiner, F.R.; Theilacker, J.E. Protecting Farmlands; AVI Publishing Company, Inc.: Westport, CT, USA, 1984. [Google Scholar]
- Climate Summaries, Midwest Regional Climate Center. Available online: http://mrcc.isws.illinois.edu/climate_midwest/mwclimate_data_summaries.htm (accessed on 6 June 2014).
- Eathington, L. 2000–2009 Population Growth in the Midwest: Urban and Rural Dimensions. Available online: http://www.econ.iastate.edu/sites/default/files/publications/papers/p11427-2010-04-28.pdf (accessed on 10 August 2013).
- Fry, J.; Xian, G.; Jin, S.; Dewitz, J.; Homer, C.; Yang, L.; Barnes, C.; Herold, N.; Wickham, J. Completion of the 2006 national land cover database for the conterminous United States. Photogramm. Eng. Remote Sens. 2011, 77, 858–864. [Google Scholar]
- Homer, C.; Dewitz, J.; Fry, J.; Coan, M.; Hossain, N.; Larson, C.; Herold, N.; McKerrow, A.; van Driel, J.N.; Wickham, J. Completion of the 2001 national land cover dataset. Photogramm. Eng. Remote Sens. 2007, 73, 337–344. [Google Scholar]
- United States Geological Survey. NLCD 2001 to 2006 Land Cover from to Change Index (2011 Edition) (99.5MB). Available online: http://www.mrlc.gov/nlcd06_data.php (accessed on 4 June 2012).
- Xian, G.; Homer, C.; Fry, J. Updating the 2001 National Land Cover Database land cover classification to 2006 using Landsat imagery change detection methods. Remote Sens. Environ. 2009, 113, 1133–1147. [Google Scholar] [CrossRef]
- Wickham, J.D.; Stehman, S.V.; Gass, L.; Dewitz, J.; Fry, J.A.; Wade, T.G. Accuracy assessment of NLCD 2006 land cover and impervious surface. Remote Sens. Environ. 2013, 130, 294–304. [Google Scholar] [CrossRef]
- Kazmierczak, T.C. Rangeland to Cropland Conversion in the Central Great Plains. Master’s Thesis, Northern Illinois University, DeKalb, IL, USA, 2010. [Google Scholar]
- Xie, H.; Eheart, J.W.; An, H. Hydrologic and economic implications of climate change for typical river basins of the agricultural midwestern United States. J. Water Resour. Plan. Manag. 2008, 134, 205–213. [Google Scholar] [CrossRef]
- 1981–2000 Climate Normals. National Climatic Data Center, National Oceanic and Atmospheric Administration. Available online: http://www.ncdc.noaa.gov/cdo-web/datatools/normals (accessed on 2 June 2014).
- Census of Agriculture 2002 and 2007. U.S. Summary and State Reports. Available online: http://www.agcensus.usda.gov/Publications/Historical_Publications/ (accessed on 1 June 2014).
- Andresen, J.; Hilberg, S.; Kunkel, K. Historical climate and climate trends in the midwestern USA. U.S. National Climate Assessment Midwest Technical Input Report. Winkler, J., Andresen, J., Hatfield, J., Bidwell, D., Brown, D., Eds.; Available online: http://glisa.msu.edu/docs/NCA/MTIT_Historical.pdf (accessed on 27 May 2014).
- Historical Palmer Drought Indices. National Climatic Data Center, National Oceanic and Atmospheric Administration. Available online: http://www.ncdc.noaa.gov/temp-and-precip/drought/historical-palmers.php (accessed on 2 June 2014).
- Kustu, M.D.; Fan, Y.; Robock, A. Large-scale water cycle perturbation due to irrigation pumping in the US High Plains: A synthesis of observed streamflow changes. J. Hydrol. 2010, 390, 222–244. [Google Scholar] [CrossRef]
- Center Pivot Irrigation Shape File. The Conservation and Survey Division and the Center for Advanced Land Management Information Technologies. University of Nebraska-Lincoln. Available online: http://snr.unl.edu/data/geographygis/NebrGISdata.asp (accessed on 4 June 2014).
- Thompson, C.L.; Supalla, R.J.; Martin, D.L.; McMullen, B.P. Evidence supporting cap and trade as a groundwater policy option for reducing irrigation consumptive use. J. Am. Water Resour. Assoc. 2009, 45, 1508–1518. [Google Scholar] [CrossRef]
- Baker, J.M.; Griffis, T.J.; Ochsner, T.E. Coupling landscape water storage and supplemental irrigation to increase productivity and improve environmental stewardship in the U.S. Midwest. Water Resour. Res. 2012, 48, W05301. [Google Scholar]
- Scanlon, B.R.; Faunt, C.C.; Longuevergne, L.; Reedy, R.C.; Alley, W.M.; McGuire, V.L.; McMahon, P.B. Groundwater depletion and sustainability of irrigation in the US High Plains and Central Valley. Proc. Natl. Acad. Sci. USA 2012, 109, 9320–9325. [Google Scholar] [Green Version]
- Dominguez-Faus, R.; Folberth, C.; Liu, J.; Jaffe, A.M.; Alvarez, P.J.J. Climate change would increase the water intensity of corn ethanol. Environ. Sci. Technol. 2013, 47, 6030–6037. [Google Scholar]
- Dennehy, K.F.; Litke, D.W.; McMahon, P.B. The High Plains aquifer, USA: Groundwater development and sustainability. In Sustainable Groundwater Development; Hiscock, K.M., Rivett, M.O., Davison, R.M., Eds.; Geological Society of London: Bath, UK, 2002; pp. 99–120. [Google Scholar]
- Feichtinger, P.; Salhofer, K. The Valuation of Agricultural Land and the Influence of Government Payments; Factor Markets Working Paper No. 10/December 2011. Centre for European Policy Studies: Brussels, Belgium. Available online: http://ageconsearch.umn.edu/bitstream/119103/2/Factor%20Markets%20WP%20No%2010%20on%20Agricultural%20Land%20and%20Influence%20of%20Government%20Payments%20D16.pdf (accessed on 28 May 2014).
- Lubowski, R.N.; Plantinga, A.J.; Stavins, R.N. What Drives Land-Use Change in the United States? A National Analysis of Landowner Decisions; National Bureau of Economic Research Work Paper No. 13572; National Bureau of Economic Research: Cambridge, MA, USA, 2007; pp. 1–41. [Google Scholar]
- Choi, S.-W.; Sohngen, B.; Alig, R. An assessment of the influence of bioenergy and marketed land amenity values on land uses in the Midwestern US. Ecol. Econ. 2011, 70, 713–720. [Google Scholar] [CrossRef]
- Jiyuan, L.; Kuang, W.; Zhang, Z.; Xu, X.; Yuanwei, Q.; Ning, J.; Zhou, W.; Zhang, S.; Li, R.; Yan, C.; et al. Spatiotemporal characteristics, patterns, and causes of land-use changes in China since the late 1980s. J. Geogr. Sci. 2014, 24, 195–210. [Google Scholar]
- Martinuzzi, S.; Januchowski-Hartley, S.R.; Pracheil, B.M.; McIntyre, P.B.; Plantinga, A.J.; Lewis, D.J.; Radeloff, V.C. Threats and opportunities for freshwater conservation under future land use change scenarios in the United States. Glob. Chang. Biol. 2014, 20, 113–124. [Google Scholar] [CrossRef]
© 2014 by the authors; licensee MDPI, Basel, Switzerland. This article is an open access article distributed under the terms and conditions of the Creative Commons Attribution license (http://creativecommons.org/licenses/by/3.0/).
Share and Cite
Emili, L.A.; Greene, R.P. New Cropland on Former Rangeland and Lost Cropland from Urban Development: The “Replacement Land” Debate. Land 2014, 3, 658-674. https://doi.org/10.3390/land3030658
Emili LA, Greene RP. New Cropland on Former Rangeland and Lost Cropland from Urban Development: The “Replacement Land” Debate. Land. 2014; 3(3):658-674. https://doi.org/10.3390/land3030658
Chicago/Turabian StyleEmili, Lisa A., and Richard P. Greene. 2014. "New Cropland on Former Rangeland and Lost Cropland from Urban Development: The “Replacement Land” Debate" Land 3, no. 3: 658-674. https://doi.org/10.3390/land3030658