1. Introduction
With an increase in demand for strong, evidence-based environmental policy and management, scientists have called for methods to accurately capture the complex nature of socio-ecological systems [
1,
2]. This call is driven by the need to understand the likely consequences and trade-offs of proposed policies on economic outcomes, land use, and social well-being [
3]. A modelling approach is well suited to this task because the social, economic, and geographic factors that determine the choice and impact of land use are in themselves complex [
4,
5,
6,
7].
Land use and land cover change (LULCC) models represent a well-developed approach to modelling and understanding processes that shape the environment [
8,
9,
10] and have developed alongside our understanding of wider economic and social systems. As with most modelling approaches, early implementation of LULCC models focused on mathematical programming and rational utility theory,
i.e., individuals are assumed to maximise profits [
11,
12,
13,
14,
15]. These approaches are still common, and while these models capture trends in LULCC, they may fail to reflect accurately the underlying processes driving the change in LULCC [
2].
More specifically, more economically focused LULCC models focus on management practices that maximise net returns for a given land use while omitting key spatial, bio-physical, and social details [
2,
16,
17,
18,
19,
20,
21]. Such abstractions ignore the processes, people, and space within the model, thus making the “optimally derived” solution unrealistic [
22]. Geographically defined LULCC models, on the other hand, typically account for heterogeneity across space and individuals, but often simplify the level of economic behaviour [
23,
24,
25,
26,
27]. As such, geographic models are typically structured to include simplified economic approaches and to exclude explicit representations of land and commodity markets [
23].
Geographers and economists have rarely collaborated in undertaking these analyses, leading to calls for modellers from these two disciplines to coordinate efforts in order to build models that better represent the real world [
23,
28].
LULCC is a complex, adaptive process that can also be explained through the use of computational tools such as agent-based models (ABMs) [
2,
29,
30]. ABMs are well suited to analysing decentralised, autonomous decision making such as that underlying LULCC because they represent complex spatial interactions under heterogeneous conditions [
30,
31,
32]. In addition, the ABM approach accounts for space, distance, and time in decision making.
However, capturing the social and economic behaviour of farmers via ABMs to analyse LULCC is not without its own complexities and limitations [
27,
33,
34,
35,
36]. For example, Burton [
37] outlines numerous social processes that should be evaluated when assessing farmer behaviour, including cultural embeddedness [
38], social networks, and technology transfer [
39,
40], and the dichotomy between social and economic approaches to farming [
41,
42]. Therefore, capturing the heterogeneity of farmer behaviour is essential when modelling rural land-use change. While this notion is widely supported [
38,
43], there is significant variation in how heterogeneity in farmer decision making is accounted in ABMs. Examples of such heterogeneity include: variation in different production strategies [
35,
44,
45]; dealing with external factors [
46,
47]; and simulating key parts of the farming process [
48,
49,
50]. In all cases, this variation depends on the objective of the ABM [
51].
To answer these calls, the authors (two economists and a geographer) developed an economically grounded, spatially explicit ABM to explore the effects of environmental policy on rural land use in New Zealand. The Agent-based Rural Land Use New Zealand (ARLUNZ) is capable of analysing the impact of a variety of policies on land use, net revenue, and environmental indicators such as greenhouse gas (GHG) emissions, nutrient loadings, and soil erosion [
36].
This inter-disciplinary collaboration required that two differences in approach be resolved. The first is a disciplinary perspective on how individual agents enter into the model. Geographers have traditionally had a strong preference for defining types of agents within a population according to a typological framework [
35,
38,
43,
44,
46] to limit complexity while still moving agents towards their predefined goals [
52,
53,
54,
55]. While economists recognise the need to limit computational complexity [
34], they have also called for empirical calibration and validation of decision-making hypotheses through surveys, interviews, participatory modelling, and experimental economics [
33,
56,
57]. Because we have access to a large-scale, nationally representative survey that accounts for demographics, social processes, and land use, we side with economists and rely on empirical distributions of farmer and forester characteristics to simulate a population of agents [
58].
The second disciplinary disagreement—and a primary focus of this paper—is the way in which processes that shape the behaviour of agents are integrated within the model. Irwin [
23] observes that the methods used for modelling land-use change vary significantly: economists tend to focus on econometric analyses, while geographers tend to base their analyses on simulations.
Farmers’ information networks are framed around their social interactions and play a role in shaping their decision making processes [
39,
40,
59,
60]. Through the nationally representative survey, we could define the observable effects of each farmer’s networks into the agent-based model by directly affecting the likelihood of a certain type of behaviour, in this case land-use conversion. Conversely, we could simulate the agent’s interactions with their networks and observe how these interactions affect the agent’s likelihood of land-use conversion.
Consequently, this paper analyses how each approach affects the resulting land use, net revenue, and environmental outputs at a catchment scale. We hypothesise that the two approaches will produce significant differences for each of these metrics.
We note that these disagreements relate to representation of people and the empirical characterisation of agents within ABMs [
1,
51,
57,
58,
61,
62]. Specifically, the disagreements relate to how empirical data is used to capture and define the bounds of decision making available to the agents. Greater variety of on-farm management options (e.g., reducing stocking rates, fencing streams, and planting riparian buffers) and more information being made available to farmers (e.g., climate, biophysical and soils data) increase the complexity associated with defining farmer agents. Because of the significant empirical data required to inform the use of on-farm management options and to account for additional information through climate and biophysical models, we constrain farmer decision making in this manuscript to complete farm conversion from enterprise to enterprise.
The remainder of this paper is organised as follows:
Section 2 describes the methodology used in this research and the approaches used to define an agent’s likelihood of land-use conversion;
Section 3 summarises the experimental design for the research specifically the region the model has been applied on;
Section 4 presents the results from the experiment; and
Section 5 concludes.
2. Methods
The ARLUNZ model was designed to analyse complex environmental issues in the rural landscape, to provide information about how farmers will adapt to change, and to inform policy that seeks to address vulnerability to resource scarcity. Specifically, ARLUNZ focuses on variability in decision making among farmers, moving away from a representative decision-making agent to a spatial and behaviourally heterogeneous population of farmers whose decision making reflects the real world.
ARLUNZ is written in Version 5.0.5 of NetLogo [
63] using the GIS, String, and Shell extensions. Python 2.7 is used to facilitate a loose coupling [
64] between ARLUNZ and a modified version of the New Zealand Forest and Agriculture Regional Model (NZFARM) that provides economic information. NZFARM is a non-linear, partial equilibrium mathematical programming model of New Zealand land use operating at the sub-catchment scale [
65]. The version used within ARLUNZ has been refined to produce an economically optimised result for each farm rather than an optimised landscape for a sub-catchment [
66,
67,
68,
69].
Morgan and Daigneault [
36] provides detailed information on the design, structure, outputs, and parameterisation of ARLUNZ and its coupling with NZFARM as well as its use to estimate the impacts of climate change policy on land use in New Zealand. In addition,
Table S1 contains an ODD+D description [
70] for the ARLUNZ model.
2.1. Survey Research
Some parametrisation in the ARLUNZ model is based on the Survey of Rural Decision Makers (SRDM), a nationally representative survey of land owners and other decision makers [
71]. The survey was conducted online between March and July 2013.
The survey gathered up to 192 data points on each respondent, land characteristics and use, current farm practice, demographics, succession plans, professional networks, sources of information regarding best practice, management objectives, income, risk tolerance, and values [
71]. The questionnaire was developed in consultation with the Ministry for the Environment, the Ministry of Primary Industries, Dairy New Zealand, Beef + Lamb New Zealand, HortNZ, regional councils, AgResearch, the New Zealand Institute for Economic Research, farmer discussion groups, and other stakeholders.
The sample was drawn from the AssureQuality AgriBase database [
72]. Developed in 1993 to track foot and mouth disease, AgriBase records detailed information on privately held rural land across New Zealand. Inclusion in AgriBase is voluntary and entries are updated irregularly. As such, the median address was entered into the database seven years before the survey and some of the individuals contacted for the survey had left farming, making the true response rate difficult to ascertain. However, a total of 1564 responses were collected, yielding a response rate of at least 21%. Participation was incentivised via a donation made to a charity of each respondent’s choice and an invitation to view summary results online after the survey had closed. The primary decision-maker for each property was asked to complete the survey, which, on average, took approximately 20 min to complete.
Summary statistics for the variables of interest are shown in
Table 1. The mean property comprises 486 hectares, although this high average is driven by a handful of very large Sheep and Beef stations. The average age of respondents is 56.5, consistent with ages reported in New Zealand’s Agricultural Census [
73]. The average farmer has 25 years of experience. One-third of farmers hold university degrees, while 27.8% have completed diplomas or post-secondary technical training in farming and/or farm management.
Table 1.
Summary Statistics from the Survey of Rural Decision Makers.
Table 1.
Summary Statistics from the Survey of Rural Decision Makers.
| Variables | Mean | Std. Dev. | Min. | Max. |
|---|
| intend to intensify over the following 5 years (1–10) | 2.678 | 3.046 | 0 | 10 |
| intend to de-intensify over the following 5 years (1–10) | 3.569 | 3.452 | 0 | 10 |
| effective land quantity (hectares) | 486.440 | 1932.137 | 2 | 34,000 |
| age (years) | 56.471 | 10.098 | 24 | 87 |
| experience (years) | 25.100 | 15.812 | 1 | 66 |
| high school education (dummy) | 0.393 | 0.488 | 0 | 1 |
| diploma/tech training (dummy) | 0.278 | 0.448 | 0 | 1 |
| university or higher (dummy) | 0.329 | 0.470 | 0 | 1 |
| importance of being highly productive (1–10) | 6.535 | 2.787 | 0 | 10 |
| profitable business (dummy) | 0.785 | 0.411 | 0 | 1 |
| respondent exceeds median # of farm/farmer visits (dummy) | 0.487 | 0.500 | 0 | 1 |
| risk tolerance (1–10) | 5.437 | 2.403 | 0 | 10 |
| enterprise = sheep and beef (share) | 0.444 | 0.497 | 0 | 1 |
| enterprise = dairy (share) | 0.209 | 0.407 | 0 | 1 |
| enterprise = deer and other livestock (share) | 0.035 | 0.183 | 0 | 1 |
| enterprise = horticulture and viticulture (share) | 0.107 | 0.309 | 0 | 1 |
| enterprise = arable (share) | 0.030 | 0.171 | 0 | 1 |
| enterprise = dairy support (share) | 0.045 | 0.207 | 0 | 1 |
| enterprise = forestry (share) | 0.079 | 0.270 | 0 | 1 |
| enterprise = other enterprise (share) | 0.052 | 0.222 | 0 | 1 |
| number of land uses on this operation (#) | 1.684 | 0.884 | 1 | 5 |
| region = Auckland (share) | 0.031 | 0.173 | 0 | 1 |
| region = Bay of Plenty (share) | 0.054 | 0.226 | 0 | 1 |
| region = Canterbury (share) | 0.178 | 0.382 | 0 | 1 |
| region = Gisborne (share) | 0.024 | 0.154 | 0 | 1 |
| region = Hawke's Bay (share) | 0.084 | 0.277 | 0 | 1 |
| region = Marlborough (share) | 0.057 | 0.232 | 0 | 1 |
| region = Manuwatu-Whanganui (share) | 0.066 | 0.249 | 0 | 1 |
| region = Northland (share) | 0.053 | 0.224 | 0 | 1 |
| region = Otago (share) | 0.128 | 0.334 | 0 | 1 |
| region = Southland (share) | 0.086 | 0.280 | 0 | 1 |
| region = Tasman and Nelson (share) | 0.067 | 0.250 | 0 | 1 |
| region = Taranaki (share) | 0.043 | 0.203 | 0 | 1 |
| region = Waikato (share) | 0.074 | 0.262 | 0 | 1 |
| region = Wellington (share) | 0.036 | 0.186 | 0 | 1 |
| region = West Coast (share) | 0.020 | 0.139 | 0 | 1 |
The importance of being highly productive was self-evaluated on a scale of 0 to 10, where 0 indicates that being highly productive is “not at all important’ and 10 indicates that being highly productive is “extremely important”. The mean score for the importance of being highly productive is 6.53. Risk tolerance is measured by the question “Are you a person who is generally prepared to take risks?”, where 0 indicates “don’t like to take risks” and 10 indicates “fully prepared to take risks”. The mean score for risk tolerance was 5.44, indicating a moderate level of risk-taking.
Some 78.5% of respondents report that their business is either profitable or that it breaks even. Having a “large” professional network is defined by visiting more than the median number of farms (i.e., five) or meeting more than the median of farmers to discuss productivity (i.e., four); by definition, half of the survey respondents meet these criteria. The main reported farm enterprises by area include sheep and beef (44%), dairy (21%), horticulture and viticulture (11%), forestry (8%), dairy support (4%), deer and other livestock (3%), and arable (3%). The average number of different enterprises on the farm is 1.68, although a small number of farms have as many as five different enterprises. Respondents in Canterbury (the region on which this paper focuses) account for 17.2% of the total sample.
2.2. Defining the Likelihood of Land-Use Conversion
Decision making within the model rests entirely with the farmer agent. The economic component of the model returns the net revenue-maximising land-use for each farm along with the expected net revenue for each enterprise that could be undertaken on each farm. If the economically optimal land use differs from the enterprise currently undertaken, then the farmer agent chooses whether or not to convert through an evaluation against each farmer’s “likelihood of land-use conversion”.
The likelihood of land-use conversion is thus fundamental to decision making within the model. We adopt several methods for evaluating this value. The first (the homogeneous approach) ignores individual attributes of farmers and assigns an identical likelihood to each farmer. The second (the network approach) allows farmers to interact with peers and to make decisions that are informed by peer performance, either via networks or imitation. The third (the survey approach) uses empirical data from the Survey of Rural Decision Makers to predict this likelihood based on individual characteristics.
2.2.1. Homogeneous Approach
For this approach, which we class as the baseline, we ignore all farmer attributes and define the likelihood of land-use conversion at 0.2 (or 20%) for all farmer agents. We use this approach to represent a common type of economic LULCC model that uses a single rational, profit-maximising agent to make decisions.
2.2.2. Network Approach
This approach uses social and geographic networks to shape the farmer agent’s likelihood of land-use conversion. Farmer’s information networks are framed around their social [
39,
40,
59] and geographical [
74,
75] interactions and play a role in decision-making processes [
39,
50,
75]. Two theoretical frameworks inform how networks influence farmer decision making—endorsements and imitation. While endorsements and imitation in social networks are understood, the scale and impact that these processes have on decisions are difficult to quantify in the farming context.
Studies have found that the proximity to the people in one’s network is not as important as the stature of those people [
59,
76]. Therefore we assume that two-way interactions such as endorsements are preferred by farmers and provide a higher level of information acceptance compared with one-way interactions such as imitation. Consequently, we specify that endorsements obtained through social networks have higher weightings than those obtained through imitation.
Specifying these weightings for these network types required additional experimentation as there was no empirical data on the level of acceptance of information obtained through them. Sociological opinion in New Zealand suggests that the relative weighting of the information provided via farmer networks should range between 0.05 and 0.15 [
77]. Based on this, we defined the weightings for the likelihood of information uptake as 0.10 for Endorsement and 0.05 for Imitation. To explore the influence that these weightings have on the outputs of the model, we undertook a local sensitivity analysis (
Supplementary Material 2). We found that the model outputs are relatively insensitive to small variations in the weightings used for both endorsements and imitation.
Endorsements work on the concept that information about a product, process, or person (
i.e., the endorsed) is transferred from one individual (
i.e., the endorser) to another individual (
i.e., the receiver) through a social process. The information that is transferred by the endorser is subjective and is validated by the receiver based on his or her understanding of the endorser and the product, process, or person. Thus, endorsements capture a “
subjective but socially embedded agent’s reasoning process about cognitive trajectories aimed at achieving information and preferential clarity over another, endorsed agent” ([
78]; p. 1).
With endorsement in ARLUNZ, each farmer agent incorporates information on the success of the farming operation for ten farmer agents who are located closest to the decision maker and who undertake the same enterprise as the farmer agent. Each farmer agent learns the profitability/ha of each of the farmer agents within his or her social network; using these values, a mean profitability/ha value is derived for the farmer agent’s network and is then compared to farmer agent’s profitability/ha value. If the farmer agent’s profitability/ha is higher than the mean profitability/ha of the farmer agent’s social network, then his or her likelihood of land-use conversion is decreased by 0.10 percentage points to 10%. If the farmer agent’s profitability/ha is lower than the mean profitability/ha of the farmer agent’s social network, then his or her likelihood of land-use conversion increases by 0.10 percentage points to 30%. The ARLUNZ model assumes that each farmer in the social network has identical stature.
The theory of Social Learning [
79,
80] describes imitation as a process in which a person observes another person being rewarded for understandable and reproducible behaviour. The original person might then imitate that behaviour to try to achieve the same reward [
81]. Imitation transfers knowledge through a one-way network in which information is “absorbed” from the person’s surroundings and then used to inform the decisions they make. Farming practices are visible to all, particularly so to farmers in close proximity because of the regular exposure [
75,
82].
With imitation in ARLUNZ, the farmer agent incorporates information from the farms that are geographically adjacent to his or her own farm, regardless of the enterprise undertaken. If the economic component of the model proposes a change in land use, then each farmer agent in the geographic network that undertakes the proposed land use provides his or her profitability/ha value. Using these values, a mean profitability/ha value is derived for the farmer agent’s network, and this figure is compared with the farmer agent’s profitability/ha value. If the farmer agent’s profitability/ha is higher than that of his or her geographic network, then his or her likelihood of land-use conversion is decreased by 0.05 percentage points to 15%. If the farmer agent’s profitability/ha is higher than that of his or her geographic network, then the agent’s likelihood of land-use conversion is increased by 0.05 percentage points to 25%.
2.2.3. Survey Approach
This approach is based on empirical data from the Survey of Rural Decision Makers, which accounts for the decision to de-intensify land use as well as the decision to intensify land use based on the predicted net revenue of each enterprise.
The perceived likelihood of changing your current land use to more intensive or less intensive uses over the following five years was evaluated using an 11-point scale, with 0 representing “extremely unlikely” and 10 representing “extremely likely”. The average reported likelihood of intensification was 2.68, which we interpret to mean that there is a 26.8% probability of intensifying in the next five years, on average. Similarly, the average reported likelihood of de-intensification was 3.57, which we interpret to mean there is a 37.5% probability of de-intensifying in the next five years, on average.
Importantly, survey participants were asked about intensification and de-intensification, which could mean a change in management on the farm (such as an increase in the number of livestock per hectare) rather than wholesale conversion of a farmer’s land use. As these are the best empirical indicators of intentions, however, we ignore this possibility in the analysis that follows.
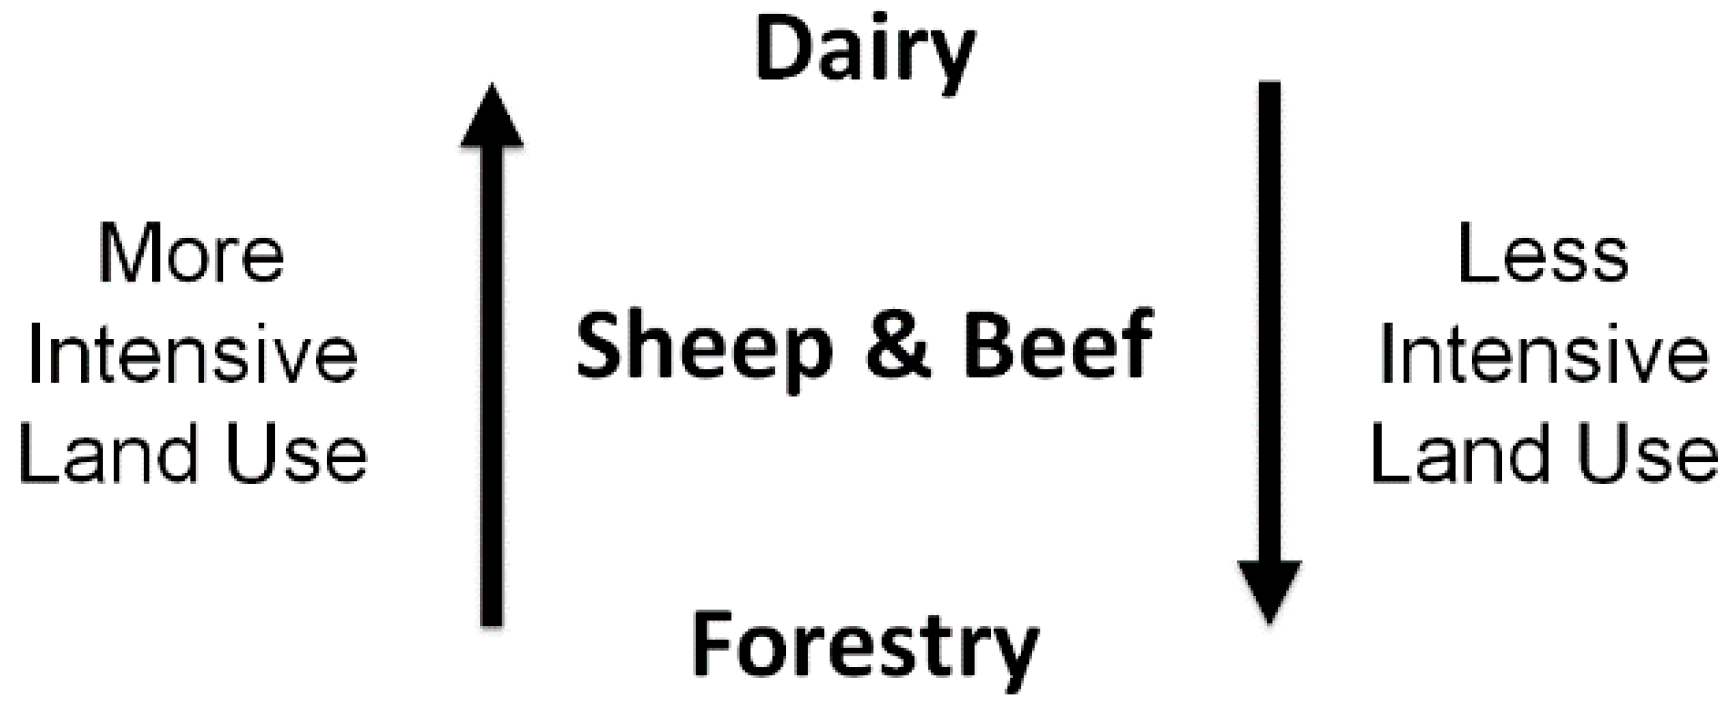
For the purposes of this research, we ranked the three most common land uses based on the intensiveness of their land use (
Figure 1). Dairy farming represents the most intensive land use, followed by sheep and beef farming. Forestry is the least intensive land use.
Figure 1.
Land uses within the ARLUNZ model ranked by the intensiveness of their land use.
Figure 1.
Land uses within the ARLUNZ model ranked by the intensiveness of their land use.
Using attributes defined by geospatial information (specifically, predominant land use and farm size) and empirical data from the Survey of Rural Decision Makers (specifically, age, experience, education level, importance of productivity, profitability, and network size), we define the likelihood of a farmer intensifying or de-intensifying his or her land use econometrically. Specifically, the probabilities of moving from a low-intensity activity to a high-intensity activity over the subsequent five years and vice versa are estimated using Tobit models in which the dependent variables are censored at 0 and 10. Specifically,
where
is a latent variable equal to the observed variable,
, only when the latent variable falls between the values of 0 and 10,
is a vector of explanatory variables, and the error term,
, is normally distributed. Thus, we have:
In contrast to the ordinary least squares with censored data, the tobit estimator is consistent [
83].
Table 2 presents the tobit estimates based on the national level data. The
are interpreted as the expected change in the uncensored latent variable,
i.e., the uncensored likelihood of intensification or de-intensification associated with a marginal change in an explanatory variable. For example, increasing age of the decision maker by 1% reduces the predicted (uncensored) perceived likelihood of intensification by 0.034 points on the 11-point scale, an effect that is statistically significant at the 0.01 level. Similarly, having a diploma or technical training increases the predicted (uncensored) perceived likelihood of intensification by 0.570 points, also significant at the 0.01 level. Neither of these explanatory variables has a statistically distinguishable effect on the perceived likelihood of de-intensification.
Table 2.
Predicted intensification and de-intensification for the survey approach (tobit model).
Table 2.
Predicted intensification and de-intensification for the survey approach (tobit model).
| Variables | Intensify | De-Intensify |
|---|
| log of effective land quantity | 0.206 * | 0.150 |
| | (0.105) | (0.118) |
| log of age | –3.374 *** | –0.0697 |
| | (0.767) | (0.923) |
| log of experience | 0.380 *** | 0.352 ** |
| | (0.145) | (0.164) |
| diploma/tech training | 0.570 * | –0.337 |
| | (0.329) | (0.370) |
| university or higher | 0.295 | –0.159 |
| | (0.323) | (0.373) |
| importance of being highly productive | 0.140 ** | –0.0216 |
| | (0.0605) | (0.0657) |
| profitable business | –0.842 ** | –0.342 |
| | (0.373) | (0.410) |
| respondent exceeds median # of farm/farmer visits | 1.272 *** | 0.787 ** |
| | (0.286) | (0.328) |
| risk tolerance | 0.179 *** | 0.0248 |
| | (0.0619) | (0.0705) |
| Constant | 6.874 ** | –3.812 |
| | (3.330) | (3.988) |
| Enterprise dummies | YES | YES |
| Region dummies | YES | YES |
| Observations | 1,507 | 1,507 |
| McFadden’s adjusted R-squared | 0.0449 | 0.0182 |
To use the likelihood of land-use conversion values as defined above, we take a random draw from a uniform distribution between 0 and 1. If the value of the random draw is less than the farmer’s likelihood of land-use conversion, then the proposed land-use change is accepted by the farmer agent and the farm is immediately converted to the proposed enterprise. In addition to converting between enterprises, the farmer agent also realises the predicted net revenue for that land use as defined by the economic component. If the random draw exceeds the likelihood of land-use conversion, then the incumbent enterprise is retained until the next time step of the model.
3. Experimental Section
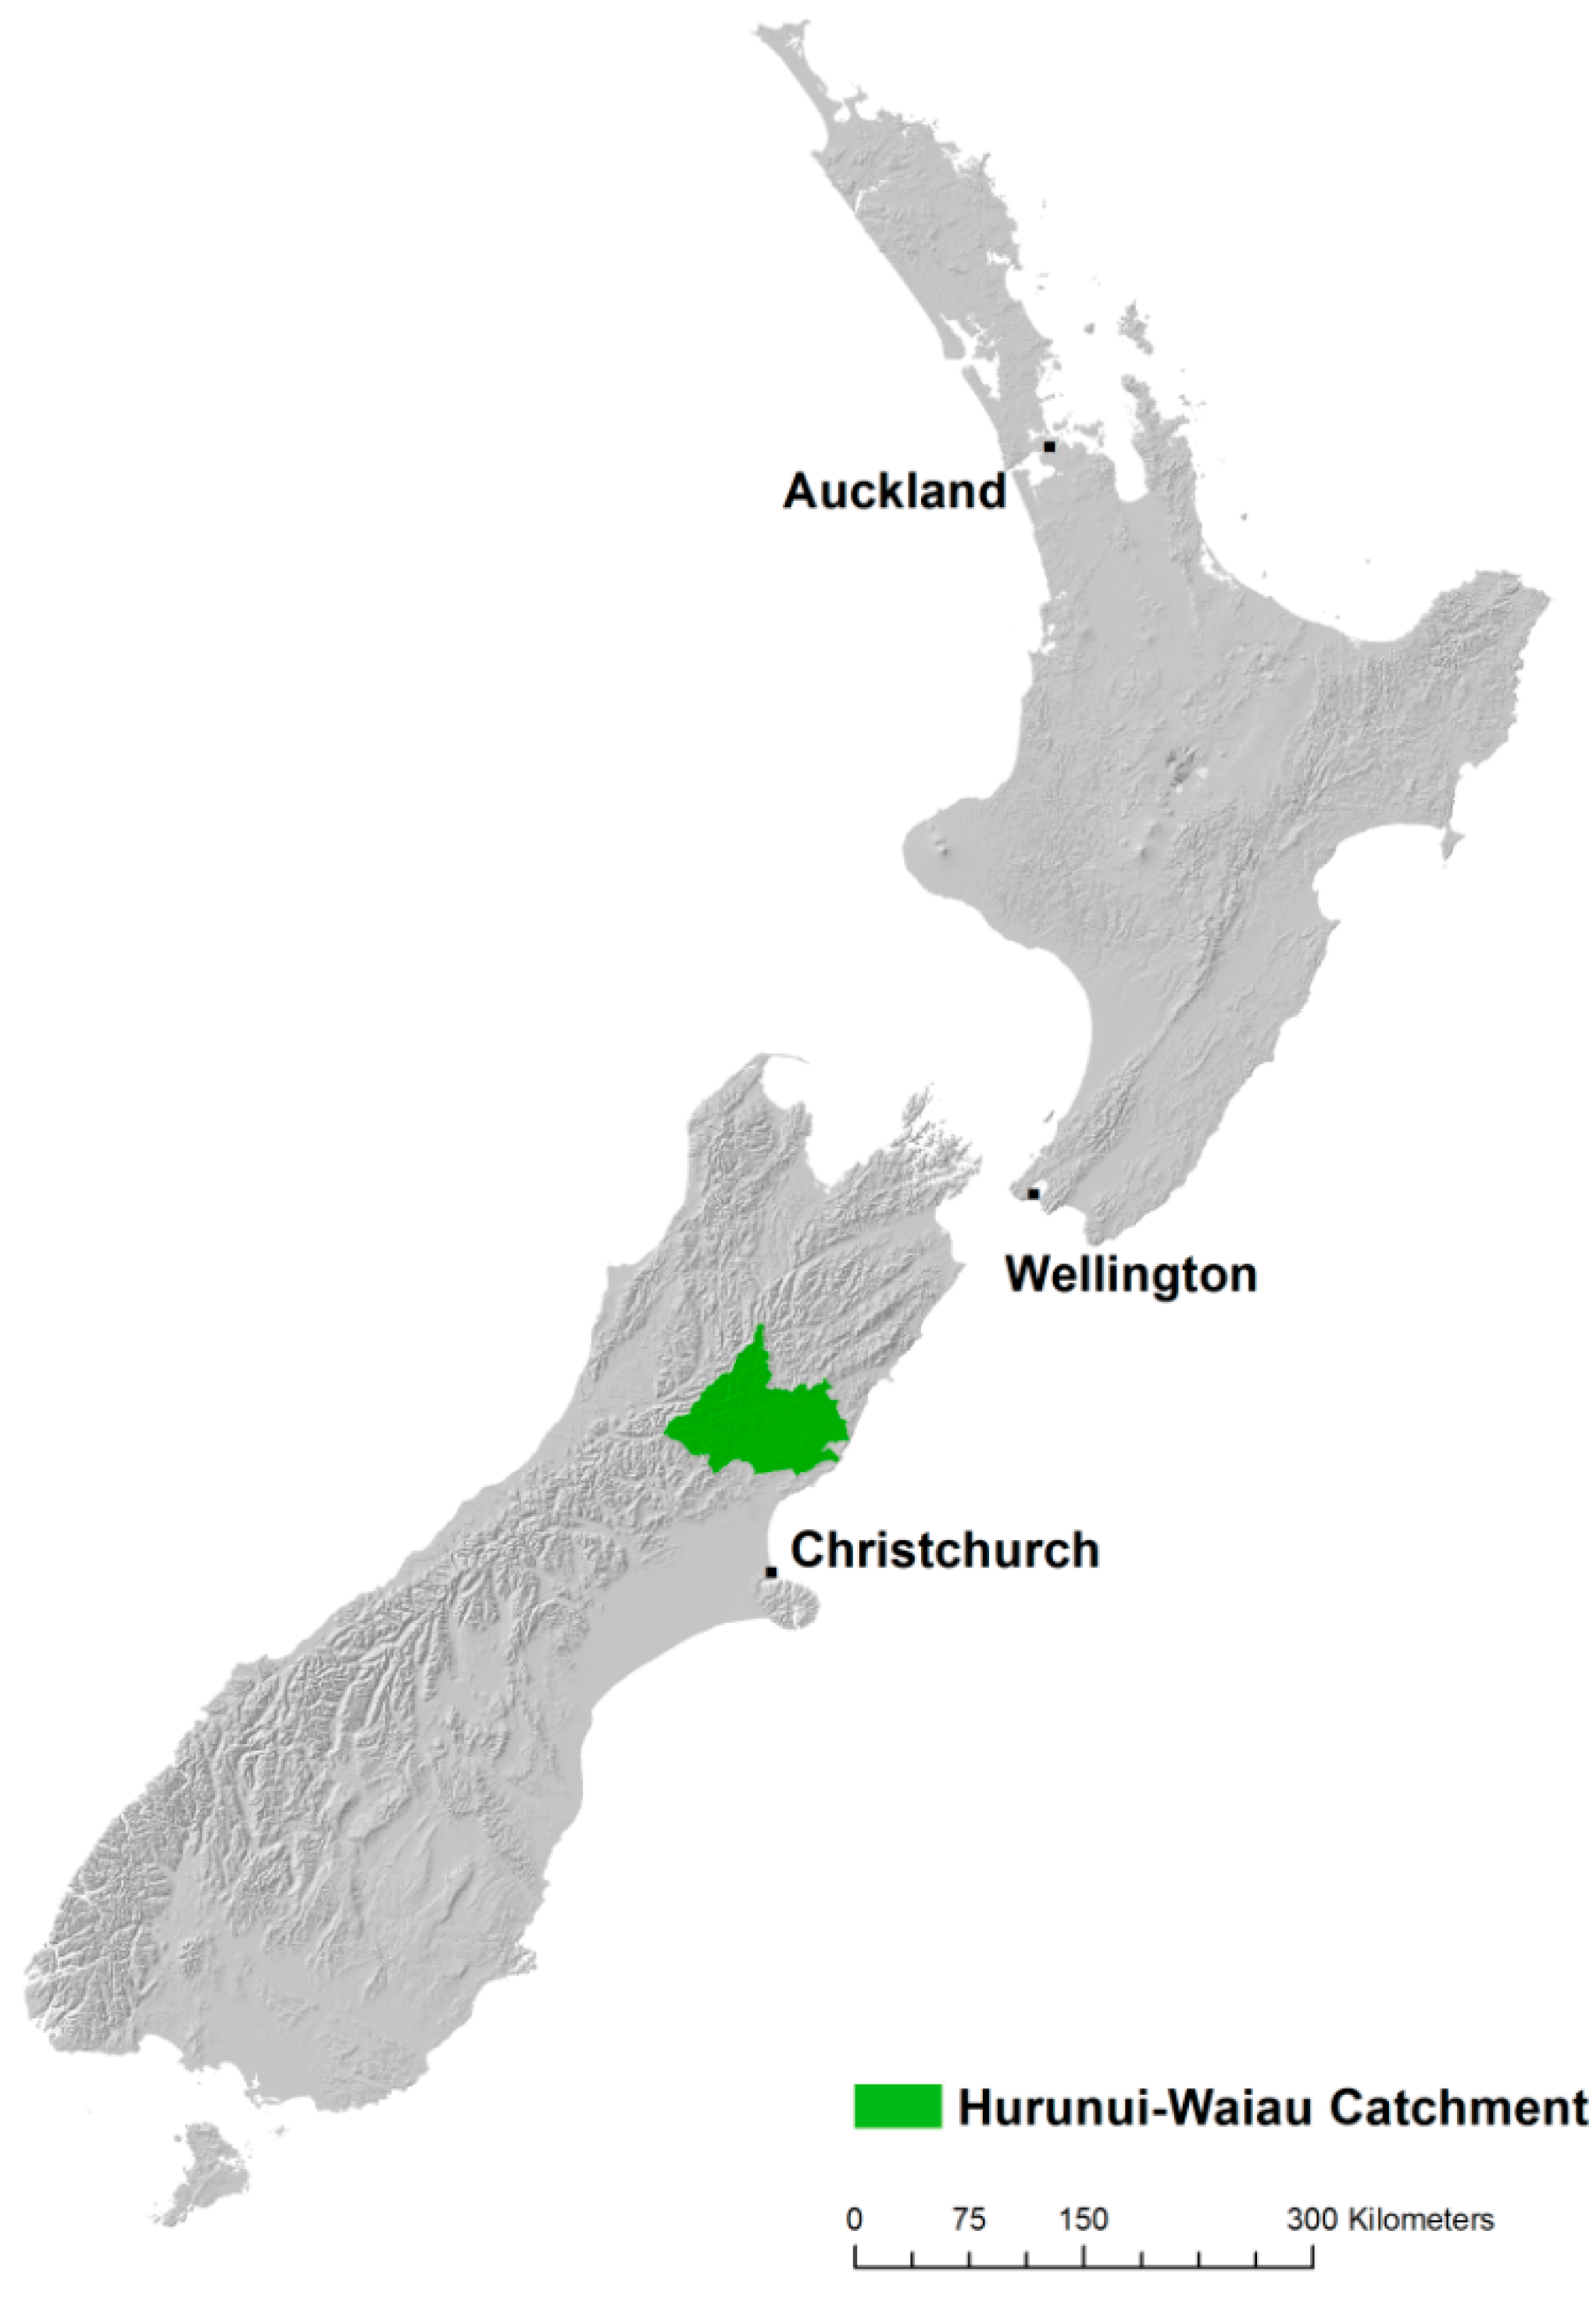
To illustrate the variation in the predicted land use, economic outcomes, and environmental impacts caused by various approaches to assigning farmers’ likelihood of land-use conversion, we explore the effects on landowners in the Hurunui-Waiau catchment in the Canterbury region of New Zealand’s South Island (
Figure 2). These catchments have a large and diverse set of land uses that are expected to see significant changes in the future.
Figure 2.
Location of the Hurunui-Waiau catchment. The catchment is located within the Canterbury region of New Zealand’s South Island. Planners in the catchment anticipate significant changes in land use over the next several decades.
Figure 2.
Location of the Hurunui-Waiau catchment. The catchment is located within the Canterbury region of New Zealand’s South Island. Planners in the catchment anticipate significant changes in land use over the next several decades.
To provide a sample that encompasses the range of possible outcomes, the model was run using 50 simulations for each of the three approaches being investigated (i.e., the homogeneous approach, the network approach, and the survey approach). The results in the following section are based on the averaged values over all 50 simulations for each of the three approaches.
The model covers a time horizon of 50 years with ten incremental time steps, each of which represent five years. The scenario assumes a real annual increase in farm commodity prices (
i.e., milk, meat, and timber) of 2%, which is commensurate with the last 50 years of commodity prices [
84]. Climate and available technology are held constant over the entire model simulation. We note that the economic picture is consistent across scenarios and that the strength of milk prices relative to meat and timber prices produces a trend toward dairy conversion.
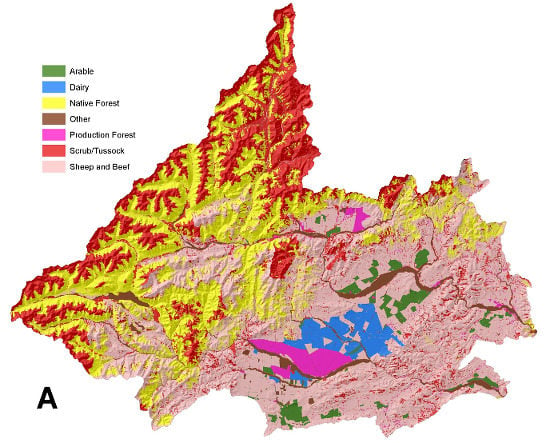
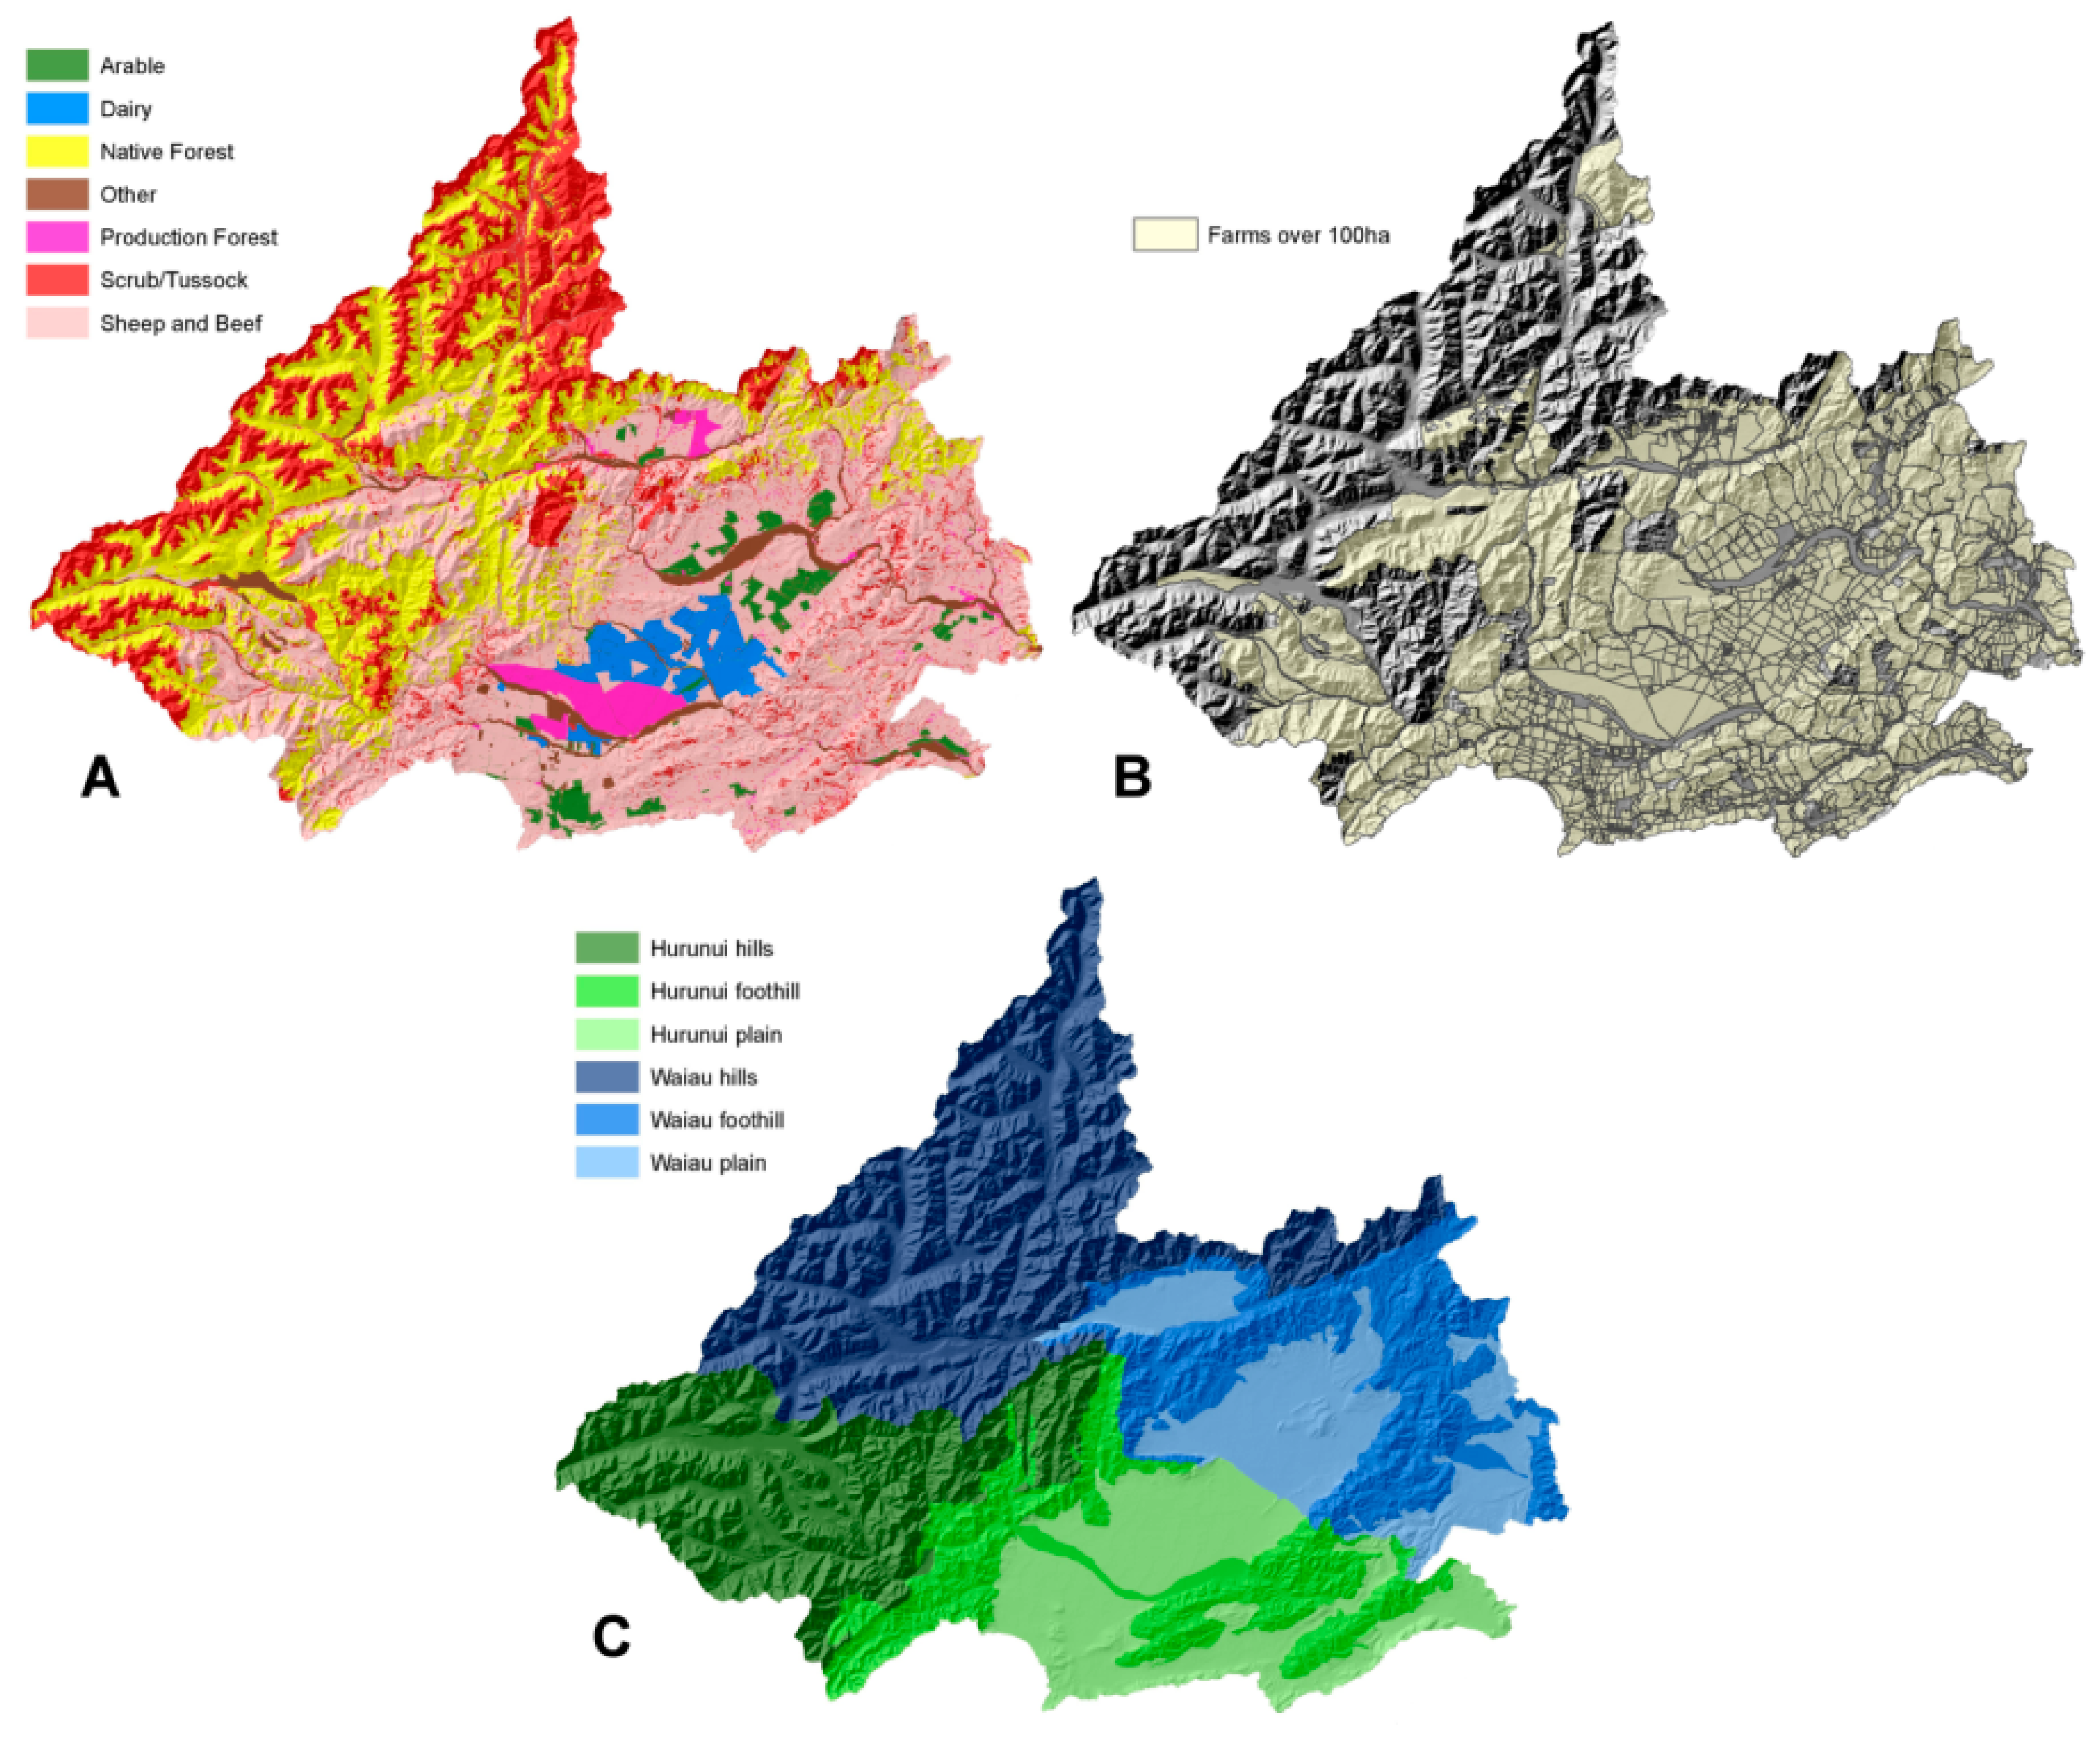
The land-use map used in the model was captured in June 2010 [
85] (
Figure 3a), and although the map includes seven different land uses, the model focuses on the three key enterprises that represent 94% of the productive land available within the catchment: dairy, sheep and beef, and plantation forestry. The cadastral land parcel boundaries used are derived from Land Information New Zealand and represent the cadastral structure of the catchments as at August 2012 (
Figure 3b), which was the closest database to the 2010 land use map. Farmer agents are only created for farms exceeding 100 ha in order to focus on commercially operated enterprises. Productivity zones are delineated by land use classification [
86] and slope and are classified into productivity zones—flats, foothills, or hills (
Figure 3c). Any land owned by the Crown (e.g., native forest) is assumed to be non-productive in use and hence no farmer agent is created.
Figure 3.
Detailed map of the Hurunui-Waiau catchment by (a) 2010 land use; (b) 2012 cadastral land parcels; and (c) productivity zone. The data layers are used within the model to define the initial land use, farm locations and extents, and the expected productivity for each farm.
Figure 3.
Detailed map of the Hurunui-Waiau catchment by (a) 2010 land use; (b) 2012 cadastral land parcels; and (c) productivity zone. The data layers are used within the model to define the initial land use, farm locations and extents, and the expected productivity for each farm.
The landscape provides a range of geospatial information about the catchment being modelled, such as cadastral boundaries, initial land use, and productivity zones. Using the cadastral boundaries, a farmer agent is generated at the centre of each cadastral parcel and makes decisions for the entire cadastral parcel (i.e., farm). This agent holds a range of social and economic attributes such as age, education, and the size of social networks. These attributes are defined empirically for all farmer agents through the Survey of Rural Decision Makers. For the homogeneous and network approaches, each agent’s initial likelihood of land-use conversion is set to 20%; in the case of the survey approach, each agent’s likelihood of land-use conversion is defined econometrically as described above.
For the survey approach, there is significant variation in the farmer agents’ likelihood of land-use conversion between each of the three enterprises.
Table 3 summarises this variation over the 50 randomly generated populations used in the model. Farmers who undertake forestry have the lowest likelihoods of land-use conversion. These values reinforce two characteristics forestry, namely, its low intensity (an average likelihood of de-intensification at 0% highlights a lack of less-intensive options) and that farmers undertaking forestry are less likely to move to more intensive land uses (13% compared with 26% and 31% for sheep and beef and dairy farmers, respectively).
Table 3.
Mean values across the 50 simulations for the survey approach using ARLUNZ. Mean values, standard deviation, and confidence intervals for this figure are available in
Supplementary Material 2.
Table 3.
Mean values across the 50 simulations for the survey approach using ARLUNZ. Mean values, standard deviation, and confidence intervals for this figure are available in Supplementary Material 2.
| | Forestry | Sheep and Beef | Dairy |
|---|
| Intensify | 12.99% | 26.12% | 31.06% |
| De-Intensify | 0.00% | 29.10% | 26.99% |
The simulated likelihoods of land-use conversion to more and less intensive enterprises for sheep and beef farmers are more balanced (26.12% vs. 29.10%, respectively), but sheep and beef farmers are more likely to de-intensify their land use over the next five years. The simulated likelihoods of land-use conversion for dairy farmers highlight the production-focused approach commonly associated with the enterprise: alongside a 27% probability that they will de-intensify their land use, there is a 31% chance that they would further intensify their land use over the next five years. However, the model does not include a more intensive land use, so while this intention is accounted for within the model, it is not currently utilised.
4. Results
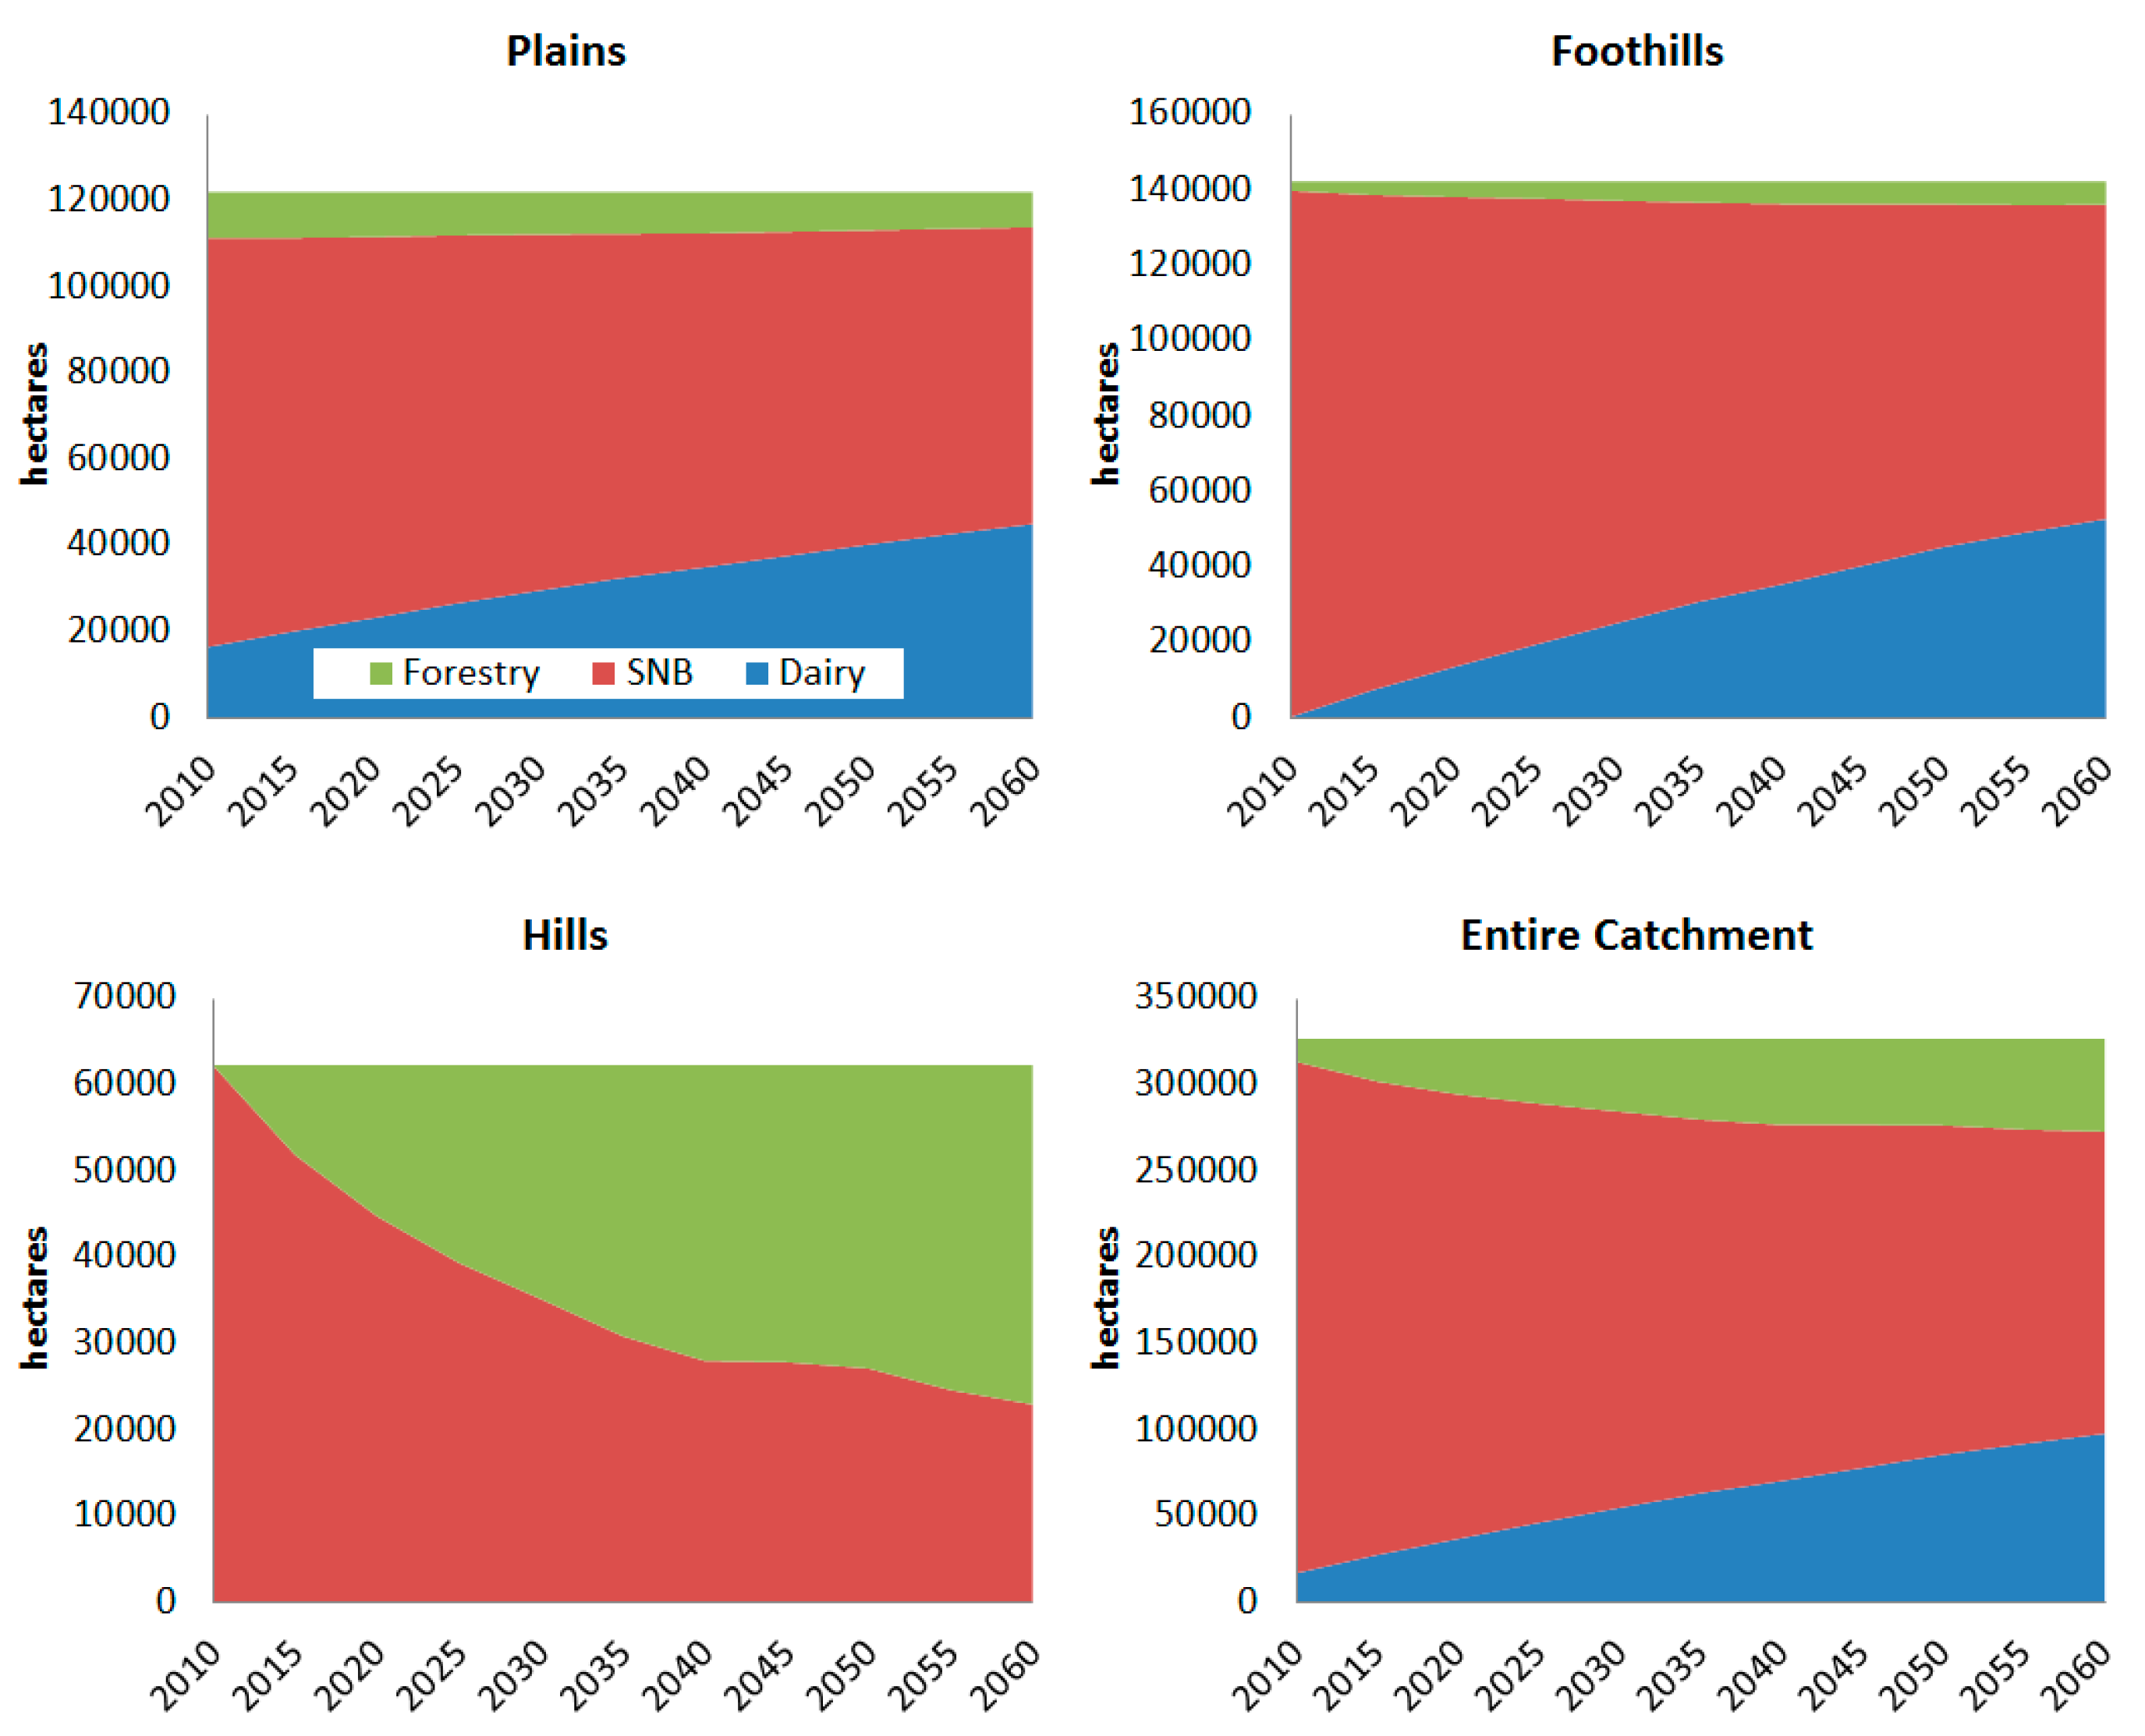
In this section, we compare results obtained after defining the likelihood of land-use conversion in each of the ways described above. At the catchment level, we project that the area of both dairy and forestry will increase over time (
Figure 4). At the production zone level, dairy is estimated to increase in both the plains and foothills, while forestry is estimated to expand in the foothills and hills. The area of sheep and beef farms is estimated to decline in all three productivity zones.
For the homogenous approach, the area allocated to dairy increases from the initial 16,900 ha to 100,450 ha over the 50-year period (with a 95% Confidence Interval, hereafter 95% CI, of 1670 ha). This expansion is split between the highly productive plains region of the catchment and the less productive foothills.
Although such an expansion in dairy is large, it is not unrealistic. For example, the area of land allocated to dairy in Canterbury increased by 172% between 1996 and 2008, and it is projected to expand by an additional 51% by 2020 [
87]. Moreover, the Hurunui-Waiau catchment have already witnessed conversion to dairy as forests in the highly-productive flat areas of the catchment reached harvest age. Third, there are ongoing discussions of implementing the Hurunui Water Project, which would expand the area of irrigated land by an additional 41,500 ha, bringing the total irrigated area of the Hurunui-Waiau catchment to over 72,000 ha [
88].
Figure 4.
Regional land use area for “Homogenous” baseline projection. Mean values, standard deviation, and confidence intervals for this figure are available in
Supplementary Material 3.
Figure 4.
Regional land use area for “Homogenous” baseline projection. Mean values, standard deviation, and confidence intervals for this figure are available in
Supplementary Material 3.
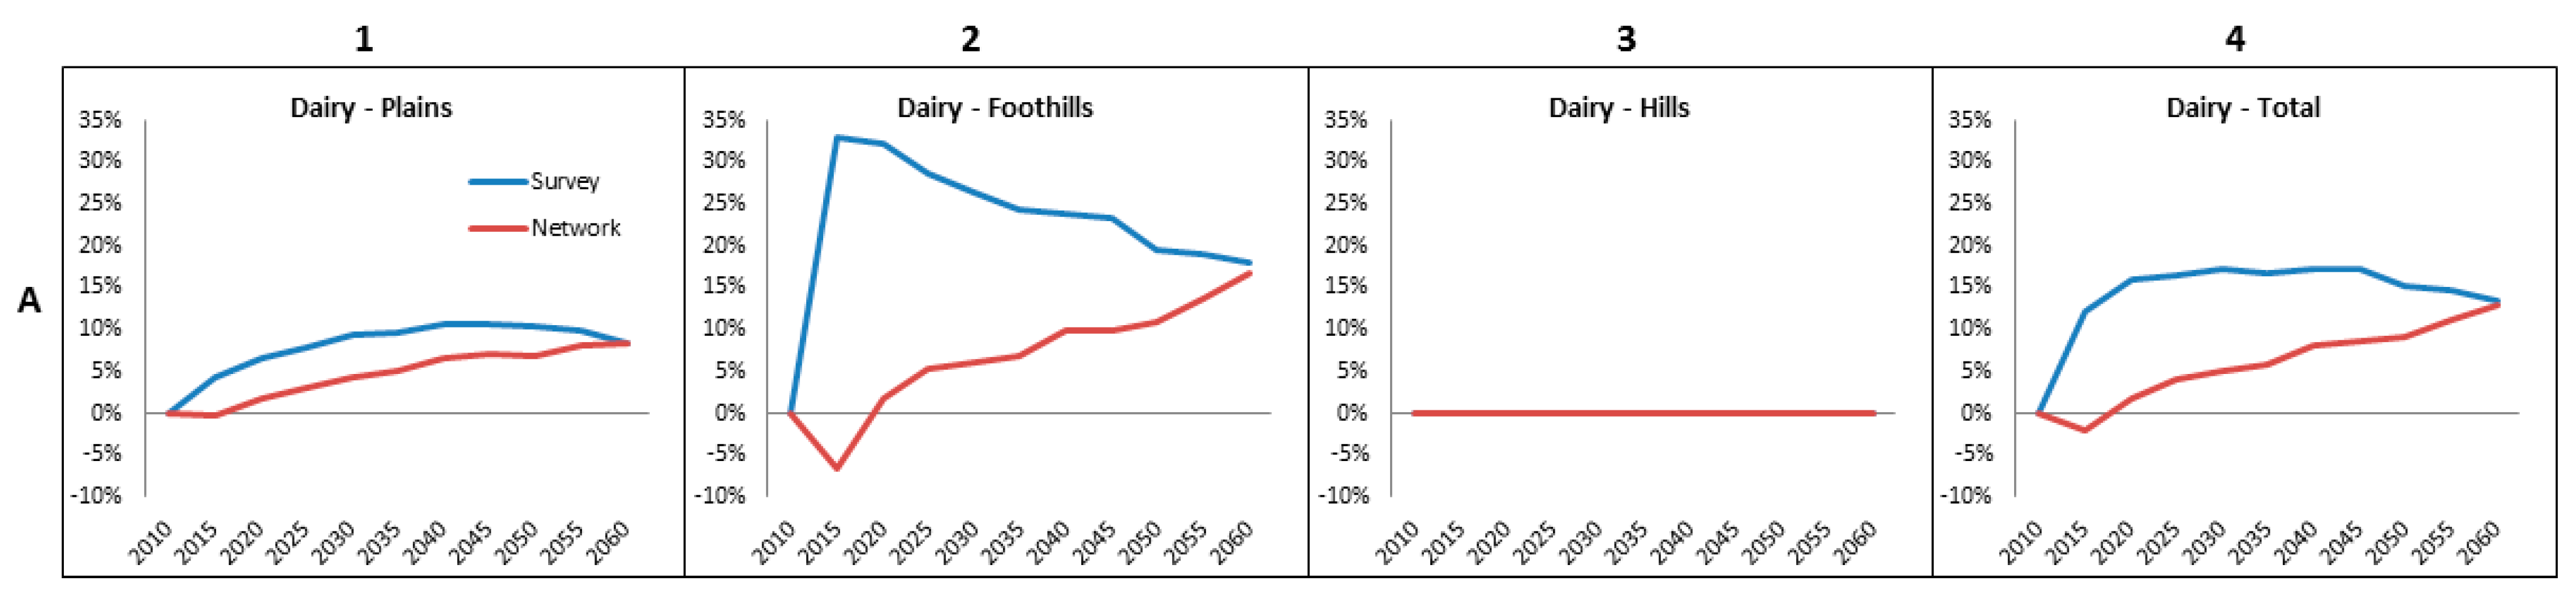
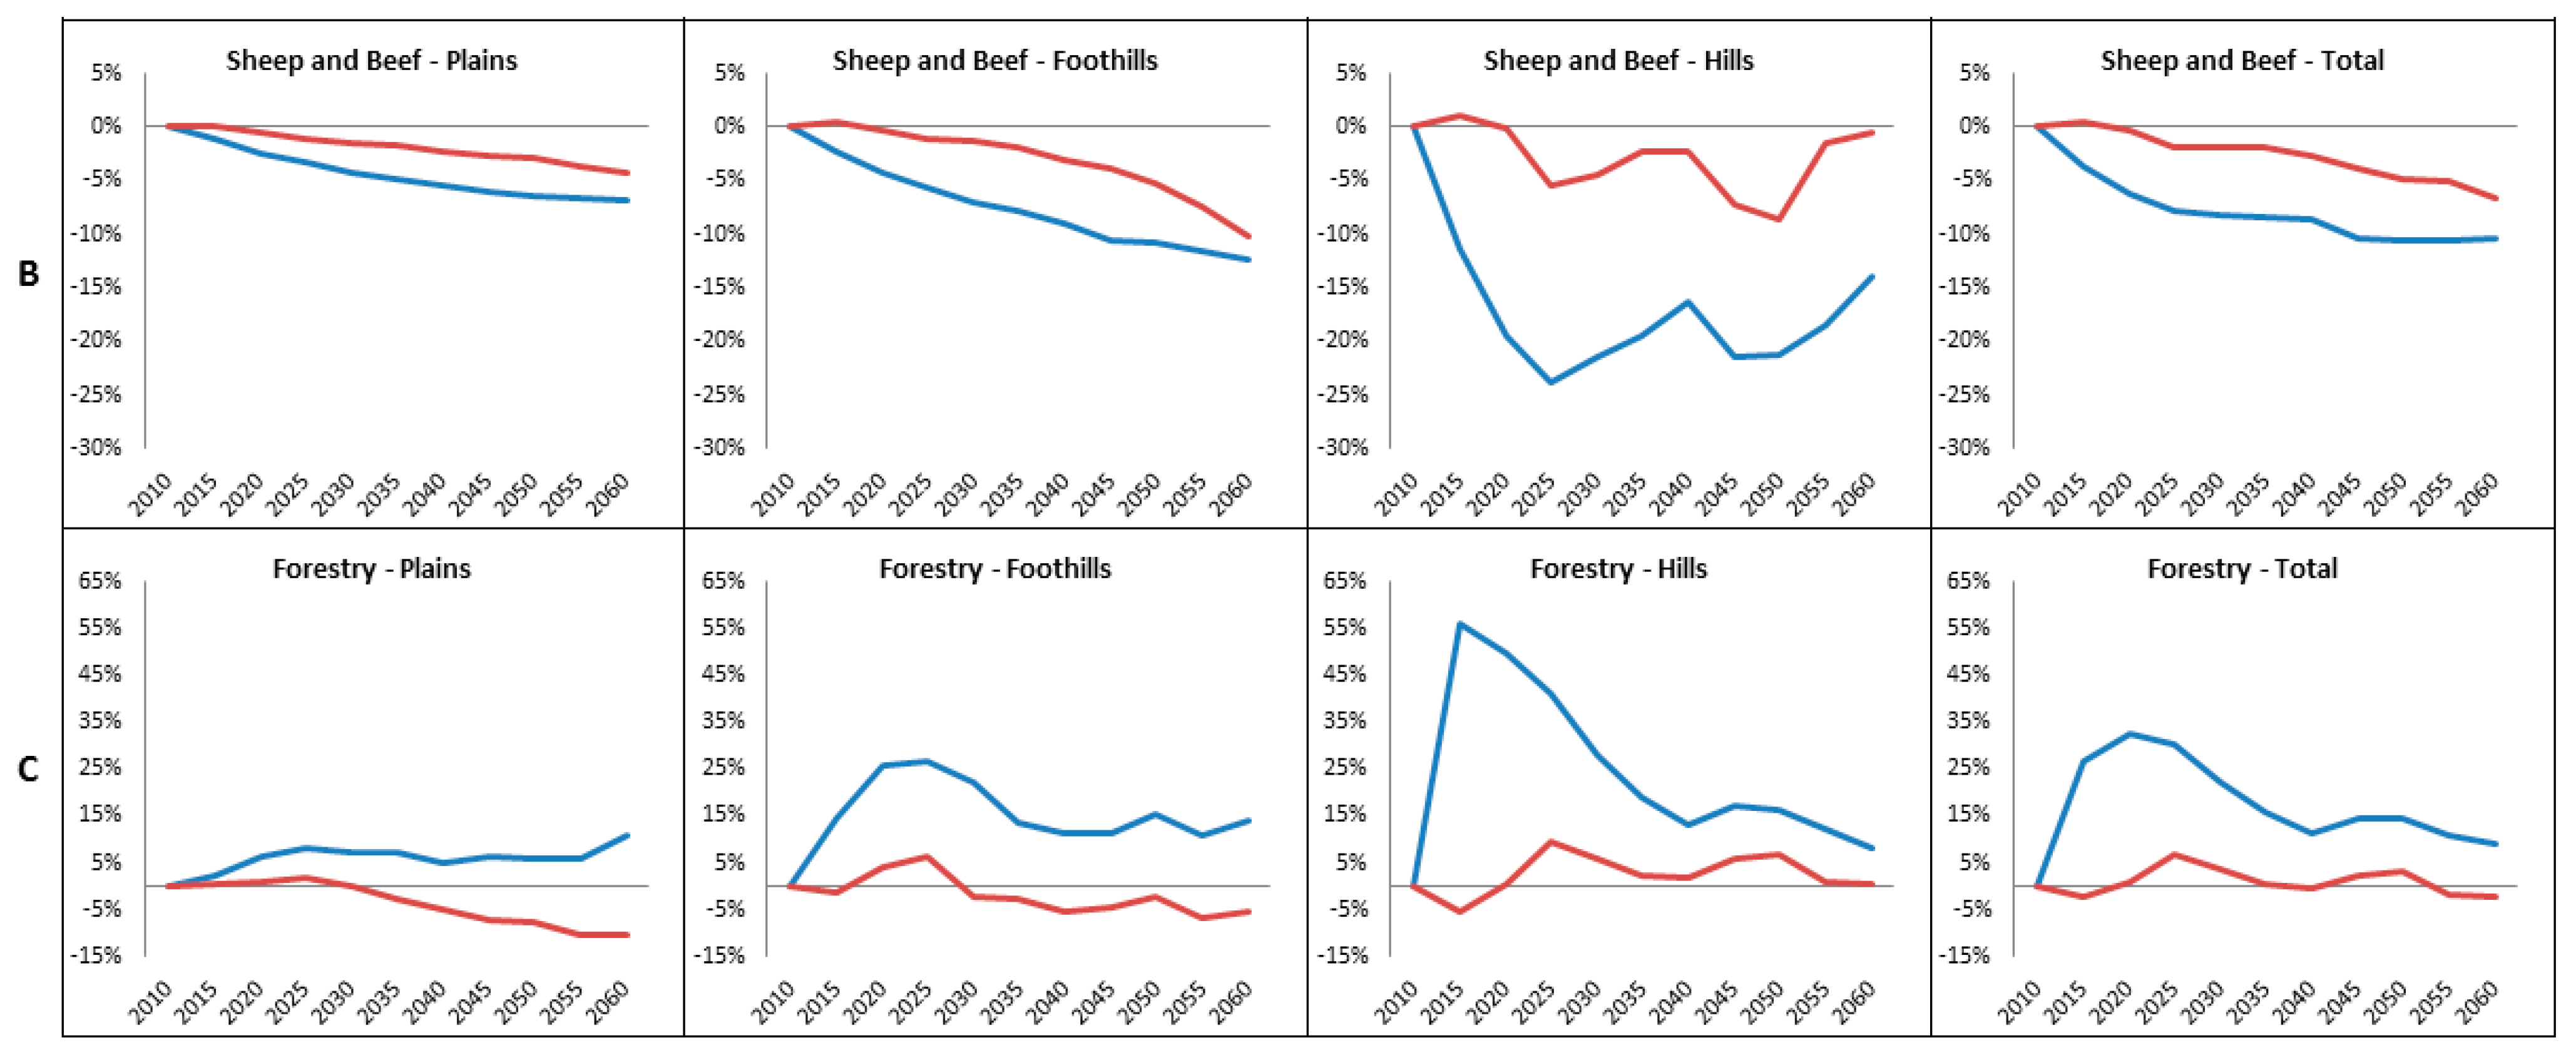
The modelled change in land use relative to the homogeneous approach is shown in
Figure 5. For both dairy and sheep and beef operations, both approaches to defining the likelihood of land-use conversion trend positively and begin to converge by 2060 (
Figure 5, C4). Divergence between the network and survey approaches by 2060 can only be found in forestry and then only for the network approach which results in a level of land use similar to the homogeneous baseline.
Figure 5.
Relative change in regional land use area from “Homogenous” baseline projection. Mean values, standard deviation, and confidence intervals for this figure are available in
Supplementary Material 3.
Figure 5.
Relative change in regional land use area from “Homogenous” baseline projection. Mean values, standard deviation, and confidence intervals for this figure are available in
Supplementary Material 3.
Using a sub-regional scale by productivity zone, the network approach results in impacts that are similar to the homogenous approach. In addition, the survey approach always results in a more rapid change in land use relative to the baseline and to the network approach. Under the survey approach, farmer agents make changes to their farms sooner than under the network approach, which may explain, which explains the rapid growth in dairy in the foothill productivity zone (
Figure 5, A2) and forestry in the hills productivity zone (
Figure 5, C3).
In the model, forestry at a sub-regional scale is significantly affected by the change in approach to define the farmer’s likelihood of land-use conversion. For example, the area of forestry within the plains productivity zone significantly reduces for the network approach when compared with both the survey approach and the homogenous baseline (
Figure 5, C1). This outcome is because the more intensive land uses on the plains (such as dairy or sheep and beef) are more profitable, which is translated into the farmer’s networks, particularly their geographic network. The increased profitability within their geographic network alters the behaviour of the forestry agents to increase the likelihood of their conversion to more intensive land uses.
4.1. Farm Net Revenue
For reference, all monetary figures from the model are reported in 2012 New Zealand dollars. Farm net revenue is estimated to increase over time under all approaches (
Table 4), increasing from $153 million/yr in 2010 to between $745 and $807 million/yr by 2060 (95% CIs of $8 million and $6.8 million respectively). The increase over time stems from the assumption that all commodity prices and yield combinations (
i.e., farm revenue per hectare) increase by 2%/yr and the expansion of dairy. Interestingly, while the survey and network approaches vary, the difference in net revenue for the two approaches at a catchment scale over time is negligible ($807
vs. $804 million/yr by 2060 respectively, with 95% CI’s of $6.8 million/yr and $8.2 million/yr respectively).
Table 4.
Total annual farm profits for Hurunui-Waiau catchment (million NZD/yr). Mean values, standard deviation, and confidence intervals for this figure are available in
Supplementary Material 3.
Table 4.
Total annual farm profits for Hurunui-Waiau catchment (million NZD/yr). Mean values, standard deviation, and confidence intervals for this figure are available in Supplementary Material 3.
| Year | Total | Dairy | Sheep and Beef | Forestry |
|---|
| Homo | Networks | Survey | Homo | Networks | Survey | Homo | Networks | Survey | Homo | Networks | Survey |
|---|
| 2010 | $153 | 0.0% | 0.0% | $30 | 0.0% | 0.0% | $115 | 0.0% | 0.0% | $7 | 0.0% | 0.0% |
| 2020 | $214 | 0.9% | 6.6% | $83 | 1.2% | 15.3% | $110 | 1.8% | –6.8% | $21 | 0.0% | 25.0% |
| 2030 | $308 | 3.1% | 7.8% | $156 | 4.3% | 15.7% | $118 | 1.7% | –10.3% | $34 | 2.9% | 19.0% |
| 2040 | $421 | 4.5% | 8.7% | $246 | 7.2% | 16.0% | $126 | 1.6% | –10.5% | $49 | –2.1% | 9.3% |
| 2050 | $568 | 4.9% | 8.4% | $369 | 7.1% | 14.0% | $139 | 0.0% | –14.9% | $60 | 1.6% | 13.0% |
| 2060 | $745 | 7.3% | 7.7% | $514 | 11.4% | 12.7% | $153 | –3.4% | –15.9% | $78 | –1.3% | 9.3% |
While net revenue at a catchment scale is similar, the distribution in net revenue between the three enterprises differs. Total dairy profits are estimated to increase from $30 million in 2010 to between $514 and $589 million (95% CIs of $9.1 million and $8.3 million respectively) in 2060 (
Table 4). The largest increases are estimated to occur under the survey approach, where annual profits are, on average, 15% larger than under the homogenous approach.
The expansion of forestry in the catchment also yields increased net revenue from an initial $7 million in 2010 to between $77 and $86 million (95% CI of $3.4 million and $3.4 million respectively) in 2060. Again, the survey approach is estimated to yield increased profits (10% or more/yr) relative to the homogenous approach. Profits in sheep and beef farming are estimated to increase from $115 million in 2010 to between $132 and $153 million (95% CI of $2.9 million and $3.3 million respectively) in 2060 even though the area devoted to this land use is expected to contract because of yield and commodity price changes that increases the per hectare revenue of sheep and beef farming.
Interestingly, the distribution in net revenue for sheep and beef under the network approach is estimated to be higher than under the homogenous approach up until 2060 (
Table 4). The opposite is found for the survey approach, which sees a reduction in the level of profit for sheep and beef compared with the baseline.
4.2. Environmental Outputs
As land-use change impacts key environmental indicators, the ARLUNZ model captures a range of environmental outputs such as GHG emissions, forest carbon sequestration, nitrogen (N) and phosphorus (P) loss [
36]. As seen in
Table 5, the expansion of dairy—which often has a higher stocking rate per hectare than sheep and beef—causes an 18% increase in livestock GHG emissions compared with the homogeneous approach. The network and survey approaches show additional livestock GHG emissions of 6% and 3%, respectively.
This growth in livestock GHGs are offset by increases in carbon sequestration through forestry under two of the three approaches. Specifically, the networks approach shows a reduction in forest carbon sequestration of 2% relative to the baseline while the survey approach shows a 9% increase in the amount of carbon sequestered. This result highlights the detrimental effects of the network approach on forestry in more marginal production zones. Even so, the overall expansion of forestry in all three approaches results in a net GHG reduction of between 50% and 68% between 2010 and 2060.
Table 5.
GHG outputs for Hurunui-Waiau catchment (tons/yr). Mean values, standard deviation, and confidence intervals for this figure are available in
Supplementary Material 3.
Table 5.
GHG outputs for Hurunui-Waiau catchment (tons/yr). Mean values, standard deviation, and confidence intervals for this figure are available in Supplementary Material 3.
| Year | Livestock GHGs | Forest Carbon Sequestration | Net GHGs |
|---|
| Homogenous | Network | Survey | Homogenous | Network | Survey | Homogenous | Network | Survey |
|---|
| 2010 | 988,619 | 988,619 | 988,619 | –200,686 | –200,686 | –200,686 | 787,933 | 787,933 | 787,933 |
| 2020 | 1,009,062 | 1,027,099 | 1,007,832 | –517,043 | –502,681 | –677,464 | 492,020 | 524,418 | 330,368 |
| 2030 | 1,052,232 | 1,080,009 | 1,060,729 | –682,562 | –697,085 | –833,184 | 369,670 | 382,924 | 227,545 |
| 2040 | 1,080,496 | 1,125,738 | 1,113,336 | –807,773 | –792,856 | –896,421 | 272,723 | 332,881 | 216,915 |
| 2050 | 1,134,640 | 1,179,598 | 1,164,413 | –810,228 | –821,304 | –930,562 | 324,412 | 358,294 | 233,851 |
| 2060 | 1,166,265 | 1,238,713 | 1,201,127 | –867,407 | –847,212 | –947,868 | 298,859 | 391,501 | 253,259 |
In contrast, the expansion of dairy farming in the plains and foothills, results in a large increase in nutrient loadings that could impact the environmental quality of the local waterways (
Table 6). We estimate that N and P will increase by 86% and 43%, respectively, over the next 50 years under the homogenous baseline. The networks approach predicts increases in both N and P by an additional 8% relative to the baseline, while the survey approach predicts additional increases of 8% and 5%, respectively. Consequently, while the expansion of dairy farming in the catchment produces economic benefits, the negative impacts on water quality are non-negligible.
Table 6.
Nitrogen and Phosphorus outputs for Hurunui-Waiau catchment (tons/yr). Mean values, standard deviation, and confidence intervals for this figure are available in
Supplementary Material 3.
Table 6.
Nitrogen and Phosphorus outputs for Hurunui-Waiau catchment (tons/yr). Mean values, standard deviation, and confidence intervals for this figure are available in Supplementary Material 3.
| Year | Nitrogen | Phosphorus |
|---|
| Homogenous | Network | Survey | Homogenous | Network | Survey |
|---|
| 2010 | 4039 | 4039 | 4039 | 37 | 37 | 37 |
| 2020 | 4899 | 4970 | 5171 | 40 | 41 | 41 |
| 2030 | 5701 | 5882 | 6115 | 44 | 45 | 45 |
| 2040 | 6339 | 6652 | 6899 | 46 | 49 | 49 |
| 2050 | 7009 | 7370 | 7599 | 50 | 53 | 53 |
| 2060 | 7517 | 8136 | 8111 | 53 | 57 | 56 |
5. Conclusions
We anticipated that the two different approaches to defining the likelihood of land-use change would significantly affect model outcomes. However, the results from this experiment show that the approach has a limited effect at a catchment scale for both the distribution of land use and the resulting total net revenue. Nevertheless, the differing distributions of land use across productivity zones suggest that the approach to estimating the likelihood of land-use change ultimately does matter.
Simulating the social process of information transfer between agents through the network approach resulted in less economically optimal land use for all three enterprises. For dairy, the network approach predicts less conversion vis-à-vis the survey approach. Still, results for both approaches converge by 2060.
The network approach to defining the likelihood of land-use change profoundly impacts model outcomes for sheep and beef farmers in the hill productivity zone. Within this zone, it appears that the level of productivity is very similar at a per hectare level for each sheep and beef farmer. This similarity of profitability for these farmer agents reduces the likelihood of conversion to the more profitable enterprise of forestry within the network approach. For the small amount of forestry on the highly productive plains in the initial state of the model, the network approach enabled the farmer agents to easily recognise significant increases in average net revenue if they converted to different enterprises, primarily dairy. This resulted in a steady decrease in the area of forestry on the plains. In the foothill zone, many sheep and beef farms convert to dairy.
Defining the agents’ likelihood of land-use conversion through the survey approach provides greater deviation from the baseline for all sub-regional results. This deviation is particularly evident in the early steps of the model simulation, where variations in area of up to 55% compared with the baseline are observed. This result highlights the design of the survey approach, where land that suits the two ends of the spectrum of land-use intensity—dairy and forestry—quickly sees the influx of new farms, in contrast to the slow changes that occur under the network approach.
The results for the survey approach highlight two interesting observations. First, even with the significant increase in net revenue when converting forestry to other enterprises in the plains productivity zone, the amount of forestry in this zone increases under the survey approach. This result is embedded in the initial land-use conversion values defined for a move to a more intensive enterprise. For example, regardless of the significant increase in net revenue, the survey found that foresters are unlikely to convert to a more intensive enterprise, highlighting the static nature of the survey approach, which—unlike the dynamic network approach—is unable to account for changes in preference over time.
A second interesting result is the fact that substantively different approaches to defining the likelihood of land-use conversion produce similar trends. This observation raises questions that cannot be fully answered in this paper: If the attributes of a population can be reliability and accurately captured through surveys, can the agent-based model that uses these data be simplified by removing the need to simulate social processes? And would this facilitate greater uptake among end users because the process used to define behaviour within an agent-based model is easier to understand?
Malanson and Walsh [
29] recently noted the problems of calibration and validation stemming from complex interactions in agent-based models. While agreeing that the challenge for applied agent-based models is in correctly parametrising the agents, we found that the survey approach provided enough detail to generate reliable populations of agents and did not over parametrise the model.
We believe that model design should be informed by model purpose. Where comprehensive surveys are available, we advocate using empirical data to define an agent’s likelihood of a type of behaviour. However, if there is limited information about the size and importance of a farmer’s social and geographical networks or if a key purpose of the model is to account for the effects of these networks, then developing the structure within the model to simulate, test, and document the effects of changes in the networks is preferred.
For LULCC models—especially those in applied settings—exploring the impacts of different approaches to modelling the likelihood of land-use conversion is critical. Understanding the effects of key model parameters on economic, social, and environmental factors will facilitate the continued acceptance of ABM of LULCC among end users and will improve the results generated by both the economic and geographic ABMs of LULCC. While the results outlined here will not fully resolve the disciplinary differences, they do outline the need to account for heterogeneity in the predicted agent behaviours for both disciplines.


