
Why Don’t More Farmers Go Organic? Using A Stakeholder-Informed Exploratory Agent-Based Model to Represent the Dynamics of Farming Practices in the Philippines

Abstract
:1. Introduction
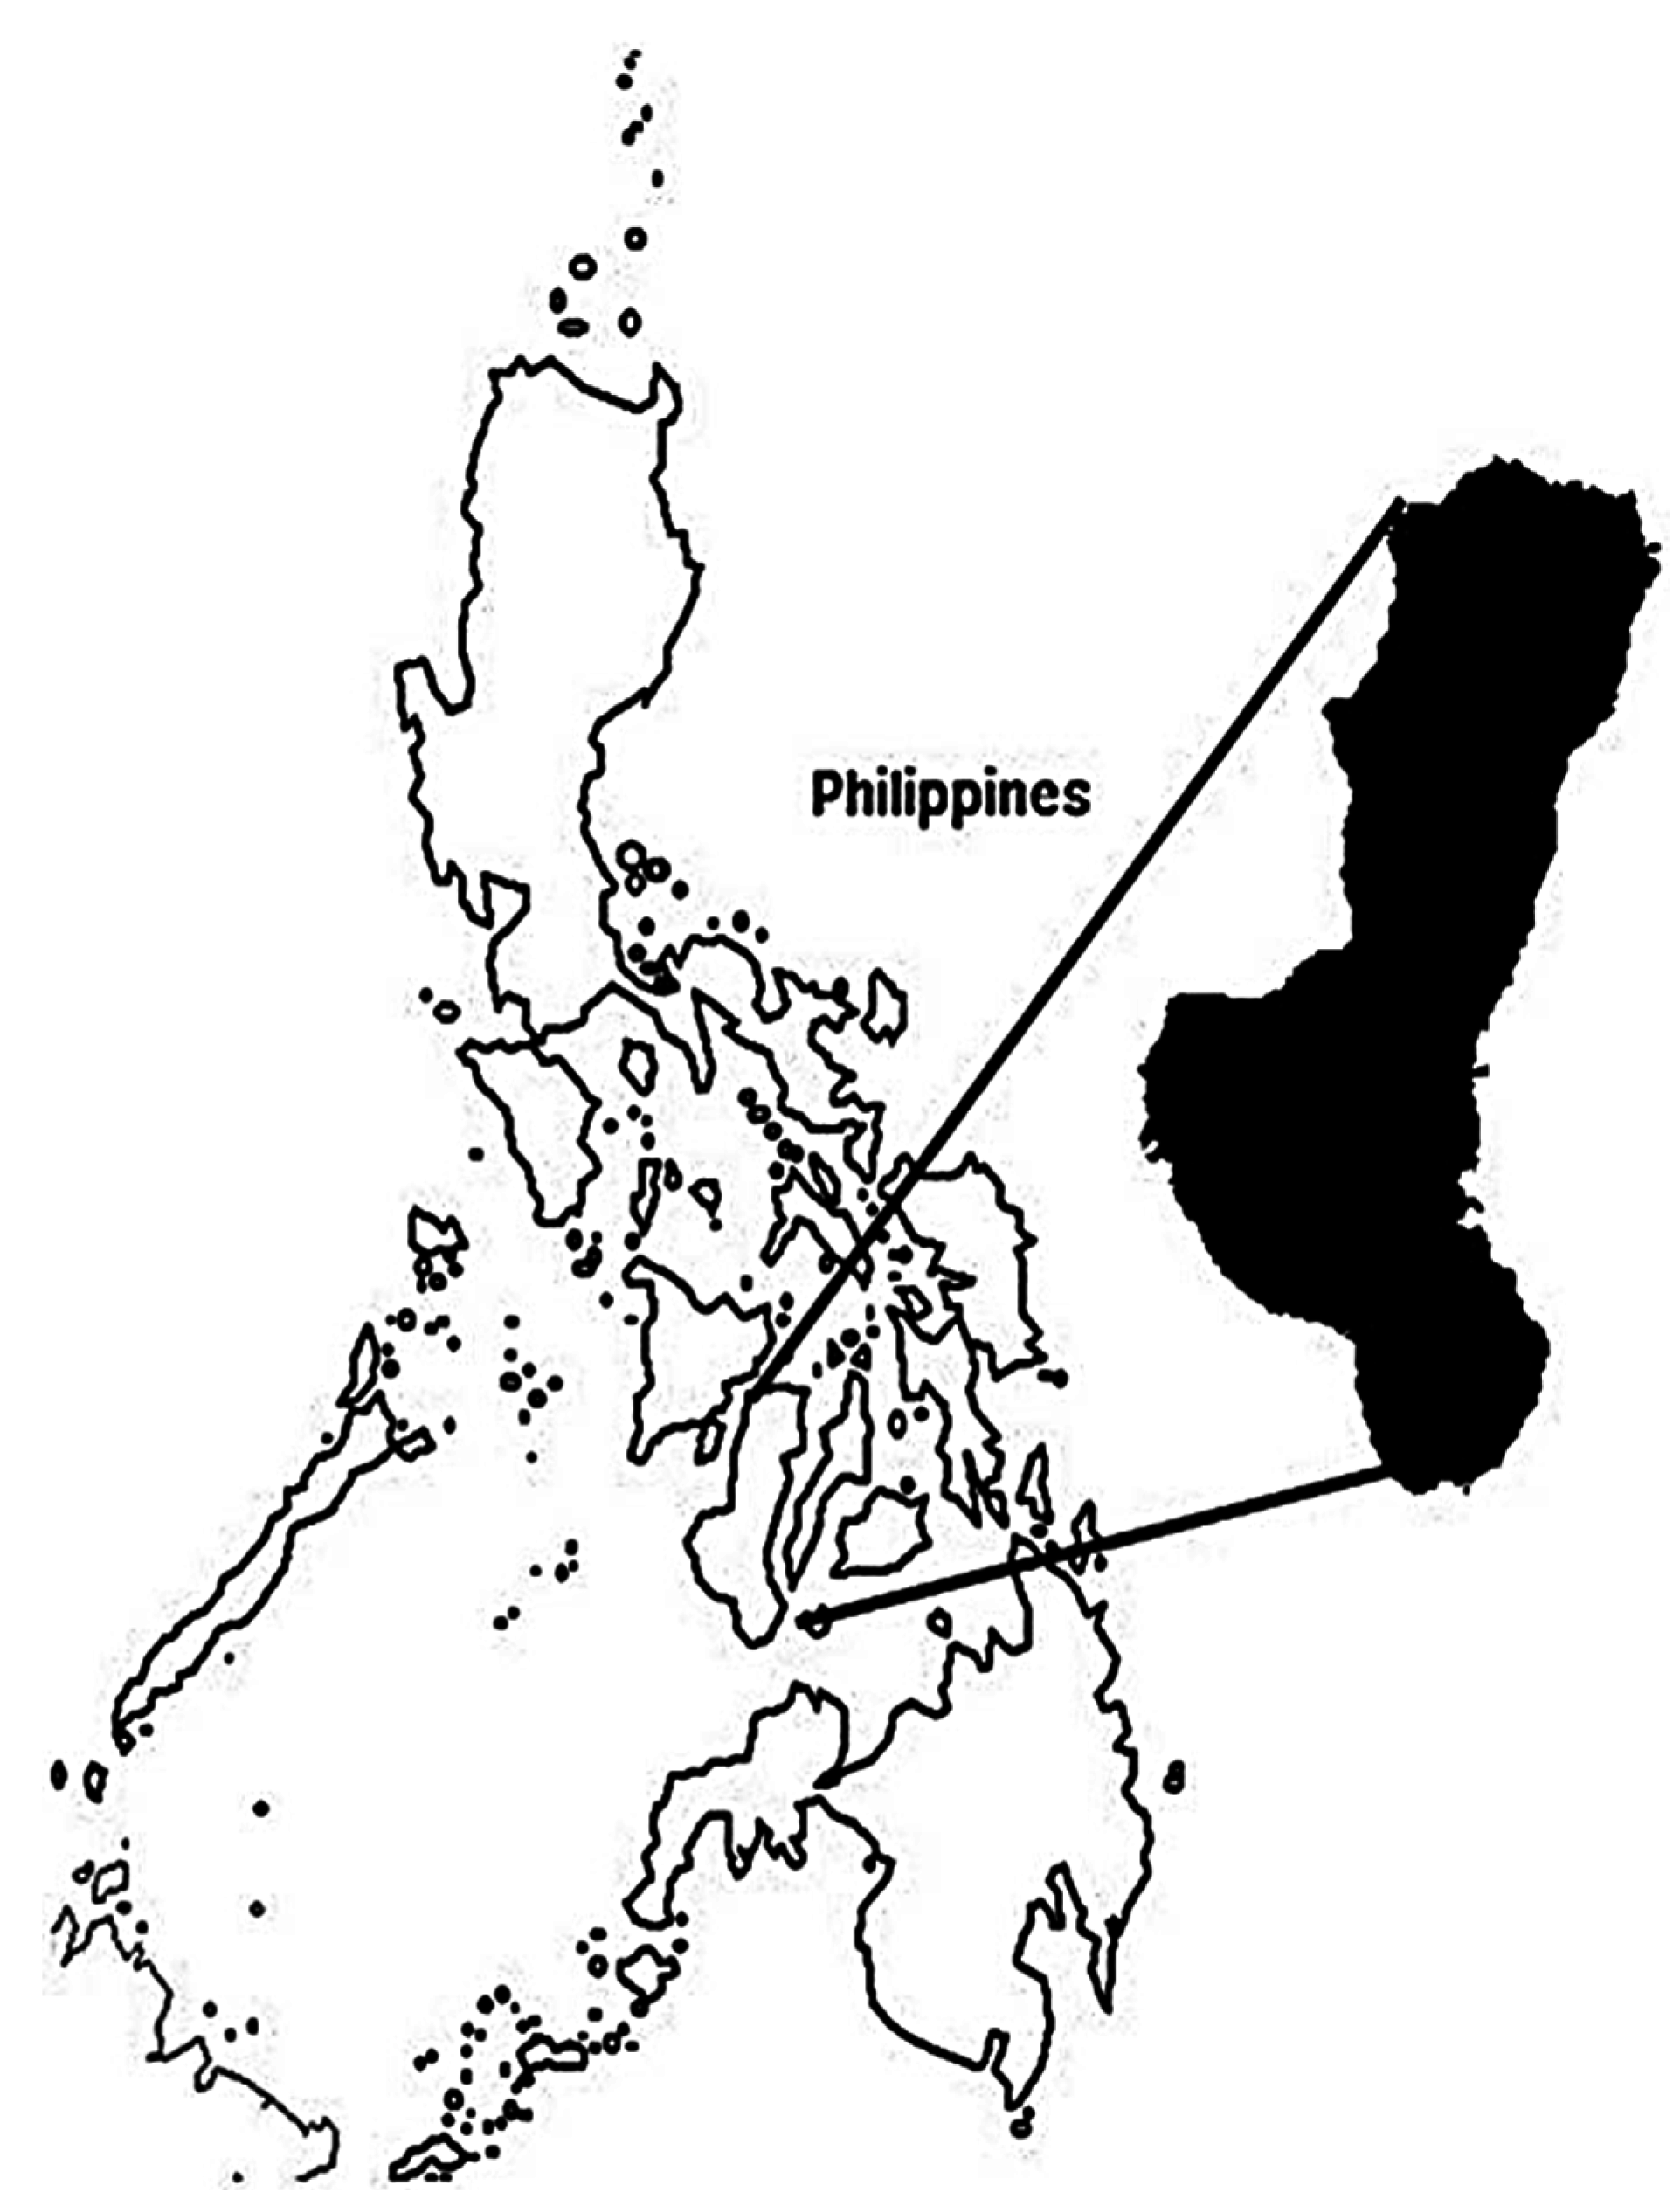
2. Study Area and Research Questions

3. Data Collection
Focus Group Discussions and Model Parameterization

4. Methods
4.1. Agent-Based Model
4.1.1. Farmer Agent Specification

| Input Factor | Definition and Units | Distribution |
|---|---|---|
| Area of land (a) | Hectares | U = (0.25, 10) |
| Labor availability (la) | People in household | D = {1, 2, 3, …, 8} |
| Social reach (sr) | Distance in agent’s social space (unitless) | U = (5, 25) |
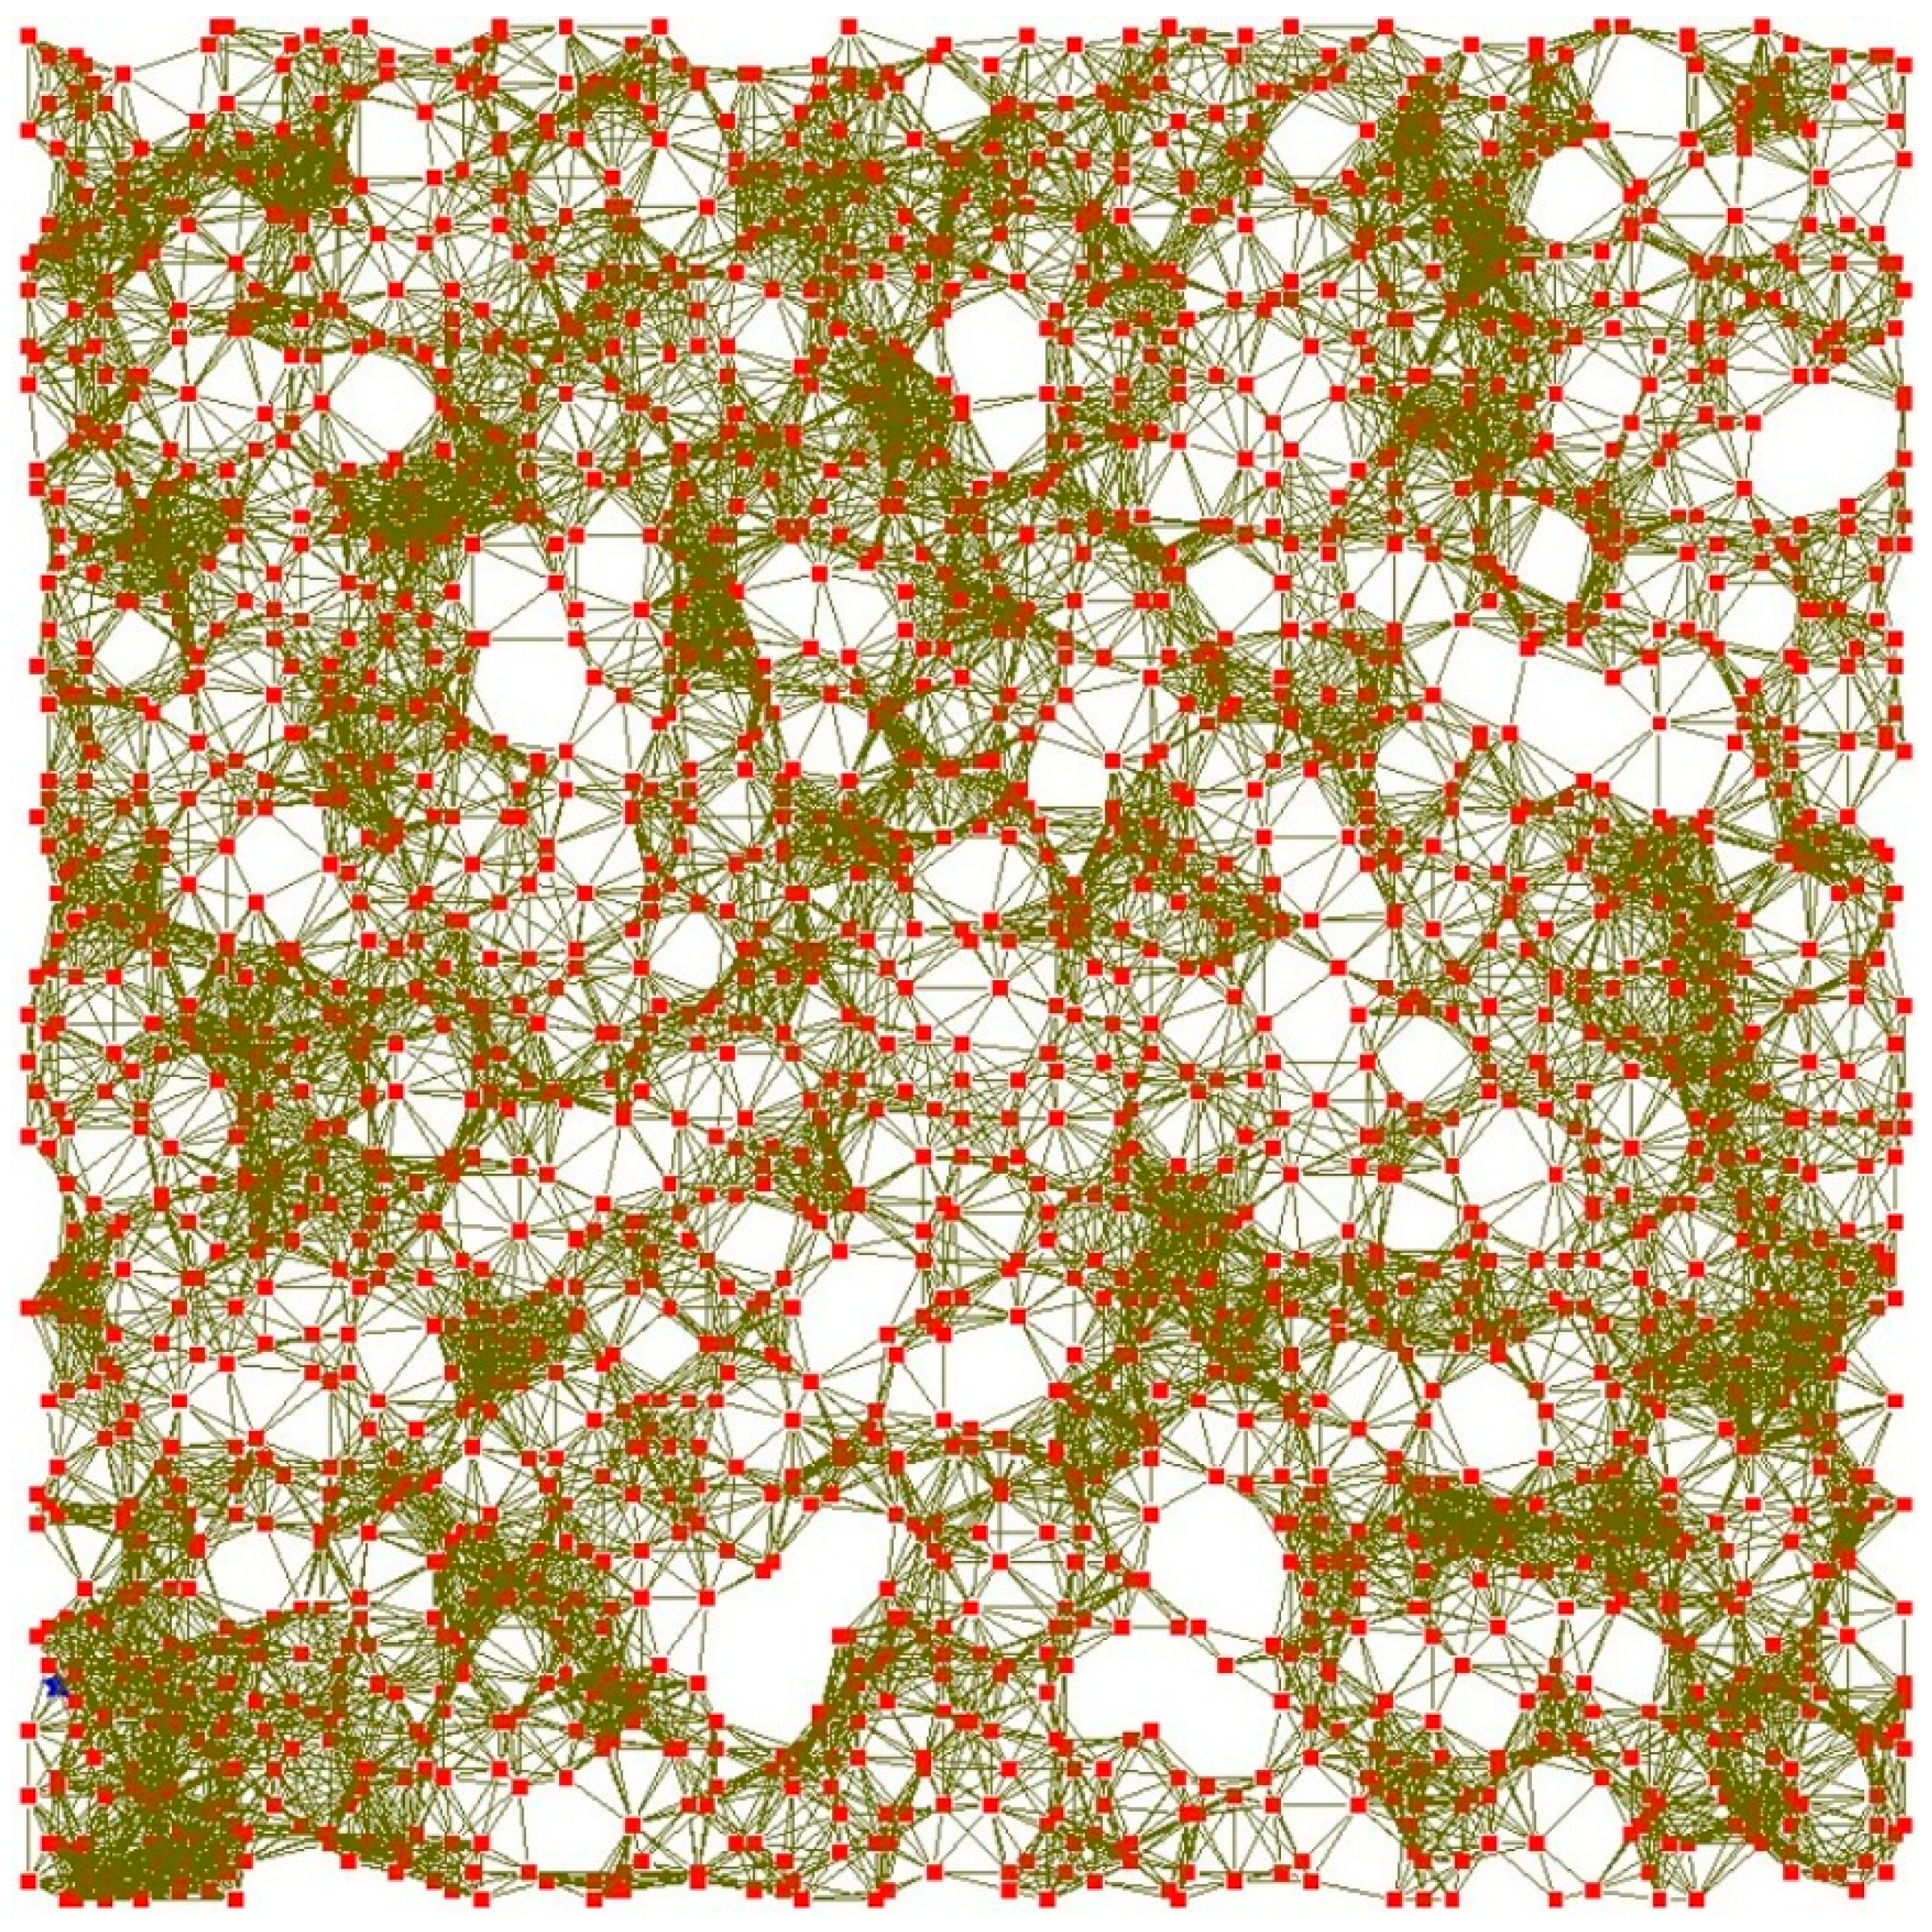
| Social influence (si) | Density of social connections among agents | D = {1, 2, 3, …, 30} |
| Animal ownership (ao) | Proportion of farmers owning animals (unitless) | U = (0, 1) |
| Patience (p) | Number of farming seasons (3 seasons/year) | D = {1, 2, 3, …, 15} |
| Risk taken (r) | Attitude towards risk related with the adoption of organic farming (unitless) | U= (0, 1) |
| Cost of conventional fertilizer (ccf) | Philippine Pesos per kilo | U = (40, 400) |
| Cost of organic fertilizer (cof) | Philippine pesos per kilo | U = (40, 400) |
| Average cost of other conventional input (coci) | Philippine pesos per hectare | U = (3000, 7500) |
| Average cost of other organic input (cooi) | Philippine pesos per hectare | U = (1100, 2900) |
| Average cost of labor (cl) | Philippine pesos | U = (6000, 13,000) |
| Average price of rice (p) | Philippine pesos per kilo | U = (7.44, 17.86) |
| Average yield (y) | Kilos per hectare | U = (1200, 6000) |
| Organic fertilizer threshold (oft) | Hectares | U = (0,10) |
| Land area for one labor (lal) | Hectares/person | U = (0.1,10) |

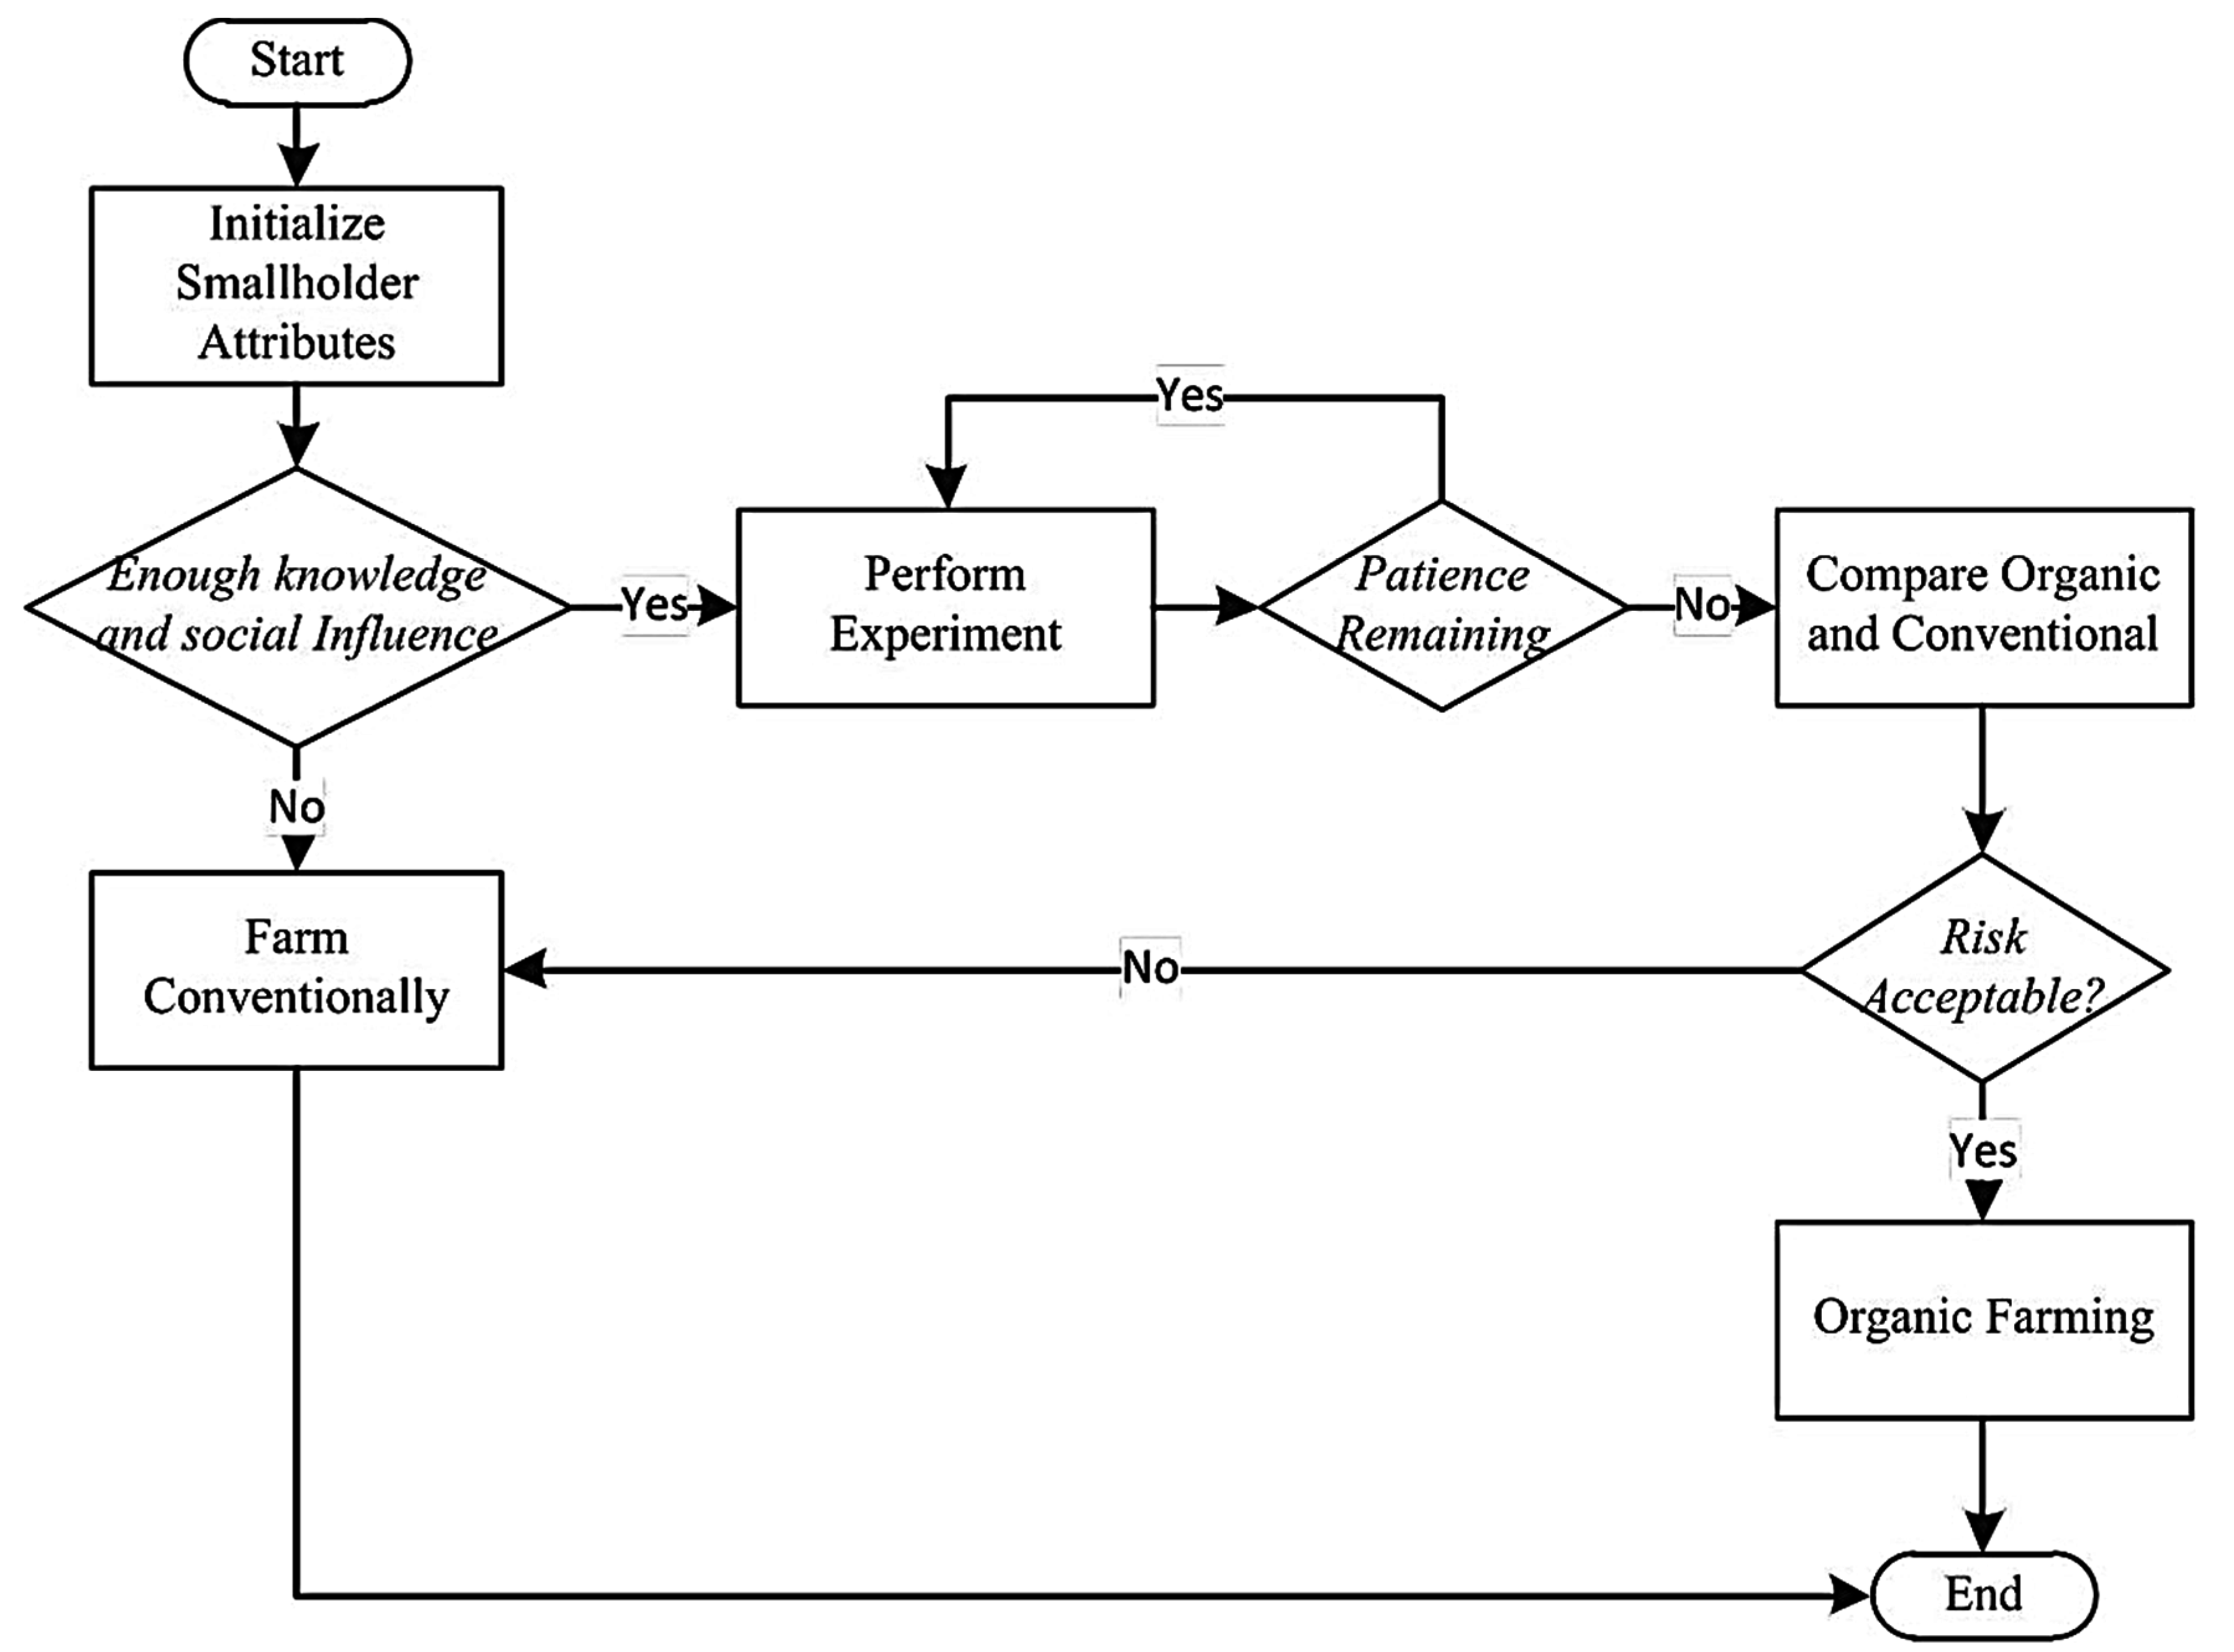
4.1.2. Decision Algorithm
4.2. Exploring Model Outcome Variability with Sensitivity Analysis
4.3. Computational Experiments
5. Results
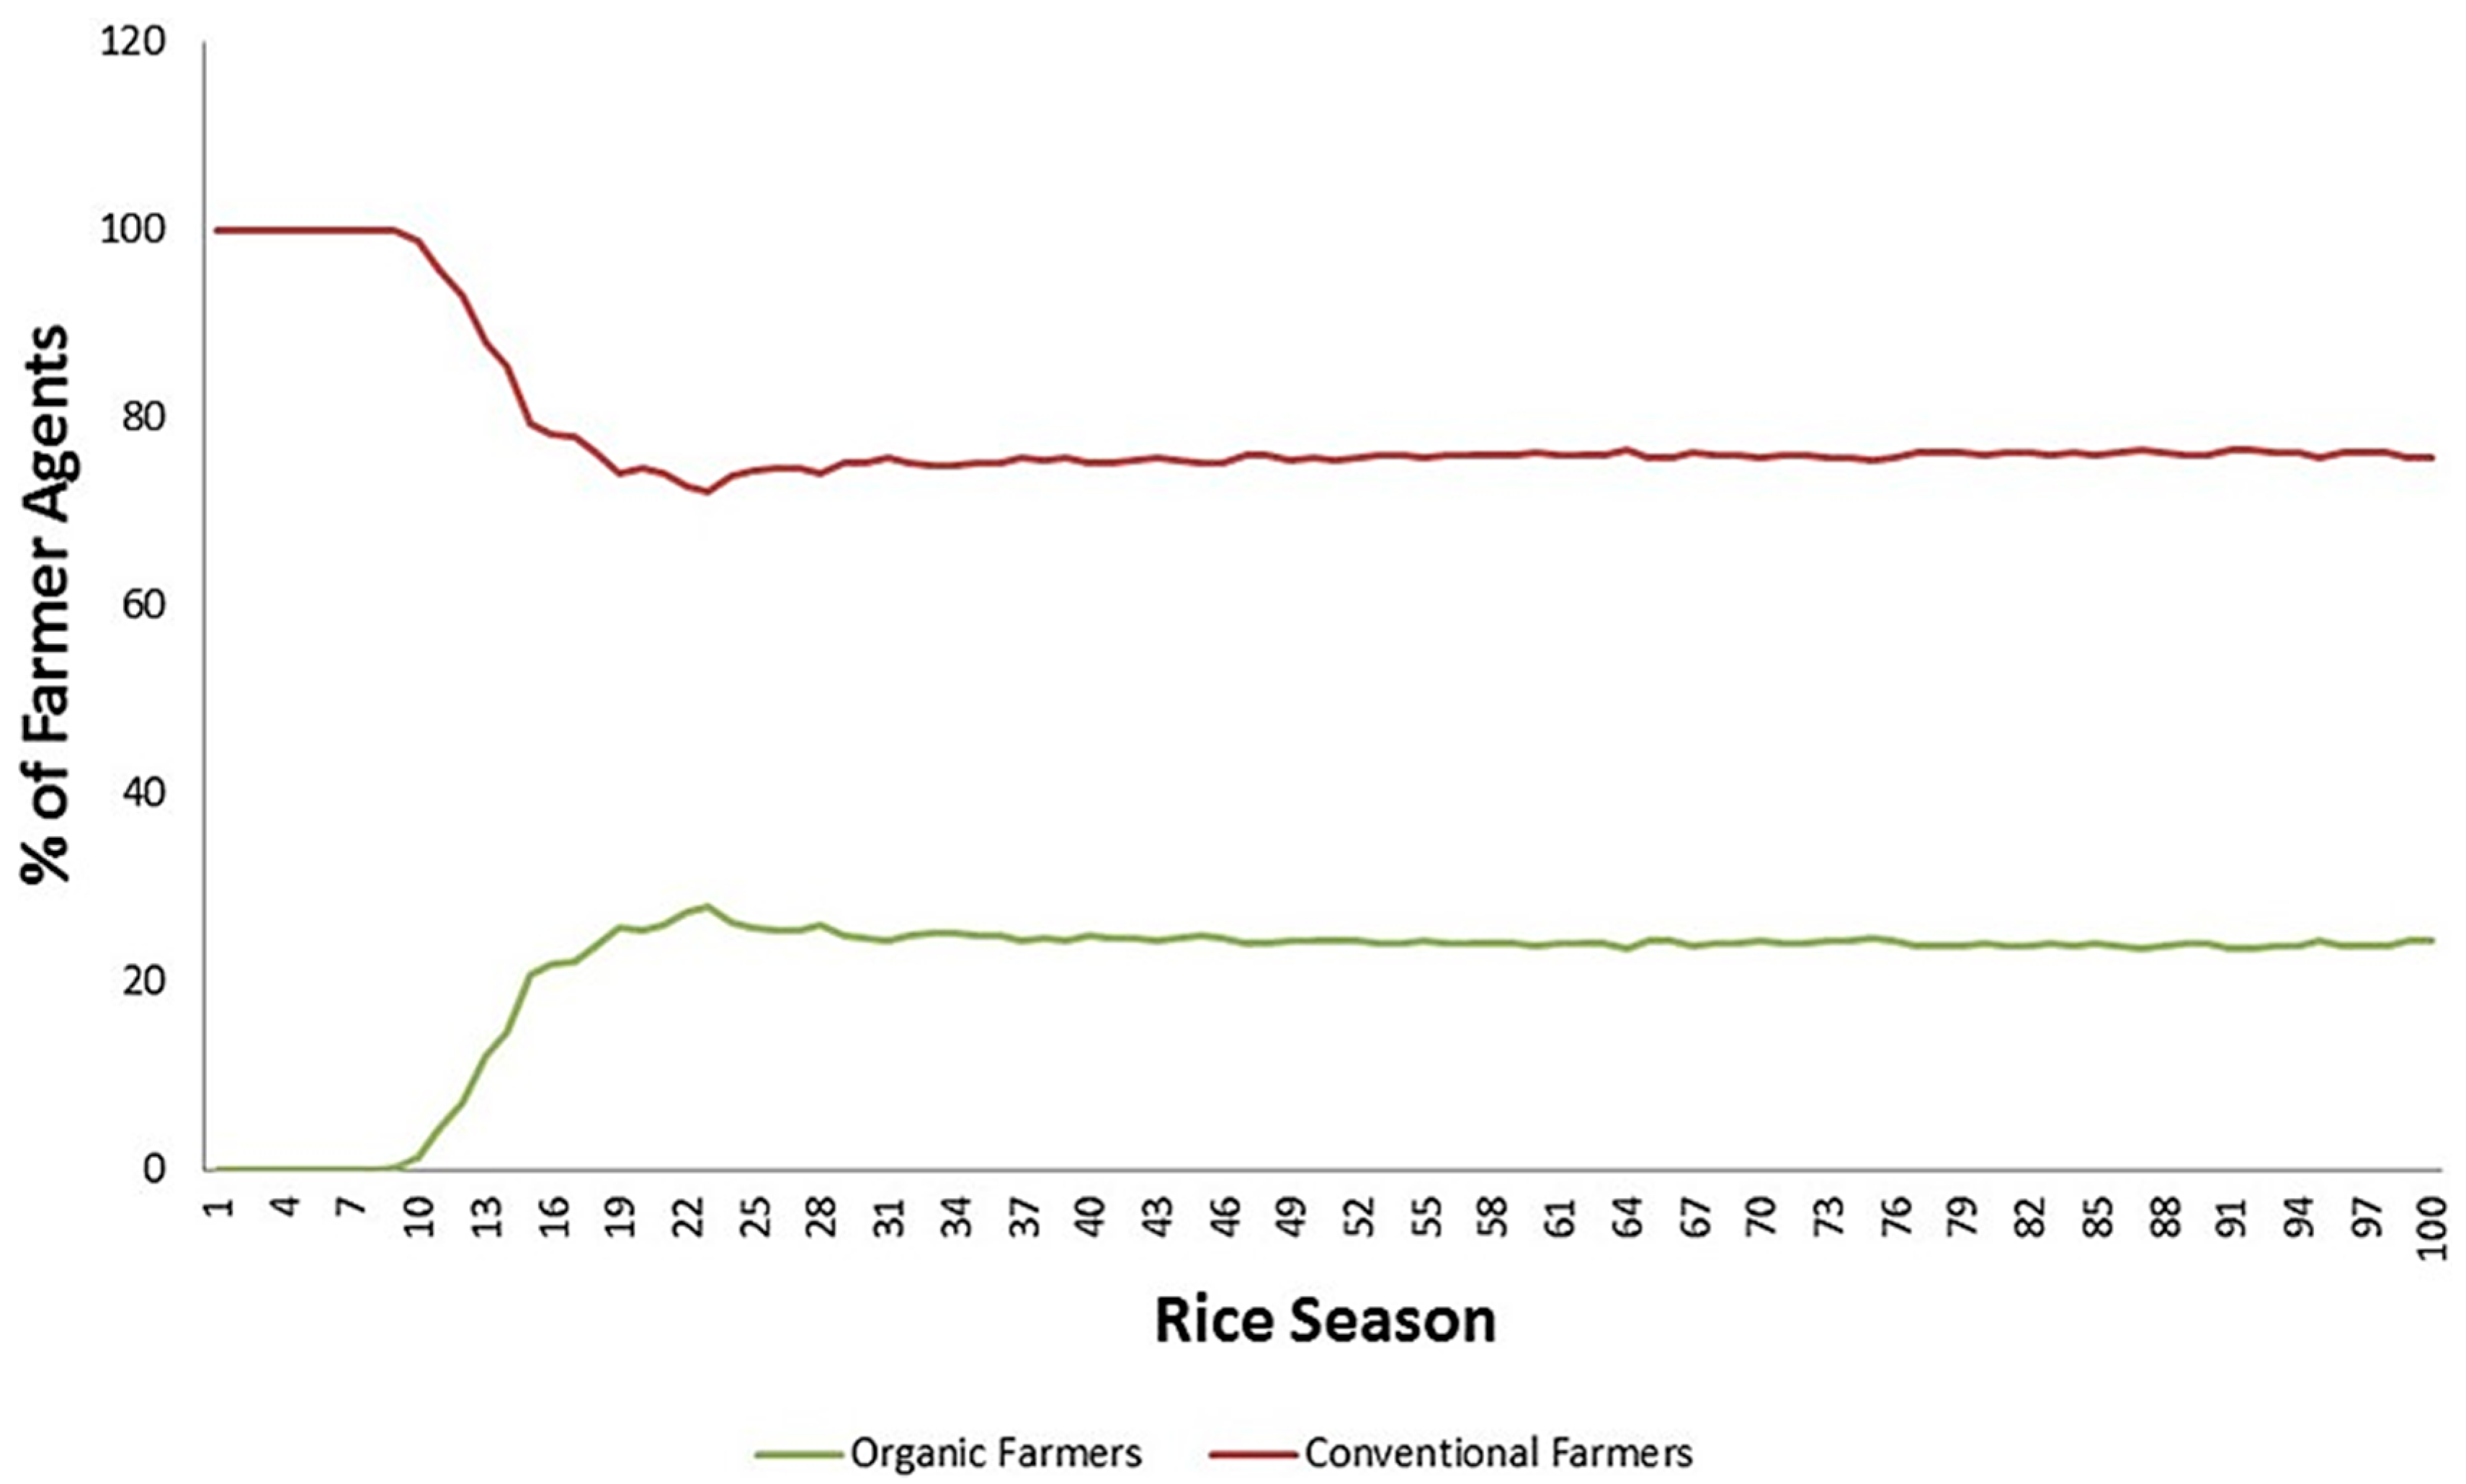
Agent-Based Model

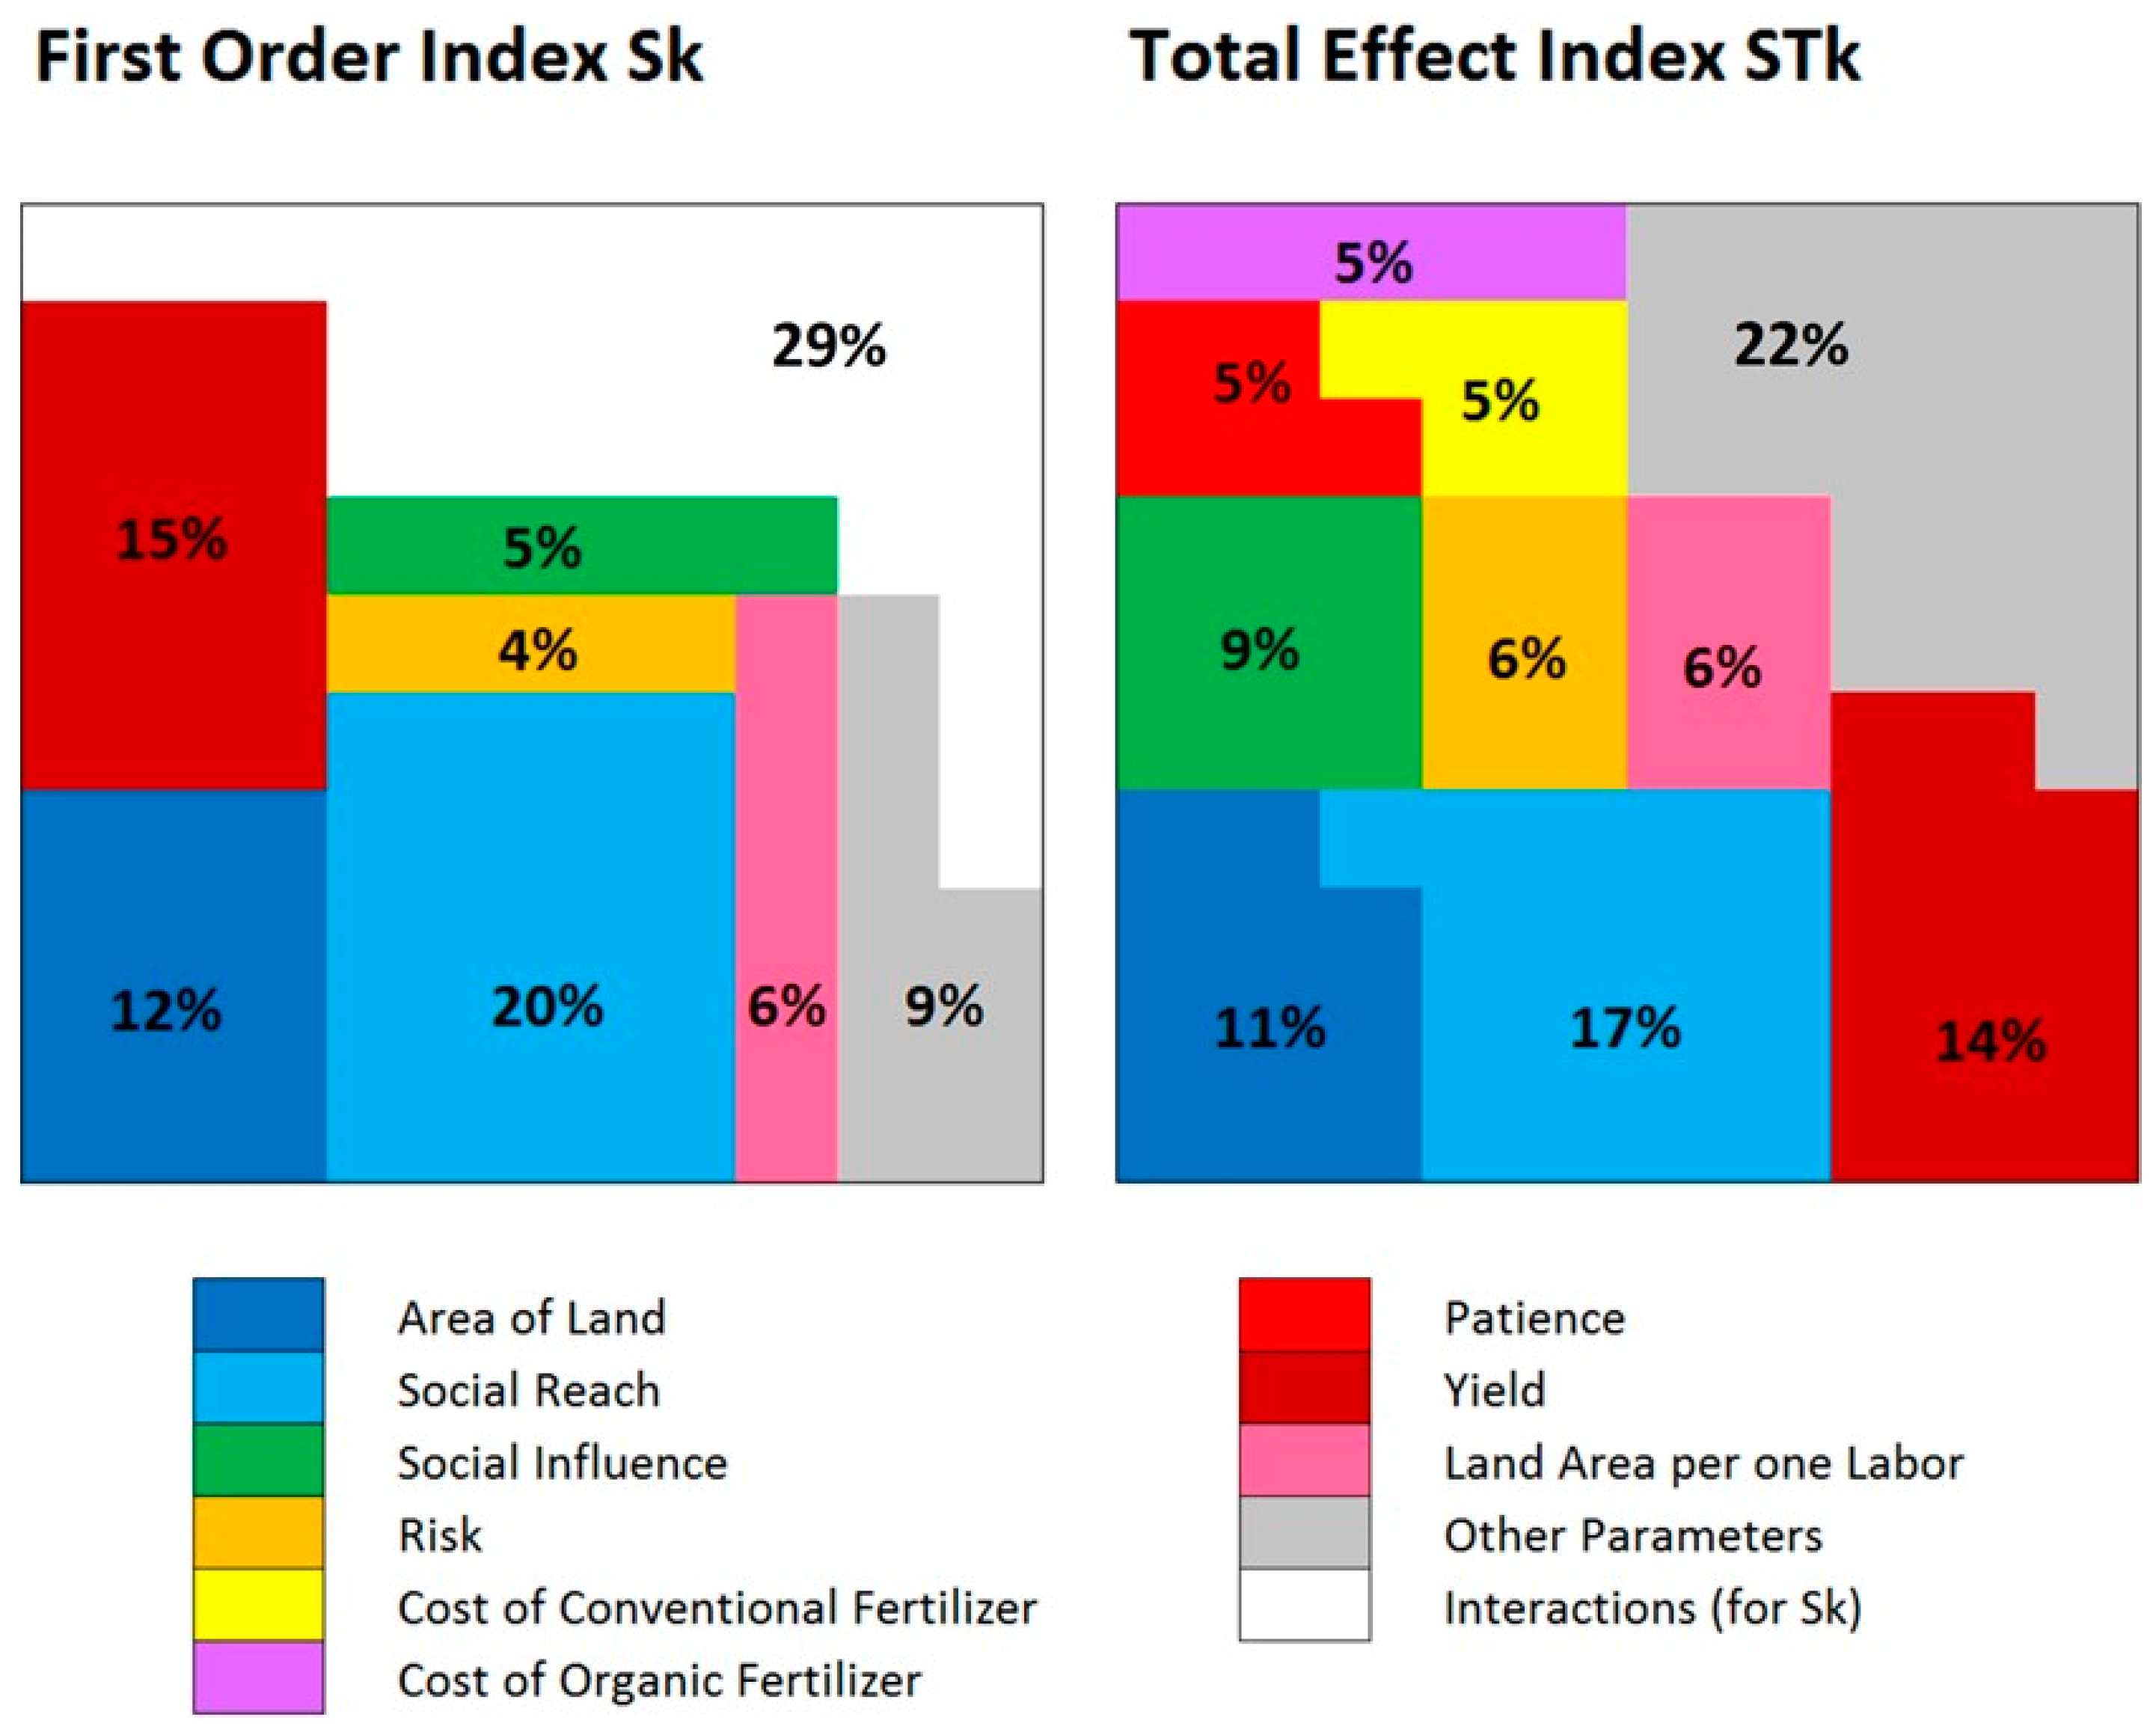
Sensitivity Analysis: Variance Decomposition of Model Results


6. Discussion
Implications and Limitations
7. Conclusions
Supplementary Files
Supplementary File 1Acknowledgments
Author Contributions
Conflicts of Interest
References
- Willer, H.; Kilcher, L. (Eds.) The World of Organic Agriculture: Statistics & Emerging Trends 2009; International Federation of Organic Agriculture Movements (IFOAM): Bonn, Germany, 2009.
- Horrigan, L.; Lawrence, R.S.; Walker, P. How sustainable agriculture can address the environmental and human health harms of industrial agriculture. Environ. Health Perspect. 2002, 110, 445–456. [Google Scholar] [CrossRef] [PubMed]
- Pimentel, D. Green revolution agriculture and chemical hazards. Sci. Total Environ. 1996, 188 (S1), S86–S98. [Google Scholar] [CrossRef]
- Mendoza, T.C. Evaluating the benefits of organic farming in rice agroecosystems in the Philippines. J. Sustain. Agric. 2004, 24, 93–115. [Google Scholar] [CrossRef]
- Eakin, H. Smallholder maize production and climatic risk: A case study from Mexico. Clim. Change 2000, 45, 19–36. [Google Scholar] [CrossRef]
- Uematsu, H.; Mishra, A.K. Organic farmers or conventional farmers: Where’s the money? Ecol. Econ. 2012, 78, 55–62. [Google Scholar] [CrossRef]
- Burton, M.; Rigby, D.; Young, T. Modelling the adoption of organic horticultural technology in the UK using duration analysis. Aust. J. Agric. Resour. Econ. 2003, 47, 29–54. [Google Scholar] [CrossRef]
- Berger, T. Agent-based spatial models applied to agriculture: A simulation tool for technology diffusion, resource use changes and policy analysis. Agric. Econ. 2001, 25, 245–260. [Google Scholar] [CrossRef]
- Parker, D.C.; Manson, S.M.; Janssen, M.A.; Hoffman, M.J.; Deadman, P. Multi-agent systems for the simulation of land-use and land-cover change: A review. Ann. Assoc. Am. Geogr. 2003, 93, 314–337. [Google Scholar] [CrossRef]
- An, L.; Linderman, M.; Qi, J.; Shortridge, A.; Liu, J. Exploring complexity in a human-environment system: An agent-based spatial model for multidisciplinary and multiscale integration. Ann. Assoc. Am. Geogr. 2005, 95, 54–79. [Google Scholar] [CrossRef]
- Ligmann-Zielinska, A.; Kramer, D.B.; Cheruvelil, K.S.; Soranno, P.A. Using uncertainty and sensitivity analyses in socioecological agent-based models to improve their analytical performance and policy relevance. PLoS ONE 2014, 9, e109779. [Google Scholar] [CrossRef] [PubMed]
- Acosta-Michlik, L.; Espaldon, V. Assessing vulnerability of selected farming communities in the Philippines based on a behavioural model of agent’s adaptation to global environmental change. Glob. Environ. Change 2008, 18, 554–563. [Google Scholar] [CrossRef]
- Valbuena, D.; Verburg, P.; Veldkamp, A.; Bregt, A.K.; Ligtenberg, A. Effects of farmers’ decisions on the landscape structure of a Dutch rural region: An agent-based approach. Landsc. Urban Plan. 2010, 97, 98–110. [Google Scholar] [CrossRef]
- Bert, F.E.; Podesta, G.P.; Rovere, S.L.; Menendez, A.N.; North, M.; Tatara, E.; Laciana, C.E.; Weber, E.; Toranzo, F.R. An agent based model to simulate structural and land use changes in agricultural systems of the argentine pampas. Ecol. Model. 2011, 222, 3486–3499. [Google Scholar] [CrossRef]
- Huang, Q.; Parker, D.C.; Sun, S.P.; Filatova, T. Effects of agent heterogeneity in the presence of a land-market: A systematic test in an agent-based laboratory. Comput. Environ. Urban Syst. 2013, 41, 188–203. [Google Scholar] [CrossRef]
- Goldenberg, J.; Libai, B.; Muller, E. Talk of the network: A complex systems look at the underlying process of word-of-mouth. Mark. Lett. 2001, 12, 211–223. [Google Scholar] [CrossRef]
- Allsop, D.T.; Bassett, B.R.; Hoskins, J.A. Word-of-Mouth research: Principles and applications. J. Advert. Res. 2007, 47, 398–411. [Google Scholar] [CrossRef]
- Burton, M.; Rigby, D.; Young, T. Analysis of the determinants of adoption of organic horticultural techniques in the UK. J. Agric. Econ. 2008, 50, 47–63. [Google Scholar] [CrossRef]
- Conley, T.; Udry, C. Social learning through networks: The adoption of new agricultural technologies in Ghana. Am. J. Agric. Econ. 2001, 83, 668–673. [Google Scholar] [CrossRef]
- Schreinemachers, P.; Berger, T. An agent-based simulation model of human-environment interactions in agricultural systems. Environ. Model. Softw. 2011, 26, 845–859. [Google Scholar] [CrossRef]
- Matthews, R.B.; Gilbert, N.G.; Roach, A.; Polhill, J.G.; Gotts, N.M. Agent-based land-use models: A review of applications. Landsc. Ecol. 2007, 22, 1447–1459. [Google Scholar] [CrossRef] [Green Version]
- Kaye-Blake, W.; Li, F.Y.; Martin, A.M.; McDermott, A.; Rains, S.; Sinclair, S.; Kira, A. Multi-Agent Simulation Models in Agriculture: A Review of Their Construction and Uses; Lincoln University: Christchurch, New Zealand, 2010. [Google Scholar]
- Bithell, M.; Brasington, J. Coupling agent-based models of subsistence farming with individual-based forest models and dynamic models of water distribution. Environ. Model. Softw. 2009, 24, 173–190. [Google Scholar] [CrossRef]
- Matthews, R. The People and Landscape Model (PALM): Towards full integration of human decision-making and biophysical simulation models. Ecol. Model. 2006, 194, 329–343. [Google Scholar] [CrossRef]
- Evans, T.P.; Phanvilay, K.; Fox, J.; Vogler, J. An agent-based model of agricultural innovation, land-cover change and household inequality: The transition from swidden cultivation to rubber plantations in Laos PDR. J. Land Use Sci. 2011, 6, 151–173. [Google Scholar] [CrossRef]
- Deffuant, G.; Huet, S.; Bousset, J.P.; Henriot, J.; Amon, G.; Weisbuch, G. Agent based simulation of organic farming conversion in Allier département. In Complexity and Ecosystem Management: The Theory and Practice of Multi-Agent Systems; Janssen, M.A., Ed.; Edward Elgar Publishers: Chelten-Ham, UK, 2002; pp. 158–187. [Google Scholar]
- Kaufmann, P.; Stagl, S.; Franks, D.W. Simulating the diffusion of organic farming practices in two New EU Member States. Ecol. Econ. 2009, 68, 2580–2593. [Google Scholar] [CrossRef]
- Bakker, M.M.; van Doorn, A.M. Farmer-specific relationships between land use change and landscape factors: Introducing agents in empirical land use modelling. Land Use Policy 2009, 26, 809–817. [Google Scholar] [CrossRef]
- Gotts, N.M.; Polhill, J.G. When and how to imitate your neighbours: Lessons from and for FEARLUS. J. Artif. Soc. Soc. Simul. 2009, 12, 2. [Google Scholar]
- Happe, K.; Kellermann, K.; Balmann, A. Agent-based analysis of agricultural policies: An illustration of the agricultural policy simulator AgriPoliS, its adaptation, and behavior. Ecol. Soc. 2006, 11, 49. [Google Scholar]
- Schreinemachers, P.; Berger, T.; Sirijinda, A.; Praneetvatakul, S. The diffusion of greenhouse agriculture in northern Thailand: Combining econometrics and agent-based modeling. Can. J. Agric. Econ. 2009, 57, 513–536. [Google Scholar] [CrossRef]
- Valbuena, D.; Verburg, P.; Veldkamp, A.; Bregt, A.K.; Ligtenberg, A. An agent-based approach to explore the effect of voluntary mechanisms on land use change: A case in rural Queensland, Australia. J. Environ. Manag. 2010, 91, 2615–2625. [Google Scholar] [CrossRef] [PubMed]
- Jager, W.; Janssen, M.A.; De Vries, H.J.M.; De Greef, J.; Vlek, C.A.J. Behaviour in commons dilemmas: Homo economicus and Homo psychologicus in an ecological-economic model. Ecol. Econ. 2000, 35, 357–379. [Google Scholar] [CrossRef]
- Congress of the Philippines. An Act Providing for the Development and Promotion of Organic Agriculture in the Philippines and for Other Purpose, in Republic Act 10068. Fourteenth Congress: Manila, Philippines, 2009. [Google Scholar]
- Lesaca, P.R.A. Organic Agriculture in the Philippines: Going Back to Basic. In BAR Digest 2012; 13 February 2014. Available online: http://www.bar.gov.ph/organic-agriculture (accessed on 10 January 2015). [Google Scholar]
- David, C.C. Agriculture. In The Philippine Economy: Development, Policies, and Challenges; Balisacan, A.M., Hill, H., Eds.; Oxford University Press: New York, NY, USA, 2003; pp. 175–218. [Google Scholar]
- National Economic and Development Authority (NEDA). Medium-Term Philippine Development Plan, 2004–2010; NEDA: Manila, Philippines, 2004. [Google Scholar]
- Herdt, R.W.; Barker, R.; Rose, B. The Rice Economy of Asia; International Rice Research Institute: Manila, Philippines, 1985; Volume 2. [Google Scholar]
- Collado, P.M.G.; Tia, M.E.; del Prado, D.G.L.; Taguibolos, G.B.; Lipio, G.M., Jr. Characteristics of Farm Holdings: Evidence from the Philippines’ Census of Agriculture; Southeast Asian Regional Center for Graduate Study and Research in Agriculture: Los Baños, Philippines, 2013. [Google Scholar]
- Schmitt, L. Developing and applying a soil erosion model in a data-poor context to an island in the rural Philippines. Environ. Dev. Sustain. 2009, 11, 19–42. [Google Scholar] [CrossRef]
- Muramoto, J.; Hidaka, K.; Mineta, T. Japan: Finding opportunities in the current crisis. In The Conversion to Sustainable Agriculture: Principles, Processes and Practices; Gliessman, S.R., Rosemeyer, M., Eds.; CRC Press: Boca Raton, FL, USA, 2010; pp. 273–302. [Google Scholar]
- Klonsky, K.; Greene, C. Widespread adoption of organic agriculture in the US: Are market-driven policies enough? In Proceedings of the American Agricultural Economics Association Annual Meeting, Providence, RI, USA, 24–27 July 2005.
- D’Souza, G.; Cyphers, D.; Phipps, T. Factors affecting the adoption of sustainable agricultural practices. Agric. Resour. Econ. Rev. 1993, 221, 59–165. [Google Scholar]
- Best, H. Environmental concern and the adoption of organic agriculture. Soc. Nat. Resour. 2010, 23, 451–468. [Google Scholar] [CrossRef]
- Mzoughi, N. Farmers adoption of integrated crop protection and organic farming: Do moral and social concerns matter? Ecol. Econ. 2011, 7, 1536–1545. [Google Scholar] [CrossRef]
- Cauwenbergh, N.V.; Biala, K.; Bielders, C.; Brouckaert, V.; Franchois, L.; Garcia Cidad, V.; Hermy, M.; Mathijs, E.; Muys, B.; Reijnders, J.; et al. SAFE—A hierarchical framework for assessing the sustainability of agricultural systems. Agric. Ecosyst. Environ. 2007, 1202, 229–242. [Google Scholar] [CrossRef]
- Philippine Bureau of Agricultural Statistics. Area Planted/Harvested of Crops; Report 2007; Philippine Bureau of Agricultural Statistics: Manila, Philippines, 2007. [Google Scholar]
- Hamill, L.; Gilbert, N. Social circles: A simple structure for agent-based social network models. J. Artif. Soc. Soc. Simul. 2009, 12, 3. [Google Scholar]
- Datta, S.K.D. Improving nitrogen fertilizer efficiency in lowland rice in tropical Asia. Fertil. Res. 1986, 91, 71–186. [Google Scholar] [CrossRef]
- Schouten, M.; Verwaart, T.; Heijman, W. Comparing two sensitivity analysis approaches for two scenarios with a spatially explicit rural agent-based model. Environ. Model. Softw. 2014, 54, 196–210. [Google Scholar] [CrossRef]
- Crosetto, M.; Tarantola, S.; Saltelli, A. Sensitivity and uncertainty analysis in spatial modelling based on GIS. Agric. Ecosyst. Environ. 2000, 81, 71–79. [Google Scholar] [CrossRef]
- Gomez-Delgado, M.; Tarantola, S. GLOBAL sensitivity analysis, GIS and multi-criteria evaluation for a sustainable planning of a hazardous waste disposal site in Spain. Int. J. Geogr. Inf. Sci. 2006, 20, 449–466. [Google Scholar] [CrossRef]
- Chu-Agor, M.L.; Muñoz-Carpena, R.; Kiker, G.; Emanuelsson, A.; Linkov, I. Exploring vulnerability of coastal habitats to sea level rise through global sensitivity and uncertainty analyses. Environ. Model. Softw. 2011, 26, 593–604. [Google Scholar] [CrossRef]
- Saltelli, A.; Ratto, M.; Andres, T.; Campolongo, F.; Cariboni, J.; Gatelli, D.; Saisana, M.; Tarantola, S. Global Sensitivity Analysis: The Primer; Wiley-Interscience: Chichester, UK, 2008; p. 304. [Google Scholar]
- Lilburne, L.; Tarantola, S. Sensitivity analysis of spatial models. Int. J. Geogr. Inf. Sci. 2009, 23, 151–168. [Google Scholar] [CrossRef]
- Homma, T.; Saltelli, A. Importance measures in global sensitivity analysis of nonlinear models. Reliab. Eng. Syst. Saf. 1996, 52, 1–17. [Google Scholar] [CrossRef]
- Saltelli, A.; Annoni, P.; Azzini, I.; Campolongo, F.; Ratto, M.; Tarantola, S. Variance based sensitivity analysis of model output. Design and estimator for the total sensitivity index. Comput. Phys. Commun. 2010, 181, 259–270. [Google Scholar] [CrossRef]
- Ligmann-Zielinska, A.; Sun, L. Applying time dependent variance-based global sensitivity analysis to represent the dynamics of an agent-based model of land use change. Int. J. Geogr. Inf. Sci. 2010, 24, 1829–1850. [Google Scholar] [CrossRef]
- Tarde, G. The Laws of Imitation; The Mershon Company Press: Rahway, NJ, USA, 1903. [Google Scholar]
- Ryan, B.; Gross, N.C. The diffusion of hybrid seed corn in two Iowa communities. R. Soc. 1943, 8, 15–24. [Google Scholar]
- Rogers, E.M. Diffusion of Innovations; Free Press: New York, NY, USA, 2003. [Google Scholar]
- Heong, K.L.; Escalada, M.M. A comparative analysis of pest management practices of rice farmers in Asia. In Pest Management of Rice Farmers in Asia; Heong, K.L., Escalada, M.M., Eds.; International Rice Research Institute: Los Baños, Philippines, 1997; pp. 227–242. [Google Scholar]
- Borron, S. Building Resilience for an Unpredictable Future: How Organic Agriculture Can Help Farmers Adapt to Climate Change; United Nations Food and Agriculture Organization: Rome, Italy, 2006. [Google Scholar]
- Bankes, S. Exploratory modeling for policy analysis. Oper. Res. 1993, 41, 435–449. [Google Scholar] [CrossRef]
- Weaver, C.P.; Lempert, R.J.; Brown, C.; Hall, J.A.; Revell, D.; Sarewitz, D. Improving the contribution of climate model information to decision making: The value and demands of robust decision frameworks. Wiley Interdiscip. Rev.: Clim. Change 2013, 4, 39–60. [Google Scholar] [CrossRef]
- Bankes, S.; Lempert, R.; Popper, S. Making computational social science effective: Epistemology, methodology, and technology. Soc. Sci. Comput. Rev. 2002, 20, 377–388. [Google Scholar] [CrossRef]
- Downey, E.; Brill, J. The use of optimization models in public-sector planning. Manag. Sci. 1979, 25, 413–422. [Google Scholar]
- Meadows, D. Thinking in Systems: A Primer; Chelsea Green: White River Junction, VT, USA, 2008. [Google Scholar]
- Peck, S.L. Simulation as experiment: A philosophical reassessment for biological modeling. Trends Ecol. Evol. 2004, 19, 530–534. [Google Scholar] [CrossRef] [PubMed]
© 2015 by the authors; licensee MDPI, Basel, Switzerland. This article is an open access article distributed under the terms and conditions of the Creative Commons Attribution license (http://creativecommons.org/licenses/by/4.0/).
Share and Cite
Olabisi, L.S.; Wang, R.Q.; Ligmann-Zielinska, A. Why Don’t More Farmers Go Organic? Using A Stakeholder-Informed Exploratory Agent-Based Model to Represent the Dynamics of Farming Practices in the Philippines. Land 2015, 4, 979-1002. https://doi.org/10.3390/land4040979
Olabisi LS, Wang RQ, Ligmann-Zielinska A. Why Don’t More Farmers Go Organic? Using A Stakeholder-Informed Exploratory Agent-Based Model to Represent the Dynamics of Farming Practices in the Philippines. Land. 2015; 4(4):979-1002. https://doi.org/10.3390/land4040979
Chicago/Turabian StyleOlabisi, Laura Schmitt, Ryan Qi Wang, and Arika Ligmann-Zielinska. 2015. "Why Don’t More Farmers Go Organic? Using A Stakeholder-Informed Exploratory Agent-Based Model to Represent the Dynamics of Farming Practices in the Philippines" Land 4, no. 4: 979-1002. https://doi.org/10.3390/land4040979