Article

Understanding Land Use and Land Cover Dynamics from 1976 to 2014 in Yellow River Delta

1
School of Geography and Environment, Shandong Normal University, 88 East Wenhua Rd, Jinan 250014, China
2
Chinese Research Academy of Environmental Sciences, Beijing 100012, China
3
Agricultural and Biological Engineering, Purdue University, 225 S. University St, West Lafayette, IN 47907-2093, USA
4
Institute of Regional Economic Research, Shandong University of Finance and Economics, 7366 East Erhuan Rd, Jinan 250014, China
*
Author to whom correspondence should be addressed.
Submission received: 10 February 2017 / Revised: 6 March 2017 / Accepted: 7 March 2017 / Published: 13 March 2017
(This article belongs to the Special Issue Urban Land Systems: An Ecosystems Perspective)

Abstract

:
Long-term intensive land use/cover changes (LUCCs) of the Yellow River Delta (YRD) have been happening since the 1960s. The land use patterns of the LUCCs are crucial for bio-diversity conservation and/or sustainable development. This study quantified patterns of the LUCCs, explored the systematic transitions, and identified wetland change trajectory for the period 1976–2014 in the YRD. Landsat imageries of 1976, 1984, 1995, 2006, and 2014 were used to derive nine land use classes. Post classification change detection analysis based on enhanced transition matrix was applied to identify land use dynamics and trajectory of wetland change. The five cartographic outputs for changes in land use underlined major decreases in natural wetland areas and increases in artificial wetland and non-wetland, especially aquafarms, salt pans and construction lands. The systematic transitions in the YRD were wetland degradation, wetland artificialization, and urbanization. Wetland change trajectory results demonstrated that the main wetland changes were wetland degradation and wetland artificialization. Coastline change is the subordinate reason for natural wetland degradation in comparison with human activities. The results of this study allowed for an improvement in the understanding of the LUCC processes and enabled researchers and planners to focus on the most important signals of systematic landscape transitions while also allowing for a better understanding of the proximate causes of changes.

Graphical Abstract

1 Introduction

Land use/cover change (LUCC) is considered to be one of the most important components and driving factors of global environmental change [1,2,3,4], and it is one of the most important indicators in understanding the interactions between human activities and the environment [5,6]. Understanding the reorganization of land in order to adapt its use and spatial structure to social demands has become crucial to management and represents a major challenge to land use planning and public policies [7,8,9].
LUCC is defined as the transformation of the physical or biotic nature of a site, whereas land use change involves a modification in the way in which land is being used by humans [10]. These transitions can be random or systematic [11,12], with random transitions representing those characterized by abrupt changes or episodic processes of change and systematic transitions those marked by consistency and stable processes [13]. Land use transitions can be detected by statistical evaluation by comparing different temporal pattern maps. A common method employs the use of a land use/cover transition matrix, which provides a cross-tabulation matrix including change quantities and directions, and allows identification of differences between random and systematic land use transitions [14,15,16,17]. However, matrix-based land use studies mainly focus on overall gains and losses, and tend to ignore the spatial locations and swap changes of land use transitions [10,18]. Furthermore, the maps or databases of these studies are sampled or classed at discrete intervals, and the analysis tends to focus on the adjacent periods, but ignore successive process of land use transitions [19,20]. Therefore, establishing a better understanding of the fundamental processes of land use transitions requires the detection of dominant systematic land cover transitions and an illustration of the trajectory of the interest objects (land use types).
The Yellow River Delta (YRD)—located in the estuary of the Yellow River, with resource–rich territory of coastal wetlands—is the only habitat for several species of rare migratory birds and preserves natural vegetation near several big cities [21]. As the key economic development area of Shandong province and one of the most important regions of petroleum production in China, the YRD has been subject to increasing human disturbance (e.g., petroleum exploitation and production, agricultural development, and urbanization) since the early 1960s [22,23]. Moreover, the runoff and sediment discharge from the Yellow River has decreased considerably since the 1950s, resulting in frequent and prolonged channel drying in the downstream area since the 1970s [24,25,26]. These two stressors led to dramatic land use changes, so the detection of LUCCs and the identification of the trajectory of wetland change are fundamental for bio-diversity conservation and/or sustainable development of the YRD. In recent years, LUCCs in the YRD have received considerable attention in China, and researchers at home and abroad have conducted numerous studies surrounding the aspects of land use change [27,28,29], landscape dynamics [30], wetland evolution [31,32,33], and impacts of anthropogenic activities [34] based on qualitative, quantitative, and modeling methods. However, these studies mainly focused on the concentration of land use status before 2009 and covered much less the land use situation after 2010. More importantly, these studies paid more attention to the area changes and driving forces, but ignored the systematic transitions of LUCCs and the trajectory of wetland change.
This study aimed at the detection of LUCCs and the identification of the trajectory of wetland changes due to their importance for bio-diversity conservation and/or sustainable development of the YRD. Therefore, three specific objectives of this article were to (1) analyze spatial and temporal dynamics of land use patterns from 1976 to 2014; (2) explore the systematic transitions of land use of the YRD; and (3) illustrate the trajectory of wetland change and the driving factors. The following sections of the paper are organized in the following ways: the study area and methods section provides details on case study area, data sources, and methods to quantify land use change, and trajectories of wetland change; the results section presents the accuracy of our analysis, land use pattern detected, and the wetland changes; the discussion section provides insights regarding the comparison of our study and existing studies, the implication of our results, and ultimately this is followed by the conclusion of this study.

2. Study Area and Methods
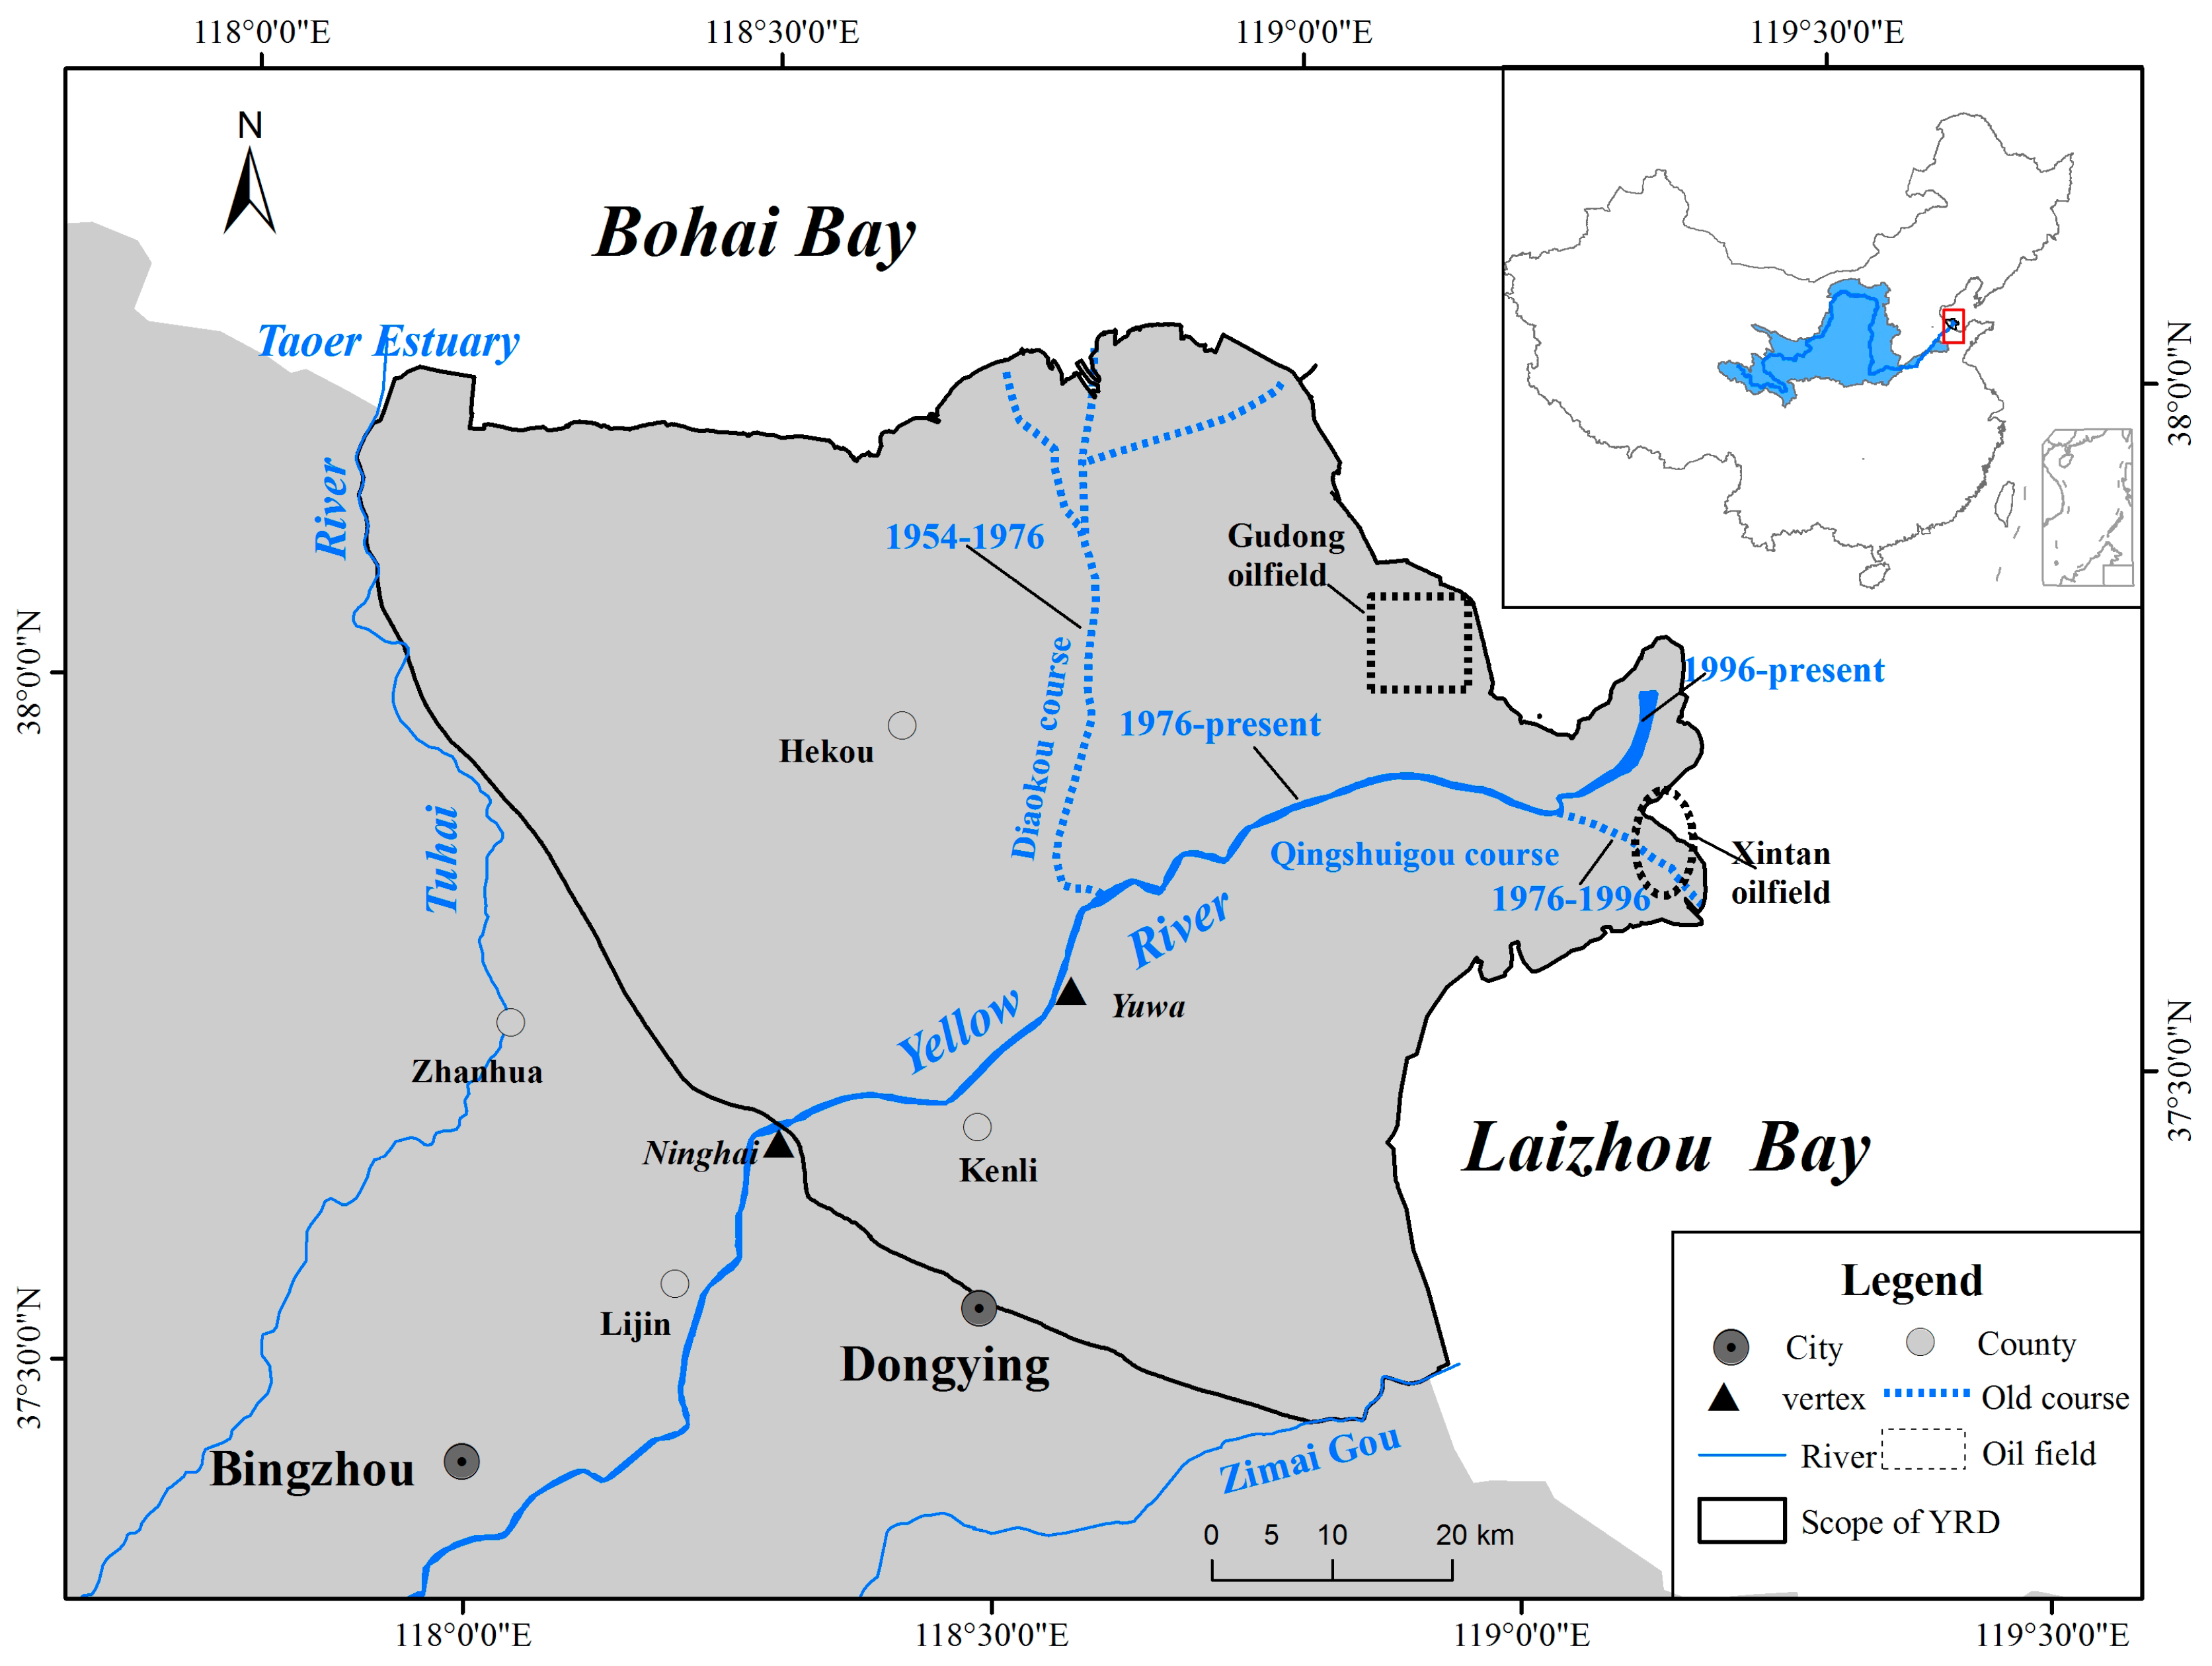
2.1. Study Area

The YRD is the newly-formed fan-shaped delta of the Yellow River estuary area after the Yellow River was diverted into the Bohai Sea in 1855. The delta (located in 118°33′ E to 119°18′ E and from 37°26′ N to 38°09′ N) takes Ninghai as the vertex, starts from the Taoer Estuary in the north, and reaches the ZhimaiGou river in the south and Tuhai River in the west (Figure 1). It has a warm temperate continental monsoon climate with distinctive seasonality. The annual temperatures and precipitation is 11.7–12.6 °C and 530–630 mm, respectively [35]. However, average annual evaporation is almost 3.5 times the average yearly precipitation. Approximately 10.5 million tons of sand and soil discharged by the river is deposited in the delta annually, forming a vast floodplain and special wetland landscape [36]. The soil of the YRD is mainly composed of fine sand and is characteristically young, with a high groundwater table, low fertility, and a tendency towards secondary salinization and desertification [37]. The average groundwater table is generally 2–3 m, and only 0.5–1.5 m along the coastline. The natural vegetation is composed of broadleaf deciduous forest (mainly Hankow willow and weeping willow), shrubbery (mainly Chinese tamarisk), and shore coppice [38]. The YRD is one of six of the most beautiful wetlands in China and an important energy base with more than 5 × 10⁹ t petroleum and 2.3 × 10¹¹ m natural gas [23,39].

2.2. Data Preparation and Acquisition

2.2.1. Satellite Image Selection and Pre-Processing

Generally, the selection of Landsat images was mainly based on availability, cloud cover percentage, and correspondence [40]. However, the image features of land use types in the YRD are more likely to be affected by seasonal aspects and tidal conditions. The duration of seasonal tidal flows in YRD was always from January to April [41,42]. Therefore, the remotely sensed imageries selected in this paper (Table 1) were not only cloud–free but also during the appropriate period. All the imageries were acquired from Earth Observation and Digital Earth Science Center of Chinese Academy of Sciences. The satellite images were corrected in order to remove atmospheric effects by subtracting the radiance of a “dark pixel” within each band image [43], and then the images were geo-referenced using between 15 and 30 ground control points distributed across each image. After geo-reference, the images had a Gaussian–Krueger projection and a Root Mean Squared Error (RMSE) of less than one pixel.

2.2.2. Region Definition, Land Use Classification, and Accuracy Assessment

The YRD experiences erosion and deposition, so its scope and area is constantly changing. In this paper, the coastlines of each period were extracted to defined the YRD’s scope, and an interactive interpretation technique combining an automatic boundary detection algorithm with human supervision was used to detect the land–ocean shoreline boundaries in satellite images. The coastline types of the YRD are muddy coastlines and artificial coastlines, and artificial coastlines were acquired by interpreting the construction edges manually. The muddy coastlines were established using an automatic boundary detection algorithm following the process of Tasseled Cap Transformation [44], binary converting, edge enhancement, and edge detection [26].
The detection of time intervals in land use changes required a pre-classification image analysis process (image to image comparison) of land use. Visual interpretation of land use types based on elements such as color, tone, texture, form, size, presence of shadows, and the location of infrastructures [45,46] has been the main approach for identifying land use changes because it can provide more accurate land use maps compared with automatic classification [47,48]. In this study, the land use data series were acquired by interpreting the basic land use map in 2010 and detecting the changing parts between adjacent time periods of Landsat images manually. The whole process is supported by six main stages: field investigation, establishment of land use classification, interpretation of basic map, change detection, field test and corrections, and accuracy assessment. Field investigation was conducted in May 2013 covering the entire study area to get a priori knowledge of the study area as a whole, including landform, soil, vegetation, ponds, rivers, salt fields, agriculture fields, and built-up areas. A classification system including three land use types and nine classes (Table 2) was established based on the national land classification system and the regional characteristics of the YRD while referring to wetland classification principles of previous studies [49,50,51]. In the process of interpretation, interpreters used ArcGIS software to identify land use types based on their understanding about the object’s spectral reflectance, structure, and other ancillary information with the smallest patch of land use bigger than 25 pixels (2.25 ha) and the shortest edge longer than 3 pixels (90 m). A second round of field surveys/tests was conducted on August–September 2014 after finish detecting land use changes and from the land use maps from the five periods. Subsequently, the corrections were implemented on the land use maps from the five periods based on samples of the two field surveys, land use maps from local governments, and high resolution aerial photographs. Discrete multivariate analytical techniques were used to statistically evaluate the accuracy of the classified maps [52] and a variety of indices such as overall accuracy, producer’s accuracy, user’s accuracy, and kappa analysis were calculated [53].

2.3. Quantification of LUCC Based on Transition Matrix

In order to quantify the land use/cover dynamics, post classifications (map to map comparisons) were generated involving the successive sets of images cross-referenced to define land use transition matrixes and a series of evaluation indexes. In the process of generating land use transition matrixes, the union scope of five periods with an area of 6398 km2 was taken as the analysis scope and a new land use type of sea surface (SF) was added to represent the land that disappeared as a result of coastline erosion.

2.3.1. Land Use Transition Matrix

The land use transition matrix comes from system analysis aiming at quantitative description of the system state and state transition, and it is the most common approach used to compare maps of different sources, as it provides detailed “from-to” change class information [40]. The traditional area cross-tabulation matrix (transition matrix) was computed using overlay functions in ArcGIS 9.3 software. The computed transition matrix consists of rows that display categories at time T1 and columns that display categories at time T2 (Table 3). The notation Aij is the area of the land that experiences transition from category i to category j. The diagonal elements (i.e., Aii) indicate the area of the landscape that shows persistence of category i. Entries off the diagonal indicate a transition from category i to a different category j. The area of the landscape in category i in time T1 (Ai+) is the sum of Aij over all j. Similarly, the area of the landscape in category j in time T2 (A+j) is the sum of Aij over all i. The losses (Ai+ − Aii) were calculated as the differences between row totals and persistence. The gains (A+i − Aii) were calculated as the differences between the column totals and persistence.

2.3.2 Annual Rate of Change

The annual rate of change (RCi) for each land cover category i was calculated as [5,54]:
R C i = ( ( A + i / A i + ) 1 T 2 T 1 1 ) × 100 %
where Ai+ and A+i are the areas (in ha) of a cover class at years T 1 (initial time) and T 2 (next time step), respectively.

2.3.3. Stability Grade

To expresses the proportion of the landscape category i that had not experienced a transition to any different category of land use, the indicator stability grade (SGi) was defined as Equation (2) and the total stability grade of the region (SG) was defined as Equation (3) [11]:
S G i = 2 × A i i A + i + A i + × 100 %
S G = i = 1 n A i i / i = 1 n A + i × 100 %

2.3.4. Swap Change (SW) Percentage

Swap was a component of change which implied that a given area of a category was lost at one location, while the same area was gained at a different location. The amount of swap was calculated as two times the minimum of the gain and loss [53]. The total change for each land class was calculated as either the sum of the net change and the swap or the sum of the gains and losses. The percentage of swap change (Rsw) was calculated as follow [11,40]:
R s w = 2 × M i n ( A + j A j j , A j + A j j ) A + j + A j + 2 A j j × 100

2.3.5. Selection of Main Transition

Main transitions were identified as dominant conversions with bigger proportions of the total change. The proportion of the land (Pij) that experiences transition from category i to category j was calculated, and the transitions with the proportion values larger than the average values were selected as the main transition. The proportion of the transition and the comparison with the average proportion were defined as follows in Equation (5):
{ P i j = A i j / i = 1 n A i j × 100 % i j P i j > 100 % n × ( n 1 )
in which n represents the number of land types.

2.4. Trajectories of Wetland Change

Swetnam [55] presented a method to explore land use change characteristics or trajectory using the combinations of the three spatial indices (similarity, turnover, and diversity) to classify the land use change into six groups: stepped, cyclical, dynamic, no constant trend (NCT), and (stable) [56]. In this study, trajectory analysis was made for natural wetland, artificial wetland, and non-wetland classes because of their ecological importance. Additionally, the original six groups were clustered and reclassified in the aspect of wetland landscape change. With three land cover classes (natural wetland, artificial wetland, and non-wetland classes) and five temporal image dates (1976, 1984, 1995, 2006, and 2014), 61 out of 243 possible wetland land cover change trajectories were found. Finally, similar trajectories were clustered, resulting in six classes (Figure 2 and Table 4).

3. Results

3.1. Accuracy Assessment

Figure 2 depicts the classified maps for 1976, 1984, 1995, 2006, and 2014. According to the confusion matrix report (Table 5), 90.62% overall accuracy and a Kappa Coefficient (KC) value of 0.89 were attained for the 2014 classified map. Similarly, overall classification accuracy levels achieved were 91.63% (with a KC of 0.90) for the 2006, 94.74% (with KC of 0.94) for the 1995, 91.43% (with KC of 0.89) for the 1984, and 93.16% (with KC of 0.91) for the 1976 image classifications. In general, the maps met the minimum accuracy requirements to be used for the subsequent post-classification operations.

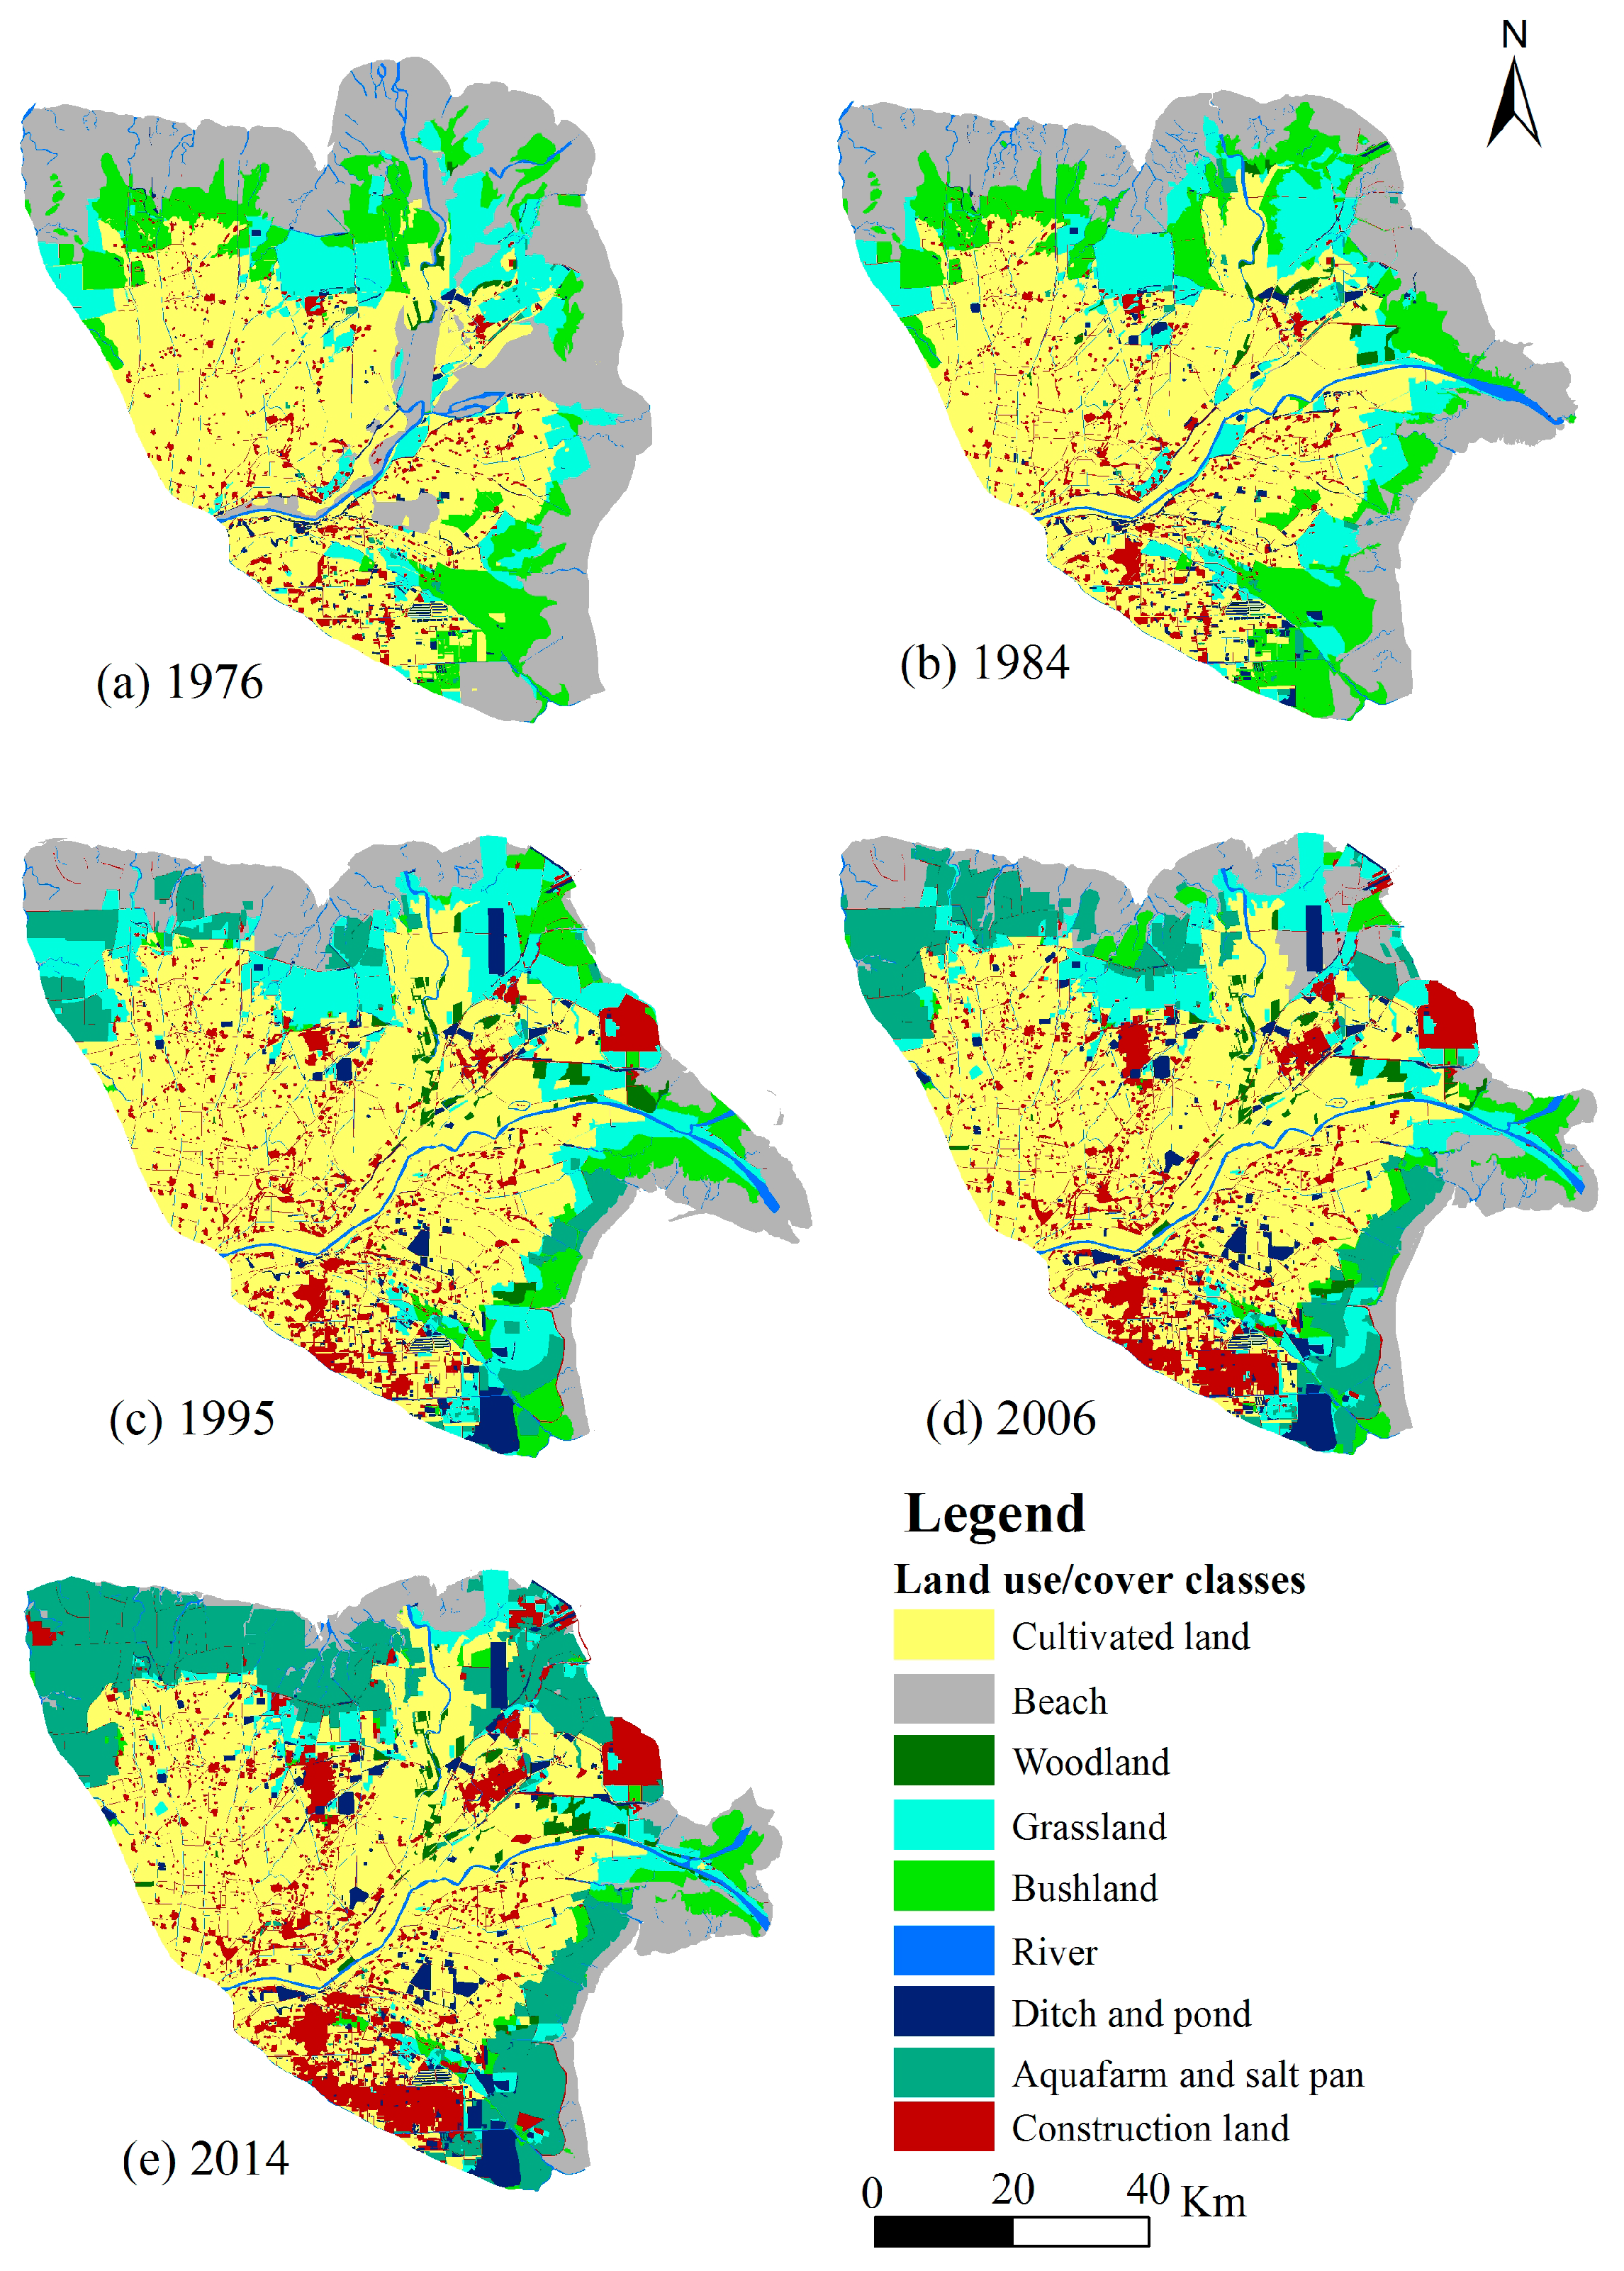
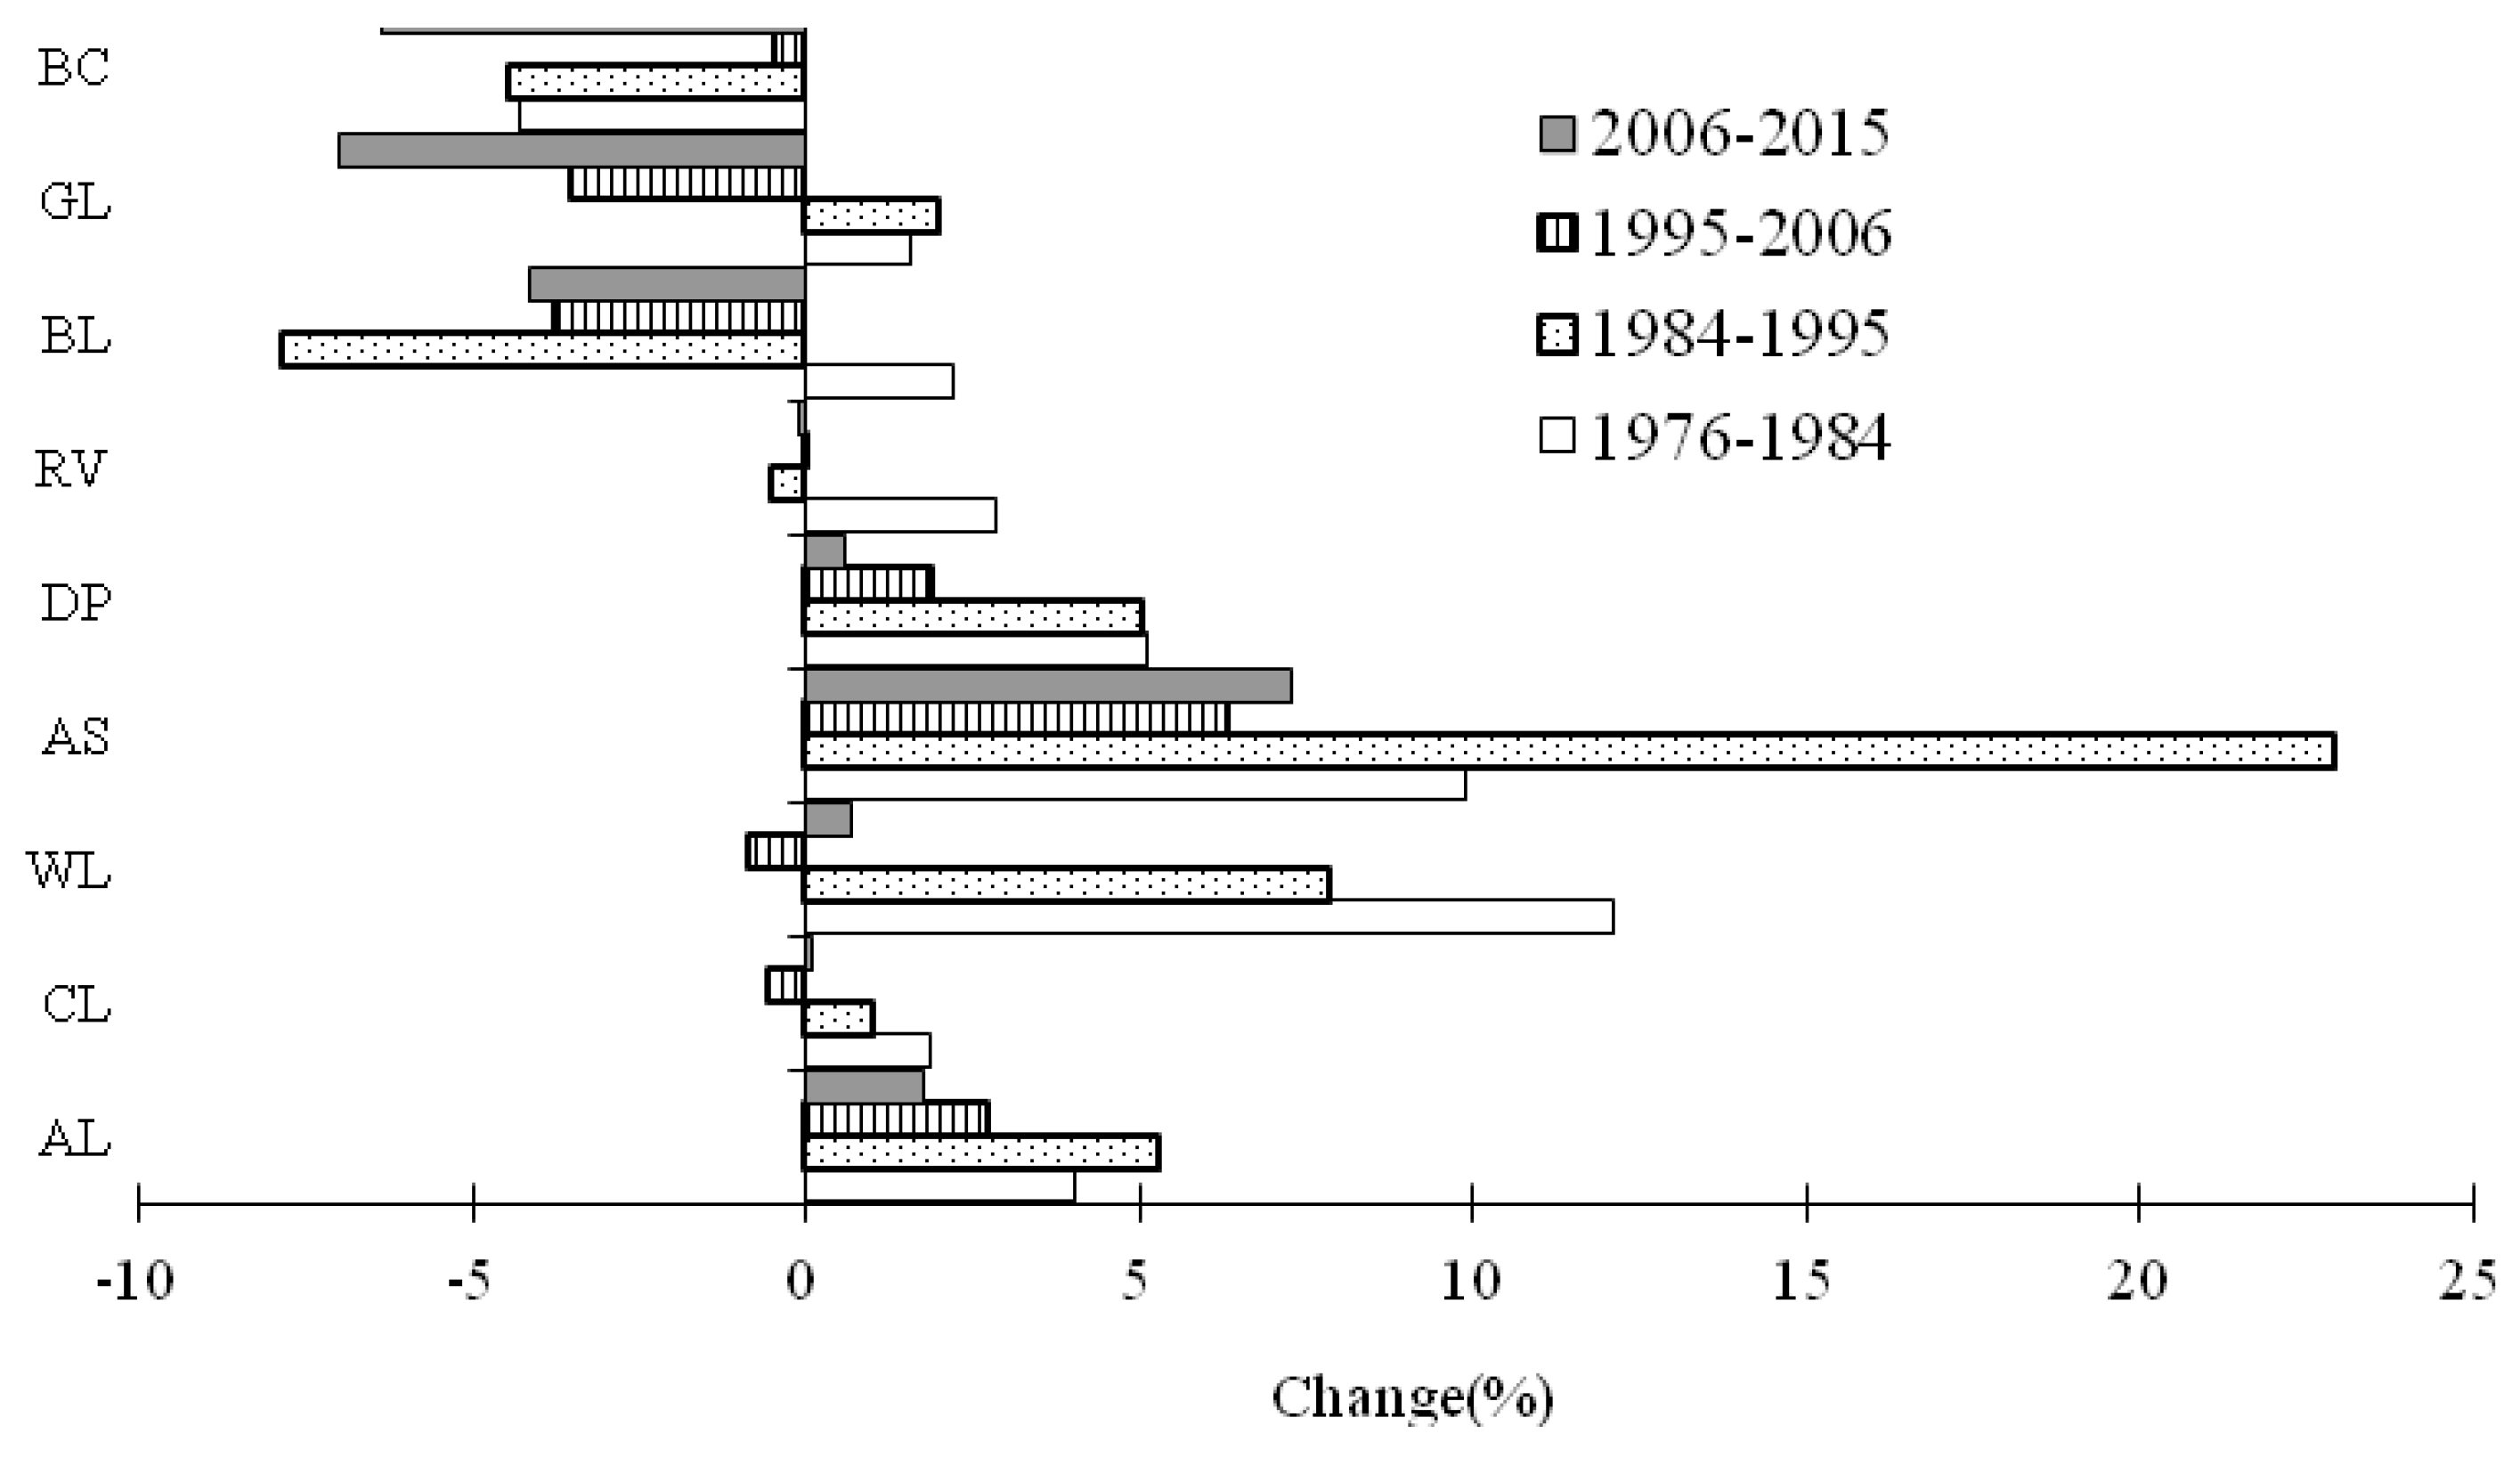
3.2. Temporal Patterns for Changes in Land Use

Figure 2 presents the land use classification for the five years/moments of image analysis (1976, 1984, 1995, 2006, and 2014). The cartographic outputs show a large change in different sectors of the YRD, with diverse trajectories. The analysis indicates some systematic transitions involving great changes of coastline shapes, as well as an increase in artificial wetland and construction land with urbanization and wetland artificialization characteristics. A more detailed observation emphasizes that the landscape change is relevant, involving a significant decrease in the natural wetland area, in particular the beach, grassland, and bushland, an increase in construction areas, and a large transformation from natural wetland to artificial wetland.
Table 6 shows the evolution of land use and occupation in the YRD, as represented by the landscape patterns for the period analyzed. In analyzing areas of land use, certain systematic transitions were observed, namely: an increase in artificial wetland with ditch, pond, aquafarm, and salt pan units; an increase in artificial land involving artificial wetland and non-wetland; a decrease of natural wetland, in particular the areas and percentages of beach, grassland, and bushland. For natural wetland, the area and percentage of beach, grassland, and bushland kept decreasing from 1976 to 2014, while the river increased slightly. The total area of natural wetland decreased from 3488.2 km2 in 1976 to 1120.9 km2 in 2014, with the annual decreasing rate of 62.3 km2/year. In contrast, both ditch and ponds (DP) and aquafarm and salt plains (AS) of artificial wetland kept increasing and showed a relative growth of 15 times of the original state. The areas of cultivated land and woodland both increased from 1976 to 2014 in spite of experiencing a decrease in the period 1995–2006. The area of construction land kept increasing from 1976 to 2014, and showed a relative growth of 274% from the original state.
The analysis of land use areas also shows an abrupt or limited temporal transitional process where cultivated land and woodland decreased in the period 1995–2006. This is likely because of a lack of suitable lands for the development of agriculture and forest planting. Furthermore, the acceleration of construction expansion occupied more cultivated land and woodland in this period.
Figure 3 shows the annual changing rate of each category, revealing a diverse changing process for each land use category in different periods, thereby showing the systematic transitions in more detail: natural wetland increased in the former stages (1976–1984 and 1984–1995) and decreased in the recent stages (1995–2006, 2006–2015), while non-wetland and artificial wetland kept increasing from 1976 to 2014. Only the periods 1995–2006 and 1976–1984 have different trajectories, marked by a decrease in the percentage of woodland and cultivated land in the period 1995–2006, and a decrease in the percentage of beach in the period 1976–1984.
Although the increase of non-wetland and artificial wetland (on the left-hand side) in contrast to natural wetland areas (on the right-hand side) was clear, the annual changing rates appeared different in different periods from 1976 to 2014. During the period 1976–1984, woodland, cultivated land, and ditch and ponds had the biggest annual increasing rate, while the river, bushland, and grassland classifications all had a positive annual increasing rate. During the 1984–1995 period, construction land and aquafarm and salt pans had the biggest annual increasing rates, while bushland had the biggest annual decreasing rate, and grassland had a positive annual increasing rate. During the period 1995–2006, none of the categories had the biggest annual increasing or increasing rate, but the woodland and cultivated land annual changing rates were negative, showing a an opposite changing trend. During 2006–2014, beach land and grassland had the biggest annual increasing rate.

3.3. Dynamic Analysis of Changes in Land Use

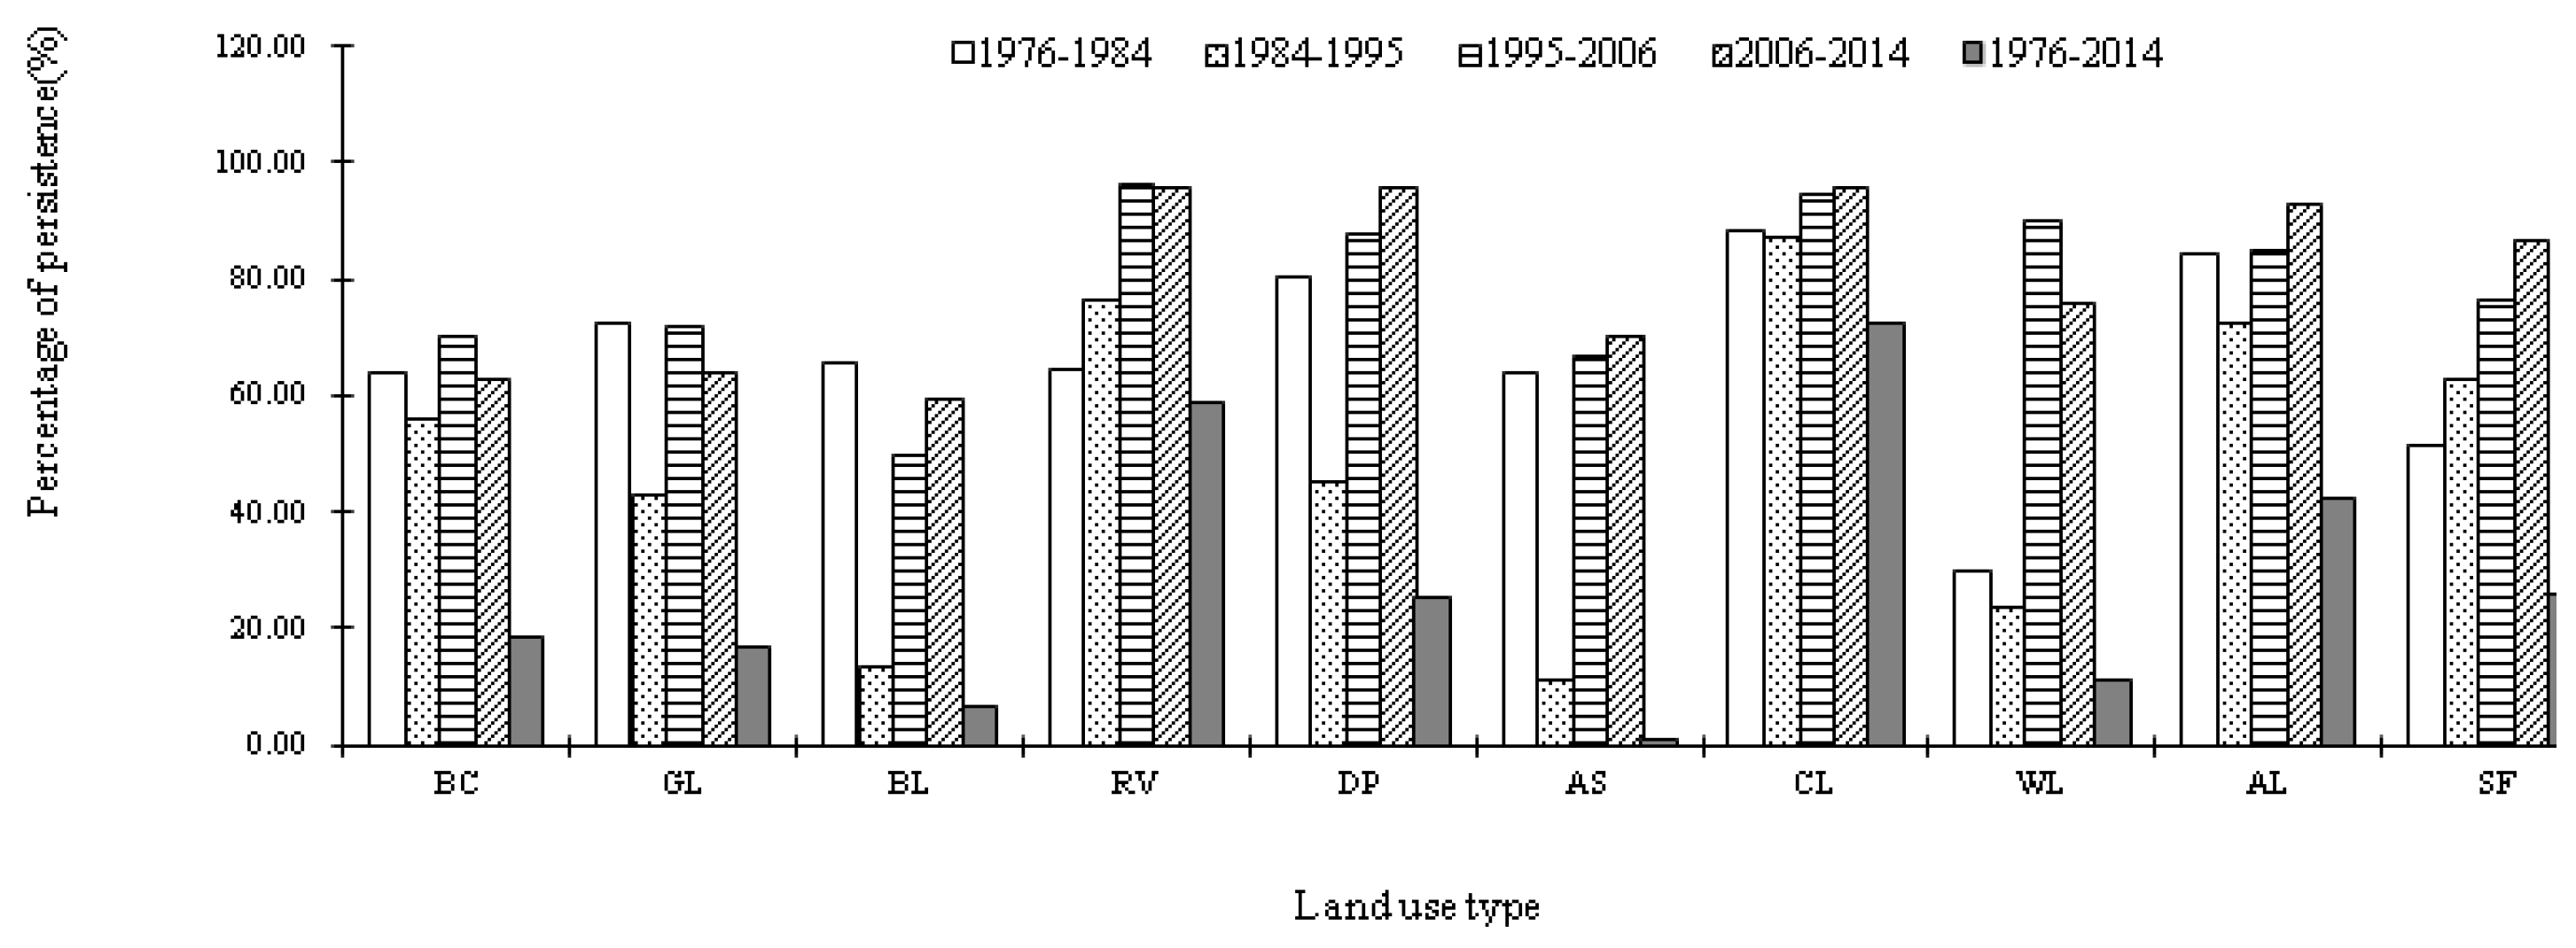
3.3.1. Stability Grade
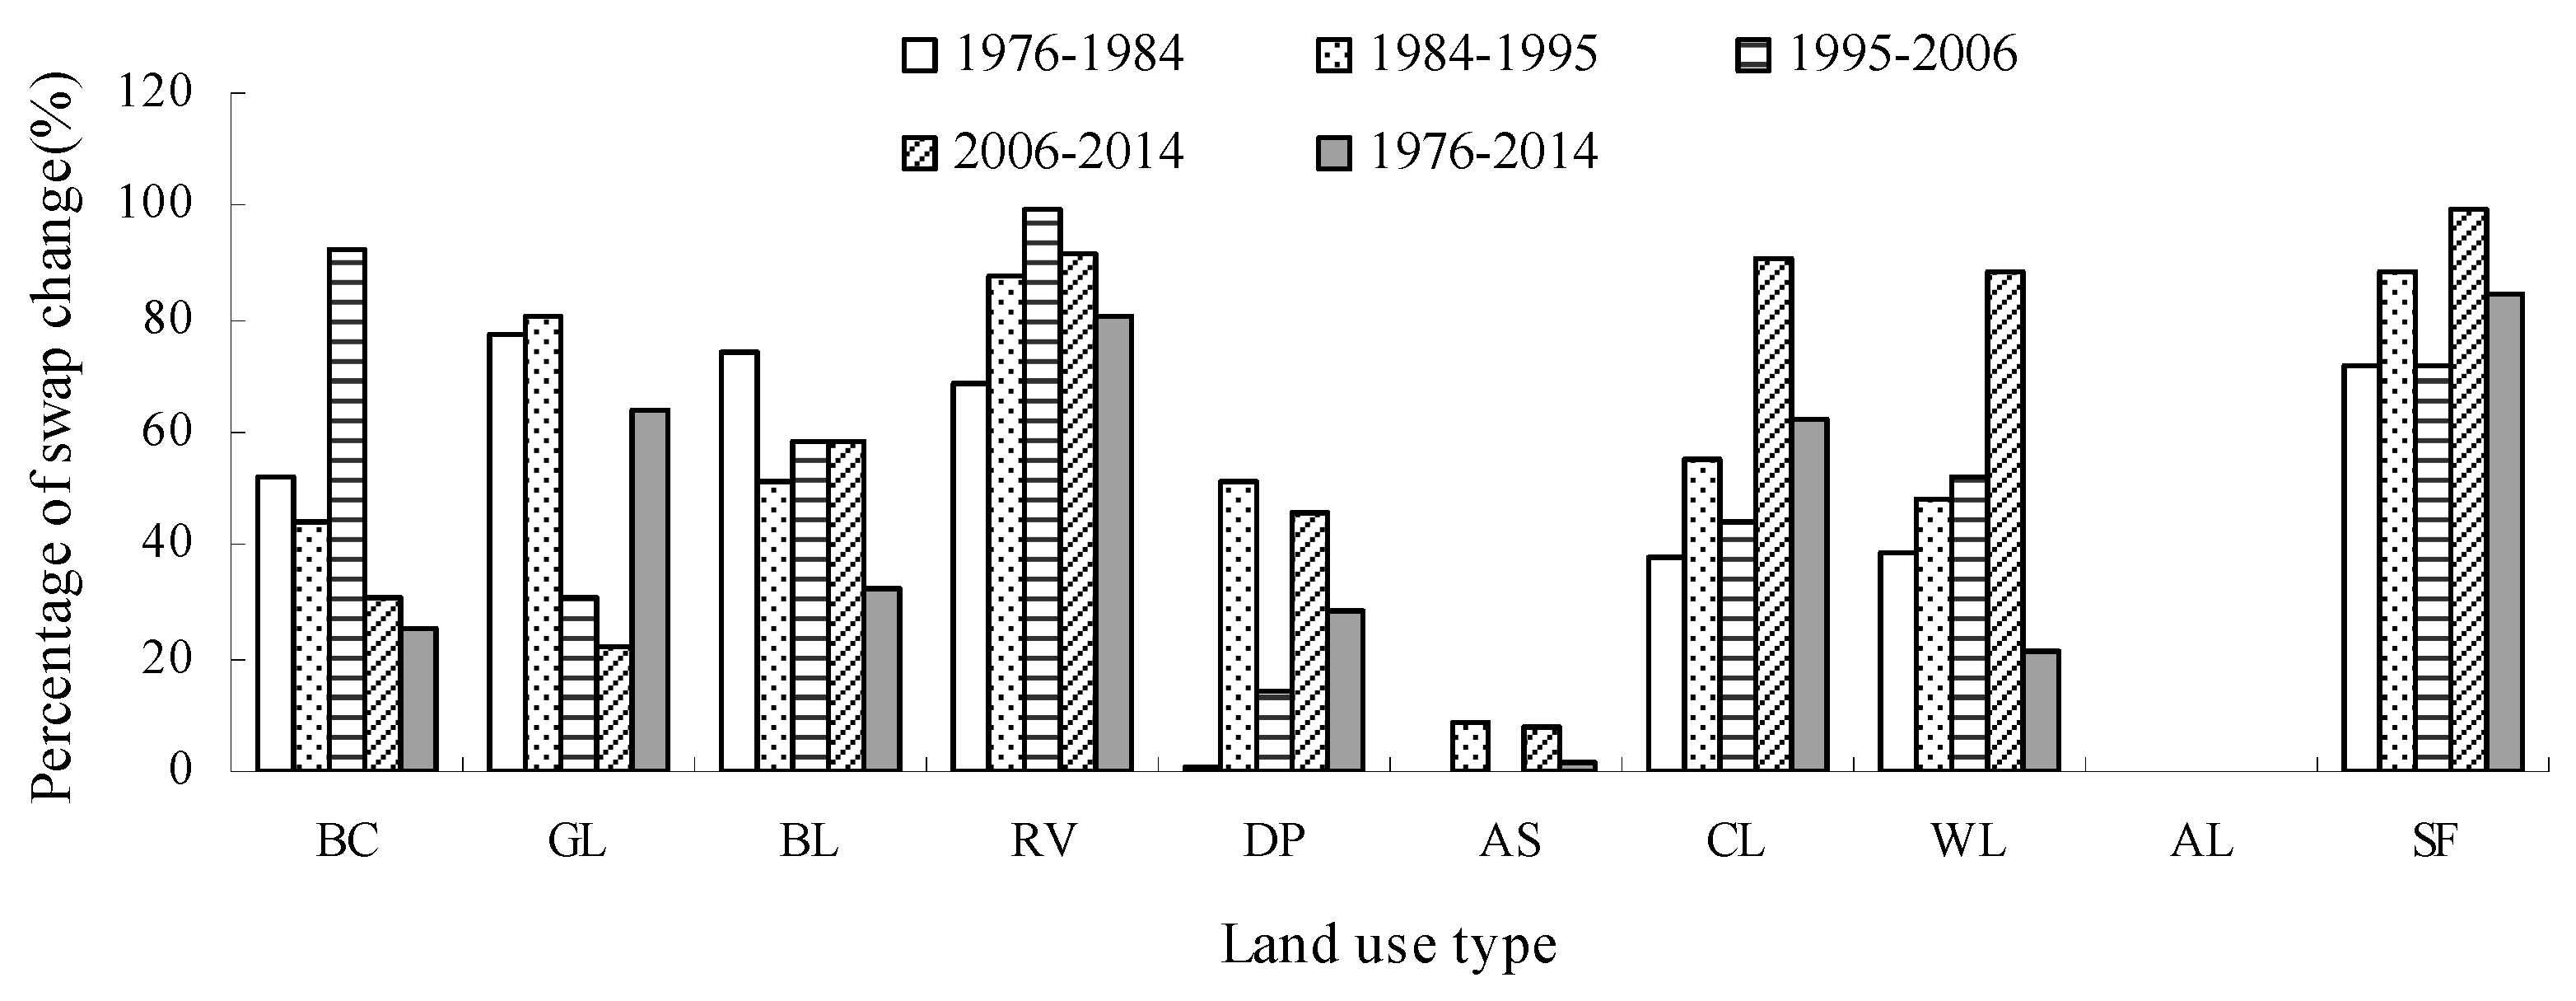
The transformation matrices for 1976–1984, 1984–1995, 1995–2006, and 2006–2014 subsequently made possible a detailed study of the dynamics of land use and occupation in five periods of analysis. The stability grade (SG) of the land cover was calculated for each transformation matrix to show the percentage of landscape that remained unchanged. About 73.2%, 62.3%, 81.2%, and 82.8% of the landscape persisted or 28.0%, 39.3%, 18.8%, and 17.2% of the landscape has changed during the period 1976–1984, 1984–1995, 1995–2006, and 2006–2014, respectively, indicating that persistence dominates in all periods. However, the stability during the period 1976–2014 was only 38.0%, and 62.1% of the YRD experienced transition from one category to a different category. The stability grade values for each land use type were calculated and are shown in Figure 4. There was a relative small stability grade in the period 1984–1995 for all the land use types in comparison with the other three periods. The stability grade values were bigger than 50% except those of grassland, bushland, woodland, and aquafarm and salt pans in the period 1984–1995, which also indicated that persistence dominates in all periods. Nevertheless, only cultivated land and river had stability grade values bigger than 60% in the whole period of 1976–2014. Therefore, the cumulative process of LUCC has resulted in the YRD having undergone significant land use/cover alterations over the 38 years considered. The analysis also showed that the land use class transfer does not take place all at once, but in a set of small sequential steps.

3.3.2. Swap Change

Percentages of swap change for each land use type in different periods and the whole YRD were calculated and are shown in Figure 4 and Figure 5. Swap change accounted for 57.6%, 53.4%, 46.0%, and 34.8% of total change during the periods 1976–1984, 1984–1995, 1995–2006, and 2006–2014, respectively, showing a LUCC evolution process from the change attributable to location to the change attributable to quantity. Swap change is greater than net change in the period before 1995, suggesting that the importance of the swapping component and common methods of land use/cover change study would miss these dynamics. During the period 1976–2014, changes in construction land experienced net change dynamics, whereas the changes in all other categories consisted of both swap and net changes. The river and sea surface both had relatively larger percentages of swap change, reflecting the transforming effects on the trail channels by the Yellow River Mouth and the coastline change caused by the accumulation of sediment and erosion. The type of change that each land use/cover experienced differs from period to period, but landscape types of natural wetland tend to have bigger swap changes than artificial land types such as aquafarms, salt pans, and construction lands.

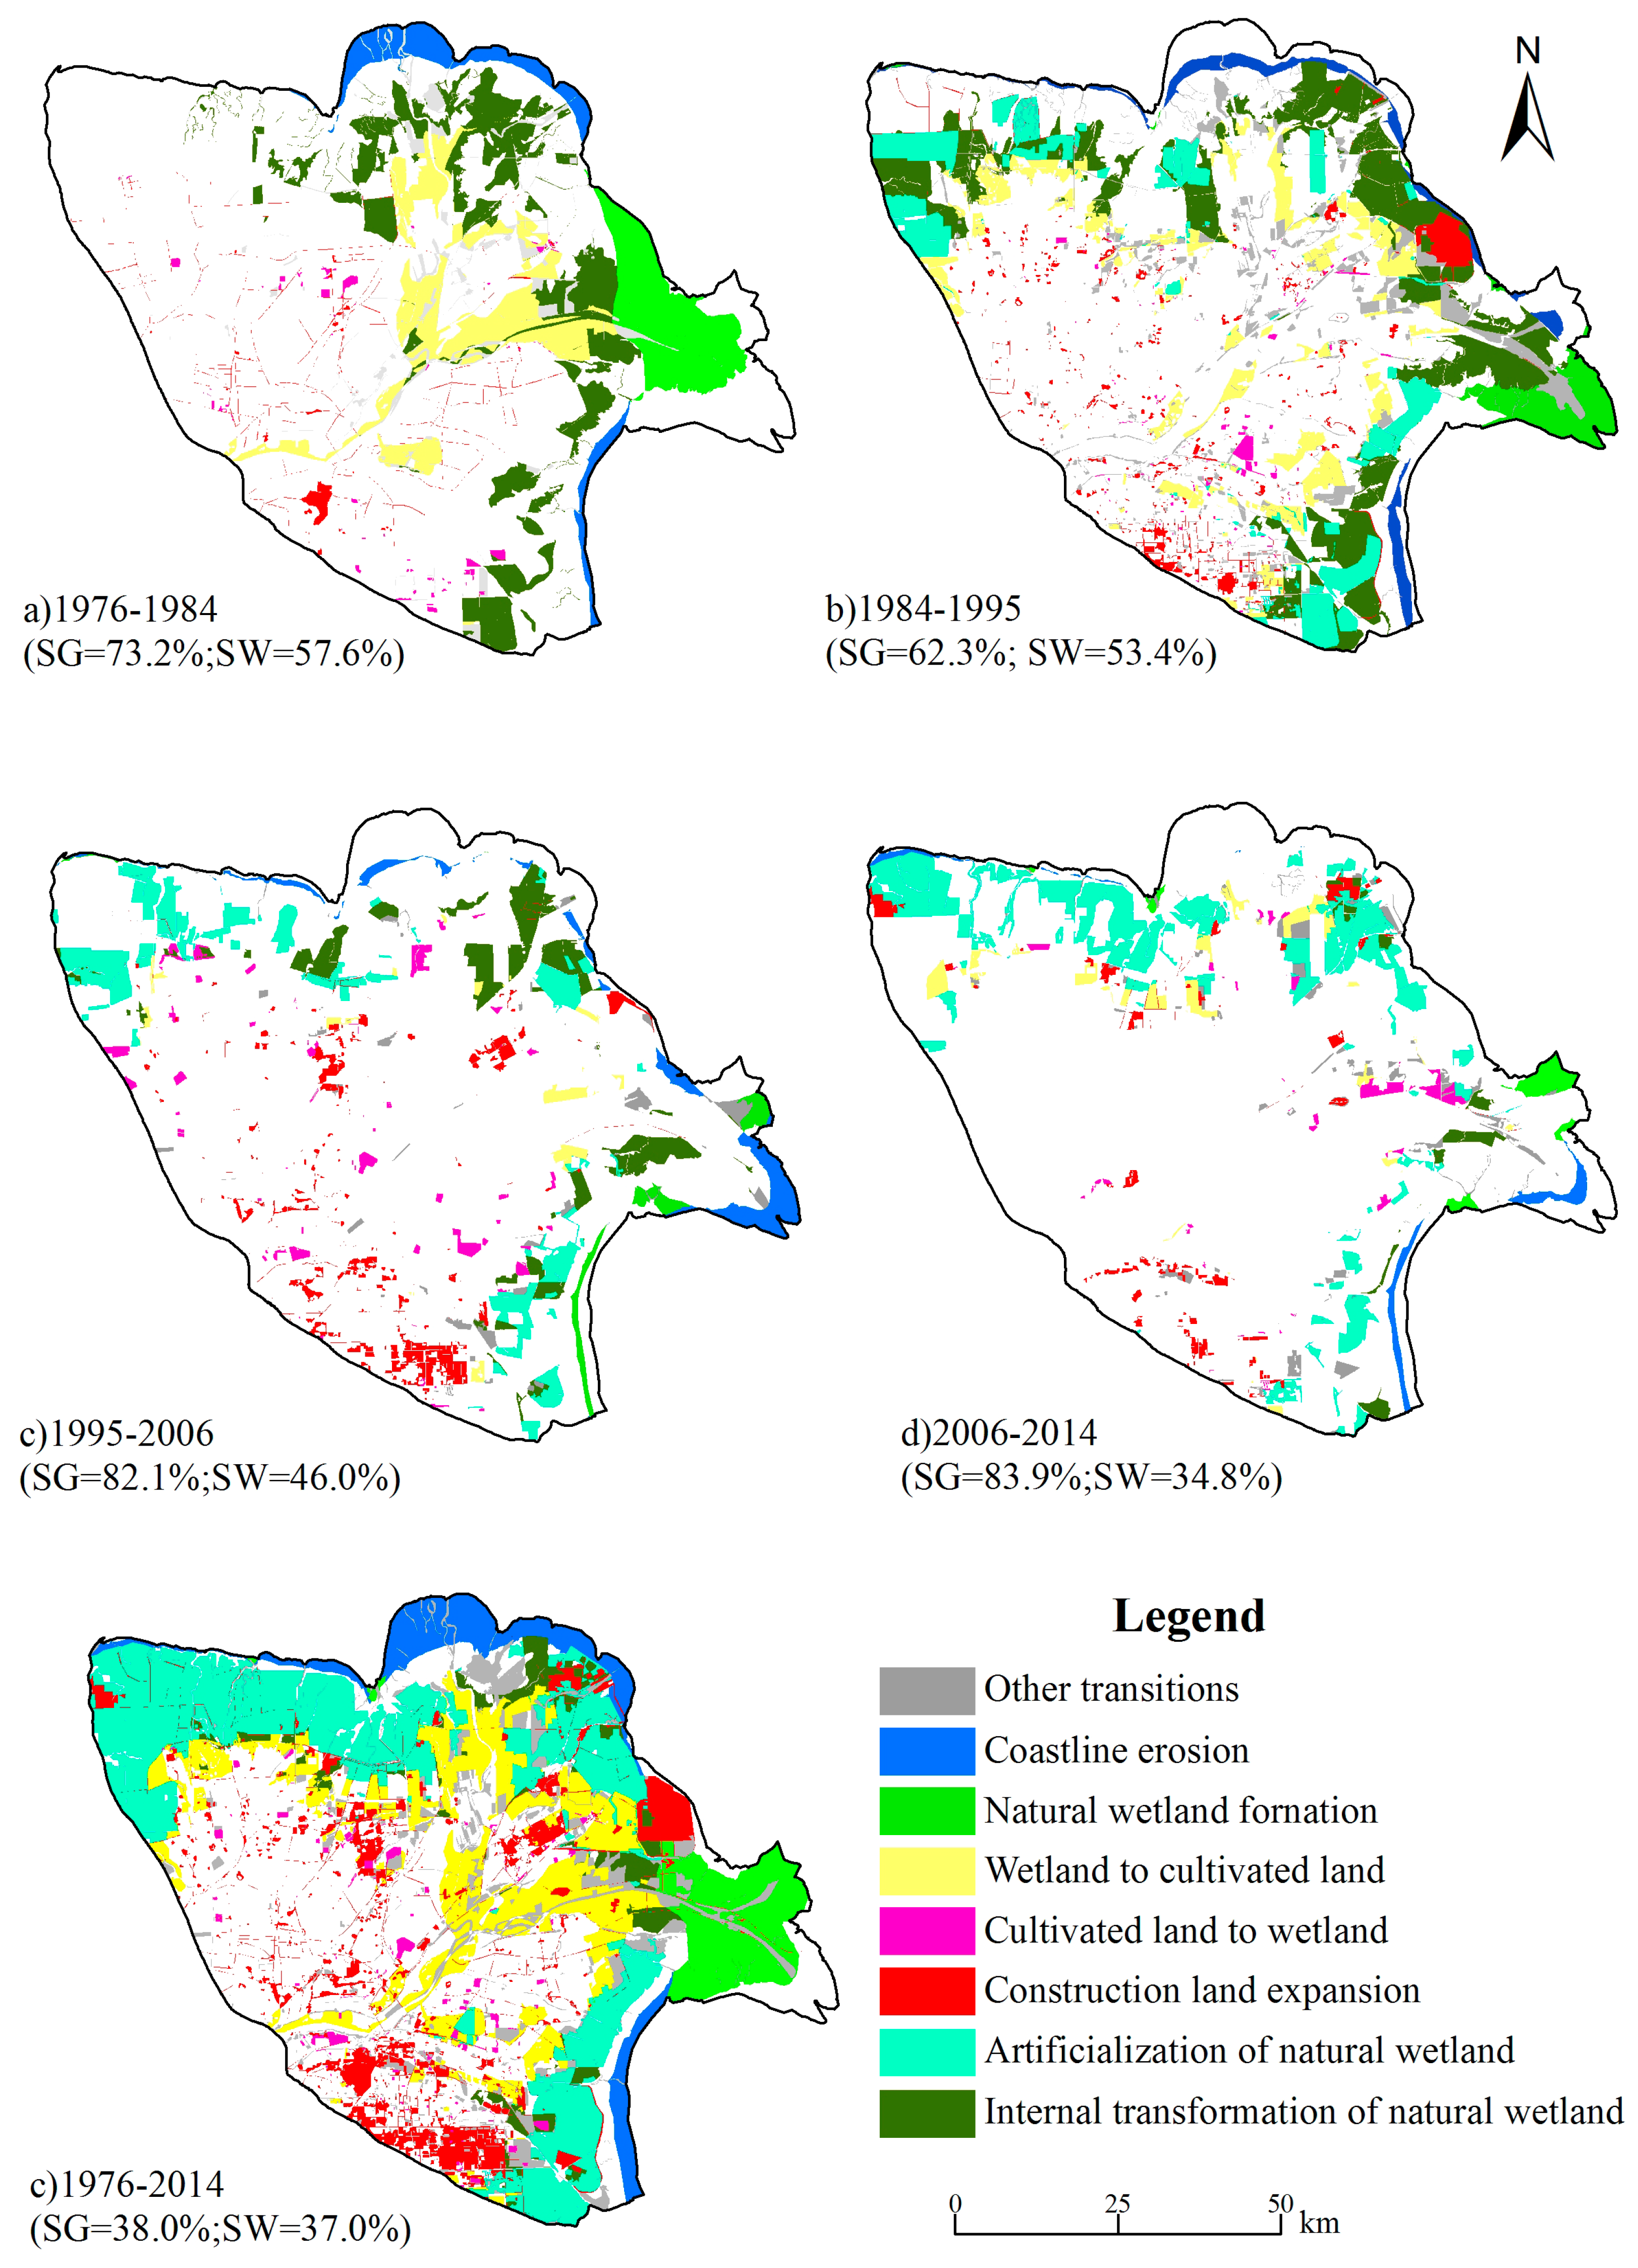
3.3.3. Main Transitions

The landscapes of wetland, cultivated land, and construction land are closely related to ecology protection and human's survival and production depends. Based on the increase or decrease of these three landscapes, the main transitions were reclassified into seven categories, namely cultivated land to wetland, construction land expansion, wetland to cultivated land, internal transformation of natural wetland, natural wetland formation, artificialization of natural wetland, and coastline erosion.
Figure 6 shows the distributions of the main transition categories in different period from 1976 to 2014, and Table 7 shows the percentages and detailed compositions of theses main transitions. The transitions between sea surface and beach land were included in the main transitions in the four periods, showing that the YRD has been experiencing the process of erosion and sediment accumulation. The main transition categories of land use dynamics from 1976 to 2014 were the artificialization of natural wetland, transition from wetland to cultivated land, and construction land expansion, with the percentages of 32.6%, 20.3%, and 12.9%, respectively. During the periods 1976–1984 and 1984–1995, the main transition categories were characterized by internal transformation of natural wetland, transition from wetland to cultivated land, and natural wetland’s formation and erosion. However, the main transition categories are predominantly natural wetland artificialization and construction expansion in the periods 1995–2006 and 2006–2014. The change of main transition category also revealed a continuous increase in artificial areas, indicating that land use trajectories were veering towards artificial surfaces.
Although the main transition categories were characterized by artificialization, the composition details of main transition categories appeared different in different periods from 1976 to 2014. During 1976–2014, the form of natural wetland artificialization was mainly aquafarm and salt pan. The form of the transition from cultivated land to wetland was ditches and ponds in the period 1976–1984 and 1984–1995, The transitions of cultivated land to wetland were mainly in the form of the building of ditches and ponds in the periods 1976–1984 and 1984–1995, and there were small percentages of transitions from cultivated land to grassland and aquafarm land in the periods 1995–2006 and 2006–2014 which were caused by the policy of returning farmland to wetland and a new agriculture-fishery mode. The main source of construction land expansion was cultivated land in the four periods, but beach land and grassland also became part of the main sources in the last three periods. Both the composition types and percentages of natural wetland internal transformation decreased from early periods to late periods. The composition types only included the transition from beach to grassland and the transition from bushland to grassland. These results revealed that natural wetland internal transformation was the medium process of transition from the natural wetland to artificial land. The transitions from the beach, grassland, and bushland to cultivated land were the main transitions in the four periods, showing that the YRD had continuous agricultural development process from 1976 to 2014. The main land use types for the transitions from natural wetland to artificial wetland were aquafarm and salt pan which occurred in the last three periods. The main occupation land of construction land was cultivated land in the former periods (1976–1984 and 1984–1995), while grassland became the other main occupation source in the last period (2006–2014). The irrigation and water conservancy construction in the period 1995–2006 was one of the major types of transfer.

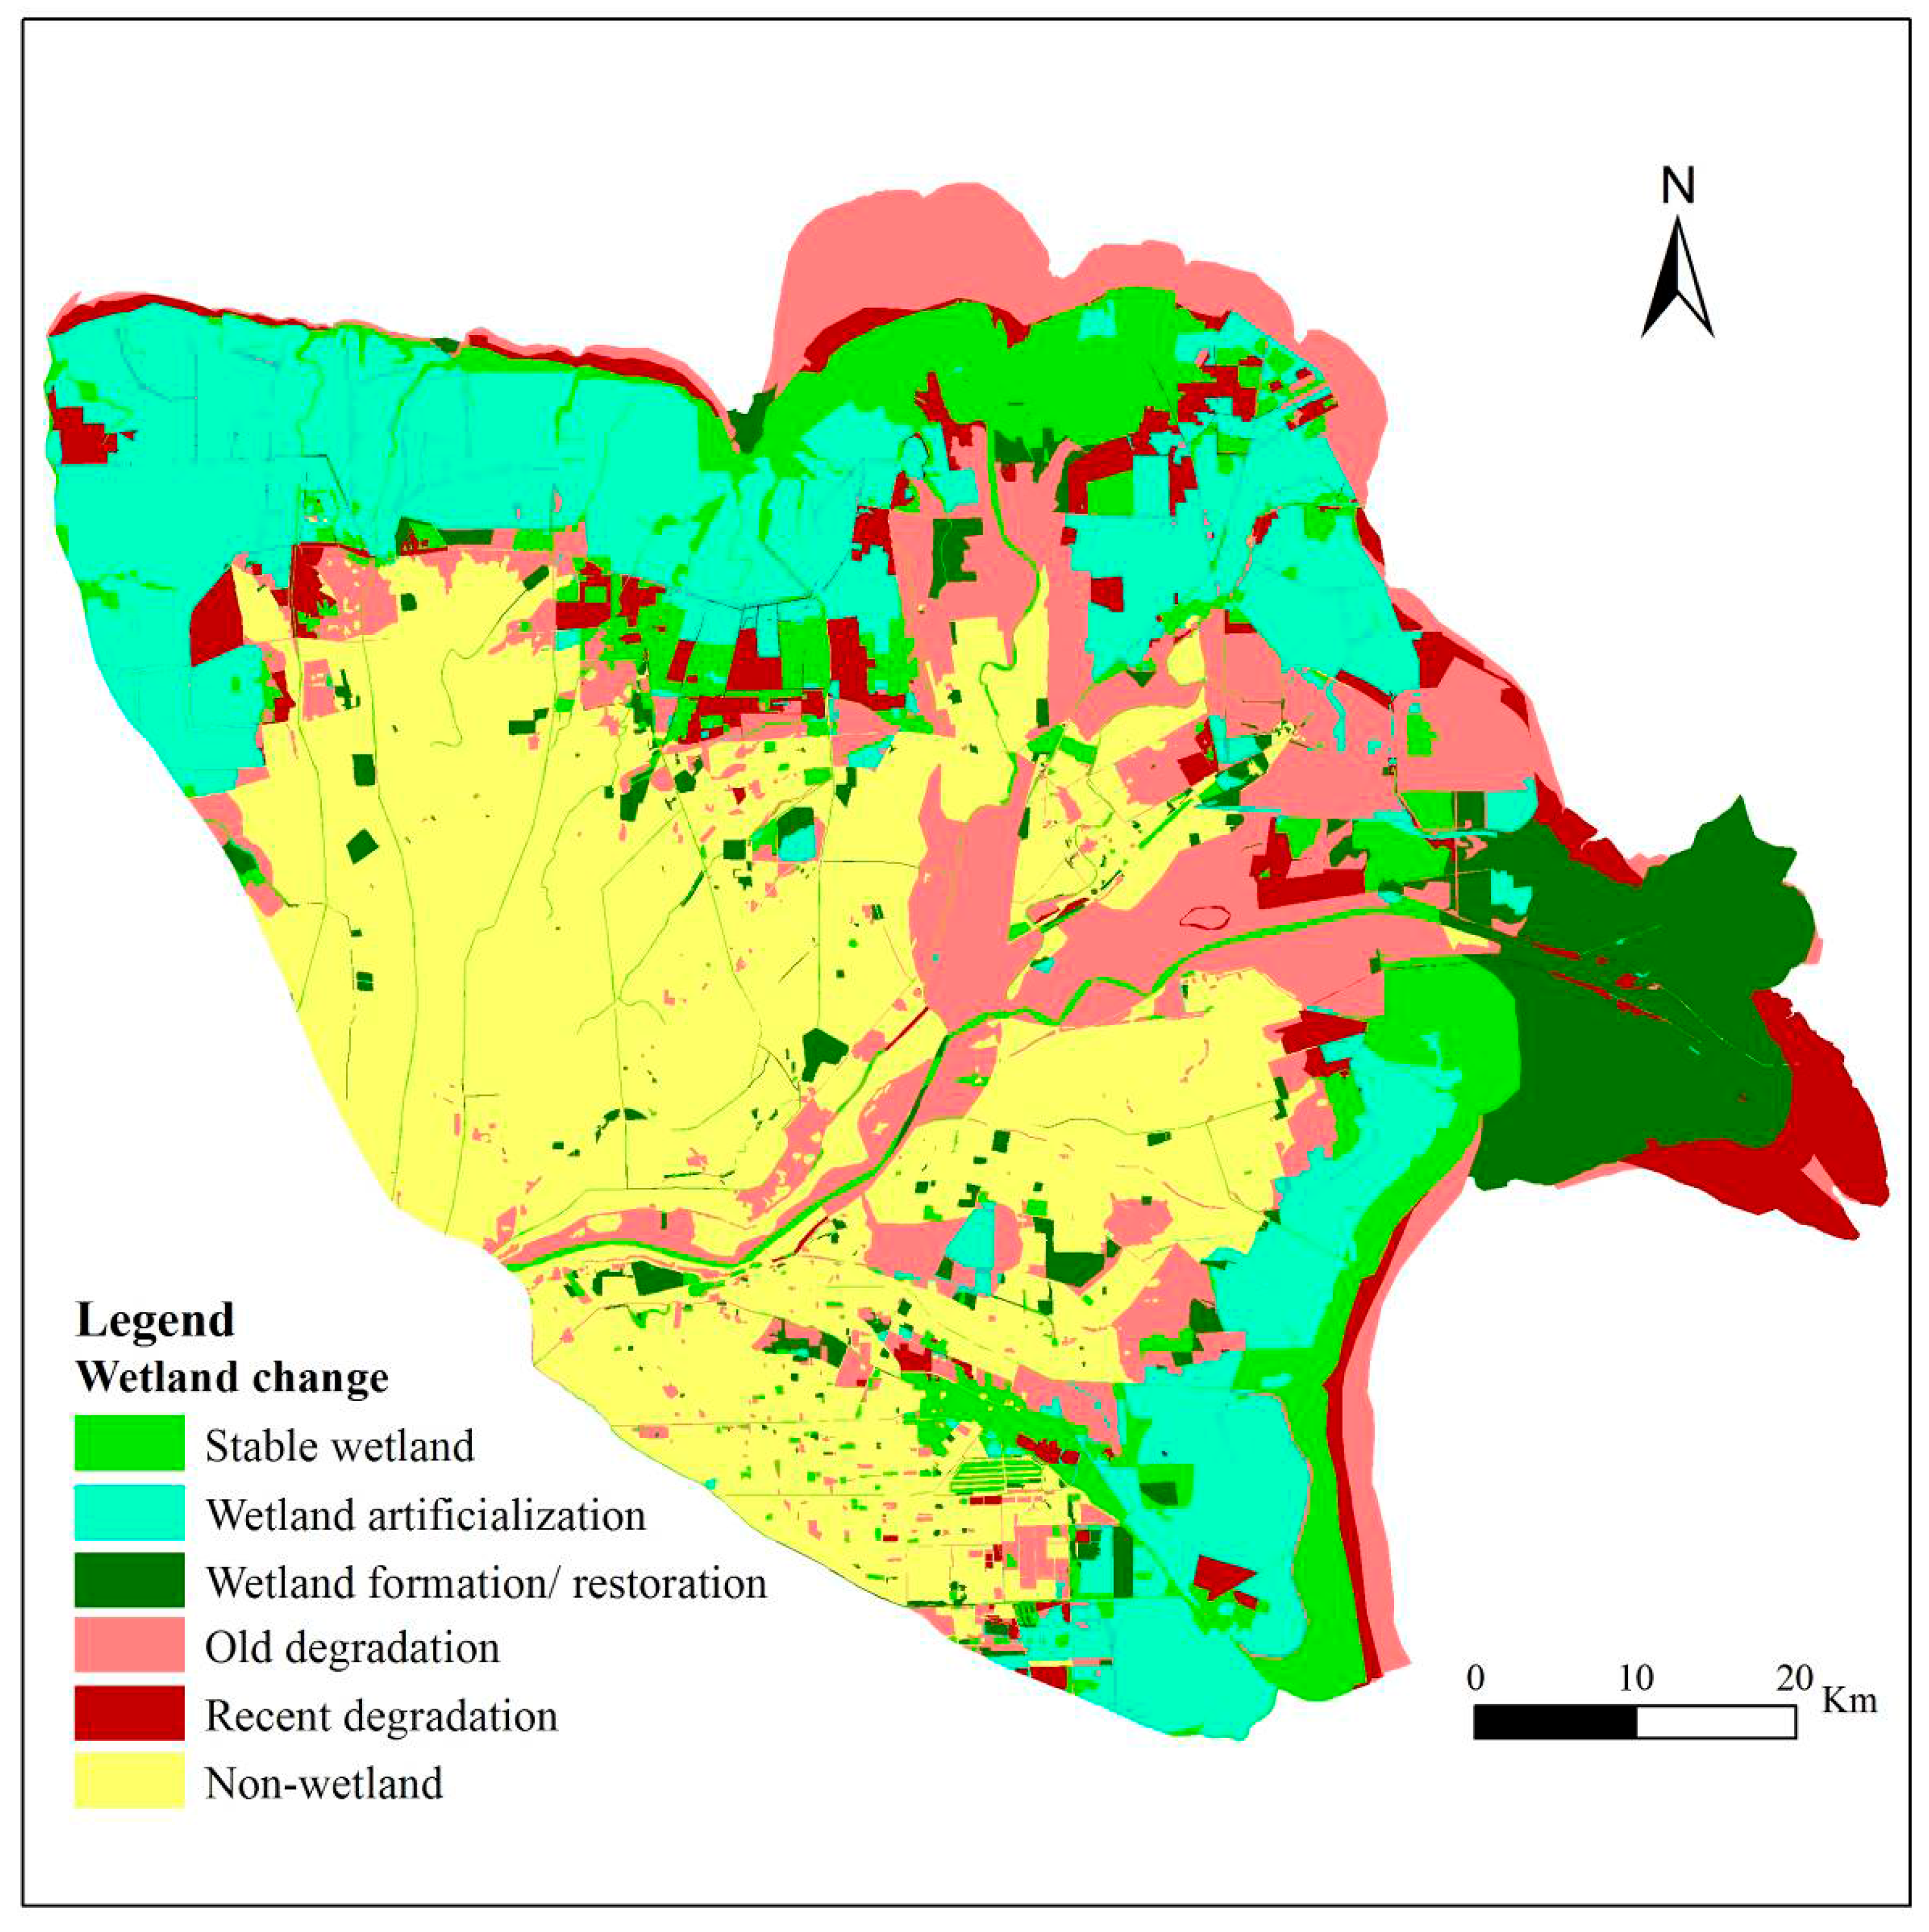
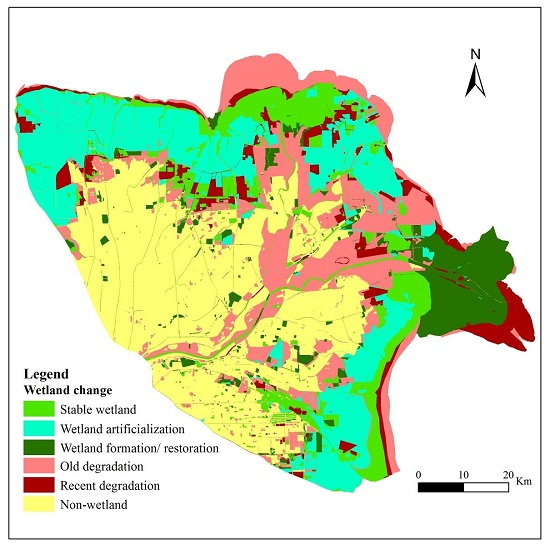
3.4. Trajectory of Wetland Change

The maps of six wetland trajectory types were shown in Figure 5, and areas and percentages of land use type in 1976 and 2014 for each wetland trajectory types were shown in Table 6. The results show that the classes of wetland changed greatly, even for the area percentages of wetland classes of stable wetland. The area of stable wetland was 746.7 km2, accounting for 28.4% of the total wetland area in 2014. Wetland artificialization was mainly distributed beside stable wetland had an area of 1361.4km2 and the main destination class was aquafarm and salt pan, accounting for 89.2%. Old degradation mainly distributed along the Yellow River and its old course was in the north (Diaokou Ditch). Recent degradations displayed scattered distribution except for a concentrated distribution outside the mouth of the Yellow River in the east. The area percentages for the old degraded and recently degraded wetlands were caused by coastline change (percentage to sea surface in 2014) which were 23.3% and 42.5%, respectively, which indicated that human activities other than coastline change were the main driving forces of wetland degradation. Wetland formation/restoration mainly came from the result of estuarine deposits in the mouth of the Yellow River (70.6%), followed by reservoir construction in the cultivated lands (13.2%).
During 1976–2014, the wetland change in the YRD included wetland formation/restoration, wetland degradation, and wetland artificialization, but the main wetland changes were wetland degradation and wetland artificialization (Figure 7 and Table 8). The areas of wetland degradation (1645.1 km2) and wetland artificialization (1361.4 km2) were much greater than that of the wetland formation/ restoration (524.1 km2).

4 Discussion

The five cartographic outputs for changes in land use underline the major decrease in natural wetland areas, the increase in artificial wetland and non-wetland, especially in regards to the aquafarms, salt pans, and construction lands. The land use dynamics from 1976 to 2014 are similar with the observations before 2009 made by Zong [27], Zhang et al. [30], Sun et al. [28], Chen et al. [57], and Wang et al. [58]. About 28.0%, 39.3%, 18.8%, and 17.2% of the landscape in the YRD had experienced transition from one category to another category of land use/cover during the periods 1976–1984, 1984–1995, 1995–2006, and 2006–2014, respectively, indicating that persistence dominates in each period. However, the cumulative process of LUCCs had made the YRD undergo significant land use/cover alterations, and about 62.1% of the YRD experienced transition from one category to a different category of land use/cover over the 38 years considered. Therefore, the analysis also showed that the land use class transfer does not take place all at once, but in a set of small sequential steps.
Although an increase in all artificial land types (artificial wetland and non-wetland) was observed from 1976 to 2014, the aquafarm and salt pan land classification had the highest annual increasing area and rate, followed by construction land. The ditches and ponds, woodland, and cultivated land classifications mainly increased in the former two periods (1976–1984 and 1984 to 1995), and woodland and cultivated land decreased in the period 1995–2006, which was mainly caused by the occupation of construction land.
Swap change accounted for 57.6%, 53.4%, 46.0%, and 34.8% of total change during the period 1976–1984, 1984–1995, 1995–2006, and 2006–2014, respectively, showing a LUCC evolution process from the change attributable to location to that attributable to quantity. Swap change is greater than net change in the period before the 1995, demonstrating the importance of the swapping component and suggesting that common methods of land use/cover change study would miss these dynamics. The type of change that each land use/cover experienced differs from period to period, but landscape types of natural wetland tend to have bigger swap changes than artificial land types such as aquafarm, salt pan, and construction land classifications.
During the periods 1976–1984 and 1984–1995, the main transitions were characterized by internal transformation of natural wetland, transition from wetland to cultivated land, and natural wetland’s formation and erosion. However, the main transitions are predominantly natural wetland artificialization and construction expansion in the period 1995–2006 and 2006–2014. The main transition valuation also revealed a continuous increase in artificial areas, indicating that land use trajectories were veering towards artificial surfaces. During 1976–2014, the destination of natural wetland artificialization was mainly aquafarm and salt pan, which will have likely exacerbated land subsidence, sea water invasion, and salinization [34,42,59].
Wetland change trajectory results demonstrate that the main wetland changes were wetland degradation and wetland artificialization. The percentages of old degradation and recent degradation transferred to sea surface were 23.2% and 42.5%, respectively. Meanwhile, the overlay analysis of wetland change trajectory map and coastline evaluation map shows 73.3% of old degradation wetland and 53.8% of recent degradation wetland are distributed in the stable land from 1976 to 2014. Therefore, coastline change is the subordinate effect for natural wetland degradation in comparison with human activities. The transitions of cultivated land to wetland were mainly a result of the building of ditches and ponds in the periods 1976–1984 and 1984–1995, and there were small percentages of transitions from cultivated land to grassland and aquafarm land in the periods 1995–2006 and 2006–2014, which were caused by the policy of returning farmland to wetland and a new agriculture-fishery mode.
The footprint of human disturbance on the YRD is becoming larger and larger, and the artificialization rate of the YRD increased from 40.1% in 1976 to 81.1% in 2014. The wetlands in the YRD are experiencing a continuous development and evolution process under the combined effects of natural factors and human factors. It is certain that the degree of human disturbance tended to increase with time, and the degree of influence has become deeper and deeper. Currently, the YRD is in a period of rapid development, and large-scale development and construction activities are inevitable. Although the establishment of Binzhou Shell Islands and Wetland Nature Reserve and the Yellow River Delta Nature Reserve and implementation of wetland restoration projects for the protection of coastal wetlands plays important role in preventing wetlands from loss and degradation, the overall loss and degradation trend is unlikely to change in the short-term. As such, the protection of coastal wetland ecological environment remains very difficult and long-term.

5. Conclusions

This research quantified the LUCC process, explored the systematic transitions of land cover, and identified wetland change trajectory for the period 1976–2014 in the Yellow River Delta through enhanced transition matrix and relevant quantitative indicators. This study provides reliable LUCC data, which is useful for the detection and refinement of conservation policies aimed at protecting estuarine wetland. The main wetland changes were wetland degradation and wetland artificialization, and anthropogenic activities were the major driving forces of wetland degradation. Our findings suggest that development of salt pan industry and the construction of built spaces occupying natural wetland needs to be controlled and well managed in order to help maintain the natural habits and mitigate seawater intrusion and soil salinization. Finally, this study highlighted that the identification of systematic transitions and their spatial statistical modeling under GIS environment enable researchers and planners to focus on the most important signals of systematic landscape transitions and allow a better understanding of the proximate causes of changes.

Acknowledgments

This research was supported by the National Natural Science Foundation of China (No. 41401663), the Natural Science Foundation of Shandong Province (No. ZR2016EEM18), the Science Foundation of Ministry of Education of China (No. 12YJC790254), and the Excellent Young Scholars Research Fund of Shandong Normal University. We would like to thank the Editor and the anonymous reviewers for providing constructive comments and suggestions.

Author Contributions

Baolei Zhang, Shumin Zhang, and Chaoyang Feng contributed to the research design. Qiaoyun Zhang contributed to data processing and analysis of datasets. Shumin Zhang and Baolei Zhang wrote the paper. Qingyu Feng and Chaoyang Feng reviewed the manuscript and offered useful insights for its improvement.

Conflicts of Interest

The authors declare no conflict of interest.

Abbreviations

The following abbreviations are used in this manuscript:
YRDYellow River Delta
LUCCLand use/cover change
KCKappa coefficient
SGStability grade
SWSwap change
BCBeach
GLGrassland
BLBushland
RVRiver
DPDitch and ponds
ASAquafarm and salt pan
WLWoodland
CLCultivated land
ALConstruction land
SFSea surface

References

  1. Turner, B.L., II; Skole, D.; Sanderson, S.; Fischer, G.; Fresco, L.; Leemans, R. Land-Use and Land-Cover Change-Science/Research Plan; IGBP Report No.35 and HDP Report No.7; IGBP and HDP Secretariats: Stochkholm, Sweden; Geneva, Switzerland, 1995. [Google Scholar]
  2. Houghton, R.A.; Hackler, J.L.; Lawrence, K.T. The US carbon budget: Contribution from land use change. Science 1999, 285, 574–578. [Google Scholar] [CrossRef] [PubMed]
  3. Shi, P.J.; Gong, P.; Li, X.B. Methods and Practice of Land Use Changes in Research; Science Press: Beijing, China, 2000. (In Chinese) [Google Scholar]
  4. Lawrence, P.L.; Chase, T.N. Investigating the climate impacts of global land cover change in the community climate system model. Int. J. Clim. 2010, 30, 2066–2087. [Google Scholar] [CrossRef]
  5. Liu, J.Y.; Liu, M.L.; Deng, X.Z.; Zhuang, D.F.; Zhang, Z.X.; Luo, D. The land use and land cover change database and its relative studies in China. J. Geogr. Sci. 2002, 12, 275–282. [Google Scholar]
  6. Dewan, A.M.; Yamaguchi, Y.; Rahman, M.Z. Dynamics of land use/cover changes and the Analysis of Landscape fragmentation in Dhaka Metropolitan, Bangladesh. GeoJournal 2012, 77, 315–330. [Google Scholar] [CrossRef]
  7. Antrop, M. Why landscapes of the past are important for the future. Landsc. Urban Plan. 2005, 70, 21–34. [Google Scholar] [CrossRef]
  8. Hasse, J.E.; Lathrop, R.G. Land resource impact indicators of urban sprawl. Appl. Geogr. 2003, 23, 159e175. [Google Scholar] [CrossRef]
  9. Tavares, A.O.; Pato, R.L.; Magalhães, M.C. Spatial and temporal land use change and occupation over the last half century in a peri-urban area. Appl. Geogr. 2012, 34, 432–444. [Google Scholar] [CrossRef]
  10. Li, S.N.; Wang, G.X.; Deng, W.; Hu, Y.M.; Hu, W.W. Influence of hydrology process on wetland landscape pattern: A case study in the Yellow River Delta. Ecol. Eng. 2009, 35, 1719–1726. [Google Scholar] [CrossRef]
  11. Pontius, R.G., Jr.; Shusas, E.; McEachern, M. Detecting important categorical land changes while accounting for persistence. Agric. Ecosyst. Environ. 2004, 101, 251–268. [Google Scholar] [CrossRef]
  12. Braimoh, A.K. Random and systematic land-cover transitions in northern Ghana. Agric. Ecosyst. Environ. 2006, 113, 254–263. [Google Scholar] [CrossRef]
  13. Lambin, E.F.; Geist, H.J.; Lepers, E. Dynamics of land-use and land-cover change in tropical regions. Ann. Rev. Environ. Resour. 2003, 28, 205–241. [Google Scholar] [CrossRef]
  14. Lu, D.; Mausel, P.; Brondízio, E.; Moran, E. Change detection techniques. Int. J. Remote Sens. 2004, 25, 2365–2407. [Google Scholar] [CrossRef]
  15. Pontius, R.G.; Petrova, S.H. Assessing a predictive model of land change using uncertain data. Environ. Model. Softw. 2010, 25, 299–309. [Google Scholar] [CrossRef]
  16. Manandhar, R.; Odeh, I.O.A.; Pontius, R.G. Analysis of twenty years of categorical land transitions in the lower hunter of new South Wales, Australia. Agric. Ecosyst. Environ. 2010, 135, 336–346. [Google Scholar] [CrossRef]
  17. Isabel, P.; Cunha, M.; Pereira, L. Remote sensing based indicators of changes in a mountain rural landscape of northeast Portugal. Appl. Geogr. 2011, 31, 871–880. [Google Scholar]
  18. Johnson, B.G.; Zuleta, G.A. Land-use land-cover change and ecosystem loss in the Espinal ecoregion, Argentina. Agric. Ecosyst. Environ. 2013, 181, 31–40. [Google Scholar] [CrossRef]
  19. Liu, R.; Zhu, D.L. Methods for detecting land use changes based on the land use transition matrix. Resour. Sci. 2010, 32, 1544–1550. [Google Scholar]
  20. Zhou, Q.; Li, B.; Kurban, A. Trajectory analysis of land cover change in arid environment of China. Int. J. Remote Sens. 2008, 29, 1093–1107. [Google Scholar] [CrossRef]
  21. Wang, H.; Gao, Y.; Pu, R.L.; Ren, L.L.; Kong, Y.; Li, H.; Li, L. Natural and anthropogenic influences on a red-crowned crane habitat in the Yellow River Delta Natural Reserve, 1992–2008. Environ. Monit. Assess. 2014, 186, 4013–4028. [Google Scholar] [CrossRef] [PubMed]
  22. Wang, H.; Gao, Y.; Pu, R.L.; Ren, L.L.; Kong, Y.; Li, H.; Li, L. Assessment of the red-crowned crane habitat in the Yellow River Delta Nature Reserve, East China. Reg. Environ. Chang. 2012, 31, 115–123. [Google Scholar] [CrossRef]
  23. Bi, X.L.; Wang, B.; Lu, Q.S. Fragmentation effects of oil wells and roads on the Yellow River Delta, North China. Ocean Coast Manag. 2011, 54, 256–264. [Google Scholar] [CrossRef]
  24. Fan, H.; Huang, H.J. Response of coastal marine eco-environment to river fluxes into the sea: A case study of the Huanghe (Yellow) River mouth and adjacent waters. Mar. Environ. Res. 2008, 65, 378–387. [Google Scholar] [CrossRef] [PubMed]
  25. He, X.H.; Hörmann, G.; Strehmel, A.; Guo, H.L.; Fohrer, N. Natural and Anthropogenic Causes of Vegetation Changes in Riparian Wetlands Along the Lower Reaches of the Yellow River, China. Wetlands 2015, 35, 391–399. [Google Scholar] [CrossRef]
  26. Kong, D.X.; Miao, C.Y.; Borthwick, A.G.L.; Duan, Q.Y.; Liu, H.; Sun, Q.H.; Ye, A.Z.; Di, Z.H.; Gong, W. Evolution of the Yellow River Delta and its relationship with runoff and sediment load from 1983 to 2011. J. Hydrol. 2015, 520, 157–167. [Google Scholar] [CrossRef]
  27. Zong, X.Y. Study on Dynamic Changes of Wetland Landscape Pattern in Yellow River Delta. J. Geo-inf. Sci. 2009, 11, 91–97. [Google Scholar] [CrossRef]
  28. Sun, X.Y.; Su, F.Z.; Lv, T.T. Analysis of temporal-spatial changes in wetlands over the Yellow River estuary. Resour. Sci. 2011, 33, 2277–2284. [Google Scholar]
  29. Zhang, B.L.; Yin, L.; Zhang, S.M.; Feng, C.Y. Assessment on characteristics of LUCC process based on complex network in Modern Yellow River Delta, Shandong Province of China. Earth Sci. Inform. 2016, 9, 83–93. [Google Scholar] [CrossRef]
  30. Zhang, X.L.; Ye, S.Y.; Yin, P. Characters and successions of natural wetland vegetation in Yellow River Delta. Ecol. Environ. Sci. 2009, 18, 292–298. [Google Scholar]
  31. Li, S.N.; Wang, G.X.; Deng, W.; Hu, Y.M. Effects of runoff and sediment variation on landscape pattern in the Yellow River Delta of China. Adv. Water Sci. 2009, 20, 325–331. [Google Scholar]
  32. Zhang, X.L.; Li, P.; Liu, L.J.; Li, P.Y. Degradation assessment of Modern Yellow River Delta coastal wetland. Mar. Sci. Bull. 2010, 29, 685–689. [Google Scholar]
  33. Hong, J.; Lu, X.N.; Wang, L.L. Quantitative analysis of the factors driving evolution in the Yellow River Delta Wetand in the past 40 years. Acta Ecol. Sin. 2016, 36, 924–935. [Google Scholar]
  34. Ottinger, M.; Kuenzer, C.; Liu, G.H.; Wang, S.Q.; Dech, S. Monitoring land cover dynamics in the Yellow River Delta from 1995 to 2010 based on Landsat 5 TM. Appl. Geogr. 2013, 44, 53–68. [Google Scholar] [CrossRef]
  35. Fang, H.; Liu, G.; Kearney, M. Georelational analysis of soil type, soil salt content, landform, and land use in the Yellow River Delta, China. Environ. Manag. 2005, 35, 72–83. [Google Scholar] [CrossRef]
  36. Xu, J.X. A study of thresholds of runoff and sediment for the land accretion of the Yellow River Delta. Geogr. Res. 2002, 21, 163–170. [Google Scholar]
  37. Zhao, X.S.; Cui, B.S.; Sun, T.; He, Q. The relationship between the spatial distribution of vegetation and soil environmental factors in the tidal creek areas of the Yellow River Delta. Ecol. Environ. Sci. 2010, 19, 1855–1861. [Google Scholar]
  38. Yu, J.B.; Chen, X.B.; Sun, Z.G.; Xie, W.J.; Mao, P.L.; Wu, C.F.; Dong, H.F.; Mu, X.J.; Li, Y.Z.; Guan, B.; et al. The spatial distribution characteristics of soil nutrients in new-born coastal wetland in Yellow River delta. Acta Sci. Circumst. 2010, 30, 855–861. [Google Scholar]
  39. Kuenzer, C.; Ottinger, M.; Liu, G.H.; Sun, B.; Baumhauer, R.; Dech, S. Earth observation-based coastal zone monitoring of the Yellow River Delta: Dynamics in China's second largest oil producing region overfour decades. Appl. Geogr. 2014, 55, 92–107. [Google Scholar] [CrossRef]
  40. Teferi, E.; Bewket, W.; Uhlenbrook, S.; Wenninger, J. Understanding recent land use and land cover dynamics in the source region of the Upper Blue Nile, Ethiopia: Spatially explicit statistical modeling of systematic transitions. Agric. Ecosyst. Environ. 2013, 165, 98–117. [Google Scholar] [CrossRef]
  41. Wan, H. Research on Wetland Information Extraction and Analysis of Yellow River Delta Based on RS and GIS; China University of Petroleum (East China): Dongying, China, 2009. [Google Scholar]
  42. Liu, G.L.; Zhang, L.C.; Zhang, Q.; Musyimi, Z.; Jiang, Q.H. Spatio–temporal dynamics of wetland landscape patterns based on remote sensing in Yellow River Delta,China. Wetlands 2014, 34, 787–801. [Google Scholar] [CrossRef]
  43. Lavery, P.; Pattiaratchi, C.; Wyllie, A.; Hick, P. Water-Quality Monitoring in Estuarine Waters Using the Landsat Thematic Mapper. Remote Sens. Environ. 1993, 46, 268–280. [Google Scholar] [CrossRef]
  44. Fan, Y.; Zhang, S.; Hou, C.; Zhang, L. Study on Method of Coastline Extraction from Remote Sensing—Taking Yellow River Mouth Reach and Diaokou Reach of Yellow River Delta Area as an Example. Remote Sens. Inform. 2009, 8, 67–70. [Google Scholar]
  45. Piwowar, J.M. Digital Image Analysis. In Remote Sensing for GIS Managers; Aronoff, S., Ed.; ESRI Press: Redlands, CA, USA, 2005. [Google Scholar]
  46. Ke, C.Q.; Zhang, D.; Wang, F.Q.; Chen, S.X.; Schmullius, C.; Boerner, W.M.; Wang, H. Analyzing coastal wetland change in the Yancheng National Nature Reserve, China. Reg. Environ. Chang. 2011, 11, 161–173. [Google Scholar] [CrossRef]
  47. Liu, J.Y.; Liu, M.L.; Tian, H.Q.; Zhuang, D.F.; Zhang, Z.X.; Zhang, W.; Tang, X.M.; Deng, X.Z. Spatial and temporal patterns of China’s cropland during 1990–2000: An analysis based on Landsat TM data. Remote Sens. Environ. 2005, 98, 442–456. [Google Scholar] [CrossRef]
  48. Wang, W.J.; Zhang, C.R.; Allen, J.M.; Li, W.D.; Boyer, M.A.; Segerson, K.; Silander, J.A., Jr. Analysis and prediction of land use changes related to invasive species and major driving forces in the state of Connecticut. Land 2016, 5, 25. [Google Scholar] [CrossRef]
  49. Ni, J.R.; Yin, K.Q.; Zhao, Z.J. Comprehensive classification for wetlands I. Classification. J. Nat. Resour. 1998, 13, 214–221. [Google Scholar]
  50. Zhao, H.T.; Wang, L.R. Coastal wetland types in China. Mar. Sci. Bull. 2000, 19, 72–81. [Google Scholar]
  51. Tang, X.P.; Huang, G.L. Study on classification system for wetland types in China. For. Res. 2003, 16, 531–539. [Google Scholar]
  52. Foody, G.M. Status of land cover classification accuracy assessment. Remote Sens. Environ. 2002, 80, 185–201. [Google Scholar] [CrossRef]
  53. Stehman, S.V. Selecting and interpreting measures of thematic classification accuracy. Remote Sens. Environ. 1997, 62, 77–89. [Google Scholar] [CrossRef]
  54. Aldwaik, S.Z.; Pontius, R.G. Intensity analysis to unify measurements of size and stationarity of land changes by interval, category, and transition. Landsc. Urban Plan. 2012, 106, 103–114. [Google Scholar] [CrossRef]
  55. Swetnam, R.D. Rural land use in England and Wales between 1930 and 1998: Mapping trajectories of change with a high resolution spatio-temporal dataset. Landsc. Urban Plan. 2007, 81, 91–103. [Google Scholar] [CrossRef]
  56. Wang, D.C.; Gong, J.H.; Chen, L.D.; Zhang, L.H.; Song, Y.Q.; Yue, Y.J. Spatio-temporal pattern analysis of land use/cover change trajectories in Xihe watershed. Int. J. Appl. Earth Obs. Geoinf. 2012, 4, 12–21. [Google Scholar] [CrossRef]
  57. Chen, J.; Wang, S.Y.; Mao, Z.P. Monitoring wetland changes in Yellow River Delta by remote sensing during 1976–2008. Prog. Geogr. 2011, 30, 585–592. [Google Scholar]
  58. Wang, Y.L.; Yu, J.B.; Dong, H.F.; Li, Y.Z.; Zhou, D.; Fu, Y.Q.; Han, G.X.; Mao, P.L. Spatial Evolution of Landscape Pattern of Coastal Wetlands in Yellow River Delta. Sci. Geogr. Sin. 2012, 32, 717–724. [Google Scholar]
  59. Higgins, S.; Overeem, I.; Tanaka, A.; Syvitski, J.P.M. Land subsidence at aquaculture facilities in the Yellow River delta, China. Featur. Geophys. Res. Lett. 2013, 40, 3898–3902. [Google Scholar] [CrossRef]
Figure 1. Location of the modern Yellow River Delta (YRD).
Land 06 00020 g001
Figure 2. Land use maps based on image classifications by year: (a) 1976; (b) 1984; (c) 1995; (d) 2006; (e) 2014.
Land 06 00020 g002
Figure 3. Annual changing rate of each category.
Land 06 00020 g003
Figure 4. Stability grade values for each land use type in different periods.
Land 06 00020 g004
Figure 5. Percentages of swap change for each land use type in different periods.
Land 06 00020 g005
Figure 6. Distributions of main transition categories in different periods from 1976 to 2014.
Land 06 00020 g006
Figure 7. Wetland change trajectory map.
Land 06 00020 g007
Table 1. List of satellite images used in this study.
PlatformSensorPath/RowResolution(m)AcquisitionDate
Landsat 2Multispectral Scanner130–134902 June 1976
Landsat 5Thematic Mapper121–134305 November 1984
Landsat 5Thematic Mapper121–1343018 September 1995
Landsat 5Enhanced Thematic Mapper121–134152 November 2006
Landsat 8Operational Land Imager121–1343011 May 2014
Table 2. The classification key used in the present study.
Land Use TypeLand Use ClassDescriptionCode
Natural wetlandBeachMucky, sandy, and gravel beach located between the estuary and tidal zoneBC
GrasslandReeds, cattails (Typha orientalis), and other water-loving plant community members located in rivers and estuaries, reservoirs, and lakes of flood landGL
BushlandMainly Tamarix bush combined with the alkaline meadows such as Suaeda heteroptera, Salicornia, and Suaeda salsBL
RiverPermanent and seasonal rivers including their floodplainsRV
Artificial wetlandDitch and pondsA natural or artificial pond or lake used for the storage and regulation of water, including lake, reservoirs, and pondsDP
Aquafarm and salt panArtificial built around shrimp, crabs and other aquatic ponds, etc.; Salt field in coastal areas and near estuariesAS
Non-wetlandWoodlandWoodland composed of Populus, Salix, Black locust (Robinia pseudoacacia) and Salix (Salix integra)WL
Cultivated landArable land that is worked by plowing and sowing and raising cropsCL
Construction landMan-made impervious surface such as roads, urban, and rural residential land, industrial land, oil field infrastructure, etc.AL
Table 3. A sample of land use transition matrix.
T2Ai+Loss
L1L2. . .Ln
T1L1A11A12. . .A1nA1+A1+ − A11
L2A21A22. . .A2nA2+A2+ − A22
.
.
.
.
.
.
.
.
.
.
.
.
.
.
LnAn1An2. . .AnnAn+An+ − Ann
A+iA+1A+2. . .A+n
GainA+1 − A11A+2 − A22. . .A+n − Ann
Table 4. Wetland change trajectories between 1976 and 2014.
No.DescriptionTrajectories *
1Stable wetlandWWWWW, RRRRR
2wetland formation/restorationNNNNR, NNNNW, NNNRR, NNNWW, NNRRR, NNWWW, NRRRR, NWWWW, NWNNW, NWNWW, NWWNW, NWWWW, RRNWW, WNNWW, WNWNW, WNWWW, WWNNW, WWNRR, WWRNR
3Wetland artificializationNNNWR, NNWRR, NWNWR, NWRRR, NWWRR, NWWWR, WNNWR, WNRRR, WRRRR, WWNWR, WWRRR, WWWNR, WWWRR, WWWWR
4Old degradationNRNNN, NWNNN, RRNNN, WNNNN, WRNNN, WWNNN
5Recent degradationNNWNN, NNWRN, NNWWN, NRRNN, NRWNN, NRWWN, NWNWN, NWWNN, NWWWN, RRRNN, RRWWN, WNNWN, WNWNN, WNWWN, WWNWN, WWRNN, WWRRN, WWWNN, WWWRN, WWWWN
6Non-wetlandNNNN
* The sequence represents the time periods 1976, 1984, 1995, 2006, and 2014. “W” stands for natural wetland class, “R” stands for artificial wetland, and “N” stands for non-wetland class.
Table 5. Confusion matrix (error matrix) for the 2014 classification map.
Classified DataBCGLBLRVDPASCLWLALRow TotalUser’s Accuracy
BC4022 24687%
GL 282 23288%
BL 227 1 3090%
RV 202 2291%
DP 118 1995%
AS121 56 6093%
CL132 187 9493%
WL 2 123 2688%
AL2 2 1 394489%
Column total443736212257902343373
Producer‘s accuracy87%88%90%91%95%93%93%88%89%91%
Overall accuracy = 90.62%, KC =0.89.
Table 6. Area (A) and percentage (P) changes from 1976 to 2014.
Classes19761984199520062014
A (km2)P (%)A (km2)P (%)A (km2)P (%)A (km2)P (%)A (km2)P (%)
Beach1991.534.21402.623.5852.914.2813.613.7480.68.1
Grassland639.911.0724.212.2903.715.1612.110.3342.25.8
Bushland747.412.8891.215.0362.36.0238.04.0169.62.9
River109.41.9136.82.3129.32.2129.42.2128.52.2
Natural wetland3488.259.93154.953.02248.237.51792.930.21120.918.9
Ditch and pond75.61.3112.61.9194.13.2238.84.0250.14.2
Aquafarm and salt pan17.70.337.70.6364.36.1717.812.11261.321.3
Artificial wetland93.31.6150.32.5558.39.3956.616.11511.425.5
Cultivated land2030.234.92351.439.52636.144.02481.641.82499.742.1
Woodland14.80.336.90.685.01.477.51.381.81.4
Construction land192.83.3264.84.4467.27.8628.910.6722.612.2
Non-wetland2237.938.52653.144.53188.253.23188.053.73304.255.7
YRD Area5819.3100.05958.2100.05994.7100.05937.5100.05936.5100.0
Table 7. The percentages (P/%) and detail compositions of main transitions in different period from 1976 to 2014.
Main TransitionType1976–19841984–19951995–20062006–20141976–2014
PDetailsPDetailsPDetailsPDetailsPDetails
Cultivated
land to wetland
1.4CL-DP (1.4)1.2CL-DP (1.2)6.5CL-DP (3.2)
CL-GL (1.8)
CL-AS (1.5)
2.6CL-GL (1.5)
CL-AS (1.1)
1.4CL-DP (1.4)
Construction land expansion3.0CL-AL (3.0)6.2CL-AL (3.9)
BC-AL (2.3)
13.1CL-AL (11.6)
BC-AL (1.5)
8.1CL-AL (3.1)
GL-AL (2.6)
BC-AL (2.4)
12.9CL-AL (6.9)
BC-AL (2.1)
GL-AL (1.5)
SF-AL (1.3)
BL-AL (1.2)
Wetland to
cultivated land
23.3BC-CL (17.4)
GL-CL (3.3)
BL-CL (2.6)
17.9GL-CL (8.6)
BL-CL (8.0)
DP-CL (1.3)
4.1GL-CL (4.1)9.4GL-CL (7.9)
AS-CL (1.5)
20.3BC-CL (8.4)
GL-CL (6.7)
BL-CL (5.2)
Internal
transformation of natural wetland
35.7BC-BL (14.1)
BC-GL (7.0)
BL-GL (6.0)
GL-BL (4.0)
BL-GL (3.1)
BC-RV (1.5)
33.0BL-GL (13.6)
BC-BL (10.5)
BC-GL (7.1)
BL-BC (1.8)
24.0BL-BC (7.3)
GL-BC (6.7)
BC-BL (3.6)
BL-GL (3.5)
GL-BL (2.9)
5.1BL-BC (2.0)
BC-BL (1.8)
BC-GL (1.3)
4.7BC-GL (2.9)
BL-GL (1.8)
Natural wetland formation18.1SF-BC (14.4)
SF-BL (2.4)
SF-GL (1.3)
6.2SF-BC (6.2)5.3SF-BC (5.3)5.0SF-BC (3.9)
SF-BL (1.1)
8.5SF-BC (5.0)
SF-BL (2.3)
SF-GL (1.2)
Artificialization of natural
wetland
17.8BL-AS (5.8)
BC-AS (5.5)
GL-AS (2.8)
BL-DP (2.5)
GL-DP (1.2)
29.4GL-AS (15.5)
BC-AS (7.9)
BL-AS (6.0)
52.9BC-AS (27.6)
GL-AS (16.1)
BL-AS (9.2)
32.6BC-AS (19.1)
BL-AS (8.0)
GL-AS (3.5)
BC-DP (2.0)
Coastline erosion10.1BC-SF (10.1)5.6BC-SF (5.6)11.4BC-SF (11.4)5.9BC-SF (5.9)8.0BC-SF (8.0)
Total91.6 87.9 93.8 89.0 88.4
Table 8. Areas and percentages of land use type in 1976 and 2014 for each wetland change type.
Change TypeTimeArea (km2)Percentage (%)
BCGLBLRVDPASCLWLALSF
Non-wetland19762120.5 90.2 0.6 9.1 0.1
2014 77.4 1.0 21.7 0.0
Stable wetland1976746.749.5 16.7 17.1 9.8 5.7 1.2
201437.5 33.8 9.2 12.5 5.9 1.0
Old degradation19761234.451.9 20.0 16.7 2.2 2.5 0.7 0.7 5.4
2014 0.0 59.1 3.6 14.1 23.2
Recent degradation1976410.632.3 21.8 13.0 0.5 0.6 0.1 1.1 30.5
2014 31.7 4.1 21.7 42.5
Wetland formation/restoration1976524.12.4 2.5 4.7 19.5 0.3 70.6
201438.3 17.1 19.2 6.7 13.2 5.5
Wetland artificialization19761361.461.4 12.2 24.7 0.5 0.2 1.0
2014 10.0 90.0

