
Habitat Loss on Rondon’s Marmoset Potential Distribution

 ,
,
Abstract
:1. Introduction
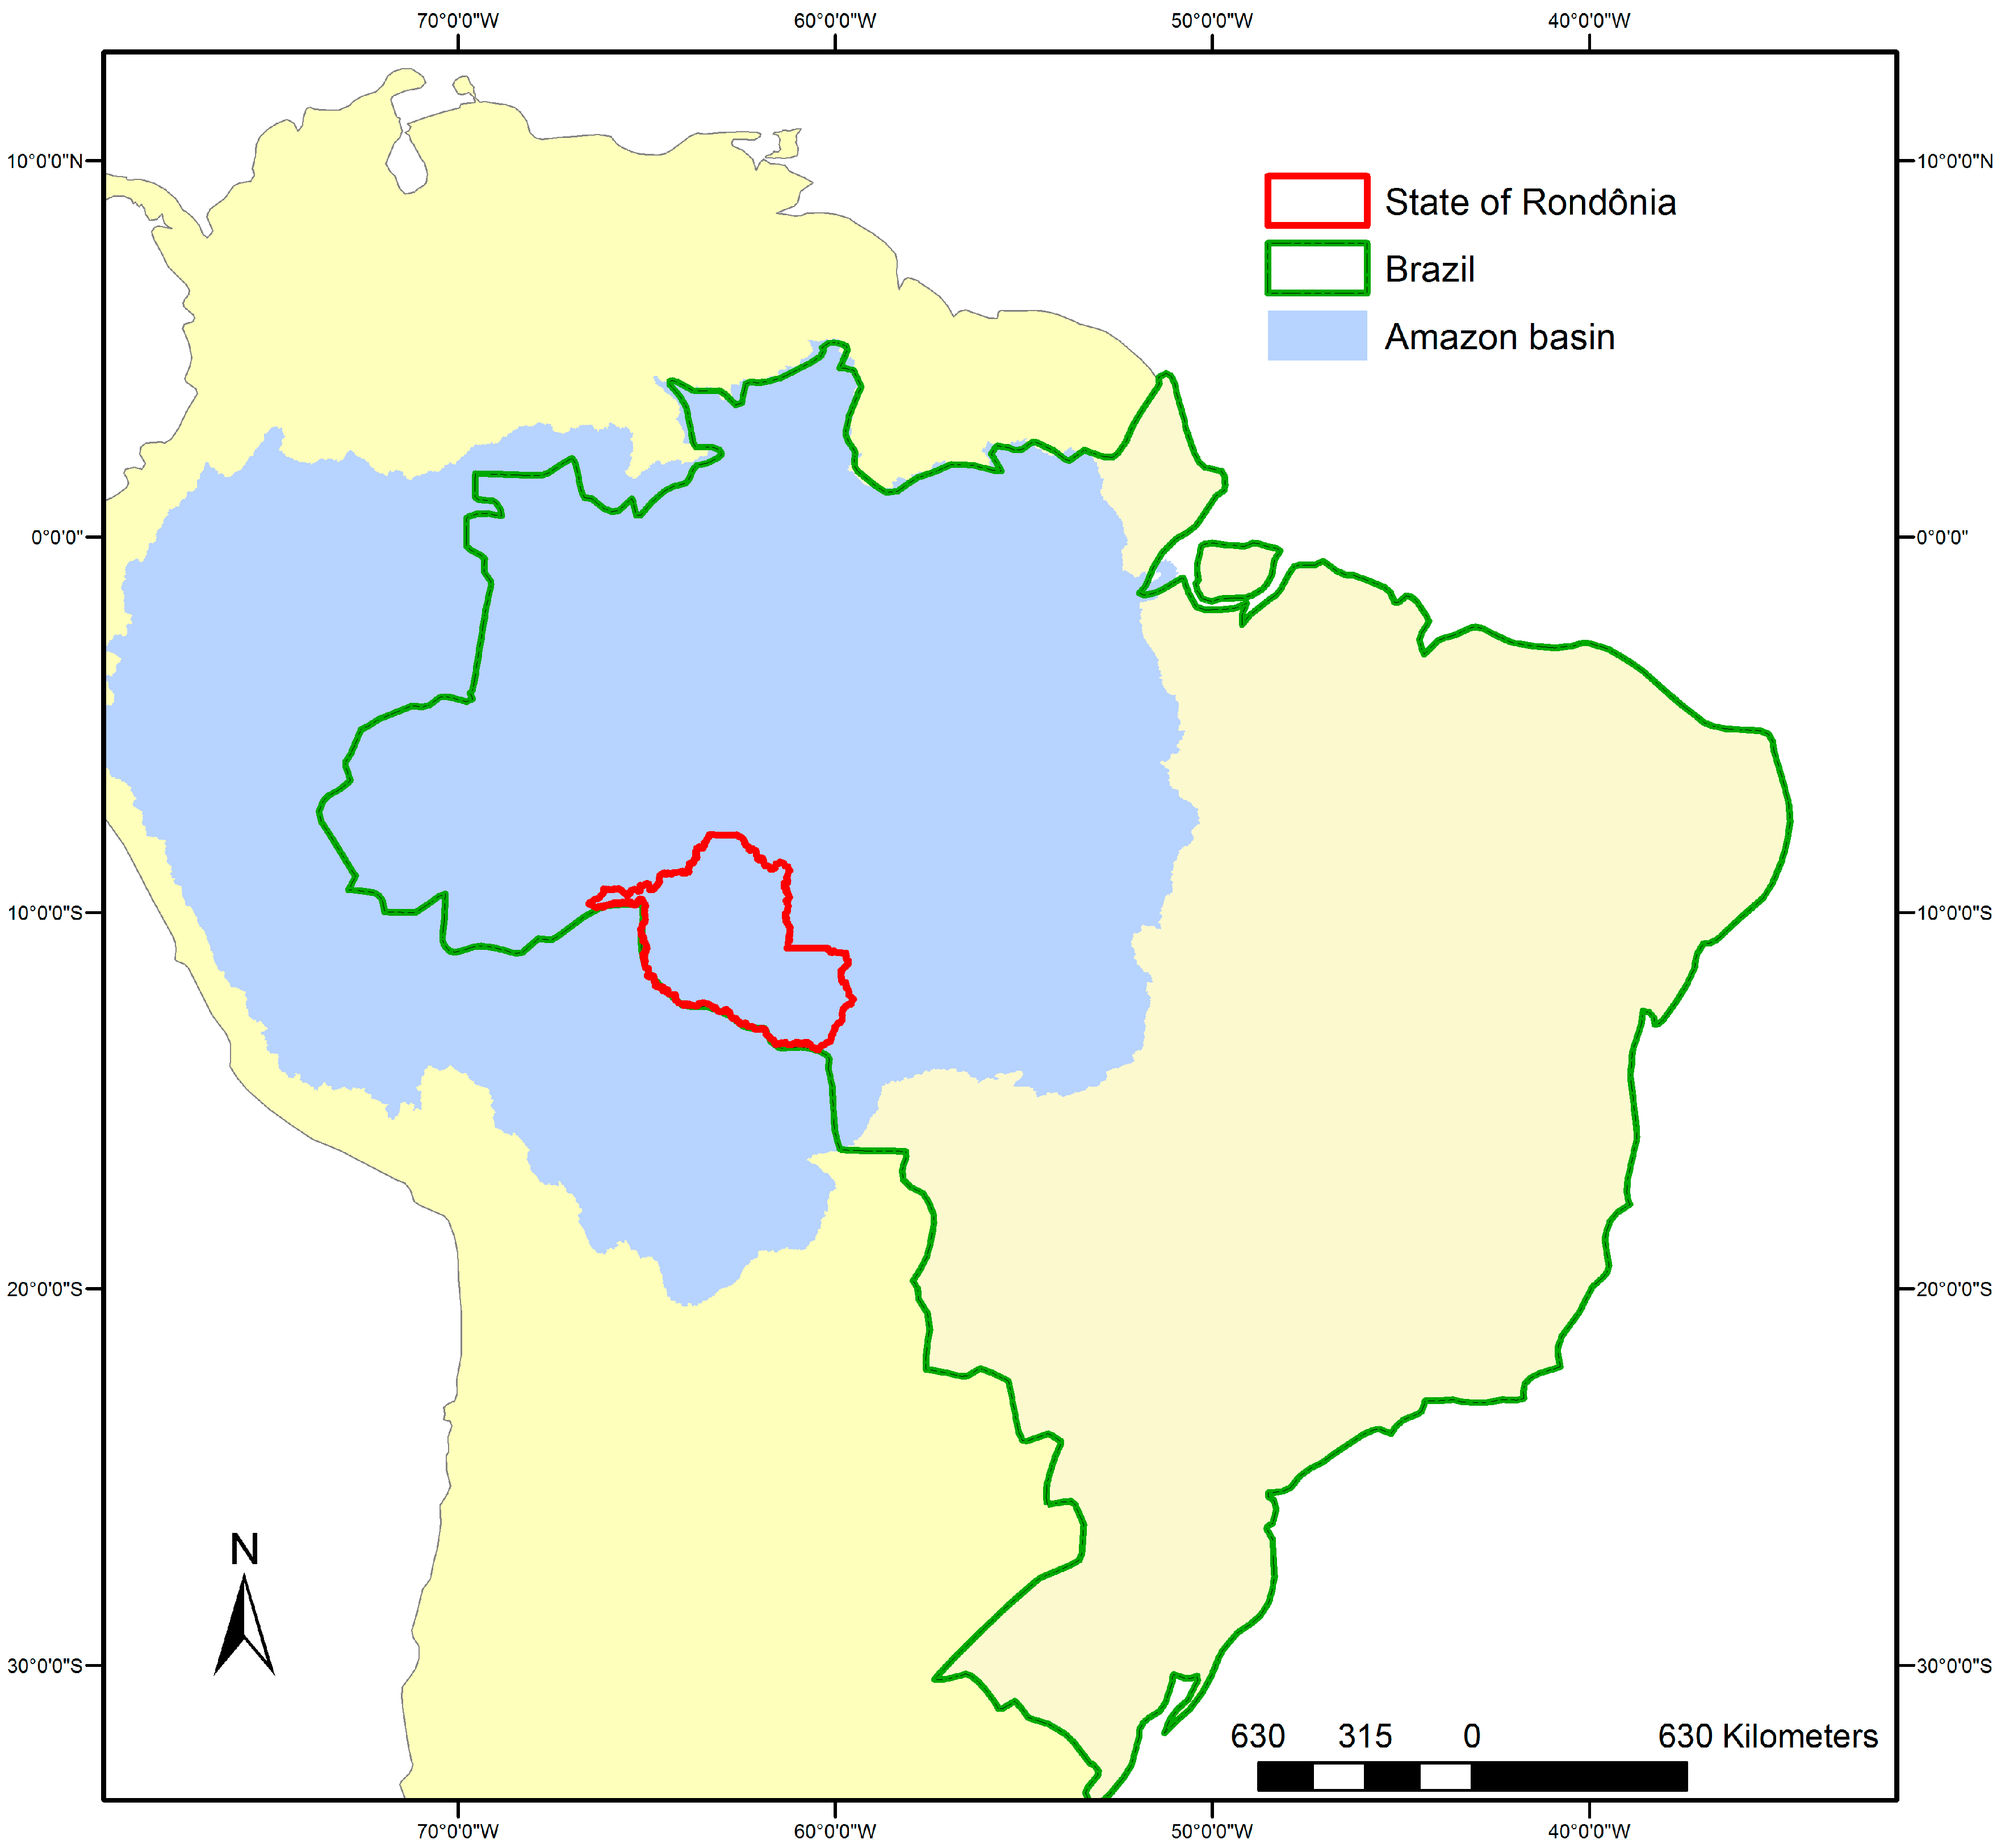
Study Area
2. Materials and Methods
2.1. Species Distribution Model
2.2. Current Levels of Protection and Threats
2.3. Re-Assessing the IUCN Threat Status of Rondon’s Marmoset
3. Results
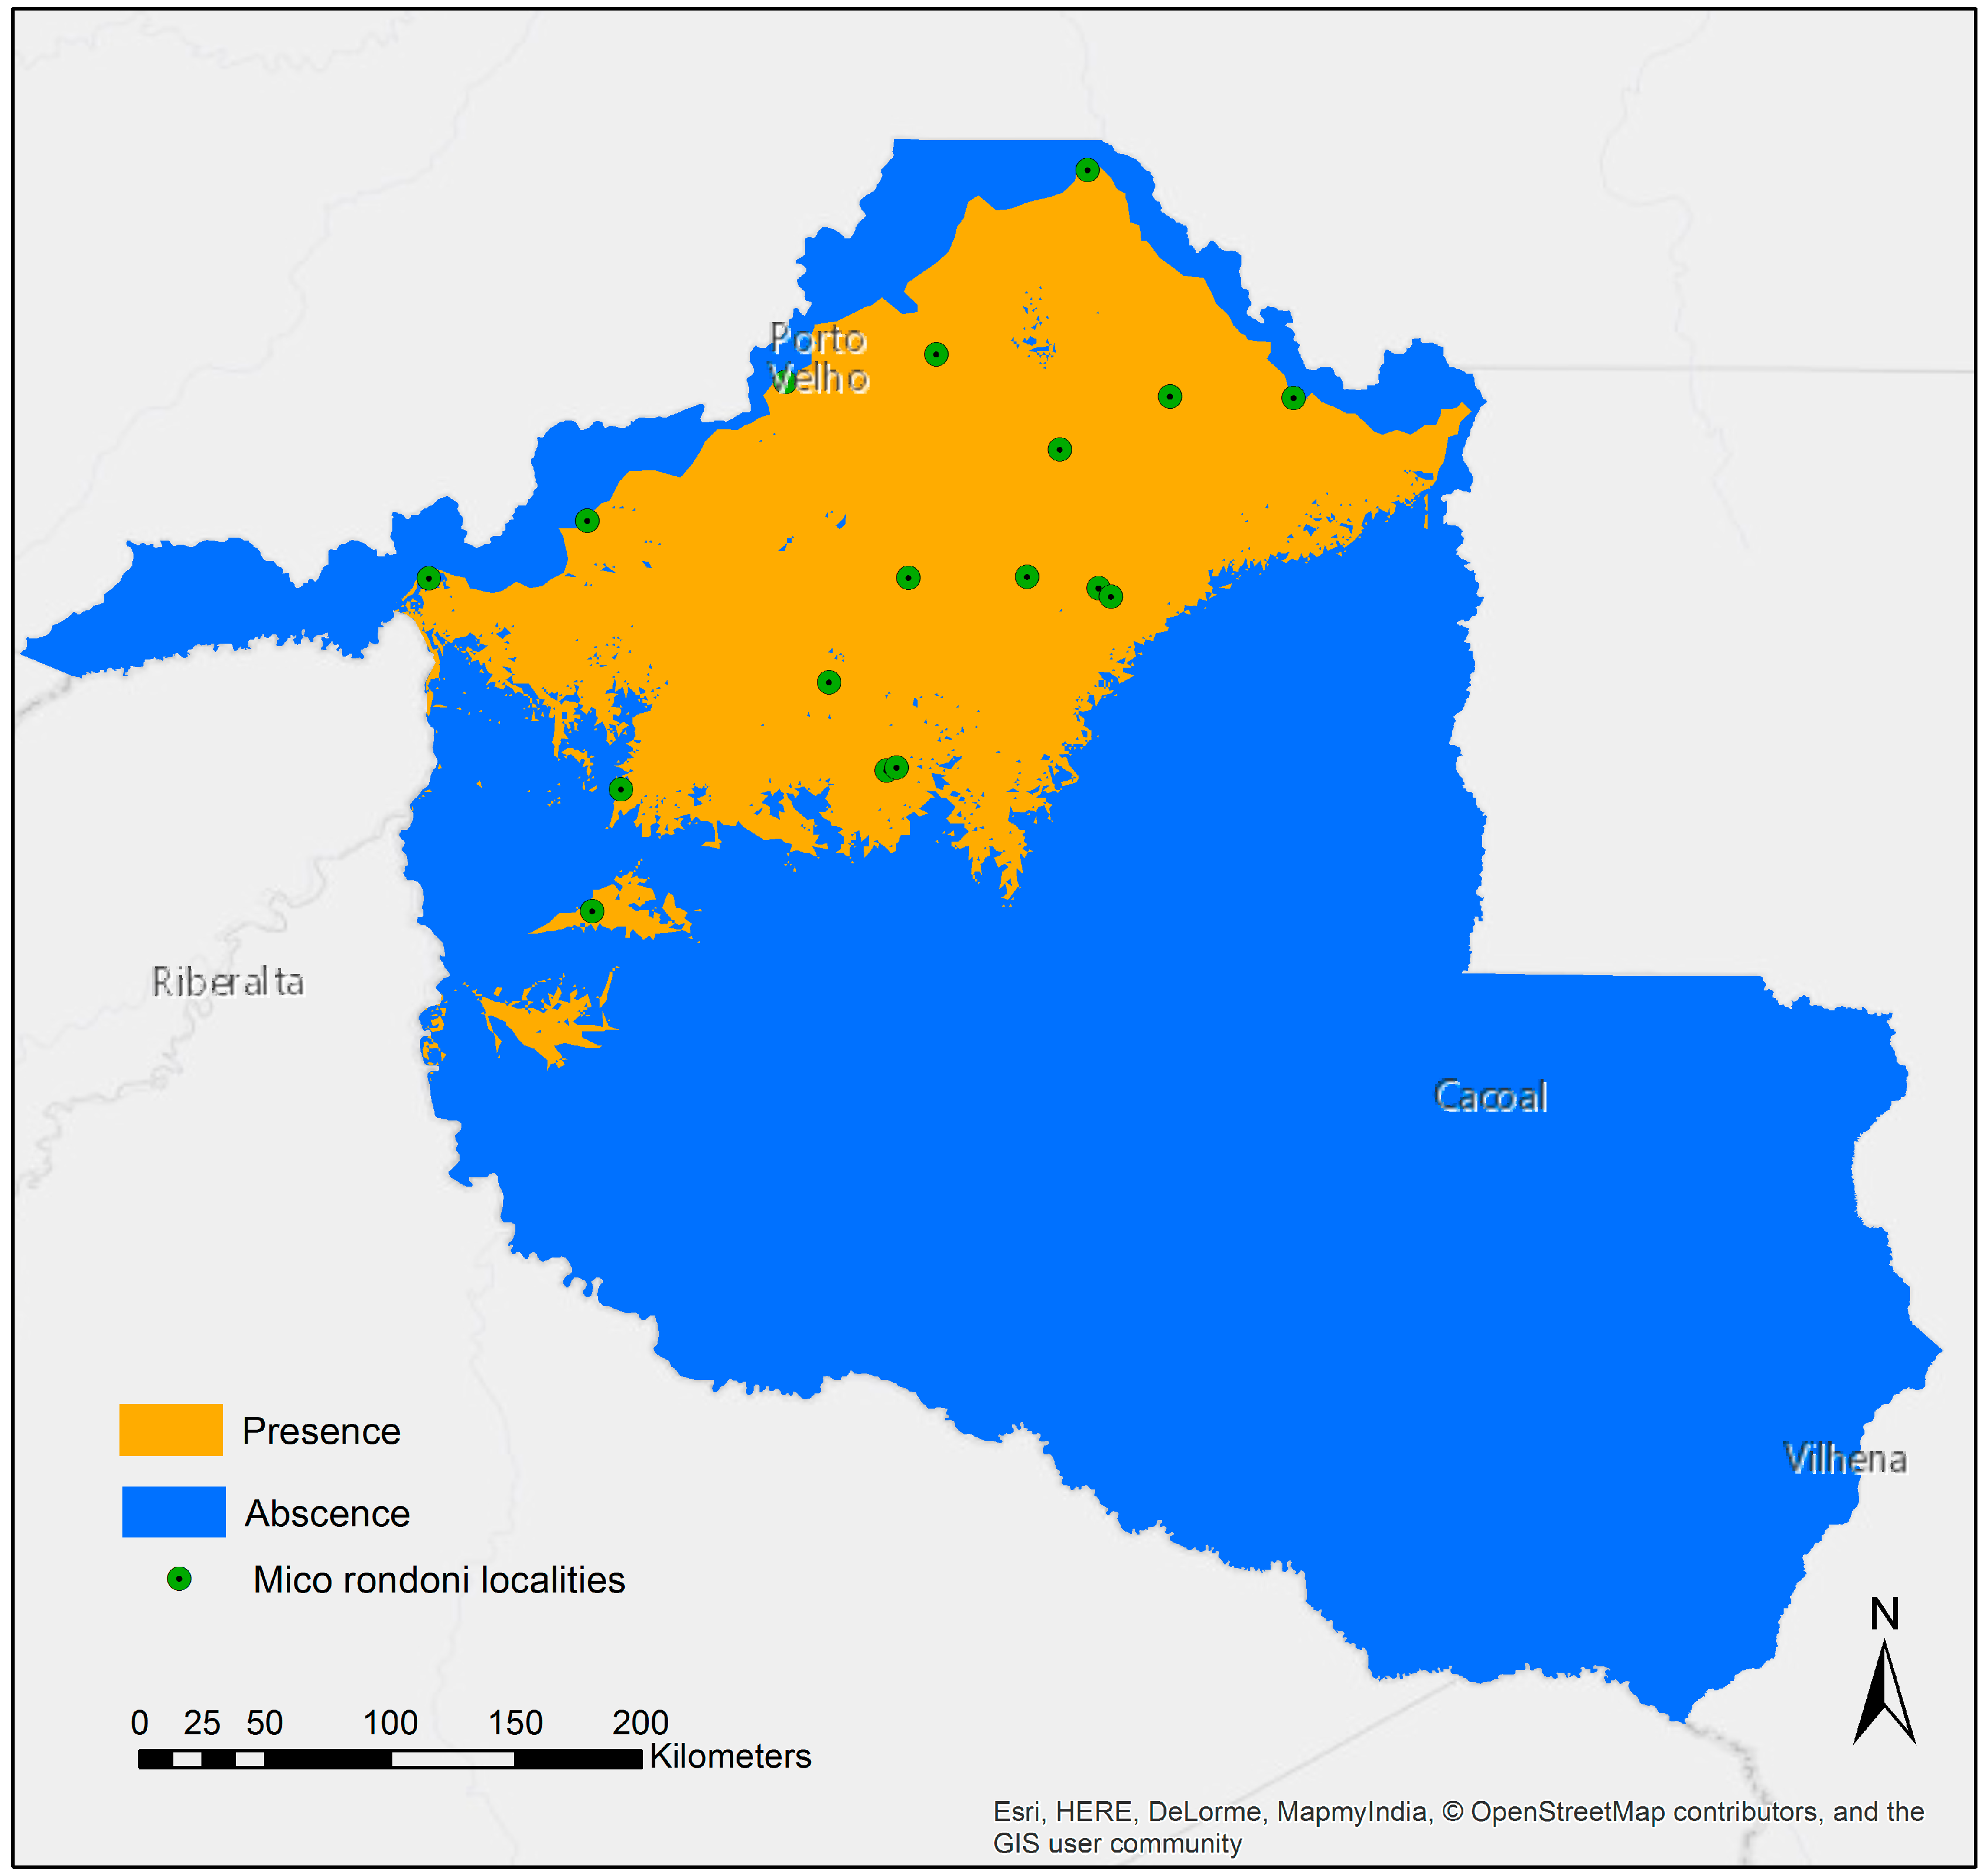
3.1. Species Distribution Model
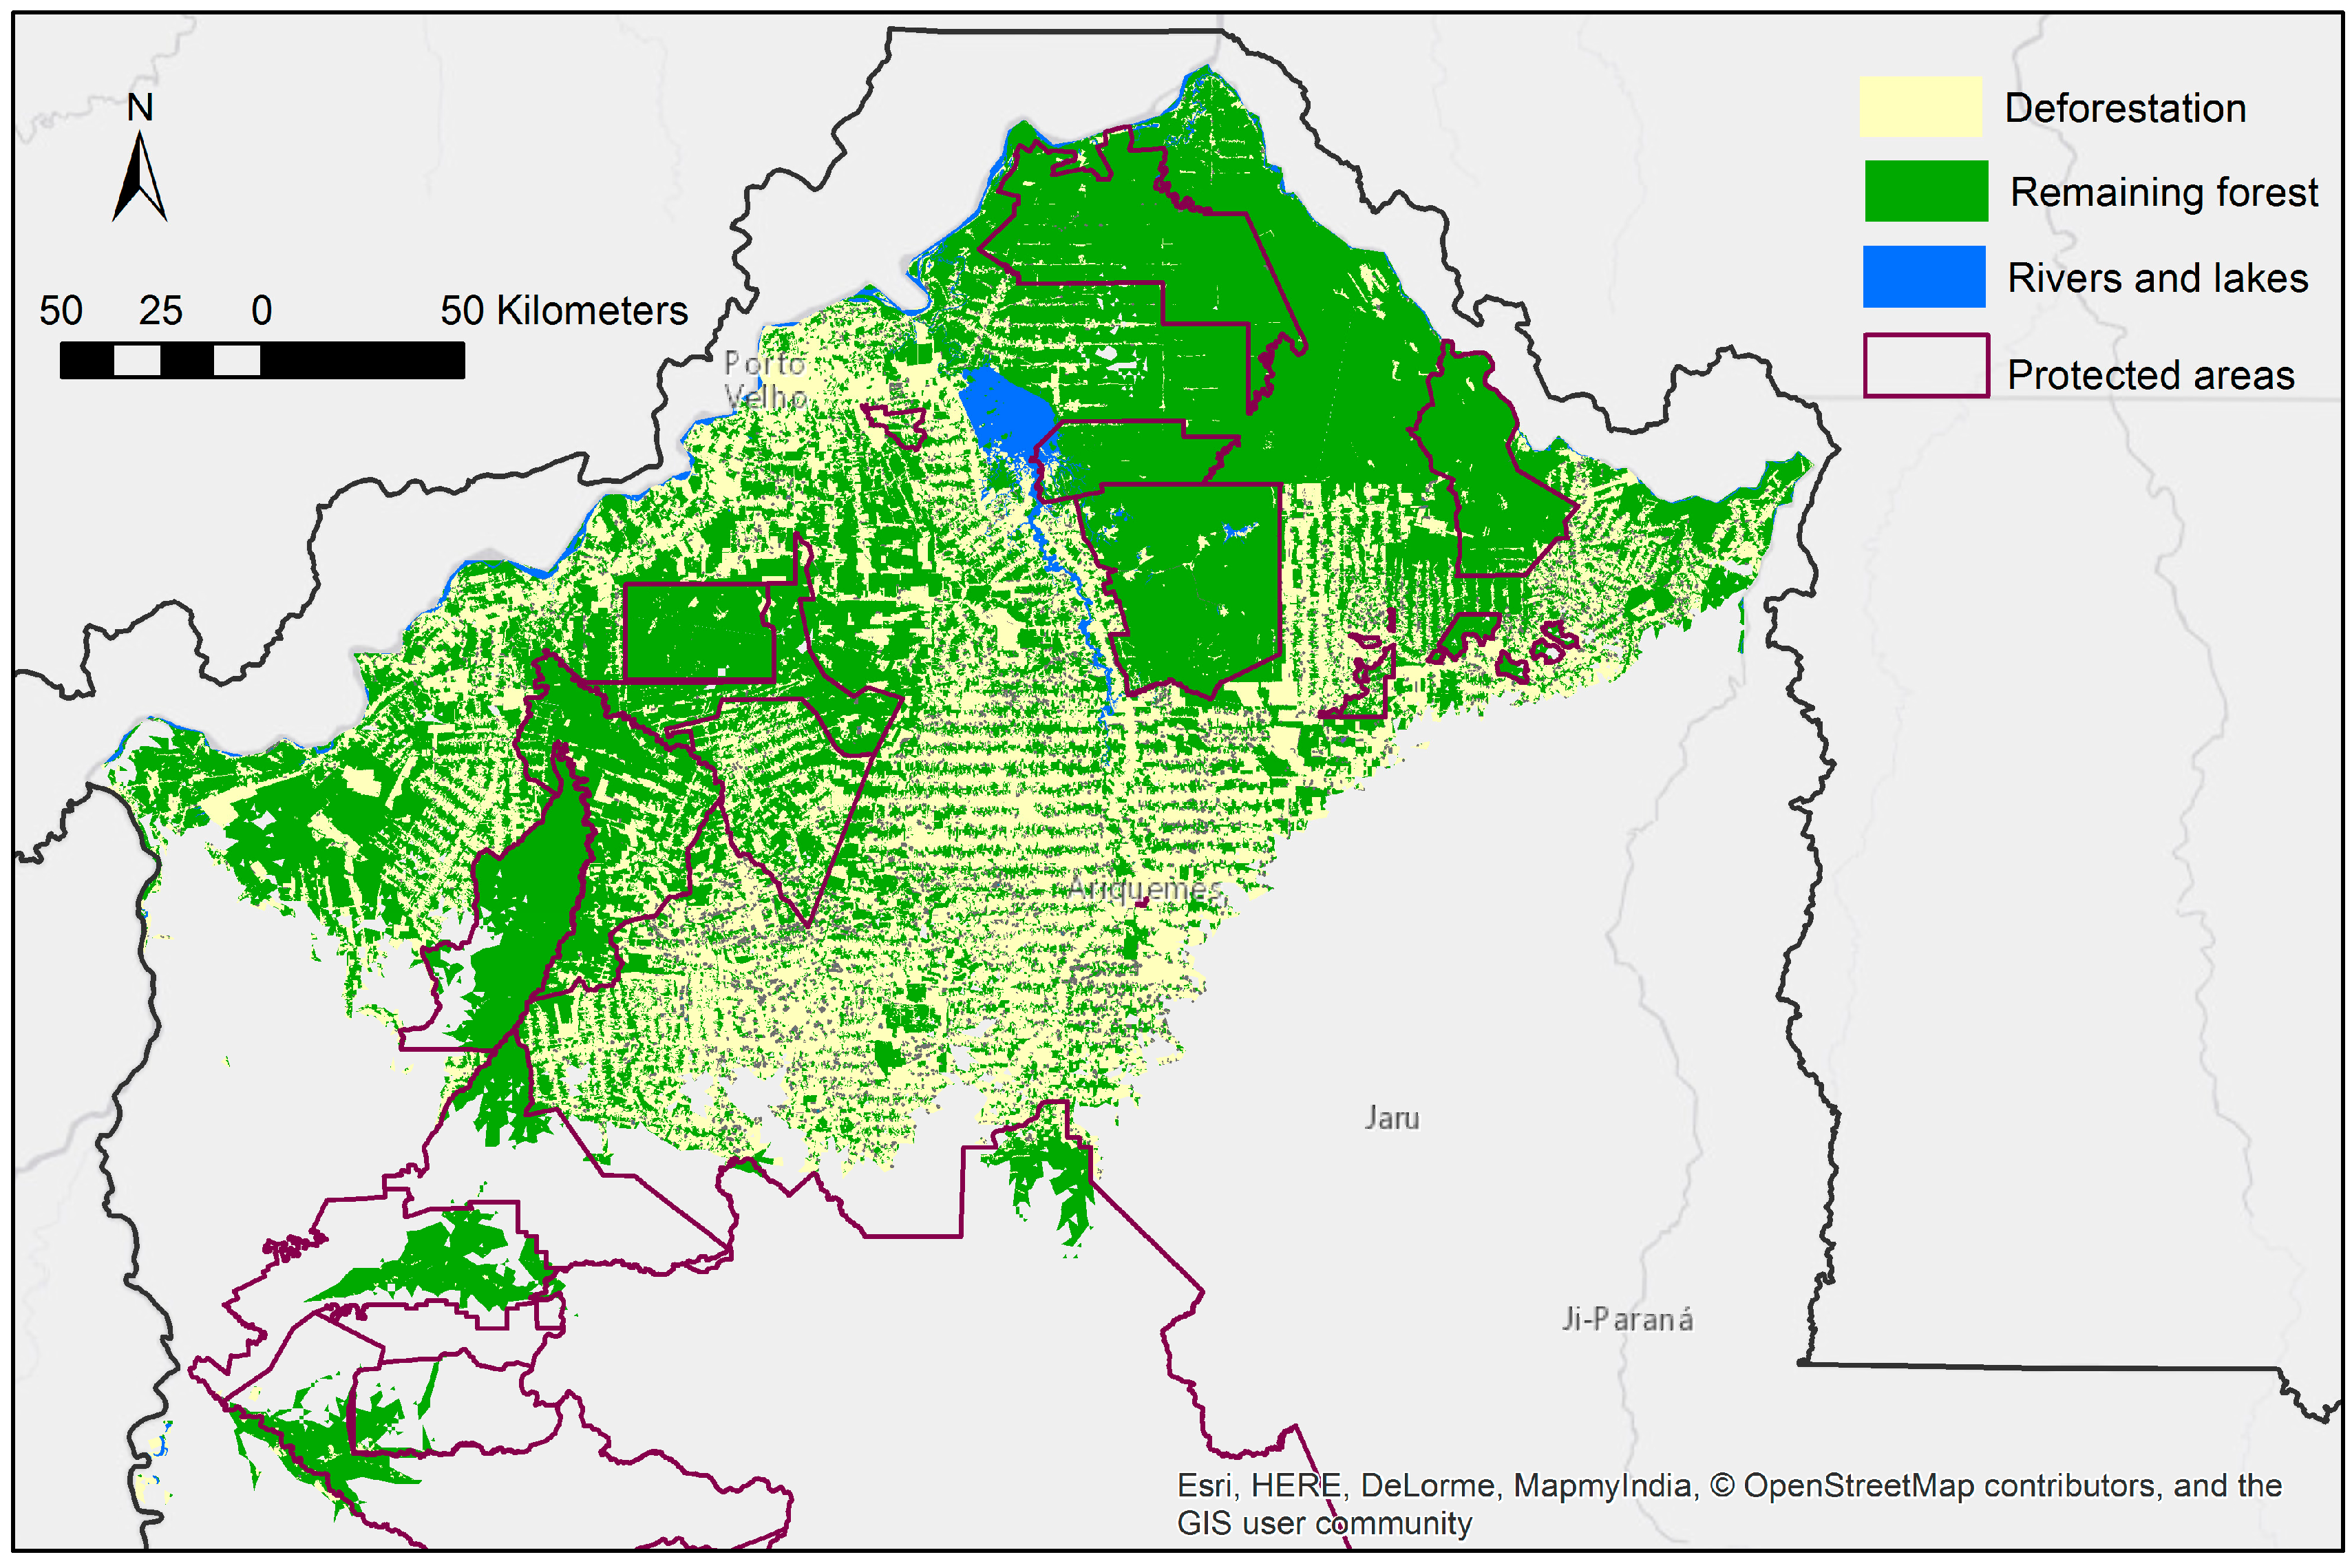
3.2. Protected Area Coverage of the Predicted Distribution
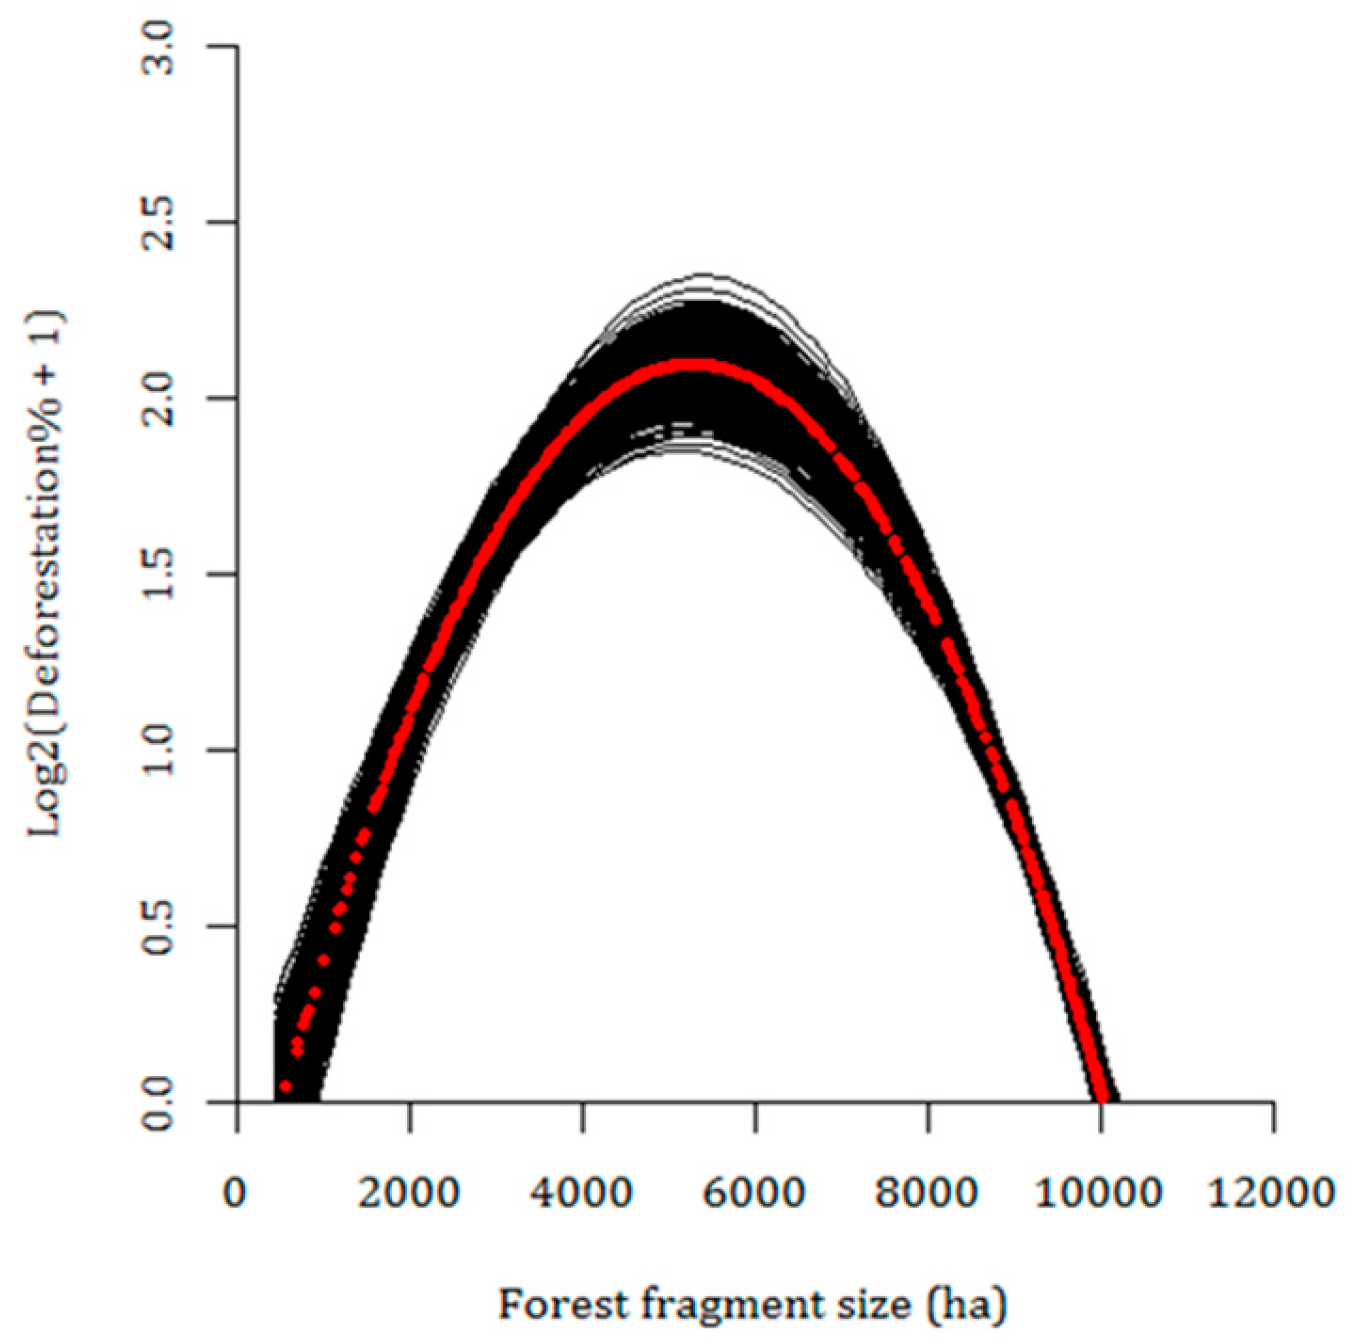
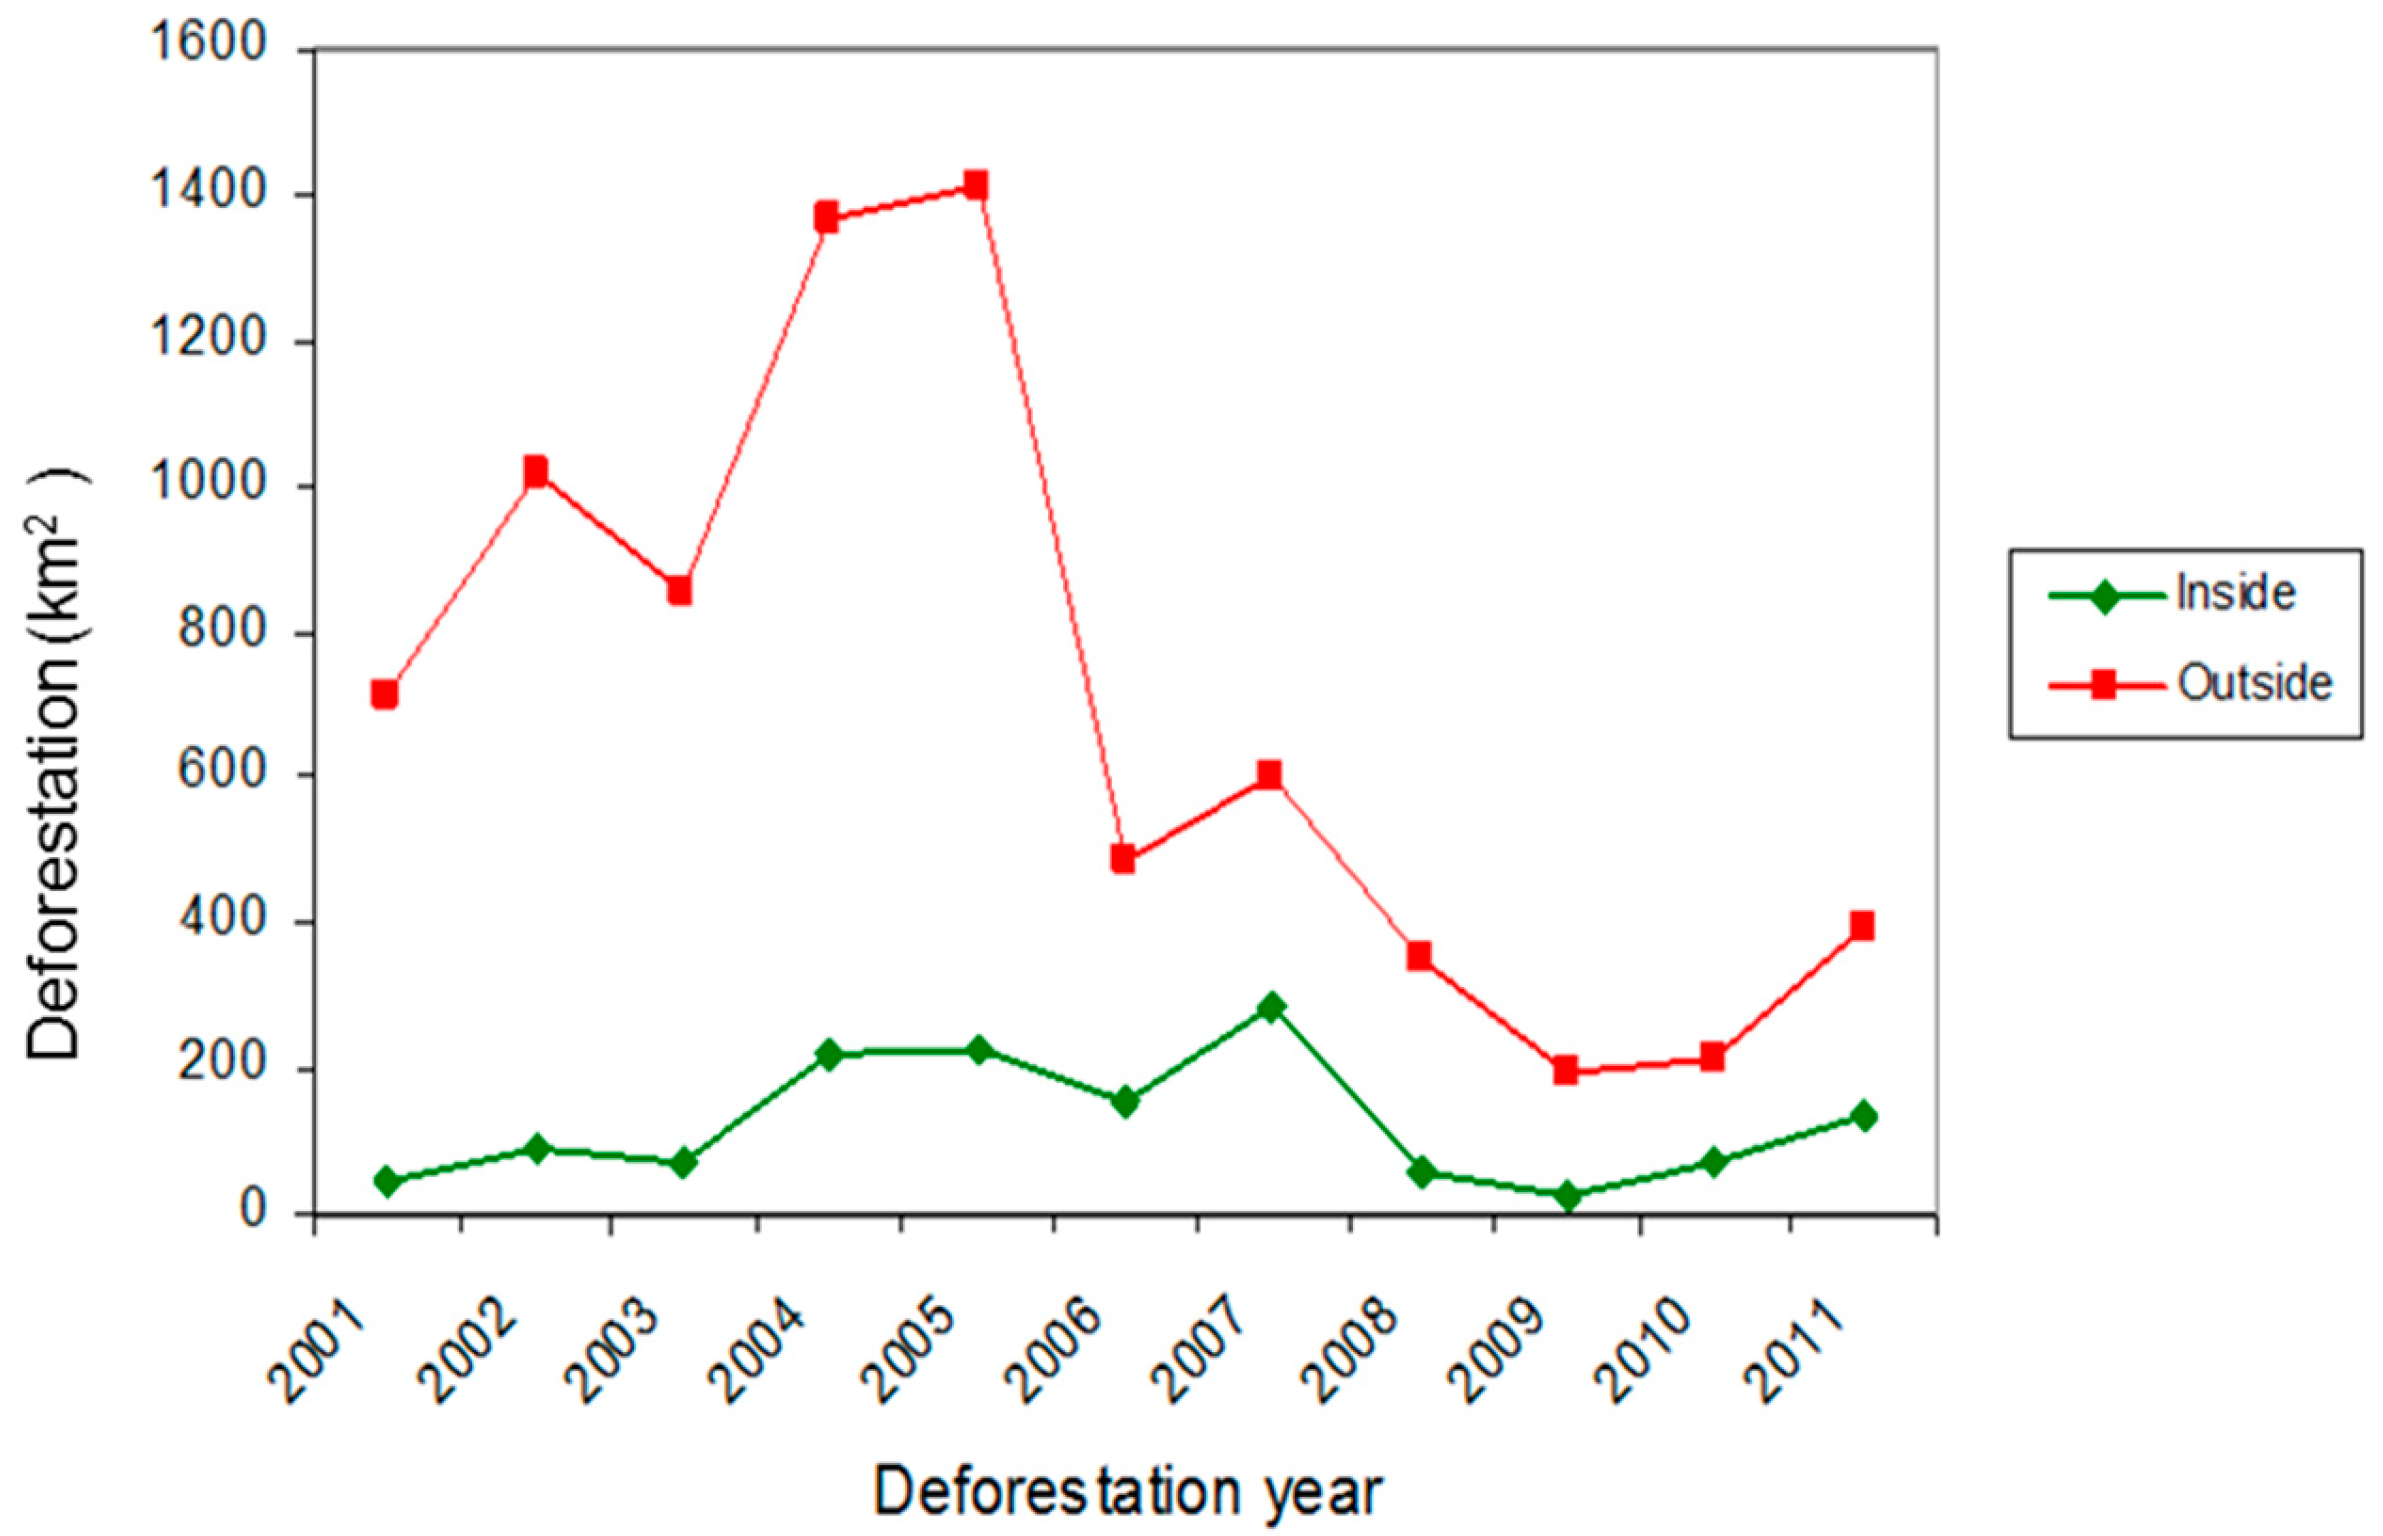
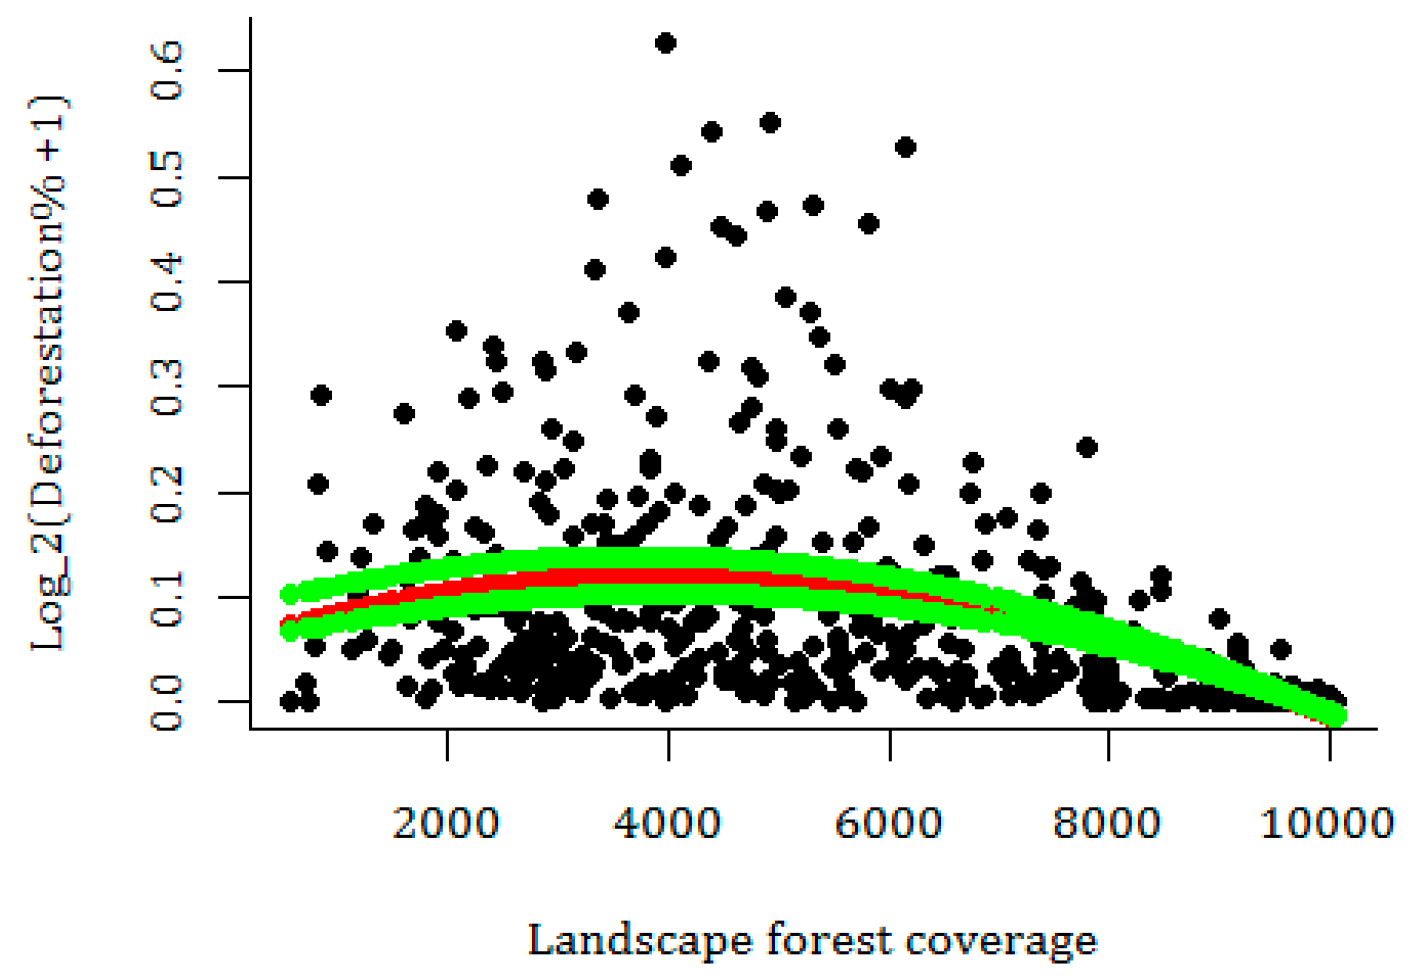
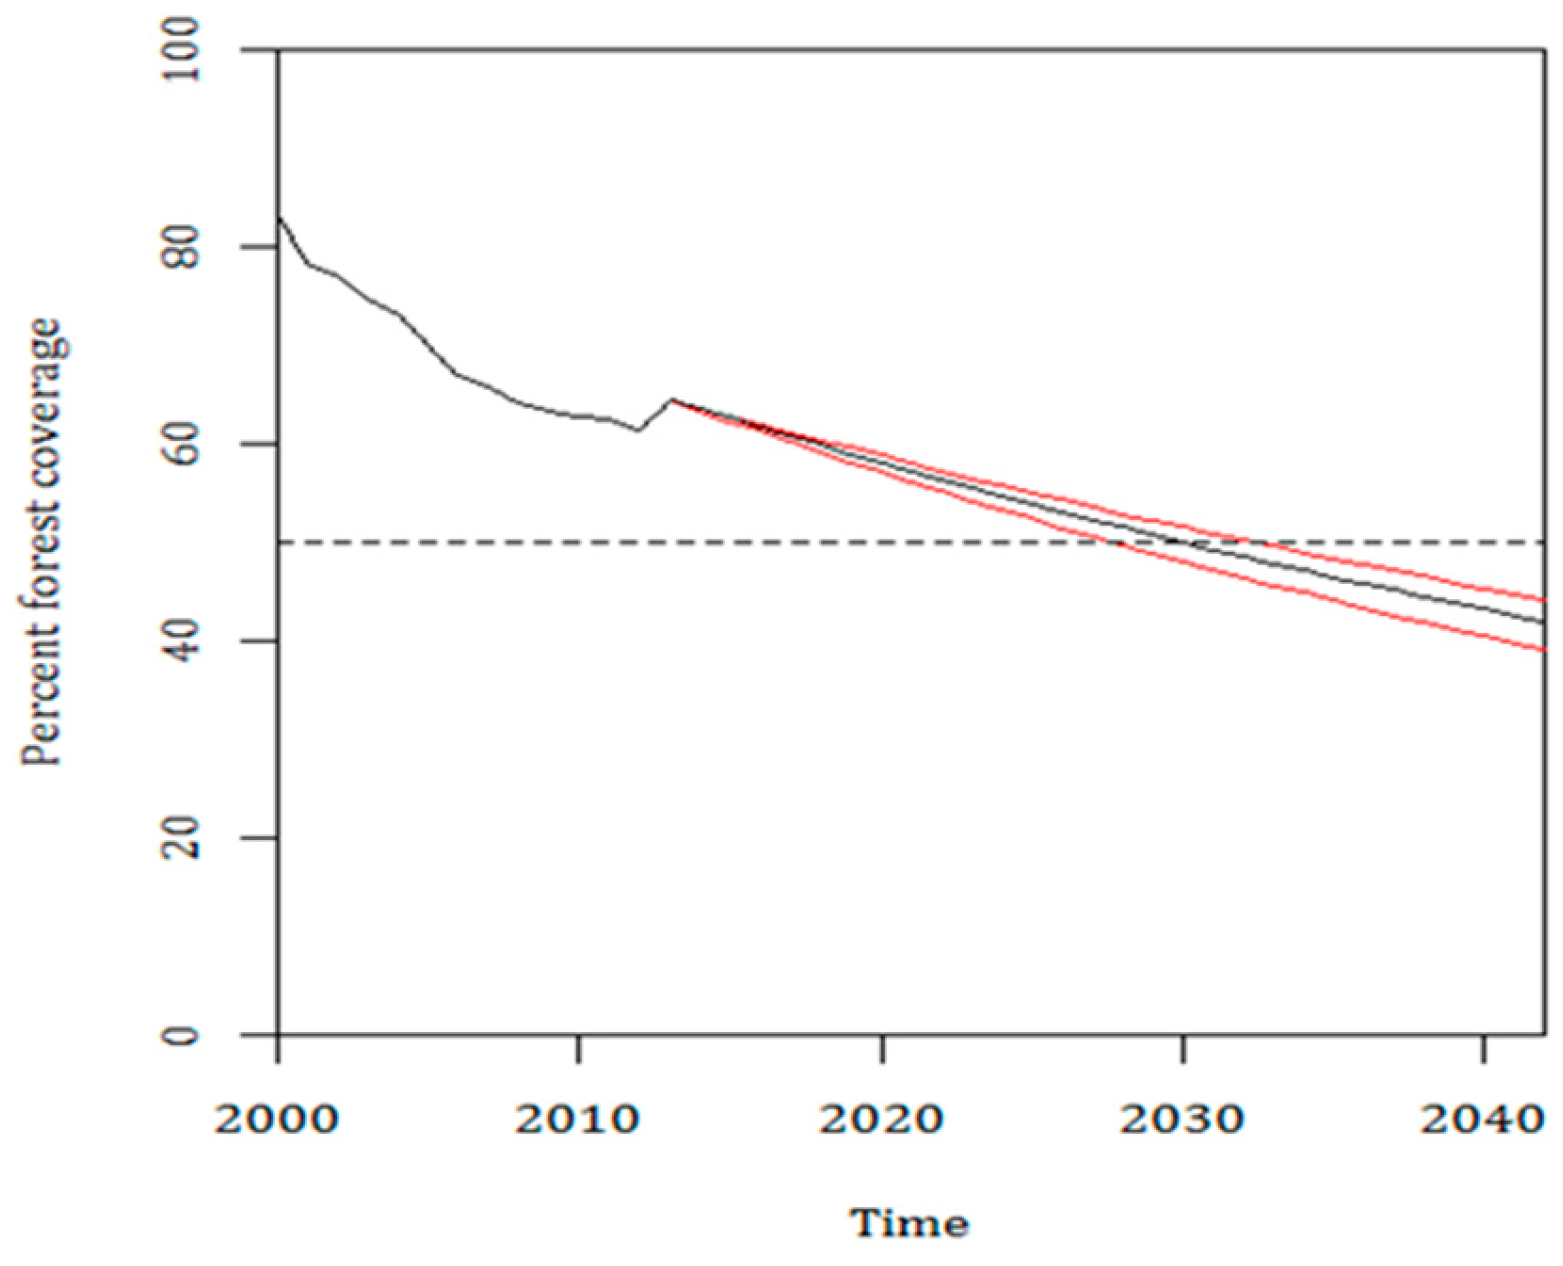
3.3. Current Pattern of Forest Loss, Expected Deforestation and Re-Evaluation of the IUCN Threat Status of Rondon’s Marmoset
4. Discussion
5. Conclusions
Acknowledgments
Author Contributions
Conflicts of Interest
Appendix A

| Number | Species | X | Y | Source |
|---|---|---|---|---|
| 1 | Mico rondoni | −64.72666 | −10.76028 | Ferrari et al. 2010 [24] |
| 2 | Mico rondoni | −64.61778 | −10.32111 | Ferrari et al. 2010 |
| 3 | Mico rondoni | −63.46666 | −8.75000 | Ferrari et al. 2010 |
| 4 | Mico rondoni | −62.91667 | −8.08333 | Ferrari et al. 2010 |
| 5 | Mico rondoni | −62.16833 | −8.90750 | Ferrari et al. 2010 |
| 6 | Mico rondoni | −65.31261 | −9.55228 | Mariluce Rezende Messias unp. Data |
| 7 | Mico rondoni | −64.73684 | −9.34888 | Mariluce Rezende Messias unp. Data |
| 8 | Mico rondoni | −64.01567 | −8.84924 | Mariluce Rezende Messias unp. Data |
| 9 | Mico rondoni | −63.01840 | −9.09545 | Mariluce Rezende Messias unp. Data |
| 10 | Mico rondoni | −62.61887 | −8.90285 | Mariluce Rezende Messias unp. Data |
| 11 | Mico rondoni | −63.85925 | −9.93685 | Ochoa-Quintero JM |
| 12 | Mico rondoni | −63.74462 | −9.62525 | Ochoa-Quintero JM |
| 13 | Mico rondoni | −63.64947 | −10.25626 | Ochoa-Quintero JM |
| 14 | Mico rondoni | −63.61388 | −10.24537 | Ochoa-Quintero JM |
| 15 | Mico rondoni | −63.56884 | −9.55847 | Ochoa-Quintero JM |
| 16 | Mico rondoni | −63.13775 | −9.55532 | Ochoa-Quintero JM |
| 17 | Mico rondoni | −62.87828 | −9.59665 | Ochoa-Quintero JM |
| 18 | Mico rondoni | −62.83247 | −9.62761 | Ochoa-Quintero JM |
| 19 | Mico rondoni | −62.11989 | −9.55746 | Ochoa-Quintero JM |
| 20 | Sanguinus weddelli | −64.91000 | −10.83278 | Ferrari et al. 2010 |
| 21 | Sanguinus weddelli | −64.80277 | −10.40334 | Ferrari et al. 2010 |
| 22 | Sanguinus weddelli | −64.72666 | −10.76028 | Ferrari et al. 2010 |
| 23 | Sanguinus weddelli | −64.65834 | −10.59111 | Ferrari et al. 2010 |
| 24 | Sanguinus weddelli | −64.61778 | −10.32111 | Ferrari et al. 2010 |
| 25 | Sanguinus weddelli | −64.57389 | −10.31861 | Ferrari et al. 2010 |
| 26 | Sanguinus weddelli | −64.54194 | −10.31833 | Ferrari et al. 2010 |
| 27 | Sanguinus weddelli | −64.42944 | −10.82750 | Ferrari et al. 2010 |
| 28 | Sanguinus weddelli | −64.13056 | −10.42500 | Ferrari et al. 2010 |
| 29 | Sanguinus weddelli | −64.10722 | −10.42361 | Ferrari et al. 2010 |
| 30 | Sanguinus weddelli | −63.78417 | −10.51250 | Ferrari et al. 2010 |
| 31 | Sanguinus weddelli | −63.46666 | −8.75000 | Ferrari et al. 2010 |
| 32 | Sanguinus weddelli | −63.31167 | −12.02694 | Ferrari et al. 2010 |
| 33 | Sanguinus weddelli | −62.91667 | −8.08333 | Ferrari et al. 2010 |
| 34 | Sanguinus weddelli | −62.79250 | −11.69861 | Ferrari et al. 2010 |
| 35 | Sanguinus weddelli | −62.73250 | −10.21611 | Ferrari et al. 2010 |
| 36 | Sanguinus weddelli | −62.03250 | −9.02139 | Ferrari et al. 2010 |
| 37 | Sanguinus weddelli | −61.43306 | −12.20083 | Ferrari et al. 2010 |
| 38 | Sanguinus weddelli | −64.85093 | −11.39505 | Mariluce Rezende Messias unp. Data |
| 39 | Sanguinus weddelli | −64.66525 | −10.92667 | Mariluce Rezende Messias unp. Data |
| 40 | Sanguinus weddelli | −64.57185 | −10.41757 | Mariluce Rezende Messias unp. Data |
| 41 | Sanguinus weddelli | −64.40190 | −11.60116 | Mariluce Rezende Messias unp. Data |
| 42 | Sanguinus weddelli | −63.75452 | −9.63040 | Ochoa-Quintero JM |
| 43 | Sanguinus weddelli | −63.68235 | −9.72496 | Ochoa-Quintero JM |
| 44 | Sanguinus weddelli | −63.64947 | −10.25626 | Ochoa-Quintero JM |
| 45 | Sanguinus weddelli | −63.61388 | −10.24537 | Ochoa-Quintero JM |
| 46 | Sanguinus weddelli | −63.56832 | −10.23835 | Ochoa-Quintero JM |
| 47 | Sanguinus weddelli | −63.21380 | −10.05134 | Ochoa-Quintero JM |
| 48 | Sanguinus weddelli | −62.91580 | −10.38790 | Ochoa-Quintero JM |
| 49 | Sanguinus weddelli | −62.87795 | −10.30455 | Ochoa-Quintero JM |
| 50 | Sanguinus weddelli | −62.87411 | −10.28550 | Ochoa-Quintero JM |
| 51 | Sanguinus weddelli | −62.72091 | −9.75068 | Ochoa-Quintero JM |
| 52 | Sanguinus weddelli | −62.24402 | −9.54754 | Ochoa-Quintero JM |
| 53 | Sanguinus weddelli | −61.97526 | −9.86657 | Ochoa-Quintero JM |
| 54 | Sanguinus weddelli | −61.91976 | −9.52122 | Ochoa-Quintero JM |
| Name of Protected Area | National Category |
|---|---|
| Resex Rio Preto Jacunda | Reserva Extrativista (Extractivist reserve) |
| Resex Jaci Parana | Reserva Extrativista (Extractivist reserve) |
| Resex Pacaas Novos | Reserva Extrativista (Extractivist reserve) |
| Flona Jacunda | Floresta Nacional (National florest) |
| Resex Mogno | Reserva Extrativista (Extractivist reserve) |
| Resex Ipe | Reserva Extrativista (Extractivist reserve) |
| Resex Cedro | Reserva Extrativista (Extractivist reserve) |
| Resex Angelim | Reserva Extrativista (Extractivist reserve) |
| Resex Sucupira | Reserva Extrativista (Extractivist reserve) |
| Fers Gaviao | Florestas Estaduais de Rendimento Sustentado (State Forest of Sustainability) |
| Fers Periqutos | Florestas Estaduais de Rendimento Sustentado (State Forest of Sustainability) |
| Fers Mutum | Florestas Estaduais de Rendimento Sustentado (State Forest of Sustainability) |
| Fers Tucano | Florestas Estaduais de Rendimento Sustentado (State Forest of Sustainability) |
| Fers Araras | Florestas Estaduais de Rendimento Sustentado (State Forest of Sustainability) |
| Esec Samuel | Estação Ecológica (Ecological Station) |
| Flona Jamari | Floresta Nacional (National Forest) |
| P.E. Guajara-Mirim | Parque Estadual (Estate Park) |
| Resex Ouro Preto | Reserva Extrativista (Extractivist reserve) |
| Apa/Fes Rio Pardo | Area de Proteção Ambiental/Floresta Estadual (Area of environmental protection/ State Forest) |
| P.M. Ariquemes | Parque Municipal (Municipal park) |
| P.M. Cana-Ariquiemes | Parque Municipal (Municipal park) |
| Flona Bom Futuro | Parque Federal (Federal Park) |
| Karipuna | Indigenous reserve |
| Karitiana | Indigenous reserve |
| Rio Negro Ocaia | Indigenous reserve |
| Uru-Eu-Wau-Wau | Indigenous reserve |
| Parque Estadual de Candeias | Parque Estadual (State Park) |
References
- Amadon, D. Birds of the Congo and Amazon forests: A comparison. In Tropical Forest Ecosystems in Africa and South America: A Comparative Review; Smithsonian Institution Press: Washington, DC, USA, 1973; pp. 267–277. [Google Scholar]
- Gentry, A.H. Tree species richness of upper Amazonian forests. Proc. Natl. Acad. Sci. USA 1988, 85, 156–159. [Google Scholar] [CrossRef] [PubMed]
- Peres, C.A.; Janson, C.H. Species coexistence, distribution, and environmental determinants of neotropical primate richness: A community-level zoogeographic analysis. In Primate Communities; Fleagle, J.G., Janson, C.H., Reed, K.E., Eds.; Cambridge University Press: Cambridge, UK, 1999; pp. 55–74. [Google Scholar]
- WWF Global. Amazon Alive, a Decade of Discovery 1999–2009. 2010. Available online: http://wwf.panda.org/wwf_news/?200056/AmazonAliveAdecadeofdiscovery1999–2009 (accessed on 3 September 2012).
- Peres, C.A.; Lake, I.R. Extent of nontimber resource extraction in tropical forests: Accessibility to game vertebrates by hunters in the Amazon basin. J. Soc. Conserv. Biol. 2003, 17, 521–535. [Google Scholar] [CrossRef]
- Alencar, A.A.C.; Solorzano, L.A.; Nepstad, D.C. Modeling forest understory fires in an eastern Amazonian landscape. Ecol. Appl. 2004, 14, S139–S149. [Google Scholar] [CrossRef]
- Bird, J.P.; Buchanan, G.M.; Lees, A.C.; Clay, R.P.; Develey, P.F.; Yépez, I.; Butchart, S.H.M. Integrating spatially explicit habitat projections into extinction risk assessments: A reassessment of Amazonian avifauna incorporating projected deforestation. Divers. Distrib. 2012, 18, 273–281. [Google Scholar] [CrossRef]
- Wearn, O.R.; Reuman, D.C.; Ewers, R.M. Extinction debt and windows of conservation opportunity in the Brazilian Amazon. Science 2012, 337, 228–232. [Google Scholar] [CrossRef] [PubMed]
- Soares-Filho, B.; Nepstad, D.C.; Curran, L.M.; Cerqueira, G.C.; Garcia, R.A.; Ramos, C.A.; Voll, E.; McDonald, A.; Lefebvre, P.; Schlesinger, P. Modelling conservation in the Amazon basin. Nature 2006, 440, 520–523. [Google Scholar] [CrossRef] [PubMed]
- Armenteras, D.; Rodríguez, N.; Retana, J. Are conservation strategies effective in avoiding the deforestation of the Colombian Guyana Shield? Biol. Conserv. 2009, 142, 1411–1419. [Google Scholar] [CrossRef]
- Veríssimo, A.; Rolla, A.; Vedoveto, M.; Futada, S.D.M. Protected Areas in the Brazilian Amazon: Challenges & Opportunities; John, L., Ed.; CIP (Brazilian Book Committee): São Paulo, Brazil, 2011; pp. 3–96. [Google Scholar]
- Nepstad, D.; Schwartzman, S.; Bamberger, B.; Santilli, M.; Ray, D.; Schlesinger, P.; Lefebvre, P.; Alencar, A.; Prinz, E.; Fiske, G.; et al. Inhibition of Amazon deforestation and fire by parks and indigenous lands. Conserv. Biol. 2006, 20, 65–73. [Google Scholar] [CrossRef] [PubMed]
- Nepstad, D.; Soares-Filho, B.S.; Merry, F.; Lima, A.; Moutinho, P.; Carter, J.; Bowman, M.; Cattaneo, A.; Rodrigues, H.; Schwartzman, S.; et al. The end of deforestation in the Brazilian Amazon. Science 2009, 326, 1350–1351. [Google Scholar] [CrossRef] [PubMed]
- Instituto Nacional de Pesquisas Espaciais (INPE). National Institute for Space Research Projeto Prodes Monitoramento da Florsta Amazonica Brasileira por Satélite Prodes. 2012. Available online: http://www.obt.inpe.br/prodes/ (accessed on 4 September 2012).
- Davidson, E.A.; de Araújo, A.C.; Artaxo, P.; Balch, J.K.; Brown, I.F.; Bustamante, M.M.C.; Coe, M.T.; DeFries, R.S.; Keller, M.; Longo, M.; et al. The Amazon basin in transition. Nature 2012, 481, 321–326. [Google Scholar] [CrossRef] [PubMed]
- Gardner, T. The Amazon in transition: The challenge of transforming the world’s largest tropical forest biome into a sustainable social-ecological system. In Addressing Tipping Points; O’Riordan, T., Christie, L., Eds.; Oxford University Press: Oxford, UK, 2013; pp. 127–148. [Google Scholar]
- Ceballos, G.; Ehrlich, P.R. Discoveries of new mammal species and their implications for conservation and ecosystem services. Proc. Natl. Acad. Sci. USA 2009, 106, 3841–3846. [Google Scholar] [CrossRef] [PubMed]
- Giam, X.; Scheffers, B.R.; Sodhi, N.S.; Wilcove, D.S.; Ceballos, G.; Ehrlich, P.R. Reservoirs of richness: Least disturbed tropical forests are centres of undescribed species diversity. Proc. R. Soc. B Biol. Sci. 2012, 279, 67–76. [Google Scholar] [CrossRef] [PubMed]
- Klorvuttimontara, S.; McClean, C.J.; Hill, J.K. Evaluating the effectiveness of Protected Areas for conserving tropical forest butterflies of Thailand. Biol. Conserv. 2011, 144, 2534–2540. [Google Scholar] [CrossRef]
- Elith, J.; Phillips, S.J.; Hastie, T.; Dudík, M.; Chee, Y.E.; Yates, C.J. A statistical explanation of MaxEnt for ecologists. Divers. Distrib. 2011, 17, 43–57. [Google Scholar] [CrossRef]
- Guisan, A.; Thuiller, W. Predicting species distribution: Offering more than simple habitat models. Ecol. Lett. 2005, 8, 993–1009. [Google Scholar] [CrossRef]
- Cardillo, M.; Mace, G.M.; Gittleman, J.L.; Jones, K.E.; Bielby, J.; Purvis, A. The predictability of extinction: Biological and external correlates of decline in mammals. Proc. R. Soc. B Biol. Sci. 2008, 275, 1441–1448. [Google Scholar] [CrossRef] [PubMed]
- Rylands, A.B.; Coimbra-Filho, A.F.; Mittermeier, R.A.; Ford, S.M.; Porter, L.M.; Davis, L.C. The Systematics and Distributions of the Marmosets (Callithrix, Callibella, Cebuella and Mico) and Callimico (Callimico) (Callitrichidae, Primates). In The Smallest Anthropoids; Ford, S.M., Davis, L.C., Porter, L.M., Eds.; Springer: New York, NY, USA, 2009; pp. 25–61. [Google Scholar]
- Ferrari, S.; Sena, L.; Schneider, M.; Júnior, J. Rondon’s marmoset, Mico rondoni sp. from southwestern Brazilian Amazonia. Int. J. Primatol. 2010, 31, 693–714. [Google Scholar] [CrossRef]
- IUCN Red List of Threatened Species. 2012. Available online: www.iucnredlist.org (accessed on 3 September 2012).
- De Vivo, M. On Some Monkeys from Rondônia, Brasil (Primates: Callitrichidae, Cebidae); Papeis Avulsos de Zoologia; Universidade de Sao Paulo: São Paulo, Brazil, 1985; Volume 36, pp. 103–110. [Google Scholar]
- Aparecida, L.M.; Ferrari, S.F. Foraging behavior of a tamarin group (Saguinus fuscicollis weddelli) and interactions with marmosets (Callithrix emiliae). Int. J. Primatol. 1994, 15, 373–387. [Google Scholar]
- Pedlowski, M.A.; Matricardi, E.A.T.; Skole, D.; Cameron, S.R.; Chomentowski, W.; Fernandes, C.; Lisboa, A. Conservation units: A new deforestation frontier in the Amazonian state of Rondonia, Brazil. Environ. Conserv. 2005, 32, 149–155. [Google Scholar] [CrossRef]
- Rondonia. Boletim Climatológico de Rondônia ano 2004 (Bulletin of Climatology from Rondonia 2004); Governo do Estado de Rondônia: Porto Velho, Brasil, 2004.
- Cracraft, J. Historical biogeography and patterns of differentiation within the South American avifauna: Areas of endemism. Ornithol. Monogr. 1985, 49–84. [Google Scholar] [CrossRef]
- Haffer, J. Distribution of Amazonian forest birds. Bonn Zool. Beitr. 1978, 29, 38–78. [Google Scholar]
- Radambrasil, P. Folha SC.20—Porto Velho. In Levantamento de Recursos Naturais; Radambrasil: Rio de Janeiro, Brazil, 1978. [Google Scholar]
- Browder, J.O.; Pedlowski, M.A.; Walker, R.; Wynne, R.H.; Summers, P.M.; Abad, A.; Becerra-Cordoba, N.; Mil-Homens, J. Revisiting theories of frontier expansion in the Brazilian Amazon: A survey of the colonist farming population in Rondonia’s post-frontier, 1992–2002. World Dev. 2008, 36, 1469–1492. [Google Scholar] [CrossRef]
- Lima, J.M.T.; Valle, D.; Moretto, E.M.; Pulice, S.M.P.; Zuca, N.L.; Roquetti, D.R.; Beduschi, L.E.C.; Praia, A.S.; Okamoto, C.P.F.; da Silva Carvalhaes, V.L.; et al. A social-ecological database to advance research on infrastructure development impacts in the Brazilian Amazon. Sci. Data 2016, 3, 160071. [Google Scholar] [CrossRef] [PubMed]
- Ochoa-Quintero, J.M.; Gardner, T.A.; Rosa, I.; Ferraz, S.F.; Sutherland, W.J. Thresholds of species loss in Amazonian deforestation frontier landscapes. Conserv. Biol. 2015, 29, 440–451. [Google Scholar] [CrossRef] [PubMed]
- Phillips, S.J.; Anderson, R.P.; Schapire, R.E. Maximum entropy modeling of species geographic distributions. Ecol. Model. 2006, 190, 231–259. [Google Scholar] [CrossRef]
- Warren, D.L.; Seifert, S.N. Ecological niche modeling in Maxent: The importance of model complexity and the performance of model selection criteria. Ecol. Appl. 2011, 21, 335–342. [Google Scholar] [CrossRef] [PubMed]
- Pearson, R.G.; Raxworthy, C.J.; Nakamura, M.; Peterson, T. Predicting species distributions from small numbers of occurrence records: A test case using cryptic geckos in Madagascar. J. Biogeogr. 2007, 34, 102–117. [Google Scholar] [CrossRef]
- Hijmans, R.J.; Cameron, S.E.; Parra, J.L.; Jones, P.G.; Jarvis, A. Very high resolution interpolated climate surfaces for global land areas. Int. J. Climatol. 2005, 25, 1965–1978. [Google Scholar] [CrossRef]
- De Oliveira, M.M.; Rylands, A.B.; Ferrari, S.F.; Silva, J.S., Jr. Mico rondoni. The IUCN Red List of Threatened Species. 2008. Available online: http://dx.doi.org/10.2305/IUCN.UK.2008.RLTS.T136804A4341743.en (accessed on 18 January 2016).
- World Database on Protected Areas. Available online: http://www.wdpa.org/ (accessed on 7 September 2016).
- Rodrigues, A.S.L.; Ewers, R.M.; Parry, L.; Souza, C., Jr.; Verissimo, A.; Balmford, A. Boom-and-bust development patterns across the Amazon deforestation frontier. Science 2009, 324, 1435–1437. [Google Scholar] [CrossRef] [PubMed]
- Alves, D.S.; Escada, M.I.; Pereira, J.L.; de Albuquerque Linhares, C. Land use intensification and abandonment in Rondônia, Brazilian Amazônia. Int. J. Remote Sens. 2003, 24, 899–903. [Google Scholar] [CrossRef]
- Ferraz, S.D.B.; Vettorazzi, C.A.; Theobald, D.M. Using indicators of deforestation and land-use dynamics to support conservation strategies: A case study of central Rondônia, Brazil. For. Ecol. Manag. 2009, 257, 1586–1595. [Google Scholar] [CrossRef]
- Balmford, A.; Green, R.; Phalan, B. What conservationists need to know about farming. Proc. R. Soc. B Biol. Sci. 2012, 279, 2714–2724. [Google Scholar] [CrossRef] [PubMed]
- Prist, P.; Michalski, F.; Metzger, J. How deforestation pattern in the Amazon influences vertebrate richness and community composition. Landsc. Ecol. 2012, 27, 799–812. [Google Scholar] [CrossRef]
- Laurance, W.F.; Carolina Useche, D.; Rendeiro, J.; Kalka, M.; Bradshaw, C.J.A.; Sloan, S.P.; Laurance, S.G.; Campbell, M.; Abernethy, K.; Alvarez, P.; et al. Averting biodiversity collapse in tropical forest protected areas. Nature 2012, 489, 290–294. [Google Scholar] [CrossRef] [PubMed]
- Cardozo, F.D.S.; Pereira, G.; Shimabukuro, Y.E.; Moraes, E.C. Análise das mudanças dos parâmetros físicos da superfície derivados das queimadas no estado de Rondônia. Bol. Ciênc. Geod. 2014, 20, 830. [Google Scholar] [CrossRef]
- Asner, G.P.; Knapp, D.E.; Broadbent, E.N.; Oliveira, P.J.; Keller, M.; Silva, J.N. Selective logging in the Brazilian Amazon. Science 2005, 310, 480–482. [Google Scholar] [CrossRef] [PubMed]
- Rodrigues, A.S.L.; Akçakaya, H.R.; Andelman, S.J.; Bakarr, M.I.; Boitani, L.; Brooks, T.M.; Chanson, J.S.; Fishpool, L.D.C.; da Fonseca, G.A.B.; Gaston, K.J.; et al. Global gap analysis: Priority Regions for expanding the global protected-area network. BioScience 2004, 54, 1092–1100. [Google Scholar] [CrossRef]
- Radford, J.Q.; Bennett, A.F. The relative importance of landscape properties for woodland birds in agricultural environments. J. Appl. Ecol. 2007, 44, 737–747. [Google Scholar] [CrossRef]
- Pardini, R.; Bueno, A.D.A.; Gardner, T.A.; Prado, P.I.C.; Metzger, J.P. Beyond the fragmentation threshold hypothesis: Regime shifts in biodiversity across fragmented landscapes. PLoS ONE 2010, 5, e13666. [Google Scholar] [CrossRef] [PubMed]
- Etter, A.; McAlpine, C.; Phinn, S.; Pullar, D.; Possingham, H. Unplanned land clearing of Colombian rainforests: Spreading like disease? Landsc. Urban Plan. 2006, 77, 240–254. [Google Scholar] [CrossRef]
- Michalski, F.; Peres, C.A.; Lake, I.R. Deforestation dynamics in a fragmented region of southern Amazonia: Evaluation and future scenarioa. Environ. Conserv. 2008, 35, 93–103. [Google Scholar] [CrossRef]
- Rosa, I.M.D.; Purves, D.; Souza, C., Jr.; Ewers, R. Predictive modelling of contagious deforestation in the Brazilian Amazon. PLoS ONE 2013, 8, e77231. [Google Scholar] [CrossRef] [PubMed]
- Fearnside, P.M. Brazil’s Samuel Dam: Lessons for hydroelectric development policy and the environment in Amazonia. Environ. Manag. 2005, 35, 1–19. [Google Scholar] [CrossRef]


© 2017 by the authors. Licensee MDPI, Basel, Switzerland. This article is an open access article distributed under the terms and conditions of the Creative Commons Attribution (CC BY) license ( http://creativecommons.org/licenses/by/4.0/).
Share and Cite
Ochoa-Quintero, J.M.; Chang, C.H.; Gardner, T.A.; Rezende Messias, M.; Sutherland, W.J.; Delben, F.A.C. Habitat Loss on Rondon’s Marmoset Potential Distribution. Land 2017, 6, 8. https://doi.org/10.3390/land6010008
Ochoa-Quintero JM, Chang CH, Gardner TA, Rezende Messias M, Sutherland WJ, Delben FAC. Habitat Loss on Rondon’s Marmoset Potential Distribution. Land. 2017; 6(1):8. https://doi.org/10.3390/land6010008
Chicago/Turabian StyleOchoa-Quintero, Jose Manuel, Charlotte H. Chang, Toby A. Gardner, Mariluce Rezende Messias, William J. Sutherland, and Fernanda A. C. Delben. 2017. "Habitat Loss on Rondon’s Marmoset Potential Distribution" Land 6, no. 1: 8. https://doi.org/10.3390/land6010008