Vegetation in Drylands: Effects on Wind Flow and Aeolian Sediment Transport


1
School of Geography and the Environment, Oxford University Centre for the Environment, South Parks Road, Oxford OX1 3QY, UK
2
USDA-ARS Jornada Experimental Range, Las Cruces, NM 88003, USA
*
Author to whom correspondence should be addressed.
Land 2017, 6(3), 64; https://doi.org/10.3390/land6030064
Submission received: 19 July 2017
/
Revised: 14 September 2017
/
Accepted: 14 September 2017
/
Published: 18 September 2017
(This article belongs to the Special Issue Arid Land Systems: Sciences and Societies)
Abstract
:Drylands are characterised by patchy vegetation, erodible surfaces and erosive aeolian processes. Empirical and modelling studies have shown that vegetation elements provide drag on the overlying airflow, thus affecting wind velocity profiles and altering erosive dynamics on desert surfaces. However, these dynamics are significantly complicated by a variety of factors, including turbulence, and vegetation porosity and pliability effects. This has resulted in some uncertainty about the effect of vegetation on sediment transport in drylands. Here, we review recent progress in our understanding of the effects of dryland vegetation on wind flow and aeolian sediment transport processes. In particular, wind transport models have played a key role in simplifying aeolian processes in partly vegetated landscapes, but a number of key uncertainties and challenges remain. We identify potential future avenues for research that would help to elucidate the roles of vegetation distribution, geometry and scale in shaping the entrainment, transport and redistribution of wind-blown material at multiple scales. Gaps in our collective knowledge must be addressed through a combination of rigorous field, wind tunnel and modelling experiments.
1. Introduction: The Drylands Context
Dryland environments, which constitute about 47% of the global land area [1], are extreme in their nature, typified by non-equilibrium conditions in climate, vegetation and geomorphology [2,3]. The strong interannual variability in precipitation characteristic of drylands [4,5] often results in ephemeral vegetative cover [6] or distinctive spatial patterning [7]. In turn, the limited nature of vegetation cover makes it an important control on the rate and extent to which geomorphological (and notably aeolian) processes operate.
Aeolian processes are increasingly viewed as major abiotic drivers that can have important consequences for landscape evolution [8,9], biogeochemical cycling [10,11], regional climate [12,13,14], land degradation [15,16,17] and public health [18,19]. Wind regime and sediment supply are known to largely control the formation of bare-sand dunes (e.g., [20,21,22,23]), but the complicating effects of vegetation, which form part of a wider, multi-scaled interplay of biophysical and anthropogenic factors, are less well understood [24,25,26].
Many of the potential effects of climate and land use change over the 21st century are likely to be mediated through aeolian activity in dryland landscapes [27,28]. Pressures on dryland resources are increasing as the population of the global arid zone, which is located mostly in the developing world, surpasses 2 billion people [29,30]. These pressures, combined with increasingly arid conditions owing to climatic change [13,31,32,33], are driving rapid, large-scale vegetation shifts that alter rates and patterns of soil erosion and modify ecosystem functioning and structure [6,34]. Land degradation, a form of regime shift whereby the environment changes potentially irreversibly to a new state [35], is likely to have a major impact on food security and environmental quality [6,36]. Changing vegetation patterns may lead to large-scale reactivation of dune fields and desert encroachment in many of the world’s most vulnerable regions [8,9,33].
Given the key role that vegetation plays in modulating abiotic processes in drylands, this paper reviews recent studies to provide a holistic view of the effect of vegetation on wind flow and aeolian sediment transport. The paper examines: (i) the effect of vegetation on wind flow, both in terms of the wind velocity profile and on drag, drag partition and the distribution of surface shear stress; (ii) sediment transport dynamics on vegetated surfaces, collating information from wind tunnel, field, and modelling studies; and (iii) potential future avenues for research in these fields.
2. The Effect of Vegetation on Wind Flow
Semi-arid vegetation is often patchy and dynamic through time and space, primarily as a result of resource (water and nutrients) limitation [37,38,39,40,41,42]. In turn, the presence of patchy plant configurations significantly complicates wind flow near the land surface. The effect of non-erodible elements (e.g., vegetation) on wind flow can be examined both in terms of the wind velocity profile, which provides information at single points in space, and in terms of the partition of drag over the land surface at larger spatial scales.
2.1. Effects on the Wind Velocity Profile
At the scale of individual roughness elements, dryland vegetation modulates the erodibility of the surface and the erosivity of the wind through three primary mechanisms [43]. First, vegetation can directly shelter the soil from the wind by covering a fraction of the surface and initiating a wake region in its lee [44,45,46]; Second, vegetation directly affects wind velocity profiles by acting as a form of roughness that results in the growth of a boundary layer downwind (e.g., [47,48,49,50,51,52]); Finally, vegetation acts to trap windborne particles, thus reducing flux and providing loci for sediment deposition [27,53,54,55]. These mechanisms are explored in further detail below.
2.1.1. Plant Wake Dynamics
Single roughness elements such as plants shed turbulent eddies in a way that causes the flow in the wake to be separated from the surrounding flow [43]. For smooth, solid objects the interaction with the flow is relatively predictable [56], but characterising flow around live plants that are porous, pliable and of diverse geometry, is significantly more complex.
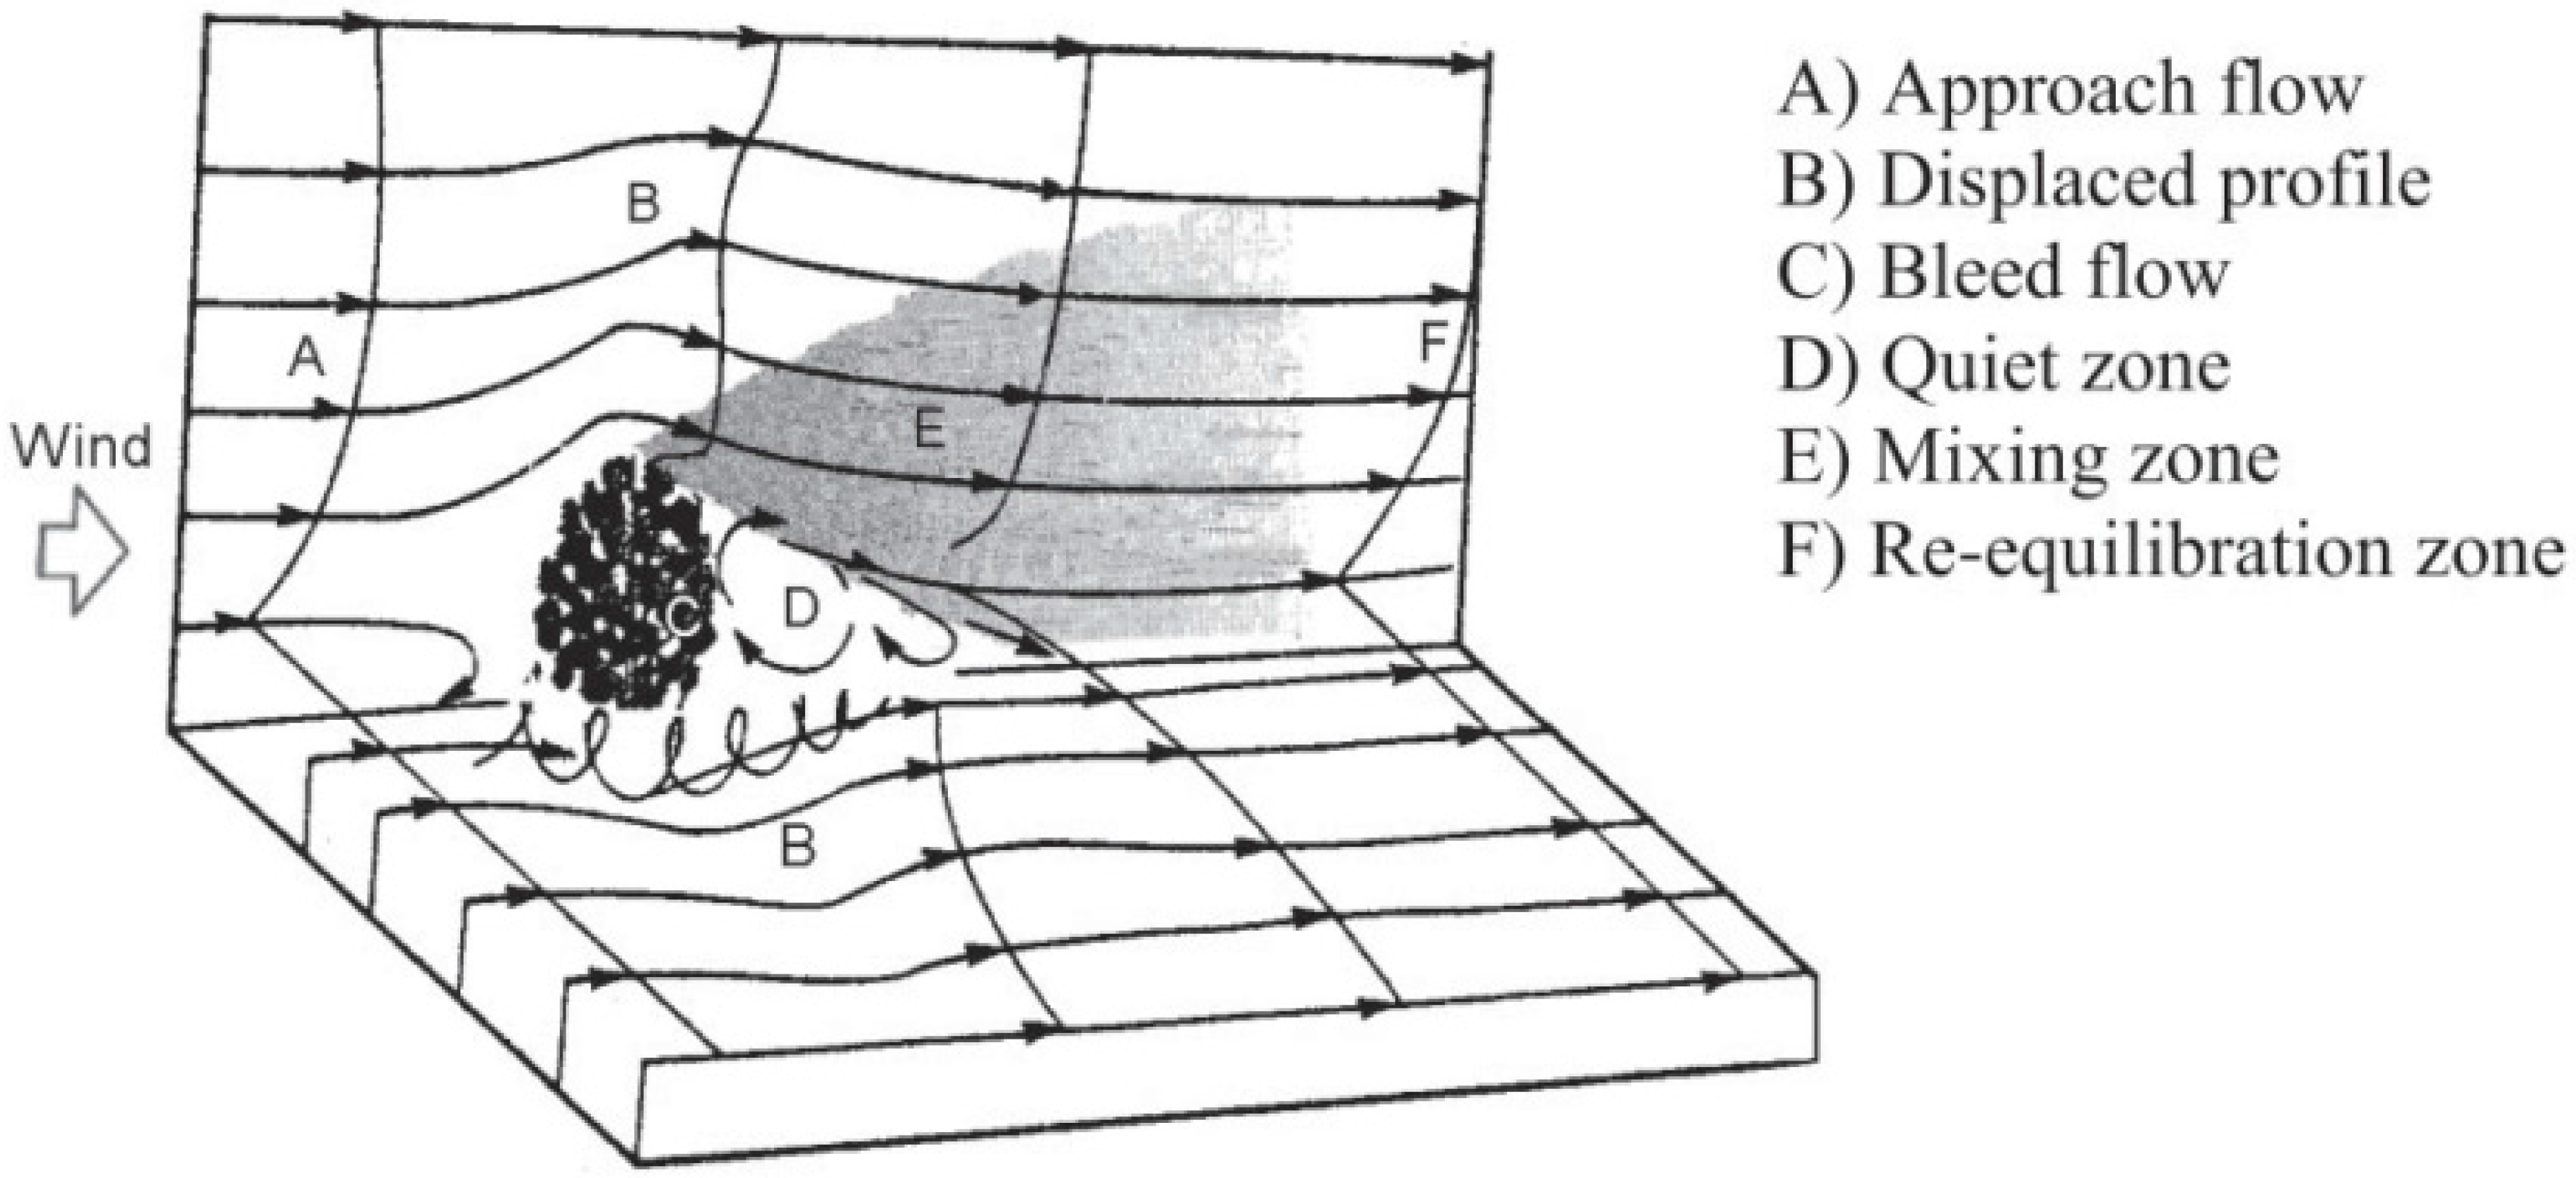
Using wind tunnel data, Judd et al. [44] built on the work of Wolfe and Nickling [43] to classify zones of flow around single porous roughness elements (see Figure 1). As wind approaches an obstacle (A), the air in the layer below the top of the element slows down and diverges upwind, with some air continuing through the porous obstacle to create a region of slower bleed flow in its immediate lee (C). As air is forced around the element and the flow lines are compressed, a region of accelerated wind develops above it and to its side (B). A low-velocity zone forms in the sheltered area of the obstacle (D), where wind velocity drastically decreases or even reverses in direction to form a recirculating eddy. This zone has variously been conceptualised as triangular in shape [57] or as a ‘corridor’ of asymptotic recovery [58]. Above and downwind of the low-velocity zone, a turbulent mixing zone grows downward from a thin layer at the top of the obstacle, eventually intersecting the ground surface (E). Ultimately the mixing zone merges into an equilibration zone (F) as the airflow recovers to equate to the upwind profile.
The model of Judd et al. [44] for individual plants has subsequently been supported by wind tunnel data (e.g., [59,60,61,62]) and modelling experiments [63]. However, few studies have sought to examine the turbulent wake structures generated by dryland plants in the field. Leenders et al. [46], who observed distinct zones of flow acceleration and deceleration around single Sahelian shrubs, showed that turbulence intensity was higher in low-velocity zones than at other locations. They concluded that the net effect of a shrub is to reduce wind velocity and trap sand particles near the soil surface. Mayaud et al. [64] investigated differences in high-frequency wind flow around a single shrub and grass clump, and showed that the bluffer nature of the grass induced more intense wind slowdown in the lee than the shrub. This supports previous findings [65,66] that low-porosity elements induce turbulence in their lee, but allow flow to recover to upstream conditions sooner than more porous elements.
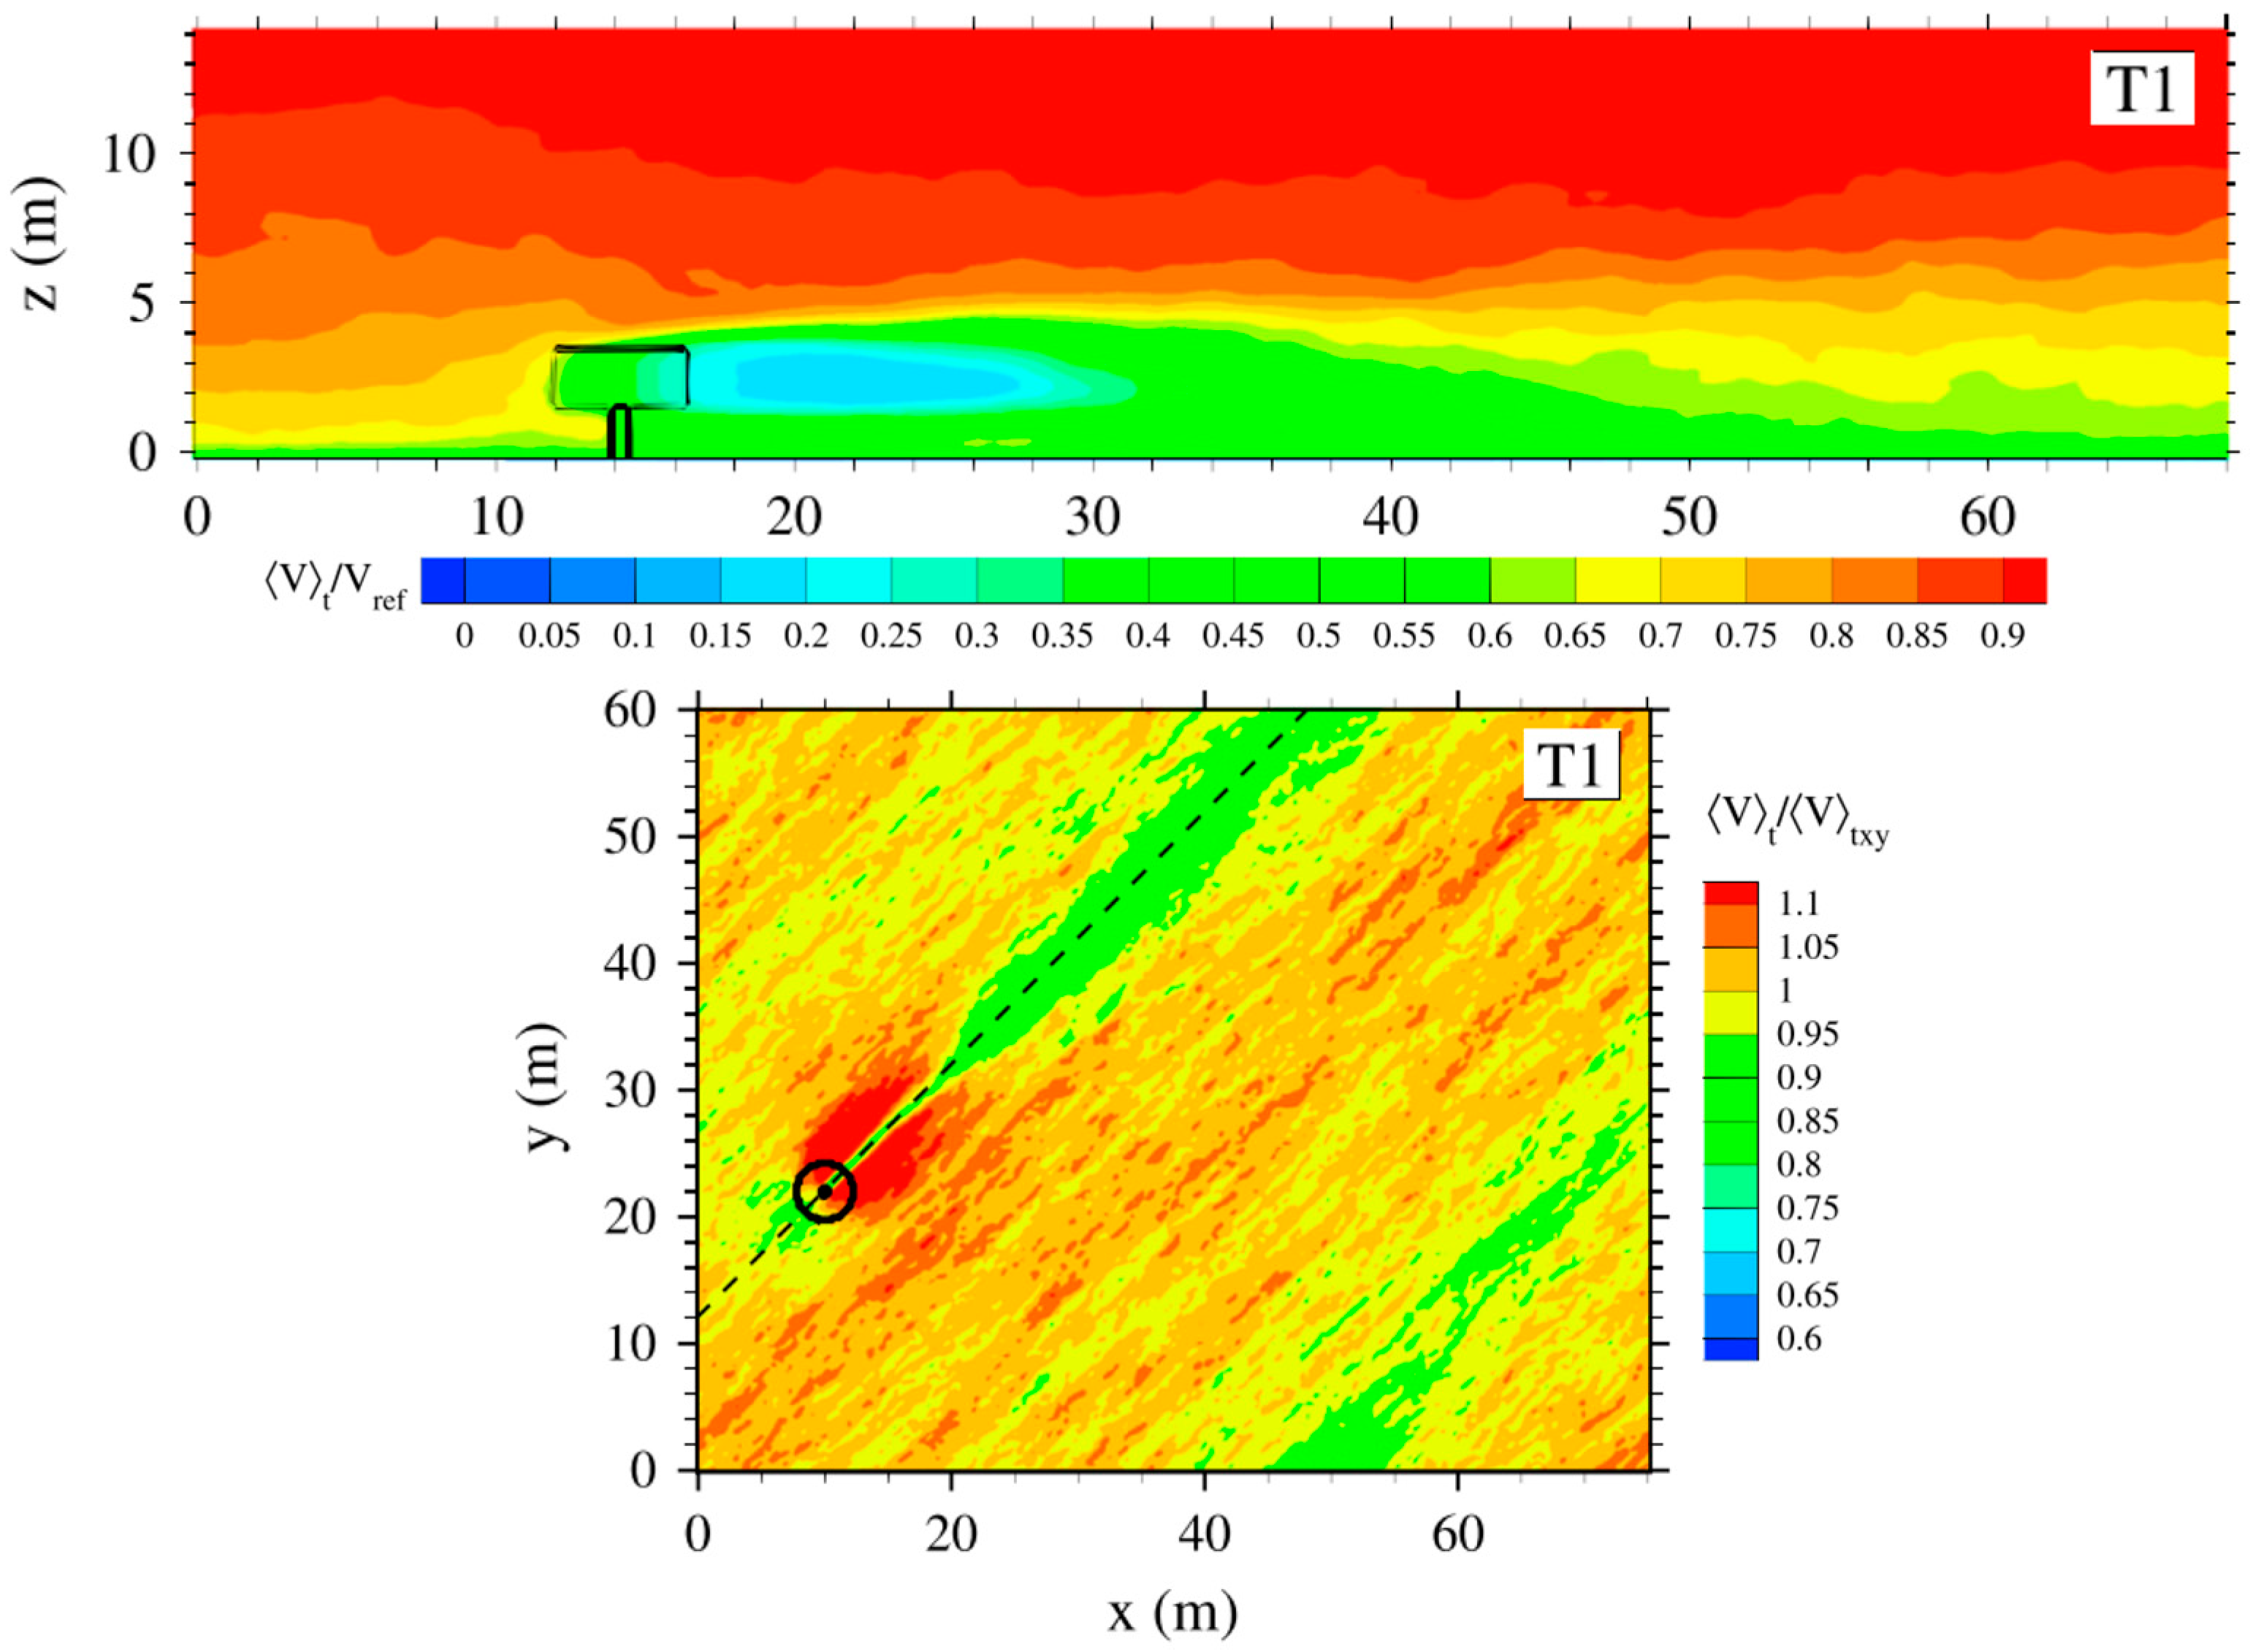
Trees affect wind flow differently to grasses and shrubs, owing to the presence of a trunk and canopy in the tree case [46,52,64,67]. Gross [67] and Dupont et al. [52] demonstrated using numerical models that wind flow accelerates over and around a single tree (Figure 2), and Leenders et al. [46] and Mayaud et al. [64] observed in the field that wind speed increases locally around the base of the trunk. A tree’s elevated canopy produces a ‘bottom gap’ effect, whereby wind flowing near the top half of the tree moves over its crown [61] and streamline compression between the ground and underside of the crown results in wind speeding up [52,68].
Further downwind, the frontal impact of the tree crown produces a wake region similar to that of a shrub, although the greater size of a tree means that it reduces wind speed more efficiently than a shrub [46]. The length and strength of the reverse flow in the wake of a tree appears to increase with wind speed, and the location of the minimum wind speed to shift to higher levels as trunk height increases [67]. Tree leaves may also be important for altering local airflow patterns [69], by inducing updrafts and downdrafts in the upstream region that cause turbulent, upwelling recirculation zones to form [61].
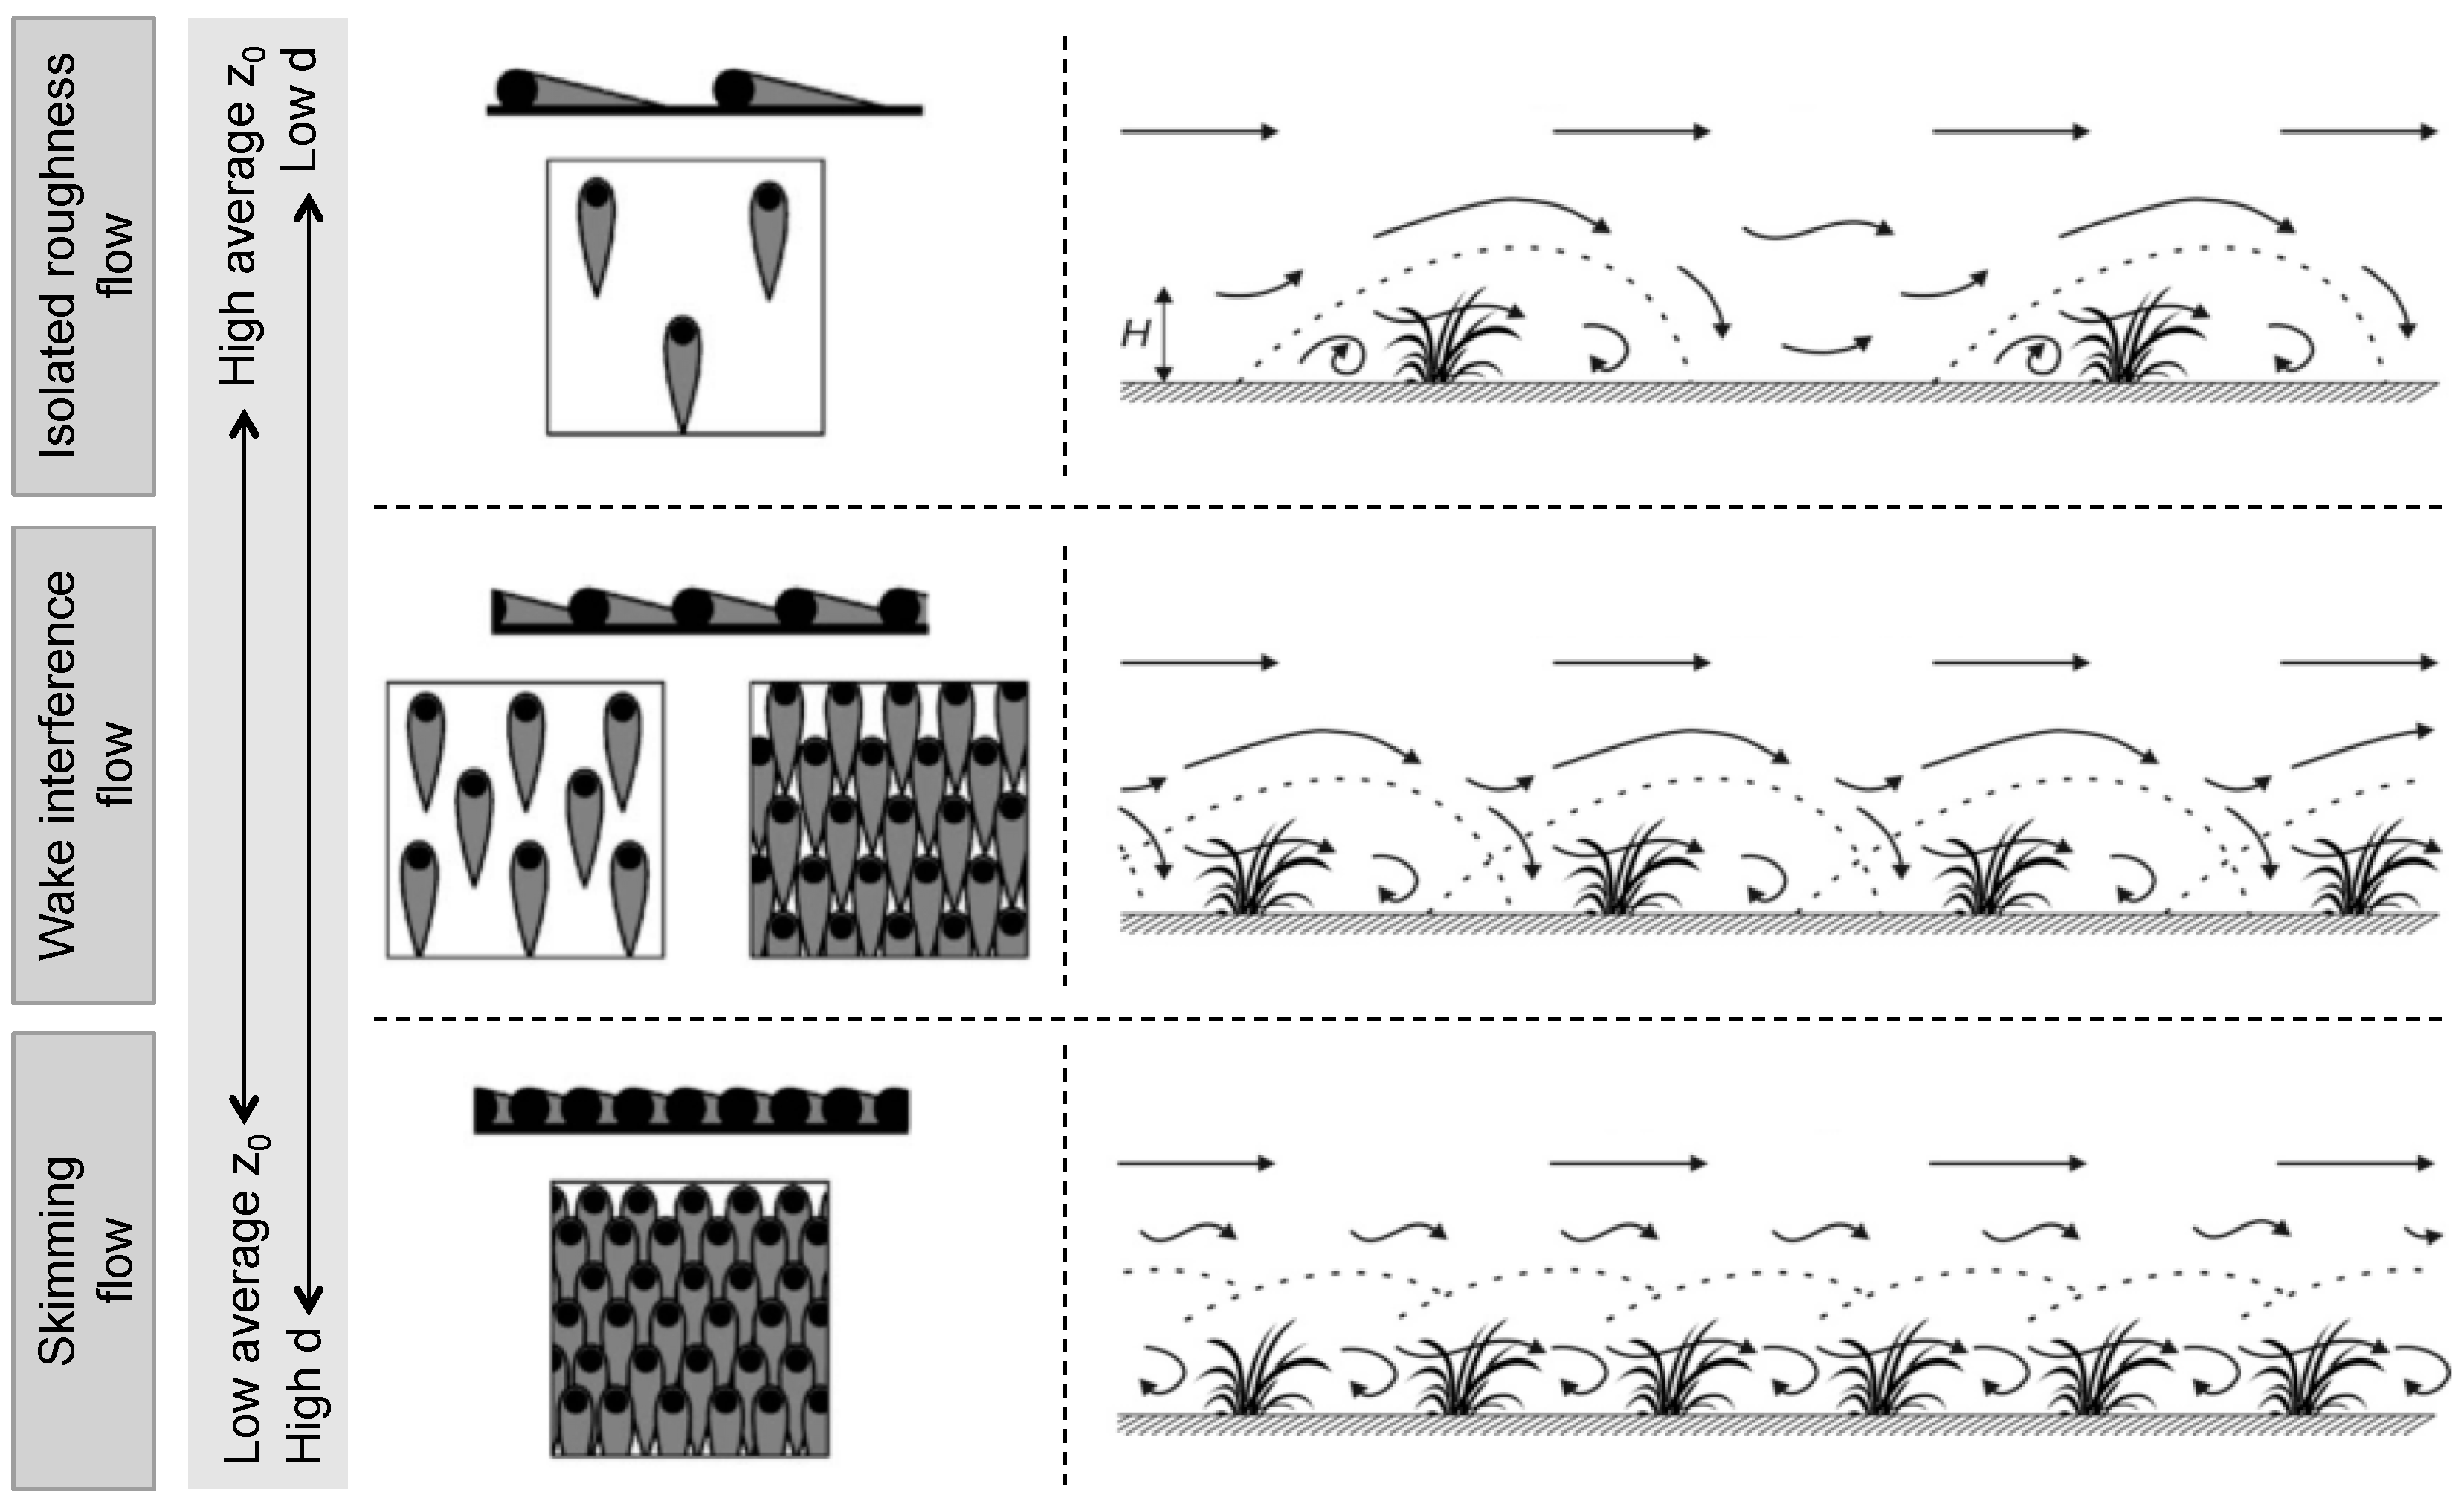
Whilst single plants are present in drylands, vegetation often grows in clumps and patches that can have varying effects on wind flow. The interactions of individual plant wakes with their neighbours can be broadly described by three different flow regimes ([43] Figure 3). As roughness element density increases, the flow regime changes from one where the elements act individually on the flow (isolated roughness flow) to a regime where the airflow skims across the top of the elements (skimming flow). In dryland environments, vegetation is often spaced far enough apart that the wake shed by an individual plant can fully develop or is only slightly obscured by a downwind plant (wake-interference flow). Lee and Soliman [70] classified these regimes by a ratio of inter-row spacing length to element height. However, this relationship often breaks down in dryland systems because natural vegetative surface roughness changes are often irregular, thus affecting wind momentum extraction and surface sheltering in differing ways [71].
2.1.2. Vegetation as a Form of Roughness
Vegetation can directly affect wind velocity profiles on desert surfaces by acting as a form of roughness, extracting momentum from near-surface wind, which results in the growth of a boundary layer downwind [47,48,72]. Boundary layer growth differs depending on the type of flow regime (Figure 3). When isolated roughness elements populate the surface (<16% cover [43]), each plant sheds turbulent eddies by diverting wind flow around and above each plant (see Section 2.1.1). This increases drag, thus raising shear stress and the aerodynamic roughness (), and potentially enhancing erosion locally [73]. An arch vortex with a reverse surface flow direction can develop directly downwind of individual roughness elements, upwind of a flow stagnation region where the outer flow reattaches to the ground [59,74].
In wake-interference flow (ca. 16–40% cover [43]), the increased drag and shear stress resulting from the presence of multiple elements may only be partly absorbed by the plants themselves. This results in stress being transferred to the inter-canopy surface, and potentially greater sediment transport [52,75]. In the case of skimming flow (>~40% cover [43]), the increased drag from the vegetation acts to displace upwards (establishing a zero-plane displacement height, ), which simultaneously extracts momentum from the surface wind and increases wind shear stress above the canopy (e.g., [47,48,49,50,51,52,76,77]). The absorption of additional stresses by the plants therefore decreases the erosion potential at the surface, despite the additional above-canopy shear stress induced by the increased surface roughness. That is, while increased roughness density may result in greater total shear stress, momentum partitioning between the plant canopy and the soil surface results in smaller surface shear stresses for entraining soil particles.
Skimming flow experiments have been mainly conducted in wind tunnels (e.g., [60,78,79]) and a few field and modelling studies of forest edges (e.g., [80,81,82,83]) and backward-facing steps (e.g., [84,85]). However, these configurations often have more extensive low-velocity zones and delayed reattachment points compared with vegetated cases due to their almost parallel-to-wall streamlines. More field research and empirical observations are needed to better understand skimming flow dynamics over full-scale vegetation patches in drylands.
2.1.3. Trapping of Windborne Sediment
Finally, vegetation acts to trap windborne particles, thus reducing the total horizontal and vertical sediment fluxes and providing loci for sediment deposition [27,86]. The prevalence of this effect can differ depending on vegetation height [55]: in the case of tall vegetation (e.g., trees and shrubs), saltation transport takes place primarily below canopy level in the open space between individual plants. In contrast, for short vegetation (e.g., grasses), sand transport takes place primarily within and above the plant canopy, so that grasses may trap aeolian sediment more readily than shrubs. Trees affect sediment trapping differently to grasses and shrubs, owing to their trunk and elevated crown [46,52,61,64,67].
The deposition of aeolian sediment in the presence of vegetation occurs via three principal processes: gravitational settling, inertial impaction and Brownian diffusion [87]. The interception of saltating particles and suspended sediment by vegetation may be considered a part of the impaction process, which in addition to vegetation height is influenced by vegetation porosity and the spatial distribution of roughness over the land surface [88]. Zhang and Shao [89] formulated a parameterisation of dry deposition for rough land surfaces that resolves the aerodynamic resistance of the surface, gravitational resistance, and surface collection resistance as a function of the component depositional processes. However, considerable uncertainty remains in how to effectively measure and model sediment deposition processes for areas with heterogeneous vegetation. New approaches to resolve the partition of wind momentum fluxes over heterogeneous land surfaces (see Section 3.2.1) may provide opportunities to reduce the uncertainty in sediment deposition schemes.
2.1.4. Effects of Plant Porosity, Pliability and Configuration
Theoretical calculations [57,58] and experimental measurements [46,54,62,63,79,90] suggest that protective wakes downwind of individual vegetation elements extend to approximately 7–10 h (where h is the height of the element). However, this can vary significantly depending on plant porosity, pliability and configuration.
Much of the research on the effects of plant porosity and pliability on wind flow has been conducted on sand fences and windbreaks, and findings from these are of some relevance to plants [46,91]. Taylor [92] found that drag coefficients decreased exponentially as the porosity of a two-dimensional barrier increased, but Grant and Nickling [91] demonstrated that a peak in drag coefficient occurred at an intermediate optical porosity (~20%) for three-dimensional trees. It has been shown that elements with a porosity less than 20% act to enhance wind speed recovery in their lee [68,93,94,95], so elements with intermediate porosity strike a compromise between shear stress reduction and the downwind distance for which it is effective [96,97]. However, even porosity values of 50% can cause wake effects to extend to at least 50 h downwind of a windbreak [98]. The sediment trapping mechanism of plants (see Section 2.1.3) also depends on plant porosity [53,54,96], with wind tunnel (e.g., [97]) and field (e.g., [91]) experiments showing that the trapping effect of vegetation is maximised at intermediate values of porosity (20–40%). Using wire mesh structures, Gillies et al. [86,99] showed that porous elements have a greater potential for modulating sediment flux than solid elements in large spatial arrays.
The pliability of plants affects their aerodynamic behaviour. Some pliable plant stems alter their form to become more streamlined in higher winds, thus extracting momentum less effectively as wind speed increases [53]. This results in a decreased sheltering effect at increasing wind speeds, due to a narrowing of the lee-side wake and suppression of horseshoe vortices [74,78]. Therefore, the rigid, non-porous roughness elements commonly employed in many wind tunnel studies to simulate vegetation arrays may provide inadequate approximations to live plants [74]. Indeed, Gillies et al. [54] showed that flow field responses between solid bluff body forms and elements of the same form and size that are covered with a porous outer layer surrounding a solid inner core are not equivalent. Moreover, scaling issues linked to boundary layer depths mean that full-scale elements are rarely used in wind tunnel experiments. This can limit the applicability of findings from wind tunnels. A few studies (e.g., [74,78,100]) have recently used live canopies in wind tunnels, but live plants are far more complicated to control in terms of appearance and behaviour than artificial imitations [78].
The configuration, or geometric arrangement, of windbreaks has also been shown to affect their aerodynamic behaviour. Using a numerical model, Liu et al. [72] showed that alternate and regular arrays of tree windbreaks provided the most protection, whereas a patchy arrangement, where trees were clumped together in space, resulted in the highest erosive forces. Liu et al. [72] hypothesised that this resulted from reduced diameter influences, whereby vegetation clumping decreases the total wake spread, thus reducing the protective effects of wake interference and allowing wind to flow through unimpeded. Wind tunnel studies [62,95] suggest that multiple-row barriers reduce wind velocities more efficiently than single-row barriers, at least in the immediate lee. This effect is likely due to the additional turbulence generated by a sequence of fences compared to an isolated barrier [101]. Wu et al. [62] also showed that using multiple vegetation species can provide optimal sheltering effects. There is little research on the impact of vegetation patch configuration at the meso scale, with the exception of some scaled-down wind tunnel experiments [60,78,79] and modelling studies of forest edges [81,82,83]. Wind tunnel and modelling experiments have also been used to understand flow behaviour around backward-facing steps (e.g., [84,85]), although these configurations often have more extensive low-velocity zones and delayed reattachment points compared to vegetated cases, due to their almost parallel-to-wall streamlines.
Collating information from windbreak and vegetation studies allows the main zones of flow change to be identified and partially quantified (see Figure 4). However, whilst windbreak studies can be useful proxies for vegetation elements, the three-dimensional nature of live plants (as opposed to the two-dimensional problem represented by a fence) means that findings may not be completely transferable [46,54,64,77]. The recovery length downwind of a vegetation patch or fence has been shown to be significantly longer than in the case of single vegetation elements [46,54,62,64,77,81,83,91,98,102]. The difference in velocity recovery length has been attributed to a lack of flow moving laterally around a patch [77] or a fence where the obstacle width is assumed to be infinite [63,86,99,103], in contrast to isolated vegetation elements where faster-moving airflow mixes with slower-moving airflow in the wake via counter-rotating vortices [59].
Furthermore, it is unclear whether windbreaks affect flow turbulence in the same way as live vegetation. This is particularly problematic in the field, where the dynamic complexity of the flow structures cannot be controlled in the same way as in modelled or wind tunnel environments [104]. This issue is pertinent given the evidence that turbulence is an important driving force behind sediment entrainment and transport in aeolian environments [105,106,107,108,109,110,111,112,113,114].
2.2. Effects on Drag
Alongside the effects on velocity profiles, it is useful to consider more complex scenarios where multiple vegetation elements affect drag across a surface. Shear stress (or drag) partitioning is traditionally used to quantify the proportion of the wind shear stress or shear velocity () that is acting on a soil surface, compared to the proportion acting on vegetation elements (e.g., [48,96,115]). The theoretical basis for partitioning comes from the work of Schlichting [116], who proposed that the total drag on a roughened surface () can be expressed as:
where is the sum of the drag on the intervening surface and is the drag on all the individual roughness elements.
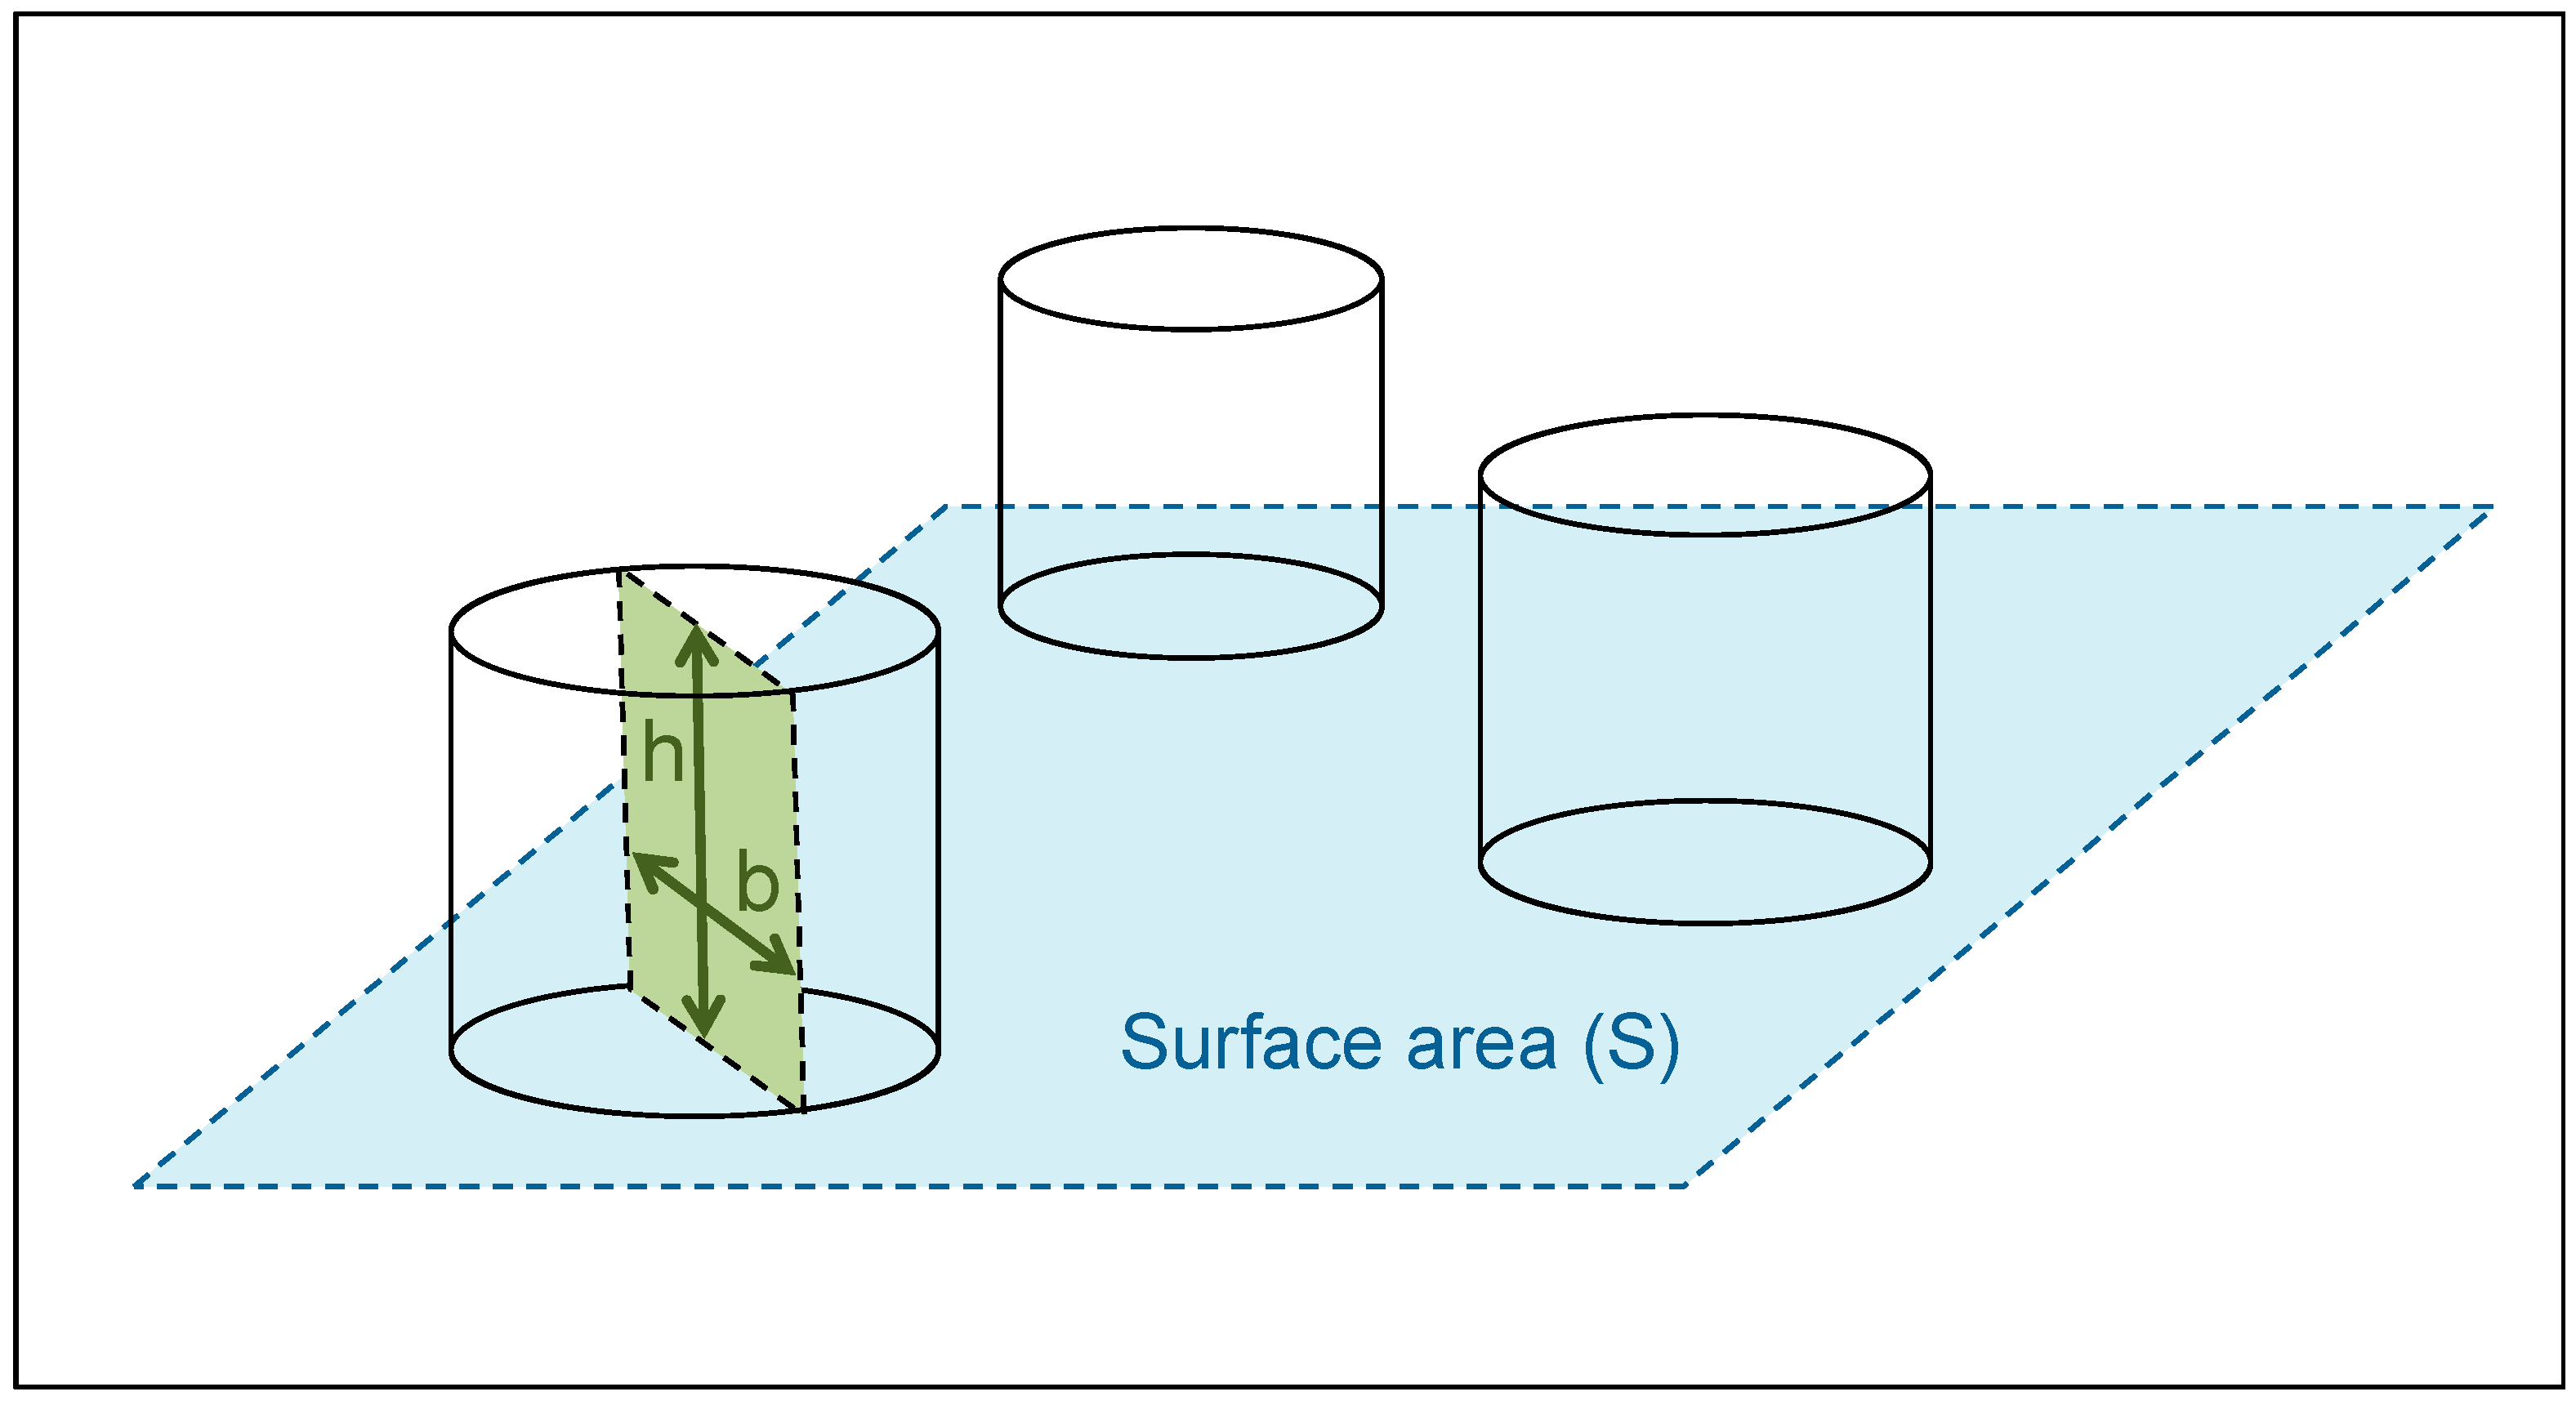
Marshall [117] proposed that partition should be mostly dependent on the dimensionless roughness density (), which characterizes the lateral roughness of the surface:
where is the number of roughness elements of width and height per unit surface area (Figure 5). This definition implies that the absorption of momentum by elements is controlled to a large degree by the total frontal area of the elements [118,119]. Although the relationship between partition and was not fully supported by later field observations (e.g., [73]) and wind-tunnel experiments [48,115,120], the parameter was widely employed, particularly in the context of two principal partitioning models by Marticorena and Bergametti [118] and Raupach [57,121]. Both models have distinct approaches but are based on the ‘shear stress ratio’ (SSR) of shear stress required for erosion on a bare surface to the total shear stress threshold of the surface including roughness, relying on as a fundamental descriptor of surface roughness. King et al. [71] provide a comprehensive analysis of the Raupach [121] and Marticorena and Bergametti [118] drag partition schemes through a comparison with field and wind tunnel measurements. We detail benefits and limitations of the approaches in Section 3.2.
Shao and Yang [122,123] demonstrated that, in addition to and , it is sometimes useful to consider ‘skin drag’ (, i.e., the drag due to momentum transfer to roughness element surfaces). For ground surfaces with sufficiently large , Equation (1) becomes increasingly inadequate, so Shao and Yang [123] included in a modified version of Raupach’s [57] drag partitioning model. This allowed Shao and Yang [123] to mathematically explain how increasingly closed canopies lead to a decrease in values, as is commonly observed in cases of skimming flow (see Section 2.1.2).
3. Sediment Transport on Vegetated Surfaces
The relationship between wind stress (erosivity) and the susceptibility of a surface to erosion (erodibility) broadly determines the potential for sediment transport in deserts [124]. Most of the evidence for the interactions between dryland vegetation and wind erosion comes from wind tunnel, windbreak and field experiments. However, an increasing number of modelling studies are exploring these relationships further, and introducing important predictive capabilities.
3.1. Evidence from Wind Tunnel, Windbreak and Field Studies
Wind tunnel studies have proved useful for studying the relationship between vegetation and wind-blown sediment transport under controlled conditions. Experiments have been conducted using dead vegetation [125], live vegetation [60,78], or artificial vegetation [79,95,126,127]. Suter-Burri et al. [60] used coloured sand to visualize spatial patterns of sediment redistribution within grass tussocks, allowing them to relate different canopy densities to their theoretical flow regimes (Figure 6). Wedge-shaped wake deposits developed fully in the low-density case (representing isolated roughness flow), overlapped with adjacent downstream tussocks in the medium-density case (wake-interference flow), and deposited grains were evenly distributed around the tussocks in the high-density case (skimming flow). Suter-Burri et al. [60] observed that the fraction of the surface that was exposed to erosion was substantially smaller (44–78%) than the area not covered by vegetation, owing to the turbulent wake structures around the tussocks.
Wind tunnel studies have also shown that vegetation can act to increase erosion in some circumstances. The experiments of Burri et al. [78] demonstrated that whilst sediment and dust flux was significantly reduced on high canopy-density surfaces compared to an unplanted configuration, low-density canopies (~3% cover) led to elevated shear stress on the bed resulting from flow acceleration, and thus higher sediment and dust fluxes. This region of elevated surface shear stress in the wake could result from counter-rotating vortices created by the roughness element [59], or from oscillating movements of grass blades on the sand surface [78]. In a ‘regional’ scale study (i.e., between neighbouring land units), Youssef et al. [79] used artificial 1:50 sized shrubs, laid out in different configurations in a wind tunnel, to measure the spatial distribution of sediment height after wind events. They found that shrubs bunched into patches resulted in far greater sediment fluxes than in the case of regular grids of single shrubs, likely because of a significant increase in turbulence between the patches. However, the length scales of saltation in wind tunnels has been shown to differ from those of natural saltation [128,129,130], so findings from wind tunnel studies should be treated with some caution.
Windbreak experiments (e.g., [87,88,131]) also provide some insights about the impact of vegetation on sediment transport. When oncoming particle-laden airflow approaches a windbreak, particles are filtered from the flow passing through the windbreak and deposited on the element, whereas in the air flowing over the obstacle, particle concentrations remain similar to upwind values [88]. Raupach and Lu [87] showed that wind speed reduction in the lee of a windbreak leads to lower particle concentrations, and that with increasing downwind distance, particles from the air flowing over the windbreak are progressively mixed downwards into the sheltered region. Using a high-speed camera system, Zhang et al. [131] observed that sand transport rates were reduced by 37% directly in front of a fence due to momentum loss of particles colliding with the fence surface, and by 80% up to the downstream location of 3 h. Similarly, the kinetic energy of saltating particles was reduced by more than 60% in the windward region, and up to 90% at 3 h.
In the field, decoupling the influences of plants on sediment transport from those induced by variations in the wind or surface conditions is very difficult at the plant or patch scale [74,79]. Several field studies have nonetheless attempted to demonstrate a gradient of surface activity in response to varying vegetation cover. There is evidence that vegetation cover of 12–15% provides a threshold for sand transport [55,132,133,134], but the use of percentage cover is limiting because it provides no information about the spatially heterogeneous impact of vegetation on erosion thresholds. It also does not account for the fact that erosion can still occur at relatively high (up to 45%) vegetation cover if the wind velocity is high enough or the vegetation height is small [47,73]. A more nuanced consideration of the impacts of vegetation on the balance between erosivity and erodibility factors is therefore needed.
3.2. Modelling Sediment Transport on Vegetated Surfaces
Wind erosion models form a key part of our understanding of sediment transport dynamics on partly vegetated surfaces, and are crucial for assessing the potential vulnerability of dryland regions to soil degradation [11,27,33,135]. The mobility potential of vegetated dunes over long timescales has been successfully modelled using wind-based indices that combine precipitation, temperature and wind data [8,9]. Whilst this approach is useful for simulating large dunefield dynamics, it does not resolve sediment transport dynamics at the same scale as plant-flow interactions. A variety of finer-scale models are examined here, from earlier theoretical models based on shear stress partitioning theory [116,118,121], to more recent approaches emphasising vegetation gaps [28,58] and numerical models simulating patch-scale sediment movement [52,136].
3.2.1. Drag Partition Schemes
Early methods for modelling the impact of roughness elements on sediment mass flux focused on the establishment of empirical relations between fractional ground cover and sediment transport rates [47,137,138,139]. During the 1990s, more attention was given to the development of drag partitioning techniques that could establish the wind momentum flux at the soil surface in the presence of roughness elements. The schemes of Raupach [57,121] and Marticorena and Bergametti [118] were widely adopted on the basis of their good agreement with wind tunnel experiments using solid objects on non-complex surfaces (e.g., [51,71,140,141,142,143]). However, the drag partition schemes have also been found to be limited in application in several respects.
By relying on the roughness density () and aerodynamic roughness () parameters, both the Raupach [57,121] and Marticorena and Bergametti [118] schemes suffer from the inherent requirement for a given surface to be treated homogenously. The schemes seek to establish the mean (or maximum) shear stress ratio in the absence of information about the heterogeneity of roughness on the land surface [87]. The spatial distribution of vegetation has been shown to affect horizontal sediment flux, even at low roughness densities [28,51,119,144,145,146]. The roughness distribution effects on aeolian sediment transport are also nuanced, in that the sediment mass flux may not always be significantly affected as long as vegetation is not overly clumped together [147]. The so-called ‘Telephone Pole Problem’ (Figure 7), where two roughness scenarios have the same roughness density but different spatial distributions, illustrates the limitations of using average vegetation density information to describe transport dynamics [58].
Other disadvantages of the parameter include scaling issues, whereby tall (>0.10 m) elements appear to influence sand transport in a way that cannot be accounted for based solely on knowledge of roughness density [141,142]. This deficiency is minimised in large homogeneous areas of randomly or regularly spaced vegetation of the same height, but becomes problematic in natural environments displaying structural anisotropy [27,58]. The parameter has also been shown to inadequately describe three-dimensional objects, due an intrinsic bias in using the frontal silhouette area [90,96]. Chappell and Webb [148] provided an in-depth analysis of the limitations of the drag partition scheme with respect to Raupach’s [57] assumptions about how the sheltering afforded by roughness elements can be approximated by the parameter (denoted in their text). Critically, interactions between sheltered areas are not captured by the drag partition scheme, but have demonstrably significant effects on sediment transport [148]. These interactions are also not captured by estimating the drag partition from approximations of [118].
Both and are difficult parameters to measure reliably in the field, especially at large scales and/or in the presence of large roughness elements (e.g., shrubs and trees). Rapid and repeatable methods have not been established to measure in the field, while the spatial variability and height of roughness elements often confounds measurements of , which in response can have large spatial (including directional) and temporal variability [149,150].
Raupach and Lu [87] identified representation of the sub-grid scale heterogeneity in momentum transfer within the atmospheric boundary layer as a major challenge for reducing uncertainty in wind erosion and dust emission models. That challenge remains today, and despite considerable research into the parameterisation of drag partition schemes and their modification to account for the non-uniformity in surface shear stress in the presence of vegetation [52,74]. Brown et al. [119] demonstrated that roughness configuration may have a small effect on the average drag partition when basic descriptive statistics (e.g., mean, standard deviation) are used to represent variability in surface shear stress measurements, but parameters of the Raupach et al. [121] drag partition scheme are sensitive to roughness configuration. Webb et al. [146] used Brown et al.’s [119] data to further examine the effects of roughness configuration and the performance of the Raupach et al. [121] and Marticorena and Bergametti [118] drag partition schemes for estimating sediment mass flux. Both drag partition schemes were found to have difficulty in accurately, and realistically, representing sediment mass flux responses to changing free stream velocity (), and . This is due to uncertainties and potential inconsistencies in the parameter values and a lack of sensitivity of the schemes to roughness configuration when applied with invariant parameter values [146]. Drag partition schemes that explicitly represent the effects of roughness configuration on the distribution of surface shear stress are needed to improve the accuracy of wind erosion models [151].
3.2.2. Okin (2008) Model
An alternative wind erosion model presented by Okin [58] recognises the inherent irregularity of vegetation patterning in drylands, and emphasises the controlling influence that the spatial configuration of vegetation has on the distribution of surface shear stress. By moving away from homogenous mean values to describe the roughness density and drag partition, Okin’s [58] approach resolves the heterogeneous wind shear velocity between roughness elements and over the soil surface. This notion is supported by field observations that flux is not ubiquitous across an entire landscape during a transport event [51]. Okin’s [58] method implies that surface roughness moderates the wind erosivity, rather than the threshold shear velocity for soil entrainment.
The Okin model assumes that plants are porous objects [49,90], meaning that reverse flow in the lee of plants can be negligible and the surface shear velocities in the wake of plants can be greater than zero. Asymptotic recovery of shear stress has been observed downwind of porous fences (e.g., [98]) and nebkha vegetation [54,63], so the model is formulated probabilistically to simulate the distribution of surface shear stress as a function of the distance to the nearest upwind plant. The aerodynamic roughness length () is used to represent the soil roughness and establish between roughness elements.
Okin’s [58] model shows good agreement with aeolian sand flux data at the plant/patch scale (e.g., [28,152]). It simulates transport around solid objects well when the model-calculated shear stress ratio is compared with the experimental data of King et al. [71], which is noteworthy considering that the model omits return flow. A notable advantage of Okin’s [58] scheme is its scale explicitness, which allows individual unvegetated gaps as well as entire landscapes to be simulated. The model can also be used to evaluate directional effects of wind flow on sediment transport for a given area.
Since the Okin model uses relatively simple spatial inputs, as opposed to the structural parameters of roughness elements needed for traditional shear stress partitioning models, data can be collected easily in the field using standardized measurement methods (e.g., [135,153]), and at the landscape scale using high resolution (<5 m) remote sensing techniques (e.g., [152,154,155]). As remote sensing approaches to estimating the precise spatial configuration of surface roughness are yet to be established at moderate spatial resolutions (e.g., 30–500 m), alternative data and models are needed to represent the heterogeneous effects of vegetation on aeolian sediment transport at regional to global scales.
3.2.3. Remote Sensing Approaches
Remote sensing data have been used to represent the spatial and temporal variability in vegetation within drag partition schemes, increasing wind erosion and dust model sensitivities to land cover dynamics (e.g., [156,157]). Normalised Difference Vegetation Index (NDVI) and Leaf Area Index (LAI) data are most commonly used to estimate the vegetation cover fraction and as input to drag partition schemes, and to estimate for the land surface [150]. However, while these approaches appear to improve modelled temporal responses of sediment transport, the data also introduce uncertainties that may compound those associated with selected drag partition parameter values [158]. As neither NDVI nor LAI adequately represent the effects of vegetation phenological changes on vegetation structure, which is central to the partitioning of wind momentum over the land surface [150], alternative approaches have been sought to obtain estimates of land surface aerodynamic properties at broad spatial scales.
Some attempts have been made to derive areal estimates of for desert surfaces, which can be implemented across several scales. Greeley et al. [159,160] established relations between obtained from wind velocity profile data and radar backscatter cross sections. Marticorena et al. [161] evaluated the application of a bidirectional reflectance model to estimate roughness properties, while Marticorena et al. [162] found a relation between radar backscatter coefficients in the C band and that suggested potential for remote sensing the roughness length at broad scales.
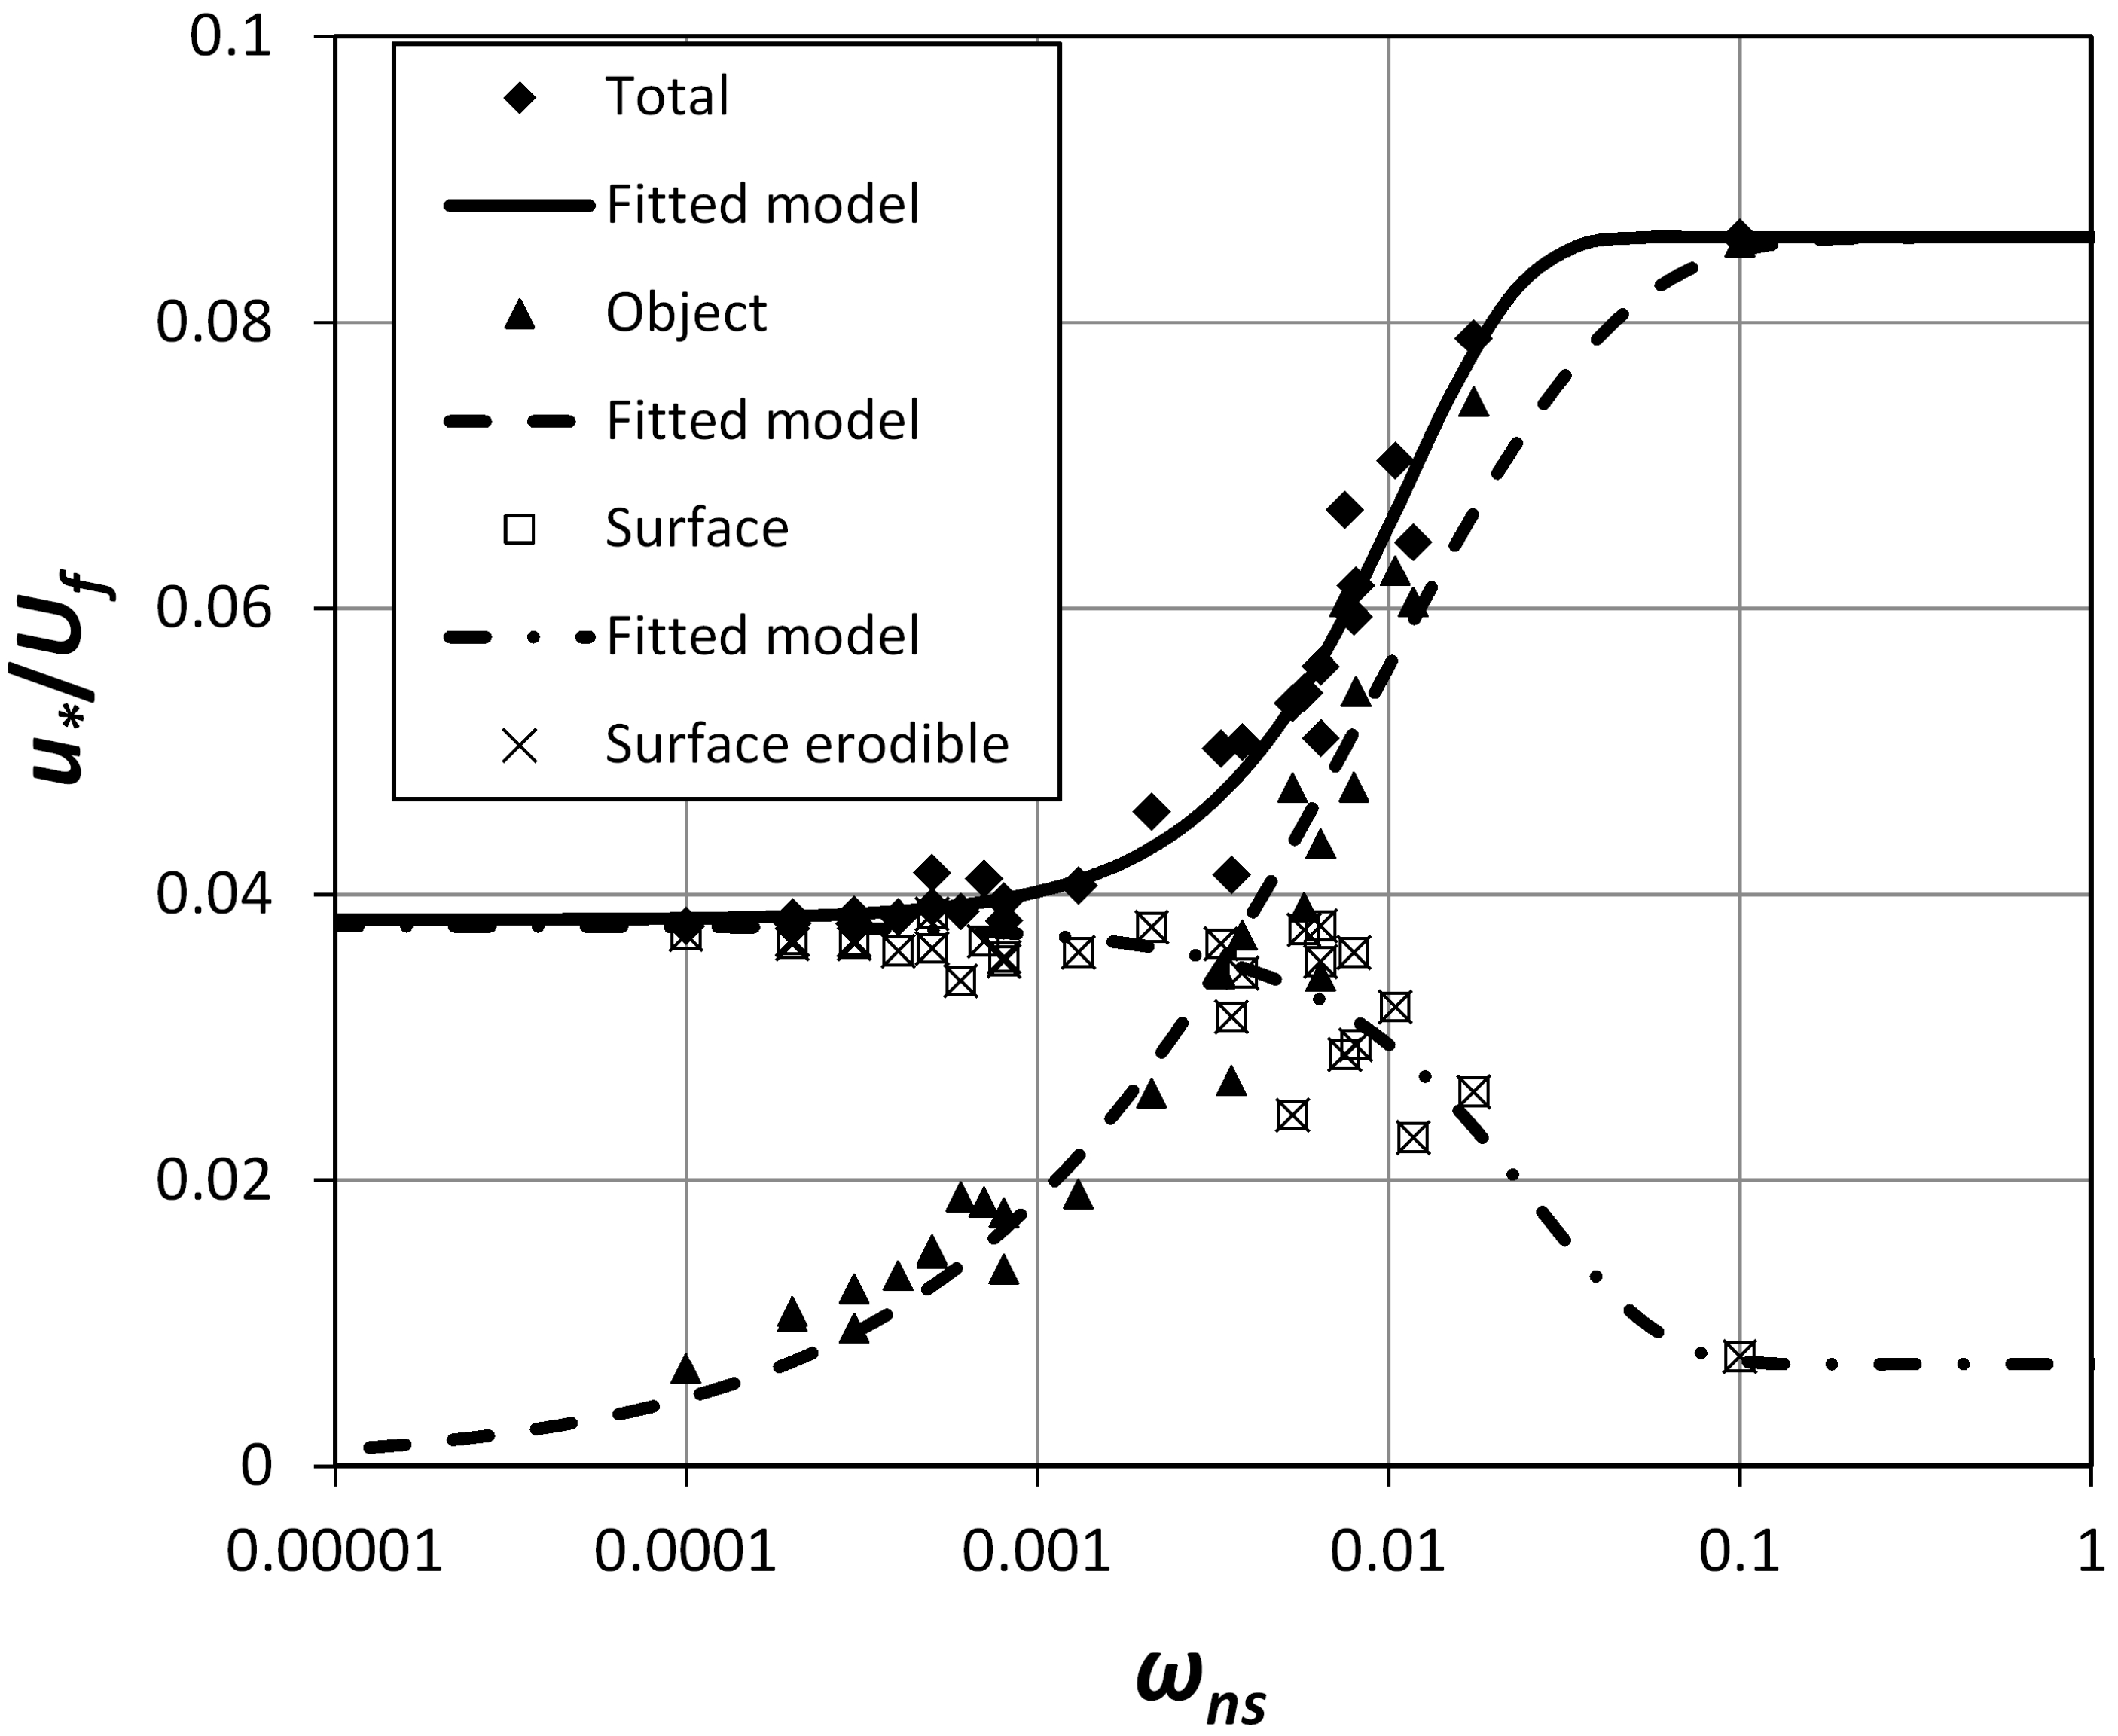
However, obtaining areal estimates of is not sufficient on its own to determine the drag partition and wind momentum transfer to exposed soil surfaces in vegetated landscapes. To address this need, Chappell and Webb [148] developed an approach to estimating the drag partition and surface shear stress for heterogeneous surfaces from shadow, which can be obtained globally at moderate spatial resolutions (e.g., 500 m) from albedo data. The approach built on Marshall’s [117] wind tunnel study that underpinned Raupach’s [57] drag partition theory, and simulations exploring the relation between surface illumination, shadow and conducted by Chappell and Heritage [163] and Chappell et al. [164]. Figure 8 shows an example of the relations established by Chappell and Webb [148] between normalised albedo () and scaled wind shear stress (). Albedo (shadow) measurements scale linearly, can be collected in the field (e.g., using a net radiometer) or with airborne and satellite sensors, and are sensitive to vegetation spatial distribution. Therefore, the approach has potential to resolve the outstanding issue of representing sub-grid scale variability in the drag partition for aeolian sediment transport and land surface models [87].
3.2.4. Computational Fluid Dynamics (CFD) Modelling
Computational fluid dynamics (CFD) modelling has been used to explicitly resolve turbulent wind flow and sediment flux around individual roughness elements to a high temporal and spatial resolution (e.g., [52,63,136,165]). CFD allows a more complete representation of flow structure than that obtained by field and wind tunnel experiments, so represents a promising approach for incorporating wind flow turbulence in vegetated contexts. Using CFD simulations, Turpin et al. [136] identified a peak in shear stress in the low-shear zone behind individual elements and showed that the “inversion point” at which an element switched from reducing shear stress to increasing it varied with coverage density and roughness height. Turpin et al. [136] could also test the effect of increasing the number and height of roughness elements on erosion patterns. Hesp and Smyth [63] used a CFD model to investigate the impact of nebkha width on wind flow recovery in the lee. By accurately quantifying turbulent wind structures around each simulated nebkha, Hesp and Smyth [63] could begin to link flow behaviour with resultant shadow dune formation.
Despite the high resolution and realistic flow structure representation that can be achieved using CFD, it is a computationally expensive method. To get around this issue, flow properties can be calculated using much coarser meshes, through large eddy simulations (LES) [52,165,166,167]. Dupont et al. [52] coupled a LES model with a physically based saltation model to resolve turbulent wind flow over heterogeneous vegetated landscapes composed of trees and shrubs. The erosion patterns simulated by Dupont et al.’s [52] model were qualitatively consistent with previous wind tunnel [59,78] and field [46,140] observations. Minimal dune models (e.g., [168,169]), which combine analytical descriptions of turbulent wind velocity with continuum saltation models, have also been used to successfully simulate transitions between barchan and parabolic dunes [169,170].
Nevertheless, the computational requirements of CFD and LES methods still limit their use for simulating long-term erosion at larger than the field scale. Such modelling approaches are also highly dependent on a large number of parameterisations and coefficients to describe, in high resolution, the physical processes they seek to simulate [171]. Given the significant uncertainties that exist in our understanding of the interactions between vegetation, wind flow and sediment transport, hard-coding the appropriate physics into CFD and LES models remains an ongoing challenge.
3.2.5. Cellular Automaton (CA) Modelling
Cellular automata (CA) are a class of numerical models consisting of regular, discrete grids of cells operated on by predefined rules, which capture full landscape-scale dynamics using only fundamental processes. The CA approach has been particularly productive in the context of dune-field patterning (e.g., [21,22,23,172]), and the spatial nature of CAs lends itself well to analysing ecogeomorphic systems [173]. The strength of CA models lies in their capacity to represent key processes underlying complex systems, using a far smaller number of parameters and assumptions than many detailed reductionist models [171].
In most CA models, local neighbourhood operations produce dynamic responses from basic rules centred on each grid cell. All cells hold a variety of attributes (in the drylands context, these could include sand surface height and vegetation characteristics such as plant type, height and porosity) that are altered by applying transition rules during each timestep. As model time progresses, the vegetation distribution can alter local wind flow characteristics, thus impacting sediment flux patterns over the surface. The grid formulation on which CAs are based allows wind velocity to effectively be ‘mapped onto’ the model domain as a function of vegetation height and porosity, fitting Okin’s [58] conception of vegetated desert surfaces as a collection of gaps between roughness elements. The relative computational efficiency of CAs means that simulations can be run over larger domains (scale of ~104 m) and long timescales, which is particularly useful for landscape evolution modelling.
The CA approach not only allows sediment transport and wind flow behaviour to be modelled in isolation, but also enables explicit simulations of feedbacks between major components of dryland ecogeomorphic systems. For instance, surface changes resulting from wind erosion can be linked to subsequent vegetation growth/dieback within a coupled CA framework (e.g., [2,25,26,33,174]). This approach is rooted in the concept of ‘landscape connectivity’ [175,176], which considers dryland landscapes as a series of conduits for processes (e.g., fire, wind and water propagation) that link vegetation growth, aeolian processes and external forcing factors through various biotic and abiotic feedbacks [41,177,178].
The Discrete ECogeomorphic Aeolian Landscape model (DECAL) [2,25,174], later extended by Yan and Baas [179], provides an approach for simulating the dynamics of vegetation-dependent dunes such as parabolic dunes and nebkhas, by incorporating feedbacks between sedimentation balance and vegetation growth. DECAL introduces a length scale to resultant landforms that remains otherwise dimensionless in bare-sand CAs. Mayaud et al. [26] built on this approach by developing the coupled Vegetation and Sediment TrAnsport model (ViSTA). ViSTA allows plant-plant interactions to be specified and for realistic vegetation patterning to emerge in the domain, without the need for directly imposing factors such as seasonality in plant growth. By including a variety of ecogeomorphic feedbacks linking plant growth, wind dynamics and sediment transport, Mayaud et al. [26] successfully simulated the development of an equilibrium nebkha dunefield in the Skeleton Coast, Namibia (Figure 9).
4. Potential Future Avenues for Research
In general, there remains a need to collect more windflow data around a variety of dryland plant types in the field. Despite increasing evidence showing that two-dimensional wind fences do not approximate well to three-dimensional live plants, only a handful of studies have examined airflow dynamics in the wake of single rows of three-dimensional plants (e.g., [62]). These could display different behaviours to traditional wind fences, especially with regards to flow turbulence. Linked to this issue, the impact of roughness element width on wind flow recovery remains under-studied, perhaps because it intuitively does not have as great an impact on drag as element height or porosity. Recent numerical modelling of nebkhas [63] has revealed that nebkha width strongly controls wind flow recovery, so wind tunnel and field studies investigating element width would help to better parameterise wind flow in vegetated contexts.
Whilst it is clearly beneficial to conduct wind flow studies in field situations to account for natural processes and variability, it is not possible to control for vegetation parameters (height, width, porosity, pliability) and flow parameters (velocity, turbulence, intermittency) to the same degree as in wind tunnels. Wind tunnel experiments have proved valuable for understanding the impacts of a wide variety of parameters on flow behaviour, and should be extended to address some of the knowledge gaps highlighted here. More wind tunnel studies are needed that systematically investigate the effects of porosity and/or pliability of three-dimensional, live plants on wind flow. Porosity and pliability are relatively difficult to control for in live plants when attempting to keep height and width parameters constant. Some wind tunnel studies have begun to investigate porosity variability in high detail using porous mesh cubes and cylinders (e.g., [86]), although these remain crude approximations to live plants. Other studies have begun to account for plant pliability, for instance through measuring the temporally-averaged frontal area of flexible plants in wind tunnels (e.g., [100]).
Remote sensing data are proving increasingly useful for representing spatial and temporal variability in vegetation within modelling schemes [157]. Plant characteristics (e.g., height, width and porosity) can now be quantified rapidly and over relatively large scales thanks to the recent progress in image-based techniques (e.g., [155]) and high-resolution remote sensing [152,154,180]. However, ongoing challenges remain for identifying appropriate metrics of surface roughness distribution that could be used as inputs to schemes such as Okin’s [58] over large (i.e., regional) areas, and for overcoming limitations of indices such as NDVI and LAI for representing vegetation (see Section 3.2.3). Direct approximation of the drag partition and surface shear stress from remote sensing is likely to alleviate these challenges, while reducing the uncertainty in wind erosion estimates [148].
Additionally, low-elevation surveys using aerial drones (unmanned aerial vehicles, UAVs) allow for vast vegetation transect measurements to be collected quickly and relatively inexpensively [181]. In turn, ‘structure-from-motion’ (SfM) photogrammetry can easily convert drone images of an element or landscape into a georeferenced digital elevation model (DEM) [182,183,184]. This technique can produce centimetre-scale horizontal and vertical precision that is comparable with airborne LiDAR [185] and terrestrial laser scanning [184], allowing landscape change before and after geomorphic events to be accurately quantified. However, issues arise with regards to the reliance of SfM’s image-matching algorithms on image texture, which may result in low-texture images (e.g., bare sand surfaces) yielding poor point clouds [185].
Finally, an explicit link must be made between the impact of vegetation on wind flow, and the subsequent impact on sediment transport processes. Some wind tunnel studies (e.g., [60,78]) have used creative methods, such as coloured sand, for tracking erosion and deposition around roughness elements, but detailed exploration of flow field behaviour and the evolution of bedforms around plants is still required. For instance, high-resolution terrestrial laser scanning could be used to detect mm-scale changes in height around partially vegetated erodible surfaces [186], thus helping to identify erosional and depositional regions to a high level of accuracy. In terms of modelling vegetation/sediment interactions, Raupach and Lu [87] identify problems of scaling over heterogeneous surfaces, and raise questions over how sediment deposition processes in the presence of vegetation could be adequately measured. Whilst these issues remain pertinent, drag partition schemes that explicitly resolve the effects of roughness configuration on surface shear stress distribution could significantly reduce the uncertainty in sediment deposition schemes.
5. Conclusions
The effects of patchy vegetation on wind flow and sediment transport in drylands are multiple and varied. They depend on the vegetation type in question, as well as turbulence, porosity and pliability factors. The use of high-frequency anemometers in both field and wind tunnel contexts, as well as creative methodological approaches such as the use coloured sand, have helped to identify key aerodynamic zones of interest. Increasingly, sophisticated modelling techniques such as computational fluid dynamics (CFD) and cellular automaton (CA) modelling are being used to gain more holistic perspectives on the processes shaping partially vegetated surfaces. However, such models are often computationally expensive to run, and still suffer from an ongoing lack of adequate data describing flow dynamics at the plant/patch scale.
Moving forward, more empirically-derived flow and transport data collected in vegetated contexts must be used to parameterize, verify and validate wind flow/sediment transport models. Remote sensing methods are proving to be increasingly convenient, and in some cases relatively inexpensive, ways of rapidly measuring vegetation, wind flow and sediment characteristics over vast areas and at multiple scales. Remote sensing also offers opportunities to reduce the complexity, and increase the accuracy, of aeolian sediment transport modelling. Without these crucial data forming the basis for rigorous model parameterisation, significant uncertainty will remain surrounding the potential future responses of dryland landscapes to climate and land use change.
Acknowledgments
This research was funded by a UK Natural Environment Research Council Doctoral Training Grant (NE/L501530/1), a St Catherine’s College (University of Oxford) Scholarship and a Hertford College (University of Oxford) Scholarship to Jerome Mayaud. We thank the Assistant Editor of Land (Sanford Su), the anonymous reviewers whose comments helped to improve this paper, and Richard Bailey and Giles Wiggs for their constructive feedback on a related version of this manuscript.
Author Contributions
Jerome Mayaud and Nicholas Webb both contributed to researching and writing the manuscript.
Conflicts of Interest
The authors declare no conflict of interest.
References
- UNEP. World Atlas of Desertification, 2nd ed.; Edward Arnold: Sevenoaks, UK, 1998. [Google Scholar]
- Baas, A.C.W.; Nield, J.M. Modelling vegetated dune landscapes. Geophys. Res. Lett. 2007, 34, L06405. [Google Scholar] [CrossRef]
- Viles, H.A. Weathering systems. In Arid Zone Geomorphology: Process, Form and Change in Drylands, 3rd ed.; Thomas, D.S.G., Ed.; John Wiley & Sons Ltd.: Chichester, UK, 2011; pp. 85–101. [Google Scholar]
- Thomas, D.S.G.; Shaw, P.A. The Kalahari Environment; Cambridge University Press: Cambridge, UK, 1991. [Google Scholar]
- Goudie, A.S. Great Warm Deserts of the World; Cambridge University Press: Cambridge, UK, 2002. [Google Scholar]
- Ravi, S.; Breshears, D.D.; Huxman, T.E.; D’Odorico, P. Land degradation in drylands: Interactions among hydrologic–aeolian erosion and vegetation dynamics. Geomorphology 2010, 116, 236–245. [Google Scholar] [CrossRef]
- Kéfi, S.; Rietkerk, M.; Alados, C.L.; Pueyo, Y.; Papanastasis, V.P.; Elaich, A.; de Ruiter, P.C. Spatial vegetation patterns and imminent desertification in Mediterranean arid ecosystems. Nature 2007, 449, 213–217. [Google Scholar] [CrossRef] [PubMed]
- Thomas, D.S.G.; Knight, M.; Wiggs, G.F.S. Remobilization of southern African desert dune systems by twenty-first century global warming. Nature 2005, 435, 1218–1221. [Google Scholar] [CrossRef] [PubMed]
- Wang, X.; Yang, Y.; Dong, Z.; Zhang, C. Responses of dune activity and desertification in China to global warming in the twenty-first century. Glob. Planet. Chang. 2009, 67, 167–185. [Google Scholar] [CrossRef]
- Reynolds, R.; Belnap, J.; Reheis, M.; Lamothe, P.; Luiszer, F. Aeolian dust in Colorado Plateau soils: Nutrient inputs and recent change in source. Proc. Natl. Acad. Sci. USA 2001, 98, 7123–7127. [Google Scholar] [CrossRef] [PubMed]
- Ravi, S.; D’Odorico, P.; Breshears, D.D.; Field, J.P.; Goudie, A.S. Aeolian processes and the biosphere. Rev. Geophys. 2011, 49, 1–45. [Google Scholar] [CrossRef]
- Goudie, A.S.; Middleton, N.J. Desert Dust in the Global System; Springer: Berlin, Germany, 2006. [Google Scholar]
- Seager, R.; Ting, M.; Held, M.I.; Kushnir, Y.; Lu, J.; Vecchi, G.; Huang, H.-P.; Harnik, N.; Leetmaa, A.; Lau, N.-C.; et al. Model projections of an imminent transition to a more arid climate in southwestern North America. Science 2007, 316, 1181–1184. [Google Scholar] [CrossRef] [PubMed]
- Bogle, R.; Redsteer, M.H.; Vogel, J. Field measurement and analysis of climatic factors affecting dune mobility near Grand Falls on the Navajo Nation, southwestern United States. Geomorphology 2015, 228, 41–51. [Google Scholar] [CrossRef]
- Barbier, N.; Couteron, P.; Lejoly, J.; Deblauwe, V.; Lejeune, O. Self-organized vegetation patterning as a fingerprint of climate and human impact on semi-arid ecosystems. J. Ecol. 2006, 94, 537–547. [Google Scholar] [CrossRef]
- D’Odorico, P.; Bhattachan, A.; Davis, K.F.; Ravi, S.; Runyan, C.W. Global desertification: Drivers and feedbacks. Adv. Water Resour. 2013, 51, 326–344. [Google Scholar] [CrossRef]
- Middleton, N.J.; Sternberg, T. Climate hazards in drylands: A review. Earth Sci. Rev. 2013, 126, 48–57. [Google Scholar] [CrossRef]
- Griffin, D.W.; Garrison, V.H.; Herman, J.R.; Shinn, E.A. African desert dust in the Caribbean atmosphere: Microbiology and public health. Aerobiologia 2001, 17, 203–213. [Google Scholar] [CrossRef]
- Wiggs, G.F.S.; O’Hara, S.L.; Wegerdt, J.; Van Der Meer, J.; Small, I.; Hubbard, R. The dynamics and characteristics of aeolian dust in dryland Central Asia: Possible impacts on human exposure and respiratory health in the Aral Sea basin. Geogr. J. 2003, 169, 142–157. [Google Scholar] [CrossRef]
- Wasson, R.J.; Hyde, R. Factors determining desert dune type. Nature 1983, 304, 337–339. [Google Scholar] [CrossRef]
- Werner, B.T. Eolian dunes: Computer simulations and attractor interpretation. Geology 1995, 23, 1107–1110. [Google Scholar] [CrossRef]
- Momiji, H.; Carretero-Gonzalez, R.; Bishop, S.R.; Warren, A. Simulation of the effect of wind speedup in the formation of transverse dune fields. Earth Surf. Process. Landf. 2000, 25, 905–918. [Google Scholar] [CrossRef]
- Bishop, S.R.; Momiji, H.; Carretero-Gonzalez, R.; Warren, A. Modelling desert dune fields based on discrete dynamics. Discret. Dyn. Nat. Soc. 2002, 7, 7–17. [Google Scholar] [CrossRef]
- Hesp, P. Foredunes and blowouts: Initiation, geomorphology and dynamics. Geomorphology 2002, 48, 245–268. [Google Scholar] [CrossRef]
- Nield, J.M.; Baas, A.C.W. Investigating parabolic and nebkha dune formation using a cellular automaton modelling approach. Earth Surf. Process. Landf. 2008, 33, 724–740. [Google Scholar] [CrossRef]
- Mayaud, J.R.; Bailey, R.M.; Wiggs, G.F.S. A coupled vegetation/sediment-transport model for dryland environments. J. Geophys. Res. Earth Surf. 2017, 122, 875–900. [Google Scholar] [CrossRef]
- Okin, G.S.; Gillette, D.A.; Herrick, J.E. Multi-scale controls on and consequences of aeolian processes in landscape change in arid and semi-arid environments. J. Arid Environ. 2006, 65, 253–275. [Google Scholar] [CrossRef]
- Li, J.; Okin, G.S.; Herrick, J.E.; Belnap, J.; Miller, M.E.; Vest, K.; Draut, A.E. Evaluation of a new model of aeolian transport in the presence of vegetation. J. Geophys. Res. Earth Surf. 2013, 118, 288–306. [Google Scholar] [CrossRef]
- Huang, J.; Minnis, P.; Yan, H.; Yi, Y.; Chen, B.; Zhang, L.; Ayers, J. Dust aerosol effect on semi-arid climate over Northwest China detected from A-Train satellite measurements. Atmos. Chem. Phys. 2010, 10, 6863–6872. [Google Scholar] [CrossRef] [Green Version]
- UNDP. The Forgotten Billion: MDG Achievement in Drylands; UNDP: New York, NY, USA, 2011. [Google Scholar]
- Held, I.M.; Delworth, T.M.; Lu, J.; Findell, K.L.; Knutson, T.R. Simulation of Sahel Drought in the 20th and 21st centuries. Proc. Natl. Acad. Sci. USA 2005, 102, 17891–17896. [Google Scholar] [CrossRef] [PubMed]
- IPCC. Summary for Policymakers. In Climate Change 2013: The Physical Science Basis. Contribution of Working Group I to the Fifth Assessment Report of the Intergovernmental Panel on Climate Change; Stocker, T.F., Qin, D., Plattner, G.K., Tignor, M., Allen, S.K., Eds.; Cambridge University Press: Cambridge, UK; New York, NY, USA, 2013. [Google Scholar]
- Mayaud, J.R.; Bailey, R.M.; Wiggs, G.F.S. Modelled responses of the Kalahari Desert to 21st century climate and land use change. Sci. Rep. 2017, 7, 3887. [Google Scholar] [CrossRef] [PubMed]
- Kinast, S.; Meron, E.; Yizhaq, H.; Ashkenazy, Y. Biogenic crust dynamics on sand dunes. Phys. Rev. E 2013, 87, 1–5. [Google Scholar] [CrossRef] [PubMed]
- Bestelmeyer, B.T.; Okin, G.S.; Duniway, M.C.; Archer, S.R.; Sayre, N.F.; Williamson, J.C.; Herrick, J.E. Desertification, land use, and the transformation of global drylands. Front. Ecol. Environ. 2015, 13, 28–36. [Google Scholar] [CrossRef]
- Webb, N.P.; Marshall, N.A.; Stringer, L.C.; Reed, M.S.; Chappell, A.; Herrick, J.E. Land degradation and climate change: Building climate resilience in agriculture. Front. Ecol. Environ. 2017. [Google Scholar] [CrossRef]
- Meron, E.; Gilad, E.; von Hardenberg, J.; Shachak, M.; Zarmi, Y. Vegetation patterns along a rainfall gradient. Chaos Solitons Fractals 2004, 19, 367–376. [Google Scholar] [CrossRef]
- Borgogno, F.; D’Odorico, P.; Laio, F.; Ridolfi, L. Mathematical models of vegetation pattern formation in ecohydrology. Rev. Geophys. 2009, 47, RG1005. [Google Scholar] [CrossRef]
- Wainwright, J. Desert Ecogeomorphology. In Geomorphology of Desert Environments, 2nd ed.; Parsons, A.J., Abrahams, A.D., Eds.; Springer: Berlin, Germany, 2009; pp. 21–66. [Google Scholar]
- Bailey, R.M. Spatial and temporal signatures of fragility and threshold proximity in modelled semi-arid vegetation. Proc. R. Soc. B 2011, 278, 1064–1071. [Google Scholar] [CrossRef] [PubMed]
- Stewart, J.; Parsons, A.J.; Wainwright, J.; Okin, G.S.; Bestelmeyer, B.; Fredrickson, E.L.; Schlesinger, W.H. Modelling emergent patterns of dynamic desert ecosystems. Ecol. Monogr. 2014, 84, 373–410. [Google Scholar] [CrossRef]
- Getzin, S.; Wiegand, K.; Wiegand, T.; Yizhaq, H.; von Hardenberg, J.; Meron, E. Adopting a spatially explicit perspective to study the mysterious fairy circles of Namibia. Ecography 2014. [Google Scholar] [CrossRef]
- Wolfe, S.A.; Nickling, W.G. The protective role of sparse vegetation in wind erosion. Prog. Phys. Geogr. 1993, 17, 50–68. [Google Scholar] [CrossRef]
- Judd, M.J.; Raupach, M.R.; Finnigan, J.J. A wind tunnel study of turbulent flow around single and multiple windbreaks, part I: Velocity fields. Bound. Layer Meteorol. 1996, 80, 127–165. [Google Scholar] [CrossRef]
- Al-Awadhi, J.M.; Willetts, B.B. Sand transport and deposition within arrays of non-erodible cylindrical elements. Earth Surf. Process. Landf. 1999, 24, 423–435. [Google Scholar] [CrossRef]
- Leenders, J.K.; van Boxel, J.H.; Sterk, G. The effect of single vegetation elements on wind velocity and sediment transport in the Sahelian zone of Burkina Faso. Earth Surf. Process. Landf. 2007, 32, 1454–1474. [Google Scholar] [CrossRef]
- Wasson, R.J.; Nanninga, P.M. Estimating wind transport of sand on vegetated surfaces. Earth Surf. Process. Landf. 1986, 11, 505–514. [Google Scholar] [CrossRef]
- Gillette, D.A.; Stockton, P.A. The effects of non-erodible particles on wind erosion of erodible surfaces. J. Geophys. Res. 1989, 94, 12885–12893. [Google Scholar] [CrossRef]
- Gillies, J.A.; Nickling, W.G.; King, J. Drag coefficient and plant form-response to wind velocity in three plant species: Burning bush (Euonymus alatus), Colorado blue spruce (Picea pungens glauca.), and fountain grass (Pennisetum setaceum). J. Geophys. Res. 2002, 107, 4760. [Google Scholar] [CrossRef]
- Crawley, D.M.; Nickling, W.G. Drag partition for regularly-arrayed rough surfaces. Bound. Layer Meteorol. 2003, 107, 445–468. [Google Scholar] [CrossRef]
- Gillette, D.A.; Herrick, J.E.; Herbert, G.A. Wind characteristics of Mesquite Streets in the northern Chihuahuan Desert, New Mexico, USA. Environ. Fluid Mech. 2006, 6, 241–275. [Google Scholar] [CrossRef]
- Dupont, S.; Bergametti, G.; Simoëns, S. Modeling aeolian erosion in presence of vegetation. J. Geophys. Res. Earth Surf. 2014, 119, 168–187. [Google Scholar] [CrossRef]
- Gillies, J.A.; Lancaster, N.; Nickling, W.G.; Crawley, D. Field determination of drag forces and shear stress partitioning effects for a desert shrub (Sarcobatus vermiculatus, Greasewood). J. Geophys. Res. Atmos. 2000, 105, 24871–24880. [Google Scholar] [CrossRef]
- Gillies, J.A.; Nield, J.M.; Nickling, W.G. Wind velocity and sediment transport recovery in the lee of a vegetated and denuded nebkha within a nebkha dune field. Aeolian Res. 2014, 12, 135–141. [Google Scholar] [CrossRef]
- Davidson-Arnott, R.G.D.; Bauer, B.O.; Walker, I.J.; Hesp, P.A.; Ollerhead, J.; Chapman, C. High-frequency sediment transport responses on a vegetated foredune. Earth Surf. Process. Landf. 2012, 37, 1227–1241. [Google Scholar] [CrossRef]
- Van Gardingen, P.; Grace, J. Plants and wind. Adv. Bot. Res. 1991, 18, 189–253. [Google Scholar]
- Raupach, M.R. Drag and drag partition on rough surfaces. Bound. Layer Meteorol. 1992, 60, 375–395. [Google Scholar] [CrossRef]
- Okin, G.S. A new model of wind erosion in the presence of vegetation. J. Geophys. Res. 2008, 113, F02S10. [Google Scholar] [CrossRef]
- Sutton, S.L.F.; McKenna-Neuman, C. Sediment entrainment to the lee of roughness elements: Effects of vortical structures. J. Geophys. Res. 2008, 113, F02S09. [Google Scholar] [CrossRef]
- Suter-Burri, K.; Gromke, C.; Leonard, K.C.; Graf, F. Spatial patterns of aeolian sediment deposition in vegetation canopies: Observations from wind tunnel experiments using colored sand. Aeolian Res. 2013, 8, 65–73. [Google Scholar] [CrossRef]
- Lee, J.-P.; Lee, E.-J.; Lee, S.-J. Shelter effect of a fir tree with different porosities. J. Mech. Sci. Technol. 2014, 28, 565–572. [Google Scholar] [CrossRef]
- Wu, X.; Zou, X.; Zhou, N.; Zhang, C.; Shi, S. Deceleration efficiencies of shrub windbreaks in a wind tunnel. Aeolian Res. 2015, 16, 11–23. [Google Scholar] [CrossRef]
- Hesp, P.A.; Smyth, T.A.G. Nebkha flow dynamics and shadown dune formation. Geomorphology 2017, 282, 27–38. [Google Scholar] [CrossRef]
- Mayaud, J.R.; Wiggs, G.F.S.; Bailey, R.M. Characterizing turbulent wind flow around dryland vegetation. Earth Surf. Process. Landf. 2016, 41, 1421–1436. [Google Scholar] [CrossRef]
- Hagen, L.J.; Skidmore, E.L. Turbulent velocity fluctuations and vertical flow as affected by windbreak porosity. Trans. Am. Soc. Agric. Eng. 1971, 14, 634–637. [Google Scholar]
- Perera, M.D. Shelter behind two-dimensional solid and porous fences. J. Wind Eng. Ind. Aerodyn. 1981, 8, 93–104. [Google Scholar] [CrossRef]
- Gross, G. A numerical study of the air flow within and around a single tree. Bound. Layer Meteorol. 1987, 40, 311–327. [Google Scholar] [CrossRef]
- Kim, H.B.; Lee, S.-J. The structure of turbulent shear flow around a two-dimensional porous fence having a bottom gap. J. Fluids Struct. 2002, 16, 317–329. [Google Scholar] [CrossRef]
- Endalew, A.M.; Hertog, M.; Gebrehiwot, M.G.; Baelmans, M.; Ramon, H.; Nicolaï, B.M.; Verboven, P. Modelling airflow within model plant canopies using an integrated approach. Comput. Electron. Agric. 2009, 66, 9–24. [Google Scholar] [CrossRef]
- Lee, B.E.; Soliman, B.F. An investigation of the forces on three-dimensional bluff bodies in rough wall turbulent boundary layer. J. Fluids 1977, 99, 503–509. [Google Scholar] [CrossRef]
- King, J.; Nickling, W.G.; Gillies, J.A. Representation of vegetation and other non-erodible elements in aeolian shear stress partitioning models for predicting transport threshold. J. Geophys. Res. 2005, 110, F04015. [Google Scholar] [CrossRef]
- Liu, S.; Wul, H.; Lytton, R.L.; Sharpe, P.J. Aerodynamic sheltering effects of vegetative arrays on wind erosion: A numerical approach. J. Environ. Manag. 1990, 30, 281–294. [Google Scholar] [CrossRef]
- Ash, J.E.; Wasson, R.H. Vegetation and sand mobility in the Australian desert dunefield. Z. Geomorphol. 1983, 45, 7–25. [Google Scholar]
- Walter, B.; Gromke, C.; Leonard, K.C.; Manes, C.; Lehning, M. Spatio-temporal surface shear-stress variability in live plant canopies and cube arrays. Bound. Layer Meteorol. 2012, 143, 337–356. [Google Scholar] [CrossRef]
- Breshears, D.D.; Whicker, J.J.; Zou, C.B.; Field, J.P.; Allen, C.D. A conceptual framework for dryland aeolian sediment transport along the grassland–forest continuum: Effects of woody plant canopy cover and disturbance. Geomorphology 2009, 105, 28–38. [Google Scholar] [CrossRef]
- Wiggs, G.F.S.; Livingstone, I.; Thomas, D.S.G.; Bullard, J.E. Effect of vegetation removal on airflow patterns and dune dynamics in the southwest Kalahari Desert. Land Degrad. Rehabil. 1994, 5, 13–24. [Google Scholar] [CrossRef]
- Mayaud, J.R.; Wiggs, G.F.S.; Bailey, R.M. Dynamics of skimming flow in the wake of a vegetation patch. Aeolian Res. 2016, 22, 141–151. [Google Scholar] [CrossRef]
- Burri, K.; Gromke, C.; Lehning, M.; Graf, F. Aeolian sediment transport over vegetation canopies: A wind tunnel study with live plants. Aeolian Res. 2011, 3, 205–213. [Google Scholar] [CrossRef]
- Youssef, F.; Visser, S.M.; Karssenberg, D.; Erpul, G.; Cornelis, W.M.; Gabriels, D.; Poortinga, A. The effect of vegetation patterns on wind-blown mass transport at the regional scale: A wind tunnel experiment. Geomorphology 2012, 159–160, 178–188. [Google Scholar] [CrossRef]
- Gash, J.H.C. Observations of turbulence downwind of a forest-heath interface. Bound. Layer Meteorol. 1986, 36, 227–237. [Google Scholar] [CrossRef]
- Liu, J.; Chen, J.M.; Black, T.A.; Novak, M.D. E-ε modelling of turbulent air flow downwind of a model forest edge. Bound. Layer Meteorol. 1996, 77, 21–44. [Google Scholar] [CrossRef]
- Belcher, S.; Jerram, N.; Hunt, J. Adjustment of a turbulent boundary layer to a “canopy” of roughness elements. J. Fluid Mech. 2003, 488, 369–398. [Google Scholar] [CrossRef]
- Frank, C.; Ruck, B. Numerical study of the airflow over forest clearings. Forestry 2008, 81, 259–277. [Google Scholar] [CrossRef]
- Le, H.; Moin, P.; Kim, J. Direct numerical simulation of turbulent flow over a backward-facing step. J. Fluid Mech. 1997, 330, 349–374. [Google Scholar] [CrossRef]
- Wengle, H.; Huppertz, A.; Bärwolff, G.; Janke, G. Manipulated transitional backward-facing step flow: An experimental and direct numerical simulation investigation. Eur. J. Mech. 2001, 20, 25–46. [Google Scholar] [CrossRef]
- Gillies, J.A.; Nickling, W.G.; Nickolich, G.; Etyemezian, V. A wind tunnel study of the aerodynamic and sand trapping properties of porous mesh 3-dimensional roughness elements. Aeolian Res. 2017, 25, 23–35. [Google Scholar] [CrossRef]
- Raupach, M.R.; Lu, H. Representation of land-surface processes in aeolian transport models. Environ. Model. Softw. 2004, 19, 93–112. [Google Scholar] [CrossRef]
- Raupach, M.R.; Woods, N.; Dorr, G.; Leys, J.F.; Cleugh, H.A. The entrapment of particles by windbreaks. Atmos. Environ. 2001, 35, 3373–3383. [Google Scholar] [CrossRef]
- Zhang, J.; Shao, Y. A new parameterization of particle dry deposition over rough surfaces. Atmos. Chem. Phys. 2014, 14, 12429–12440. [Google Scholar] [CrossRef]
- Minvielle, F.; Marticorena, B.; Gillette, D.A.; Lawson, R.E.; Thompson, R.; Bergametti, G. Relationship between the aerodynamic roughness length and the roughness density in cases of low roughness density. Environ. Fluid Mech. 2003, 3, 249–267. [Google Scholar] [CrossRef]
- Grant, P.F.; Nickling, W.G. Direct field measurement of wind drag on vegetation for application to windbreak design and modeling. Land Degrad. Dev. 1998, 9, 57–66. [Google Scholar] [CrossRef]
- Taylor, P.A. Turbulent wakes in the boundary layer. In Flow and Transport in the Natural Environment: Advances and Applications; Steffen, W.L., Denmead, O.T., Eds.; Springer: Berlin, Germany, 1988; pp. 270–292. [Google Scholar]
- Wang, H.; Takle, E.S. Momentum budget and shelter mechanism of bounda-layer flow near a shelterbelt. Bound. Layer Meteorol. 1996, 82, 417–435. [Google Scholar] [CrossRef]
- Vigiak, O.; Sterk, G.; Warren, A.; Hagen, L.J. Spatial modeling of wind speed around windbreaks. Catena 2003, 52, 273–288. [Google Scholar] [CrossRef]
- Cornelis, W.M.; Gabriels, D. Optimal windbreak design for wind-erosion control. J. Arid Environ. 2005, 61, 315–332. [Google Scholar] [CrossRef]
- Musick, H.B.; Trujillo, S.M.; Truman, C.R. Wind-tunnel modelling of the influence of vegetation structure on saltation threshold. Earth Surf. Process. Landf. 1996, 21, 589–605. [Google Scholar] [CrossRef]
- Lee, S.-J.; Park, K.C.; Park, C.W. Wind tunnel observations about the shelter effect of porous fences on the sand particle movements. Atmos. Environ. 2002, 36, 1453–1463. [Google Scholar] [CrossRef]
- Bradley, E.F.; Mulhearn, P.J. Development of velocity and shear-stress distributions in the wake of a porous shelter fence. J. Wind Eng. Ind. Aerodyn. 1983, 15, 145–156. [Google Scholar] [CrossRef]
- Gillies, J.A.; Etyemezian, V.; Nikolich, G.; Glick, R.; Rowland, P.; Pesce, T.; Skinner, M. Effectiveness of an array of porous fences to reduce sand flux: Oceano Dunes, Oceano CA. J. Wind Eng. Ind. Aerodyn. 2017, 168, 247–259. [Google Scholar] [CrossRef]
- Walter, B.; Gromke, C.; Leonard, K.; Clifton, A.; Lehning, M. Spatially resolved skin friction velocity measurements using Irwin sensors: A calibration and accuracy analysis. J. Wind Eng. Ind. Aerodyn. 2012, 104–106, 314–321. [Google Scholar] [CrossRef]
- Wilson, J.D.; Yee, E. Calculation of winds disturbed by an array of fences. Agric. For. Meteorol. 2003, 115, 31–50. [Google Scholar] [CrossRef]
- Hagen, L.J. WEPS: Wind Erosion Prediction System, Technical Documentation; Wind Erosion Research Unit: Manhattan, NY, USA, 1996. [Google Scholar]
- McKenna-Neuman, C.; Bédard, O. A wind tunnel study of flow structure adjustment on deformable sand beds containing a surface-mounted obstacle. J. Geophys. Res. Earth Surf. 2015, 120, 1824–1840. [Google Scholar] [CrossRef]
- Clifford, N.J.; French, J.R. Monitoring and modelling turbulent flows: Historical and contemporary perspectives. In Turbulence: Perspectives on Flow and Sediment Transport; Clifford, N.J., French, J.R., Hardisty, J., Eds.; John Wiley & Sons: New York, NY, USA, 1993; pp. 1–34. [Google Scholar]
- Butterfield, G.R. Grain transport rates in steady and unsteady turbulent airflows. Acta Mech. 1991, 1, 97–122. [Google Scholar]
- Sterk, G.; Jacobs, A.F.G.; van Boxel, J.H. The effect of turbulent flow structures on saltation sand transport in the atmospheric boundary layer. Earth Surf. Process. Landf. 1998, 23, 877–887. [Google Scholar] [CrossRef]
- Namikas, S.L.; Bauer, B.O.; Sherman, D.J. Influence of averaging interval on shear velocity estimates for aeolian transport modelling. Geomorphology 2003, 53, 235–246. [Google Scholar] [CrossRef]
- Schönfeldt, H.J.; von Löwis, S. Turbulence-driven saltation in the atmospheric surface layer. Meteorol. Z. 2003, 12, 257–268. [Google Scholar] [CrossRef]
- Baas, A.C.W.; Sherman, D.J. Formation and behaviour of aeolian streamers. J. Geophys. Res. 2005, 110, F03011. [Google Scholar] [CrossRef]
- Baas, A.C.W.; Sherman, D.J. Spatiotemporal variability of aeolian sand transport in a coastal dune environment. J. Coast. Res. 2005, 22, 1198–1205. [Google Scholar] [CrossRef]
- Leenders, J.K.; van Boxel, J.H.; Sterk, G. Wind forces and related saltation transport. Geomorphology 2005, 71, 357–372. [Google Scholar] [CrossRef]
- Weaver, C.M.; Wiggs, G.F.S. Field measurements of mean and turbulent airflow over a barchan sand dune. Geomorphology 2011, 128, 32–41. [Google Scholar] [CrossRef]
- Wiggs, G.F.S.; Weaver, C.M. Turbulent flow structures and aeolian sediment transport over a barchan sand dune. Geophys. Res. Lett. 2012, 39, 1–7. [Google Scholar] [CrossRef]
- Mayaud, J.R.; Bailey, R.M.; Wiggs, G.F.S. Modelling aeolian sand transport using a dynamic mass balancing approach. Geomorphology 2016, 280, 108–121. [Google Scholar] [CrossRef]
- Musick, H.B.; Gillette, D.A. Field evaluation of relationships between a vegetation structural parameter and sheltering against wind erosion. Land Degrad. Rehabil. 1990, 2, 87–94. [Google Scholar] [CrossRef]
- Schlichting, H. Experimentelle untersuchungen zum Rauhigkeitsproblem. Ing.-Arch. 1936, 7, 1–34. [Google Scholar] [CrossRef]
- Marshall, J.K. Drag measurements in roughness arrays of varying densities and distribution. Agric. Meteorol. 1971, 8, 269–292. [Google Scholar] [CrossRef]
- Marticorena, B.; Bergametti, G. Modeling the atmospheric dust cycle: 1. Design of a soil-derived dust emission scheme. J. Geophys. Res. 1995, 100, 16415. [Google Scholar] [CrossRef]
- Brown, S.; Nickling, W.G.; Gillies, J.A. A wind tunnel examination of shear stress partitioning for an assortment of surface roughness distributions. J. Geophys. Res. 2008, 113, F02S06. [Google Scholar] [CrossRef]
- Lyles, L.; Schrandt, R.L.; Schmeidler, N.F. How aerodynamic roughness elements control sand movement. Trans. ASAE 1974, 17, 134–139. [Google Scholar] [CrossRef]
- Raupach, M.R.; Gillette, D.A.; Leys, J.F. The effect of roughness elements on wind erosion threshold. J. Geophys. Res. 1993, 98, 3023–3029. [Google Scholar] [CrossRef]
- Shao, Y.; Yang, Y. A scheme for drag partition over rough surfaces. Atmos. Environ. 2005, 39, 7351–7361. [Google Scholar] [CrossRef]
- Shao, Y.; Yang, Y. A theory for drag partition over rough surfaces. J. Geophys. Res. 2008, 113, F02S05. [Google Scholar] [CrossRef]
- Lancaster, N. Development of linear dunes in the southwestern Kalahari, southern Africa. J. Arid Environ. 1988, 14, 233–244. [Google Scholar]
- Molina-Aiz, F.D.; Valera, D.L.; Álvarez, A.J.; Madueño, A. A wind tunnel study of airflow through horticultural crops: Determination of the drag coefficient. Biosyst. Eng. 2006, 93, 447–457. [Google Scholar] [CrossRef]
- Udo, K.; Takewaka, S. Experimental study of blown sand in a vegetated area. J. Coast. Res. 2007, 23, 1175–1182. [Google Scholar] [CrossRef]
- Wuyts, K.; Verheyen, K.; De Schrijver, A.; Cornelis, W.M.; Gabriels, D. The impact of forest edge structure on longitudinal patterns of deposition, wind speed, and turbulence. Atmos. Environ. 2008, 42, 8651–8660. [Google Scholar] [CrossRef]
- Sherman, D.; Farrell, E. Aerodynamic roughness lengths over movable beds: Comparison of wind tunnel and field data. J. Geophys. Res. Earth Surf. 2008, 113. [Google Scholar] [CrossRef]
- Li, B.; Neuman, M.C. Boundary-layer turbulence characteristics during aeolian saltation. Geophys. Res. Lett. 2012, 39, L11402. [Google Scholar] [CrossRef]
- Martin, R.L.; Kok, J.F. Linear scaling of wind-driven sand flux with shear stress. Sci. Adv. 2017, 3. [Google Scholar] [CrossRef] [PubMed]
- Zhang, N.; Kang, J.-H.; Lee, S.-J. Wind tunnel observation on the effect of a porous wind fence on shelter of saltating sand particles. Geomorphology 2010, 120, 224–232. [Google Scholar] [CrossRef]
- Wiggs, G.F.S.; Thomas, D.S.G.; Bullard, J.E.; Livingstone, I. Dune mobility and vegetation cover in the southwest Kalahari Desert. Earth Surf. Process. Landf. 1995, 20, 515–529. [Google Scholar] [CrossRef]
- Lancaster, N.; Baas, A. Influence of vegetation cover on sand transport by wind: Field studies at Owens Lake, California. Earth Surf. Process. Landf. 1998, 23, 69–82. [Google Scholar] [CrossRef]
- Munson, S.M.; Belnap, J.; Okin, G.S. Responses of wind erosion to climate-induced vegetation changes on the Colorado Plateau. Proc. Natl. Acad. Sci. USA 2011, 108, 3854–3859. [Google Scholar] [CrossRef] [PubMed]
- Webb, N.P.; Herrick, J.E.; Duniway, M.C. Ecological site-based assessments of wind and water erosion: Informing accelerated soil erosion management in rangelands. Ecol. Appl. 2014, 24, 1405–1420. [Google Scholar] [CrossRef]
- Turpin, C.; Badr, T.; Harion, J.-L. Numerical modeling of aeolian erosion over rough surfaces. Earth Surf. Process. Landf. 2010, 35, 1418–1429. [Google Scholar] [CrossRef]
- Chepil, W.S. Utilization of crop residue for wind erosion control. Sci. Agric. 1944, 24, 307–319. [Google Scholar]
- Siddoway, F.H.; Chepil, W.S.; Armbrust, D.V. Effect of kind, and placement of residue on wind erosion control. Trans. ASAE 1965, 8, 327–331. [Google Scholar] [CrossRef]
- Lyles, L.; Allison, B.E. Wind erosion: The protective role of simulated standing stubble. Trans. ASAE 1976, 19, 61–64. [Google Scholar] [CrossRef]
- King, J.; Nickling, W.G.; Gillies, J.A. Aeolian shear stress ratio measurements within mesquite-dominated landscapes of the Chihuahuan Desert, New Mexico, USA. Geomorphology 2006, 82, 229–244. [Google Scholar] [CrossRef]
- Gillies, J.A.; Nickling, W.G.; King, J. Aeolian sediment transport through large patches of roughness in the atmospheric inertial sublayer. J. Geophys. Res. 2006, 111, F02006. [Google Scholar] [CrossRef]
- Gillies, J.A.; Nickling, W.G.; King, J. Shear stress partitioning in large patches of roughness in the atmospheric inertial sublayer. Bound. Layer Meteorol. 2007, 122, 367–396. [Google Scholar] [CrossRef]
- Gillies, J.A.; Nickling, W.G.; King, J.; Lancaster, N. Modeling aeolian sediment transport thresholds on physically rough Martian surfaces: A shear stress partitioning approach. Geomorphology 2010, 121, 15–21. [Google Scholar] [CrossRef]
- Okin, G.S.; Gillette, D.A. Distribution of vegetation in wind-dominated landscapes: Implications for wind erosion modeling and landscape processes. J. Geophys. Res. 2001, 106, 9673–9683. [Google Scholar] [CrossRef]
- Lancaster, N.; Nickling, W.G.; Gillies, J.A. Sand transport by wind on complex surfaces: Field studies in the McMurdo Dry Valleys, Antarctica. J. Geophys. Res. 2010, 115, F03027. [Google Scholar] [CrossRef]
- Webb, N.P.; Okin, G.S.; Brown, S. The effect of roughness elements on wind erosion: The importance of surface shear stress distribution. J. Geophys. Res. Atmos. 2014, 119, 6066–6084. [Google Scholar] [CrossRef]
- Gillies, J.A.; Green, H.L.; McCarley-Holder, G.; Grimm, S.; Howard, C.; Barbieri, N.; Ono, D.; Schade, T. Using solid element roughness to control sand movement: Keeler Dunes, Keeler, California. Aeolian Res. 2015, 18, 35–46. [Google Scholar] [CrossRef]
- Chappell, A.; Webb, N.P. Using albedo to reform wind erosion modelling, mapping and monitoring. Aeolian Res. 2016, 23, 63–78. [Google Scholar] [CrossRef]
- Chen, Q.; Jia, L.; Hutjes, R.; Menenti, M. Estimation of aerodynamic roughness length over oasis in the Heihe River Basin by utilizing remote sensing and ground data. Remote Sens. 2015, 7, 3690–3709. [Google Scholar] [CrossRef]
- Yu, M.; Wu, B.; Yan, N.; Xing, Q.; Zhu, W. A method for estimating the aerodynamic roughness length with NDVI and BRDF signatures using multi-temporal Proba-V data. Remote Sens. 2017, 9, 6. [Google Scholar] [CrossRef]
- Shao, Y.; Nickling, W.; Bergametti, G.; Butler, H.; Chappell, A.; Findlater, P.; Gillies, J.; Ishizuka, M.; Klose, M.; Kok, J.F.; et al. A tribute to Michael R. Raupach for contributions to aeolian fluid dynamics. Aeolian Res. 2015, 19, 37–54. [Google Scholar] [CrossRef]
- Sankey, J.B.; Law, D.J.; Breshears, D.D.; Munson, S.M.; Webb, R.H. Employing lidar to detail vegetation canopy architecture for prediction of aeolian transport. Geophys. Res. Lett. 2013, 40, 1724–1728. [Google Scholar] [CrossRef]
- Herrick, J.E.; Van Zee, J.W.; McCord, S.E.; Courtright, E.M.; Karl, J.W.; Burkett, L.M. Monitoring Manual for Grassland, Shrubland, and Savanna Ecosystems, Volume 1: Core Methods, 2nd ed.; USDA-ARS Jornada Experimental Range: Las Cruces, NM, USA, 2017; Available online: http://www.landscapetoolbox.org/manuals/monitoring-manual/ (accessed on 1 January 2017).
- Jupp, D.L.B.; Culvenor, D.S.; Lovell, J.L.; Newnham, G.J.; Strahler, A.H.; Woodcock, C.E. Estimating forest LAI profiles and structural parameters using a ground-based laser called ‘Echidna’. Tree Physiol. 2008, 29, 171–181. [Google Scholar] [CrossRef] [PubMed]
- Karl, J.W.; Duniway, M.C.; Schrader, T.S. A technique for estimating rangeland canopy-gap size distributions from high-resolution digital imagery. Rangel. Ecol. Manag. 2011, 65, 196–207. [Google Scholar] [CrossRef]
- Shao, Y. Physics and Modelling of Wind Erosion; Kluwer Academic Publishers: London, UK, 2008. [Google Scholar]
- Ito, A.; Kok, J.F. Do dust emissions from sparsely vegetated regions dominate atmospheric iron supply to the Southern Ocean? J. Geophys. Res. Atmos. 2017, 122, 3987–4002. [Google Scholar] [CrossRef]
- Galloza, M.S.; Webb, N.P.; Bleiweiss, M.P.; Winters, C.; Herrick, J.E.; Ayers, E. Resolving dust emission responses to land cover change using an ecological land classification. Aeolian Res. 2017, in press. [Google Scholar]
- Greeley, R.; Gaddis, L.; Lancaster, N.; Dobrovolskies, A.; Iversen, J.; Rasmussen, K.; Saunders, S.; van Zyl, J.; Wall, S.; Zebker, H.; et al. Assessment of aerodynamic roughness via airborne radar observations. Acta Mech. 1991, 2, 77–88. [Google Scholar]
- Greeley, R.; Blumberg, D.G.; McHone, J.F.; Dobrovolskis, A.; Iversen, J.D.; Lancaster, N.; Rasmussen, K.R.; Wall, S.D.; White, B.R. Applications of spaceborne radar laboratory data to the study of aeolian processes. J. Geophys. Res. 1997, 102, 10971–10983. [Google Scholar] [CrossRef]
- Marticorena, B.; Chazette, P.; Bergametti, G.; Dulac, F.; Legrand, M. Mapping the aerodynamic roughness length of desert surfaces from the POLDER/ADEOS bidirectional reflectance product. Int. J. Remote Sens. 2004, 25, 603–626. [Google Scholar] [CrossRef]
- Marticorena, B.; Kardous, M.; Bergametti, G.; Callot, Y.; Chazette, P.; Khatteli, H.; Le Hegarat-Mascle, S.; Maille, M.; Rajot, J.-L.; Vidal-Madjar, D.; et al. Surface and aerodynamic roughness in arid and semiarid areas and their relation to radar backscatter coefficient. J. Geophys. Res. 2006, 111, F03017. [Google Scholar] [CrossRef]
- Chappell, A.; Heritage, G.L. Using illumination and shadow to model aerodynamic resistance and flow separation: An isotropic study. Atmos. Environ. 2007, 41, 5817–5830. [Google Scholar] [CrossRef]
- Chappell, A.; Van Pelt, S.; Zobeck, T.; Dong, Z. Estimating aerodynamic resistance of rough surfaces using angular reflectance. Remote Sens. Environ. 2010, 114, 1462–1470. [Google Scholar] [CrossRef]
- Dupont, S.; Bergametti, G.; Marticorena, B.; Simoëns, S. Modeling saltation intermittency. J. Geophys. Res. Atmos. 2013, 118, 1–20. [Google Scholar] [CrossRef]
- Maruyama, T. Large eddy simulation of turbulent flow around a windbreak. J. Wind Eng. Ind. Aerodyn. 2008, 96, 1998–2006. [Google Scholar] [CrossRef]
- Schröttle, J.; Dörnbrack, A. Turbulence structure in a diabatically heated forest canopy composed of fractal Pythagoras trees. Theor. Comput. Fluid Dyn. 2012, 27, 337–359. [Google Scholar] [CrossRef] [Green Version]
- Schwämmle, V.; Herrmann, H.J. A model for barchan dunes including lateral shear stress. Eur. Phys. J. E 2005, 16, 57–65. [Google Scholar] [CrossRef] [PubMed]
- Hermann, H.J.; Duran, O.; Parteli, E.J.R.; Schatz, V. Vegetation and induration as sand dunes stabilizators. J. Coast. Res. 2008, 24, 1357–1368. [Google Scholar] [CrossRef]
- Durán, O.; Hermann, H.J. Vegetation against dune mobility. Phys. Rev. Lett. 2006, 97, 188001. [Google Scholar] [CrossRef] [PubMed]
- Turnbull, L.; Hochstrasser, T.; Wieczorek, M.; Baas, A.; Wainwright, J.; Scarsoglio, S.; Tietjen, B.; Jeltsch, F.; Mueller, E.N. Approaches to modelling ecogeomorphic systems. In Patterns of Land Degradation in Drylands: Understanding Self-Organised Ecogeomorphic Systems; Mueller, E.N., Wainwright, J., Parsons, A.J., Turnbull, L., Eds.; Springer: Berlin, Germany, 2013. [Google Scholar]
- Narteau, C.; Lajeunesse, E.; Métivier, F.; Rozier, O. Modelling of dune patterns by short range interactions. River Coast. Estuar. Morphodyn. 2006, 2, 1035–1046. [Google Scholar]
- Baas, A.C.W. Complex systems in aeolian geomorphology. Geomorphology 2007, 91, 311–331. [Google Scholar] [CrossRef]
- Nield, J.M.; Baas, A.C.W. The influence of different environmental and climatic conditions on vegetated aeolian dune landscape development and response. Glob. Planet. Chang. 2008, 64, 76–92. [Google Scholar] [CrossRef]
- Peters, D.P.C.; Bestelmeyer, B.T.; Herrick, J.E.; Monger, H.C.; Fredrickson, E.; Havstad, K.M. Disentangling complex landscapes: New insights to forecasting arid and semiarid system dynamics. BioScience 2006, 56, 491–501. [Google Scholar] [CrossRef]
- Okin, G.S.; Parsons, A.J.; Wainwright, J.; Herrick, J.E.; Bestelmeyer, B.T.; Peters, D.C.; Fredrickson, E.L. Do changes in connectivity explain desertification? Bioscience 2009, 59, 237–244. [Google Scholar] [CrossRef]
- Turnbull, L.; Wainwright, J.; Brazier, R.E. A conceptual framework for understanding semi-arid land degradation: Ecohydrological interactions across multiple-space and time scales. Ecohydrology 2008, 1, 23–34. [Google Scholar] [CrossRef] [Green Version]
- Turnbull, L.; Wilcox, B.; Belnap, J. Understanding the role of ecohydrological feedbacks in ecosystem state change in drylands. Ecohydrology 2012, 183, 174–183. [Google Scholar] [CrossRef]
- Yan, N.; Baas, A.C.W. Environmental controls, morphodynamic processes, and ecogeomorphic interactions of barchan to parabolic dune transformations. Geomorphology 2017, 278, 209–237. [Google Scholar] [CrossRef]
- Omasa, K.; Hosoi, F.; Konishi, A. 3D lidar imaging for detecting and understanding plant responses and canopy structure. J. Exp. Bot. 2007, 58, 881–898. [Google Scholar] [CrossRef] [PubMed]
- Cruzan, M.B.; Weinstein, B.G.; Grasty, M.R.; Kohrn, B.F.; Hendrickson, E.C.; Arredondo, T.M.; Thompson, P.G. Small unmanned aerial vehicles (micro-UAVs, drones) in plant ecology. Appl. Plant Sci. 2016, 4. [Google Scholar] [CrossRef] [PubMed]
- Fonstad, M.A.; Marcus, W.A. High resolution, basin extent observations and implications for understanding river form and process. Earth Surf. Process. Landf. 2010, 35, 680–698. [Google Scholar] [CrossRef]
- James, M.R.; Robson, S. Straightforward reconstruction of 3D surfaces and topography with a camera: Accuracy and geoscience application. J. Geophys. Res. Earth Surf. 2012, 117, F03017. [Google Scholar] [CrossRef]
- Westoby, M.J.; Brasington, J.; Glasser, N.F.; Hambrey, M.J.; Reynolds, J.M. “Structure-from-Motion” photogrammetry: A low-cost, effective tool for geoscience applications. Geomorphology 2012, 179, 300–314. [Google Scholar] [CrossRef] [Green Version]
- Fonstad, M.A.; Dietrich, J.T.; Courville, B.C.; Jensen, J.L.; Carbonneau, P.E. Topographic structure from motion: A new development in photogrammetric measurement. Earth Surf. Process. Landf. 2013, 38, 421–430. [Google Scholar] [CrossRef]
- Nield, J.M.; King, J.; Wiggs, G.F.S.; Leyland, J.; Bryant, R.G. Estimating aerodynamic roughness over complex surface terrain. J. Geophys. Res. Atmos. 2013, 118, 12948–12961. [Google Scholar] [CrossRef]
Figure 1.
Flow visualisation around a single vegetation element, showing the development of six different flow regimes (from [46] (p. 1457), adapted from [43,44]).

Figure 2.
Flow visualisation downwind of a single tree, shown as: (top panel) the normalised time-averaged wind velocity (Vt/Vref) simulated by Dupont et al.’s [52] model, shown in vertical cross-section. Solid black lines delimit the tree; (bottom panel) the normalised time-averaged wind velocity (Vt/Vtxy) simulated by the model at 0.1 m height, shown in horizontal cross-section. The solid black circle represent the tree crowns (adapted from [52] (p. 176)).

Figure 3.
Flow regimes and associated theoretical wake development, shown in schematic plan and side view. Shaded areas are wake regions. The effect of different flow regimes on average z0 (aerodynamic roughness) and d (displacement height) per plant unit is shown (adapted from [43] (p. 57), and [60] (p. 66)).

Figure 4.
Main zones of possible speedup/slowdown around a roughness element, as collated from various vegetation and windbreak studies.
Figure 4.
Main zones of possible speedup/slowdown around a roughness element, as collated from various vegetation and windbreak studies.
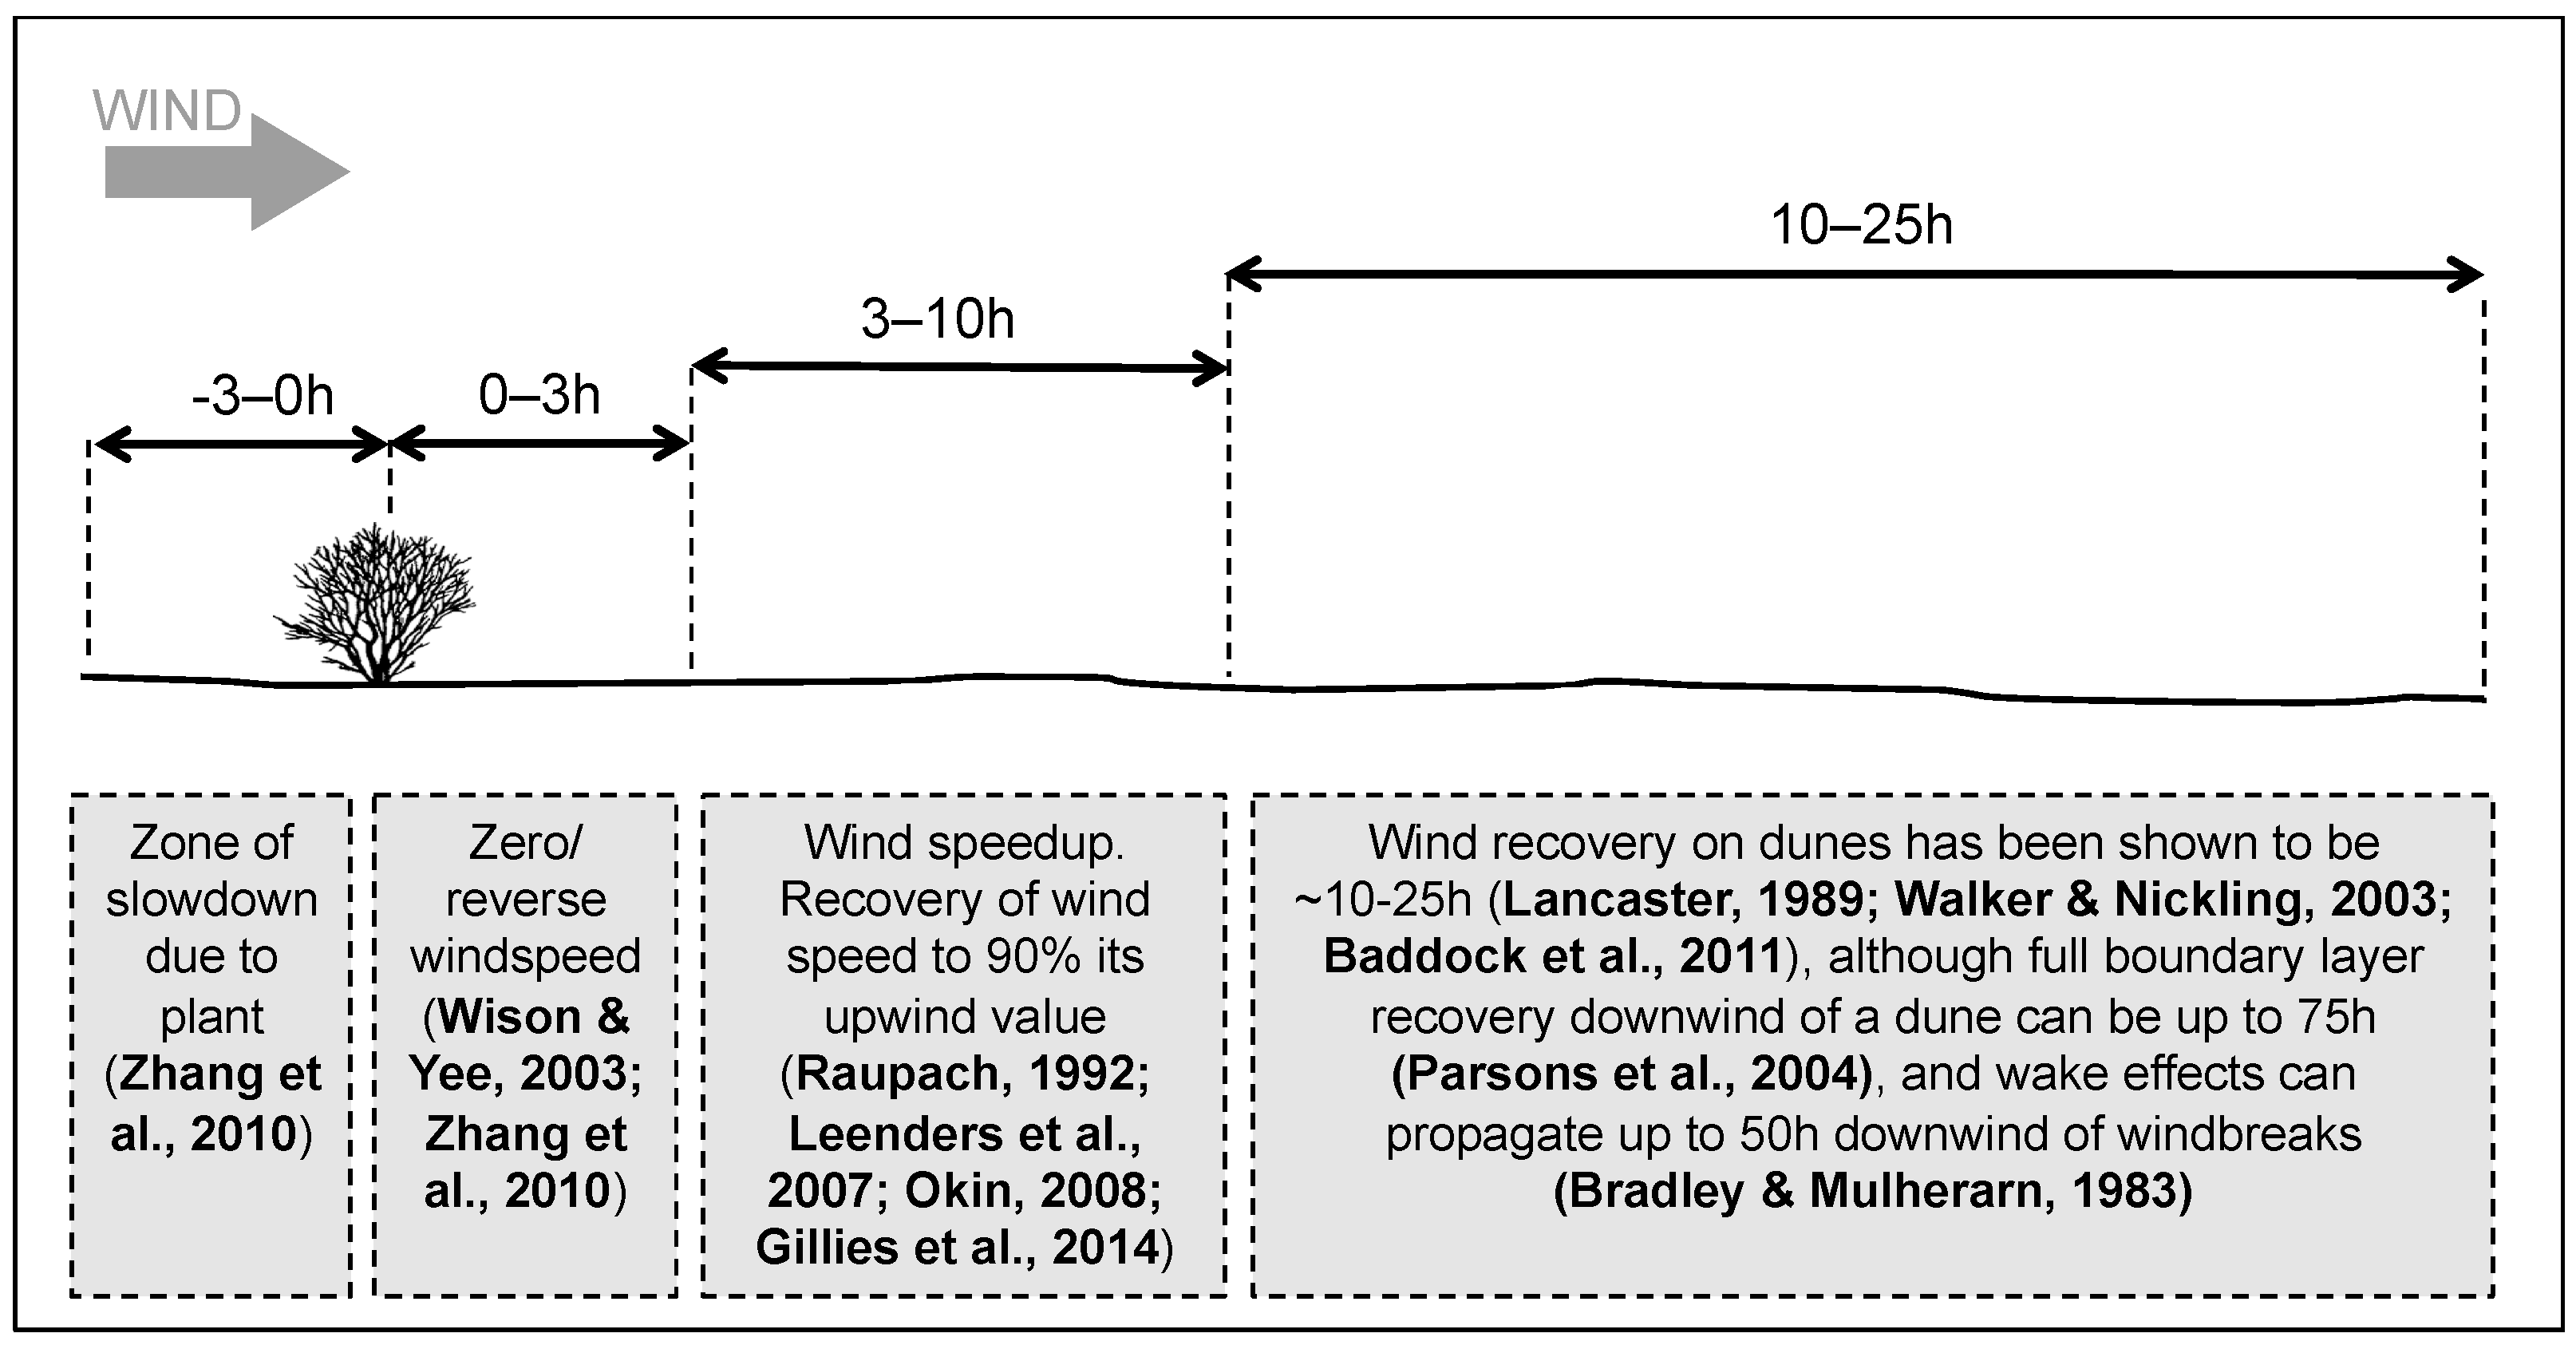
Figure 5.
Illustration of the parameters used to calculate roughness density () in roughness studies: is element height, is element base/width, is the number of elements, and is the surface area over which the calculation is made.
Figure 5.
Illustration of the parameters used to calculate roughness density () in roughness studies: is element height, is element base/width, is the number of elements, and is the surface area over which the calculation is made.

Figure 6.
Image sequences of sediment deposition patterns in Suter-Burri et al.’s [60] wind tunnel experiments, on surfaces populated by low-density (top row) and medium-density (bottom row) canopies. White sand was blowing in from upstream, with wind direction from left to right (adapted from [60] (p. 69)).
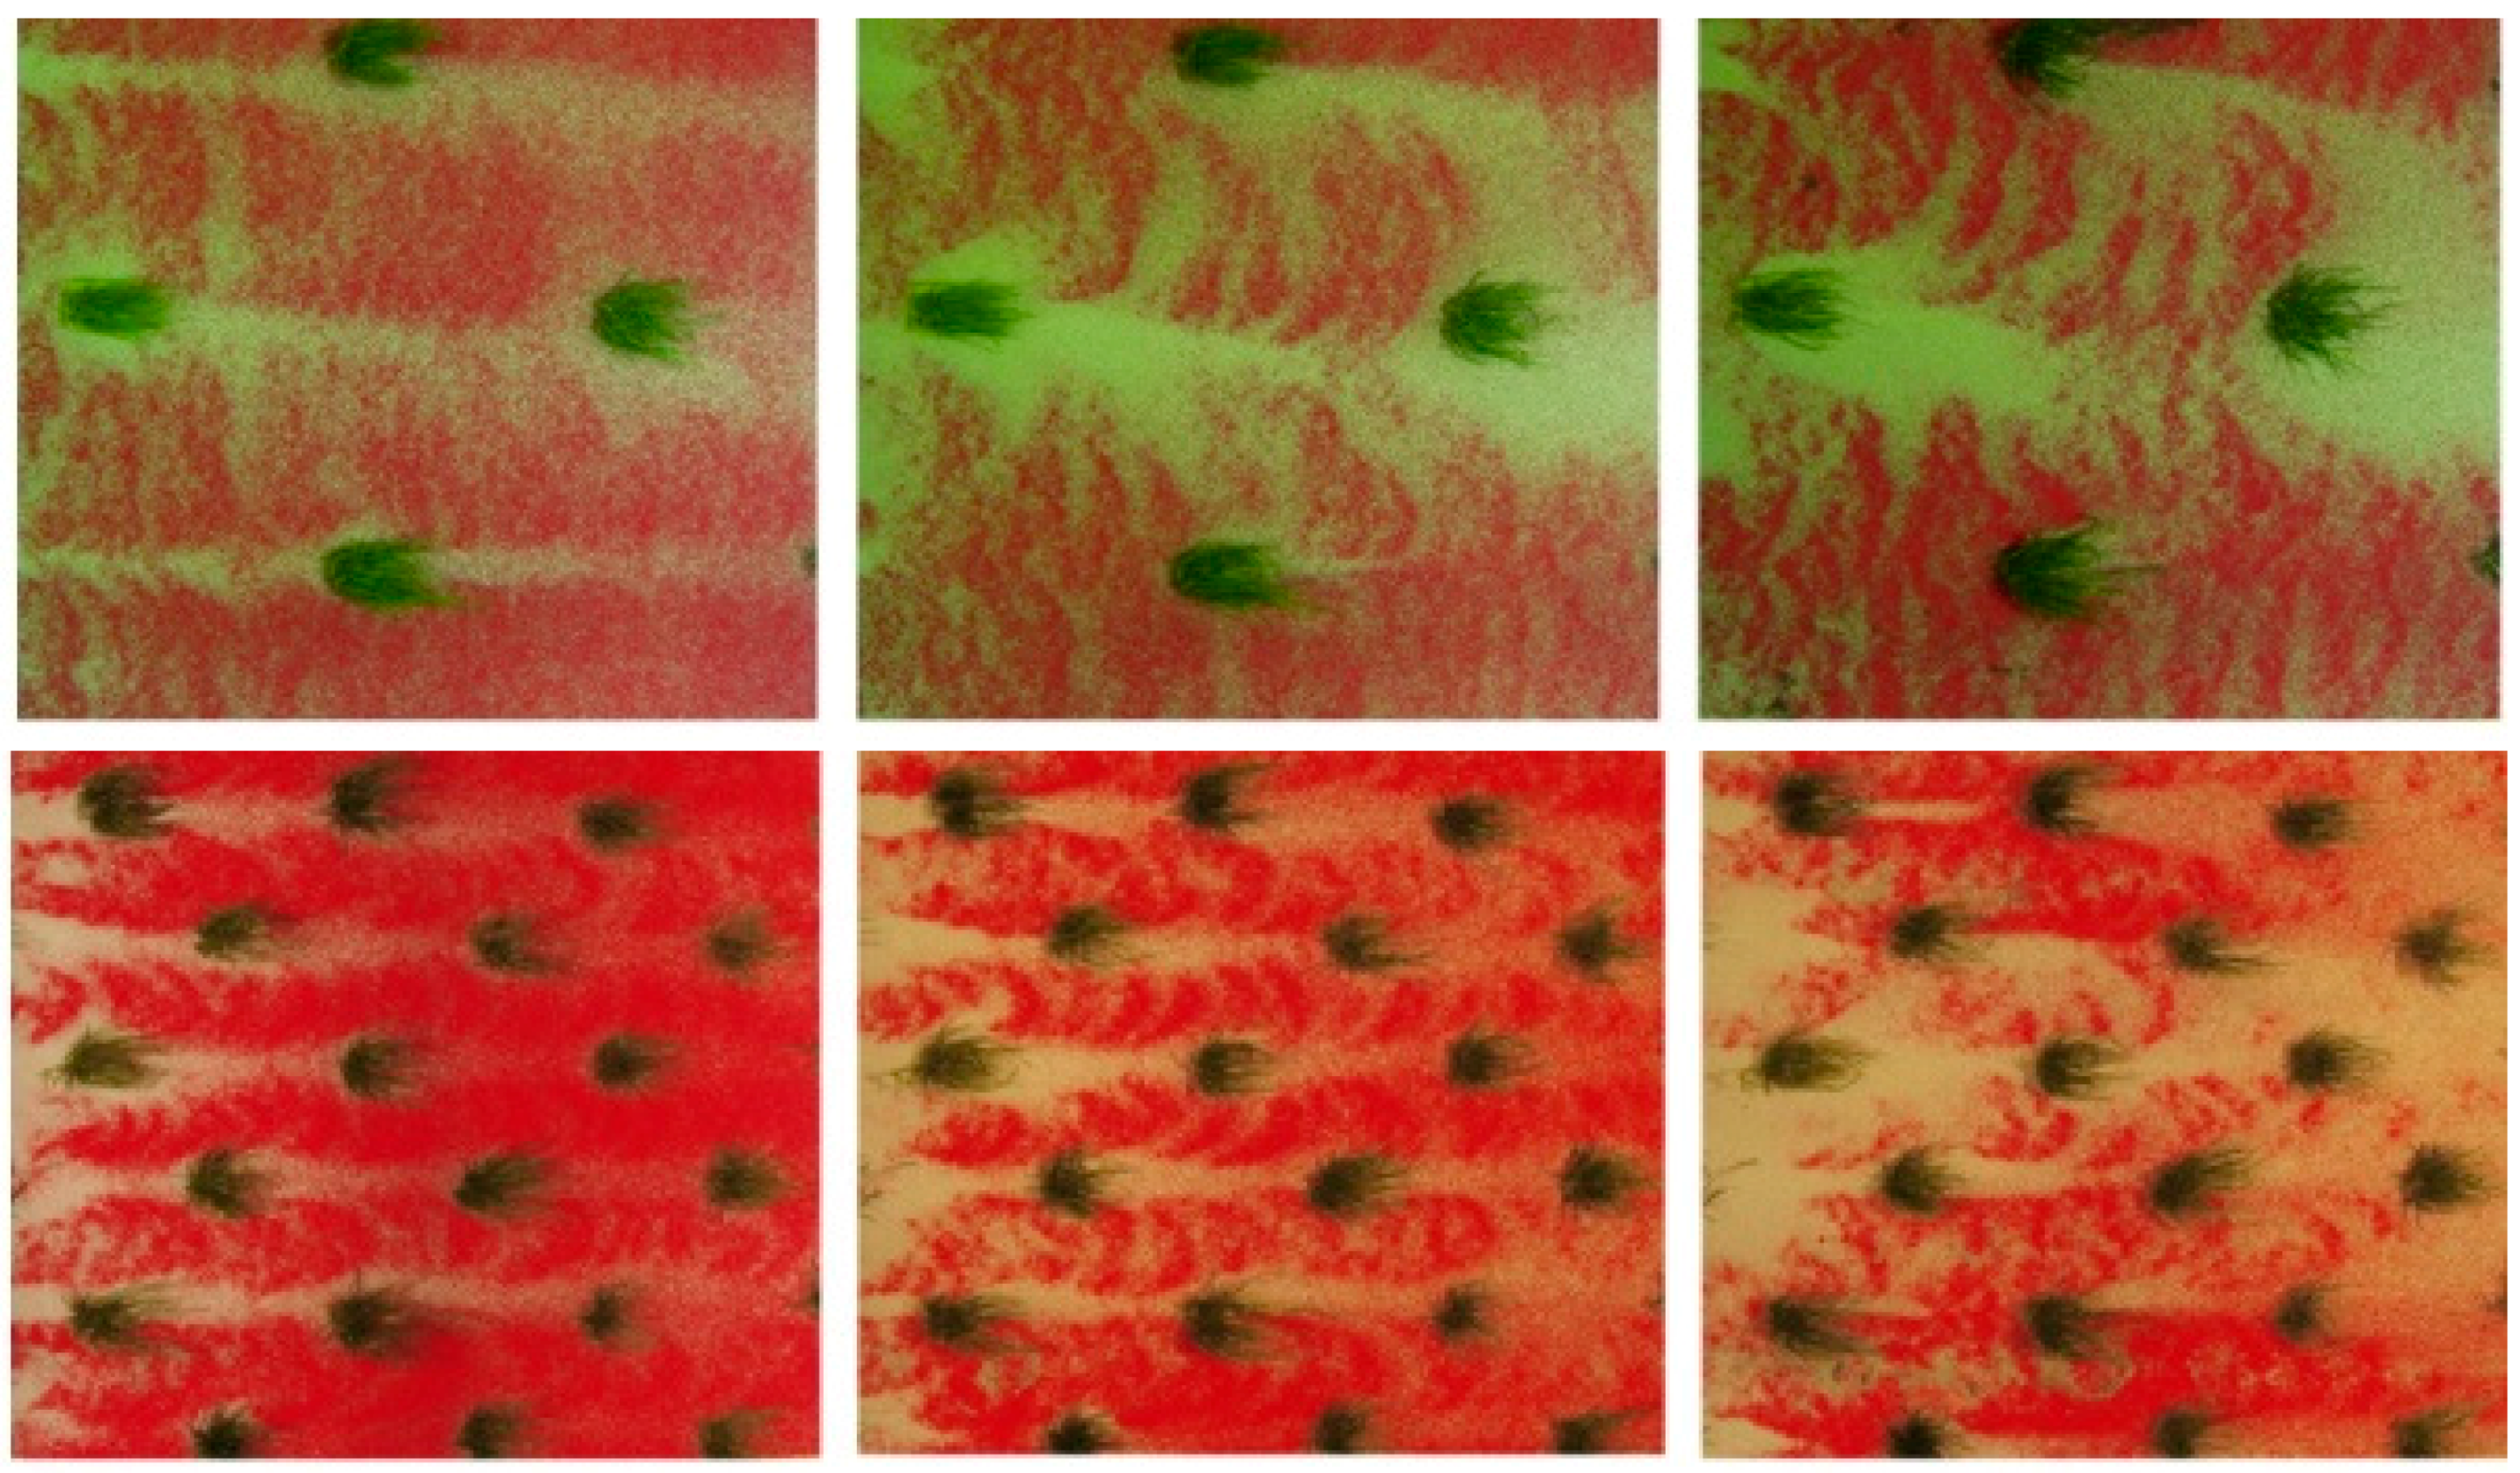
Figure 7.
The Telephone Pole Problem. Both of these surfaces have the same roughness density, but on the left roughness density is partitioned into sixteen elements, whereas on the right, it is partitioned into four objects four times the height. Under the shear stress partitioning model of Raupach et al. [121], both surfaces experience the same horizontal flux, although intuitively this is not an accurate representation of physical reality (from [58] (p. 3)).
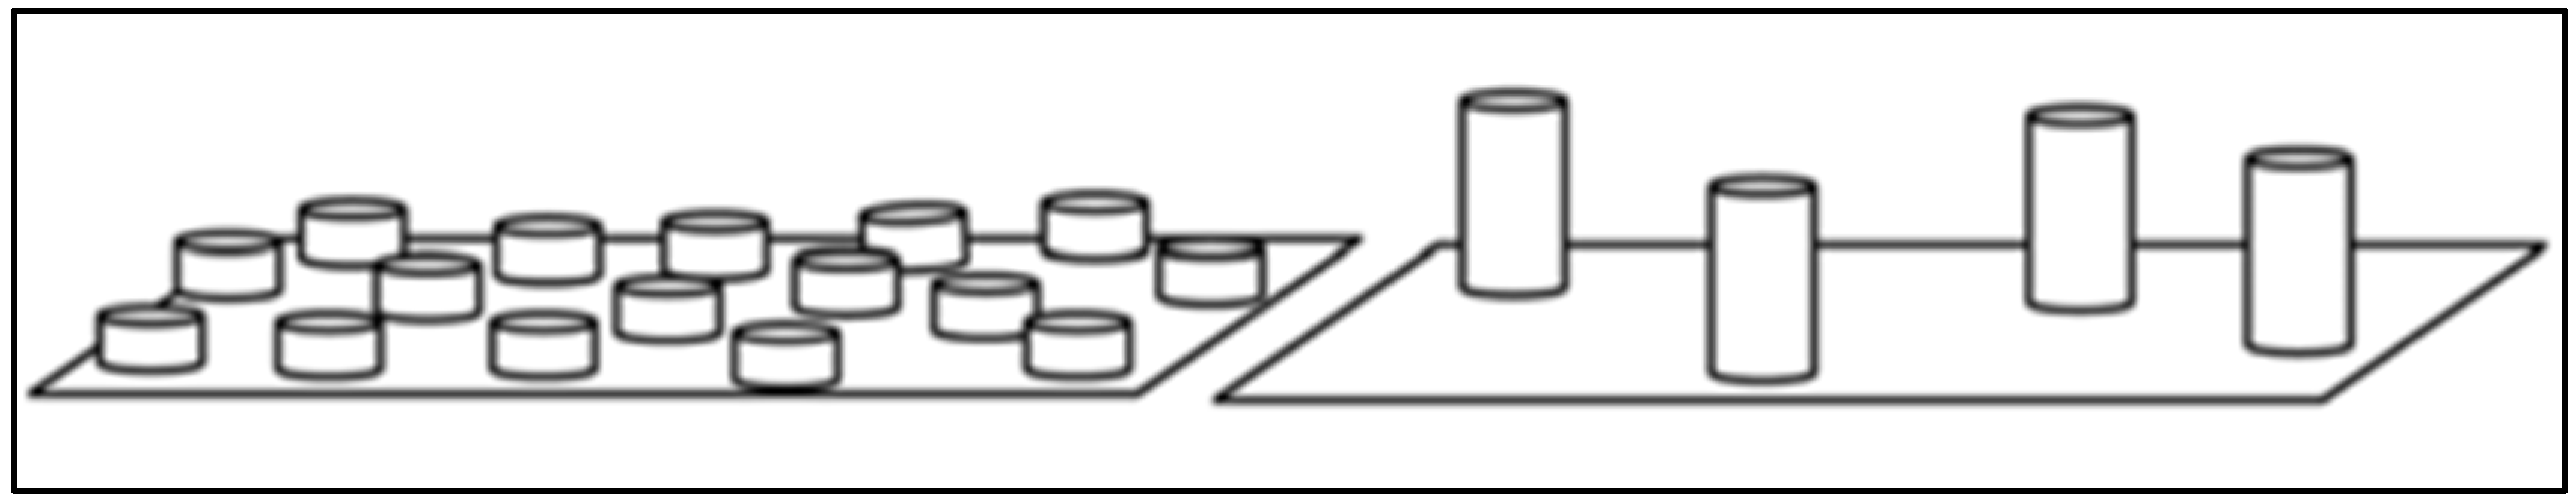
Figure 8.
Chappell and Webb’s [148] relation between normalised albedo (, i.e., proportion of shadow) and the wind shear stress scaled by the velocity at a free stream height (). Chappell and Webb [148] illuminated each of Marshall’s [117] surfaces across a range of zenith angles to approximate the direct beam directional hemispherical albedo (or black sky albedo ω; viewed at nadir), then normalised ω by the reflectance of the surface, illuminated and viewed at nadir (), to remove any spectral influences, and used the inverse to reveal the shadow , and then rescaled (). The relation enables estimates of wind shear velocity at the soil surface to be produced from Moderate Resolution Imaging Spectroradiometer (MODIS) data globally, at a 500 m spatial resolution.

Figure 9.
Three-dimensional representations of combined vegetation and surface morphology for a coupled Vegetation and Sediment TrAnsport model (ViSTA) simulation, with conditions similar to those observed in the Skeleton Coast National Park, Namibia. Figures show landscape at: (a) beginning of simulation, where the domain is artificially populated with shrubs; (b) after 25 years of arid conditions, where an equilibrium landscape of nebkha dunes emerges. Black arrow shows average wind direction (adapted from [26] (p. 22)).
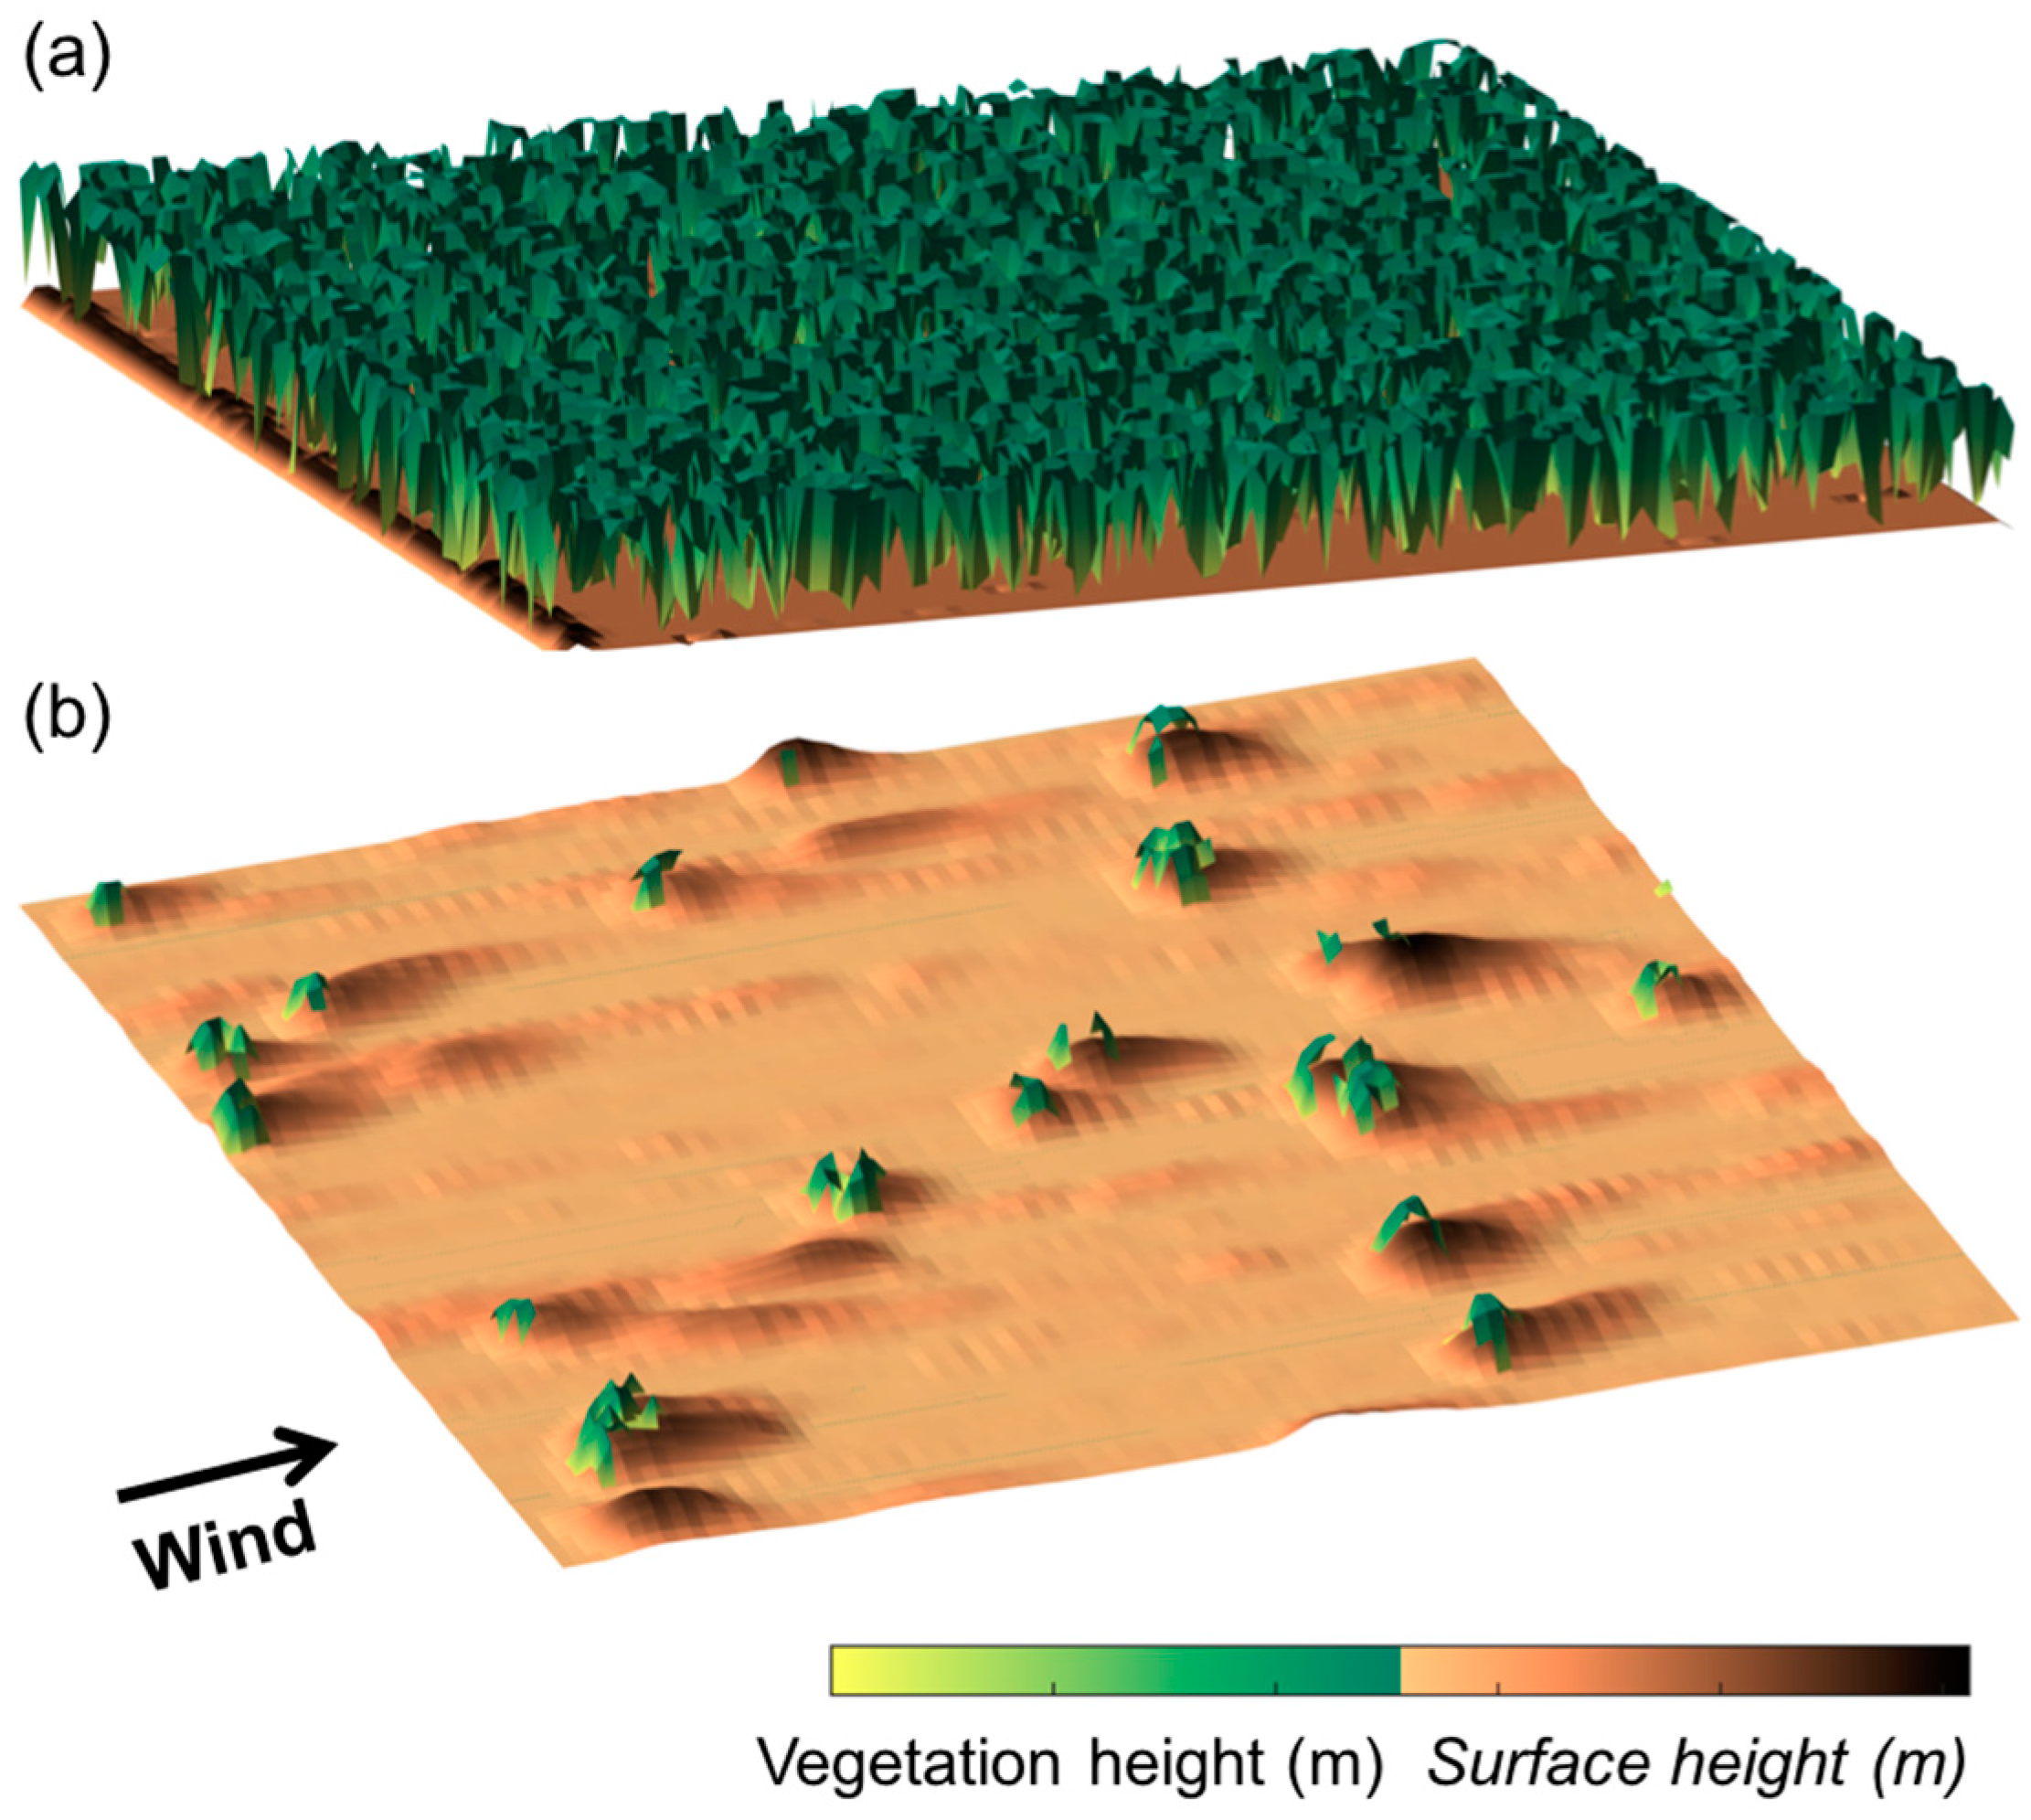
© 2017 by the authors. Licensee MDPI, Basel, Switzerland. This article is an open access article distributed under the terms and conditions of the Creative Commons Attribution (CC BY) license (http://creativecommons.org/licenses/by/4.0/).
Share and Cite
MDPI and ACS Style
Mayaud, J.R.; Webb, N.P. Vegetation in Drylands: Effects on Wind Flow and Aeolian Sediment Transport. Land 2017, 6, 64. https://doi.org/10.3390/land6030064
AMA Style
Mayaud JR, Webb NP. Vegetation in Drylands: Effects on Wind Flow and Aeolian Sediment Transport. Land. 2017; 6(3):64. https://doi.org/10.3390/land6030064
Chicago/Turabian StyleMayaud, Jerome R., and Nicholas P. Webb. 2017. "Vegetation in Drylands: Effects on Wind Flow and Aeolian Sediment Transport" Land 6, no. 3: 64. https://doi.org/10.3390/land6030064
Note that from the first issue of 2016, this journal uses article numbers instead of page numbers. See further details here.