Bequest of the Norseman—The Potential for Agricultural Intensification and Expansion in Southern Greenland under Climate Change

Department of Environmental Sciences, Physical Geography and Environmental Change, Klingelbergstrasse 27, CH-4056 Basel, Switzerland
*
Author to whom correspondence should be addressed.
Land 2017, 6(4), 87; https://doi.org/10.3390/land6040087
Submission received: 20 October 2017
/
Revised: 1 December 2017
/
Accepted: 4 December 2017
/
Published: 7 December 2017
(This article belongs to the Special Issue Arid Land Systems: Sciences and Societies)
Abstract
:The increase of summer temperatures and a prolonged growing season increase the potential for agricultural land use for subarctic agriculture. Nevertheless, land use at borderline ecotones is influenced by more factors than temperature and the length of the growing season, for example soil quality, as the increasing lengths of dry periods during vegetation season can diminish land use potential. Hence, this study focuses on the quality of the soil resource as possible limiting factor for land use intensification in southern Greenland. Physical and chemical soil properties of cultivated grasslands, reference sites and semi-natural birch and grassland sites were examined to develop a soil quality index and to identify the suitability of soils for a sustainable intensification and expansion of the agriculture. The study revealed that soils in the study area are generally characterized by a low effective cation exchange capacity (CECeff) (3.7 ± 5.0 meq 100 g−1), low pH CaCl2 (4.6 ± 0.4) and low clay and silt content (3.0 ± 1.0% and 38.2 ± 4.7%, respectively). Due to the high amount of coarse fraction (59.1 ± 5.8%) and the low amount of soil nutrients, an increasing threat of dry spells for soils and yield could be identified. Further, future land use intensification and expansion bears a high risk for concomitant effects, namely further soil acidification, nutrient leaching and soil degradation processes. However, results of the soil quality index also indicate that sites which were already used by the Norseman (980s–1450) show the best suitability for agricultural use. Thus, these areas offer a possibility to expand agricultural land use in southern Greenland.
1. Introduction
Agriculture in subarctic latitudes is characterized by a cool and short growing season. Thus, the agricultural use consists mostly of cool season forage and vegetable crops, small grains, raising cattle, sheep, goats, pigs and poultry, as well as reindeer herding [1]. Consequently, agriculture in these areas is of a relatively small economic relevance. Nevertheless, climate change is projected to improve the potential of growing forage crops and thus raising animals [1].
Since 1960, the rate of warming in northern latitudes has been two to three times higher than the global average [1] and future climate change is expected to be more pronounced than in other regions [1]. For southern Greenland, climate models predict a temperature increase of 3–6 °C for the next 100 years [1]. The Danish Meteorological Institute (DMI) modeled a lengthening of the growing season of approximately two months until 2100 [2]. Despite the ecological restrictions, Greenlandic agriculture has already experienced an enormous intensification during the last decades, e.g., by tillage of fodder fields and application of industrial fertilizers [3,4]. This trend is expected to grow further over the next century as climate warming is anticipated to increase the length of the growing season and productivity [4].
Southern Greenland offers a historic perspective on land use and climate change. During the medieval climate optimum, the Norse settlers (985–1450) practiced animal husbandry in this region. The settlement by the Norse farmers, however, ended ultimately with their complete disappearance. Literature suggests different reasons for the abandonment of the Norse settlements, for example the worsening of climatic conditions [5] or the overexploitation of land resources as grazing pressure exceeded the resilience of the landscape and pasture economy failed [6,7]. The at least partially environment-induced failure of the Norse highlights the importance of developing sustainable land use today.
“Re-colonialization” of Greenland took place in 1771, when Denmark–Norway sent a missionary expedition to Greenland [8] and permanent settlement and land use in South Greenland was resumed. During the 18th and 19th century, land use was practiced only for self-sufficiency with few domestic animals kept close to settlements [9]. Modern sheep farming in southern Greenland began after 1915 [9] and can be subdivided into two management phases. Sheep were first kept grazing outside for the whole year [10]. After some harsh winters in the 1960s and 1970s, when many sheep starved to death, a new management plan was introduced in 1982, following a pattern of seven months of barn feeding and 5 months grazing on outlying fields [9]. Barn feeding required hay production for winter fodder and the area used for haying increased steadily from 70 ha in 1980 [10] to 780 ha in 2001 to currently 1081 ha [11]. At the same time, the number of sheep owners decreased from 95 in 1982 to 48 in 2008 [12].
Agriculture in Greenland actually encompasses primarily livestock breeding of sheep. According to the Greenlandic Statistics for 2013 [13], 43 farms operated with agriculture as their primary source of income based on sheep farming with roughly 46,000 sheep, about 20,000 ewes and 26,000 lambs, which graze during the summer and are slaughtered in autumn. Grazing land included 242,000 ha, while areas used for hay production accounted for 1081 ha in 2013 [13]. The agricultural sector accounts for only about 0.1% of total export of goods [11]. To augment the agricultural exports, Greenland aims at increasing the number of sheep by fostering hay production and grazing capacity [3]. In addition, the future potential for commercial vegetable production in southern Greenland has recently been celebrated in several popular media and functions as a symbol for climate change. Carrying headlines include “Global Warming a Boon for Greenland’s Farmers” [14] or “Farming to the fore as Greenland ice thaws” [15]. However, Greenlandic agriculture is far from self-sufficiency. In 2007, Greenland imported 1000 t sheep fodder, corresponding to 40–50% of the winter fodder [16]. An additional 600 ha of hayfields would be necessary to reach self-sufficiency in feeding the current number of ewes during winter [17]. This corresponds to an increase of 55% of the area that is used nowadays. The Agricultural Consulting Service states that efforts should therefore focus on the expansion of cultivated land in the coming years [17]. Another possibility for increasing the autonomous sheep food supply would be a further raise in the yield per area using fertilizers. According to the Greenlandic government, Greenlandic agriculture already applied 600 to 700 t of industrial fertilizer on an area of about 1000 ha in 2007 [16]. Literature indicates a yield range between 2000 and 2500 FE ha−1 (1 FE = nutrition value of 1 kg barley [18]) in the years 2000–2007 [17,19,20]. Comparing the yield in 1994 (1420 FE ha−1) to the yield in 2007 (2100 FE ha−1) [19], the increase can be interpreted as a reaction to the increasing application of fertilizers. However, newer numbers of the Greenlandic Agriculture Commission [18] highlight a significant decrease in yields during the last decade with 2100 FE ha−1 in 2007, 1000 FE ha−1 in 2010, 1800 FE ha−1 in 2011 and 1500 FE ha−1 in 2012, respectively. According to the Greenlandic Agriculture Commission [18], the decrease in yield is caused by the increasingly dry summers, especially in the more protected areas of the inner fjords. Thus, the question arises of whether the prospected increase in temperature and growing season has the potential to strengthen the agricultural sector in Greenland.
Westegaard-Nielsen et al. [21] modeled the potential aboveground biomass production for sheep farming in southern Greenland until 2100 based on predicted climate change. Their results indicate an increase of biomass, suitable for increasing livestock breeding. However, the modeled increase in future biomass production is based on using air temperatures only. The authors stress that soil nutrients and plant available water are two main components that need to be included in precise assessments of future plant growth. Thus, the question arises whether the increase of temperature and the prolonged growing season actually contribute to the expansion of farming. Furthermore, climate change does not necessarily imply steadily increasing temperatures and length of growing season. On the contrary, variability in temperature, but also in precipitation patterns, for example an increased length of summer dry spells, have to be considered [2].
Finally, agriculture in the pristine landscape of southern Greenland is not without consequences for ecosystem stability [4]. Unsustainable land use can affect ecosystem functions in several ways, as for example soil degradation by loss of organic matter, salinization, compaction, structural destruction, sealing, contamination or acidification [22]. Consequently, inappropriate land use can compromise the maintenance of further productivity [22]. According to Doran and Parkin [23], soil quality assessment is therefore essential to determine the sustainability of land management systems in the near and distant future. The definition of soil quality and thus the suitability of soils for sustainable agricultural use has long been a challenging issue, since soils are highly variable in properties, characteristics and functions [22,23]. To define the capacity of soil systems for a sustainable intensification and for preventing concomitant effects of agricultural use, indicators for soil quality are needed [24]. Indicators should designate the resilience of soil against physical, chemical and biological disturbances [24] and thus provide information about the ability of the soil to provide essential environmental services [22]. They should be easy to measure and provide evident information on ecosystem functioning and productivity [22]. Thus, soil quality indicators should not only identify the condition of the soil resource, but also define the economic and environmental sustainability of land management practices [25].
The main goal of this study is to answer the question whether the proposed intensification of agricultural use following climate warming in southern Greenland is possible and sustainable considering the soil resources. Specifically, the study will examine the hypothesis whether plant available nutrients and plant available water limit the potential for a sustainable intensification and expansion of agriculture in southern Greenland. To achieve this aim, the study will examine the impact of agriculture on soil and landscape ecology by identifying concomitant effects on the soil resource. A key outcome is the identification of areas which are most suitable for a sustainable land use intensification and expansion based on an integrated soil quality index (SQI).
2. Material and Methods
2.1. Study Area
The study on the potential for land use expansion and intensification in southern Greenland took place in the area of Igaliku (60°59′27″ N, 45°25′9″ W) between the head of Igalikup Kangerlua (Einar’s Fjord) and Tunulliarfik fjord (Erik’s Fjord) (Figure 1). The study area was chosen due to its long land use history, its good accessibility and due to existing contacts to local farmers. The study area is one of 15 regions in southern Greenland where sheep farming is practiced. Hay making area, as well as sheep number in the study region account to approximately 10% of the total area and sheep number in southern Greenland. Due to its location in the inner fjords, the region is climatically more favorable than other regions; however, precipitation during vegetation period can be scarce compared to other regions [26]. In addition, soils conditions on selected protected areas of the inner fjords show to be more favorable for agricultural use than in the outer fjords and less protected areas [3].
Geologically, the Ketilidian basement, which was formed 1850–1725 million years ago, consists of granitic rocks of the Julianehåb batholith, which is partly overlain by Gardar sandstone sediments and lavas with outcrops of basaltic magmas and the intrusion of early dyke swarms [27]. Mean annual precipitation for the climatological standard normal 1961–1990 at closest meteorological station in Narsarsuaq is 615 mm. Mean annual temperature is 0.9°, with means of 10.3 °C in July and −6.8 °C in January [28]. The climate is thus subarctic because the mean temperature of the warmest month is above 10 °C [29]. On average, the number of growing days (≥5 °C) in Narsarsuaq was 138 days during the standard period 1961–1990. The mean number of growing days increased to 146 days for the period 1991 to 2010. The occurrence of dry winds from the Icecap called foehn [26], as well as the high variability in summer precipitation [2,26] can cause prolonged dry periods during vegetation period [2,26]. According to the Greenlandic Agricultural Consulting Service [3], both prolonged dry periods and increasing number of intensive rainfall events have been observed during the last decade.
Vegetation is characterized by local willow and birch copses at lower elevations. On less protected areas dwarf-shrub willow heath (Salix glauca) and an understorey of herbs as clustered lady’s mantle (Alchemilla glomerulans) can be found [29]. Above the altitudinal limit of willow heath, depending more on microclimatic and soil conditions than on defined altitudes, vegetation is characterized by wind exposed, largely open fjell fields. Species include dispersed and low growing patches of lichens, dwarf shrubs like arctic willow (Salix arctica) and common juniper (Juniperus communis), and grasses, such as wood-rush (Luzula confusa) and moss campion (Silene acaulis) [29,30]. Natural grassland slopes are dominated by different species (Anthoxanthum odoratum, Deschampsia flexuosa and subordinated Alchemilla alpina), moist fens with sedges and different species of peat mosses (Carex rariflora, Eriophorum scheuchzeri, and Sphagnum sp.) are frequent but cover limited area due to topography [29,30]. Furthermore, cultivated grassland can be found. According to Daniëls [31], vegetation of cultivated hay fields and pastures in southern Greenland most likely belongs to the class of Molinio-Arrhenatheretea, a.o. red fescue (Festuca rubra), common sorrel (Rumex acetosa), dandelion (Taraxacum officinale) and meadow buttercup (Ranunculus acris). The weed vegetation of arable fields around Igaliku consists mainly of seedmixes with high amount of timothy grass (Phleum pratense). Daniëls [31] concludes, that vegetation communities on farmed land in southern Greenland mainly correspond to the typical communities for the European cultural landscapes.
Soils in southern Greenland are generally described as acidic with low amount of nutrients and limited capacity to store water [3]. However, on protected areas in the inner fjords, brown earth can be found [3]. According to Feilberg [29], generally Brown earth and Podzols occur in densely vegetated areas, while shallow Syrosems and Rankers developed where vegetation is scattered or constitutes just a continuous cover.
Igaliku has long been recognized as the historic site of Gardar, the seat of the bishop of the Norse settlements in Greenland during the Middle Ages (986 to 1450) and has already experienced intensive agricultural use during this period [4,32,33]. The current settlement of Igaliku has been established in 1782 by the Norwegian colonist Anders Olsen, whose family subsisted on few domestic cattle and sheep [32]. Population ranged between 35 and 50 inhabitants during the last 20 years [34]. In 2011, 2100 sheep were kept at five farms in and around Igaliku [34]. For winter fodder production, a total area of about 115 ha was managed by the five farmers [3]. The areas used for hay production are common land, but assigned for management to individual farmers. They are located at a relatively low elevation (max. 75 m a.s.l., mean 28 m a.s.l.) between hills reaching 300 m a.s.l. and surrounded by mountains with elevation of up to 1800 m a.s.l.
2.2. Sampling Setup
To assess the potential of agricultural intensification and expansion, as well as the impact of land use, chemical and physical soil parameters of agricultural fields around Igaliku, were sampled. In total, 87 ha of agricultural land, farmed by four participating farmers, was studied (Figure 1). In 2013, the participating famers kept 1400 mother sheep, which are fed through the winter. The fields of Farms 3 and 4 are managed by the same farmer, but the fields of Farm 4 are allocated more south. For each Farm, 1–2 reference sites (9 in total) were sampled next to a representative agricultural field (in the following called agricultural reference sites). Furthermore, seven birch areas and six grassland areas in the northeast of the study site were sampled as additional reference sites (Figure 1). These areas represent the natural vegetation associations at the subarctic ecotone border [29]. However, sites were characterized as semi-natural as there is evidence for pastoral activities. The characteristics of the sampling sites are summarized in Table 1.
2.3. Soil Sampling and Analysis
Sampling on the agricultural fields was performed on the resolution of field size according to the map of agricultural fields provided by the Agricultural Consulting Service in Qaqortoq (Figure 1). The fields were selected to ensure that all variabilities in topographic parameters and crops were represented. Sampling took place within or shortly after the yearly harvest at the end of July 2014. Soil samples were taken on 44 agricultural fields as composite sample of 15 to 25 cores, which were randomly taken all across the field by a hand auger reaching rooting depths of 30 cm. On reference sites, soils were predominantly very shallow and reached only around 30 cm. Same sampling depth for all the soils was chosen to compare the results. Additionally, three soil samples were taken by a metal cylindrical core of 100 cm3 volume and 5 cm length at 12–17 cm on each field to determine soil bulk density and coarse fraction. Reference sites were sampled likewise within a 10 m × 10 m area (see Table 1).
Soil analysis results refer to concentration per area using the volumetric basis calculated by bulk density of the fine earth fraction <2 mm and investigated soil depth. Precise information on the soil processing and analysis, as well as the reasons for parameter selection is given in Table 2. To extrapolate the measurements of the 44 agricultural fields to the surrounding fields, the topographic parameters (angle, orientation, position and form of the slope), parent material and crop were mapped according to the FAO Guidelines for soil description [35] for all sampling sites and on further 76 agricultural fields. Soil quality of the agricultural fields was evaluated considering single indicating parameters as well as using an overall soil quality index (SQI).
2.4. Soil Quality Index (SQI)
To identify the most significant variables to calculate the soil quality index (SQI) that best represents the soil functions associated with sustainable land use intensification, a minimum dataset (MDS) of parameters is needed to avoid redundancies of the parameters [44]. According to a review by Zornoza et al. [22], the most common parameters used to calculate an index for soil quality were pH, electric conductivity (EC), soil organic carbon (Corg), total nitrogen (Ntot) and available P. Other indicators such as nitrate (NO3−-N), ammonium (NH4+-N), exchangeable cations (Naex, Kex, Caex, Mgex), bulk density (BD), texture and available water content have, according to Zornoza et al. [22], also been used by various authors. The MDS used to calculate the SQI in this study was selected using principal component analysis (PCA). PCA is a way to reduce the dimensionality of a data-set while limiting the loss of information [44]. The PCA for the presented study was performed on the analyzed 16 chemical and physical soil parameters, using SPSS statistic package (IBM 24.0). The mineralized Nitrogen (Nmin-N) was not included, because values of Nmin-N cannot be used as soil quality index for crop growth for the following growing period. The reduction of the number of components was obtained using the eigenvalue-one criterion; only PCA’s with an eigenvalue >1 [45], that explained at least 5% of the total variance and had loadings <0.4 [46] were selected. The PCA output is summarized in Table 3. To avoid inter-related variables among the indicators in one PCA, that could have remained within the variables explaining the 5% in the total variance, correlation among the indicators was examined [47]. Variables were determined as redundant if the correlation coefficients in between the variable of the PCA were higher than R2 = 0.65; given the case, the higher ranked variable was kept in the MDS.
The SQI is used for synthesizing the information of the measured indicators based on scoring different soil indicators to estimate the agricultural suitability of the sampled area. Measured values are transformed into unit-less values, so that scores may be combined to form a single value. Thus, the selected parameters were subdivided into different groups to assign different functions representing the best soil functionality of the parameter (Table 3). The groups are: (i) the more the better; (ii) the less the better; and (iii) optimal value. The data for the chosen parameters were ranked by linear scoring technique [43,51]. All the values of one variable were ranked with a score ranging from 0 to 1 applying the three functions. If the best soil functionality was associated with high values, highest score was given for the highest value, if best soil functionality was associated with low values, the highest score was given for the lowest value, remaining values were scored based on their percentage of the highest value. If the best soil functionality was associated with an optimal value highest score was given for the value closest to the optimal value. After ranking, SQI was calculated by summing scores of each indicator and dividing the result by the total number of indicators [43,52]. Ranking of available P was performed using the data not based on volumetric recalculation, but on measured concentrations to apply the classification system developed by Agroscope for the Swiss agricultural research agency [49], which also takes into account humus and clay content of the sample. The nutrients classification of Agroscope was chosen because it is also applicable to alpine soils, whose development is comparable to southern Greenlandic soils. As thresholds depend on geographic regions, the soil quality index can only be used locally to compare the quality differences within the fields of different farmers, differences to agricultural reference sites, semi-natural birch areas and grasslands. Visual classification of the scores was performed by geometrical intervals (ArcGIS 10.2).
3. Results and Discussion
3.1. Suitability of the Sampled Fields for Agricultural Use
The major concern for the intensification and expansion of agricultural use can be identified in the low nutrient status of the soils (Table 4). The sandy texture (Table 5) and the acidic parent material of the soils (Table 4) limit nutrient retention, thus soils cannot buffer natural and management induced pH changes, which leads to further nutrient leaching and a further decrease of the pH-value. A low pH affects plant availability of macronutrients, especially P, Ca and Mg, but also K and N [50]. The process of nutrient leaching due to acid soil conditions is also indicated by the significant lower Ca and Mg levels on agricultural sites compared to the semi-natural reference sites (Table 4). The unsuitable nutrient status is also shown by the low effective cation exchange capacity (CECeff) and the low base saturation (BS) (Table 4), both indicating a low nutrient saturation. The analysis of CECeff revealed very low values on Farms 1, 2 and 5, as well as on the semi-natural birch and grass sites. Farms 3 and 4 showed a median CECeff of 12.4% and 6.5%, respectively. However, on Farm 4, the exchangeable sodium percentage (ESP), expressed in Naex, contributed with median 11.5% to the CECeff, while on Farm 3, 6.2% of the CECeff derived from Na-cations. According to Scheffer et al. [39], the percentage of Naex on the CECeff on slightly acidic soils in humid climate normally accounts to only <2%. Thus, the measured Naex on Farms 3 and 4 show overproportional percentages on CECeff. However, excluding Naex-cations for the CECeff calculation, the CECeff was still significantly higher on Farms 3 and 4 than on the remaining farms.
According to the nutrient classification of Swiss Agroscope [49], the amount of P (Table 4) is particularly poor for most of the sampled sites, illustrating that P represents a limiting factor. K levels (Table 4) showed generally a higher nutrient status, and all agricultural fields were classified as “sufficient”, “stocked” and “enriched”, except for Farm 5 where only 20% of the fields showed “sufficient” K concentrations. No significant K differences were found between the reference and farmed sites.
Comparing the autumn nutrient status (P2O5, K2O) to the economically optimal nutrient range for seeded grasslands, i.e., yield compared to the need of fertilizer application [53], we can conclude that only the fields of Farm 3 have an economically feasible nutrient condition (Figure 2).
A possibility to adapt land use to the unsuitable soil conditions could also be reached by cultivating plant species which are more adapted to the soil conditions. The Agricultural Consulting Service is currently running experiments with various perennial types of grasses for the production of hay and silage [3].
The second major concern for land use intensification is related to climate variability and can be found in reduced plant available water. Due to mostly sandy texture (Table 5) of the soils, with insignificant amounts of clay (Table 5), and due to the high coarse fraction in some soils (Table 5), the water holding capacity is generally low. Archeological evidence of irrigation channels in Igaliku illustrates that the Norseman faced the challenge of limited water availability already [32,54]. The risk of dry soils for agricultural production is also mentioned by Christensen [55] who also pointed out that agricultural use should concentrate on moist depression zones not prone to drought during periods without rain. According to the Agricultural Consulting Service [3], the high variability of annual weather conditions, including the lack of rainfall during the growing season, represents a major concern for expanding agriculture. Water availability during growing season (May–September) is already very limited because only approximately half of the mean annual rainfall of 615 mm (1961–1990) at Narsarsuaq station falls during the growing season [28]. According to Hansen [26], precipitation in the inner fjords can be as low as 110 mm during the growing season in dry years. Katabatic dry winds emanating from the ice cap are a characteristic of the region and can persist for many days [56]. The dry winds result in an evapotranspiration of up to 16 mm day−1 and can lead to drought stress for the vegetation [26]. Adderley and Simpson [56] modeled soil chemical, physical and soil-water hydraulic properties for two study sites near the eastern settlement, in Qassiarsuk and Tasersuaq about 20 km northwest of Igaliku and concluded that there is a frequent requirement for irrigation, both currently and during the Norse settlement period. Recent press communications underline the threat of droughts. In 2008, for example, the 50% reduction in yield of hay and silage for sheep husbandry caused by the drought in southern Greenland was seen as a national problem [57], severe yield reduction due to dry summers continued in the years 2010, 2011, 2012 and 2015 [18,58,59]. The threat of dry growing seasons for fodder availability can even be more pronounced in the future as the Danish Meteorological Institute (DMI) modeled an increase in the lengths of dry periods (consecutive days with less than 1 mm precipitation) during the vegetation period [2]. According to the DMI, dry periods will last up to 10 days longer until 2081–2100 compared to the period 1991–2010 with its longest dry period of 20 days [2]. Another risk related to climate variability could be found in the high discrepancies of summer precipitation in southern Greenland from year to year but also within one summer [2]. As not only the length of dry periods but also the total amount of summer precipitation is expected to increase for 10% until 2081–2100 compared to the period 1991–2010 [2], this would infer heavier rainfall events. Considering the poor nutrient retention potential of the soils, such events would impose a high risk of nutrient leaching.
3.2. Impact of the Agricultural Use on Soil and Landscape Ecology
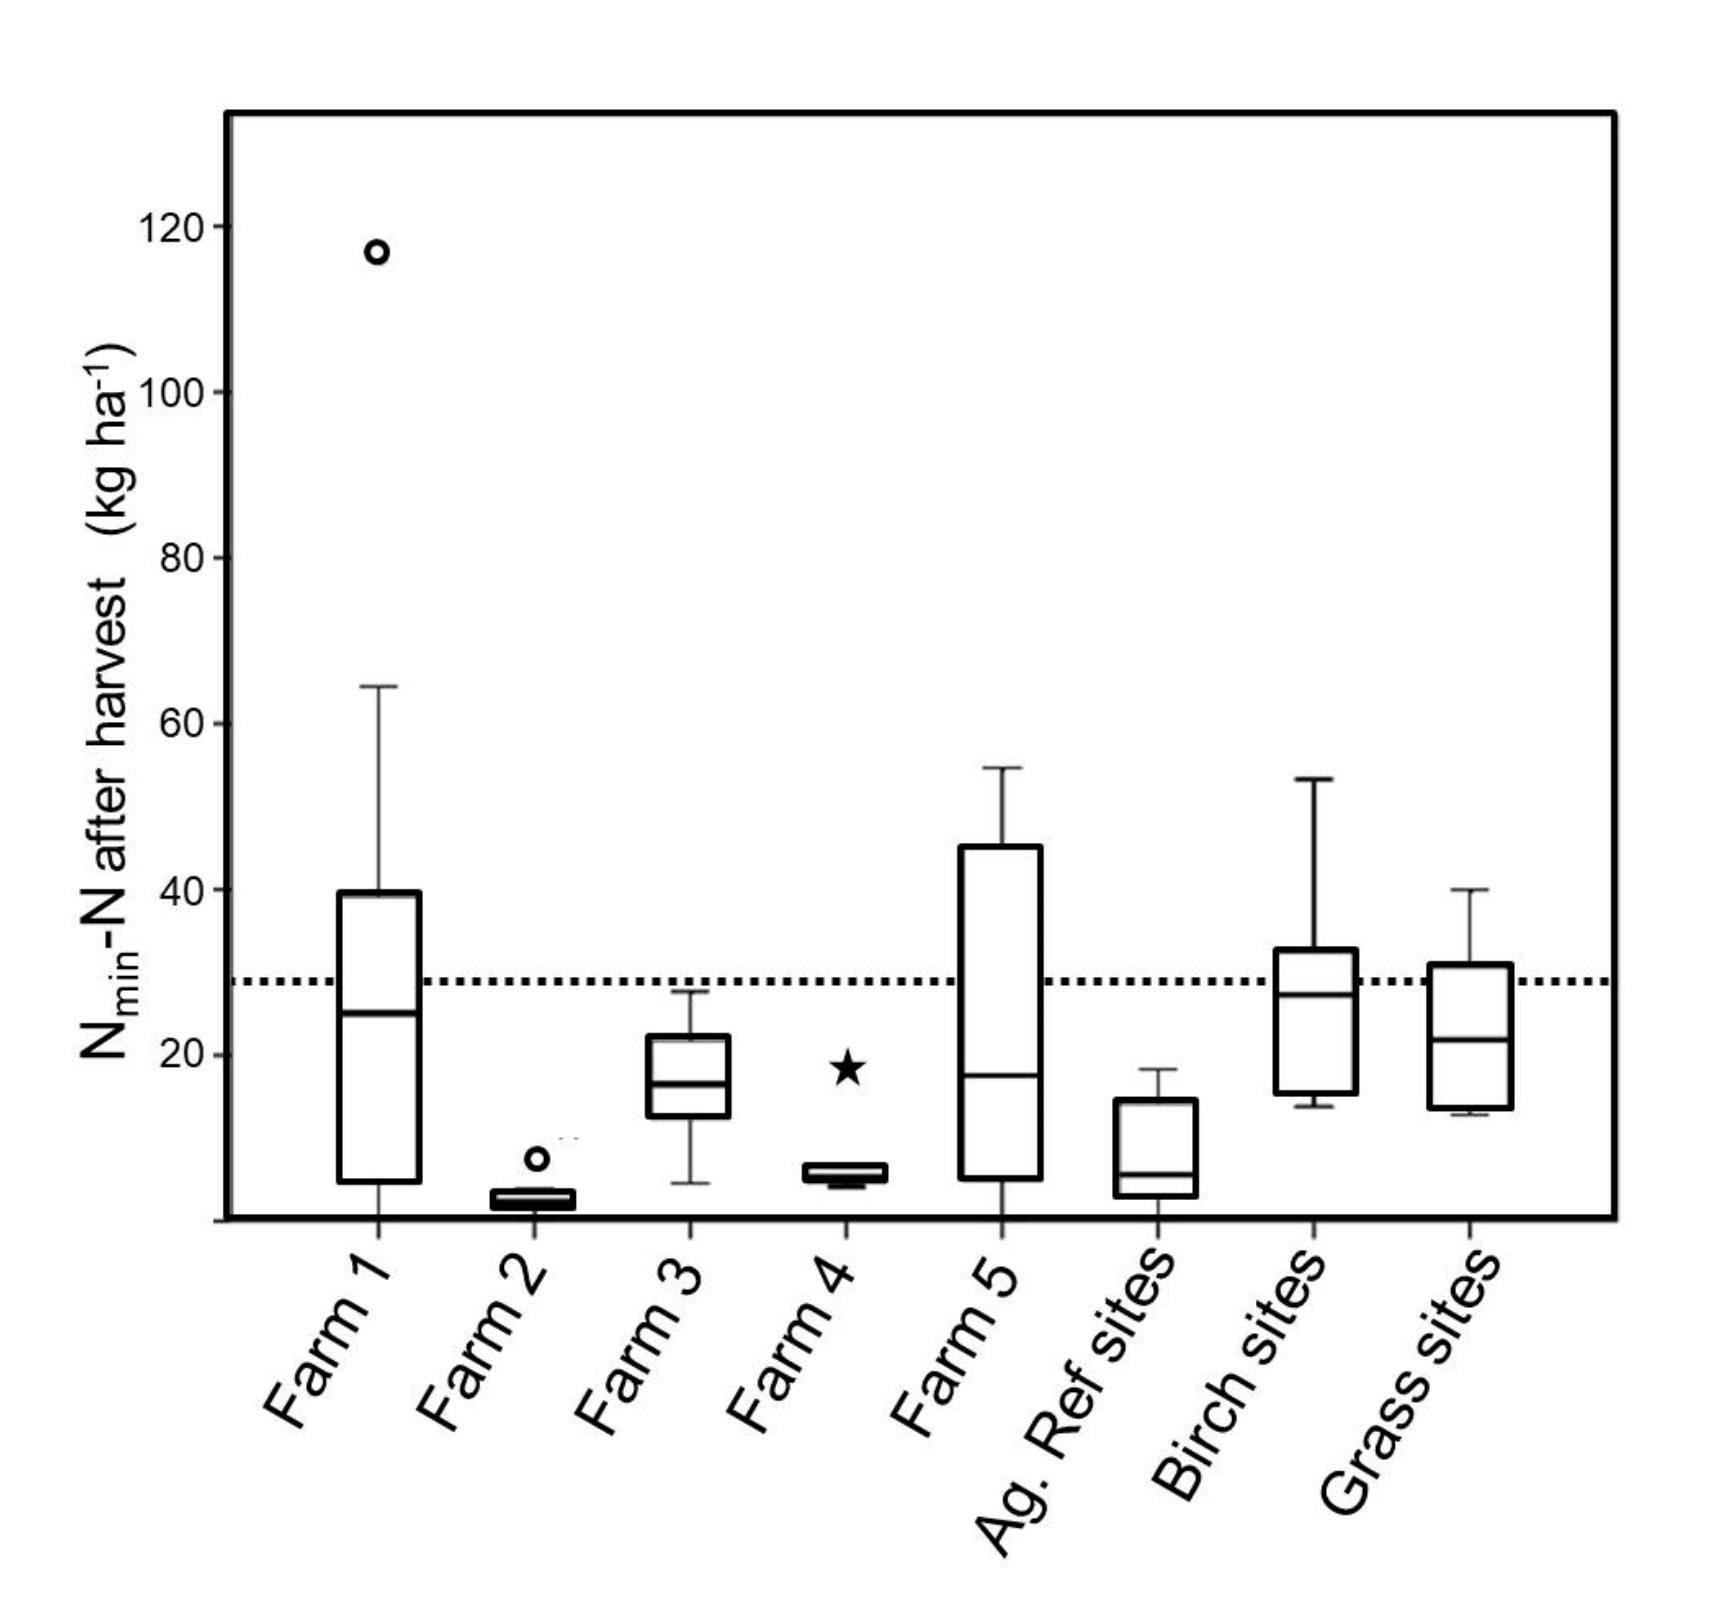
The comparison between farmed areas and reference sites already revealed that agriculturally-used areas show a significantly lower pH (CaCl2) compared to the reference sites (Table 4). Even though comparability of the values on farm level is limited, due to the low amount of reference sites for the single farms, a trend in the decrease of pH of the already acidic soils is still visible. The efficiency of applied fertilizers decreases with decreasing pH [60], highlighting another limitation of the soils for farming. The low pH (CaCl2) on the studied agricultural fields indicates high nutrient leaching, and thus waste of approximately 50 to 70% of the applied fertilizer [60]. The Nmin-N values after harvesting (Table 4) confirm the risk of nitrate leaching. Due to percolating water during autumn rainfalls, autumn Nmin-N soil values typically leach up to 100% on sandy soils and 30–70% on more cohesive soils [61]. Thus, Nmin-N after harvesting should not exceed 30 kg ha−1 [62] to prevent water bodies from eutrophication. Information on the amount of fertilizer added on the fields was not available, however the high Nmin-N values after harvesting, especially on Farms 1 and 5, indicate an inappropriate use of fertilizers (Figure 3). Confirming the leaching, a nutrient enrichment in the nearby Lake Igaliku (see Figure 1) has recently been identified by Belle et al. [63]. The study concludes that Lake Igaliku is in a worrying ecological state because of the disturbed nitrogen cycle, a loss of littoral biodiversity, and alterations of its trophic functioning [63].
The inappropriate use of fertilizer, especially if the fertilizer is not directly taken up by the plants, can increase the amount of H+ and thus lead to further leaching of nutrients [48]. Especially ammonium based fertilizers are known to affect soil pH by increasing soil acidity as the process of converting ammonium to nitrate in the soil (nitrification) releases H+ [48]. The high amount of H+ is thereby indicated by the very low base saturation (BS) on the sampled agricultural fields of Farms 1, 2 and 5 compared to the agricultural reference sites. Krøjer [64] as well as Høegh et al. [19] advise a more careful use of artificial fertilizers in the region, to prevent nutrient leaching and soil acidification. Soil acidification affects several soil processes, for example a lowered buffering capacity leading to further decrease in pH and more nutrient leaching. The hampered decomposition of litter leads to poor soil structure, root growth and microbial activity [65], which potentially reduces pore volume and water retention capacity. A reduced pore volume is also shown by higher bulk density values, which was found on Farms 1 and 5 (Table 5).
As described above, plant water availability will be a crucial parameter for agricultural use in the future, as the lengths and frequency of dry periods will increase [2]. Besides the given soil conditions and the already mentioned management induced processes which can negatively affect plant available water, a further process affecting water retention potential was detected in this study. The high percentage of exchangeable sodium (Naex) observed on fields of Farms 3 and 5 can affect aggregate stability, cause a decrease in permeability and reduce water infiltration ability [36,40]. Most likely the high amounts of Naex on Farms 3 and 4 are caused as soils were affected by seawater. This process is particularly conceivable for the fields of Farm 4 (median Naex 11.5%) (Table 4) which are situated adjacent to the sea. Another process contributing to the Naex enrichment may have been the use of seaweed as fertilizer during the Norseman period [66]. This enrichment process may have affected the fields of Farm 3 (median Naex of 6.2%) because they are situated in the village of Igaliku and were already used by the Norseman [4,32,33,67].
The analyses of the soil characteristics revealed two major processes, namely soil acidification and nutrient leaching, which both pose a risk for landscape ecology under land use intensification and expansion. However, more detailed information on fertilizer application, yield, sheep stock number, nutrient leaching into water bodies and a higher amount of reference sites providing a better comparability of unused and used areas on farm level would be needed to make a distinct estimation on the concomitant effects of land use in southern Greenland.
3.3. Identifying the Most Suitable Areas
Agriculture in south Greenland already affects soil—and landscape ecology. Consequently, it is necessary to identify areas which show suitable soil conditions for expansion and intensification to guarantee sustainable land use in the future. Applying the SQI by integrating the measured physical and chemical soil properties into one index, enables an overall assessment of the soil quality. SQI values for both reference sites and farms are shown in Figure 4. It is noteworthy that the fields belonging to Farm 3 show significantly (p < 0.01) the best soil quality, while the remaining farms with lower quality do not differ significantly amongst each other, the agricultural and the semi-natural reference sites.
Analyzing the pattern of the calculated SQI (Figure 5) reveals an interesting finding, which could help to identify suitable areas for agricultural use easily. According to the descriptions of Arneborg [32,68,69], who performed archeological studies in Igaliku, most of the fields of Farm 3 were already used by the Norseman. The fields represent the “inner fields” or “homefields” of the Norseman in Igaliku (Figure 5b) which were used for winter fodder production [32,68]. A few fields at Farm 3 (301/325 and 302) and the northernmost fields of Farm 4 (402 and 403), which lie outside the stonewall confining the “inner fields”, are close to former animal pens and have presumably been used as pasture [32]. This area coincides with the fields showing the highest soil quality index.
No evidence for agricultural use such as irrigation channels or ruins has been found on the fields of Farms 1, 2, 5 and the remaining fields of Farm 4 [32,68,69]. These areas, which have presumably not been used by the Norse, show a significantly lower SQI (Figure 4 and Figure 5). The SQI differences appear to provide evidence that the Norse settlements were situated on areas which were either suited best for agricultural use or were improved by the Norseman, e.g., by manuring or algae application. Thus, a possibility to expand agricultural land use in southern Greenland would be to concentrate the expansion on areas which were already used during the Norseman period, or at least on such sites that show similar geo-ecologic properties. Even though the present cultivated area far exceeds the area cultivated by the Norseman, there are still areas which were used by the Norseman that lie unused today [70].
3.4. Improvement of Soil Quality by Directed Measures
Soil acidification seems to be an obvious hindrance for a sustainable agriculture in southern Greenland. Liming acidic soils to balance acidification has already been recommended by Christensen, [55] and later by Krøjer, [64] and also by Høeg et al. [19]. Liming would also be indicated considering base saturation values (BS) (Table 4), which are classified, as “poor” or even “very poor” on all sampled fields [41]. Liming or the amendment of soluble soil calcium (gypsum) would also represent an accurate measure against sodic soils, which also affect the availability of plant water, replacing the sodium due to the more powerful electrical charge of gypsum [48]. Although the problem of soil acidification has apparently been identified several decades ago, our study as well as the literature [17,19,20] indicate that measurements to reduce it were not applied consequently.
The second problem, namely soil water supply during the growing season, could be addressed by irrigation systems, as used by the Norseman [32,54,68], to reduce the variability in yield production. Several irrigation channels were already reestablished for the farming area within Igaliku, corresponding to the fields of Farm 3, in the 1960s [68]. However, facing more pronounced dry periods in the future requires further measures like for example soil ameliorations, which enhance the ability to store plant available water for example by increasing soil organic carbon. Further, adaptions to the increasing length of dry periods could include cultivating plant species, which are more adapted to dry soil conditions.
A further issue concerning the adaption to climate variability and sustainable land use is the increasing size of the farms. According to Hayashi [12], the Greenlandic government introduced ordinances under the Home Rule Act of 1979, which made investments mandatory and thus made the small scaled sheep farming no longer viable. In the following, part-time farmers disappeared, while sheep flock size of the remaining farmers increased to keep their farms economically profitable. The number of sheep owners in Greenland decreased from 95 in 1982 (shortly after the Home Rule Act of 1979) to 48 in 2008 [12]. The Rambøll report states that a farmer needs at least 400 sheep to be able to make a living from it [11]. In contrast, in 1933, under self-sufficient side line farming, the number of sheep owners was 206, while flock size was mostly fewer than 100 sheep, the total number of sheep reached approximately 5000 [12]. The increasing farm size bears several risks. First, a bigger flock size infers higher use intensity than several small farms, because small farms are less centralized than one big farm. Big flock sizes also increase the risk of soil erosion, as land use, especially grazing may concentrate on smaller areas. Soil erosion due to overgrazing has been documented for several Norse settlements [7,10,33,67,71] and has also been mentioned as one of the reasons for the disappearing of the Norseman in 1450 [7,33]. Today, the increased sedimentation rate in Lake Igaliku (see Figure 1) during the 20th century indicates an increased soil erosion rate within the study area [67]. Small scale, decentralized farming, grazing regulations and smaller flock size could help minimizing soil erosion, but would require political action aimed at soil protection and subsidies providing incentives for a sustainable agriculture. Re-cultivation and expansion of agricultural use may also infer the readiness of farmers to live and establish themselves isolated and far away from the next inhabited area, and to adapt agricultural use on the given natural resources and climate variability by running a more diverse and small scaled agriculture.
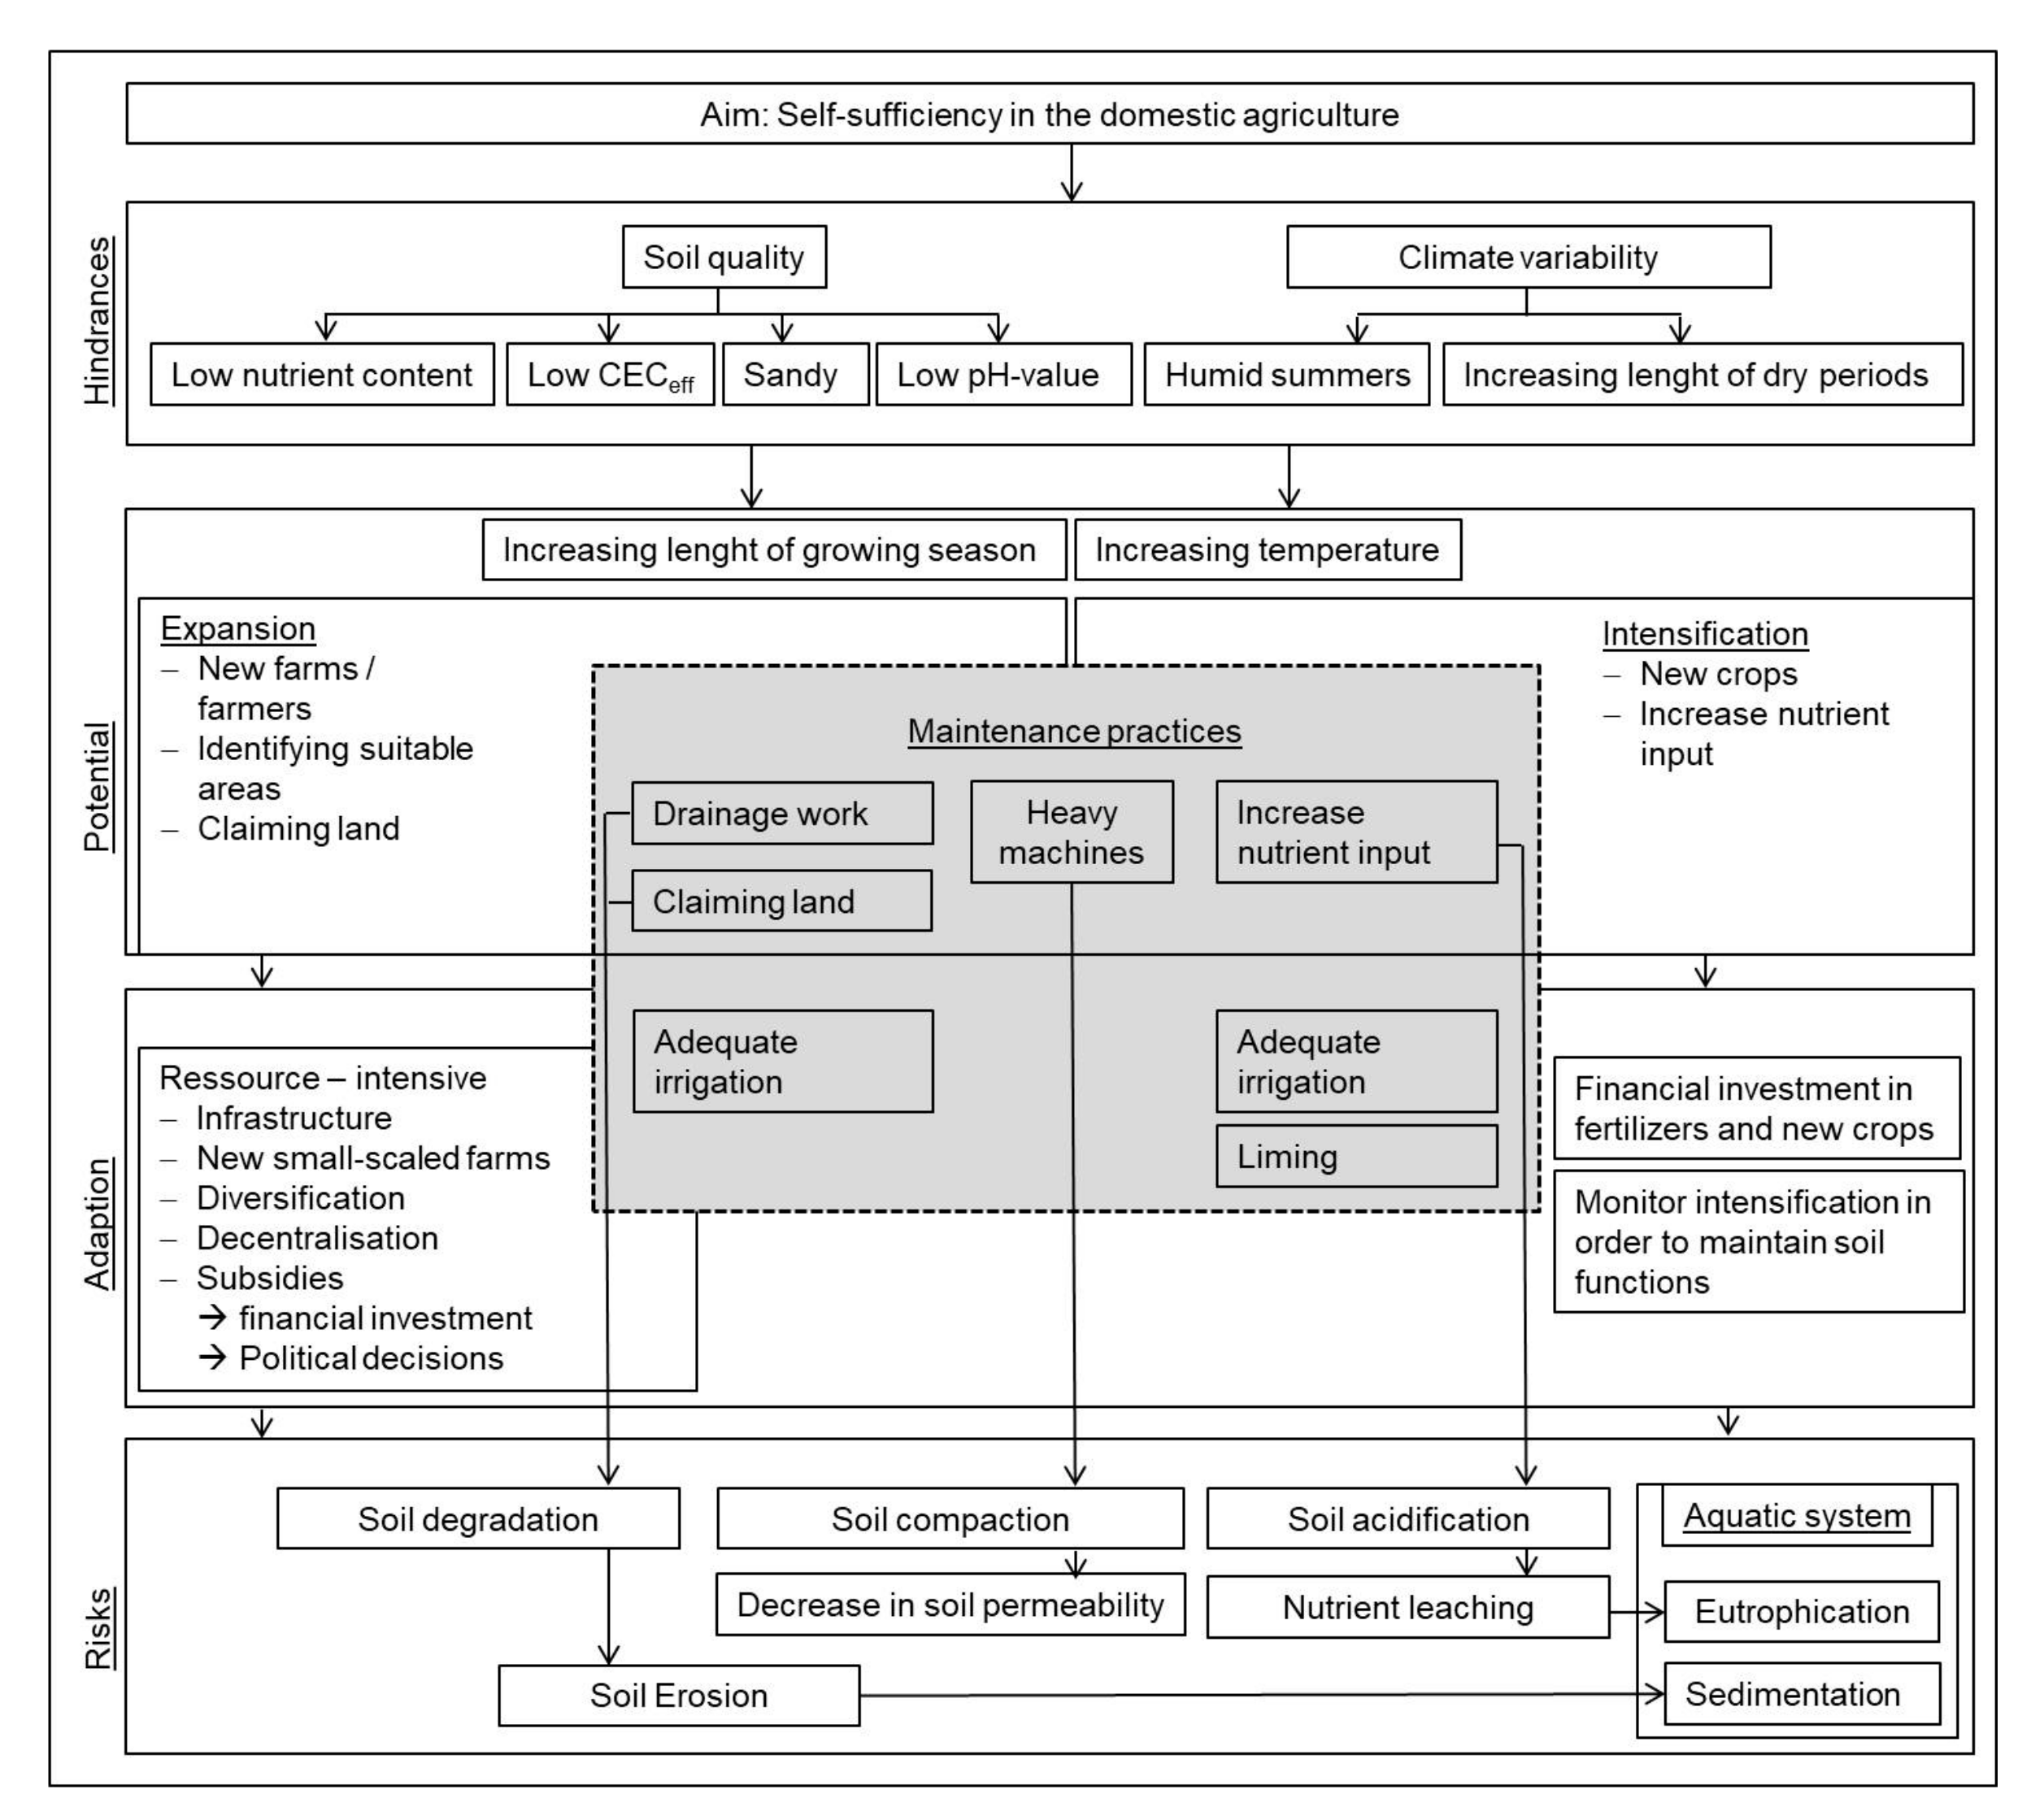
Figure 6 schematically summarizes the presented hindrances for future land use intensification and expansion given by the soil and climate conditions. Possibilities to increase the potential for an agricultural development as well as the adaptions needed to guarantee that the agricultural development is sustainable are also outlined in the diagram. Finally, it highlights the risks for landscape and soil ecology.
4. Conclusions
The study evaluated the conditions for agricultural land use in southern Greenland, focusing on the soil as the natural resource for food production. The results of this study illustrate three major findings. First, even though the study area around Igaliku is characterized by more favorable climate and partly more favorable soil conditions than other regions in southern Greenland, an increase of summer temperatures and the length of the growing season, does not automatically increase the potential for land use intensification and expansion. The main hindrance to expand or intensify agricultural use is given by the low nutrient status and the unsuitable soil texture, which affects the ability of soil to store water and nutrients. On the contrary, climate change with increased lengths of dry periods poses new risks for yield production, especially due to the mentioned unfavorable soil texture.
However, the SQI shows that, even though soil characteristics in general are not favorable, there still can be found areas that provide better possibilities for land use expansion. In the study area, these areas corresponded to those sites which were already used by the Norseman (980s–1450 AD). In the context of sustainable landscape ecology, it seems to be essential to focus land use expansion on areas that were used in medieval times.
Finally, the study revealed two major risks which can affect landscape ecology. The analysis showed a trend for soil acidification on the already acidic soils. Furthermore, the unfavorable soil texture poses a risk for nutrient leaching. To ensure a future sustainable land use, these two major problems should be addressed.
Acknowledgments
The authors want to express appreciation for the help of the students Helena Barth, Tabea Baumgartner, Alexandra Diesslin, Guy Doerfel, Lisette Kaufmann, Nicole Notter and Oliver Zoller, participating in the field course in southern Greenland, the help of the participating farmers as well as the help of Ruth Strunk assisting the laboratory analysis. Furthermore, the authors want to thank the Tomcik foundation and the “Freiwillige Akademische Gesellschaft Basel“, for financially supporting the field campaign. The authors also thank the “Departementet for Erhverv, Råstoffer og Arbejdsmarkt” of the Greenlandic Government for providing research permission.
Author Contributions
C.C., M.H. and N.J.K. conceived and designed the experiments; C.C. and M.H. performed the field research and the data analysis; N.J.K. contributed materials and analysis tools; and C.C. wrote the paper. All authors critically commented on the manuscript.
Conflicts of Interest
The authors declare no conflict of interest. The founding sponsors had no role in the design of the study; in the collection, analyses, or interpretation of data; in the writing of the manuscript, and in the decision to publish the results.
References
- Hassol, S.J. Impacts of a Warming Arctic: Arctic Climate Impact Assessment; Cambridge University Press: Cambridge, UK; New York, NY, USA, 2004; ISBN 978-0-521-61778-9. [Google Scholar]
- Christensen, J.; Olesen, M.; Boberg, F.; Stendel, M.; Koldtoft, I. Fremtidige Klimaforandringer i Grønland: Kujalleq Kommune; Videnskabelig Rapport 15-04 (1/6); Danmarks Meteorologiske Institut: København, Denmark, 2016. [Google Scholar]
- Greenland Agricultural Consulting Service. Available online: http://www.nunalerineq.gl/english/landbrug/index-landbrug.htm (accessed on 2 March 2016).
- Bichet, V.; Gauthier, E.; Massa, C.; Perren, B.; Richard, H.; Petit, C.; Mathieu, O. The history and impacts of farming activities in south Greenland: An insight from lake deposits. Polar Rec. 2013, 49, 210–220. [Google Scholar] [CrossRef]
- Dugmore, A.J.; Keller, C.; McGovern, T.H. Norse Greenland Settlement: Reflections on Climate Change, Trade, and the Contrasting Fates of Human Settlements in the North Atlantic Islands. Arct. Anthropol. 2007, 44, 12–36. [Google Scholar] [CrossRef]
- Edwards, K.J.; Schofield, J.E.; Kirby, J.R.; Cook, G.T. Problematic but promising ponds? Palaeoenvironmental evidence from the Norse Eastern Settlement of Greenland. J. Quat. Sci. 2011, 26, 854–865. [Google Scholar] [CrossRef]
- Fredskild, B. Erosion and Vegetational Changes in South Greenland Caused by Agriculture. Geogr. Tidsskr.-Dan. J. Geogr. 1992, 92, 14–21. [Google Scholar] [CrossRef]
- Sørensen, A.K. Denmark-Greenland in the Twentieth Century (Vol. 341); Museum Tusculanum Press: Copenhagen, Denmark, 2007; ISBN 978-87-635-3070-5. [Google Scholar]
- Austrheim, G.; Asheim, L.J.; Bjarnason, G.; Feilberg, J.; Fosaa, A.M.; Holand, Ø.; Høegh, K.; Jonsdottir, I.S.; Magnusson, B.; Mortensen, L.E.; et al. Sheep grazing in the North-Atlantic region—A long term perspective on management, resource economy and ecology. Rep. Zool. Ser. 2008, 3, 1–82. [Google Scholar]
- Jacobsen, N.K. Studies on soils and potential for soil erosion in the sheep farming area of south Greenland. Arct. Alp. Res. 1987, 19, 498–507. [Google Scholar] [CrossRef]
- Rambøll Management Consulting. Where Can Development Come From? Potentials and Pitfalls in Greenland’s Economic Sectors towards 2025; Rambøll Management Consulting: Copenhagen, Denmark, 2014; p. 65. Available online: http://download.ramboll-environ.com/ramboll/Greenpeace-report.pdf (accessed on 29 February 2016).
- Hayashi, N. Incorporating Climate Change Remedies into Community Development in Greenland. In Cultural Dynamics of Climate Change and the Environment in Northern America; Sommer, B., Ed.; Climate and Culture; Brill: Leiden, The Netherlands; Boston, MA, USA, 2015; Volume 3, pp. 283–303. [Google Scholar]
- Ministry of Fisheries, Hunting & Agriculture, Greenland. Grønlands Statistik. 2014 Statistisk Årbog; Fiskeri, Fangst og Landbrug: Nuuk, Greenland, 2014; p. 36.
- Taufetter, G. Arctic Harvest: Global Warming a Boon for Greenland’s Farmers. Spieg. Online. 2006. Available online: http://www.spiegel.de/international/spiegel/arctic-harvest-global-warming-a-boon-for-greenland-s-farmers-a-434356.html (accessed on 2 March 2016).
- Pleitgen. Farming to the Fore as Greenland Ice Thaws. 2012. Available online: http://edition.cnn.com/2012/12/04/world/greenland-secrets/ (accessed on 11 July 2016).
- Ministry of Fisheries, Hunting & Agriculture, Greenland. Økonomisk. Analyse af det Grønlandske Landbrug; Ministry of Fisheries, Hunting & Agriculture: Nuuk, Greenland, 2008. Available online: http://naalakkersuisut.gl/~/media/Nanoq/Files/Publications/Fangst%20og%20fiskeri/DK/Udgivelser_EL_%C3%98konomisk%20analyse%20af%20det%20gr%C3%B8nlandske%20landbrug_april%202008_DK.pdf (accessed on 2 March 2016).
- Høeg, K.; Isaksen, E.; Frederiksen, A.; Hansen, H.; Poulsen, K.; Iversen, A.; Devisme, A. Årsberetning 2006/2007 fra Konsulenttjenesten for Landbrug. 2007. Available online: http://www.nunalerineq.gl/dansk/raad/aarsberet/Aarsberetning%202006%202007%20DK.pdf (accessed on 16 May 2016).
- Landbrugskommisionen. Landbrugskommissionens Betænkning; Landbrugskommisionen: Nuuk, Greenland, 2014; p. 110. Available online: http://naalakkersuisut.gl/~/media/Nanoq/Files/Attached%20Files/Fiskeri_Fangst_Landbrug/DK/2016/Final_Rapport%20landbrug%202014_Chair_DK_pdf.pdf. (accessed on 13 November 2017).
- Høegh, K.; Lund Stidsen, P.; Frederiksen, A.; Hansen, H.; Motzfeldt, N.; Gard, J.; Petersen, M. Årsberetning 2007/2008 fra Konsulenttjenesten for Landbrug. 2008. Available online: http://www.nunalerineq.gl/dansk/raad/aarsberet/Aarsberetning%202007%202008%20DK.pdf (accessed on 16 May 2016).
- Høegh, K.; Isaksen, G.; Frederiksen, A.; Hansen, H.; Poulsen, K.; Iversen, A.; Devisme, A. Årsberetning fra Konsulenttjenesten for Landbrug. 2006. Available online: www.nunalerineq.gl/dansk/raad/aarsberet/Aarsberetning%202005%202006%20DK.pdf (accessed on 16 May 2016).
- Westergaard-Nielsen, A.; Bjørnsson, A.B.; Jepsen, M.R.; Stendel, M.; Hansen, B.U.; Elberling, B. Greenlandic sheep farming controlled by vegetation response today and at the end of the 21st Century. Sci. Total Environ. 2015, 512–513, 672–681. [Google Scholar] [CrossRef]
- Zornoza, R.; Acosta, J.A.; Bastida, F.; Domínguez, S.G.; Toledo, D.M.; Faz, A. Identification of sensitive indicators to assess the interrelationship between soil quality, management practices and human health. Soil 2015, 1, 173–185. [Google Scholar] [CrossRef]
- Doran, J.W.; Parkin, T.B. Defining and assessing soil quality. Defin. Soil Qual. Sustain. Environ. 1994, 35, 3–21. [Google Scholar]
- Schiefer, J.; Lair, G.J.; Blum, W.E. H. Indicators for the definition of land quality as a basis for the sustainable intensification of agricultural production. Int. Soil Water Conserv. Res. 2015, 3, 42–49. [Google Scholar] [CrossRef]
- Doran, J.W. Soil health and global sustainability: Translating science into practice. Agric. Ecosyst. Environ. 2002, 88, 119–127. [Google Scholar] [CrossRef]
- Hansen, B.U. Satellite Monitoring of the Biomass Production in Southern Greenland. Geogr. Tidsskr.-Dan. J. Geogr. 1988, 88, 94–101. [Google Scholar] [CrossRef]
- Brooks, K. A tale of two intrusions—Where familiar rock names no longer suffice. Geol. Today 2012, 28, 13–19. [Google Scholar] [CrossRef]
- Hanna, E.; Cappelen, J. Recent climate of southern Greenland. Weather 2002, 57, 320–328. [Google Scholar] [CrossRef]
- Feilberg, J. A Phytogeographical Study of South Greenland, Vascular Plants; Commission for Scientific Research in Greenland: Copenhagen, Denmark, 1984. [Google Scholar]
- Madsen, C.K. Pastoral Settlement, Farming, and Hierarchy in Norse Vatnahverfi, South Greenland. Ph.D. Thesis, University of Copenhagen, Copenhagen, Denmark, 2014. [Google Scholar]
- Daniёls, F.J. A geobotanical impression of South. Greenland with some remarks on its “Boreal Zone.”. In In Proceedings of the Fifth International Workshop: Conservation of Arctic Flora and Fauna (CAFF) Flora Group. Circumboreal Vegetation Mapping (CBVM) Workshop, Helsinki, Finland, 3–6 November 2008; CAFF Technical Report No. 21. Talbot, S., Charron, T., Barron, T., Eds.; CAFF International Secretariat: Helsinki, Finland, 2010; pp. 85–94. [Google Scholar]
- Arneborg, J. Saga Trails-Brattahlid, Gardar, Hvalsey Fjord’s Church and Herjolfnesnes: Four Chieftain’s Farmsteads in the Norse Settlement of Greenland; The National Museum of Denmark: Copenhagen, Denmark, 2007. [Google Scholar]
- Perren, B.B.; Massa, C.; Bichet, V.; Gauthier, É.; Mathieu, O.; Petit, C.; Richard, H. A paleoecological perspective on 1450 years of human impacts from a lake in southern Greenland. Holocene 2012, 22, 1025–1034. [Google Scholar] [CrossRef]
- Kommune Kujalleq Kommuneplanen-Igaliku, Redegørelse og Delområder. Available online: http://kujalleq.odeum.com/download/pdf/da/14_igaliku_redegoerelse_og_delomraader.pdf (accessed on 20 July 2016).
- FAO. Guidelines for Soil Description, 4th ed.; Food and Agriculture Organization of the United Nations: Rome, Italy, 2006; ISBN 978-92-5-105521-2. [Google Scholar]
- Arshad, M.A.; Martin, S. Identifying critical limits for soil quality indicators in agro-ecosystems. Agric. Ecosyst. Environ. 2002, 88, 153–160. [Google Scholar] [CrossRef]
- Agroscope FAL Reckenholz. Schweiz. Referenzmethoden der Eidg. Landwirtschaftlichen Forschungsanstalten; Eidgenössische Forschungsanstalten FAL, RAC, FAW: Zürich, Switzerland, 1996. [Google Scholar]
- Sponagel, H. Bodenkundliche Kartieranleitung: Mit 41 Abbildungen, 103 Tabellen und 31 Listen; Bundesanstalt für Geow. und Rohstoffe: Hannover, Germany, 2005; ISBN 978-3-510-95920-4. [Google Scholar]
- Scheffer, F.; Schachtschabel, P.; Blume, H.-P. Soil Science, 1st ed.; Springer: Berlin, Germany, 2016; ISBN 978-3-642-30941-0. [Google Scholar]
- Amacher, M.C.; O’Neil, K.P.; Perry, C.H. Soil Vital Signs: A New Soil Quality Index (SQI) for Assessing Forest Soil Health; Department of Agriculture, Forest Service, Rocky Mountain Research Station: Fort Collins, CO, USA, 2007; pp. 1–12. [Google Scholar]
- Flisch, R.; Sinaj, S.; Charles, R.; Richner, W. Grundlagen für die Düngung im Acker- und Futterbau-Kapitel 7-10. Agrar. Schweiz 2009, 16, 32–49. [Google Scholar]
- Stevenson, F.J.; Cole, M.A. Cycles of Soil: Carbon, Nitrogen, Phosphorus, Sulfur, Micronutrients, 2nd ed.; Wiley: New York, NY, USA, 1999; ISBN 978-0-471-32071-5. [Google Scholar]
- Marzaioli, R.; D’Ascoli, R.; De Pascale, R.A.; Rutigliano, F.A. Soil quality in a Mediterranean area of Southern Italy as related to different land use types. Appl. Soil Ecol. 2010, 44, 205–212. [Google Scholar] [CrossRef]
- Armenise, E.; Redmile-Gordon, M.A.; Stellacci, A.M.; Ciccarese, A.; Rubino, P. Developing a soil quality index to compare soil fitness for agricultural use under different managements in the Mediterranean environment. Soil Tillage Res. 2013, 130, 91–98. [Google Scholar] [CrossRef]
- Kaiser, H.F. The Application of Electronic Computers to Factor Analysis. Educ. Psychol. Meas. 1960, 20, 141–151. [Google Scholar] [CrossRef]
- Wander, M.M.; Bollero, G.A. Soil Quality Assessment of Tillage Impacts in Illinois. Soil Sci. Soc. Am. J. 1999, 63, 961–971. [Google Scholar] [CrossRef]
- Qi, Y.; Darilek, J.L.; Huang, B.; Zhao, Y.; Sun, W.; Gu, Z. Evaluating soil quality indices in an agricultural region of Jiangsu Province, China. Geoderma 2009, 149, 325–334. [Google Scholar] [CrossRef]
- Western Plant Health Association. Western Fertilizer Handbook; Waveland Press: Long Grove, IL, USA, 2010; ISBN 978-1-57766-679-0. [Google Scholar]
- Flisch, R.; Sinaj, S.; Charles, R.; Richner, W. Grundlagen für die Düngung im Acker- und Futterbau-Kapitel 3-6. Agrar. Schweiz. 2009, 16, 6–31. [Google Scholar]
- Prasad, R.; Power, J.F. Soil Fertility Management for Sustainable Agriculture; CRC/Lewis Publishers: Boca Raton, FL, USA, 1997; ISBN 978-1-56670-254-6. [Google Scholar]
- Liebig, M.A.; Varvel, G.; Doran, J. A Simple Performance-Based Index for Assessing Multiple Agroecosystem Functions. Agron. J. 2001, 93, 313–318. [Google Scholar] [CrossRef]
- Andrews, S.S.; Karlen, D.L.; Cambardella, C.A. The soil management assessment framework. Soil Sci. Soc. Am. J. 2004, 68, 1945–1962. [Google Scholar] [CrossRef]
- Landwirtschaftskammer Nordrhein-Westfalen. Grunddüngung. mit Phosphat., Kali, Magnesium; Landwirtschaftskammer Nordrhein-Westfalen: Münster, Germany, 2015; pp. 1–4. Available online: https://www.landwirtschaftskammer.de/landwirtschaft/ackerbau/pdf/phosphat-kalium-magnesium-pdf.pdf (accessed on 10 July 2016).
- Edwards, K.J.; Schofield, J.E. Investigation of proposed Norse irrigation channels and dams at Garðar/Igaliku, Greenland. Water Hist. 2013, 5, 71–92. [Google Scholar] [CrossRef]
- Christensen, K.N. Grønlands jord under kultur. Tidskr. Grønl. 1953, 11, 407–413. [Google Scholar]
- Adderley, W.P.; Simpson, I.A. Soils and palaeo-climate based evidence for irrigation requirements in Norse Greenland. J. Archaeol. Sci. 2006, 33, 1666–1679. [Google Scholar] [CrossRef]
- De Neergaard, E.; Stougaard, P.; Høegh, K.; Munk, L. Climatic changes and agriculture in Greenland: Plant diseases in potatoes and grass fields. In Proceedings of the IOP Conference Series: Earth and Environmental Science, Copenhagen, Denmark, 10–12 March 2009. [Google Scholar]
- Dollerup-Scheibel, M. Borgmester Jørgen Wæver Johansen Efterlyser Hjælp til Trængte Landmænd. SermitsiaqAG Online. 2015. Available online: http://knr.gl/da/nyheder/landbruget-ramt-af-t%C3%B8rke (accessed on 7 July 2016).
- Hannestad, A. Tørke Hærger Grønlands Landbrug. Politiken. 2015. Available online: http://politiken.dk/oekonomi/gloekonomi/ECE2888287/toerke-haerger-groenlands-landbrug/ (accessed on 7 July 2016).
- Myers, R. The Basics of Chemistry (Basics of the Hard Sciences); Greenwood Press: Westport, CT, USA, 2003; ISBN 978-0-313-31664-7. [Google Scholar]
- Niedersächsisches Landesamt für Ökologie (NLÖ). Anwenderhandbuch für Die Zusatzberatung Wasserschutz: Grundwasserschutzorientierte Bewirtschaftungsmaßnahmen in der Landwirtschaft und Methoden zu Ihrer Erfolgskontrolle; Hildesheim. 2001. Available online: http://www.nlwkn.niedersachsen.de/download/95902/NLWKN_2015_Anwenderhandbuch_fuer_die_Zusatzberatung_Wasserschutz_Grundwasserschutzorientierte_Bewirtschaftungsmassnahmen_in_der_Landwirtschaft_und_Methoden_zu_ihrer_Erfolgskontrolle_Band_21_.pdf (accessed on 15 July 2016).
- Chambre d’Agriculture. Das Info.-Blatt des Wasserschutzberatungsdienstes der Landwirtschaftskammer. Chambre d’Agriculture Wasserschutzberodung: Strassen, Luxenburg, 2015; pp. 1–4. Available online: http://www.lwk.lu/download/838/lwk-waasserschutzberodung-info-2015-4.pdf (accessed on 7 July 2016).
- Belle, S.; Rius, D.; Bichet, V.; Massa, C.; Mavon, C.; Millet, L. Combining limnology and paleolimnology to assess the influence of climate change on two lakes in Southern Greenland. Polar Biol. 2017, 1–13. [Google Scholar] [CrossRef]
- Krøjer, A.K. Landbrug i Sydgrønland-Svære produktionsvilkår i det arktiske miljø. Tidskr. Grønl. 2000, 8, 283–289. [Google Scholar]
- Galler, J. Kalkdüngung Basis für Fruchtbare Böden; Landwirtschaftskammer Salzburg, Betriebsentwicklung und Umwelt: Salzburg, Austria, 2008; pp. 1–27. [Google Scholar]
- Retamero, F.; Schjellerup, I.; Davies, A. (Eds.) Early Agricultural Remnants and Technical Heritage (EARTH): 8000 Years of Resilience and Innovation; Oxbow Books: Oxford, UK; Philadelphia, PA, USA, 2016; ISBN 978-1-84217-359-6. [Google Scholar]
- Massa, C.; Bichet, V.; Gauthier, É.; Perren, B.B.; Mathieu, O.; Petit, C.; Monna, F.; Giraudeau, J.; Losno, R.; Richard, H. A 2500 year record of natural and anthropogenic soil erosion in South Greenland. Quat. Sci. Rev. 2012, 32, 119–130. [Google Scholar] [CrossRef]
- Arneborg, J. Greenland irrigation systems on a West Nordic background: An overview of the evidence of irrigation systems in Norse Greenland c. 980-1450 AD. Pamatky Archeol. Suppl. 2005, 17, 137–145. [Google Scholar]
- Arneborg, J.; Lynnerup, N.; Heinemeier, J.; Møhl, J.; Rud, N.; Sveinbjörnsdóttir, Á.E. Norse Greenland dietary economy ca. AD 980-ca. AD 1450: Introduction. J. North Atl. 39. [CrossRef]
- Kielsen, K.; Frederiksen, S. Muligheder for Klimatilpasning i Landbrugserhvervet—Status og Handlemuligheder; Aarhus Universitet and Government of Greenland: Aarhus, Denmark, 2017; pp. 1–50. [Google Scholar]
- Schofield, J.E.; Edwards, K.J.; Mighall, T.M.; Martínez Cortizas, A.; Rodríguez-Racedo, J.; Cook, G. An integrated geochemical and palynological study of human impacts, soil erosion and storminess from southern Greenland since c. AD 1000. Palaeogeogr. Palaeoclimatol. Palaeoecol. 2010, 295, 19–30. [Google Scholar] [CrossRef]
Figure 1.
Study area and hay making fields in the area (114 ha), fields were grouped according to the farmer managing the areas and its allocation. Farm 6 (27 ha) did not participate in the study, however it is still shown in the figure as it represents almost a fourth of the total hay making area, and as its vicinity to Lake Igaliku poses a severe risk for the eutrophication of the water body.
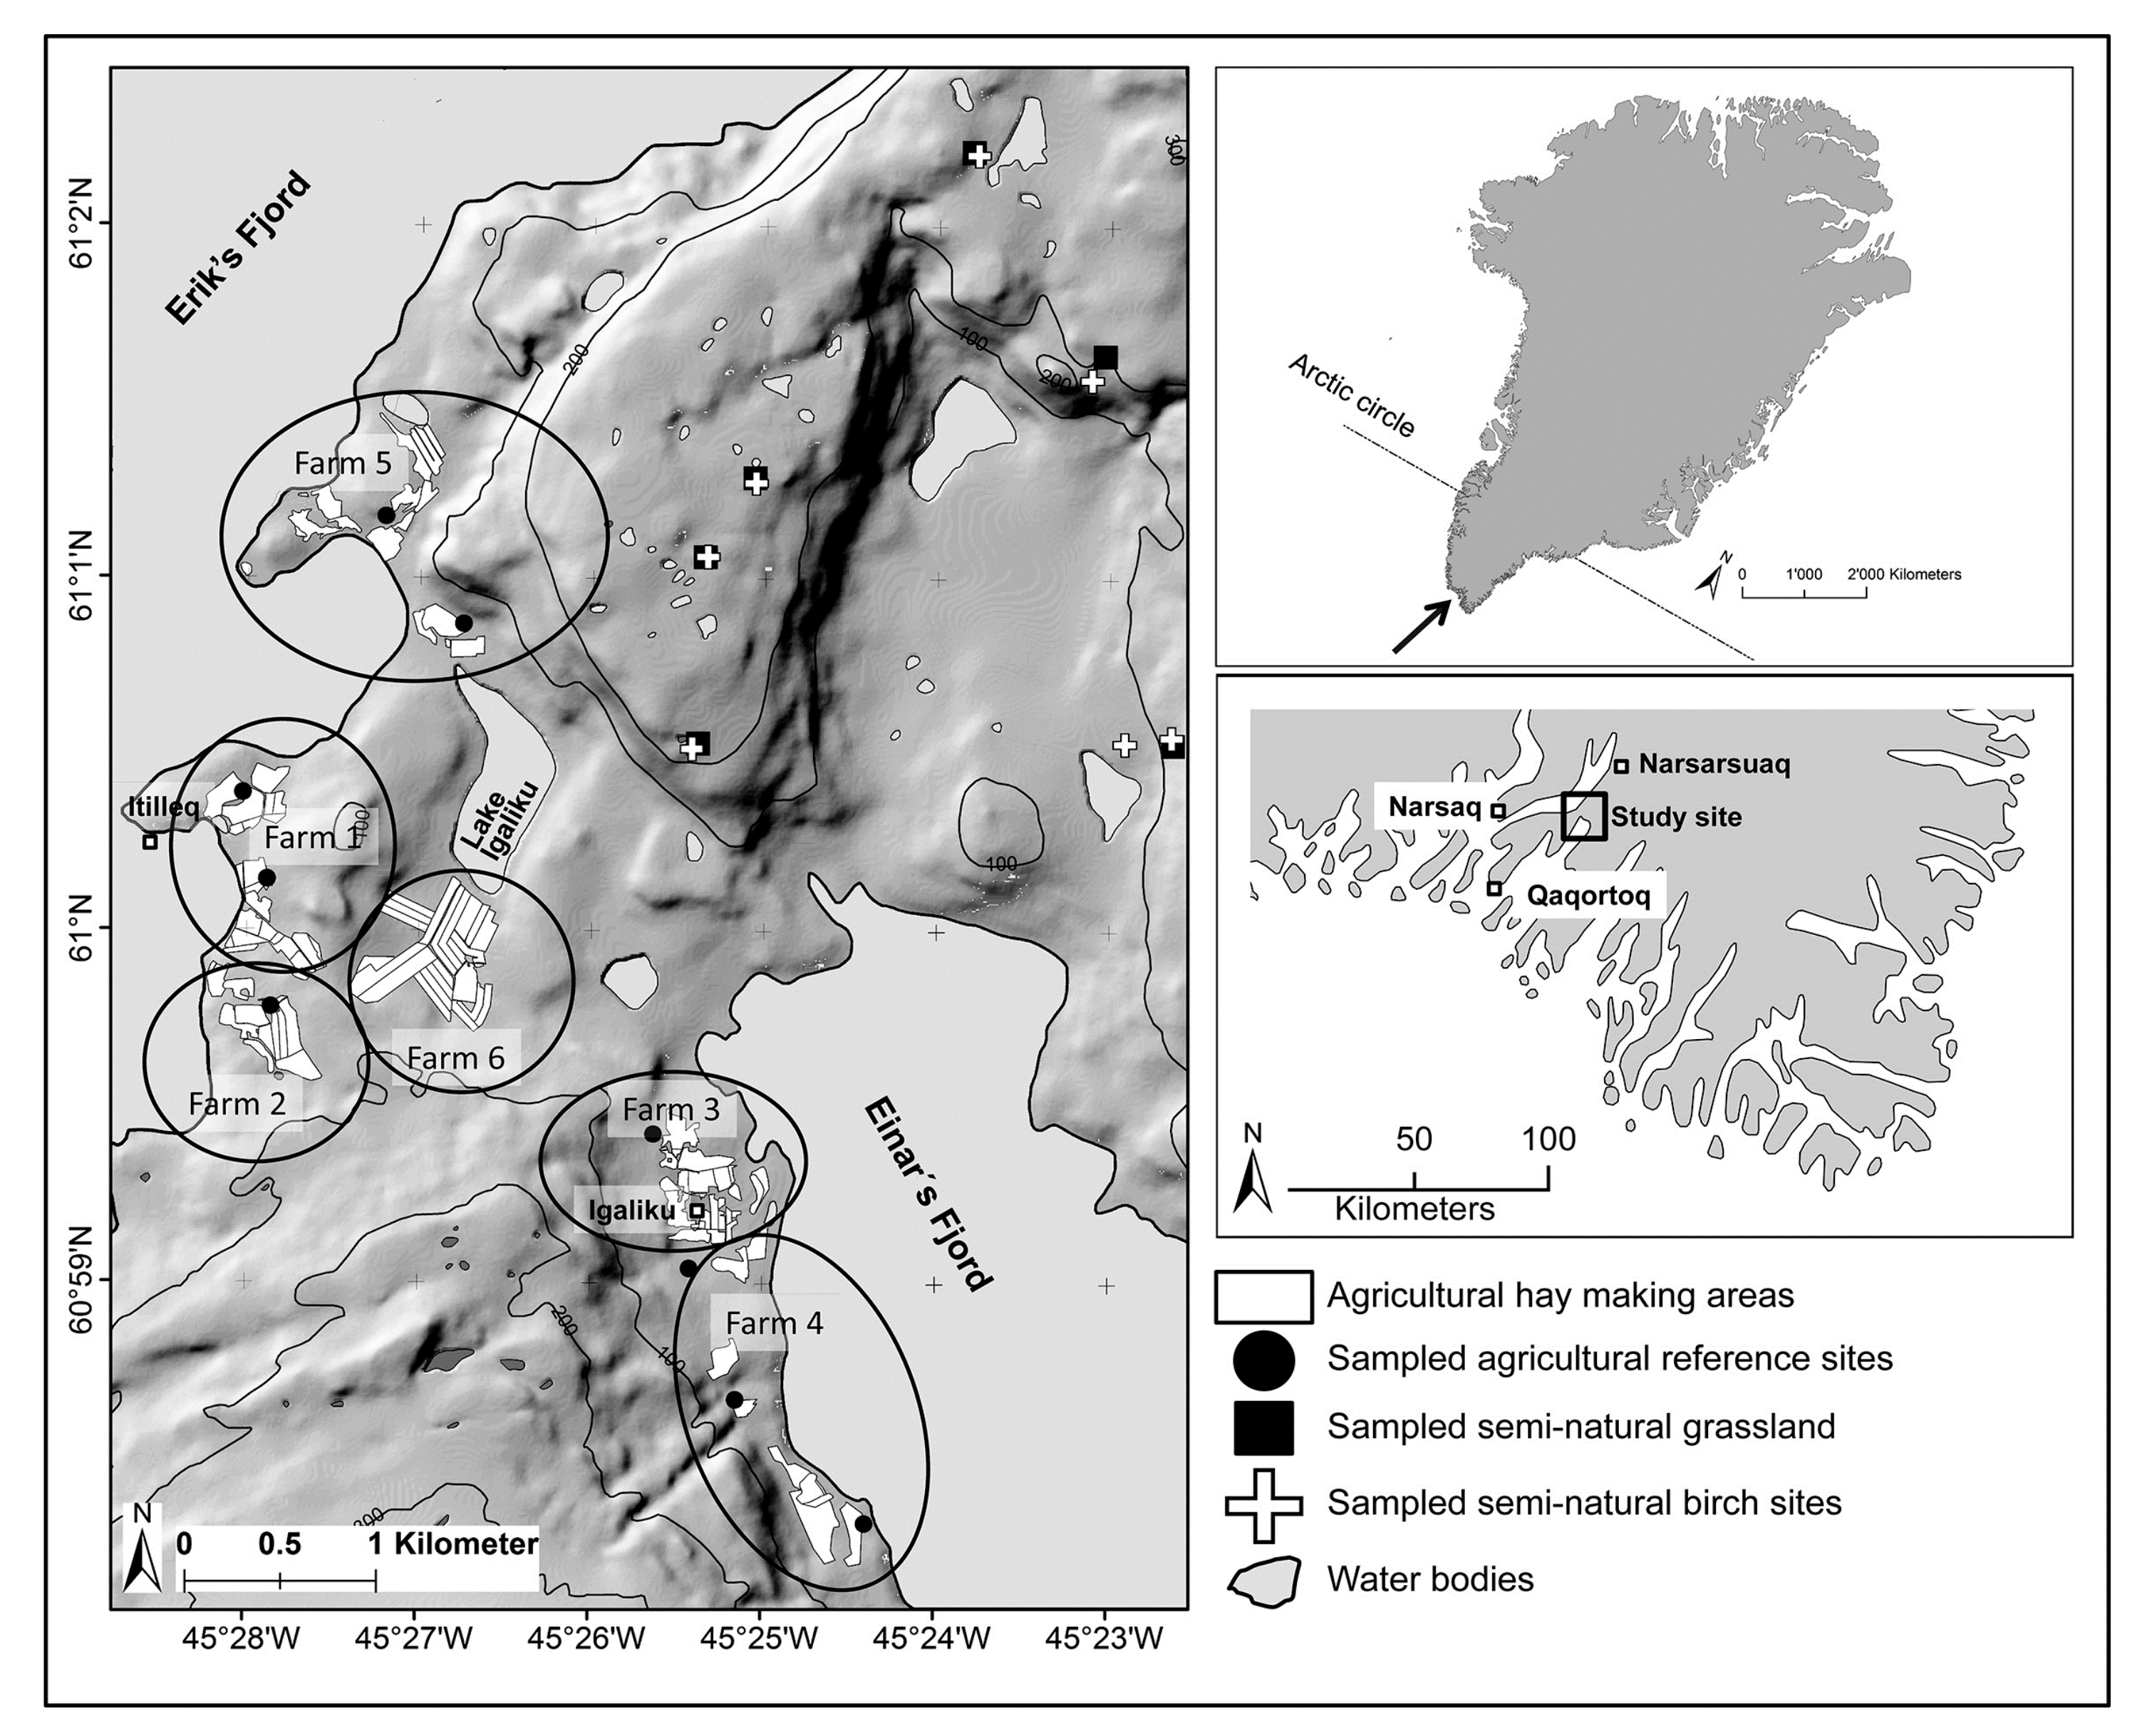
Figure 2.
(a) After harvest values for the nutrients K2O; and (b) P2O5 compared to economically optimal nutrient values for seeded grasslands [53]. Circles represent outliers that have values greater than 1.5 times the interquartile range, stars represent extreme outliers that have values greater than 3 times the interquartile range. Ag. Ref. sites = Agricultural reference sites; Birch sites = Semi-natural birch sites; Grass sites = Semi-natural grassland sites.
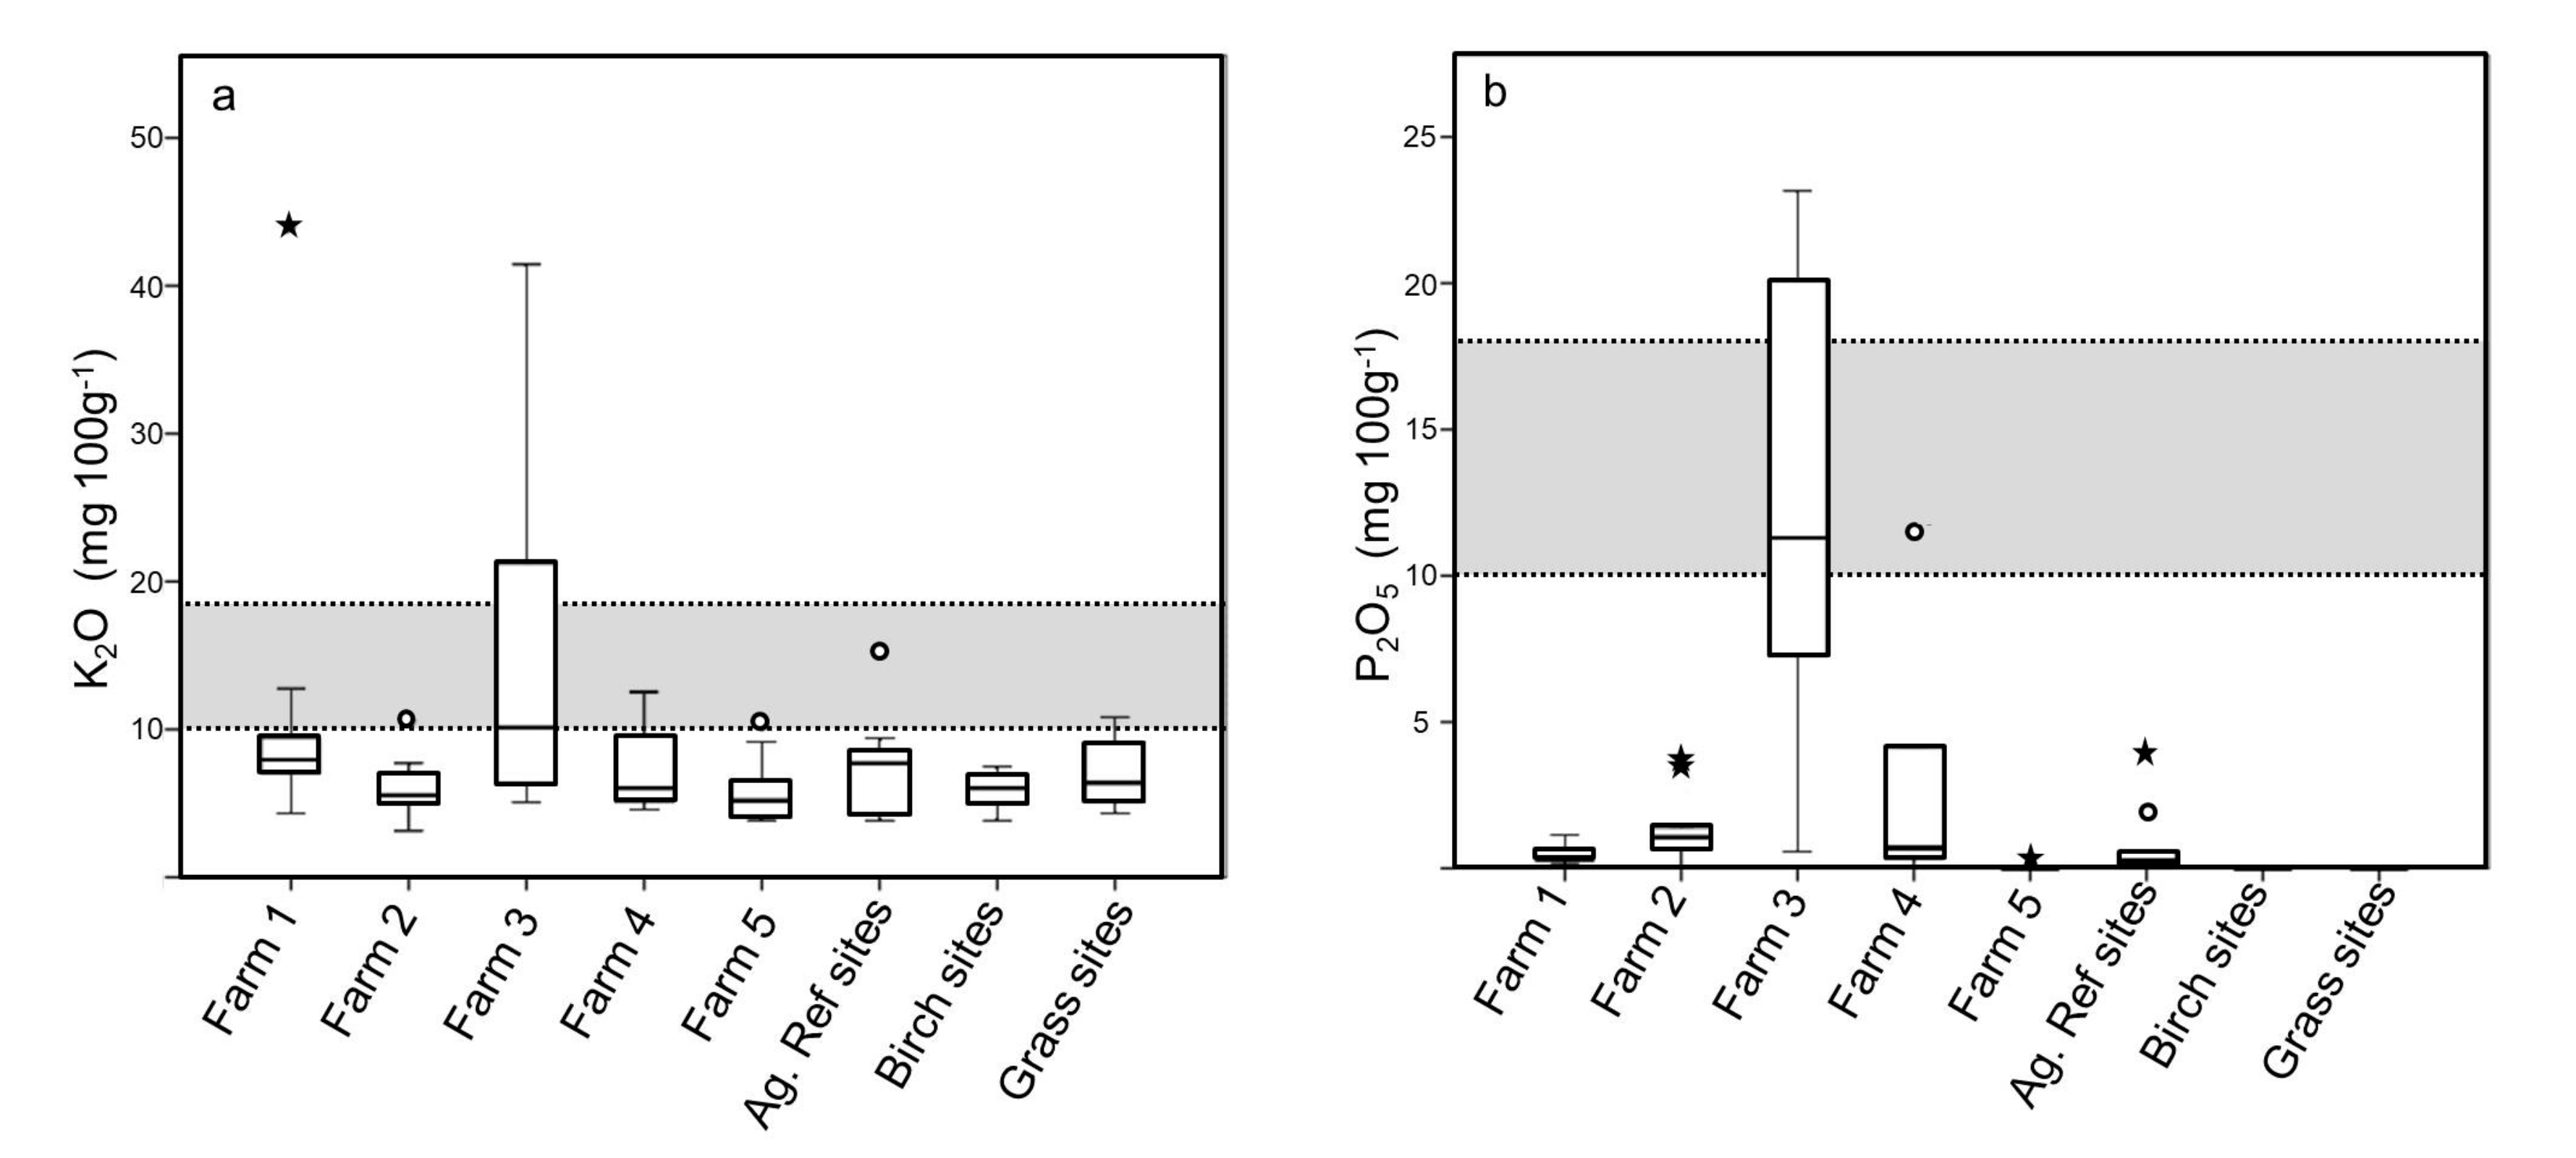
Figure 3.
After harvest Nmin-N values compared to advised Nmin-N values after harvest to protect water bodies [62]. Circles represent outliers that have values greater than 1.5 times the interquartile range, stars represent extreme outliers that have values greater than 3 times the interquartile range. Ag. Ref. sites = Agricultural reference sites; Birch sites = Semi-natural birch sites; Grass sites = Semi-natural grassland sites.

Figure 4.
Boxplots indicating soil quality index for agricultural areas, agricultural reference sites and semi-natural reference sites. Circles represent outliers that have values greater than 1.5 times the interquartile range, stars represent extreme outliers that have values greater than 3 times the interquartile range. Ag. Ref. sites = Agricultural reference sites; Birch sites = Semi-natural birch sites; Grass sites = Semi-natural grassland sites.
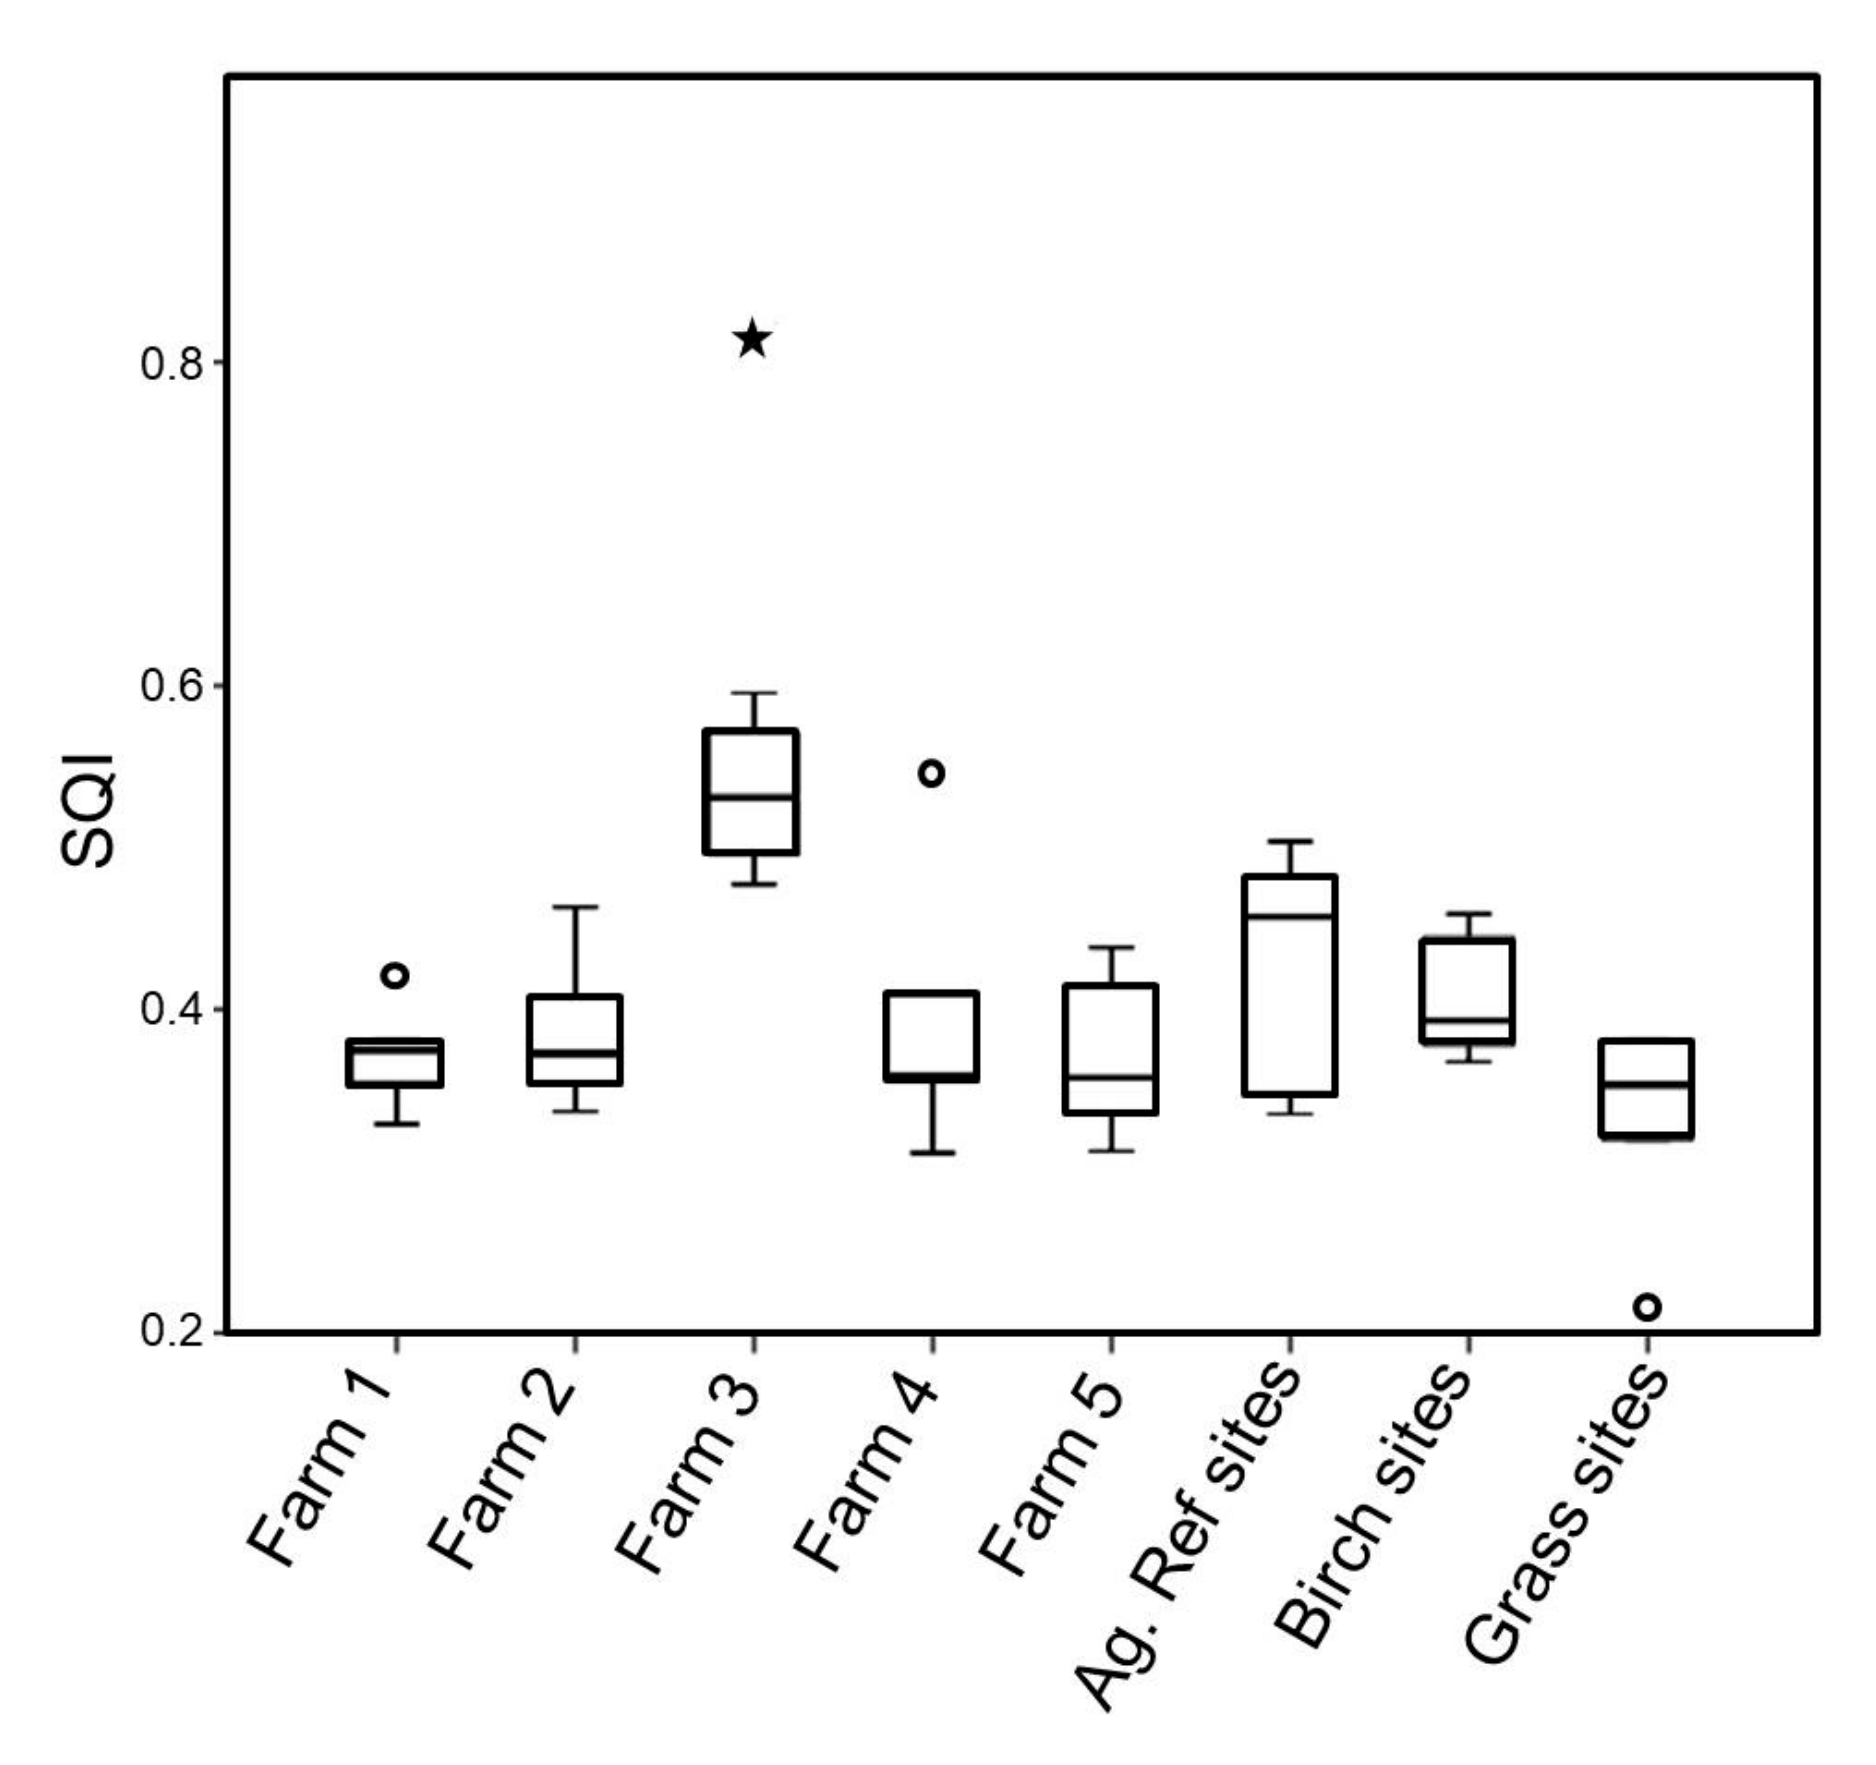
Figure 5.
(a) Parcel based soil quality index map for the agricultural areas. The hatched fields correspond to the fields where the SQI was extrapolated, considering similarities in the mapped properties (angle, orientation, position and form of the slope, parent material and crop, mapped according to the FAO Guidelines for soil description [35]. (b) Areas used for haymaking during the Norseman period (980s to 1450), after [32,68,69].
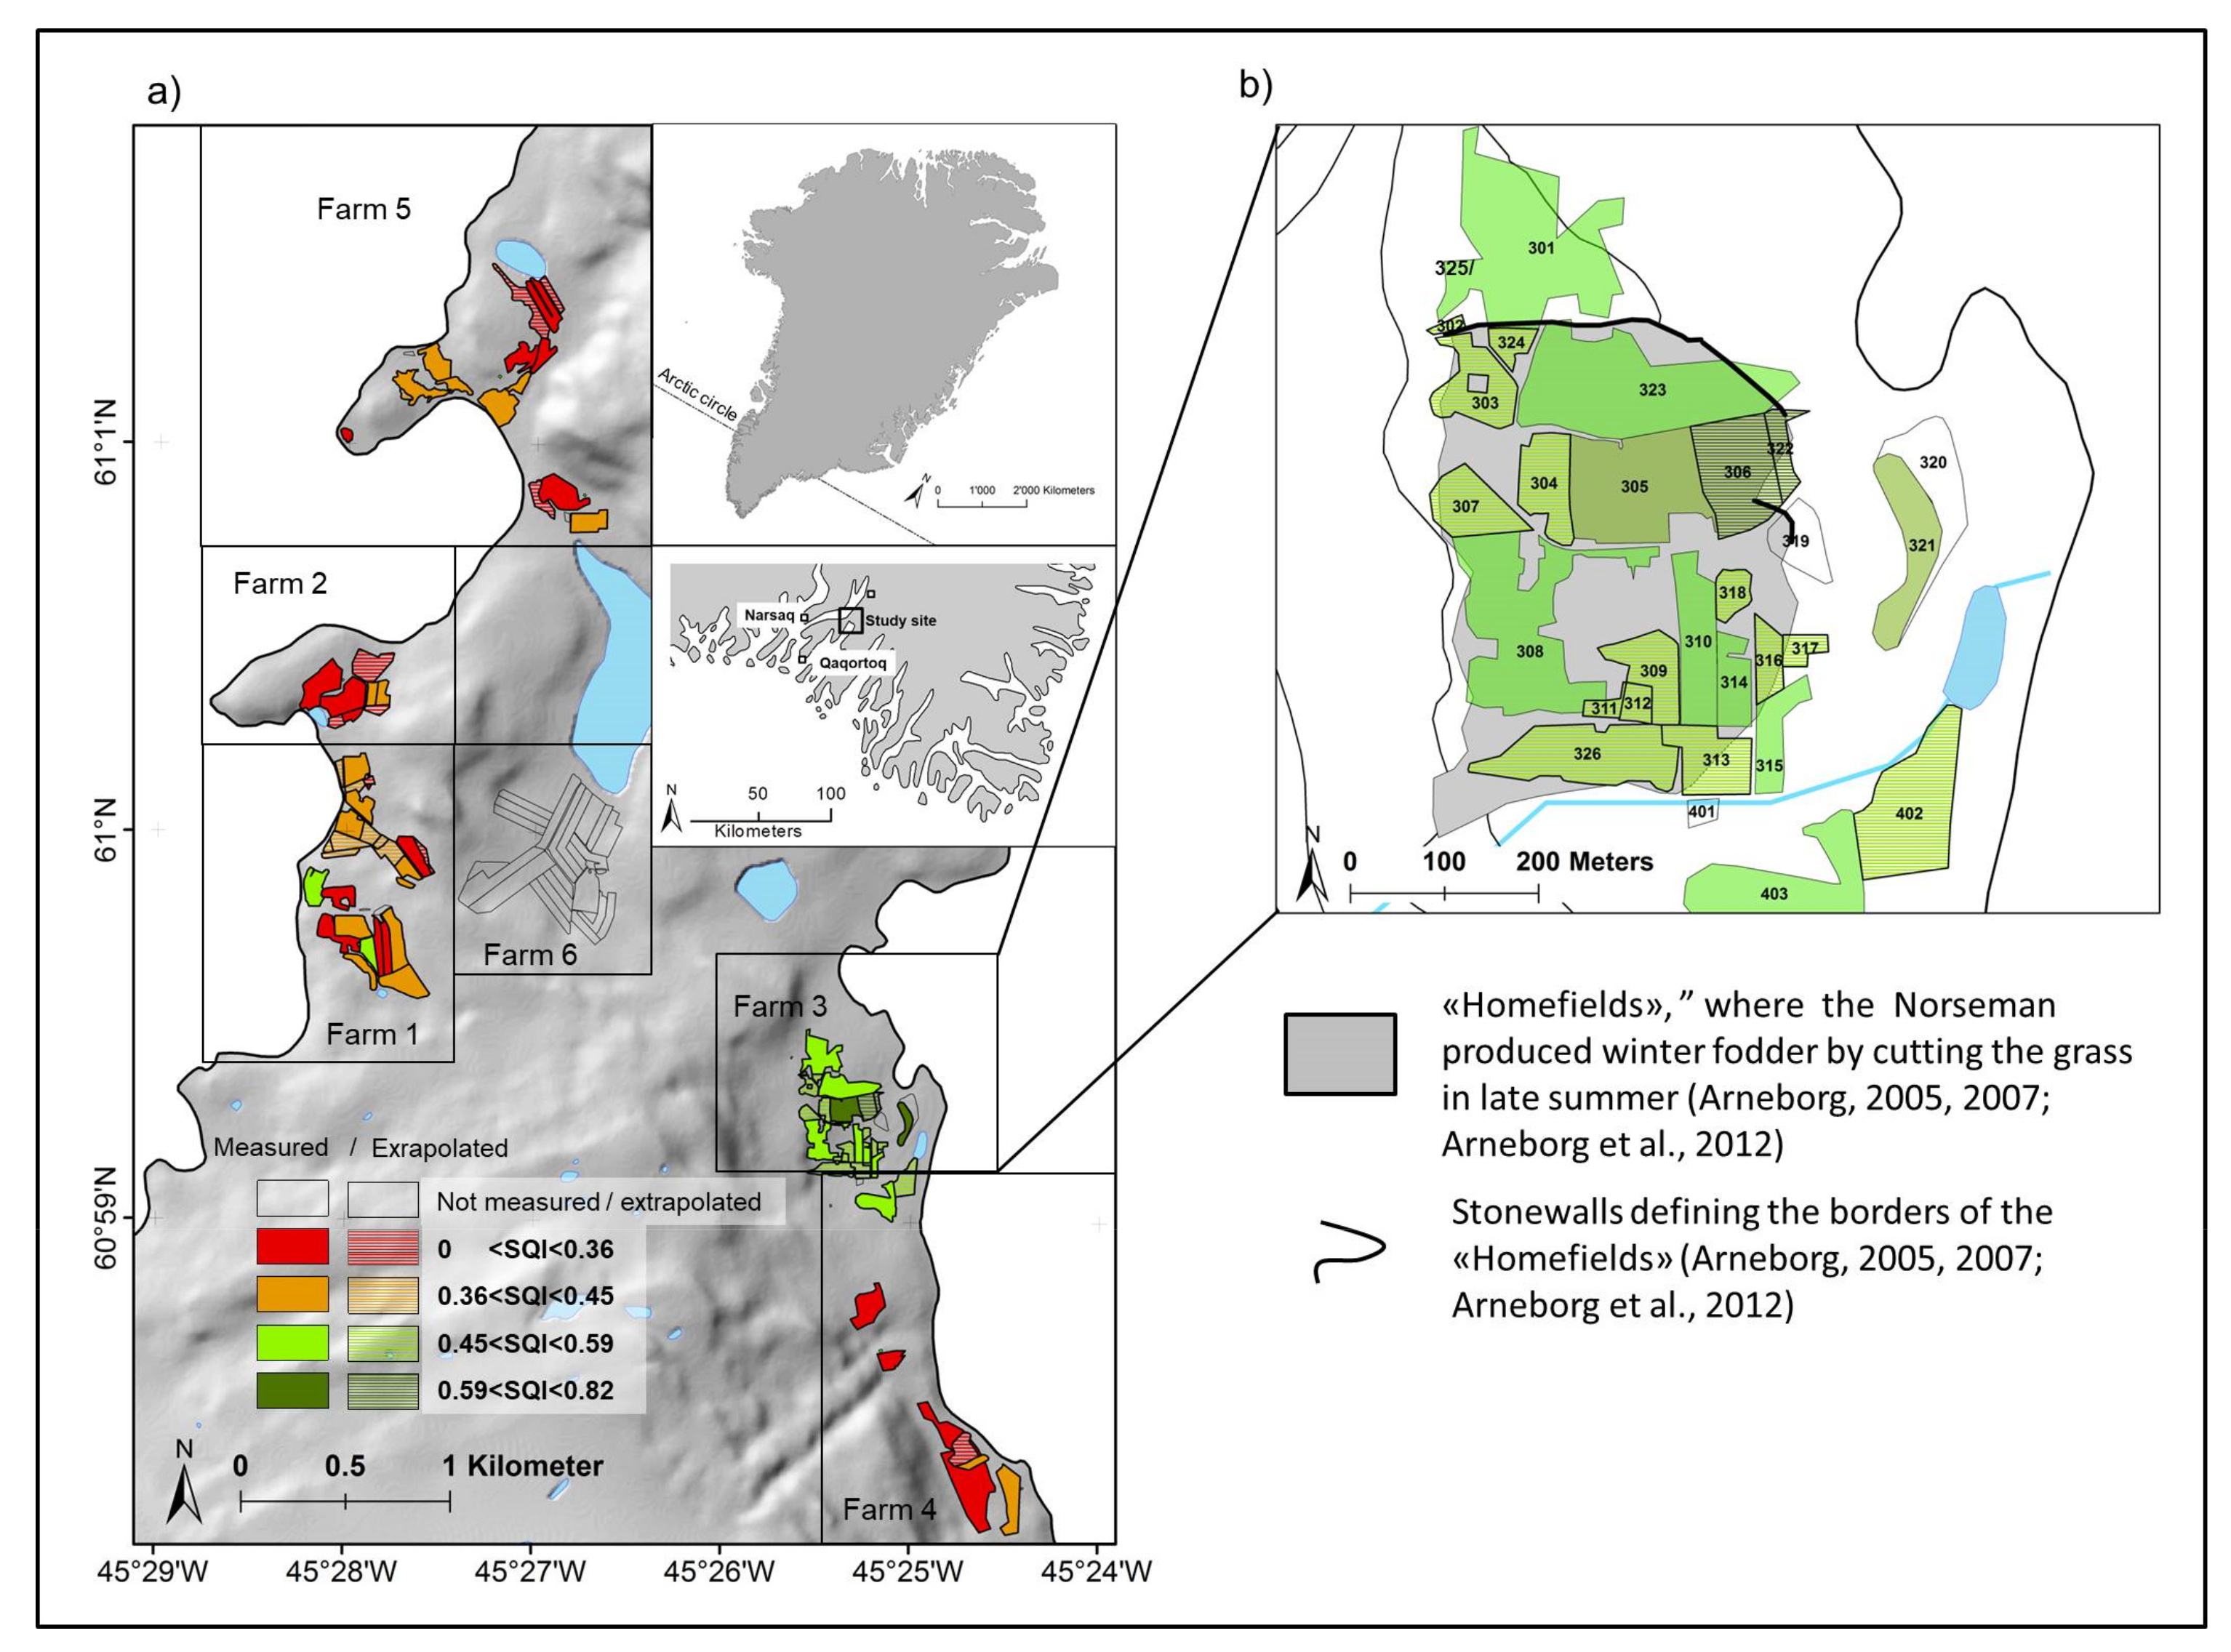
Figure 6.
Summary of hindrances, potential, maintenance measures, adaptions and risks concerning the expansion and intensification of southern Greenlandic agriculture.
Figure 6.
Summary of hindrances, potential, maintenance measures, adaptions and risks concerning the expansion and intensification of southern Greenlandic agriculture.

Table 1.
Overview of the sampled areas and its site characteristics.
| Site | Sampling Site Characteristics | Size of Sampling Area | |
|---|---|---|---|
| Farm 1 n = 10 | Mean elevation (m a.s.l.) | 21 ± 14 Stdv.; Range 38 | Parcel size |
| Mean slope (°) | 6 ± 3 Stdv.; Range 9 | ||
| Aspect | N: 0, NE: 0, E: 0; SE: 0, S: 0, SW: 2, W: 6, NW: 2 | ||
| Slope position | CR: 0, UP: 0, MS: 6, LS: 4, TS: 0, BO: 0 | ||
| Slope form | SS: 8, SV: 0, SC: 1, VS: 1, VV: 0, VC: 0, CS: 0,CV: 0, CC: 0 | ||
| Soil texture | Sandy loam: 10, Loamy sand: 0, Sand: 0 | ||
| Farm 2 n = 11 | Mean elevation (m a.s.l.) | 53 ± 15 Stdv.; Range 40 | Parcel size |
| Mean slope (°) | 7 ± 3 Stdv.; Range 9 | ||
| Aspect | N: 2, NE: 0, E: 0; SE: 0, S: 0, SW: 0, W: 7, NW: 2 | ||
| Slope position | CR: 0, UP: 0, MS: 3, LS: 5, TS: 3, BO: 0 | ||
| Slope form | SS: 6, SV: 0, SC: 2, VS: 0, VV: 0, VC: 0, CS: 3, CV: 0, CC: 0 | ||
| Soil texture | Sandy loam: 11, Loamy sand: 0, Sand: 0 | ||
| Farm 3 n = 8 | Mean elevation (m a.s.l.) | 22 ± 9 Stdv.; Range 24 | Parcel size |
| Mean slope (°) | 3 ± 2 Stdv.; Range 4 | ||
| Aspect | N: 0, NE: 0, E: 7; SE: 0, S: 1, SW: 0, W: 0, NW: 0 | ||
| Slope position | CR: 0, UP: 0, MS: 4, LS: 4, TS: 0, BO: 0 | ||
| Slope form | SS: 5, SV: 0, SC: 2, VS: 0, VV: 1, VC: 0, CS: 0, CV: 0, CC: 0 | ||
| Soil texture | Sandy loam: 8, Loamy sand: 0, Sand: 0 | ||
| Farm 4 n = 5 | Mean elevation (m a.s.l.) | 34 ± 12 Stdv.; Range 24 | Parcel size |
| Mean slope (°) | 5 ± 2 Stdv.; Range 4 | ||
| Aspect | N: 1, NE: 0, E: 4; SE: 0, S: 0, SW: 0, W: 0, NW: 0 | ||
| Slope position | CR: 0, UP: 0, MS: 5, LS: 0, TS: 0, BO: 0 | ||
| Slope form | SS: 2, SV: 0, SC: 0, VS: 1, VV: 0, VC: 1, CS: 0, CV: 0, CC: 1 | ||
| Soil texture | Sandy loam: 4, Loamy sand: 1, Sand: 0 | ||
| Farm 5 n = 10 | Mean elevation (m a.s.l.) | 28 ± 14 Stdv.; Range 45 | Parcel size |
| Mean slope (°) | 6 ± 3 Stdv.; Range 10 | ||
| Aspect | N: 1, NE: 0, E: 0; SE: 0, S: 0, SW: 5, W: 1, NW: 3 | ||
| Slope position | CR: 0, UP: 0, MS: 5, LS: 2, TS: 0, BO: 3 | ||
| Slope form | SS: 3, SV: 0, SC: 2, VS: 1, VV: 1, VC: 0, CS: 2, CV: 0, CC: 1 | ||
| Soil texture | Sandy loam: 10, Loamy sand: 0, Sand: 0 | ||
| Agricultural reference sites n = 9 | Mean elevation (m a.s.l.) | 33 ± 12 Stdv.; Range 34 | 10 m × 10 m |
| Mean slope (°) | 7 ± 3 Stdv.; Range 9 | ||
| Aspect | N: 0, NE: 1, E: 3; SE: 0, S: 3, SW: 0, W: 2, NW: 0 | ||
| Slope position | CR: 0, UP: 0, MS: 9, LS: 0, TS: 0, BO: 0 | ||
| Slope form | SS: 5, SV: 1, SC: 2, VS: 1, VV: 0, VC: 0, CS: 0, CV: 0, CC: 0 | ||
| Soil texture | Sandy loam: 7, Loamy sand: 2, Sand: 0 | ||
| Semi-natural birch sites n = 7 | Mean elevation (m a.s.l.) | 199 ± 48 Stdv.; Range 180 | 10 m × 10 m |
| Mean slope (°) | 12 ± 5 Stdv.; Range 16 | ||
| Aspect | N: 0, NE: 0, E: 0; SE: 3, S: 1, SW: 2, W: 1, NW: 0 | ||
| Slope position | CR: 0, UP: 0, MS: 4, LS: 2, TS: 1, BO: 0 | ||
| Slope form | SS: 5, SV: 0, SC: 1, VS: 0, VV: 0, VC: 0, CS: 1, CV: 0, CC: 0 | ||
| Soil texture | Sandy loam: 3, Loamy sand: 4, Sand: 0 | ||
| Semi-natural grassland sites n = 6 | Mean elevation (m a.s.l.) | 221 ± 48 Stdv.; Range 136 | 10 m × 10 m |
| Mean slope (°) | 14 ± 6 Stdv.; Range 13 | ||
| Aspect | N: 0, NE: 0, E: 0; SE: 2, S: 3, SW: 0, W: 1, NW: 0 | ||
| Slope position | CR: 0, UP: 0, MS: 5, LS: 1, TS: 0, BO: 0 | ||
| Slope form | SS: 42, SV: 0, SC: 1, VS: 1, VV: 0, VC: 0, CS: 0,CV: 0, CC: 0 | ||
| Soil texture | Sandy loam: 2, Loamy sand: 2, Sand: 1, Missing: 1 | ||
Abbreviations. For slope positions: CR, Crest (summit); UP, upper slope (shoulder); MS, Middle slope (back slope); LS, Lower slope (foot slope); TS, Toe slope; Bo, bottom. Abbreviations for slope forms of plan and profile curvature: SS, Straight straight; SV, Straight convex; SC, straight concave; VS, Convex straight; VV, Convex convex; VC, convex concave; CS, Concave straight; CV, Concave convex; CC, Concave concave [35].
Table 2.
Measured soil properties, its significance as soil quality indicator and applied analysis methods.
Table 2.
Measured soil properties, its significance as soil quality indicator and applied analysis methods.
| Parameter | Significance As Index for Soil Fertility | Analytical Method for Data Determination |
|---|---|---|
| Corg (%) | Index for soil fertility and soil structure. Increases the CEC and the water-holding capacity [36], thus prevents nutrient leaching. | Sieved (<2 mm), ball-milled, total carbon content was determined by the dry combustion technique Leco CN 628 Elemental Determinator, (Ctot was set as Corg as there was no evidence for inorganic carbon) |
| Ntot (%) | Initial source for N mineralization—>Nmin-N (NO3−-N + NH4+-N) | Sieved (<2 mm), ball-milled, nitrogen content was determined by the dry combustion technique by Leco CN 628 Elemental Determinator |
| Macronutrients K, P, Mg, Ca (kg ha−1) | Index for the capacity to support plant growth, environmental quality indicator [36]. | CO2 extraction 1:2.5 soil solution FAL CO2-EX [37], ionchromatography, IC 761 |
| Nmin (NO3-N + NH4+-N) (kg ha−1) | Index plant available soil inorganic nitrogen, leaching potential, mineralization [36]. | Sieved (<2 mm), cooled until soil extraction; extraction with 0.01M Calciumchlorid (1:4); FAL NM-Ex [37], soil nitrate and ammonium determination with QUANTOFIX® rapid test (Machery & Nagel) |
| pH (CaCl2) (-) | Index for soil acidity/alcalinity. Reduced availability of nutrients in acidic soils [36]. Soil acidity influences soil microbes, reduces bacterial activity and thus decomposition [38]. | 1:2.5 0.01 M CaCl2 suspension |
| Cation exchange capacity (CEC) (meq 100 g−1) | Index for soil capacity to supply exchangeable nutrient cations Mgex, Kex, Caex to the soil solution for plant uptake [39]. | For soils with pH (H2O) ≤ 5.9; FAL KUK1-Ex with HCl + H2SO4; KUK1-H; for soils with pH (H2O) > 5.9; KUK2-EX with Bariumchlorid KUK2-H [37]; Measured on CIROS VISION − ICP-OES Spectrometer, CECpot = (Ca2+) + (Mg2+) + (K+) + (Na+) + (H+), CECeff = (Ca2+) + (Mg2+) + (K+) + (Na+) |
| Exchangable sodium (Naex) percentage (ESP) (%) | Addresses potential hazards posed by sodium soils, as for example a decrease in permeability, soil dispersion, poor water infiltration, and possible sodium toxicity to plants [40]. | ESP = [(Na+)/CECpot] × 100 |
| Base saturation (BS) (%) | Indicates whether a soil should be limed or not [41]. | BS= [CECeff/CECpot] × 100 |
| C/N (-) | Indicates mineralization/immobilization of soil nitrogen [42]. | Sieved to 2 mm, ball-milled, the organic carbon content was determined by the dry combustion technique by Leco CN 628 Elemental Determinator; Ratio C/N |
| Bulk density (BD) < 2 mm (g cm−3) | Index for plant rooting, porosity and soil organisms [43]. | Undisturbed soil cores 100 cm3, air dried, sieved to 2 mm;BD = weight dried fine earth/cylinder volume Volume > 2 mm was measured by water replacement of the material > 2 mm, volume < 2 mm was calculated by total volume of the cylinder minus the volume > 2 mm |
| CF (Vol%) | Index for water and nutrient retention potential [40]. | CF = Vol > 2mm/(Vol > 2 mm + Vol < 2 mm) |
| Texture (%) | Index for retention and transport of water and chemicals [36]. | Treatment with H2O2 (15%) to exclude organic material, Mastersizer 2000 (Malvern, Germany) |
Table 3.
Output of principal component analysis (PCA) of the soil quality indicators and their classification into functional groups. Parameters are ordered according to their loading. Bold component-loadings correspond to the indicators included in the MDS.
Table 3.
Output of principal component analysis (PCA) of the soil quality indicators and their classification into functional groups. Parameters are ordered according to their loading. Bold component-loadings correspond to the indicators included in the MDS.
| PC 1 | PC 2 | PC 3 | PC 4 | Functional Group | |
|---|---|---|---|---|---|
| Eigenvalue | 7.549 | 2.543 | 1.423 | 1.166 | |
| Percent | 47.18 | 15.894 | 8.893 | 7.285 | |
| Cumulative percent | 47.18 | 63.073 | 71.966 | 79.251 | |
| ESP (%) | 0.933 | 0.166 | 0.009 | 0.138 | The less the better [48] |
| Naex (meq 100 g−1) | 0.852 | 0.344 | 0.093 | 0.157 | |
| C:N ratio (-) | −0.763 | −0.224 | −0.245 | 0.039 | |
| BS (%) | 0.665 | 0.229 | 0.651 | 0.059 | |
| Mgex (meq 100 g−1) | 0.609 | 0.483 | 0.243 | −0.115 | The more the better [43] |
| Corg (%) | 0.343 | 0.799 | 0.179 | 0.317 | The more the better [43] |
| Ntot (%) | 0.477 | 0.755 | 0.219 | 0.246 | |
| P (mg 100 g−1) | 0.343 | 0.739 | −0.032 | −0.133 | Optimal value [49] |
| BD > 2mm (g cm−3) | −0.088 | −0.711 | −0.133 | 0.37 | The less the better [43] |
| Kex (meq 100 g−1) | 0.45 | 0.561 | 0.33 | −0.051 | The more the better [43] |
| Caex (meq 100 g−1) | 0.194 | 0.429 | 0.837 | 0.097 | The more the better [43] |
| pH (CaCl2) | 0.036 | −0.149 | 0.82 | −0.414 | Optimal value [50] |
| CECeff (meq 100 g−1) | 0.533 | 0.528 | 0.644 | 0.062 | |
| Sand (%) | 0.064 | −0.298 | 0.074 | −0.897 | The less the better [38] |
| Clay (%) | 0.237 | −0.074 | 0.015 | 0.844 | |
| CF (Vol-%) | 0.005 | 0.277 | 0.078 | −0.53 | The less the better [38] |
Table 4.
Chemical parameters. Parameters marked with (*) show normally distributed data, thus mean and standard deviation is given, significances were calculated with t-test. Parameters marked with (**) show not normally distributed data, thus median and interquartile range is given, significances were calculated with Mann—Whitney rank sum test. Ag. Ref. = Agricultural reference sites; Birch = Semi-natural birch sites; Grass = Semi-natural grassland sites.
| Site | pH(CaCl2) * (-) | P ** (kg ha−1) | K ** (kg ha−1) | Ca ** (kg ha−1) | Mg ** (kg ha−1) | CECeff ** (meq 100 g−1) | ESP ** (%) | BS ** (%) | Nmin-N ** (kg ha−1) | Corg Stock ** (tha−1) | Ntot Stock ** (tha−1) | C:N Ratio * (-) |
|---|---|---|---|---|---|---|---|---|---|---|---|---|
| Farm 1 | 4.4 ± 0.2 abc | 2.1 ± 2.1 bc | 107.0 ± 29.7 | 128.7 ± 49.9 bc | 24.4 ± 7.7 bc | 2.6 ± 1.1 ad | 0.8 ± 0.3 ab | 16 ± 7 ad | 25.1 ± 34.6 | 116 ± 23 b | 6.8 ± 1.1 ab | 16.3 ± 1.4 ad |
| Ag. Ref 1 | 4.7 ± 0.0 bc | 0.0 f | 58.5 ± 13.1 b | 50.7 ± 61.1 b | 32.4 ± 24.5 | 2.4 ± 1.4 | 1.2 ± 0.5 | 18 ± 9 | 0.0 be | 92 ± 41 | 5.5 ± 2.8 | 16.9 ± 1.4 bg |
| Farm 2 | 4.3 ± 0.3 abcd | 4.7 ± 2.8 bc | 48.5 ± 22.8 abcd | 75.0 ± 64.1 bc | 22.8 ± 10.4 bc | 2.8 ± 2.3 | 0.8 ± 0.4 abd | 18 ± 8 | 2.4 ± 1.7 bcd | 105 ± 20 ab | 6.7 ± 1.7 ab | 15.6 ± 2.0 ad |
| Ag. Ref 2 | 4.4 | 0.0 | 84.0 | 57.7 | 28.9 | 2.4 | 1.1 | 14 | 3.0 | 140 | 8.2 | 17.1 g |
| Farm 3 | 4.7 ± 0.5 | 88.1 ± 54.7 abcd | 156.2 ± 224.0 | 113.0 ± 224.0 c | 40.8 ± 153.1 d | 12.4 ± 4.1 abcd | 6.2 ± 4.6 bcd | 38 ± 11 bcd | 16.5 ± 9.5 ad | 183 ± 87 bc | 15.4 ± 6.8 bcd | 12.5 ± 0.9 bcd |
| Ag. Ref 3 | 5.1 | 13.1 b | 96.2 | 38.2 | 12.2 | 10.1 | 10.3 b | 36 | 7.7 | 133 | 10.7 | 12.5 c |
| Farm 4 | 4.8 ± 0.3 d | 5.9 ± 27.3 bc | 91.2 ± 50.4 | 19.8 ± 32.1 bcd | 16.6 ± 36.0 | 6.5 ± 6.1 bcd | 11.5 ± 2.3 abcd | 40 ± 17 bcd | 5.4 ± 1.8 bc | 93 ± 48 | 7.5 ± 4.4 b | 11.6 ± 0.6 abcd |
| Ag. Ref 4 | 5.1 ± 0.2 e | 3.9 ± 9.5 | 123.8 ± 56.2 | 24.0 ± 100.4 b | 32.8 ± 59.6 | 8.7 ± 9.0 b | 9.3 ± 7.4 b | 39 ± 20 b | 14.2 ± 13.5 | 167 ± 162 b | 16.2 ± 14.5 be | 11.0 ± 0.6 bceg |
| Farm 5 | 4.8 ± 0.2 bc | 0 ± 0 | 80.8 ± 28.1 | 163.7 ± 152.1 | 31.3 ± 12.5 bc | 3.5 ± 0.9 | 1.0 ± 0.1 b | 22 ± 14 | 17.6 ± 10.3 | 112 ± 37 b | 6.6 ± 2.5 b | 15.6 ± 1.2 d |
| Ag. Ref 5 | 5.1 ± 0.3 | 1.3 ± 2.6 | 95.4 ± 72.1 | 577.6 ± 369.8 e | 84.8 ± 64.1 | 10.6 ± 1.2b f | 0.5 ± 1 | 37.5 ± 17 f | 12.0 ± 12.8 | 129 ± 37 b | 9.7 ± 2.1 b | 13.3 bcf |
| Farms 1–5 | 4.6 ± 0.4 abc | 3.6 ± 11.1 bc | 86.8 ± 54.8 | 103.9 ± 112.7 bc | 25.9 ± 17.5 bc | 3.7 ± 5.0 | 1.0 ± 1.3 b | 22 ± 17 | 6.0 ± 19.1 b | 112 ± 35 bc | 7.0 ± 2.1 bc | 14.7 ± 2.2 b |
| Ag. Ref. 1–5 | 4.9 ± 0.3 e | 2.0 ± 3.9 c | 84.0 ± 58.8 | 57.7 ± 98.3 b | 32.8 ± 32.6 | 8.2 ± 6.9 | 1.4 ± 8.3 b | 34 ± 17 b | 5.6 ± 11.2 bc | 133 ± 35 b | 9.9 ± 2.6 b | 13.7 ± 2.7 bc |
| Birch | 5.2 ± 0.4 e | 0.0 ± 0.0 e | 88.9 ± 29.5 | 273.7 ± 295.0 e | 66.6 ± 33.0 e | 3.4 ± 2.5 | 0 ± 0 ae | 14 ± 13 a | 27.3 ± 19.5 ae | 74 ± 19 ae | 4.6 ± 1.8 ae | 16.4 ± 1.3 ae |
| Grass | 5.1 ± 0.4 e | 0.0 ± 0.0 ae | 103.6 ± 33.1 | 326.5 ± 177.1 e | 63.8 ± 17.0 e | 2.9 ± 1.8 | 0 ± 1.9 e | 17 ± 6 | 21.8 ± 16.9 a | 67 ± 69 | 4.2 ± 3.4 | 16.2 ± 0.9 a |
a Sign. differences (p < 0.05) to agricultural reference sites (1–5); b sign. differences (p < 0.05) to birch sites; c sign. differences (p < 0.05) to grassland sites; d sign. differences (p < 0.05) to the remaining agricultural sites; e sign. differences (p < 0.05) to all agricultural sites (Farms 1–5); f sign. differences (p < 0.05) to the corresponding farm; g sign. differences (p < 0.05) to the remaining agricultural reference sites.
Table 5.
Physical soil parameters. Parameters marked with (*) show normally distributed data, thus mean and standard deviation is given, significances were calculated with t-test. Parameters marked with (**) show not normally distributed data, thus median and interquartile range is given, significances were calculated with Mann–Whitney rank sum test. Ag. Ref = Agricultural reference sites; Birch = Semi-natural birch sites; Grass = Semi-natural grassland sites.
| Site | BD < 2 mm *(gcm−3) | CF **(Vol% ) | Clay **(%) | Silt **(%) | Sand **(%) |
|---|---|---|---|---|---|
| Farm 1 | 1.06 ± 0.11 bd | 5.5 ± 5.3 | 3.2 ± 0.8 b | 38.8 ± 3.8 c | 58.2 ± 4.0 c |
| Ag. Ref 1 | 1.16 ± 0.08 b | 2.5 ± 1.0 | 2.7 ± 0.7 | 36.8 ± 13.2 | 60.5 ± 13.9 |
| Farm 2 | 0.98 ± 0.13 b | 5.0 ± 2.7 | 2.3 ± 0.7 b | 36.4 ± 3.3 c | 60.3 ± 3.9 c |
| Ag. Ref 2 | 1.13 b | 4.3 | 2.8 | 41.0 | 56.2 |
| Farm 3 | 0.68 ± 0.17 acd | 8.0 ± 4.5 d | 2.7 ± 0.5 b | 36.7 ± 7.3 c | 60.7 ± 8.5 |
| Ag. Ref 3 | 0.87 | 4.8 | 2.7 | 39.9 | 57.4 |
| Farm 4 | 0.93 ± 0.11 | 3.9 ± 1.8 | 2.1 ± 2.6 | 33.0 ± 2.6 d | 64.8 ± 3.8 |
| Ag. Ref 4 | 0.97 ± 0.11 b | 7.0 ± 6.6 | 3.2 ± 1.6 | 45.4 ± 22.7 | 51.4 ± 24.3 |
| Farm 5 | 1.10 ± 0.19 bd | 4.7 ± 5.0 | 3.6 ± 0.7 bd | 38.5 ± 3.6 bc | 57.6 ± 3.5 bc |
| Ag. Ref 5 | 0.96 ± 0.10 | 6.5 ± 10.3 | 3.2 ± 0.1 | 40.6 ± 12.0 | 56.2 ± 12.0 |
| Farms 1–5 | 0.96 ± 0.21 b | 5.2 ± 4.8 | 3.0 ± 1.0 b | 38.2 ± 4.7 bc | 59.1 ± 5.8 bc |
| Ag. Ref. 1–5 | 1.02 ± 0.13 b | 4.3 ± 5.0 | 3.0 ± 0.5 b | 41.0 ± 10.7 c | 51.4 ± 10.8 bc |
| Birch | 0.76 ± 0.13 ace | 3.7 ± 8.0 | 0.9 ± 1.7 ae | 28.9 ± 17.2 e | 59.9 ± 19.8 ae |
| Grass | 1.06 ± 0.16 b | 10.8 ± 8.7 | 0.7 ± 2.7 d | 22.2 ± 16.3 ae | 63.3 ± 18.9 ae |
a sign. differences (p < 0.05) to agricultural reference sites (1–5); b sign. differences (p < 0.05) to birch sites; c sign. differences (p < 0.05) to grassland sites; d sign. differences (p < 0.05) to the remaining agricultural sites; e sign. differences (p < 0.05) to all agricultural sites (Farms 1–5); f sign. differences (p < 0.05) to the corresponding farm; g sign. differences (p < 0.05) to the remaining agricultural reference sites.
© 2017 by the authors. Licensee MDPI, Basel, Switzerland. This article is an open access article distributed under the terms and conditions of the Creative Commons Attribution (CC BY) license (http://creativecommons.org/licenses/by/4.0/).
Share and Cite
MDPI and ACS Style
Caviezel, C.; Hunziker, M.; Kuhn, N.J. Bequest of the Norseman—The Potential for Agricultural Intensification and Expansion in Southern Greenland under Climate Change. Land 2017, 6, 87. https://doi.org/10.3390/land6040087
AMA Style
Caviezel C, Hunziker M, Kuhn NJ. Bequest of the Norseman—The Potential for Agricultural Intensification and Expansion in Southern Greenland under Climate Change. Land. 2017; 6(4):87. https://doi.org/10.3390/land6040087
Chicago/Turabian StyleCaviezel, Chatrina, Matthias Hunziker, and Nikolaus J. Kuhn. 2017. "Bequest of the Norseman—The Potential for Agricultural Intensification and Expansion in Southern Greenland under Climate Change" Land 6, no. 4: 87. https://doi.org/10.3390/land6040087
Note that from the first issue of 2016, this journal uses article numbers instead of page numbers. See further details here.