Article

Spatial Modeling of Soil Erosion Risk and Its Implication for Conservation Planning: the Case of the Gobele Watershed, East Hararghe Zone, Ethiopia

by
Gezahegn Weldu Woldemariam
1,*,
Anteneh Derribew Iguala
2,
Solomon Tekalign
2 and
Ramireddy Uttama Reddy
2
1
Geoinformation Science Program, School of Geography and Environmental Studies, Haramaya University, P.O. Box 138, Dire Dawa, Ethiopia
2
Geography and Environmental Studies Program, School of Geography and Environmental Studies, Haramaya University, P.O. Box 138, Dire Dawa, Ethiopia
*
Author to whom correspondence should be addressed.
Submission received: 8 December 2017 / Revised: 9 January 2018 / Accepted: 1 February 2018 / Published: 21 February 2018

Abstract

:
Soil erosion by water has accelerated over recent decades due to non-sustainable land use practices resulting in substantial land degradation processes. Spatially explicit information on soil erosion is critical for the development and implementation of appropriate Soil and Water Conservation (SWC) measures.The objectives of this study were to estimate the magnitude of soil loss rate, assess the change of erosion risk, and elucidate their implication for SWC planning in the Gobele Watershed, East Hararghe Zone, Ethiopia. Applying remote sensing data, the study first derived the Revised Universal Soil Loss Equation (RUSLE) model parameters in an ArcGIS environment and estimated the soil loss rates. The estimated total soil loss in the watershed was 1,390,130.48 tons in 2000 and 1,022,445.09 tons in 2016 with a mean erosion rate of 51.04 t ha−1 y−1 and 34.26 t ha−1 y−1, respectively. The study area was divided into eight erosion risk classes ranging from very low to extremely high. We established a change detection matrix of the soil erosion risk classes between 2000 and 2016. The change analysis results have revealed that about 70.80% of the soil erosion risk areas remained unchanged, 19.67% increased in total area, and 9.53% decreased, showing an overall worsening of the situation. We identified and mapped areas with a higher and increasing erosion risk as SWC priority areas using a Multi-criteria Decision Rules (MCDR) method. The top three priority levels marked for the emergency SWC measures account for about 0.04%, 0.49%, and 0.83%, respectively. These priority levels are situated along the steep slope areas in the north, northwest, south, and southeast of the Gobele Watershed. It is, thus, very critical to undertake proper intervention measures in upslope areas based on the priority levels to establish sustainable watershed management in the study area.

1. Introduction

Soil erosion is a naturally occurring environmental process by which soil materials are displaced, transported, and deposited in downstream areas by wind, water, or gravitational forces [1,2,3]. In the context of water-caused soil erosion, removal of soil particles is the result of raindrops, while surface runoff carried out the transportation process [4]. Though soil erosions are the result of the interplay between soil erodibility and rainfall erosivity factors, inappropriate human practices such as cultivation in upslope areas, deforestation, an extension of urban areas and roads, and uncontrolled and overgrazing aggravate the problem [5,6,7,8]. In connection to this, Knapen et al. [9], reported that irregular terrain and surface topography are the other causes of soil erosion. Several studies have shown that soil loss by water erosion is highly attributed to on-site and off-site effects (e.g., land and water quality degradation, sediment accumulation, emission of soil organic carbon, a decrease in agricultural productivity, effects on biodiversity and ecosystem) [10,11,12,13,14,15,16,17,18,19]. However, the untoward effects of soil erosion risk are spatially varying among diverse agroecological, biodiversity and microenvironments throughout the world. In developing countries that largely rely on the efficiency and workability of their soil, loss of the most productive upper layer of soil has caused severe economic and environmental impacts [20,21,22,23,24,25,26,27]. In relation to this, Nill et al. [23] reported that “huge investment in a civil engineering work aiming at renovating the results of erosion is comparatively higher than investments in soil conservation.’’
Ethiopia is affected by different environmental challenges, and water-induced soil erosion is one of the keys to finding sustainability to agricultural production and productivity to safeguard food security [28,29,30,31,32,33,34,35]. Although agriculture is the backbone of the country’s economy and sustains the livelihood of about 85% of the population, loss of productive soil by erosion has massive environmental and economic impacts [32,33,34,35,36]. There is intense SWC and management efforts to ameliorate soil degradation in Ethiopia. Despite this, land degradation has continued to threaten livelihood, crop production and land productivity potential and economic growth in the country [10,37,38,39]. Reports from the Food and Agriculture Organization (FAO) [38] estimated the annual soil loss in Ethiopia is about 1.5 billion tons. According to the study by the FAO [40], about 27 million hectares of the land, nearly half of the Ethiopian highland areas, were affected by serious soil erosion. Particularly, in Wollo, Tigray, and Hararghe, half of the agricultural land has soils with a depth of less than 10 cm [38,41]. This problem has decreased the soil production potential. For example, the annual productivity potential of land in the Ethiopian highlands are declining by 2.2% per year [38,41].
In response to rapid population growth and accelerated threats of water-induced soil erosion risk, the Ethiopian government has taken SWC measures [42,43]. Since it is difficult to address conservation problems at the time, it is important to identify areas that are highly vulnerable to soil erosion for conservation measures [44,45]. Given the shortcomings in the traditional soil erosion risk assessment methods, one needs a more systematic approach to do an effective soil erosion assessment [46,47]. Significant efforts have been made at local and global levels to assess the magnitude of soil erosion risk. This has certainly made a promising ground for sustainable use planning and an appropriate SWC strategy development at the watershed or basin scales [48,49,50,51,52].
So far, many models for predicting soil erosion have been developed and applied. The major models include Modified Universal Soil Loss Equation (MUSLE), the Universal Soil Loss Equation (USLE), Morgan-Morgan-Finney (MMF), Agricultural NonPoint Source Model (AGNPS), Erosion Productivity Impact Calculator (EPIC), Water Erosion Prediction Project (WEPP), Soil and Water Assessment Tool (SWAT), and European Soil Erosion Model (EUROSEM) [53,54,55,56,57,58,59,60]. Among these models, the RUSLE is the most widely applied empirical model for offering quantitative soil erosion estimation and conservation planning around the globe [2,18,61,62,63].
Nowadays, the RUSLE, in combination with satellite remote sensing and Geographic Information Systems (GIS) mapping techniques, was found to be a convenient tool for soil loss assessment and successful conservation planning [41,64,65,66,67]. There has been many prediction model-based studies conducted in various parts of Ethiopia for soil erosion risk assessment and conservation planning by integrating them with remote sensing data and GIS technology over the past few years. For instance, Ghebreyesus et al. [41] examined the soil erosion risk in the Mai-Negus catchment in northern Ethiopia by using the Morgan-Morgan-Finney Model and reported the average annual soil loss rates of 26 t ha−1 y−1, which is above the maximum tolerable soil loss threshold predicted at the national level. Abate [5] examined soil loss rates using the RUSLE for soil conservation planning based on an erosion risk level in the Borena Woreda of South Wollo Highlands of Ethiopia. Likewise, Kiflu [68] applied RUSLE and Multi-criteria Analysis (MCA) to prioritize critical soil erosion risk areas for conservation measures in the Mojo river watershed. Ayele [69] also explored soil erosion risk using similar techniques in the Holeta watershed in Central Oromia, Ethiopia. Furthermore, Israel [70] reported the mean annual soil loss rate of 58.30 t ha−1 y−1 and recommended the implementation of conservation measures to reduce the on-site and off-site effects of soil erosion in the Dire Dam Watershed. In a related study conducted on the recently dried Lake Haramaya catchment in the East Hararghe Zone, Senti et al. [71] suggested the importance of an integrated physical soil erosion control and conservation measures to tackle the on-site and off-site effects of soil erosion. However, none of these addressed the spatial changes among different soil erosion risk grades over time. Therefore, this study was designed to (i) estimate the magnitude of soil loss rates in 2000 and 2016; (ii) assess the spatial changes among soil erosion risk classes between 2000 and 2016; and (iii) identify priority areas for SWC in the Gobele Watershed, East Hararghe Zone, Ethiopia.

2. Materials and Methods

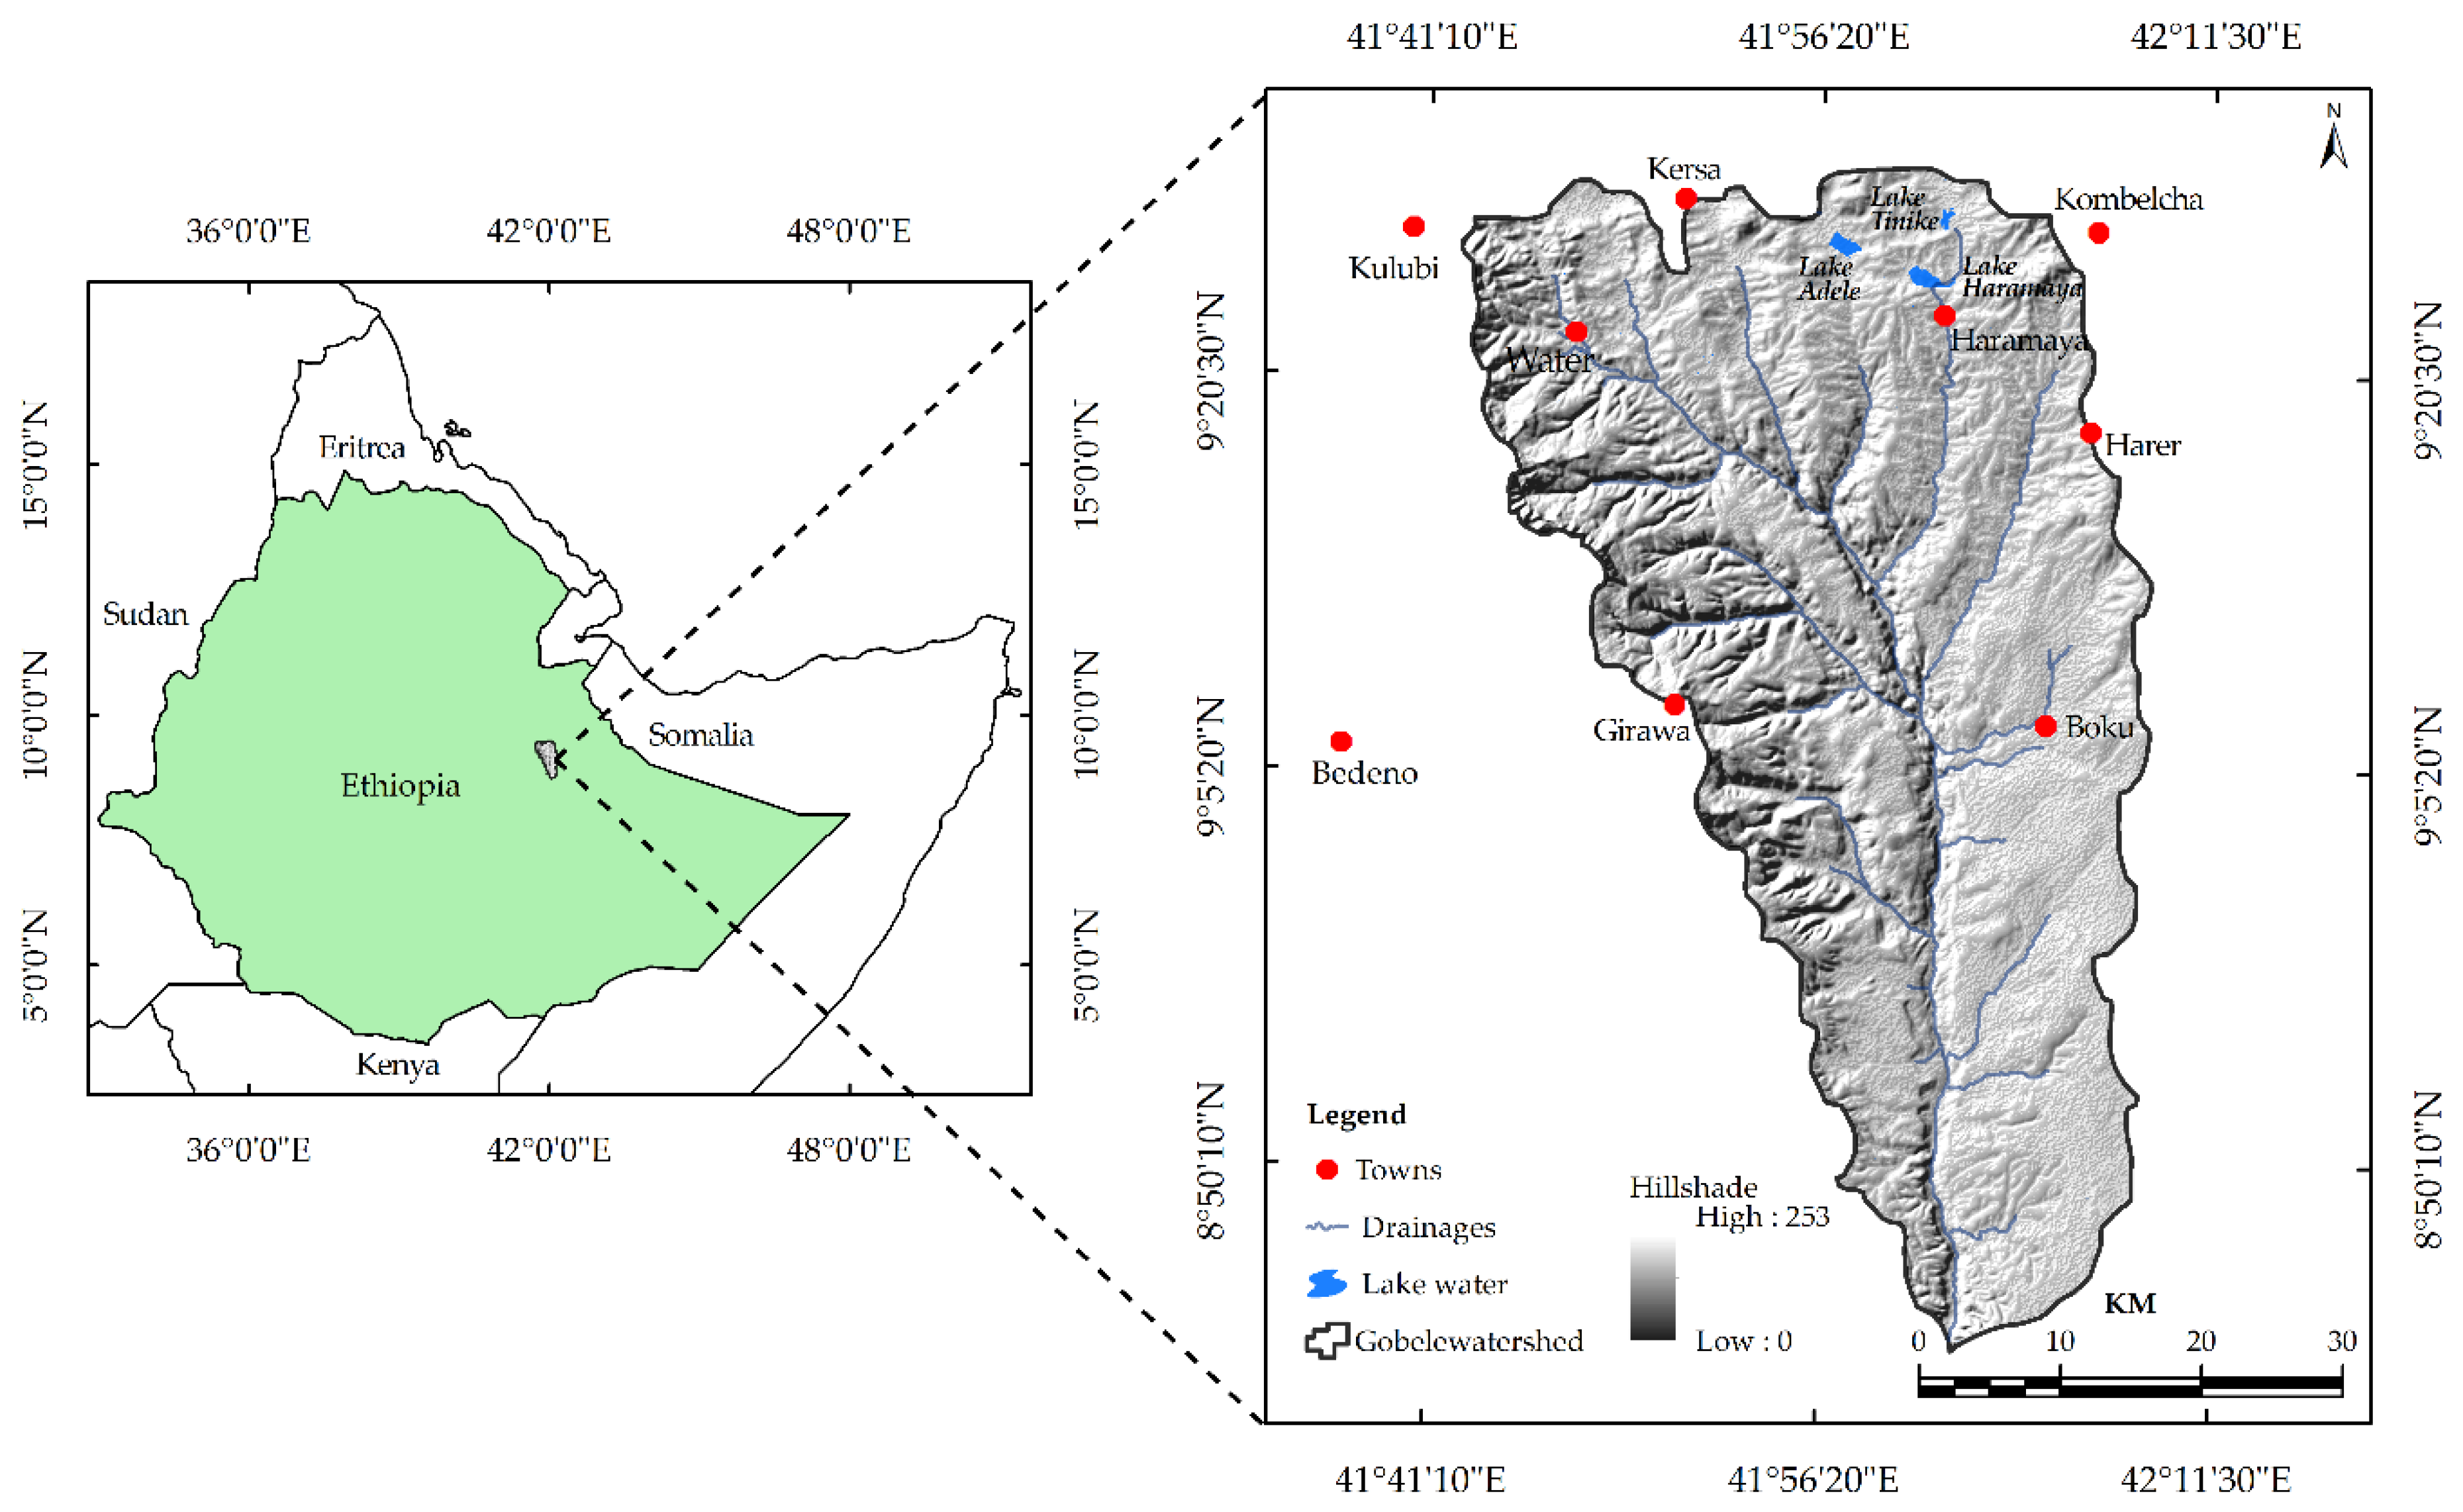
2.1. Description of the Study Area

The Gobele Watershed is located in the east Hararghe Zone, Oromia Regional State, Ethiopia. The astronomic location of the watershed extends from 8°50’10” N to 9°20’30” N latitude and from 41°41’10” E to 42°11’30” E longitude, with elevation ranging between 974 and 3,264 meters above mean sea level (Figure 1). The Gobele Watershed, with a surface area of 237,786.44 hectares, is one hydrological watershed within the Wabi Shebelle Basin. Topographically, about 77.51%, 21.58%, and 0.91% of the total study area have a slope gradient ranging from 0% to 10%, 10% to 30%, and 30% to 100%, respectively. The mean annual rainfall of the watershed is 820.01 mm, with August (152.31 mm) and April (1.16 mm) being the wettest and the driest months, respectively [72].

2.2. Data Sources

In this study, several geospatial datasets were collected and processed in a raster format to suit the RUSLE model for estimating the soil loss. We obtained the mean annual rainfall data for a period of sixteen years (1999–2015) with twelve rain gauge stations from the National Meteorological Agency (Table S1) [72]. We used two cloud-free satellite images of Landsat-7 ETM+ (Enhanced Thematic Mapper Plus) image (path/row 168/054) captured on 26 March 2000, and Landsat-8 OLI (Operational Land Imager) image (path/row 168/054) captured on 14 March 2016. The images were downloaded from the United States Geological Survey’s (USGS) Earth Explorer website [73]. In addition, a digital elevation model (DEM) with a spatial resolution of 30 m was accessed from Advanced Spaceborne Thermal Emission and Reflection Radiometer (ASTER) Global Digital Elevation Model (GDEM) website [74]. The soil data covering the study area was accessed from the FAO website in Environmental System Research Institute (ESRI) shapefile format [75]. Furthermore, field observation was made between September 2016 and November 2016 to collect reference data of land use/land cover (LULC) classes. A total of 150 ground truth data were collected from the field stratified proportional to each LULC class to support image classification and accuracy verification. Handheld Global Positioning System (GPS) was used to collect the required data. Figure 2 shows sampled LULC types in the study area.

2.3. Methods

2.3.1. Satellite Images Preprocessing

Before LULC classification and change detection, one should preprocess the distorted and degraded images to ensure the results of adequate quality with a more correct and faithful representation of the real ground scene. In the context of the current study, this involved removing or diminishing any undesirable image characteristics that occurred during the acquisition process [76,77]. This was applied to all raw Landsat image data on board ETM+ and OLI sensors. The Landsat images were preprocessed at each band level using the ENVI software version 5.1 (Exelis Visual Information Solutions, Inc. Boulder, CO, USA). The first step involved the re-projection of the Landsat images into World Geodetic System (WGS 84) spheroid, a spatial reference system of the Universal Transverse Mercator (UTM) with Datum Zone 37 N. The preprocessing includes a series of sequential operations. This includes an atmospheric and radiometric correction to diminish the effects of clouds and the sun elevation angle of satellite images taken during different periods and from different sensors. Geometric rectification accurately links the Landsat imagery with a ground truth data and other ancillary data sets, and masking operations [78,79]. Then, single-band images were combined to get multi-band composite images [80]. Additionally, image enhancement operations, including density slicing, contrast adjustment, edge enhancement and color composite were employed to enhance the interpretability of image data [81]. Since the entire scene of ETM+ and OLI images respectively covers 170 km by 185 km and a 190 km by 180 km surface area [73], the area of interest (AOI) that covers the study area (237,786.44 ha) was extracted using vector polygon layer and the subset tool available in ERDAS IMAGINE software version 10 (ERDAS, Inc., Norcross, GA, USA).

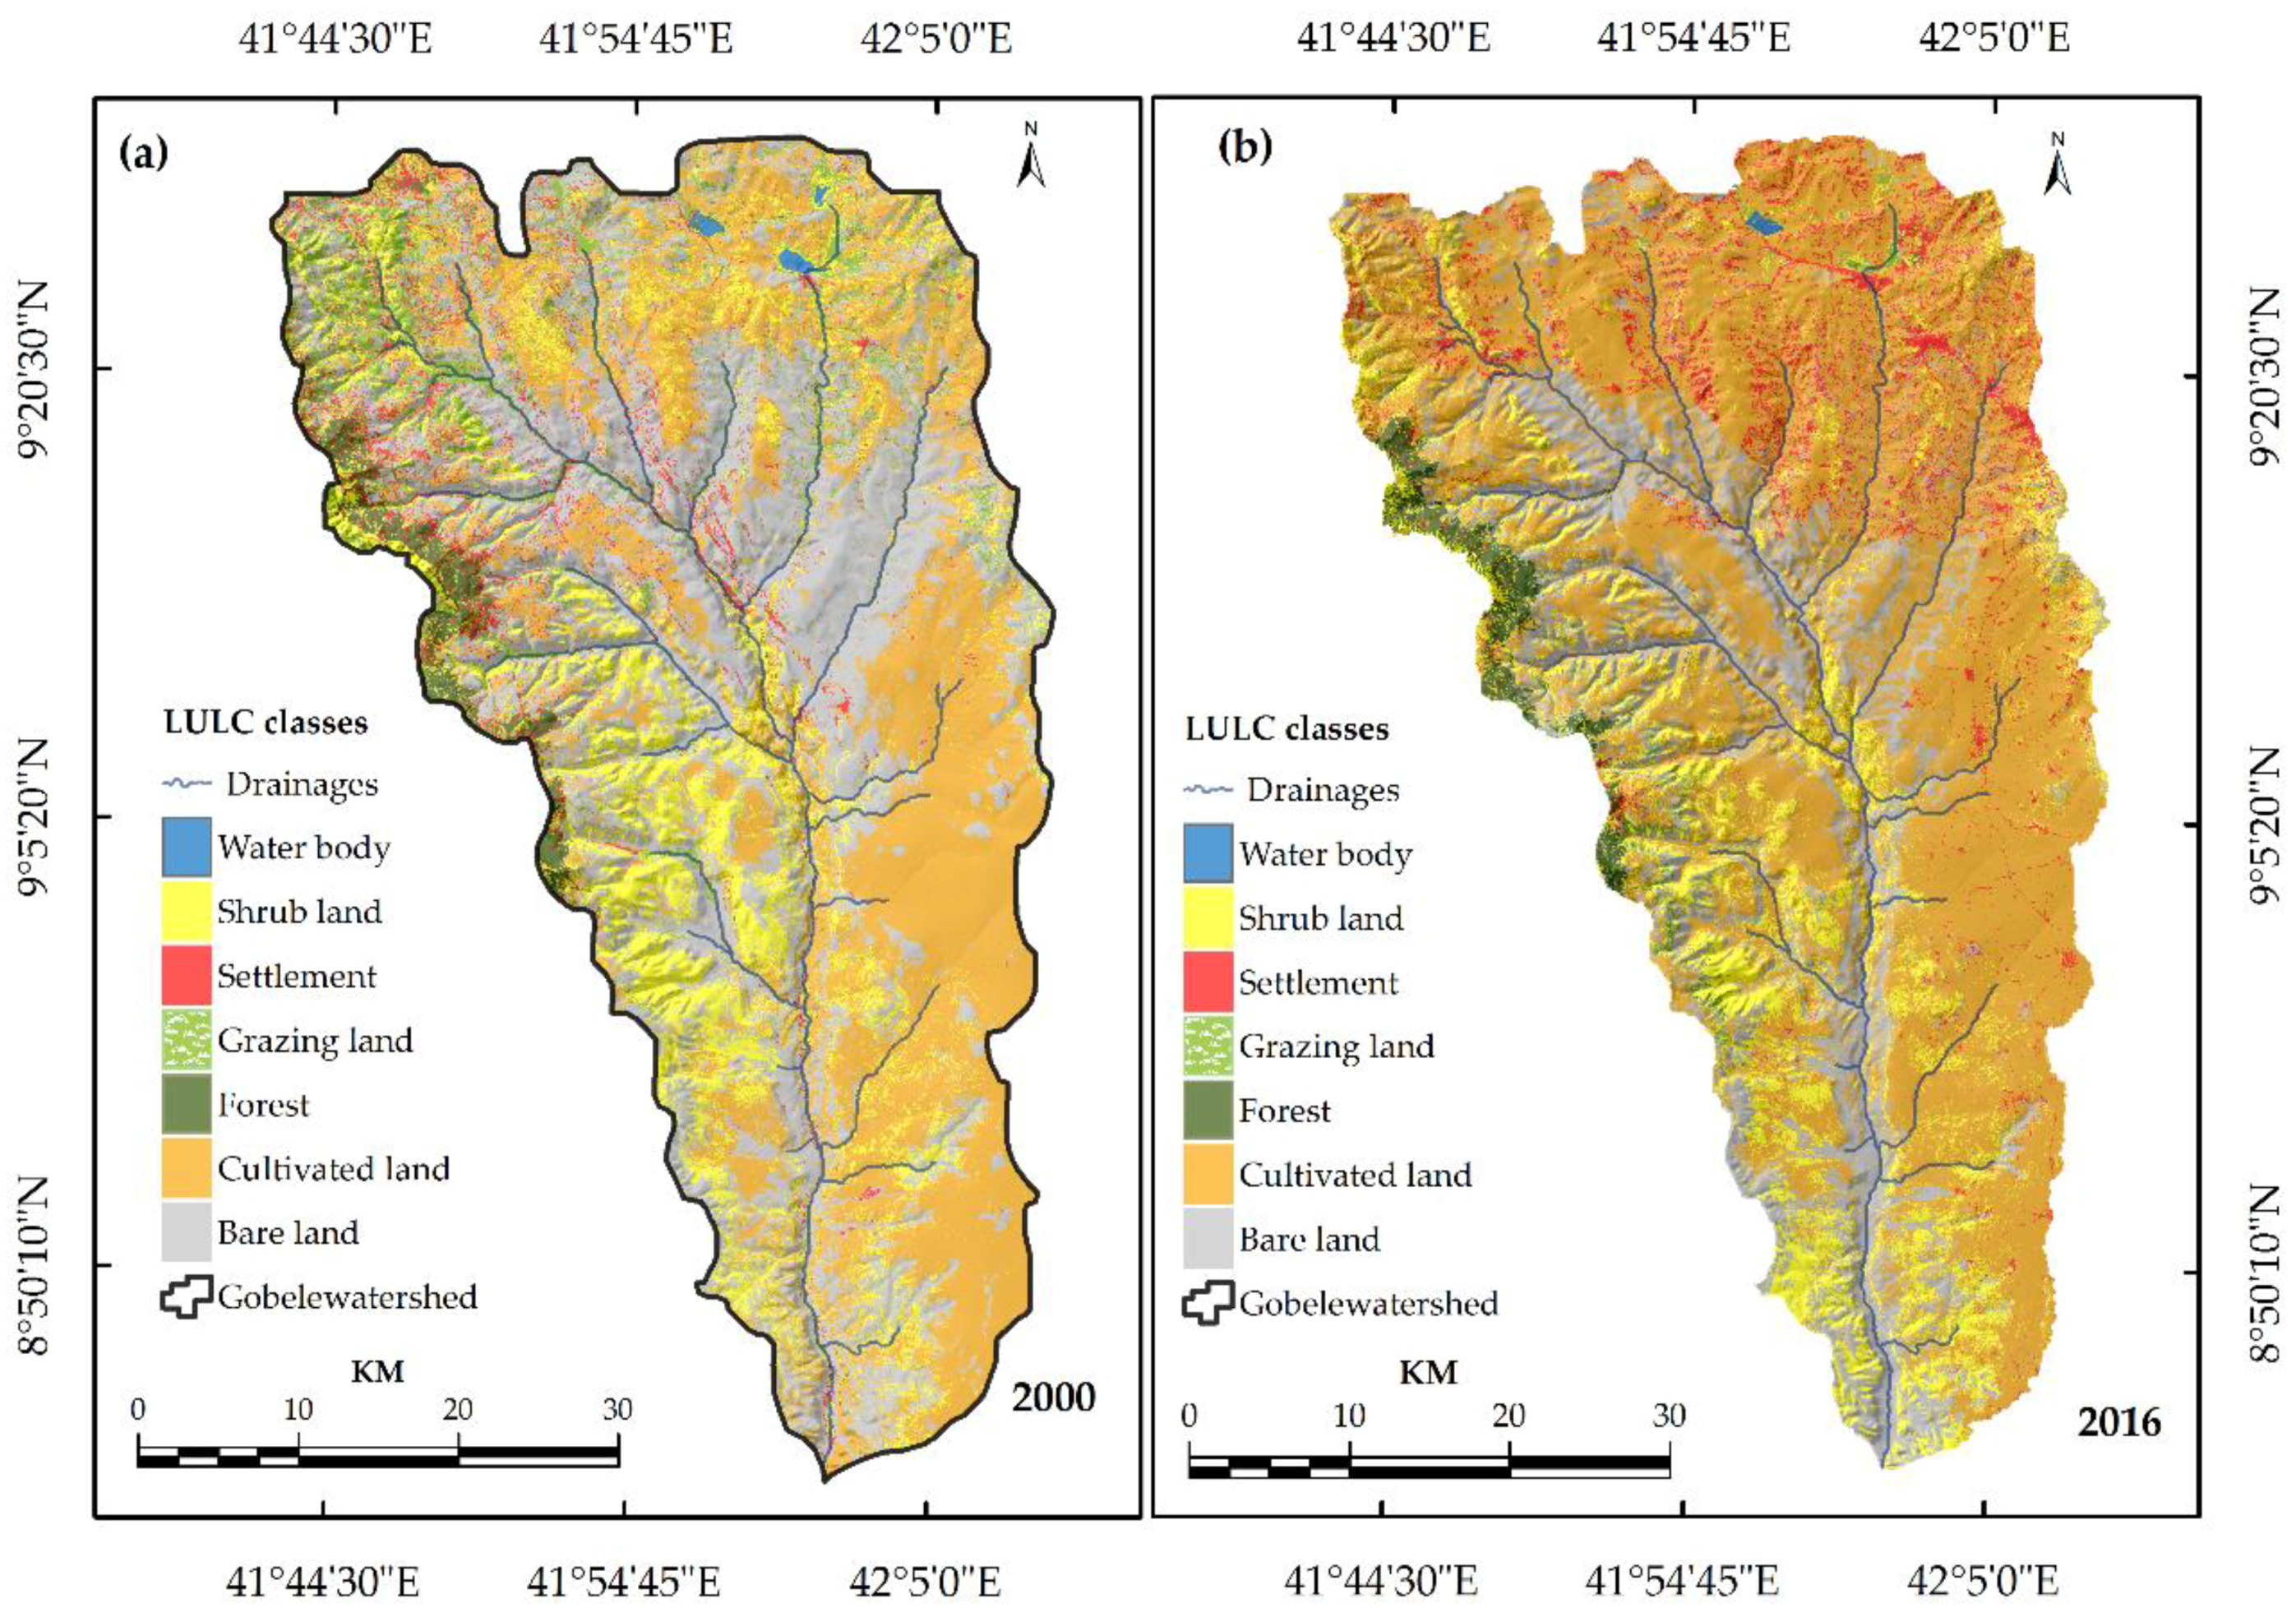
2.3.2. LULC Classification

We used a computer-aided digital image classification procedure to classify satellite images to generate thematic LULC maps of the study area based on known features on the ground [82]. For this purpose, the training signatures were collected for each LULC class from satellite images aided by sampled field reference data, and knowledge of experts and people of the locality about the earlier state of land cover in the watershed. A supervised classification method based on the Maximum Likelihood Classifier (MLC) was applied to classify the Landsat image of 2000 and 2016 separately [83,84]. We applied a 3 × 3 moving window majority filtering operation for neighboring cells in classified LULC images to minimize salt-and-pepper effects. A total of seven LULC classes were identified in the study area for the years 2000 and 2016 (Table 1). This includes bare land, cultivated land, settlements, forest, grazing land, shrubland, and water body, with a share of each class in 2000 contributes 67,021.03 ha (28.19% of the total study area), 64,159.60 ha (26.98% of the total study area), 1199.16 ha (0.50% of the total study area), 7728.48 ha (3.25% of the total study area), 299.16 ha (0.13% of the total study area), 96,822.90 ha (40.72% of the total study area), and 556.11 ha (0.23% of the total study area), respectively (Figure 3a). As shown in Table 1, each LULC class in 2016 accounted for 49,932.80 ha (21% of the total study area), 135,972.81 ha (57.18% of the total study area), 13,320.50 ha (5.60% of the total study area), 4794.84 ha (2.02% of the total study area), 1863.97 ha (0.78% of the total study area), 31,704.40 ha (13.33% of the total study area), and 197.12 ha (0.08% of the total study area), respectively (Figure 3b). During the study period, shrubland, bare land, forest, water body have decreased from 96,822.90 ha (40.72% of the total study area), 67,021.03 ha (28.19% of the total study area), 7728.48 ha (3.25% of the total study area), and 556.11 ha (0.23% of the total study area) to 31,704.40 ha (13.33% of the total study area), 49,932.80 ha (21% of the total study area), 4794.84 ha (2.02% of the total study area), and 197.12 ha (0.08% of the total study area), respectively. On the contrary, areas covered by cultivated land, settlements, and grazing lands have increased from 64,159.60 ha (26.98% of the total study area), 1199.16 ha (0.50% of the total study area), and 299.16 ha (0.13% of the total study area) to 135,972.81 ha (57.18% of the total study area), 13,320.50 ha (5.60% of the total study area), and 1863.97 ha (0.78% of the total study area), respectively.

2.3.3. Accuracy Assessment

The thematic layers of the classified LULC images for 2000 and 2016 were validated using ground truth data. Out of the total sampled ground truth data collected from the field stratified proportionally to each LULC classes, we used 50 points as a reference data for image classification. The remaining 100 points were used to examine the classification accuracy of the LULC images. A lack of field reference data on the state of historical LULC of the study area necessitated using knowledge of the local elders and experts to minimize the misclassification of remote sensing images. Thus, the ground truth data collected between September 2016 and November 2016 were used as a reference for image classification and validation of classification accuracy in 2000 and 2016. We calculated the classification accuracy in terms of producers’ and users’ accuracy, overall accuracy, and Kappa Statistics [85]. The results revealed that the overall classification precision obtained per LULC map in 2000 and 2016 was 84.26% and 94.44%, respectively (Table 2). The Overall Kappa Statistics (K^) calculated for each LULC images in 2000 and 2016 were 0.815% and 0.934%, respectively. The highest producers/users and K^ is found in the water bodies and cultivated land in classified images for 2000 and 2016.

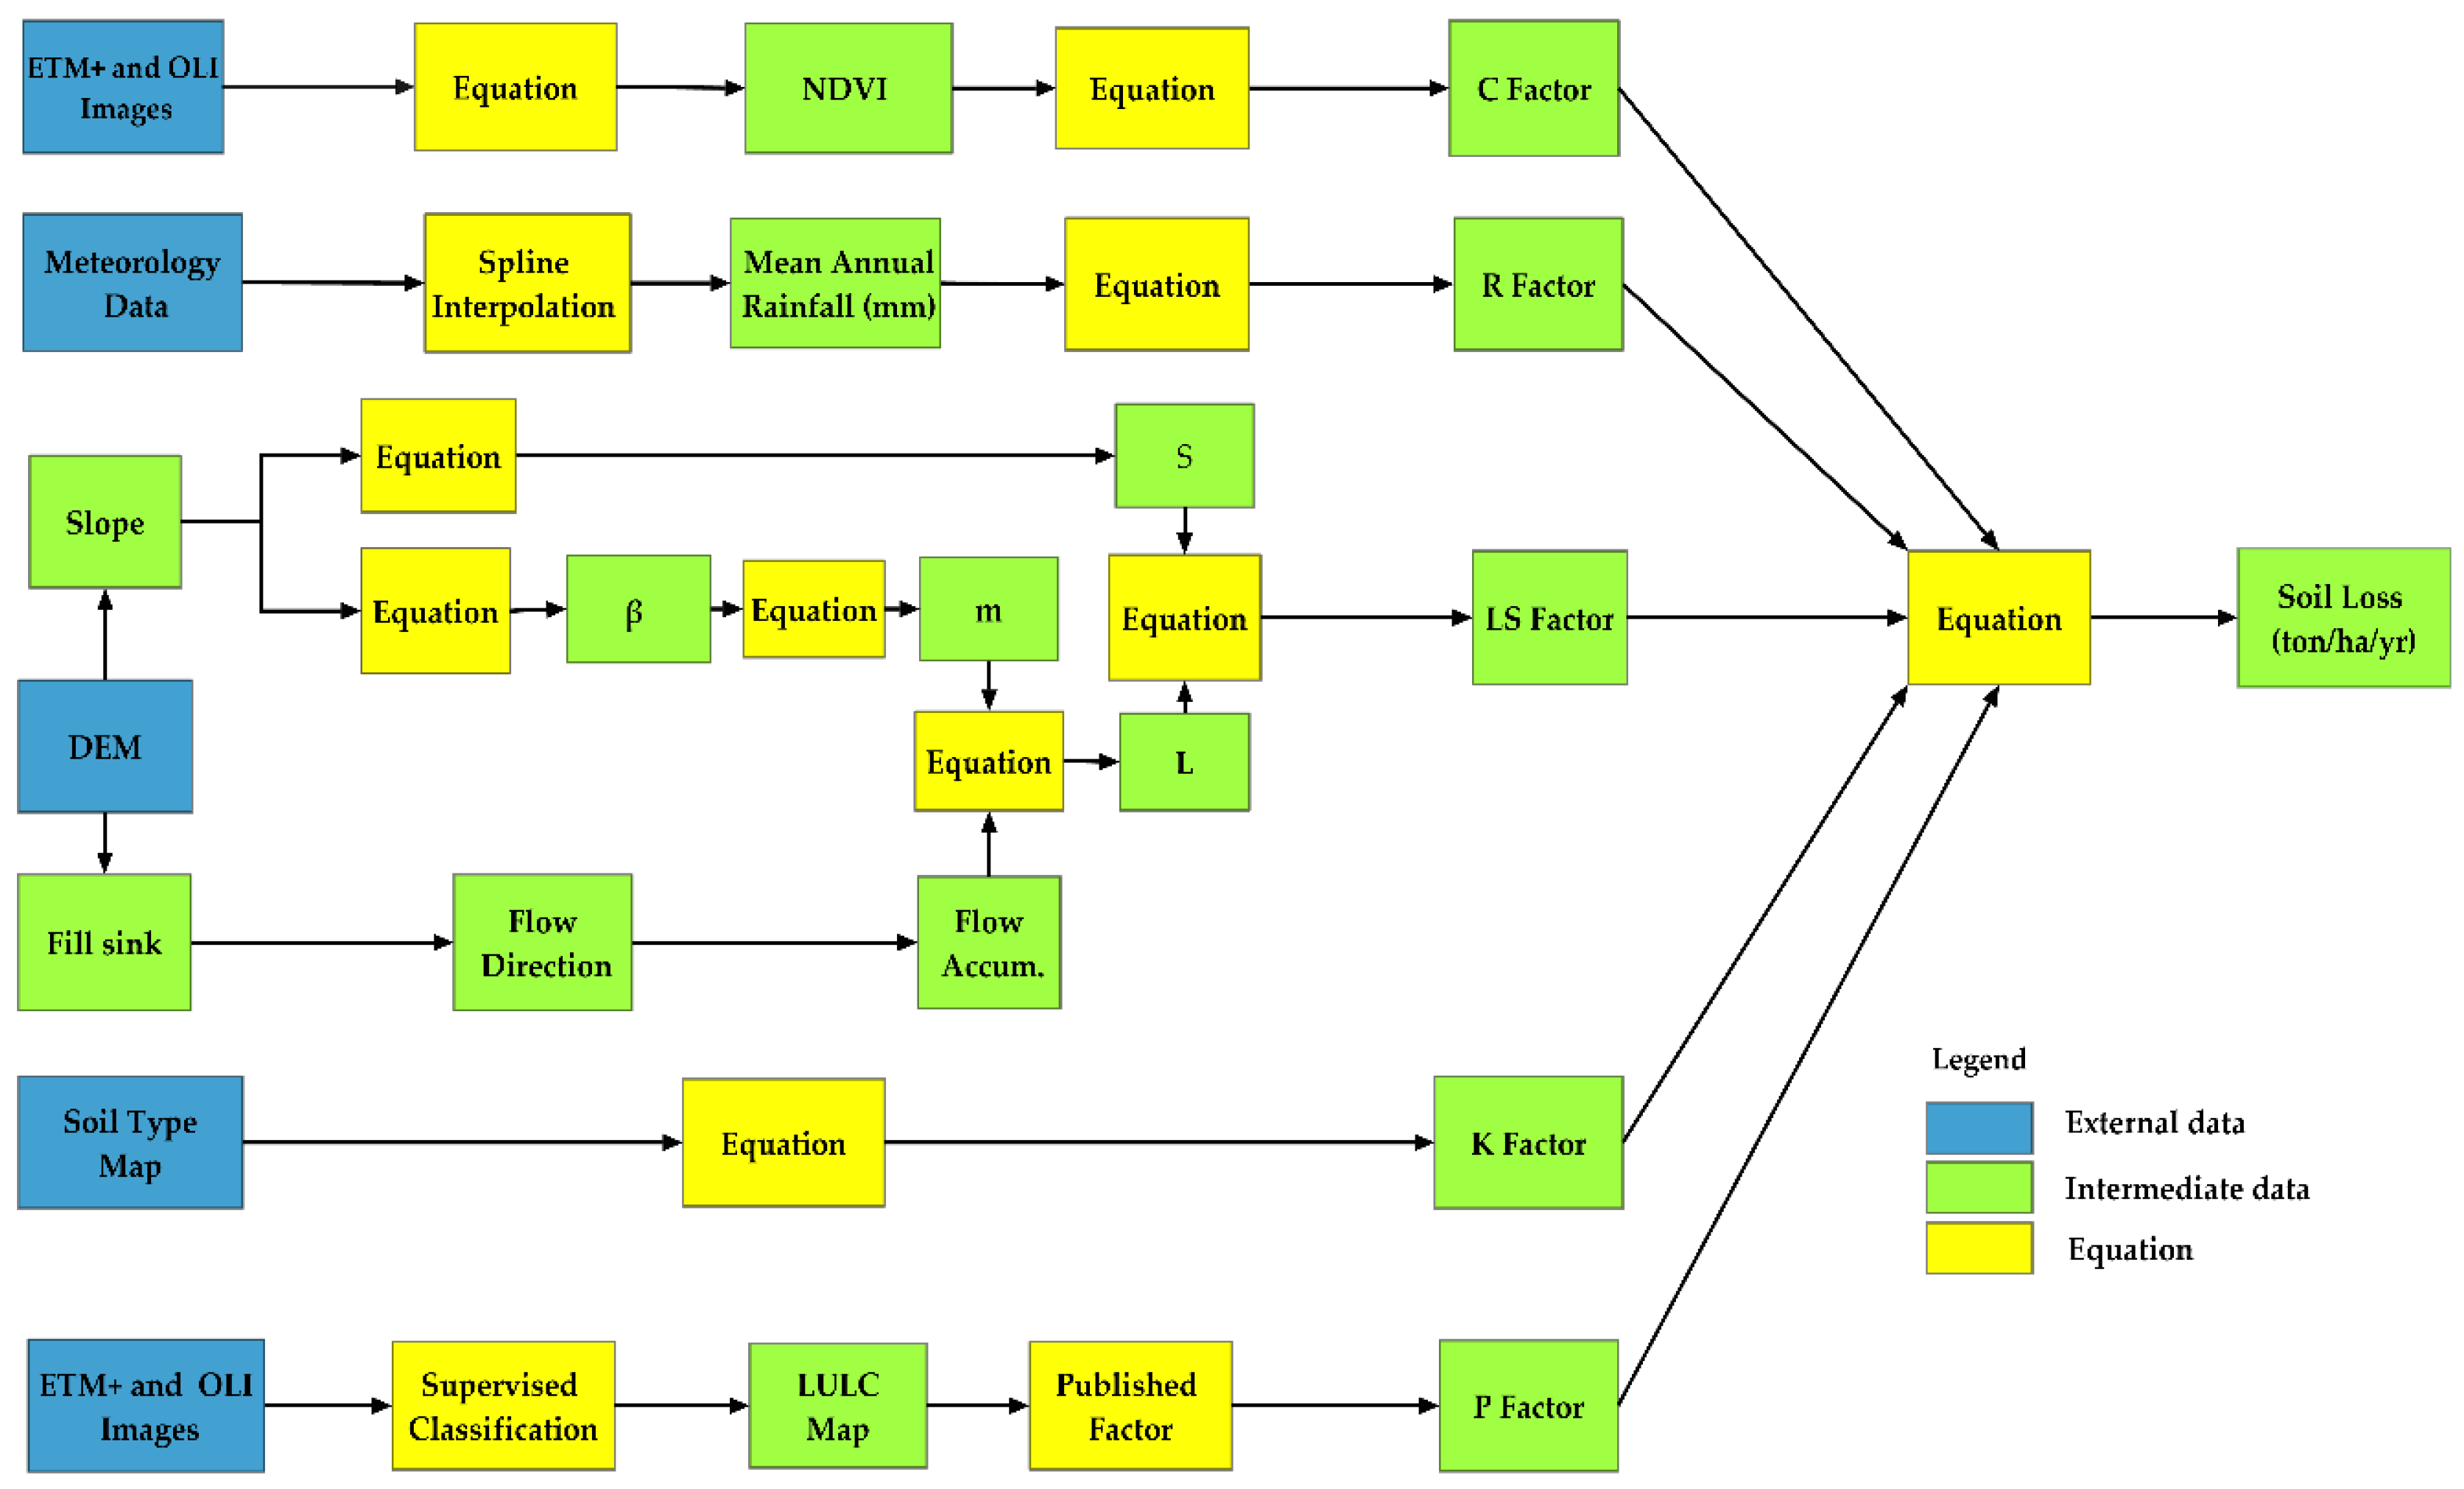
2.3.4. Development of the RUSLE Model Factors

The RUSLE is a practical tool for predicting the long-term average annual soil loss attributed to raindrop splash and runoff [63]. According to Jiang et al. [16], “to build the quantification model, as many as possible of the criteria that influence soil erosion should be taken into consideration.” In the present study, we used the empirical prediction model of RUSEL, which is easily applicable in different scales with Geographic Information system (GIS) tools [86,87]. The application of RUSLE model require five factors: rainfall erosivity (R) factor, soil erodibility (K) factor, slope length and steepness (LS) factor, cover management (C) factor, and conservation practice (P) factor determined in an ArcGIS environment (Figure 4) and multiplied together to estimate the amount of the soil loss rates (Equation (1)) [63]. Since the input model layers were acquired from various sources, and at varying scales, resampling procedures provided in digital analysis tools need to apply for the input datasets to be compatible with each other [86,87,88,89].
A   =   R   ×   K   ×   LS   ×   C   ×   P
where A is average annual soil loss (t ha−1 y−1); R is the rainfall-runoff erosivity factor; K is a soil erodibility factor; LS is a slope length-steepness factor (dimensionless); C is a cover management factor (dimensionless), and P is a support practice factor (dimensionless).
The RUSLE model was run to estimate the soil loss rate for the year 2000 and 2016 separately. Erosion risk area was categorized into eight classes from very low to extremely high, following Uddin et al. [90] for Koshi Basin. Classification of soil erosion risk area was based on the estimated rate of mean annual soil loss (Table 3). By overlaying thematic soil erosion risk map for 2000 and 2016 using a transformation matrix (GIS analysis), the study obtained information about spatial changes among the erosion risk class between 2000 and 2016. Moreover, conservation priority levels were obtained to support the spatial planning and implementation of SWC measures in the study area. Prioritization was based on soil loss assessment results and change in erosion risk classes between 2000 and 2016 with the help of MCDR method [90,91,92]. We set the highest value for areas with a high and increasing risk of soil erosion.

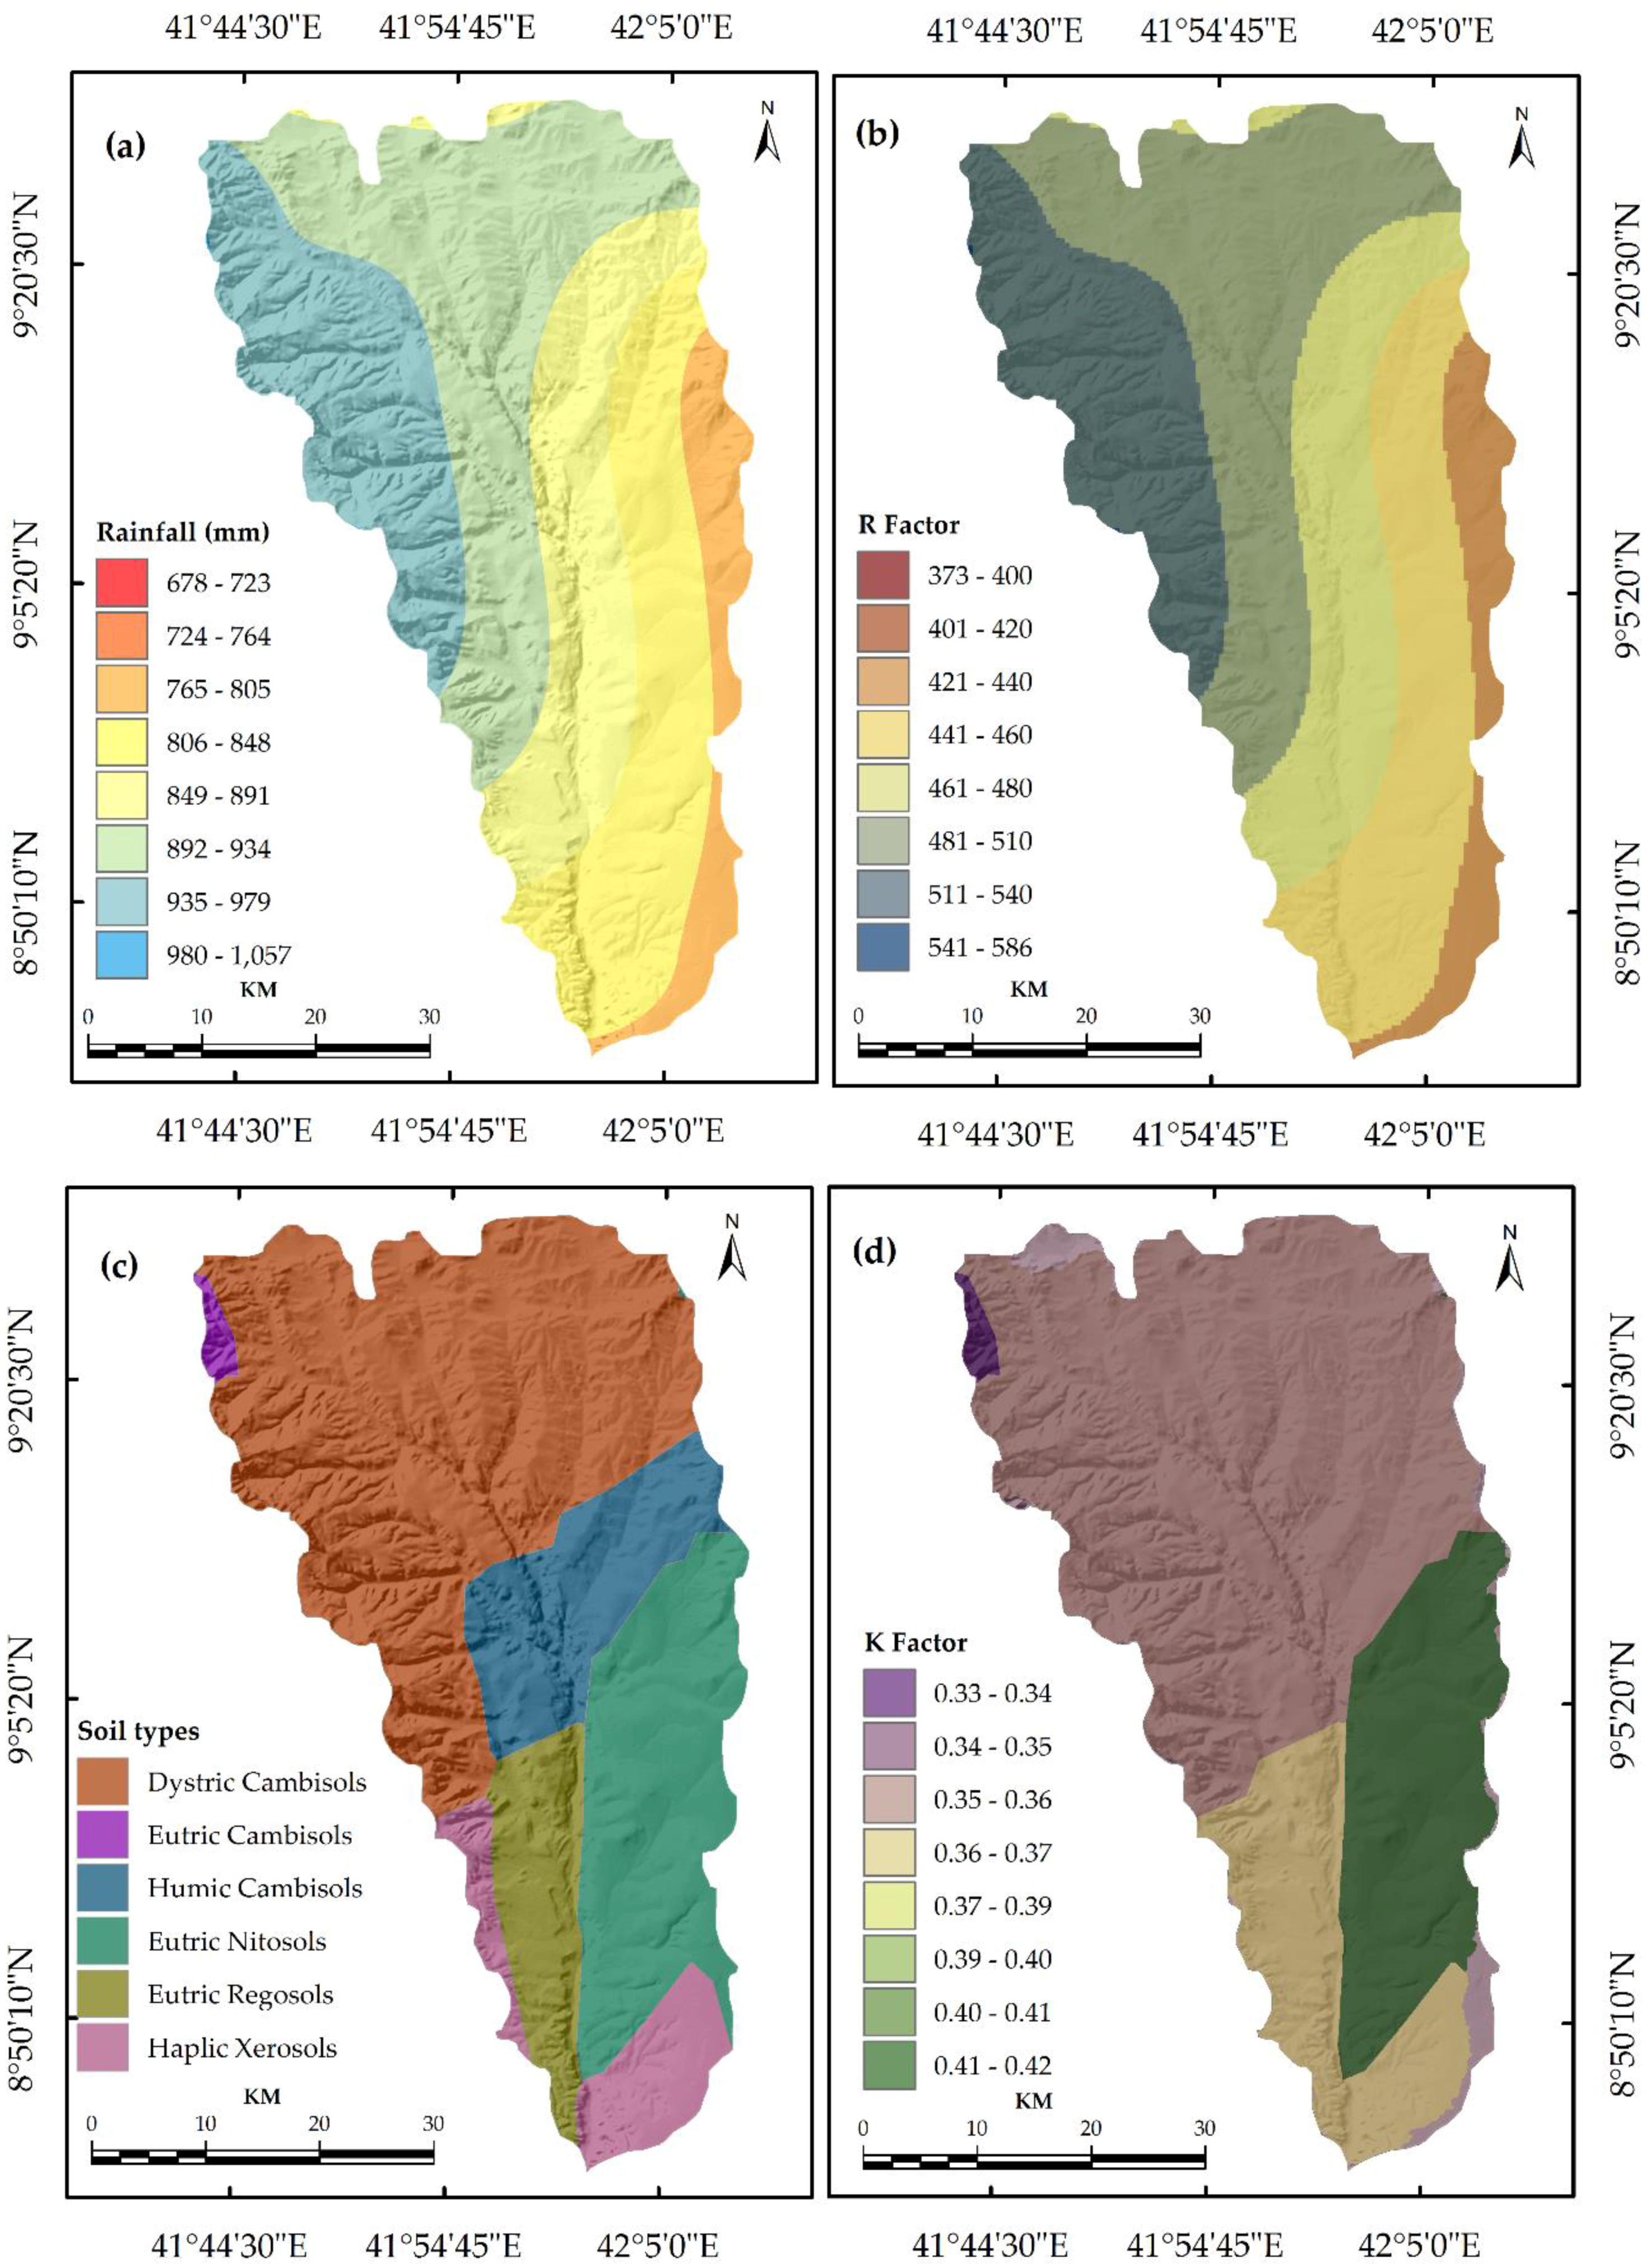
Rainfall Erosivity (R) Factor

The R factor reflects the ability of rainfall-runoff to erode the soil particles due to the joint effect of rainfall kinetic energy, duration, and potential [93]. We calculated a mean annual rainfall data using the mean yearly rainfall data covering the period from 1999 to 2015. It follows that the rainfall spatial distribution of the study area was mapped using the spline interpolation method. Finally, spatially distributed R factor value was calculated by Equation (2) (Figure 5b and Table S1) [94,95].
R =   [ 38.46   +   ( 3.48   ×   P ) ]
where P is an annual rainfall (mm).

Soil Erodibility (K) Factor

The K factor corresponds to the rate of soil loss per rainfall erosion index unit measured on a standard plot by taking into consideration the inherent soil properties [96]. It is the average prolonged effects of soil profile characteristics, soil properties (e.g., soil texture, size, thickness, organic matter, clay type, and permeability) and human activities on soil loss [22,61,63,97,98,99]. The erodibility of a soil caused by rainfall-runoff will increase proportionally with an increase in the amount of fine sand and silt contents [97,98,99,100]. For instance, the finer and the richer the soil texture in a clay ratio is, a more resistant is soil to particle detachment and the lower the soil erodibility factor is and vice versa. Moreover, the content of the organic matter is a key factor that decides erodibility of soil layers. It contributes to the increment of particle aggregation (due to the presence of chelating agents) and water infiltration [100,101]. When the K factor value of a specific soil class gets higher, more erosion occurs as the soils are exposed to the erosive force of rainfall, splash, or surface flow [102]. According to Yahya et al. [103] the soil erodibility value mostly ranges between 0 and 1, where 0 shows the soil class’s sensitivity to erosion while 1 is the high susceptibility of soil class to water erosion (Figure 5c,d). The K factor value was estimated based on a formula adapted from published literature [104,105,106,107] with the FAO harmonized digital soil map [75] as follows:
K U S L E =   f c s a n d .   f c l s i ·   f orgC · f h i s a n d
where fcsand is a factor that lowers the K indicator in soils with a high proportion of coarse-sand content and higher for soils with little sand; fcl−si gives low soil erodibility factors for soils with a high clay-to-silt ratio; forgC reduces the K values in soils with a high organic carbon content while fhisand reduce the K value of soil classes with high sand contents (Table S2). The f c s a n d , f c l s i   ,   f orgC   and fhisand was calculated using Equations (4)–(7) [101,104]:
f c s a n d = ( 0.2 + 0.3 · E x p [ 0.256 · m s · ( 1   +   m s i l t 100 ) ]   )
f c l s i   = ( m s i l t m c + m s i l t ) 0.3
f orgC   =   ( 1.0 0.256   · orgC orgC + e x p [ 3.72 2.95 . orgC ] )
f h i s a n d =   ( 1.0 0.7   · ( 1 m s 100 ) ( 1 m s 100 ) + E x p [ 5.51 + 22.9 ( 1 m s 100 ) ] )
The highest soil erodibility (K) factor value was found in the Eutric Nitosols (0.42 t h MJ−1 mm−1), while the lowest is in Eutric Camisoles (0.33 t h MJ−1 mm−1) along the southeastern and northwestern part of the watershed (Figure 5d).

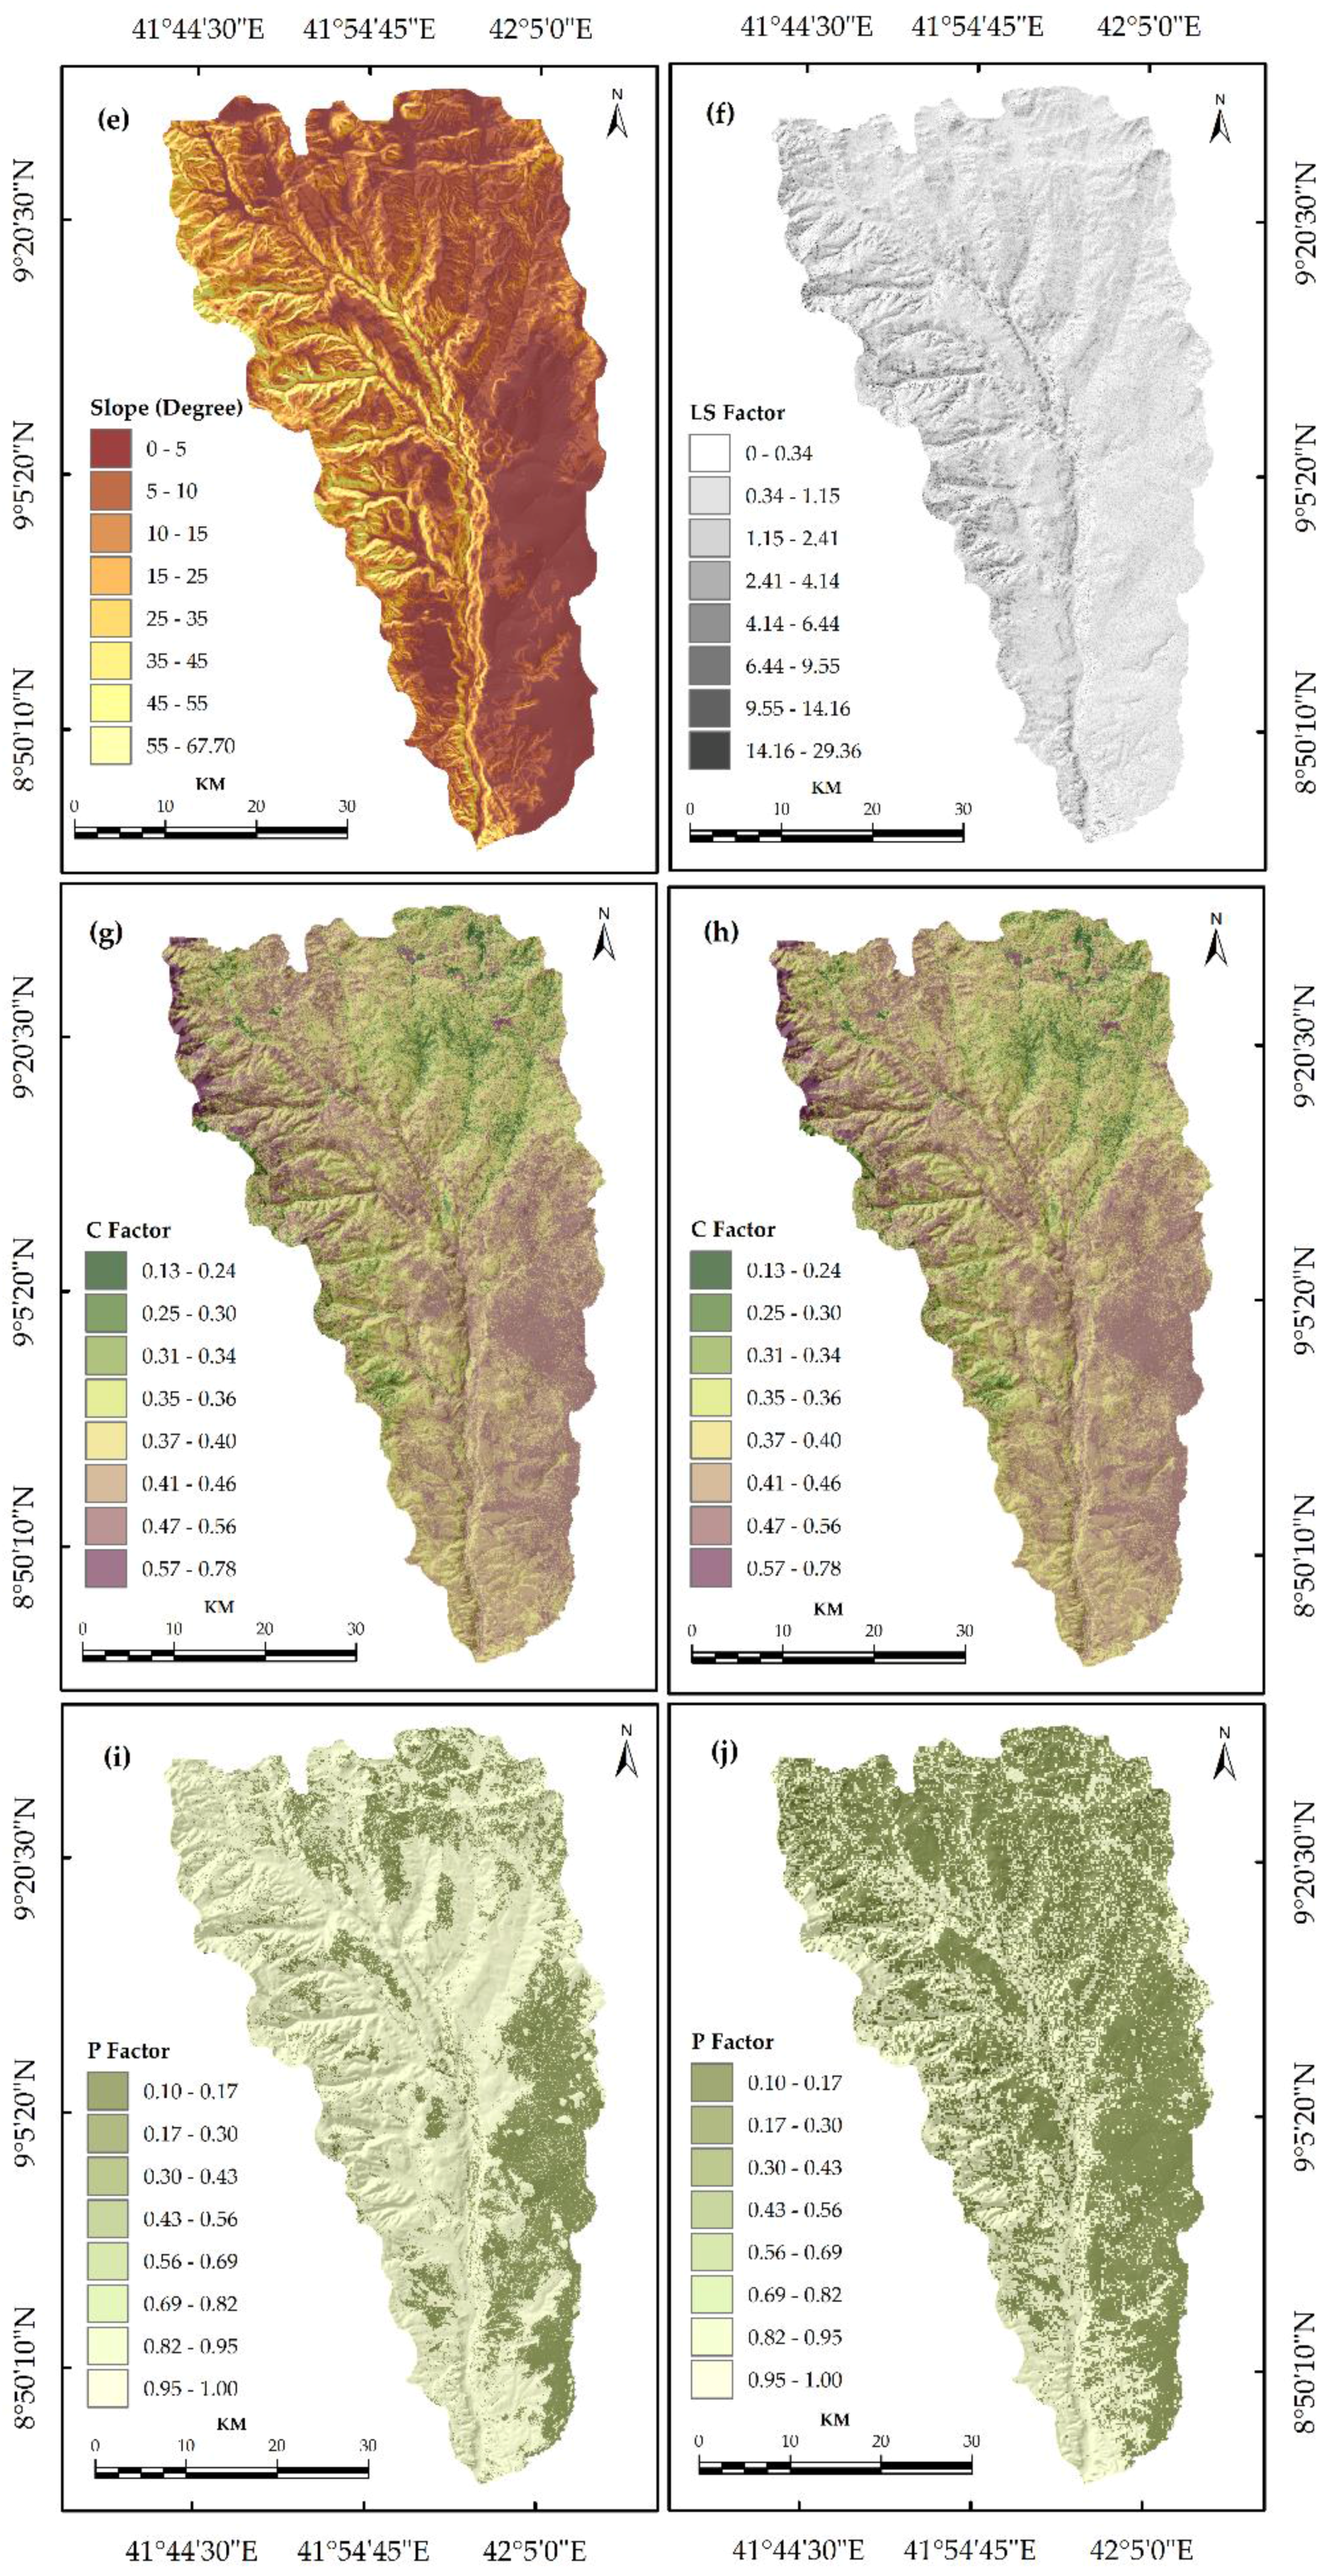
Slope Length and Steepness (LS) Factor

The slope length (L) and steepness (S) factor reflect the effect of terrain and topography on soil erosion [61]. The increase in slope length (L) and slope steepness (S) can result in the higher overland flow speed and higher erosion [1,63,103]. The specific effects of topography on soil erosion are estimated by the dimensionless LS factor as the product of the slope length (L) and slope steepness (S) constituents converge into a point of interest [5,108]. The LS factor is a ratio of soil loss under a given condition of a site for a slope length of 22.13 meters and slope steepness of 9%, free of vegetation and left in a seedbed condition [5,61]. The LS factor (Figure 5f) was calculated from the ASTER DEM of 30-m grid size of the watershed area with the Arc-Hydro extension and raster calculator tool of the ArcGIS software version 10.3 (Environment Systems Research Institute (Esri), Inc. Redlands, CA, USA) [53,86,103,109].
L = ( λ 22.13 ) m
where, L is a slope length factor, λ is the field slope length in meters, and m is a variable slope length exponent related the value of the slope gradient (Figure 5e): 0.5 for slopes steeper than 4.5%; 0.4 for slopes from 3% to 4.5%; 0.3 for slopes from 1% to 3%, and 0.2 on slopes less than 1%.
Given the uneven distribution of slope gradients over the study area, the slope steepness (S) was sub-divided into segments using Equation (9) [110,111], as follows:
L i , j =   ( A i , j i n + D 2 ) m + 1 A i , j i n m + 1 D m + 1 × x i , j m × 22.13 m
where A i , j i n   is the contributing area at the inlet of the grid cell (i, j) is measured in m2; D is the grid cell size (meters); xi,j is sin a i ,   j + cos a i , j ; A𝑖,𝑗 is the aspect direction of the grid cell (i, j); m is the slope length exponent related to the ratio of β of rill erosion and interill erosion Equations (10) and (11) [107,109]:
m = ( β 1 + β )
where,
β   =   sin θ 0.0896 [ 0.56 + 3 × ( sin θ ) 0.8 ]
θ is slope steepness angle in degrees was calculated by Equation (12) [112] as:
S = 10.8 sin θ + 0.03 ,   where   slope   gradient < 0.09
S = 16.8 sin θ 0.5 ,     where   slope   gradient 0.09

Cover Management (C) Factor

The C factor is typically associated with the effects of cropping and management practices on soil erosion [14,108]. It is the ratio of soil loss from land with specific vegetation to the corresponding soil loss under clean tilled continuous fallow or management systems to reduce erosion [54,63]. The C factor is a dimensionless factor that ranges from 0 for a completely non-erodible condition in areas with high plant cover to 1 which corresponds to the greater magnitude of soil loss due to very extensive tillage, leaving a very smooth surface that produces much runoff and makes the soil susceptible to erosion [22,63]. In this study, the C factor was derived from the Normalized Difference Vegetation Index (NDVI) interpreted using image data from ETM+ and OLI sensors (Figure 5g,h). The equation to calculate the spectral indices of NDVI is as follows [113,114]:
NDVI = NIR Red NIR + Red  
where NIR is the reflectance of near infrared bands, Band 4 of ETM+ and Band 5 of OLI, while Red is the reflectance of visible red bands, which are Band 3 of ETM+ and Band 4 of OLI imagery. The spatial distribution of the C factor was calculated using Equation (14) [115]:
C = ( ( 1 NDVI ) / 2 )

Support Practice (P) Factor

The P factor reflects the effect of soil conservation practices that reduce the amount and rate of erosion by rainfall-runoff [116]. The P factor is mechanical practices such as the effects of contouring, strip cropping, or terracing and the resultant average annual soil loss rate due to water erosion [103]. The P factor ranges between 0 and 1, where the value closer to 0 shows good conservation practices and the values close to 1 is showing little conservation practices [47]. Several studies have tried to generate the P factor value considering the slope gradient and conservation practices [54,87,117,118]. Due to a lack of field data concerning the conservation practices that have been implemented in the study area, the P factor value corresponds to LULC classes was adopted from published literature [67,119]. The values of the P factor were set to 1.00, 0.40, 0.10, 0.3, 1.00, 1.00, and 0.00 for the bare land, cultivated land, forest, grazing land, settlement, shrubland, and water bodies, respectively. Figure 5i,j display the spatial distribution of the P factor in the study area in 2000 and 2016.

3. Results

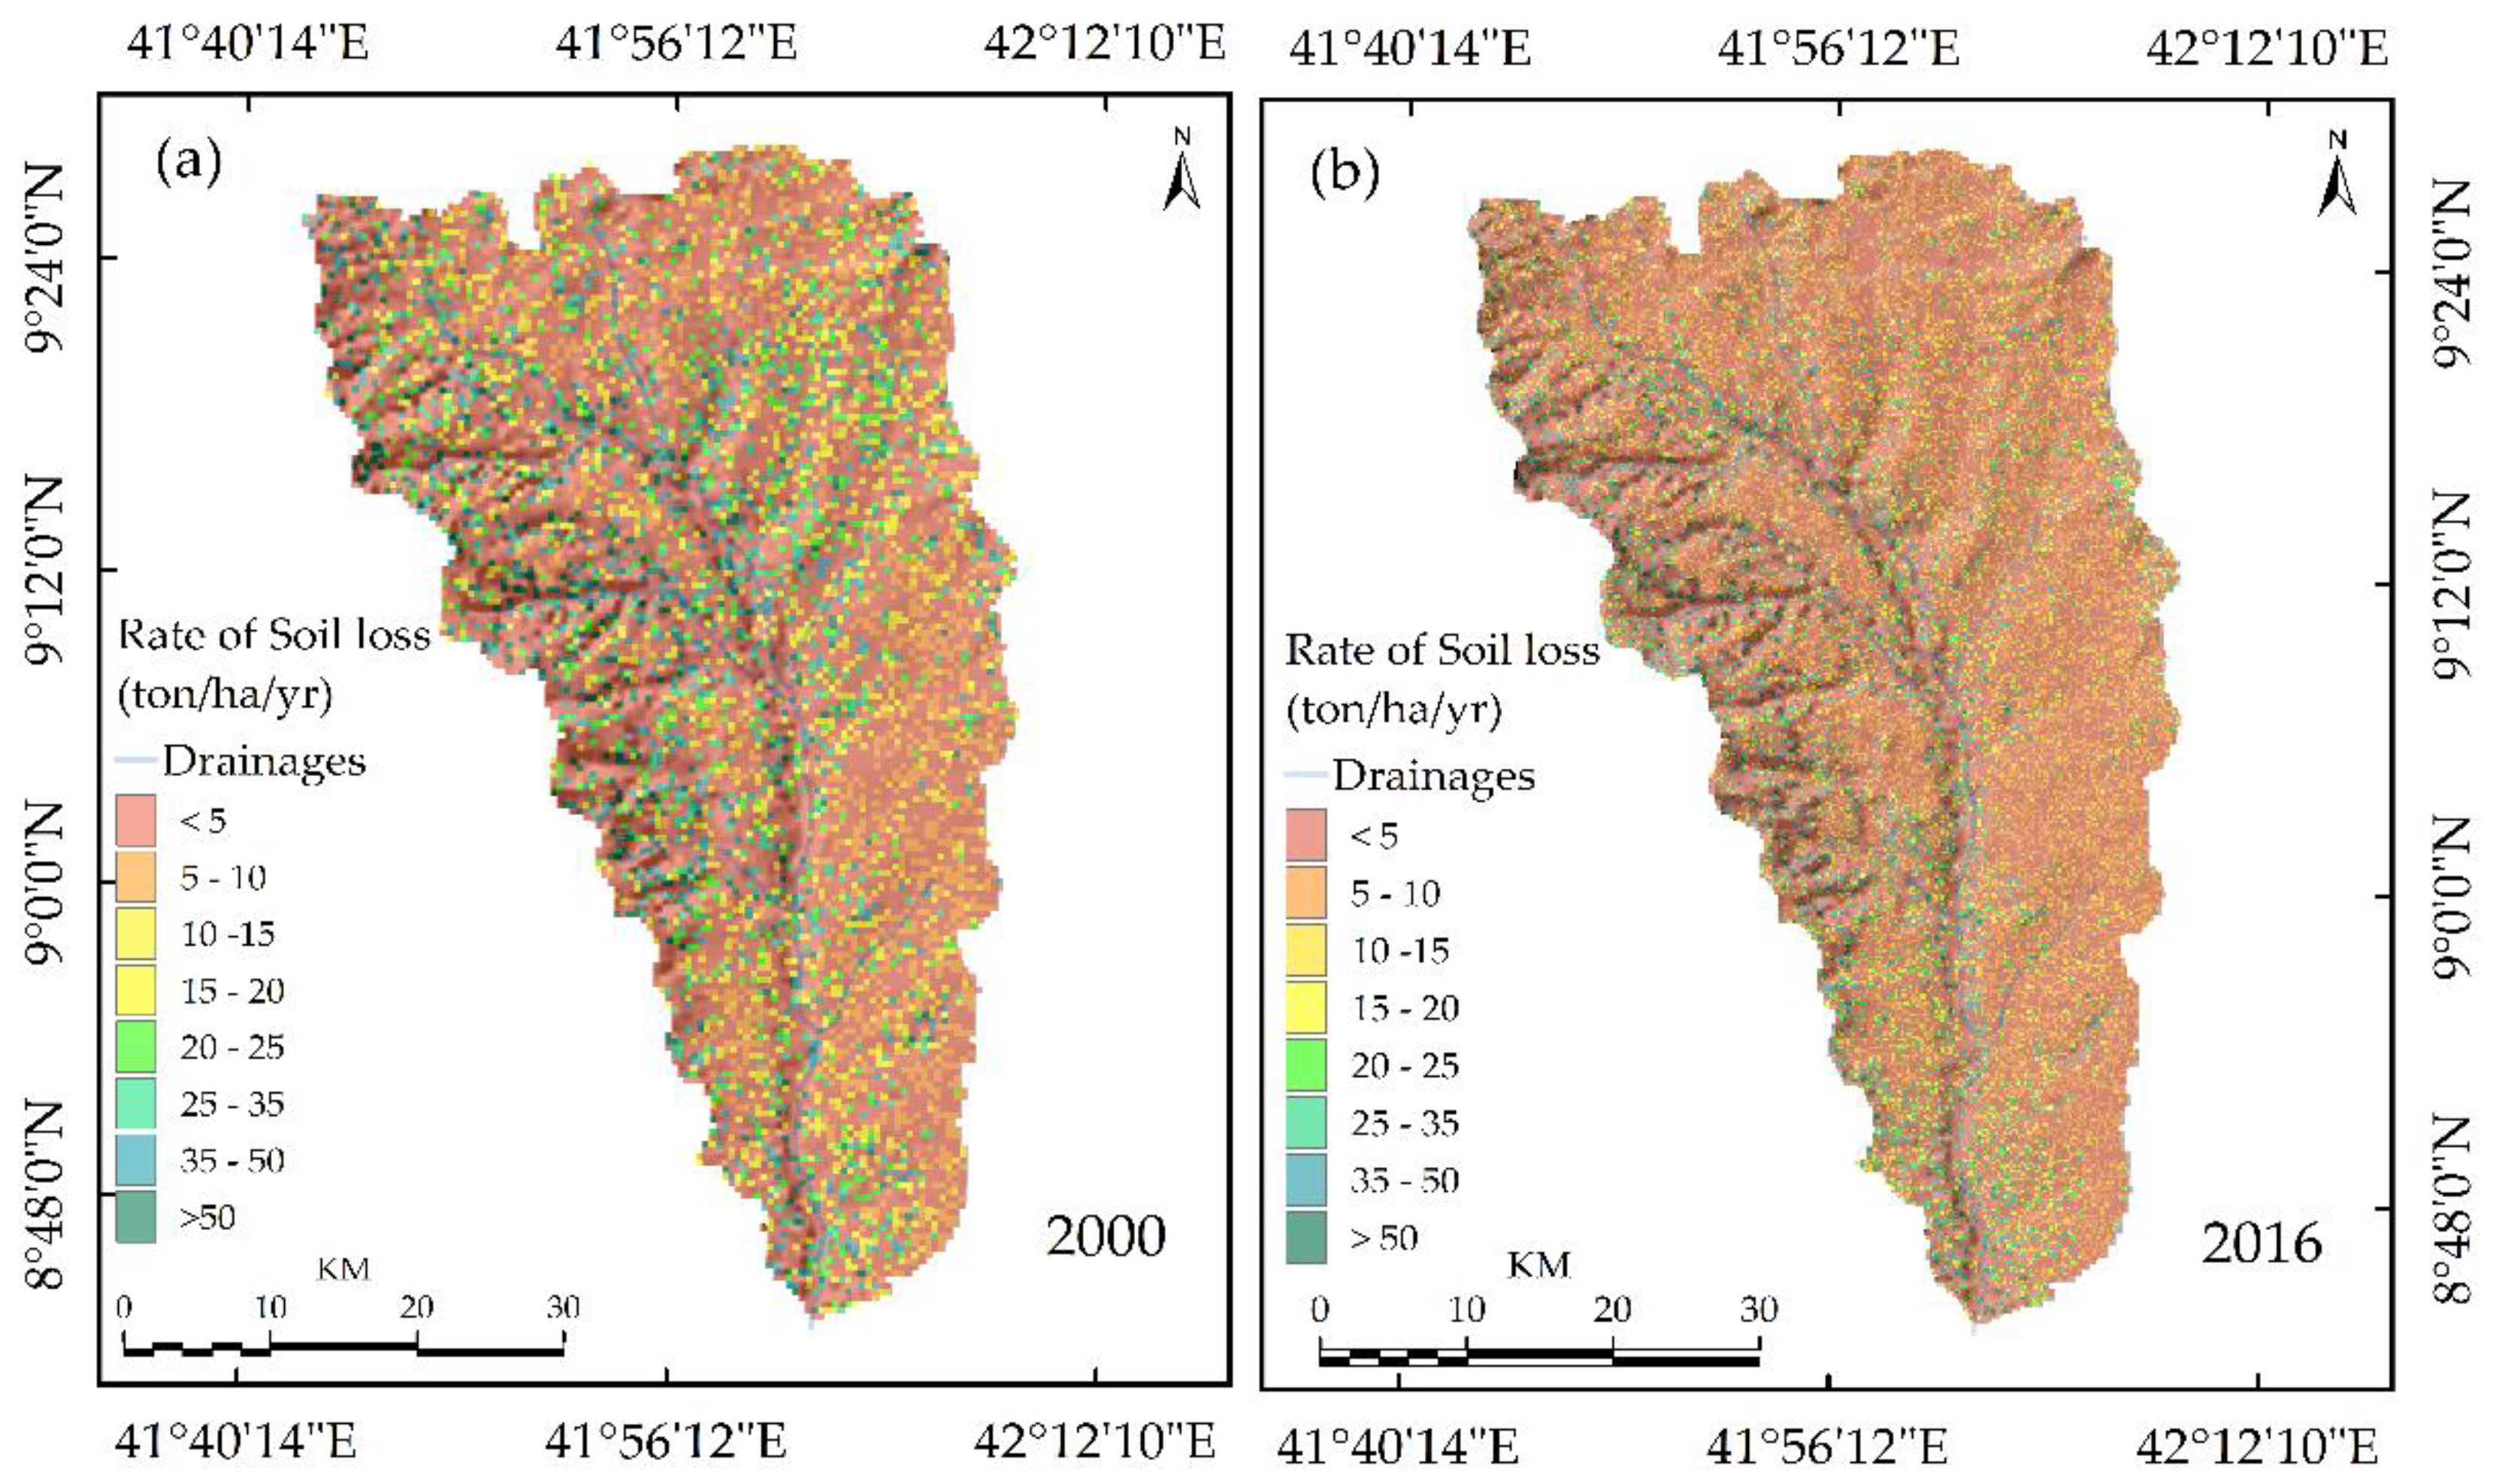
3.1. The Soil Erosion Risk in the Gobele Watershed

The soil erosion risk maps are shown in Figure 6a in 2000 and Figure 6b in 2016 while the statistical details of the soil loss rates and associated erosion risk classes are presented in Table 4. The estimated total soil loss in the Gobele Watershed was 1,390,130.48 tons in 2000 and 1,022,445.09 tons in 2016. The result suggests a net decrease of 367,685.39 tons (15.24% of the total study area). Mean annual soil loss in the watershed was 51.04 t ha−1 y−1, 34.26 t ha−1 y−1, in 2000 and 2016, respectively. Based on the estimated rate of mean annual soil loss, the watershed area was classified into eight erosion risk classes to show spatial distribution and the area coverages in 2000 and 2016. The very low constitutes a larger part of the study area and covered 184,321 ha (77.52% of the total study area) in 2000. This class continues to dominate the watershed area, and accounts for 206,910 ha (87.02% of the total study area) in 2016, suggesting a 22,589 ha (9.50% of the total study area) increase over the study period.
The area covered with low, low medium, medium, and high medium decreased from 32,663.20 ha (13.736% of the total study area), 12,935.50 ha (5.44% of the total study area), 4176.67 ha (1.756% of the total study area), and 1986.96 ha (0.836 of the total study area) to 18,929.50 ha (7.961% of the total study area), 6685.71 ha (2.812% of the total study area), 2986.66 ha (1.256% of the total study area), and 1295.24 ha (0.545 of the total study area), respectively.
The high, very high, and extremely high areas have also declined from 952.93 ha (0.401% of the total study area), 608.25 ha (0.256% of the total study area), and 141.93 ha (0.06% of the total study area) to 607.86 ha (0.256% of the total study area), 244.76 ha (0.103% of the total study area), and 126.67 ha (0.053% of the total study area), respectively. In the present study, the areas with erosion risk higher than the class value of very low were defined as eroded areas. Thus, the area of eroded classes decreased from 53,465.44 ha (22.49% of the total study area) in 2000 to 30,876.40 ha (12.99% of the total study area) in 2016. This suggests that the magnitude of soil erosion rates has decreased over the study period. This is partly attributed to some conservation measures taken by the local people over the recent years.

3.2. Spatial Changes in Soil Erosion Risk in the Gobele Watershed

Table 5 presents the percentage of each erosion risk class transformation between 2000 and 2016. The diagonal numbers showed in italic down the change matrix represents the proportion of each class that stayed unchanged for the total soil erosion risk classes in the study area. The above diagonal elements show the percentage decrease in the erosion risk area while an increase in erosion risk is below the diagonal. The change detection matrix reveals that about 70.80% of the total soil erosion risk classes covered in 2000 (i.e., the sum of the diagonal elements in Table 5) showed no change in 2016. Overall, the erosion risk areas increased by 19.67% of the total study area, and decreased by 9.53%, showing that the soil erosion situation is getting worsening in the study area.
The proportion of the area at very low risk of erosion was the largest unchanged class during the study period, while the area of extremely high-risk was the lowest persistent class. Out of the 77.51%, the very low class covered in 2000 about 68.69% of the total area stayed unchanged, and only about 8.82% were converted to other erosion risk classes. The highest percentage gain was also found in erosion risk in the category of very low. It accounts for 18.47% of the total area due to area converted primarily from low (11.63% of the total area), low-medium (4.38% of the total area), and medium (1.29% of the total area), respectively. Although the soil erosion at risk of very low gained area converted from the low, low-medium, and medium, it lost about 8.77% of the total area to other classes. In addition, the proportion of losses were comparatively higher in the area at low, very low, and low medium risk of soil erosion. It accounts for about 12.19%, 8.77%, and 5.11% of the total area, respectively. On the contrary, the lowest percentage losses were figured out in areas at extremely high, very high and high erosion risk by 0.06%, 0.26%, 0.40% of the study area, respectively.

3.3. Identification of Conservation Priorities

Proper identification of areas that are highly vulnerable to soil loss is a critical factor for designing and implementing appropriate SWC measures. Prioritization was done at watershed scales considering areas with a higher soil loss and increases in erosion risk. Thus, we set a higher value for areas with increasing mean annual soil loss. Accordingly, we classified the study area into eight conservation priority levels (Figure 7). As a result, about 104.78 ha (0.04% of the total study area), 1164.27 ha (0.49% of the total study area), 1963.74 ha (0.83% of the total study area) was identified and mapped as the top three conservation priority areas (Table 6). Among the topmost three priority levels, the majority of the first conservation levels have the slope gradient ranges from 30% to 50%, whereas, the second and the third levels were found within slope gradient greater than 50%. Moreover, about 2565.27 ha (79.35% of the total study area) was situated within the Kersa, Kurfa Chele and Girawa districts which are located in the north, northwest, south, and south-west of the watershed.
The remaining conservation priority areas within these levels account for 667.52 ha (20.65% of the total study area) and are confined within Haramaya and Fedis districts located in the eastern and southeastern part of the watershed. The three priority areas are characterized by higher soil loss rates. The areas require urgent intervention in SWC measures. The fourth, fifth and sixth conservation levels cover about 21,104.37 ha (8.88% of the total study area) and currently need of minor SWC measures. The last two conservation priority areas covered 213,449.27 ha (89.77% of the total study area) currently may not need SWC measures. The last two conservation levels representing areas with lower soil loss and erosion risk account for 213,449.27 ha (89.76% of the total area).

4. Discussion

In Ethiopia, land degradation is the most severe problem that affects agricultural productivity and negatively affects food security[31,35,120,121]. According to the World Bank statistical estimate, land degradation cost to annual agricultural GDP ranges from 2% to 6.75% [122]. To reduce the problem, the Ethiopian government adopted intensive SWC at the national level [35,42,43]. However, the effectiveness of the government’s efforts to deal with soil degradation needs up-to-date quantitative information on the extent of soil erosion risk, and its geographical distribution [123]. This study estimated the magnitude of soil loss rate, assessed the transformation of erosion risk, and identified priority areas for conservation. The estimated total soil loss in the Gobele Watershed area was 1,390,130.48 tons in 2000 and 1,022,445.09 tons in 2016. The findings of this study are within the range of the early findings that estimated the annual soil loss rate in the highland areas of Ethiopia from 1248 to 23,400 million tons [40]. Significant variations in annual soil loss rates were also reported in various parts of Ethiopia. Based on an assessment of soil erosion in the Koga watershed, Northwestern Ethiopia, Gelagay and Minale [124] reported that the total annual soil loss accounted for 255,283 tons. Ayalew [33] estimated soil loss and sediment in the Zingin watershed of the Ethiopia highlands for conservation planning and reported a total annual soil loss potential accounts for 57,750.15 tons.
The present study found that the mean annual soil loss accounts for 51.04 t ha−1 y−1, 34.26 t ha−1 y−1 in 2000 and 2016, respectively. The estimated mean rate of annual soil loss in the study area is much greater than that of the maximum tolerable soil loss estimate at a national scale (18 t ha−1 y−1) [33,125], and to the normal soil loss tolerances (from 5 t ha−1 y−1 to 11 t ha−1 y−1) [54,126]. It is also higher than the findings of earlier researchers in other areas in Ethiopia [27,33,127], and elsewhere in the world [128,129]. On the contrary, the present study results are lower than the findings across the Northwestern Ethiopia highland [130], and other similar studies’ findings [131,132,133]. Several previous studies suggested that vulnerability to a higher rate of water-induced soil erosion occurring in eastern Ethiopia’s highland is associated with the adverse effects of LULC changes, an unsustainable land management, and less emphasis is given to SWC practices [7,134,135]. These events resulted in an accelerated on-site soil nutrient loss and off-site sediment accumulation in downstream areas [135]. A complete drying up of Lake Alemaya in the East Hararghe Ethiopian highland over the recent years is one piece of compelling evidence that justifies the negative consequences of soil erosion, in combination with an unsustainable land use management practice [136,137,138].
Based on the estimated rates of mean annual soil loss, erosion risk was grouped into eight classes ranging from the very low to extremely high. We derived thematic maps to show the spatial distribution of erosion risk classes (Figure 6). The very low dominated major parts of the watershed area in 2000 and 2016 (Table 4) account for 77.52%, 87.02% of the total study area, respectively. The high, very high, and extremely high erosion risks have declined by 0.23%, 0.21%, and 0.05% of the total study area, respectively. Overall, the magnitude of soil loss rates across the Gobele Watershed marginally decreased over the period between 2000 and 2016. The decline in soil loss rates is probably due to some conservation measures were taken by the local people over the recent years. This implies that the local communities within the study area have well recognized the possible environmental threats posed by the water-induced soil erosion and because of this, putting efforts into SWC practices in erosion-prone areas. Supporting the current study’s findings, Tadesse et al. [139] noted considerable improvement in the soil erosion and rehabilitation of degraded lands in the Yezat Watershed of North Western Ethiopia following implementation of integrated watershed development programs. Validating these findings, Akale et al. [140] also reported that implementation of upland conservation measures significantly reduced the surface runoff and increased base flow in the Guale and Tikur-Wuha watersheds of the Ethiopian highlands.
In the present study area, contour bounds, terracing, and check-dams are some of the promising soil erosion control practices adopted by the local communities as observed during the field visit. We have also seen that plantation of trees in up-slope areas, especially Khat (Catha edulis) as a perennial cash crop and raw intercropping with maize and sorghum is largely practiced in various parts in the study area, and substantially contributed to the diminishing of soil losses by water erosion (Figure 8). This agrees with Lemessa [141], who highlighted the role of Khat as the most important erosion control practices by minimizing rainfall-runoff velocity in most of the Eastern and Western Hararghe highlands of Ethiopia. Confirming this, Li et al. [67] and Efe et al. [131] pointed out that the existence of vegetation covers reduces the adverse effect of slope gradients on soil erosion intensity. Moreover, the recent study by Cerdà et al. [50] revealed that application of the straw mulch as erosion control practices has been shown to reduce the rainfall-runoff velocity and connectivity of the flows, subsequently decreasing the soil loss rates and sediment fluxes. Keesstra et al. [51] emphasized the nature-based solutions (NBSs), including the soil solutions and landscape solutions as a cost-effective and sustainable conservation strategies for mitigating and restoration of degraded land and improve ecosystem services. Though the SWC implemented over the recent years might have reduced the magnitude of soil loss rate, the eroded areas are widely observed in the study area (Figure 8a–c).
The change analysis results of the present study showed that about 70.80% of erosion risk areas occupied in 2000 continued under the same classes in 2016. The results show that the erosion risk area increased by 19.67% of the total study area, and decreased by 9.53%, which shows that overall soil loss situation is worsening in the study area. These findings agree with those of the recent study by Uddin et al. [90] who reported that the state of soil erosion risk in the Koshi Basin has been worsening following increase in the proportion of the eroded areas over 9.0% of the total basin area between 1990 and 2010. On the contrary, Wang et al. [92] found improvement in the state of erosion risk in the Danjiangkou reservoir area, China, where the eroded areas have declined from 32.1% in 2004 to 25.43% in the 2010 study period. Moreover, Jiang et al. [16] reported that the eroded area has decreased by 61% between 2000 and 2012, despite increases in the intensity of soil erosion by 39% in some areas of the Mount Elgon region, Uganda.
Therefore, since there is geospatial variation in soil erosion risk distribution across the watershed area, identification of priority area is the key factor for planning and implementing appropriate SWC [10,11,12,13,14,15,16,17,18,19,51,90,142]. Accordingly, we prioritized areas with a higher and increasing soil loss rate as SWC priority areas (Table 6). This can play a vital role in supporting decision makers and conservation planners to design proper SWC measures based on the severity levels of soil loss in the Gobele Watershed. The first-, second- and third-priority levels account for about 3232.79 ha (1.36% of the watershed area) that need urgent SWC measures. Most of the top three priority areas are spatially situated in Kersa and Kurfa Chele in the northwest, Girawa in the southwest, Haramaya in north, and Fedis in the south and southeast. Moreover, these districts are situated in the steep slope area with slope gradients greater than 30 meters. In line with the findings of our study, Abate [5] reported that the steep slopes are attributed to high soil loss rate and aggravated soil erosion risk in the Borena Woreda of South Wollo Highlands of Ethiopia. A recent report by Karamage et al. [133] for the Nyabarongo River Catchment, Rwanda, also agrees with the present study’s findings, showing a higher soil erosion in the very steep slope areas contributing about 73.5% of the total soil loss. They strongly suggested construction of erosion control structures and rehabilitation of vegetation covers as a solution to reduce the soil loss in the catchment area [133]. The fourth, fifth and sixth conservation levels accounting for 21,104.37 ha (8.88% of the total study area) need of minor SWC measures. The last two conservation levels represent areas with lower soil loss and erosion risk accounting for 213,449.27 ha (89.76% of the total area), which currently may not need the emergency SWC measures.

5. Conclusions

This study estimated annual soil loss rate, assessed the spatial change of erosion risk and mapped priority areas for SWC measures by taking into consideration the severity levels of soil loss across the Gobele Watershed, East Hararghe Zone, Ethiopia. We used the RUSEL model developed in an ArcGIS software environment. The model results offered a reliable quantitative estimate of water-induced soil loss rates and spatial distribution of erosion risk in the study area. The estimated total soil loss at the watershed level was 1,390,130.48 tons in 2000 and 1,022,445.09 tons in 2016 with a mean erosion rate of 51.04 t ha−1 y−1 and 34.26 t ha−1 y−1, respectively. Thus, the status of soil loss across the Gobele Watershed has slightly improved over the study period partly due to some conservation practices. Eight erosion risk classes were mapped based on the mean soil loss rates showing that a larger portion of the study area are found under the very low, low and low medium classes and only a small part found within the high, very high and extremely high. Despite a reduction in the magnitude of soil loss rates, the spatial dimension of erosion risk is getting worse in the study area. The change analysis results showed that overall, about 70.80% of the erosion risk areas covered in 2000 continued under the same erosion risk classes in 2016 but 19.67% increased and 9.53% decreased in the total study area. This reveals that the soil erosion risk situation is worsening in the study area. We identified and mapped areas with a high and increasing soil erosion risk as conservation priority areas based on the MCDR method. Thus, conservation priorities identified in the present study can serve as a spatial decision support tool, and as input for decision makers and conservation planners for future intervention measures in highly affected areas. It also supports efforts to minimize environmental and economic impacts of soil erosion and offer insights on policy implications on what should be done to establish sustainable watershed management practices in the study area. The emperical RUSEL model and MCDR method outlined in ArcGIS environment for estimating the soil loss rates, assess the spatial change of erosion risk, and prioritization of SWC in the Gobele Watershed can be applied to other similar watersheds following proper validation.

Supplementary Materials

The following are available online at https://www.mdpi.com/2073-445X/7/1/25/s1. Table S1: Mean annual Rainfall (mm) obtained from National Meteorological Agency (NMA) from 1999 to 2015 and Rainfall erosivity (R) factor. Table S2: Attributes of Soil units and calculated soil erodibility (K) factor in the Gobele Watershed, East Hararghe Zone, Ethiopia.

Acknowledgments

The study was financially supported by the Haramaya University, Ethiopia and is gratefully acknowledged. The authors gratefully thank the anonymous reviewers and the editors whose valuable suggestions and comments have helped enrich the quality of this article. We are also grateful to Jeylan Woliyie Hussein for editing the language of the manuscript.

Author Contributions

All authors made a valuable contribution to this manuscript. Gezahegn Weldu Woldemariam conceived and designed the method, performed the experiment, and wrote the manuscript. Anteneh Derribew Iguala, Solomon Tekalign, and Ramireddy Uttama Reddy performed the experiment, reviewed, and commented the manuscript.

Conflicts of Interest

The authors declare no conflict of interest.

References

  1. Haan, C.T.; Barfield, B.J.; Hayes, J.C. Design Hydrology, and Sedimentology for Small Catchments; Academic Press: San Diego, CA, USA, 1994. [Google Scholar]
  2. Adediji, A.; Tukur, A.M.; Adepoju, K.A. Assessment of Revised Universal Soil Loss Equation (RUSLE) in Katsina Area, Katsina State of Nigeria using Remote Sensing (RS) and Geographic Information System (GIS). Iran. J. Energy Environ. 2010, 1, 255–264. [Google Scholar]
  3. Boardman, J. Soil Erosion in Britain: Updating the Record. Agriculture 2013, 3, 418–442. [Google Scholar] [CrossRef]
  4. Vrieling, A. Satellite remote sensing for water erosion assessment: A review. Catena 2006, 65, 2–18. [Google Scholar] [CrossRef]
  5. Abate, S. Estimating soil loss rates for soil conservation planning in the Borena Woreda of South Wollo Highlands, Ethiopia. J. Sustain. Dev. Afr. 2011, 13, 87–106. [Google Scholar]
  6. Kertesz, A.; Gergely, J. Gully erosion in Hungary, review and case study. Procedia-Soc. Behav. Sci. 2011, 19, 693–701. [Google Scholar] [CrossRef]
  7. Meshesha, D.T.; Tsunekawa, A.; Tsubo, M.; Ali, S.A.; Haregeweyn, N. Land-use change and its socio-environmental impact in Eastern Ethiopia’s highland. Reg. Environ. Chang. 2014, 14, 757–768. [Google Scholar] [CrossRef]
  8. Mekonnen, M.; Keesstra, S. D.; Baartman, J. E.; Stroosnijder, L.; Maroulis, J. Reducing Sediment Connectivity Through man-Made and Natural Sediment Sinks in the Minizr Catchment, Northwest Ethiopia. Land Degrad. Dev. 2017, 28, 708–717. [Google Scholar] [CrossRef]
  9. Knapen, A.; Kitutu, M.G.; Poesen, J.; Breugelmans, W.; Deckers, J.; Muwanga, A. Landslides in a Densely Populated County at the Foot slopes of Mount Elgon (Uganda): Characteristics and Causal Factors. Geomorphology 2006, 73, 149–165. [Google Scholar] [CrossRef]
  10. Sutcliff, J.P. Economic Assessment of Land Degradation in the Ethiopian Highlands: A Case Study; National Conservation Strategy Secretariat, Ministry of Planning and Economic Development: Addis Ababa, Ethiopia, 1993. [Google Scholar]
  11. Oldeman, L. The global extent of soil degradation. In Soil Resilience and Sustainable Land Use; Greenland, D.J., Szabolcs, I., Eds.; CAB: Wallingford, UK, 1994. [Google Scholar]
  12. Lal, R. Soil carbon sequestration impacts on global climate change and food security. Science 2004, 304, 1623–1627. [Google Scholar] [CrossRef] [PubMed]
  13. Saravanan, S.; Sathiyamurthi, S.; Elayaraja, D. Soil Erosion Mapping of Katteri Watershed using Universal Soil Loss Equation and GIS. J. Indian Soc. Soil Sci. 2010, 58, 418–421. [Google Scholar]
  14. Arekhi, S.; Shabani, A.; Rostamizad, G. Application of the modified universal soil loss equation (MUSLE) in prediction of sediment yield (Case study: Kengir Watershed, Iran). Arab. J. Geosci. 2012, 5, 1259–1267. [Google Scholar] [CrossRef]
  15. Mutowo, G.; Chikodzi, D. Erosion Hazard Mapping in the Runde Catchment: Implications for Water Resource Management. J. Geosci. Geomat. 2013, 1, 22–28. [Google Scholar] [CrossRef]
  16. Jiang, B.; Bamutaze, Y.; Pilesjö, P. Climate change and land degradation in Africa: A case study in the Mount Elgon region, Uganda. Geo-Spat. Inf. Sci. 2014, 17, 39–53. [Google Scholar] [CrossRef]
  17. Castrignano, A.; Buttafuoco, G.; Canu, A.; Madrau, S. Modelling spatial uncertainty of soil erodibility factor using joint stochastic simulation. Land Degrad. Dev. 2008, 19, 198–213. [Google Scholar] [CrossRef]
  18. Panagos, P.; Borrelli, P.; Meusburger, K. A New European Slope Length and Steepness Factor (LS-Factor) for Modeling Soil Erosion by Water. Geosciences 2015, 5, 117–126. [Google Scholar] [CrossRef] [Green Version]
  19. Bhattacharyya, R.; Ghosh, B.N.; Dogra, P.; Mishra, P.K.; Santra, P.; Kumar, S.; Fullen, M.A.; Mandal, U.K.; Anil, K.S.; Lalitha, M.; et al. Soil Conservation Issues in India. Sustainability 2016, 8, 565. [Google Scholar] [CrossRef] [Green Version]
  20. Lal, R. Agronomic consequences of soil erosion. In Soil Erosion at Multiple Scales: Principles and Methods for Assessing Causes and Effects; Vries, F.W.T., Agus, F., Kerr, J., Eds.; CABI Publishing: New York, NY, USA, 1998. [Google Scholar]
  21. Fazlı, E.T.; Mahmut, Y.; Murat, S.; İbrahim, M.; Mustafa, C. Assessment of Soil Erosion Based on The Method USLE; Çorum Province Example. In Proceedings of the FIG Working Week—knowing to manage the territory, protect the environment, evaluate the cultural heritage, Rome, Italy, 6–10 May 2012. [Google Scholar]
  22. Rabia, A.H. Mapping Soil Erosion Risk Using RUSLE, GIS and Remote Sensing. In Proceedings of the 4th International Congress of ECSSS, EUROSOIL, Soil Science for the Benefit of Mankind and Environment, Bari, Italy, 2–6 June 2012; p. 1082. [Google Scholar]
  23. Nill, D.; Schwertmann, U.; Sabel-Koschella, U.; Bernhard, M.; Breuer, J. Soil Erosion by Water in Africa: Principle, Prediction and Protection; GTZ: Eschborn, Germany, 1996; p. 292. [Google Scholar]
  24. Ermias, A.; Welday, W.; Emiru, B.; Nigussu, B. Monitoring and Evaluating Land use/Land cover change using participatory Geographic Information System Tools: A case study of Begasheka watershed, Tigray, Ethiopia. EJISDC 2006, 25, 1–10. [Google Scholar]
  25. Hudad, B. Multi-temporal Satellite Image Analysis for Assessing Land Degradation; A Case Study on South Wollo Zone, Doyach Watershed. Master’s Thesis, Addis Ababa University, Addis Ababa, Ethiopia, 2010. [Google Scholar]
  26. Kassu, K. Soil Erosion, Deforestation and Rural Livelihoods in the Central Rift Valley Area of Ethiopia: A Case Study in the Denku Micro-Watershed Oromia Region. Master’s Thesis, University of South Africa, Pretoria, South Africa, 2011. [Google Scholar]
  27. Amsalu, T.; Mengaw, A. GIS Based Soil Loss Estimation Using RUSLE Model: The Case of Jabi Tehinan Woreda, ANRS, Ethiopia. Nat. Resour. 2014, 5, 616–626. [Google Scholar] [CrossRef]
  28. Araya, A.; Stroosnijder, L.; Habtu, S.; Keesstra, S.D.; Berhe, M.; Hadgu, K.M. Risk assessment by sowing date for barley (Hordeum vulgare) in northern Ethiopia. Agric. For. Meteorol. 2012, 154, 30–37. [Google Scholar] [CrossRef]
  29. Muluneh, A.; Biazin, B.; Stroosnijder, L.; Bewket, W.; Keesstra, S. Impact of predicted changes in rainfall and atmospheric carbon dioxide on maize and wheat yields in the Central Rift Valley of Ethiopia. Reg. Environ. Chang. 2015, 15, 1105–1119. [Google Scholar] [CrossRef]
  30. Muluneh, A.; Bewket, W.; Keesstra, S.; Stroosnijder, L. Searching for evidence of changes in extreme rainfall indices in the Central Rift Valley of Ethiopia. Theor. Appl. Clim. 2017, 128, 795–809. [Google Scholar] [CrossRef]
  31. Muluneh, A.; Stroosnijder, L.; Keesstra, S.; Biazin, B. Adapting to climate change for food security in the Rift Valley dry lands of Ethiopia: supplemental irrigation, plant density and sowing date. J. Agric. Sci. 2017, 155, 703–724. [Google Scholar] [CrossRef]
  32. Erenstein. Sustainable Poverty Reduction in Less Favored Area; Cromwell Press: Trowbridge, UK, 1999. [Google Scholar]
  33. Ayalew, G. Geographic information system based soil loss estimation in Zingin Watershed for soil conservation planning, highlands of Ethiopia. Int. J. Sci. Technol. Soc. 2015, 3, 28–35. [Google Scholar] [CrossRef]
  34. Lal, R. Soil degradation by erosion. Land Degrad. Dev. 2001, 12, 519–539. [Google Scholar] [CrossRef]
  35. The Federal Democratic Republic of Ethiopia (FDRE). Ethiopia’s Climate-Resilient Green Economy, Green Economy Strategy; Environmental Protection Authority: Addis Ababa, Ethiopia, 2011.
  36. Community-Based Participatory Watershed Management (CBPWM). Integrated Watershed Management in Rainfed Agriculture; CRC Press: Leiden, The Netherlands, 2005. [Google Scholar]
  37. Tamene, L.; Vlek, P.L.G. GIS-based landscape characterization to assess soil erosion and its delivery potential in the highlands of northern Ethiopia. In Proceedings of the 1st International Conference on Remote Sensing and Geoinformation Processing in the Assessment and Monitoring of Land Degradation and Desertification, Trier, Germany, 7–9 September 2005; pp. 332–339. [Google Scholar]
  38. Food and Agriculture Organization (FAO). Ethiopian Highland Reclamation Study; Final Report; FAO: Rome, Italy, 1986; pp. 37–46. [Google Scholar]
  39. Tamene, L.; Vlek, P.L.G. Analysis of factors determining sediment yield variability in the highlands of Northern Ethiopia. Geomorphology 2006, 76, 76–91. [Google Scholar] [CrossRef]
  40. Food and Agriculture Organization (FAO). Ethiopian Highland Reclamation Study (EHRS); Final Report; FAO: Rome, Italy, 1984. [Google Scholar]
  41. Gebreyesus, B.; Lulseged, T.; Paul, L.G. Soil Erosion Prediction Using Morgan-Morgan-Finney Model in a GIS Environment in Northern Ethiopia Catchment. Appl. Environ. Soil Sci. 2014, 2014, 468751. [Google Scholar]
  42. The Federal Democratic Republic of Ethiopia (FDRE). Rural Development Policy and Strategies; Ministry of Finance and Economic Development Economic Policy and Planning Department: Addis Ababa, Ethiopia, 2003.
  43. The Federal Democratic Republic of Ethiopia (FDRE). Growth and Transformation Plan (GTP); Ministry of Finance and Economic Development (MoFED): Addis Ababa, Ethiopia, 2010.
  44. Tripathi, M.P.; Panda, R.K.; Raghuwanshi, N.S. Identification and prioritization of critical sub-watersheds for soil conservation management using the SWAT model. Biosyst. Eng. 2003, 85, 365–379. [Google Scholar] [CrossRef]
  45. Hurni, H. Degradation and Conservation of the Resources in the Ethiopian highlands. Mt. Res. Dev. 1988, 8, 123–130. [Google Scholar] [CrossRef]
  46. Barakat, M.; Mahfoud, I.; Kwyes, A.A. Study of soil erosion risk in the Basin of Northern Al-Kabeer River at Lattakia-Syria using remote sensing and GIS techniques. Mesopot. J. Mar. Sci. 2014, 29, 29–44. [Google Scholar]
  47. Ganasri, B.P.; Ramesh, H. Assessment of soil erosion by RUSLE model using remote sensing and GIS, a case study of Nethravathi Basin. Geosci. Front. 2016, 7, 953–961. [Google Scholar] [CrossRef]
  48. Claessens, L.; Breugel, P.V.; Notenbaert, A.; Herrero, M.; De Steeg, J.V. Mapping potential soil erosion in East Africa using the Universal Soil Loss Equation and secondary data California, USA. In Sediment Dynamics in Changing Environments, Proceedings of a Symposium Held in Christchurch, New Zealand, 1–5 December 2008; IAHS Publication: Wallingford, UK, 2008; p. 588. [Google Scholar]
  49. Tekwa, I.J.; Kundiri, A.M.; Chiroma, A.M. Efficiency test of modeled empirical equations in predicting soil loss from ephemeral gully erosion around Mubi, Northeast Nigeria. Int. Soil Water Conserv. Res. 2016, 4, 12–19. [Google Scholar] [CrossRef]
  50. Cerdàa, A.; Rodrigo-Comino, J.; Giménez-Morera, A.; Keesstra, S.D. An economic, perception and biophysical approach to the use of oat straw as mulch in Mediterranean rainfed agriculture land. Ecol. Eng. 2017, 108, 162–171. [Google Scholar] [CrossRef]
  51. Keesstra, S.; Nunes, J.; Novara, A.; Finger, D.; Avelar, D.; Kalantari, Z.; Cerdà, A. The superior effect of nature based solutions in land management for enhancing ecosystem services. Sci. Total Environ. 2018, 610, 997–1009. [Google Scholar] [CrossRef] [PubMed]
  52. Kirchhoff, M.; Rodrigo-Comino, J.; Seeger, M.; Ries, J. B. Soil erosion in sloping vineyards under conventional and organic land use managements (Saar-Mosel valley, Germany). Cuadernos de Investigación Geográfica 2017, 43, 119–140. [Google Scholar] [CrossRef]
  53. Williams, J.R. Sediment routing for Agricultural Watersheds. Water Resour. Bull. 1975, 11, 965–974. [Google Scholar] [CrossRef]
  54. Wischmeier, W.H.; Smith, D.D. Predicting Rainfall Erosion Losses—A Guide to Conservation Planning; Agriculture Handbook No. 537; US Department of Agriculture Science and Education Administration: Washington, DC, USA, 1978; p. 168.
  55. Morgan, R.P.C.; Morgan, D.D.V.; Finney, H.J. A predictive model for the assessment of soil erosion risk. J. Agric. Eng. Res. 1984, 30, 245–253. [Google Scholar] [CrossRef]
  56. Young, R.A.; Onstad, C.; Bosch, D.; Anderson, W. AGNPS: A nonpoint-source pollution model for evaluating agricultural watersheds. J. Soil Water Conserv. 1989, 44, 168–173. [Google Scholar]
  57. Sharpley, A.N.; Williams, J.R. EPIC Erosion/Productivity Impact Calculator: 1. Model Documentation; USA Department of Agriculture Technical Bulletin No. 1768; USA Government Printing Office: Washington, DC, USA, 1990.
  58. Flangan, D.C.; Nearing, M.A. USDA Water Erosion Prediction Project: Hill Slope Profile and Watershed Model Documentation; NSERL Report No. 10; USDA-ARS National Soil Erosion Research Laboratory: West Lafayette, IN, USA, 1995; Volume 47, pp. 907–1194.
  59. Arnold, J.G.; Srinivasan, R.; Muttiah, R.S.; Williams, J.R. Large area hydrologic modeling, and assessment part I: Model Development. J. Am. Water Resour. Assoc. 1998, 34, 73–89. [Google Scholar] [CrossRef]
  60. Morgan, R.P.C.; Quinton, J.N.; Smith, R.E.; Govers, G.; Poesen, J.W.A.; Auerswald, K.; Chisci, G.; Torri, D.; Styczen, M.E. The European Soil Erosion Model (EUROSEM): A dynamic approach for predicting sediment transport from fields and small catchments. Earth Surf. Process. Landf. 1998, 23, 527–544. [Google Scholar] [CrossRef]
  61. Chang, T.J.; Zhou, H.; Guan, Y. Applications of Erosion Hotspots for Watershed Investigation in the Appalachian Hills of the United States. J. Irrig. Drain Eng. 2016, 142. [Google Scholar] [CrossRef]
  62. Laflen, J.M.; Flanagan, D.C.; Engel, B.A. Soil erosion and Sediment Yield Prediction Accuracy Using WEPP. J. Am. Water Resour. Assoc. 2004, 289–297. [Google Scholar] [CrossRef]
  63. Renard, K.G.; Foster, G.R.; Weesies, G.A.; McCool, D.K.; Yoder, D.C. Predicting Soil Erosion by Water: A Guide to Conservation Planning with the Revised Universal Soil Loss Equation (RUSLE); Agriculture Handbook; USDA: Washington, DC, USA, 1997; Volume 703, pp. 1–251.
  64. Mellerowicz, K.; Ress, H.; Chow, T.; Ghanem, I. Soil conservation planning at the watershed level using the Universal Soil Loss Equation with GIS and microcomputer technologies: A case study. J. Soil Water Conserv. 1994, 49, 194–200. [Google Scholar]
  65. Millward, A.A.; Mersey, J.E. Adapting the RUSLE to model soil erosion potential in a mountainous tropical watershed. Catena 1999, 38, 109–129. [Google Scholar] [CrossRef]
  66. Ratnam, K.; Srivastava, Y.; Rao, V.; Amminedu, E.; Murthy, K. Check Dam Positioning by Prioritization Micro-Watersheds Using SYI Model and Morphometric Analysis-Remote Sensing and GIS Perspective. J. Indian Soc. Remote Sens. 2005, 33. [Google Scholar] [CrossRef]
  67. Li, X.S.; Wu, B.F.; Wang, H.; Zhang, J. Regional soil erosion risk assessment in Hai Basin. J. Remote Sens. 2011, 15, 372–387. [Google Scholar]
  68. Kiflu, G. GIS-Based Conservation Priority Area Identification in Mojo River Watershed on the Basis of Erosion Risk. Master’s Thesis, Addis Ababa University, Addis Ababa, Ethiopia, 2010. [Google Scholar]
  69. Ayele, K. Assessment of Soil Erosion Risk in the Holeta Watershed, Central Oromiya, Ethiopia. Master’s Thesis, Addis Ababa University, Addis Ababa, Ethiopia, 2011. [Google Scholar]
  70. Israel, T. Soil Erosion Risk Assessment with RUSLE and GIS in Dire Dam Watershed. Master’s Thesis, Addis Ababa University, Addis Ababa, Ethiopia, 2011. [Google Scholar]
  71. Senti, E.T.; Tufa, B.W.; Gebrehiwot, K.A. Soil erosion, sediment yield and conservation practices assessment on Lake Haramaya Catchment. World J. Agric. Sci. 2014, 2, 186–193. [Google Scholar]
  72. National Meteorological Agency (NMA). Mean Monthly Rainfall Data; Unpublished document; 2015. [Google Scholar]
  73. Earth Explorer. Available online: http://earthexplorer.usgs.gov/ (accessed on 15 September 2016).
  74. National Aeronautics and Space Administration (NASA); Land Processes Distributed Active Archive Center (LPDAAC). ASTER L1B; The United States Geological Survey (USGS)/Earth Resources Observation and Science (EROS) Center: Sioux Falls, SD, USA, 2016. Available online: http://www.gdem.aster.ersdac.or.jp/ (accessed on 15 September 2016).
  75. Food and Agriculture Organization (FAO). The Digital Soil Map of the World, Land and Water Development Division; FAO: Rome, Italy, 1995; Available online: http://www.fao.org/geonetwork/ (accessed on 7 August 2016).
  76. Lillesand, T.; Kiefer, R. Remote Sensing and Image Interpretation; John Wiley & Sons, Inc.: New York, NY, USA, 1999. [Google Scholar]
  77. Mather, P.; Koch, M. Computer Processing of Remotely-Sensed Images: An Introduction, 4th ed.; Wiley-Blackwell: Chichester, UK, 2011. [Google Scholar]
  78. Song, C.; Woodcock, C.E.; Seto, K.C.; Lenney, M.P.; Macomber, S.A. Classification and change detection using Landsat TM data: When and how to correct atmospheric effects? Remote Sens. Environ. 2001, 75, 230–244. [Google Scholar] [CrossRef]
  79. Papadavid, G.; Hadjimitsis, D.; Toulios, L.; Michaelides, L. Mapping Potatoes Crop Height and LAI through Vegetation Indices using Remote Sensing, in Cyprus. J. Appl. Remote Sens. 2011, 5. [Google Scholar] [CrossRef]
  80. Cheruto, M.C.; Kauti, M.K.; Kisangau, P.D.; Kariuki, P. Assessment of Land Use and Land Cover Change Using GIS and Remote Sensing Techniques: A Case Study of Makueni County, Kenya. J. Remote Sens. GIS 2016, 5, 175. [Google Scholar] [CrossRef]
  81. Raja, D.R. Spatial Analysis of Land Surface Temperature in Dhaka Metropolitan Area. J. Bangladesh Inst. Plan. 2012, 5, 151–167. [Google Scholar]
  82. Lillesand, T.; Kiefer, R. Remote Sensing and Photo Interpretation, 3rd ed.; Wiley: New York, NY, USA, 1994; p. 750. [Google Scholar]
  83. Otukei, J.R.; Blaschke, T. Land cover change assessment using decision trees, support vector machines and maximum likelihood classification algorithms. Int. J. Appl. Earth Observ. Geoinform. 2010, 12, 27–31. [Google Scholar] [CrossRef]
  84. Sahana, M.; Ahmed, R.; Sajjad, H. Analyzing land surface temperature distribution in response to land use/land cover change using split window algorithm and spectral radiance model in Sundarbans Biosphere Reserve, India. Model. Earth Syst. Environ. 2016, 2, 1–11. [Google Scholar] [CrossRef]
  85. Congalton, R. A review of assessing the accuracy of classifications of remotely sensed data. Remote Sens. Environ. 1991, 37, 35–46. [Google Scholar] [CrossRef]
  86. Hickey, R.A.; Smith, L.C.; Jankowski, P. Slope length calculations from a DEM within ARC/INFO GRID. Comput. Environ. Urban Syst. 1994, 18, 365–380. [Google Scholar] [CrossRef]
  87. Karamage, F.; Zhang, C.; Ndayisaba, F.; Shao, H.; Kayiranga, A.; Fang, X.; Nahayo, L.; Nyesheja, E.M.; Tian, G. Extent of Cropland and Related Soil Erosion Risk in Rwanda. Sustainability 2016, 8, 609. [Google Scholar] [CrossRef]
  88. Burrough, P.A.; McDonnell, R.A. Principles of Geographical Information Systems, 2nd ed.; Oxford University Press: London, UK, 1998. [Google Scholar]
  89. Ai, L.; Fang, N.F.; Zhang, B.; Shi, Z.H. Broad area mapping of monthly soil erosion risk using fuzzy decision tree approach: Integration of multi-source data within GIS. Int. J. Geogr. Inf. Sci. 2013, 27, 1251–1267. [Google Scholar] [CrossRef]
  90. Uddin, K.; Murthy, M.S.R.; Wahid, S.M.; Matin, M.A. Estimation of Soil Erosion Dynamics in the Koshi Basin Using GIS and Remote Sensing to Assess Priority Areas for Conservation. PLoS ONE 2016, 11, e0150494. [Google Scholar] [CrossRef] [PubMed]
  91. Zhang, X.; Wu, B.; Ling, F.; Zeng, Y.; Yan, N.; Yuan, C. Identification of priority areas for controlling soil erosion. Catena 2010, 83, 76–86. [Google Scholar] [CrossRef]
  92. Wang, L.; Huang, J.; Du, Y.; Hu, Y.; Han, P. Dynamic Assessment of Soil Erosion Risk Using Landsat TM and HJ Satellite Data in Danjiangkou Reservoir Area, China. Remote Sens. 2013, 5, 3826–3848. [Google Scholar] [CrossRef]
  93. Owusu, J. A GIS-Based Estimation of Soil Loss in the Densu Basin in Ghana. West Afr. J. Appl. Ecol. 2012, 20, 42–52. [Google Scholar]
  94. Land Degradation Assessment in Drylands. Global Land Degradation Information System-Beta Version. Available online: http://www.fao.org/nr/lada/index.php?option=com_content&view=article&id=161& Itemid=113&lang=en (accessed on 15 June 2017).
  95. Lo, A.; El-Swaify, S.; Dangler, E.; Shinshiro, L. Effectiveness of EI 30 as an Erosivity Index in Hawaii. Available online: http://agris.fao.org/agris-search/search.do?recordID=US8639059 (accessed on 15 June 2017).
  96. Parysow, P.; Wang, G.X.; Gartner, G.; Anderson, A.B. Spatial uncertainty analysis for mapping soil erodibility based on joint sequential simulation. Catena 2003, 53, 65–78. [Google Scholar] [CrossRef]
  97. Lal, R. Soil Erosion Research Method, 2nd ed.; Soil and Water Conservation Society: Ankeny, IA, USA, 1994. [Google Scholar]
  98. Hoyos, N. Spatial Modeling of Soil Erosion Potential in a Tropical Watershed of the Colombian Andes. Catena 2005, 63, 85–108. [Google Scholar] [CrossRef]
  99. Yang, S.; Lianyou, L.; Ping, Y.; Tong, C. A review of soil erodibility in water and wind erosion research. J. Geogr. Sci. 2005, 15, 167–176. [Google Scholar]
  100. Rao, C.V.; Ashenafi, T.; Aminnedu, E. Erosion risk identification study using RUSLE model in G. Madugula Mandal, Visakhapatnam District, A.P., India. Eur. Acad. Res. 2014, 2, 12246–12260. [Google Scholar]
  101. Zakerinejad, R.; Maerker, M. An integrated assessment of soil erosion dynamics with special emphasis on gully erosion in the Mazayjan basin, southwestern Iran. Nat. Hazards 2015, 79, 25–50. [Google Scholar] [CrossRef]
  102. Hudson, N. Soil Conservation; Batsford Academic and Educational: London, UK, 1981. [Google Scholar]
  103. Yahya, F.; Zregat, D.; Farhan, I. Spatial Estimation of Soil Erosion Risk Using RUSLE Approach, RS, and GIS Techniques: A Case Study of Kufranja Watershed, Northern Jordan. J. Water Resour. Prot. 2013, 5, 1247–1261. [Google Scholar]
  104. United States Department of Agriculture. EPIC-Erosion/productivity Impact Calculator 1. Model Documentation; Technical Bulletin Number 1768; United States Department of Agriculture: Washington, DC, USA, 1990. [Google Scholar]
  105. Neitsch, S.L.; Arnold, J.G.; Kiniry, J.R.; Williams, J.R. Erosion Soil and Water Assessment Tool: Theoretical Documentatio; Blackland Research Center, Texas Agricultural Experiment Station: Temple, TX, USA, 2005; p. 494. [Google Scholar]
  106. Wawer, R.; Nowocien, E.; Podolski, B. Real and Calculated KUSLE Erodibility Factor for Selected Polish Soils. Pol. J. Environ. Stud. 2005, 14, 655–658. [Google Scholar]
  107. Anache, J.A.A.; Bacchi, C.G.V.; Panachuki, E.; Sobrinho, T.A. Assessment of Methods for Predicting Soil erodibility in Soil Loss Modeling. São Paulo, UNESP. Geociências 2015, 34, 32–40. [Google Scholar]
  108. Nigel, R.; Rughooputh, S.D. Soil erosion risk mapping with new datasets: An improved identification and prioritization of high erosion risk areas. Catena 2010, 82, 191–205. [Google Scholar] [CrossRef]
  109. McCool, D.K.; Foster, G.R.; Mutchler, C.K.; Meyer, L.D. Revised slope length factor for the Universal Soil Loss Equation. Trans. Am. Soc. Agric. Eng. 1989, 32, 1571–1576. [Google Scholar] [CrossRef]
  110. Foster, G.R.; Wischmeier, W. Evaluating Irregular Slopes for Soil loss prediction. Trans. Am. Soc. Agric. Eng. 1974, 17, 305–309. [Google Scholar] [CrossRef]
  111. Desmet, P.; Govers, G. A GIS procedure for automatically calculating the USLE LS factor on topographically complex landscape units. J. Soil Water Conserv. 1996, 51, 427–433. [Google Scholar]
  112. McCool, D.K.; Brown, L.C.; Foster, G.R.; Mutchler, C.K.; Meyer, L.D. Revised slope steepness factor for the Universal Soil Loss Equation. Trans. Am. Soc. Agric. Eng. 1987, 30, 1387–1396. [Google Scholar] [CrossRef]
  113. Tucker, C.J. Red and photographic infrared linear combinations for monitoring vegetation. Remote Sens. Environ. 1979, 8, 127–150. [Google Scholar] [CrossRef]
  114. Ahmed, B.; Kamruzzaman, Md.; Zhu, X.; Rahman, S.; Choi, K. Simulating Land Cover Changes and Their Impacts on Land Surface Temperature in Dhaka, Bangladesh. Remote Sens. 2013, 5, 5969–5998. [Google Scholar] [CrossRef] [Green Version]
  115. Fathizad, H.; Karimi, H.; Alibakhshi, S.M. The estimation of erosion and sediment by using the RUSLE model and RS and GIS techniques (Case study: Arid and semi-arid regions of Doviraj, Ilam province, Iran). Int. J. Agric. Crop Sci. 2014, 7, 304–314. [Google Scholar]
  116. Tirkey, A.; Pandey, A.C.; Nathawat, M.S. Use of Satellite Data, GIS and RUSLE for Estimation of Average Annual Soil Loss in Daltonganj Watershed of Jharkhand (India). J. Remote Sens. Technol. 2013. [Google Scholar] [CrossRef]
  117. Kim, H.S. Soil Erosion Modeling Using RUSLE and GIS on the IMHA Watershed, South Korea. Master’s Thesis, Colorado State University, Fort Collins, CO, USA, 2006. [Google Scholar]
  118. Ayalew, G.; Selassie, Y.G. Soil Loss Estimation for Soil Conservation Planning using Geographic Information System in Guang Watershed, Blue Nile Basin. J. Environ. Earth Sci. 2015, 5, 126–134. [Google Scholar]
  119. Troeh, F.R.; Hobbs, A.J.; Donahue, R.L. Soil and Water Conservation, 2nd ed.; Prentice-Hall Incorporation: Needham, MA, USA, 1991; pp. 81–86. [Google Scholar]
  120. Kelbesa, W.K. Ethiopian Environmental Policy: Challenges and Prospects on Sustainable Social and Economic Development. Master’s Thesis, Indira Gandhi National Open University, New Delhi, India, 2012. [Google Scholar]
  121. Cesare, E.; Ekbom, A. Ethiopia Environmental and Climate Change Policy Brief; Sida’s Helpdesk for Environment and Climate Change: Addis Abeba, Ethiopia, 2013. [Google Scholar]
  122. Yesuf, M.; Mekonnen, M.; Kassie, M.; Pender, J. Cost of Land Degradation in Ethiopia: A critical Review of Past Studies; Environment for Development, World Bank: Washington, DC, USA, 2007. [Google Scholar]
  123. Bewket, W.; Teferi, E. Assessment of soil erosion hazard and prioritization for treatment at the watershed level: A case study in the Chemoga watershed, Blue Nile Basin, Ethiopia. Land Degrad. Dev. 2009. [Google Scholar] [CrossRef]
  124. Gelagay, H.S.; Minale, A.S. Soil loss estimation using GIS and Remote sensing techniques: A case of Koga watershed, Northwestern Ethiopia. Int. Soil Water Conserv. Res. 2016, 4, 126–136. [Google Scholar] [CrossRef]
  125. Hurni, H. Erosion Productivity Conservation Systems in Ethiopia. In Proceedings of the 4th International Conference on Soil Conservation, Maracay, Venezuela, 3–9 November 1985. [Google Scholar]
  126. Gebreyesus, B.; Kirubel, M. Estimating Soil Loss Using Universal Soil Loss Equation (USLE) for Soil Conservation planning at Medego Watershed, Northern Ethiopia. J. Am. Sci. 2009, 5, 58–69. [Google Scholar]
  127. Hana, M.A. Assessment of Soil Erosion Risk with RUSLE and GIS in Geffersa Watershed, West Shewa Zone Oromiya Region. Master’s Thesis, Addis Ababa University, Addis Ababa, Ethiopia, 2014. [Google Scholar]
  128. Lahlaoi, H.; Rhinane, H.; Hilali, A.; Lahssini, S.; Khalile, L. Potential Erosion Risk Calculation Using Remote Sensing and GIS in Oued El Maleh Watershed, Morocco. J. Geogr. Inf. Syst. 2015, 7, 128–139. [Google Scholar] [CrossRef]
  129. Cebecauer, T.; Hofierka, J. The consequences of land-cover changes on soil erosion distribution in Slovakia. Geomorphology 2008, 98, 187–198. [Google Scholar] [CrossRef]
  130. Gete, Z. Landscape Dynamics and Soil Erosion Process Modeling in the Northwestern Ethiopia Highlands; African Studies Series; University of Berne: Berne, Switzerland, 2000. [Google Scholar]
  131. Efe, R.; Ekinci, D.; Cürebal, I. Erosion Analysis of Fındıkli Creek catchment (Northwest of Turkey) using GIS based on RUSLE (3D) Method. Fresenius Environ. Bull. 2008, 17, 576–586. [Google Scholar]
  132. De Carvalho, D.F.; Durigon, V.L.; Antunes, M.A.H.; Almeida, W.S.; Oliveira, P.T.S. Predicting Soil Erosion Using RUSLE and NDVI Time series From TM Landsat 5. Pesq. Agropec. Bras. 2014, 49, 215–224. [Google Scholar] [CrossRef]
  133. Karamage, F.; Zhang, C.; Kayiranga, A.; Shao, H.; Fang, X.; Ndayisaba, F.; Nahayo, L.; Mupenzi, C.; Tian, G. USLE-Based Assessment of Soil Erosion by Water in the Nyabarongo River Catchment, Rwanda. Int. J. Environ. Res. Public Health 2016, 13, 835. [Google Scholar] [CrossRef] [PubMed]
  134. Daba, S. An investigation of the physical and socioeconomic determinants of soil erosion in the Hararghe highlands, eastern Ethiopia. Land Degrad. Dev. 2003, 14, 69–81. [Google Scholar] [CrossRef]
  135. Samuel, L.M. Prediction of Runoff and Sediment Yield Using AnnAGNPS Model: Case of Erer-Guda Catchment, East Hararghe, Ethiopia. ARPN J. Sci. Technol. 2014, 4, 575–595. [Google Scholar]
  136. Alemayehu, T.; Furi, W.; Legesse, D. Impact of water overexploitation on highland lakes of eastern Ethiopia. Environ. Geol. 2007, 52, 147–154. [Google Scholar] [CrossRef]
  137. Setegn, S.G.; Yohannes, F.; Quraishi, S.; Chowdary, V.M.; Mal, B.C. Impact of Land Use/Land Cover Transformations on Alemaya Lake, Ethiopia. J. Indian Water Resour. Soc. 2009, 29, 40–45. [Google Scholar]
  138. Assen, M. Land use/cover dynamics and its implications in the dried Lake Alemaya watershed, Eastern Ethiopia. J. Sustain. Dev. Afr. 2011, 13, 267–284. [Google Scholar]
  139. Tadesse, L.; Suryabhagavan, K.V.; Sridhar, G.; Legesse, G. Land use and land cover changes and Soil erosion in Yezat Watershed, North Western Ethiopia. Int. Soil Water Conserv. Res. 2017, 5, 85–94. [Google Scholar] [CrossRef]
  140. Akale, T.A.; Dagnew, D.C.; Belete, M.A.; Tilahun, S.A. Mekuria, W.; Steenhuis, T.S. Impact of Soil Depth and Topography on the Effectiveness of Conservation Practices on Discharge and Soil Loss in the Ethiopian Highlands. Land 2017, 6, 78. [Google Scholar] [CrossRef]
  141. Lemessa, D. Khat (Catha edulis): Botany, Distribution, Cultivation, Usage and Economics in Ethiopia; UN-Emergencies Unit for Ethiopia: Addis Ababa, Ethiopia, 2001. [Google Scholar]
  142. Adugna, A.; Abegaz, A.; Cerdà, A. Soil erosion assessment and control in Northeast Wollega, Ethiopia. Solid Earth Discuss. 2015, 7, 3511–3540. [Google Scholar] [CrossRef]
Figure 1. Location of the Gobele Watershed.
Land 07 00025 g001
Figure 2. Partial view of LULC types in the study area: (a) bare land; (b) shrub; (c) grassland; (d) cultivated land; (e) Khat (Catha edulis); (f) forest; (g) water; (h) settlement.
Land 07 00025 g002
Figure 3. A comparative map showing classified LULC for (a) 2000 and 2016 (b).
Land 07 00025 g003
Figure 4. Flowchart of the RUSLE model developed in the ArcGIS software to estimate soil loss.
Land 07 00025 g004
Figure 5. Mean annual Rainfall (mm) (a); Rainfall erosivity (R) factor (b); Soil types (c) and Soil erodibility (K) factor (d); Slope in degree (e); Slope Length-steepness (LS) factor (f); Cover management (C) factor in 2000 (g) and 2016 (h); Support practice (P) factor in 2000 (i) and 2016 (j) of the Gobele Watershed, East Hararghe Zone, Ethiopia.
Land 07 00025 g005aLand 07 00025 g005b
Figure 6. Spatial distribution of mean annual soil loss of the Gobele Watershed; (a) in 2000, (b) 2016.
Land 07 00025 g006
Figure 7. Conservation Priority levels of the Gobele Watershed, East Hararghe Zone, Ethiopia.
Land 07 00025 g007
Figure 8. Partial view of erosion sites (ac), and conservation practices (di) in the Gobele Watershed, East Hararghe, Ethiopia.
Land 07 00025 g008
Table 1. Areal statistics of classified LULC for 2000 and 2016.
LULC Class20002016Rate of Changes
2000–2016 (%)
ha%ha%
Bare land67,021.0328.1949,932.8021.00−25.50
Cultivated land64,159.6026.98135,972.8157.18111.93
Forest7728.483.254794.842.02−37.96
Grazing land299.160.131863.970.78523.07
Settlements1199.160.5013,320.505.601010.82
Shrub96,822.9040.7231,704.4013.33−67.26
Water bodies556.110.23197.120.08−64.55
Table 2. Accuracy assessment of the classified LULC for 2000 and 2016.
LULC Class2000 2016
Producers
Accuracy
%
Users
Accuracy
%
Kappa (K^)Producers
Accuracy
%
Users
Accuracy
%
Kappa K^
Bare land69.5786.960.8495.65100.001.00
Cultivated land100.0094.120.93100.0095.240.94
Settlements100.0066.670.6391.67100.001.00
Forest70.0058.331.00100.00100.001.00
Grazing land70.0081.820.5460.00100.001.00
Shrub60.0081.820.79100.0075.000.71
Water bodies93.75100.001.00100.00100.001.00
20002016
Overall Accuracy (%)84.2694.44
Overall Kappa Statistics0.8150.934
Table 3. Standards for the soil erosion risk classification.
Erosion Risk ClassRate of Erosion
(t ha−1 y−1)
Very low<5
Low5–10
Low medium10–15
Medium15–20
High medium20–25
High25–35
Very high35–50
Extremely high>50
Table 4. The erosion risk classes and their corresponding areas for 2000 and 2016.
Soil Loss
(t ha−1 y−1)
Erosion Risk Class20002016
ha%ha%
<5Very low184,321.0077.515206,910.0087.015
5–10Low32,663.2013.73618,929.507.961
10–15Low medium12,935.505.4406685.712.812
15–20Medium4176.671.7562986.661.256
20–25High medium1986.960.8361295.240.545
25–35High952.930.401607.860.256
35–50Very high608.250.256244.760.103
>50Extremely high141.930.060126.670.053
Table 5. Change detection matrix showing the erosion risk class changes between 2000 and 2016 (%).
Soil Erosion
Risk Class
ABCDEFGHTotal 2000Loss
A68.695.501.940.790.360.130.030.0177.448.76
B11.631.580.370.140.040.010.000.0013.7612.19
C4.380.580.340.090.040.010.010.005.445.11
D1.290.190.110.140.030.010.000.001.771.63
E0.630.070.020.070.030.010.000.000.830.80
F0.280.030.020.020.030.010.010.000.410.40
G0.200.010.010.010.020.010.010.000.270.26
H0.050.000.010.000.000.000.000.000.070.06
Unchanged 70.80
Total 201687.157.962.821.260.550.190.060.01
Gain18.476.392.481.120.520.180.050.01
Net change9.70−5.8−2.63−0.51−0.28−0.22−0.21−0.05
A = Very low; B = Low; C = Low-medium; D = Medium; E = High-medium; F = High; G = Very high; H = extremely high.
Table 6. Conservation Priority Levels and their corresponding area.
Priority LevelArea (ha) Percentage of Total Area
1st priority level104.780.04
2nd priority level1164.270.49
3rd priority level1963.740.83
4th priority level306.590.13
5th priority level5611.782.36
6th priority level15,186.006.39
7th priority level6616.902.78
8th priority level206,832.3786.98

