Post-War Land Cover Changes and Fragmentation in Halgurd Sakran National Park (HSNP), Kurdistan Region of Iraq


1
Faculty of Science, Petroleum Geosciences Department, Soran University, Delzyan Campus, Soran 44008, Erbil, Iraq
2
Scientific Research Centre (SRC), Soran University, Delzyan Campus, Soran 44008, Erbil, Iraq
3
Centre for Landscape and Climate Research (CLCR), Department of Geography, University of Leicester, University Road, Leicester LE1 7RH, UK
4
National Centre for Earth Observation, University of Leicester, University Road, Leicester LE1 7RH, UK
*
Author to whom correspondence should be addressed.
Land 2018, 7(1), 38; https://doi.org/10.3390/land7010038
Submission received: 8 February 2018
/
Revised: 12 March 2018
/
Accepted: 13 March 2018
/
Published: 19 March 2018
(This article belongs to the Special Issue Biodiversity and Protected Areas)
Abstract
:Context: The fundamental driving force of land use and land cover (LULC) change is related to spatial and temporal processes caused by human activities such as agricultural expansion and demographic change. Landscape metrics were used to analyze post-war changes in a rural mountain landscape, the protected area of Halgurd-Sakran National Park (HSNP) in north-east Iraq. Therefore, the present work attempts to identify the temporal trends of the most fragmented land cover types between two parts of the national park. Objectives: The objectives of this study are to compare two land cover classification algorithms, maximum likelihood classification (MLC) and random forest (RF) in the upper and lower parts of HSCZ, and to examine whether landscape configuration in the park has changed over time by comparing the fragmentation, connectivity and diversity of LULC classes. Methods: Two Landsat images were used to analyze LULC fragmentation and loss of habitat connectivity (before and after the Fall of Baghdad in 2003). Seven landscape pattern metrics, percentage of land (PLAND), number of patch (NP), largest patch index (LPI), mean patch size (MPS), euclidian nearest neighborhood distance (ENN_AM), interspersion and juxtaposition (IJI) and cohesion at class level were selected to assess landscape composition and configuration. Results: A significant change in LULC classes was noticed in the lower part of the park, especially for pasture, cultivated and forest-lands. The fragmentation trends and their changes were observed in both parts of the park, however, more were observed in the lower part. The inherent causes of these changes are the socio-economic factors created by the 1991–2003 UN post-war economic sanctions. The changes increased during sanctions and decreased afterwards. The fall of Baghdad in 2003, followed by rapid economic boom, marked the greatest cause in land use change, especially in changes-susceptible cultivated areas. Conclusions: Shrinkage of forest patches in the lower part of the park increases the distance between them, which contributes to a decline in biological diversity from decreasing habitat area. Lastly, the results confirm the applicability of the combined method of remote sensing and landscape metrics.
1. Introduction
Land is an essential and limited natural resource [1]. Utilizations of landscapes by people often result in a modification of land cover through changing human land use [2,3,4]. The ecological area or natural environment in which a particular animal or plant species usually lives is described as their habitat [5]. Land use change implies the qualification and quantification change of land cover type “as habitat for organisms and productive land for humans” [6]. Moreover, a decrease in the size of habitat fragments is a significant indicator of habitat fragmentation [7].
Land use/land cover changes are influenced by a variety of factors and they can be categorized into direct (proximate) and indirect (underlying, root) causes. How humans modify land cover represents the direct change, while the interaction of social, economic, political, demographic and culture recognized as indirect or root causes. Moreover, indirect driving forces can be defined as socio-economic drivers, which comprise of socio-political, socio-economic and cultural factors. Socio-economic-political factors drive people to degrade the natural environment [8,9,10]. The agricultural regions are good indicators for changing in land use and land cover by the conflict and geopolitical forces. Moreover, the year 2003 is the turning point from the poverty to richness and from the dictatorship to the democracy and it also represents the period of the end of sanctions in this study [11].
Landscape fragmentation is a dynamic process and has a large impact on biodiversity as a result of changes of habitats in a landscape through time [12,13]. Landscape fragmentation has several causes such as anthropogenic activities, urban development, natural causes, agricultures, illegal logging, and forest cutting. All these factors alter the landscape structure with its components [14,15,16]. Biological diversity in a landscape generally declines as fragmentation progresses, when the species extinction rate increases as a result of reducing habitat area and habitat connectivity, thus the species immigration rate will decrease [17].
Landscape connectivity has two components: structural and functional. Structural connectivity is associated with the physical characteristics of the landscape, whereas functional connectivity is related to the movement of the organisms in space and time within a landscape. Studying temporal function connectivity infers the persistence of organisms in time, in the same place, while spatial function connectivity relates to the spatial pattern [18,19]. Habitat corridors are important for species movement and protection. Their management and planning are significant for protecting green belts that can have a major recreation function, especially green corridors along roads [20]. Reductions in habitat areas and connectivity disturb the biodiversity (flora and fauna) [17]. The purpose of the habitat corridor connectivity to allow organisms in a protected area of land is to migrate from one land area to another. This type of conservation is considered when there is a loss of connectivity in habitat land cover types in a landscape usually follow an uneven distribution and are spatially heterogeneous.
The compositional heterogeneity of spatial units in the landscape refers to their number, type, and abundance, whereas the mosaic of spatial arrangements of those units is defined as configurational heterogeneity [20,21].
To gather information on the landscape fragmentation in an area of interest, remotely sensed (RS) images are a versatile tool [22]. Through analyzing landscape patterns, the interaction between anthropogenic factors and the environment can be better understood. All kinds of social and environmental factors change the Earth’s surface in different spatial and temporal scales by influencing main ecological functions [23]. Thus, there is a relationship between LULC and the fragmentation of landscapes [24].
Classification is widely used to derive thematic information from (RS) [25]. Remote sensing has been widely used for mapping land cover at a variety of spatio-temporal scales [26]. The categorization of pixels in an image into land cover classes is the general objective of a classification of multispectral data based on the similarity of the spectral signature of a pixel to a set of training signatures (supervised) or based on the data themselves in an unsupervised classification [27]. Traditional image classification techniques include pixel-based (e.g., supervised Maximum Likelihood Classification (MLC) and unsupervised e.g., Κ-means or ISODATA), sub-pixel-based (e.g., Fuzzy, neural networks regression modeling, etc.), and object-based techniques (e.g., segmentation) [28]. Unsupervised classification does not require training data, unlike supervised classification [27]. In object-based classification, an object starts with the combination of neighboring pixels into similar areas or depends on groups of pixels that represent the shapes and sizes, while in pixel-based classification method each pixel has a class that bases exclusively on the digital number of the pixel itself [29,30,31]. In contrast to traditional classification methods newer non-parametric algorithms such as random forest (RF) have been developed, which is least sensitive to the parameters and applies multiple decision trees to a set of training data [32]. The RF algorithm [33] is an ensemble classifier that consists of many decision trees that does not overfit. RF can be used for land cover mapping [34] and it often gives better land cover classification accuracies [35,36]. Moreover, RF with its multiple advantages such as handling large numbers of input variables and calculating an error matrix, giving estimates of the importance of the features in the classification fast and robust [32].
Significant human interference with the Earth’s surface affects the observed transformations in LULC [37]. In the last few decades, in many areas around the world, the rural land use have changed rapidly [38]. Industrialisation, urbanization, population growth, and economic reforms are major driving forces contributing to land-use change [39]. A rapid socio-economic change can induce LULC change such as farmland abandonment [40]. The complex interrelationship between socio-economic factors and LULC can be further compounded when global climate change is added as a factor [41].
Wars and political conflicts could have reversible or irreversible socio-economic damaging effects on agriculture, land use and land cover. The deliberate desiccation of marshlands in southern Iraq during the 1980–1988 Iraq-Iran war resulted in disastrous and changes to the land cover and use, ecosystem services and anthropogenic activities [42]. The United Nations Security Council enforced a comprehensive set of sanctions on Iraq following the latter’s military invasion of Kuwait in August 1990. Consequently, the period 1990–2003 in Iraq generally and in Kurdistan region demonstrated a period of economic war in the form of comprehensive sanctions [11], which had, in addition to the war direct consequences, devastating long-lasting results on population and economy.
The ability to acquire repeated satellite images is useful for monitoring and assessment of natural resources change occurring over time in a specific place. Thus, the use of RS and GIS is a task to address land use and landscape challenges in a wide range of resource management problems. Remote sensing data offers a valuable multi-temporal data on processes and phenomena that act over larger areas. For example, it poses a major data source specifically, for assessing protected areas [43], monitoring biodiversity [44], promoting sustainable urbanization in Greater Dhaka, Bangladesh [45], land use and land cover change detection in the western Nile data of Egypt [46] and Kodaikanal taluk, Tamil nadu [47], impact of land use change on risk erosion and sedimentation in a mixed land use watershed in the Ozark Highlands of the USA [48], applying of RS/GIS to forest fire risk mapping in the Mediterranean coast of Spain [49], using satellite images of studying forest resources in three decades of research development by [50], and monitoring forest cover change and forest degradation using remote sensing and landscape metrics of Nyungwe-Kibira park in Rwanda and Burundi [51].
Halgurd-Sakran National Park (HSNP) belongs to Choman district and consists of three zones; core zone, outer zone and additional outer zone. Our study focused on the core zone (CZ) (Figure 1) [36]. Due to its remote location, mountainous terrain, scant and limited transportation to the districts and sub-districts, there was negligible economic development in HSCZ before the Fall of Baghdad in April 2003. However, because of the attractive natural landscapes and the accelerated general economic growth in Kurdistan after 2003, the HSNP has been selected on the top list of tourism destinations for travelers in Kurdistan region-Erbil governorate since 2008 [36].
The aim of this research is to identify the temporal trends of the most fragmented land cover types between the upper and lower parts of the national park. The comparison of two land cover classification algorithms, MLC and RF in the upper and lower parts of HSCZ was the first specific objective in this study. Whereas, the second specific objective was to examine whether landscape configuration in the park has changed over time, by comparing the fragmentation, connectivity and diversity of LULC classes.
2. Materials and Methods
2.1. Study Area
HSNP is located in the northeast of Erbil-Iraq and shares a boundary with Iran along the Zagros Mountain Range (Figure 1). The climate of the Kurdistan region is very hot and dry in summer and cold and wet in winter. The Kurdish Regional Government (KRG) officially designated this area of interest a protected area since 2008. Significant socio-economic improvements such as urbanization took place after the Fall of Baghdad in 2003 in the area of interest [52,53]. Table 1 presents the population for villages around Choman district, which has grown smoothly over the last six years [54].
2.2. Remote Sensing Data
Two satellite images from Landsat 7 Enhanced Thematic Mapper plus (ETM+) for 1998 and Landsat 8 Landsat Data Continuity Mission (LDCM) for 2015 were used in this study (Table 2). Six multispectral bands, excluding the thermal band, were used for Landsat 7 and eight multispectral bands for Landsat 8. The two images were projected into Universal Transverse Mercator (UTM) zone 38 N, and then assembled in a Geographical Information System (GIS). Landsat images were processed and subset to include the entire area of HSCZ. The downloaded images for the study area were at processing level L1T, which means it is geometrically corrected and has a sufficient level. Then, the calibrated radiance values were atmospherically corrected using FLAASH in ENVI 5.3. Landsat images have been used and subset it in ENVI then exported to ArcMap 10.3. Images from 1998 and 2015 were categorized into four land cover classes; namely, bare surface, pasture, cultivated area, and forest. 160 training sites, 40 points for each land cover class (bare surface, pasture, cultivated land, and forest), were chosen for the upper and lower parts to be representative. The selected training sites were principally based on high-resolution imagery from Google Earth, ESRI ArcMap base map, and expert knowledge from the Agricultural Department of the District of Choman. Ancillary data such as slope, aspect, elevation, and NDVI were used in image classification to increase the accuracy and discrimination in land use/land cover mapping [55].
Maximum Likelihood Classification is one of the most commonly used algorithms [56], which has been broadly used for the LULC classification worldwide [57]. Pixel-based MLC algorithm relies on a statistical model [56]. The MLC algorithm is categorizing objects into classes with the highest probability that a pixel belongs to a particular class [29,30,31]. Furthermore, it assumes that the image data for each class is normally distributed according to their spatial and spectral characteristics [56]. During the classification procedure in ArcMap 10.3 the vector data integrates with the satellite image for applying pixel-based method.
On the other hand, the RF classification ensemble method is building a set of classifiers and develops lots of decision trees based on random selection of data and random selection of variables [58], then after taking a vote of their accurate and stable predictions [56]. Random forest splits each node using the best among a subset of predictors randomly chosen at that node. Thus, this procedure produces a wide variety, which usually lead to a better model [58]. Furthermore, the number of variables (M) and the number of trees (T) are two parameters in the forest. Increasing the number of variables lead to increasing the correction between the trees and the classification accuracy of an individual tree in the forest [59]. “As m increases correlation and individual tree accuracy also increase and some optimal m will give the lowest error rate”. In addition, the variable importance and internal structure are also other two additional measures in the random forest. The importance of the predictor features measure by variable importance, which is done by out of bagging (OOB) [60]. In order to estimate the importance of a certain feature, the out of bagging samples are evaluated by computing the accuracy throughout the trees and by counting the votes of each variable in the classification [59,61].
Moreover, building random forests model starts with using roughly two-thirds of the training samples and the rest (one-third) of training data (the out-of-bag samples) is used to estimate the error of the predictions. Horning (2010) showed the overcoming of the over-fitting problem for the training data by using “pruning” in decision trees. This process offers the lowest error by removing terminal nodes. In the decision trees the growing of tree is too large with the terminal nodes. Reducing these nodes will simplify the tree. We have implemented RF using a software package in R language and analyzed Landsat images.
The classification was carried out by making a comparison between MLC and RF. Each class has been prepared for spatial analysis metrics in FRAGSTATS, and then independently validated for their overall accuracy and kappa index (κ). Each class was prepared for spatial metrics analysis in FRAGSTATS 4.2.
2.3. Analyzing Changes for Fragmentation, Connectivity and Diversity
Landscape metrics following McGarigal and Marks (1995) [7], and McGarigal and Cushman (2002) [62] were grouped in four types: fragmentation, isolation, heterogeneity, and connectivity.
FRAGSTATS 4.2 was used to extract the landscape metrics from each land use map of 1998 and 2015. Seven landscape metrics at class level were calculated for analyzing fragmentation, connectivity, and diversity (heterogeneity), (Table 3) [62].
Metrics that were used for fragmentation were PLAND, NP, LPI, and MPS, while the ENN_AM was used to interpret the isolation of land cover patches. Concerning heterogeneity, the interspersion and juxtaposition was used, and cohesion was applied for connectivity. For this research, mean patch size and number of patches were used to summarize the fragmentation process of LULC categories at class level.
3. Results
3.1. Accuracy Assessment and the Performance Comparison of Two Algorithms
The comparisons of accuracy assessments between two classification algorithms are shown in Table 4. The accuracy assessment of ML classified images shows an overall accuracy for the 1998 image in the upper part of 66.2% with κ = 0.55; and overall accuracy for 2015 of 81% with κ = 0.74. The results for the RF classification in the upper part gave an overall accuracy for the 1998 image of 98% and κ = 0.97 and for 2015 of 98% and κ = 0.97.
Concerning the lower part of HSCZ the MLC accuracy assessment for image 1998, as presented in Table 5, has 57% overall accuracy and κ = 0.67. The RF classification for 1998 showed 99% overall accuracy and κ = 0.98 and for 2015 the overall accuracy was 99% with κ = 0.99. The classification results for the HSCZ revealed that the RF algorithm was more successful and gives higher classification accuracies than MLC.
3.2. Land Use/Land Cover Changes Based on Random Forest Classification
3.2.1. Land Cover Class Distribution in the Upper and Lower Parts of Core Zone
Figure 2 represents the study area that was categorized into four different classes (bare surface, pasture, cultivated land, and forest) using random forest classification [36]. In general, the lower part between the two time periods showed greater changes between LULC classes. Figure 3 displays the changes that occurred among land use land cover classes from 1998 to 2015 using the Land Change Modeller in TerrSet.
3.2.2. Land Use/Land Cover Dynamics
From 1998 to 2015, increase in pasture area was relatively significant as compared to the other LULC classes within the 17-year period of study in the lower part of the park, and this resulted in the increase of its percentage of land (PLAND) (Table 5).
In the upper part of the park, the barren land demonstrates a lesser decrease in IJI in 2015, which reflects the tendency towards uneven distribution. However, the patch numbers increased significantly for cultivated area with a slight increase for the bare surface, while pasture and forest lands decreased slightly over time Figure 4. The tendency towards uneven distribution (IJI) of barren land can be observed in Figure 5.
Likewise, Figure 4 and Figure 5 indicate trend towards more fragmentation, a small tendency to greater isolation and the heterogeneity and more physical connection of the pasture class in 2015. Thus, this analysis shows a slight trend towards increasing fragmentation of pasture land. Whereas, the cultivated area was more isolated, more evenly distributed and more physically connected in 2015 compared to 1998. This change can be related to the reduction of farming in the study area as a result of socio-economic growth. Therefore, the patches were not affected by fragmentation in the upper part of the park. Concerning the forest land, a slight decrease of the ENN_AM, very small changes in LPI and MPS were observed. Thus, the degree of isolation and spatial distribution of forest patches were reduced with less uniform distribution of forest patches from 1998 to 2015. Regardless of the slight increase of NP, LPI and MPS, with a slight decrease of the ENN_AM and cohesion, a fragmentation process of forest land was ongoing in the time period in the upper part of HSCZ.
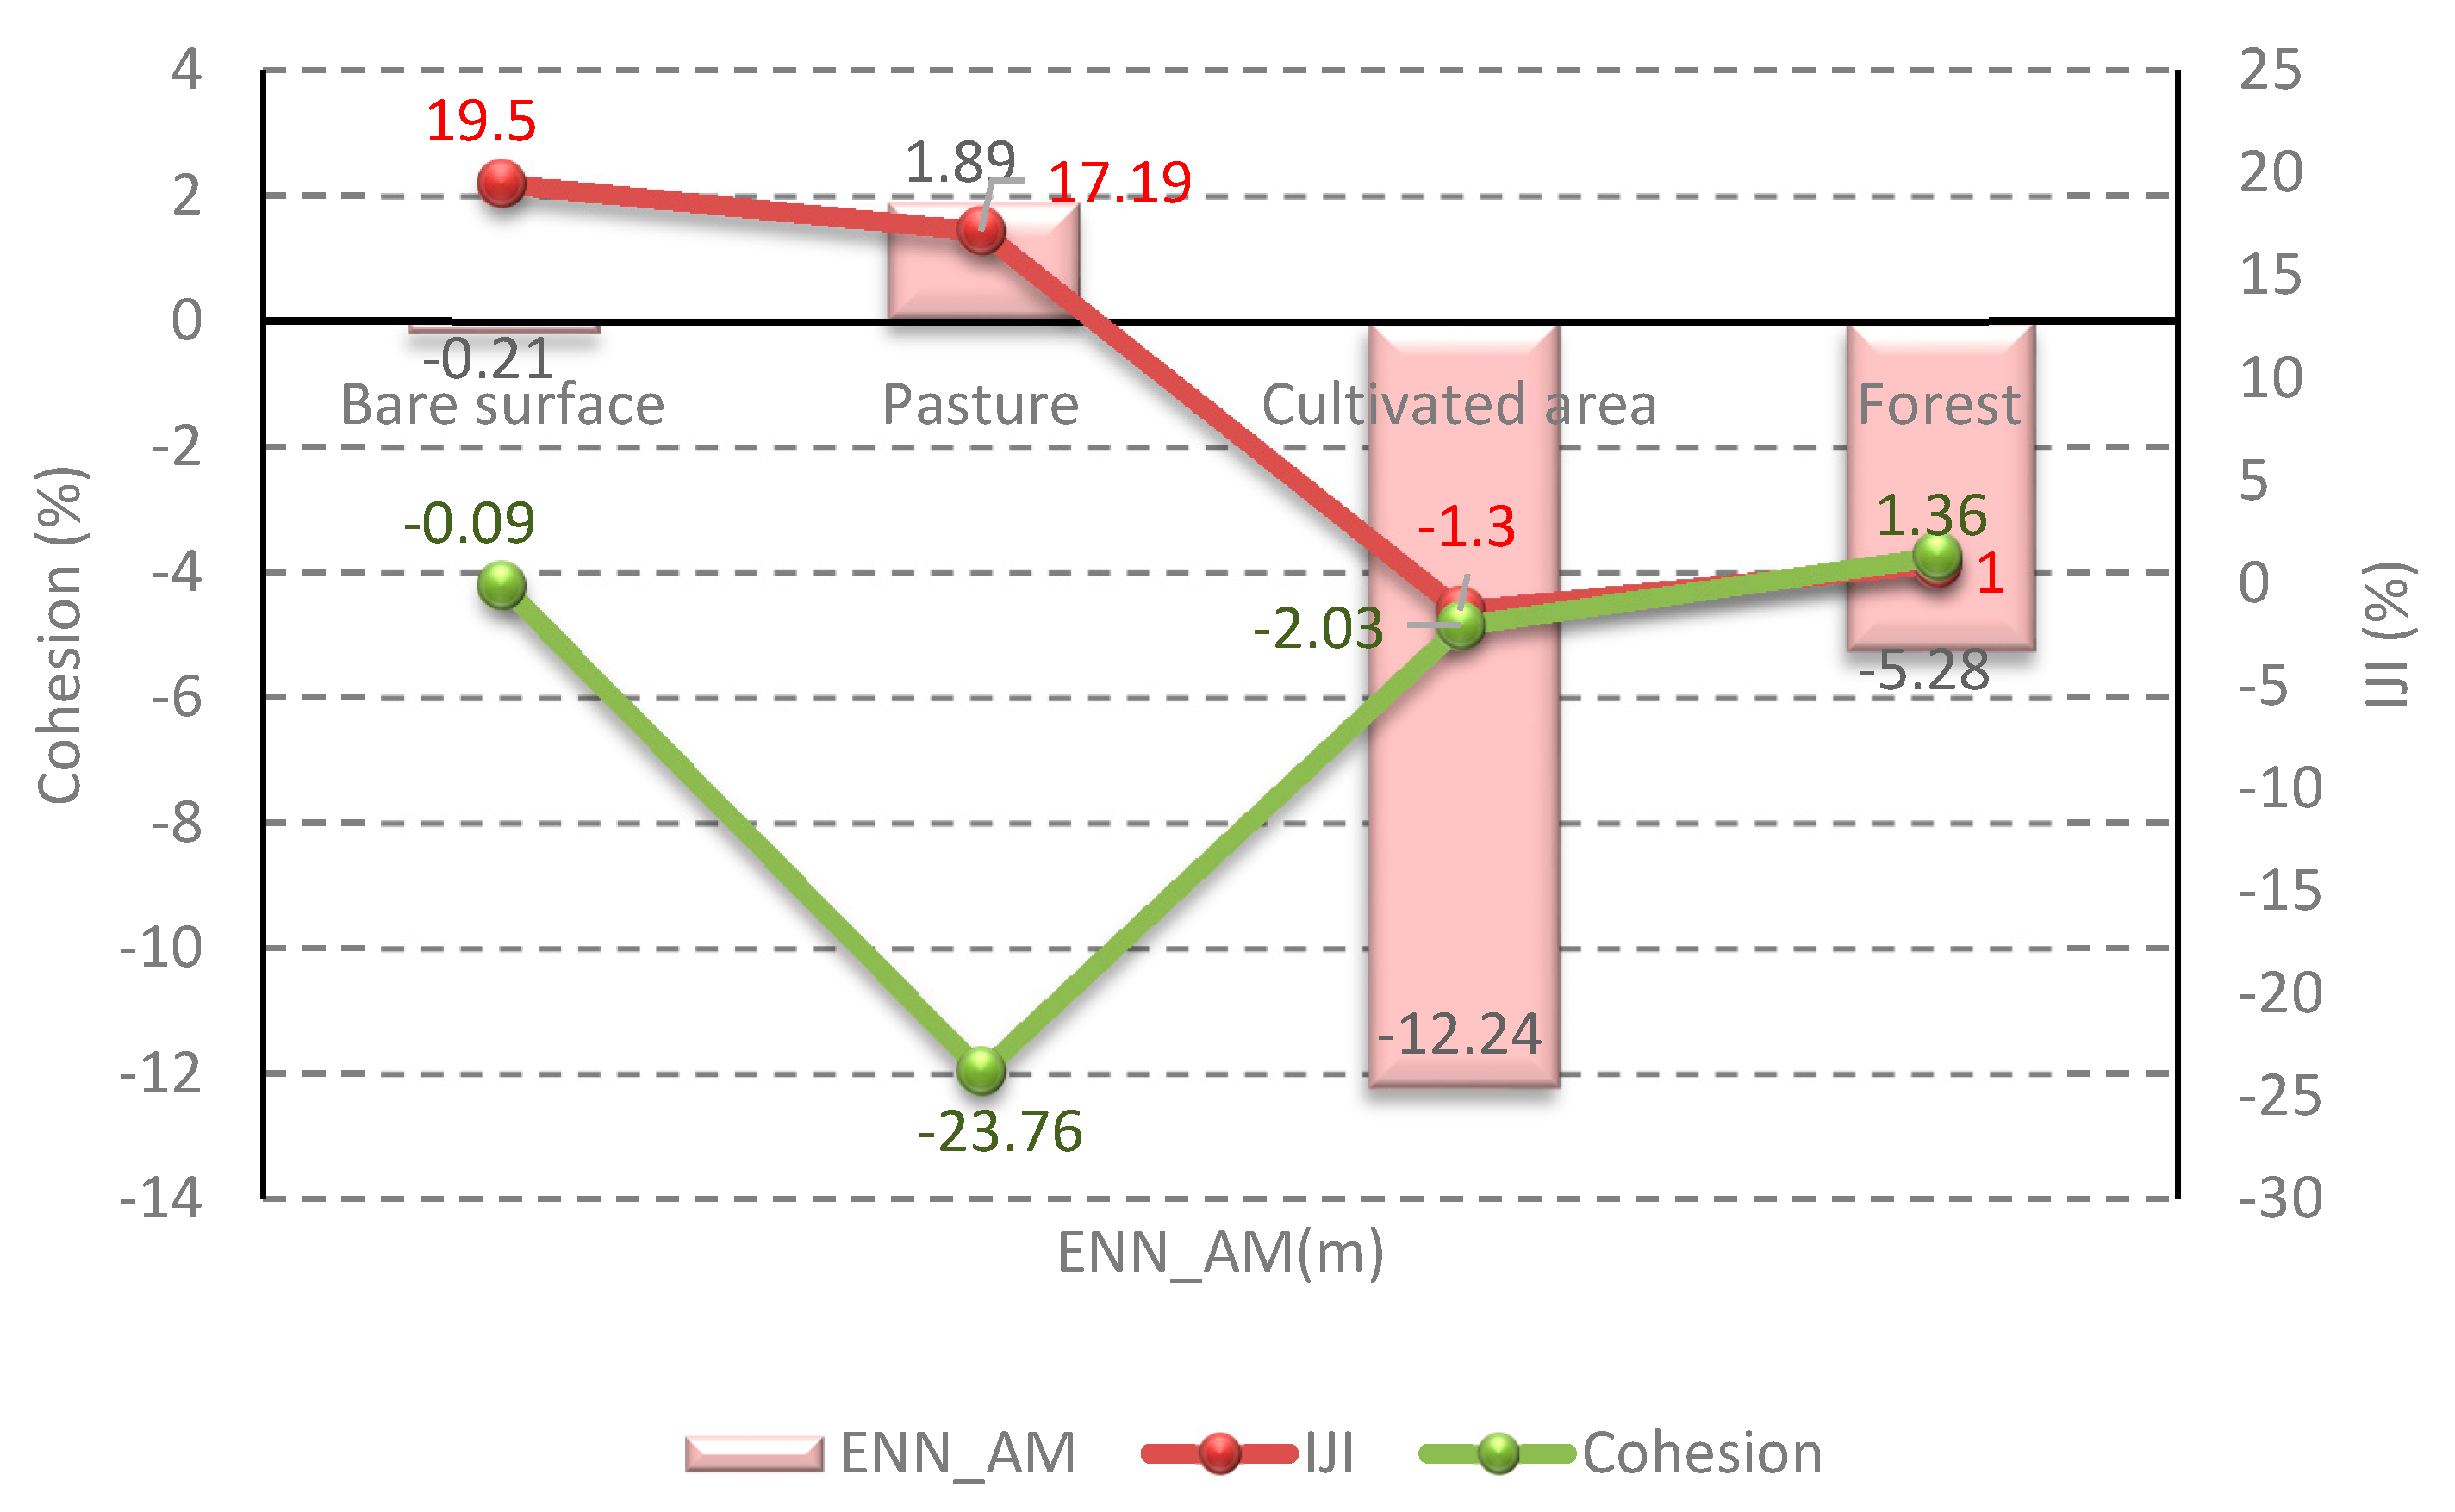
In the lower part of the park, there was a tendency for barren land to fragment more over this time period with the trend to isolation over time. Figure 6 represents that patch types that were uniformly adjacent to each other and were more clumped in distribution, while the reduction of IJI in 2015 indicates a more uneven distribution of bare cover patch sizes.
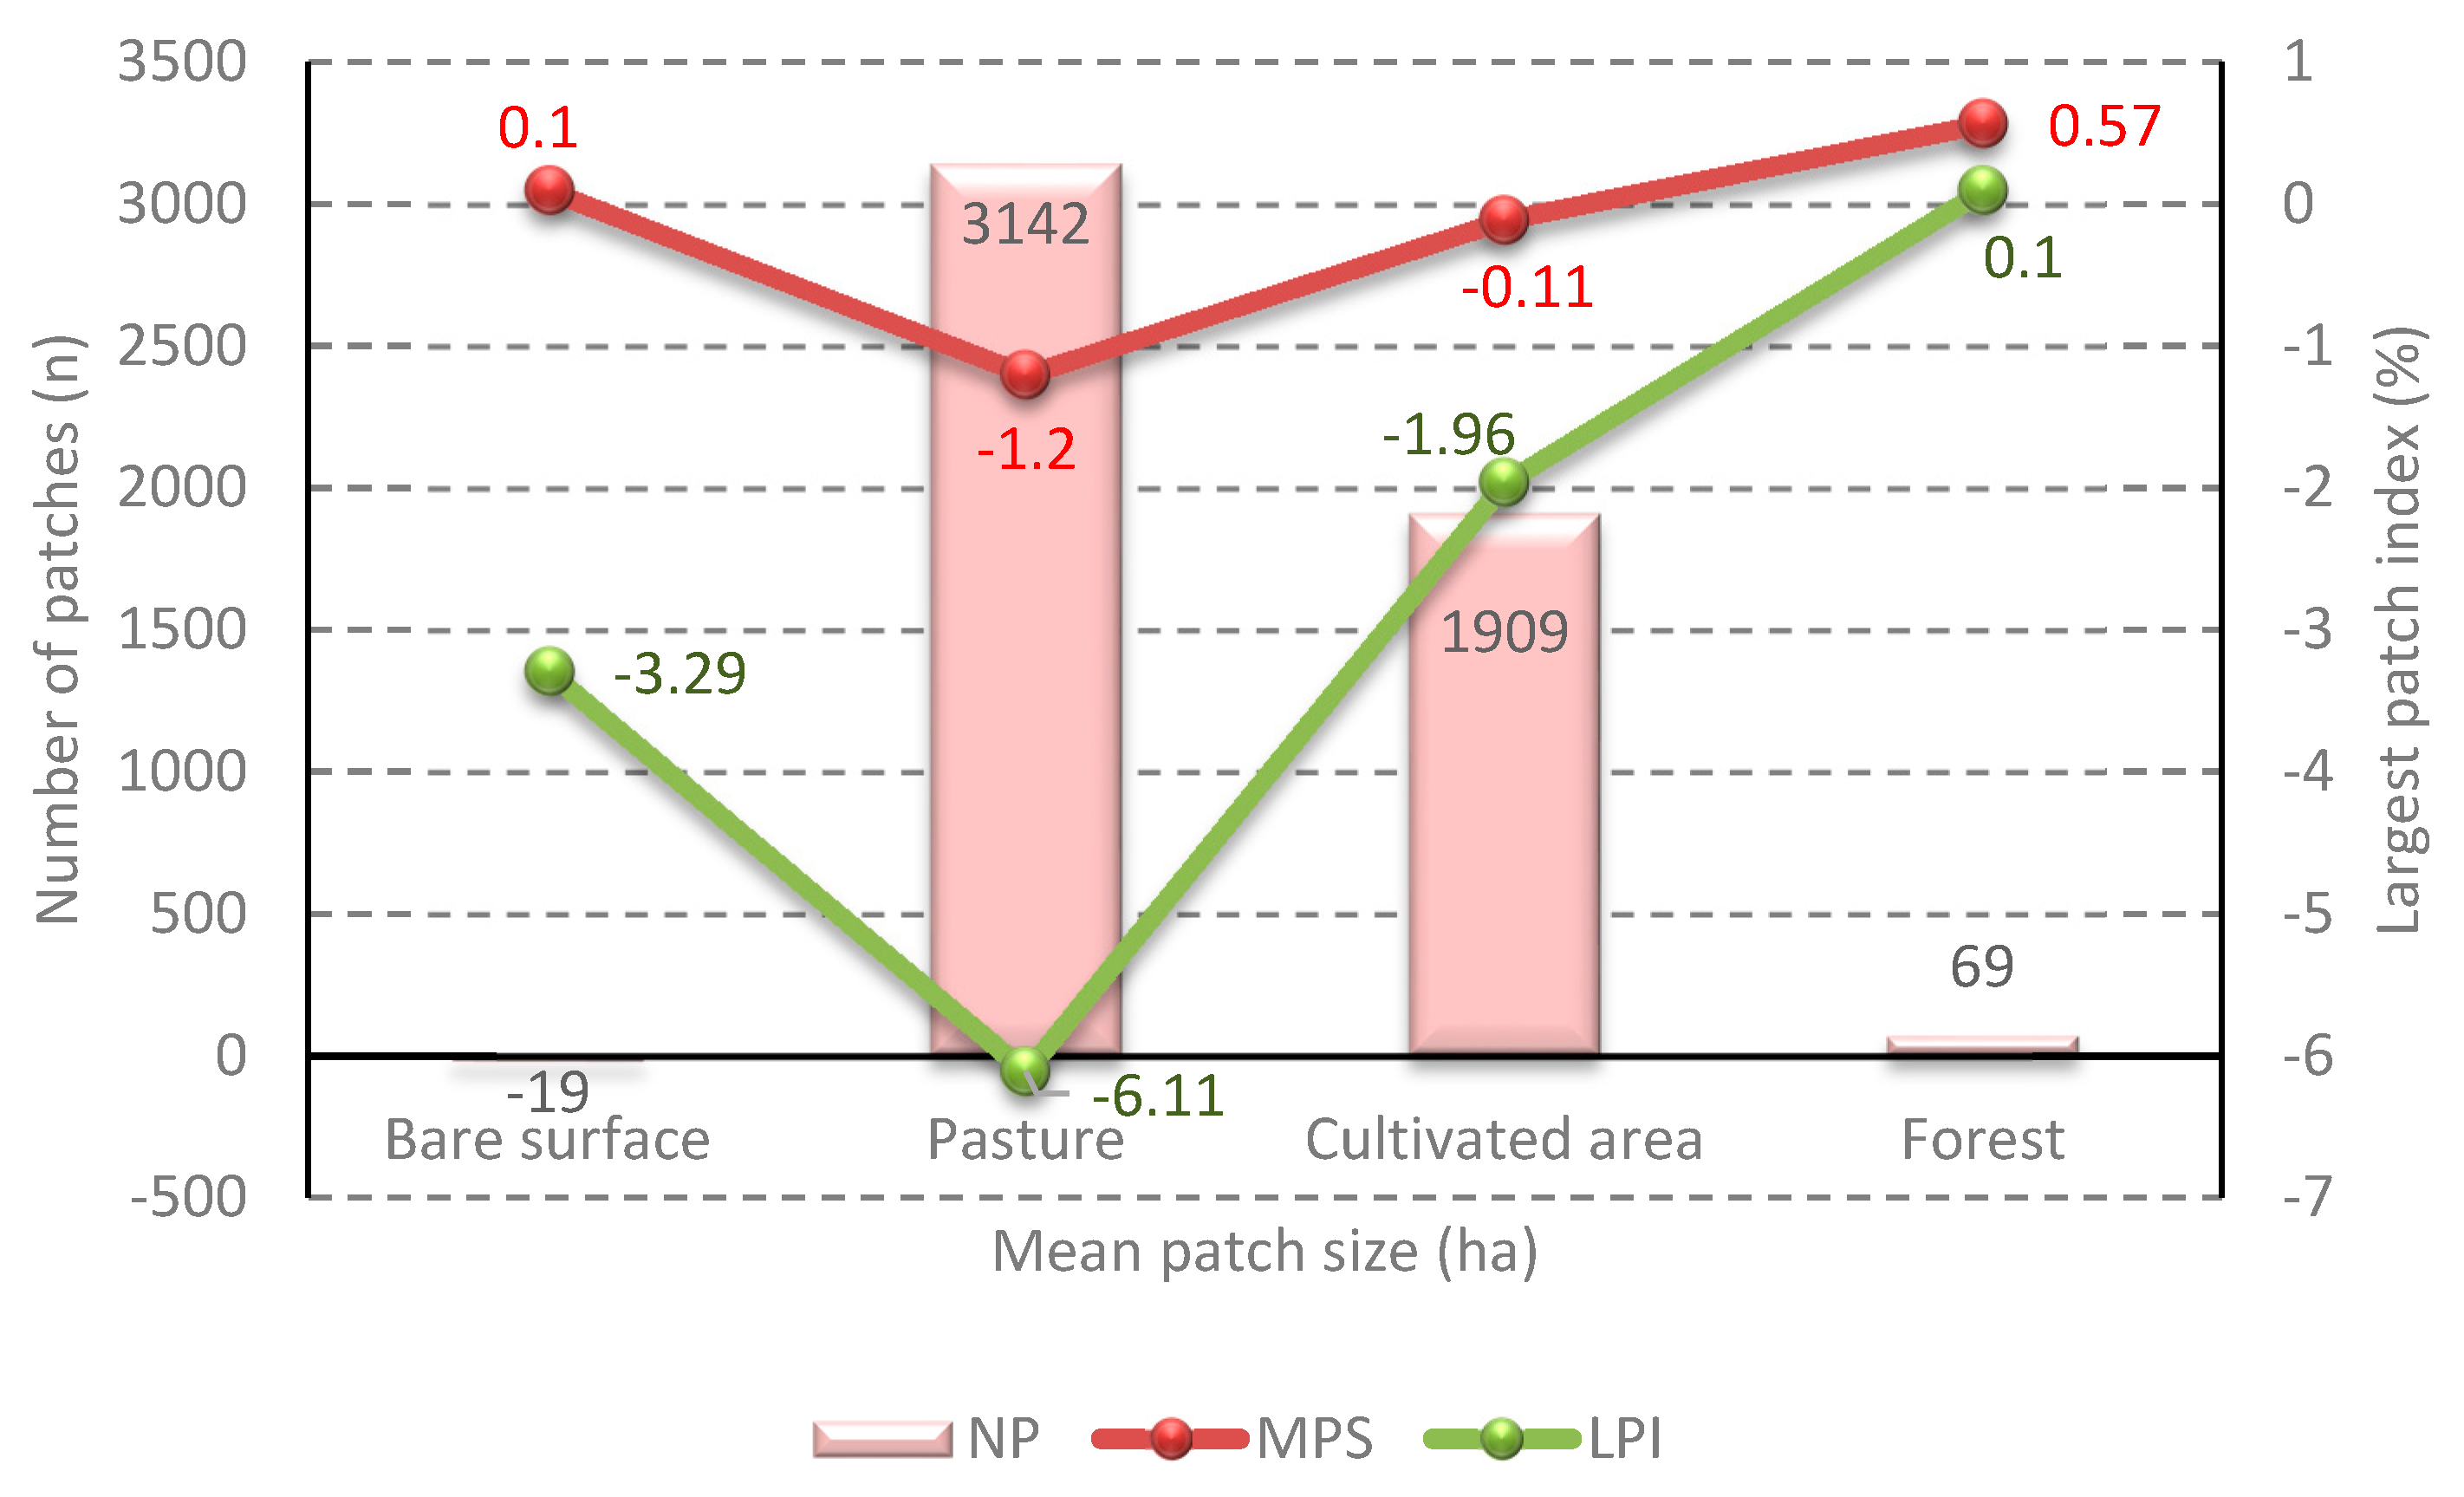
In general, in the lower part of the park the fragmentation was continuing for barren land by the increase of NP which was also confirmed by a decrease of MPS. Thus, the upper and lower parts are behaving differently concerning the barren land; this could be that the upper part contains fewer villages, higher mountain ranges, and inaccessibility to natural resources than the lower part of the park. A huge reduction was observed for pasture patch number (NP) with a slight increase of LPI and MPS over time (Figure 6). These changes indicate a trend of pasture land becoming more clumped and gradually reduced the distance of pasture patches to the nearest neighbor of the same class. Additionally, the pasture patches were more adjacent to each other in 1998 but were less clumped in distribution in 2015. Over time, a large increase in the cohesion indicating that the pasture land was less cohesive and less physically connected in 1998 in the lower part compared to the same class in 2015 (Figure 6). The decreasing and increasing of patch number (NP) and mean patch size (MPS) expresses the stability and physical connectivity of the pasture class in the lower part of the park over time.
On the other hand, the reduction in cultivated area is accompanied by a significant reduction of NP with an increase for both LPI and MPS (Figure 6). The mean distance ENN_ MN for patches of cultivated land increased similar to the upper part of the park. Patches became more isolated, the distances between patches increased and the numbers of cultivated land patches decreased. A slight increase for IJI value shows a trend towards more a uniform distribution of cultivated land patches. The patches were more connected in 2015 (cohesion) (Figure 7). This reduction of cultivated land in the lower part of the park reflects the socio-economic growth in the region especially after the Fall of Baghdad, April 2003. Concerning, the forest land the NP, LPI, and MPS of patches declined slightly (Figure 6). The increase in the mean distance (ENN_AM) between forest patches reflects the increasing isolation between forest patches. The decrease of IJI indicates changes towards a more uneven distribution among forest patches. Physical connection and aggregation for forest patches were reduced and cohesion slightly decreased, (Figure 7). Overall the lower part of the park was not affected by forest fragmentation, despite a noticeable overall forest loss.
4. Discussion
4.1. Landscape Fragmentation at Class Level
The classification technique used to derive the LULC maps for 1998 and 2015 was random forest classification. One advantage of RF is that it is one of the most accurate learning algorithms available [32,33]. The overall LULC classification accuracy level in the upper and lower parts for two dates were very high for investigating the study area. On the other hand, the proportion of each LULC classes holds a significant information concerning the composition and configuration of landscape mosaic in the upper and lower parts of the park. Four main criteria: fragmentation, isolation, heterogeneity, and connectivity have been selected for measuring the landscape spatial pattern in HSCZ. Then, seven of the most appropriate landscape indices for representing each criterion were selected.
4.1.1. Bare Surface
This shrank of the bare surface size in both parts is accompanying with increasing the IJI. Noticeably, the distribution of adjacencies among bare surface patches trend to become more increasingly uneven in the lower part than the upper part of the park, as the IJI value higher in the upper part than IJI value in the lower part in 2015. This means that the disaggregation or the heterogeneity of the bare surface patches are higher in the lower part than the upper part across the landscape of the park. This variance is related to the NP in both parts. The NP decreased in the upper part in 2015, while the number of bare surface patches in the lower part of the park increased at the same time period. This suggesting that the fragmentation of the bare surface patches in the lower part are higher or a tendency of patches are directed to be fragmented more in the lower part, as a consequence could be of fire, excessive grazing or even of climate conditions. Thus, the fragmentation strengthened in this part of the park. Furthermore, higher ENN_AM values in the lower part indicate more isolated landscape patterns. Thus, the isolation between patches was more isolated in the lower part than the upper part. The scores of the cohesion are the same in both parts indicating the physically connected landscape spatial patterns in both parts are constant in 2015.
4.1.2. Pasture
The PLAND of the pasture in the lower part significantly increase with a slight decrease in the upper part in 2015. This can be related to economic boom which most of population changed their professional work and left the agricultural lands, as lower part contains more villages and population. The connectivity in the lower part improved better for pasture patches than the upper part, this witnessed by the cohesion values. This increase of cohesion value drives the landscape to more ecosystem sustainability. Moreover, the rate of decline is fairly sharp concerning the NP in the lower part, which made the patches of pasture distributed more regularly or clumped in this part of the park in 2015. Whereas, the IJI value in the upper part indicates more irregularly distributed as displayed a slight decrease values between 1998 and 2015. Thus, the pasture patches trend to the fragmentation in the upper part of the park in 2015 and at the same time they trend to accumulation in the lower part. The ENN_MN among patches decreased while the Cohesion increased in both parts of the park in 2015, suggesting that the connectivity of pasture patches had increased and pasture patches are less isolated. Many researchers observed how the increase of pasture lands provide more forage to animals, reduce erosion, filter runoff, absorb rainfall and improve production [63,64].
4.1.3. Cultivated Area
The period between 1998 and 2015 represents the economic boom period in the study area especially, after the Fall of Baghdad. The modification of the landscape metrics were unique of cultivated area in both parts in 2015 by declining their areas in sizes PLAND and number of patches and similarly, by increasing their LPI, MPS, ENN_AM, IJI and Cohesion. Furthermore, the observed decrease in NP of cultivated patches in the upper and lower parts of the park indicates a reduction in human activities on the landscape such as agricultural activities as a result of decrease in poverty between 1998 and 2015. This positive modification led to more sustainable, stable, aggregated and better connected patches across the landscape in 2015. One thing, which was concerned in this area is increasing the isolation ENN_AM among the cultivated patches in both parts. This could be stated to the result of similar isolated patches joined to one another. Similar patches of cultivated lands aggregated as a result of increasing MPS and LPI with better connection.
4.1.4. Forest Class
The decrease in forest patch size in the lower part is accompanying with decreasing the NP, LPI, MPS, IJI and cohesion, but not the ENN_AM. This suggesting that the forest patches in the lower part in 2015 were less fragmented, fewer connected, the distribution of adjacencies among patches becomes uneven and patches were more isolated in 2015. Whereas, the forest patches in the upper part in 2015 indicate to larger patch size, greater fragmentation, lesser isolated, uneven distribution among patches and less connected across the landscape. The class level metrics analysis indicated that the decrease in the number of patches in the lower part of the park in 2015 was not related to the reduction of the LPI and MPS, but to similar isolated patches joined to one another.
This suggested that the modification and fluctuation of forest patches in the lower part of the park is higher than the upper part, this could be attributed to an increase of human activities, population density and illegal logging. Fragmentation of forest patches is of greater concern because it creates a natural imbalance in shape, size and distribution [65] and although it influences the dynamics of species and material in the landscape [20]. Moreover, the negative changes in forest cover provide some evidence of disturbance of ecological sustainability of the natural resources. Ecologists have found that small remnant areas cannot succeed in preserving species diversity [66].
A brief summary, changes in LULC classes were related to modification of spatial patterns, as confirmed by class level metrics. As a whole, class level metrics revealed absence of fragmentation for all classes excluding bare surface between 1998 and 2015 in the lower part of the park. This indicates a reduction in human activities such as agricultural activities and could be the result of previously isolated patches becoming connected.
Concerning the upper part, however, class level metrics indicated the presence of smaller and more isolated patches resulting from ongoing fragmentation. Many studies indicate that the increase in the number of patches are related to the reduction of the LPI [14,67,68]. Thus, the class level metrics analysis indicated that the increase in the number of patches was related to the reduction of the largest patch index (LPI) only for pasture and forest patches but, not for bare surface and cultivated area.
4.2. Drivers and Consequences of Changes on the Landscape
Generally speaking, more changes in landscape patterns and composition were observed and the landscape became more fragmented in the lower part of the park as a result of rapid increase in socio-economic growth between 1998 and 2015. Thus, the Fall of Baghdad shaped and changed the land in the HSCZ. Moreover, the increase in landscape fragmentation is tightly related to the increase in the human population therefore, rural population density would be one of the major factors related to the landscape change and fragmentation in the lower part of the park. Moreover, indirect or underlying causes were identified as social, economic, political and demographic factors, which promoted the economic growth. On the other hand, direct changes were recognized as agriculture and forestry changes.
Before 2003 the agricultural intensification caused landscape degradation, while after 2003 the new political conditions and economic development have led to substantial improvement in the natural environment at least in the upper part of the park. To conclude, HSCZ reflects major geopolitical events after the Fall of Baghdad.
The results indicate that the cultivated area increased during the United Nation sanctions (1998), when all food imports were banned and then decreased with the lifting of the sanctions in 2003 when food imports were resumed. Furthermore, LULC classes are associated with isolated patches in the lower part of the park. All classes were declined except pastureland from 1998 to 2015. Moreover, MPS variables were also declined for bare surface and forest-patches but increased for pasture and cultivated-patches. Concerning the upper part, Euclidian Nearest Neighborhood Distance variables indicated that they’re less isolated patches for pasture and forest in 2015, while there is an increase in distance for bare surface and cultivated-lands. However, MPS variables for all LULC classes in the upper part were increased except pastureland in 2015. On the other hand, The villages are influenced seriously by the agricultural economy and economic development for the period of last seventeen years in HSCZ [69,70]. The registered population (Table 1) of the villages were 12,008 people in 2010 and 13,746 in 2015 according to census data from Kurdistan Regional Statistics Office KRSO [54].
4.3. Random Forest Classification
One of the objectives of this study was to compare the performance of MLC and RF to map land cover. The comparison of MLC and RF classifications of Landsat imagery indicate that the RF statistically produced better classification results than MLC. The random forest algorithm could map LULC better compared to MLC algorithm. Adding a number of layers in the RF algorithm tends to increase the accuracy of the classification, such that the RF classifier provided relatively high accuracies of up to 98% for the upper part in 1998 and 2015, and up to 99% in the lower part for two time periods. The RF was a reliable classifier algorithm for the current study and confirmed by obtaining the high overall accuracy of the classification maps.
Furthermore, because the identification of the best measures of fragmentation and habitat loss is impossible [55], we conclude that the process of selecting the most appropriate landscape metrics is critical and several criteria challenges the selecting of landscape metrics such as; (1) the selectivity of metrics must meet the specific objective and question of the main subject of the research; (2) the indicators should be relatively independent or orthogonal of one another; (3) they must be spatio-temporarily sensitive to landscape change; and (4) metrics performance must be known. These aforementioned criteria follow the earlier findings [56,57,58].
5. Conclusions
The obtained results of accuracy assessment indicate the success of random forest classification in land cover mapping from Landsat images in the current study and bridges landscape ecology and remote sensing to understand the effects of the socio-economic-political factors in the park.
The metrics successfully depicted the changes in the landscape and were considered useful tools for preserving and sustaining landscape diversity. Furthermore, metrics provide numerical data on the landscape and with their calculating, human impacts can be detected on the landscapes over time. Therefore, Halgurd-Sakran National Park core zone was an appropriate area for challenging these landscape metrics for discovering landscape changes. Hence, the landscape structure was quantified, analyzed and mapped to; describe changes between two different times, compare different landscapes, and to connect the landscape pattern to the ecological processes. Of all the metrics computed, NP, MPS, ENN_AM, and COHESION were found to be most suitable for carrying out the landscape change analysis as these metrics describe both the composition and the configuration of landscape.
Halgurd-Sakran National Park core zone has experienced significant geopolitical change related to the Fall of Baghdad in April 2003. Moreover, most of the drivers influencing the LULC change of the park are influenced by political, societal and economic factors. Thus, economic and politic are the main influencing forces in HSCZ. Since this study provides the first preliminary understanding into the concern of driving force impacts in HSCZ, we diagnose the need for future research in order to make available more precise and better-informed and more sustainable landscape decisions.
To conclude, monitoring and comparison of the natural resources in the upper and lower parts of the Halgurd-Sakran National Park core zone is necessary, which provides park managers, designers, planners and other partners, and the public with scientifically dependable data and information on the current state of the environmental selected park resources.
Acknowledgments
Financial support for this research was provided by Soran University. This work forms a part of a study and is supported by the Scientific Research Centre (SRC), Soran University and the Centre for Landscape and Climate Research (CLCR), University of Leicester, Department of Geography, University of Leicester. H. Balzter was supported by the Royal Society Wolfson Research Merit Award, 2011/R3 and the NERC National Centre for Earth Observation in the UK. We would like to thank editors of Remote Sensing journal and the two anonymous reviewers for their comments and suggestions on the manuscript.
Author Contributions
All authors contributed to the conception of the study. R.H. collected the input data, carried out, conceived, and designed the methodology, analyzed the data, and wrote the paper. H.B. and K.K. supervised the research and contributed to the manuscript.
Conflicts of Interest
The authors declare no conflict of interest.
References
- Rahman, A.; Kumar, S.; Fazal, S.; Siddiqui, M.A. Assessment of land use/land cover change in the North-West District of Delhi using remote sensing and GIS techniques. J. Indian Soc. Remote Sens. 2012, 40, 689–697. [Google Scholar] [CrossRef]
- Natya, S.; Rehna, V. Land Cover Classification Schemes Using Remote Sensing Images: A Recent Survey. Br. J. Appl. Sci. Technol. 2016, 13, 1–11. [Google Scholar] [CrossRef]
- Usman, M.; Liedl, R.; Shahid, M.A.; Abbas, A. Land use/land cover classification and its change detection using multi-temporal MODIS NDVI data. J. Geogr. Sci. 2015, 25, 1479–1506. [Google Scholar] [CrossRef]
- Aspinall, R.J.; Hill, M.J. Land Use Change: Science, Policy and Management; CRC Press: Boca Raton, FL, USA, 2007. [Google Scholar]
- Van Dyke, F. The conservation of habitat and landscape. In Conservation Biology: Foundations, Concepts, Applications; Springer: Dordrecht, The Netherlands, 2008; pp. 279–311. [Google Scholar]
- Didham, R.K. Ecological consequences of habitat fragmentation. In eLS; John Wiley & Sons, Ltd.: Hoboken, NJ, USA, 2010. [Google Scholar]
- McGarigal, K.; Marks, B.J. Fragstats: Spatial Pattern Analysis Program for Quantifying Landscape Structure; General Technical Report PNW-GTR-351; U.S. Department of Agriculture, Forest Service, Pacific Northwest Research Station: Portland, OR, USA, 1995.
- Tizora, P.; Le Roux, A.; Mans, G.; Cooper, A. Land Use and Land Cover Change in the Western Cape Province: Quantification of Changes & Understanding of Driving Factors. 2016. Available online: http://hdl.handle.net/10204/8995 (accessed on 1st February).
- Krkoška Lorencová, E.; Harmáčková, Z.V.; Landová, L.; Pártl, A.; Vačkář, D. Assessing impact of land use and climate change on regulating ecosystem services in the Czech Republic. Ecosyst. Health Sustain. 2016, 2, e01210. [Google Scholar] [CrossRef]
- Berakhi, R.O. Implication of Human Activities on Land Use Land Cover Dynamics in Kagera Catchment, East Africa. Master’s Degree, Southern Illinois University Carbondale, Carbondale, IL, USA, December 2013. [Google Scholar]
- Gibson, G.R. War and Agriculture: Three Decades of Agricultural Land Use and Land Cover Change in Iraq. Doctoral Dissertation, University Libraries, Virginia Polytechnic Institute and State University, Blacksburg, VA, USA, 9 May 2012. [Google Scholar]
- Vogt, P. Quantifying landscape fragmentation. Simp. Brasil. Sensoriamento Remoto 2015, 17, 1239–1246. [Google Scholar]
- Midha, N.; Mathur, P. Assessment of forest fragmentation in the conservation priority Dudhwa landscape, India using FRAGSTATS computed class level metrics. J. Indian Soc. Remote Sens. 2010, 38, 487–500. [Google Scholar] [CrossRef]
- Vorovencii, I. Quantifying landscape pattern and assessing the land cover changes in Piatra Craiului National Park and Bucegi Natural Park, Romania, using satellite imagery and landscape metrics. Environ. Monit. Assess. 2015, 187, 692. [Google Scholar] [CrossRef] [PubMed]
- Girvetz, E.H.; Thorne, J.H.; Berry, A.M.; Jaeger, J.A. Integration of landscape fragmentation analysis into regional planning: A statewide multi-scale case study from California, USA. Landsc. Urban Plan. 2008, 86, 205–218. [Google Scholar] [CrossRef]
- Coppedge, B.R.; Engle, D.M.; Masters, R.E.; Gregory, M.S. Avian response to landscape change in fragmented southern Great Plains grasslands. Ecol. Appl. 2001, 11, 47–59. [Google Scholar] [CrossRef]
- Vannette, R.L.; Leopold, D.R.; Fukami, T. Forest area and connectivity influence root-associated fungal communities in a fragmented landscape. Ecology 2016, 97, 2374–2383. [Google Scholar] [CrossRef] [PubMed]
- Auffret, A.G.; Plue, J.; Cousins, S.A. The spatial and temporal components of functional connectivity in fragmented landscapes. Ambio 2015, 44, 51–59. [Google Scholar] [CrossRef] [PubMed]
- Mühlner, S.; Kormann, U.; Schmidt-Entling, M.; Herzog, F.; Bailey, D. Structural versus functional habitat connectivity measures to explain bird diversity in fragmented orchards. J. Landsc. Ecol. 2010, 3, 52–64. [Google Scholar] [CrossRef]
- Forman, R.T. Land Mosaics: The Ecology of Landscapes and Regions (1995); Cambridge University Press: Cambridge, UK, 1995. [Google Scholar]
- Lovett, G.M.; Jones, C.G.; Turner, M.G.; Weathers, K.C. Conceptual Frameworks: Plan for a Half-Built House. In Ecosystem Function in Heterogeneous Landscapes; Springer: New York, NY, USA, 2005; pp. 463–470. [Google Scholar]
- Southworth, J.; Nagendra, H.; Tucker, C. Fragmentation of a landscape: Incorporating landscape metrics into satellite analyses of land-cover change. Landsc. Res. 2002, 27, 253–269. [Google Scholar] [CrossRef]
- Parsa, V.A.; Yavari, A.; Nejadi, A. Spatio-temporal analysis of land use/land cover pattern changes in Arasbaran Biosphere Reserve: Iran. Model. Earth Syst. Environ. 2016, 2, 178. [Google Scholar] [CrossRef]
- Linh, N.; Erasmi, S.; Kappas, M. Quantifying land use/cover change and landscape fragmentation in Danang City, Vietnam: 1979–2009. Int. Arch. Photogramm. Remote Sens. Spat. Inf. Sci. 2012, 39-B8, 501–506. [Google Scholar] [CrossRef]
- Lu, D.; Hetrick, S.; Moran, E. Impervious surface mapping with Quickbird imagery. Int. J. Remote Sens. 2011, 32, 2519–2533. [Google Scholar] [CrossRef] [PubMed]
- Foody, G.M. Status of land cover classification accuracy assessment. Remote Sens. Environ. 2002, 80, 185–201. [Google Scholar] [CrossRef]
- Lillesand, T.; Kiefer, R.W.; Chipman, J. Remote Sensing and Image Interpretation; John Wiley & Sons: Hoboken, NJ, USA, 2014. [Google Scholar]
- Li, M.; Zang, S.; Zhang, B.; Li, S.; Wu, C. A review of remote sensing image classification techniques: The role of spatio-contextual information. Eur. J. Remote Sens. 2014, 47, 389–411. [Google Scholar] [CrossRef]
- Syed, S.; Dare, P.; Jones, S. Automatic classification of land cover features with high resolution imagery and lidar data: An object-oriented approach. In Proceedings of the National Biennial Conference of the Spatial Sciences Institute, Melbourne, Australia, 12–16 September 2005. [Google Scholar]
- Burai, P.; Deák, B.; Valkó, O.; Tomor, T. Classification of herbaceous vegetation using airborne hyperspectral imagery. Remote Sens. 2015, 7, 2046–2066. [Google Scholar] [CrossRef]
- Qian, J.; Zhou, Q.; Hou, Q. Comparison of pixel-based and object-oriented classification methods for extracting built-up areas in arid zone. In Proceedings of the ISPRS Workshop on Updating Geo-spatial Databases with Imagery & The 5th ISPRS Workshop on Dynamic and Multi-dimensional GIS, Urumchi, China, 28–29 August 2007; pp. 163–171. [Google Scholar]
- Horning, N. Random Forests: An algorithm for image classification and generation of continuous fields data sets. In Proceedings of the International Conference on Geoinformatics for Spatial Infrastructure Development in Earth and Allied Sciences, Hanoi, Vietnam, 9–11 December 2010. [Google Scholar]
- Breiman, L. Random forests. Mach. Learn. 2001, 45, 5–32. [Google Scholar] [CrossRef]
- Liaw, A.; Wiener, M. Classification and regression by randomForest. R News 2002, 2, 18–22. [Google Scholar]
- Balzter, H.; Cole, B.; Thiel, C.; Schmullius, C. Mapping CORINE land cover from Sentinel-1A SAR and SRTM digital elevation model data using Random Forests. Remote Sens. 2015, 7, 14876–14898. [Google Scholar] [CrossRef]
- Hamad, R.; Balzter, H.; Kolo, K. Multi-Criteria Assessment of Land Cover Dynamic Changes in Halgurd Sakran National Park (HSNP), Kurdistan Region of Iraq, Using Remote Sensing and GIS. Land 2017, 6, 18. [Google Scholar] [CrossRef]
- Williams, K.J.; Schirmer, J. Understanding the relationship between social change and its impacts: The experience of rural land use change in south-eastern Australia. J. Rural Stud. 2012, 28, 538–548. [Google Scholar] [CrossRef]
- Schirmer, J. Socio-Economic Impacts of Land Use Change to Plantation Forestry: A Review of Current Knowledge and Case Studies of Australian Experience. In Proceedings of the 2006 IUFRO Forest Plantations Meeting, Charleston, SC, USA, 10–13 October 2006. [Google Scholar]
- Long, H.; Tang, G.; Li, X.; Heilig, G.K. Socio-economic driving forces of land-use change in Kunshan, the Yangtze River Delta economic area of China. J. Environ. Manag. 2007, 83, 351–364. [Google Scholar] [CrossRef] [PubMed]
- Figueiredo, J.; Pereira, H.M. Regime shifts in a socio-ecological model of farmland abandonment. Landsc. Ecol. 2011, 26, 737–749. [Google Scholar] [CrossRef]
- Brown, D.; Polsky, C.; Bolstad, P.V.; Brody, S.D.; Hulse, D.; Kroh, R.; Loveland, T.; Thomson, A.M. Land Use and Land Cover Change; Pacific Northwest National Laboratory (PNNL): Richland, WA, USA, 2014. [Google Scholar]
- Saleh, S.A. Temporal Change Detection of AL-Hammar Marsh—IRAQ Using Remote Sensing Techniques. Glob. J. Hum. Soc. Sci. Res. 2012, 12, 7–14. [Google Scholar]
- Nagendra, H.; Lucas, R.; Honrado, J.P.; Jongman, R.H.; Tarantino, C.; Adamo, M.; Mairota, P. Remote sensing for conservation monitoring: Assessing protected areas, habitat extent, habitat condition, species diversity, and threats. Ecol. Indic. 2013, 33, 45–59. [Google Scholar] [CrossRef]
- Stoms, D.M.; Estes, J. A remote sensing research agenda for mapping and monitoring biodiversity. Int. J. Remote Sens. 1993, 14, 1839–1860. [Google Scholar] [CrossRef]
- Dewan, A.M.; Yamaguchi, Y. Land use and land cover change in Greater Dhaka, Bangladesh: Using remote sensing to promote sustainable urbanization. Appl. Geogr. 2009, 29, 390–401. [Google Scholar] [CrossRef]
- El-Kawy, O.A.; Rød, J.; Ismail, H.; Suliman, A. Land use and land cover change detection in the western Nile delta of Egypt using remote sensing data. Appl. Geogr. 2011, 31, 483–494. [Google Scholar] [CrossRef]
- Prakasam, C. Land use and land cover change detection through remote sensing approach: A case study of Kodaikanal taluk, Tamil nadu. Int. J. Geomat. Geosci. 2010, 1, 150. [Google Scholar]
- Leh, M.; Bajwa, S.; Chaubey, I. Impact of land use change on erosion risk: An integrated remote sensing, geographic information system and modeling methodology. Land Degrad. Dev. 2013, 24, 409–421. [Google Scholar] [CrossRef]
- Chuvieco, E.; Congalton, R.G. Application of remote sensing and geographic information systems to forest fire hazard mapping. Remote Sens. Environ. 1989, 29, 147–159. [Google Scholar] [CrossRef]
- Boyd, D.; Danson, F. Satellite remote sensing of forest resources: Three decades of research development. Prog. Phys. Geogr. 2005, 29, 1–26. [Google Scholar] [CrossRef]
- Kayiranga, A.; Kurban, A.; Ndayisaba, F.; Nahayo, L.; Karamage, F.; Ablekim, A.; Li, H.; Ilniyaz, O. Monitoring forest cover change and fragmentation using remote sensing and landscape metrics in Nyungwe-Kibira park. J. Geosci. Environ. Prot. 2016, 4, 13. [Google Scholar] [CrossRef]
- Robinson, L. Masters of Chaos: The Secret History of the Special Forces; PublicAffairs: New York, NY, USA, 2005. [Google Scholar]
- Eklund, L.; Persson, A.; Pilesjö, P. Cropland changes in times of conflict, reconstruction, and economic development in Iraqi Kurdistan. Ambio 2016, 45, 78–88. [Google Scholar] [CrossRef] [PubMed]
- KRSO. Ministry of Planning 2016. Kurdistan Regional Statistics Office-KRSO. Available online: http//www.mop.gov.krd (accessed on 25 January 2017).
- Eiumnoh, A.; Shrestha, R.P. Application of DEM data to Landsat image classification: Evaluation in a tropical wet-dry landscape of Thailand. Photogramm. Eng. Remote Sens. 2000, 66, 297–304. [Google Scholar]
- Ok, A.O.; Akar, O.; Gungor, O. Evaluation of random forest method for agricultural crop classification. Eur. J. Remote Sens. 2012, 45, 421–432. [Google Scholar] [CrossRef]
- Thakkar, A.K.; Desai, V.R.; Patel, A.; Potdar, M.B. Post-classification corrections in improving the classification of Land Use/Land Cover of arid region using RS and GIS: The case of Arjuni watershed, Gujarat, India. Egypt. J. Remote Sens. Space Sci. 2017, 20, 79–89. [Google Scholar] [CrossRef]
- Donges, N. SAP Machine Learning Foundation Working Student. Available online: https://towardsdatascience.com/@n.donges (accessed on 25 Feb 2018).
- Guan, H.; Yu, J.; Li, J.; Luo, L. Random forests-based feature selection for land-use classification using lidar data and orthoimagery. Int. Arch. Photogramm. Remote Sens. Spat. Inf. Sci. 2012, 39-B7, 203–208. [Google Scholar] [CrossRef]
- Kulkarni, A.D.; Lowe, B. Random forest algorithm for land cover classification. Pattern Recognit. Lett. 2016, 27, 294–300. [Google Scholar]
- Reynolds, J.; Wesson, K.; Desbiez, A.L.; Ochoa-Quintero, J.M.; Leimgruber, P. Using remote sensing and Random Forest to assess the conservation status of critical Cerrado Habitats in Mato Grosso do Sul, Brazil. Land 2016, 5, 12. [Google Scholar] [CrossRef]
- McGarigal, K.; Cushman, S.A.; Neel, M.C.; Ene, E. FRAGSTATS: Spatial Pattern Analysis Program for Categorical Maps. 2002. Available online: http://www.umass.edu/landeco/research/fragstats/fragstats.html (accessed on 25 January 2018).
- Nkonya, E.; Mirzabaev, A.; Von Braun, J. Economics of Land Degradation and Improvement: A Global Assessment for Sustainable Development; Springer: Cham, Switzerland, 2016. [Google Scholar]
- Speir, R.A. Managing Runoff and Erosion on Croplands and Pastures. 2009. Available online: http://aware.uga.edu/wp-content/2009/07/Erosion-and-Runoff-Update.pdf (accessed on 25 January 2018).
- Munguía-Rosas, M.A.; Montiel, S. Patch size and isolation predict plant species density in a naturally fragmented forest. PLoS ONE 2014, 9, e111742. [Google Scholar] [CrossRef] [PubMed]
- Harrison, S.; Bruna, E. Habitat fragmentation and large-scale conservation: What do we know for sure? Ecography 1999, 22, 225–232. [Google Scholar] [CrossRef]
- Kadioğullari, A.I.; Başkent, E.Z. Spatial and temporal dynamics of land use pattern in Eastern Turkey: A case study in Gümüşhane. Environ. Monit. Assess. 2008, 138, 289–303. [Google Scholar] [CrossRef] [PubMed]
- Kamusoko, C.; Aniya, M. Land use/cover change and landscape fragmentation analysis in the Bindura District, Zimbabwe. Land Degrad. Dev. 2007, 18, 221–233. [Google Scholar] [CrossRef]
- Eklund, L.; Seaquist, J. Meteorological, agricultural and socioeconomic drought in the Duhok Governorate, Iraqi Kurdistan. Nat. Hazards 2015, 76, 421–441. [Google Scholar] [CrossRef]
- Lortz, M.G. Willing to Face Death: A history of Kurdish Military Forces-the Peshmerga-from the Ottoman Empire to Present-Day Iraq. Doctoral Dissertation, Florida State University, Tallahassee, FL, USA, 2005. [Google Scholar]
Figure 1.
Location map of the study area (HSCZ) in the Kurdistan Region of Iraq.
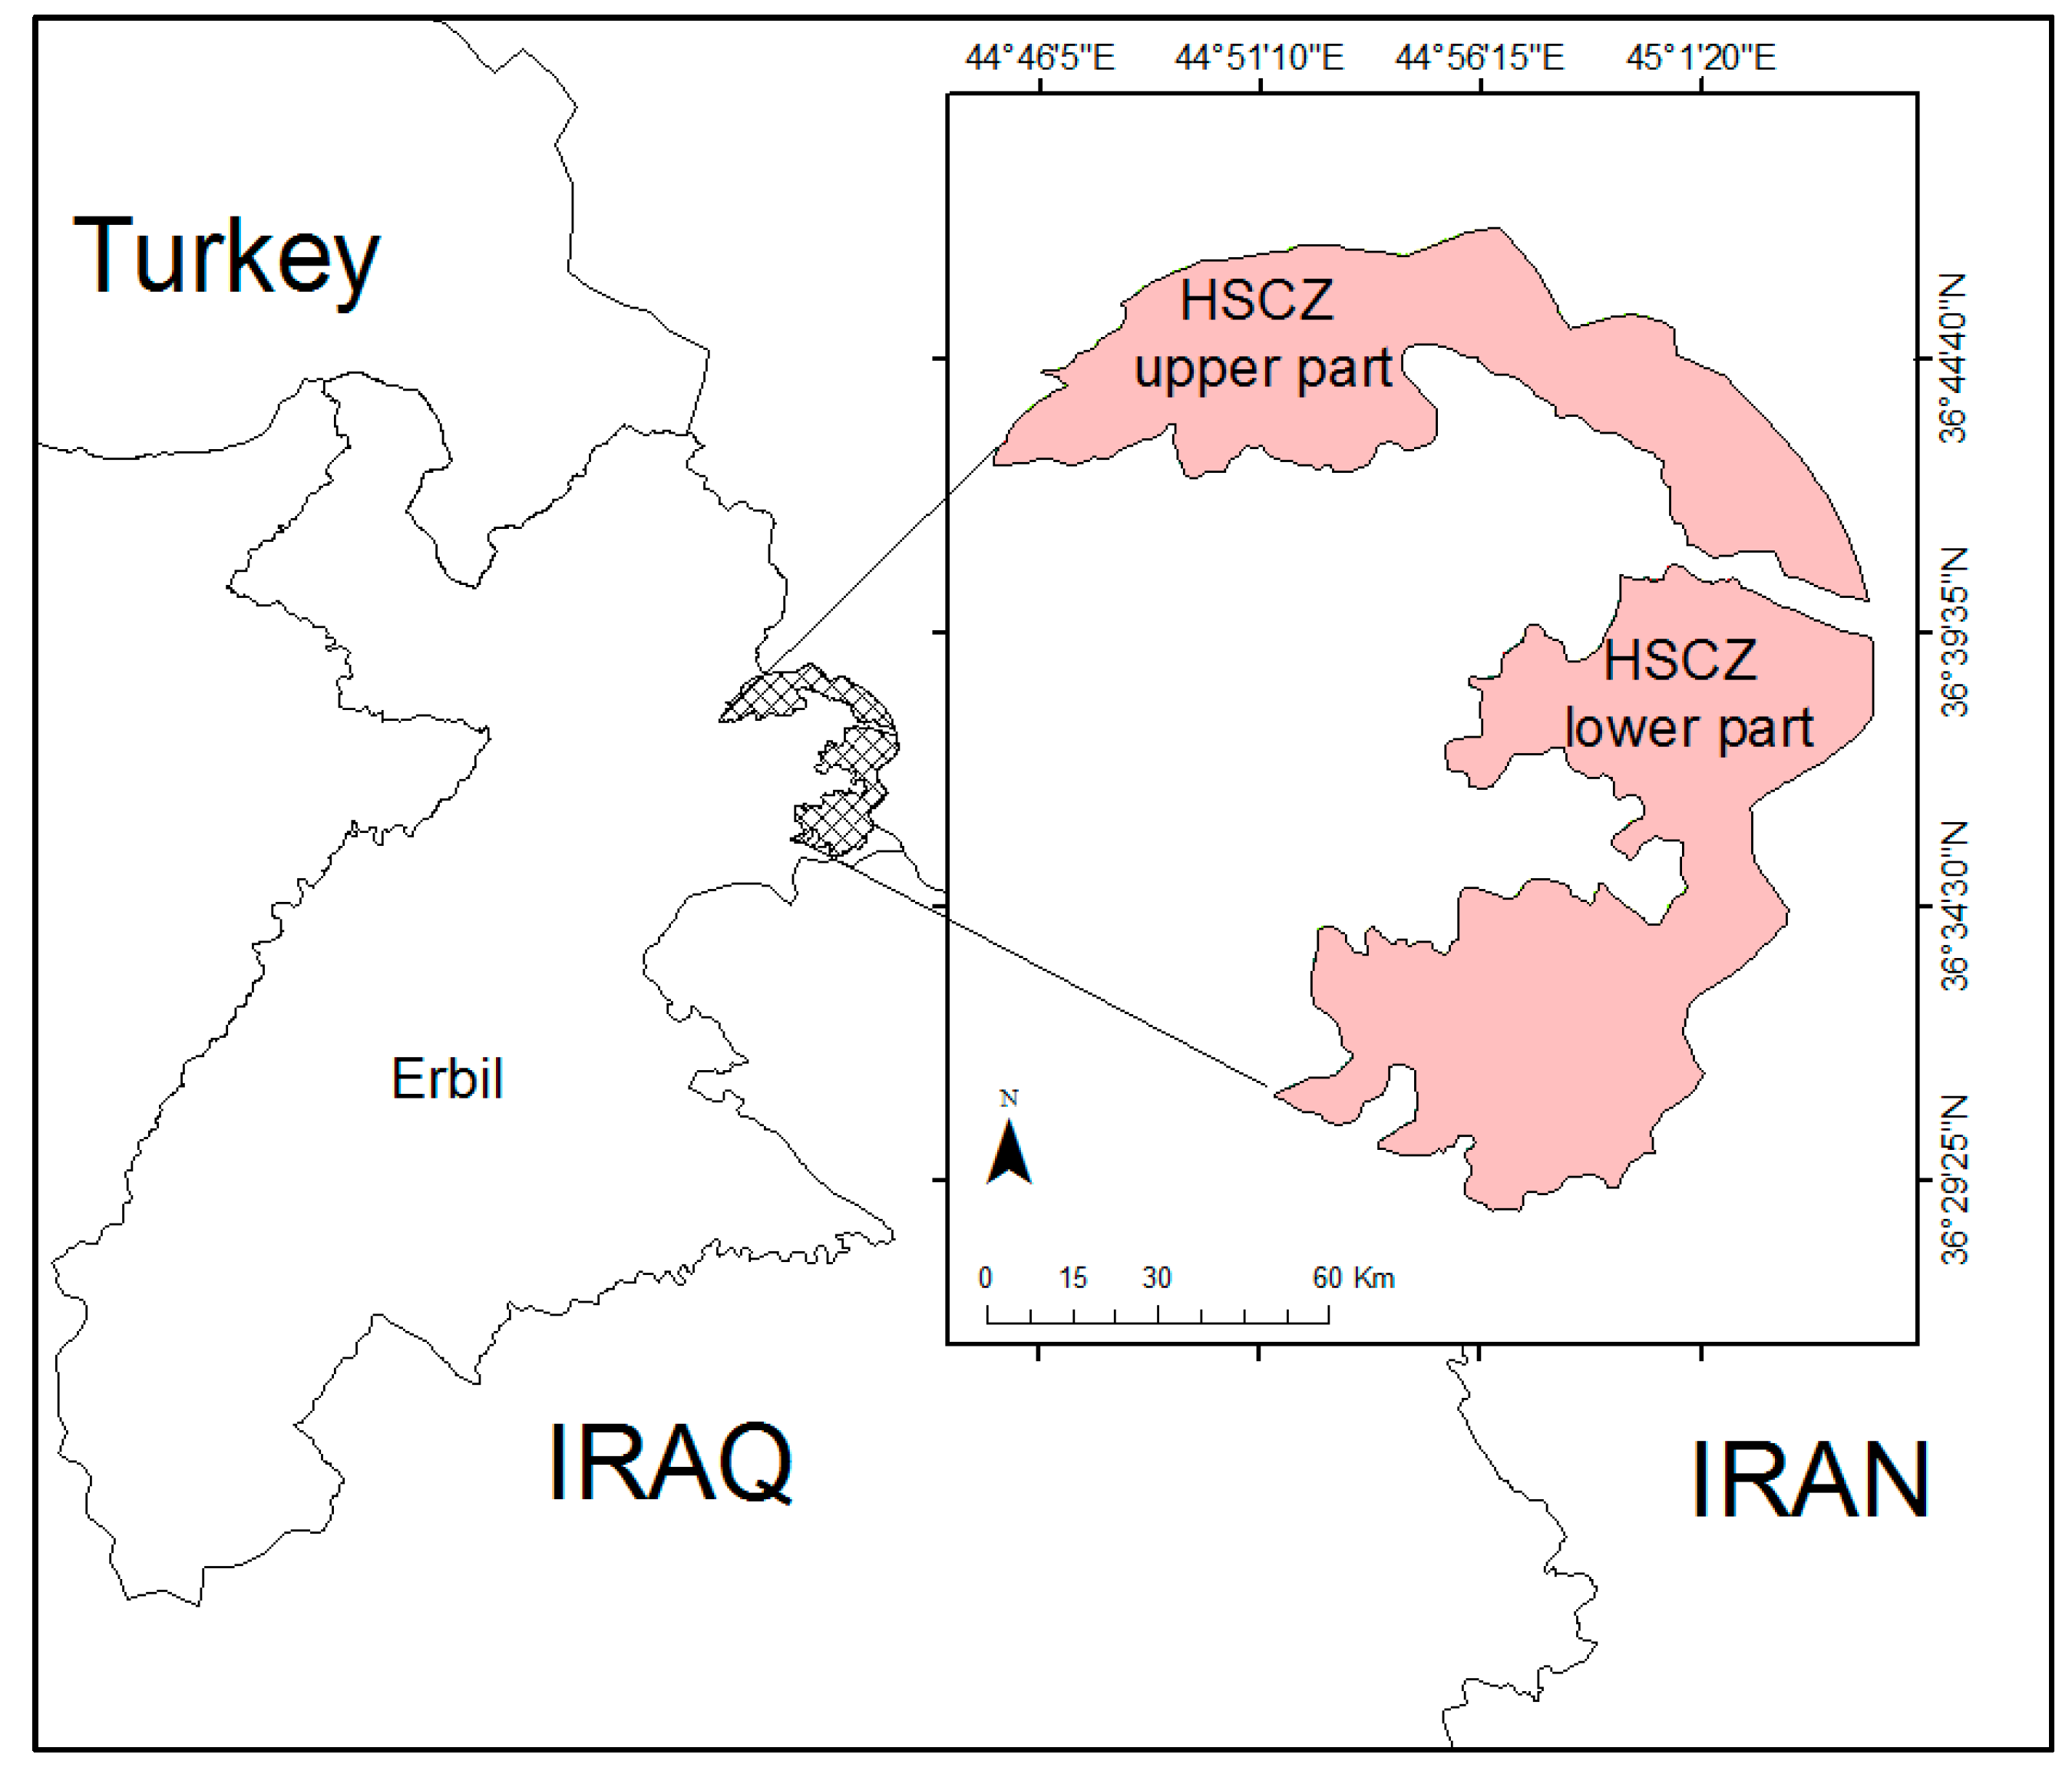
Figure 2.
The classified land use and land cover (LULC) maps for upper and lower parts of HSCZ for years 1998 and 2015 from Random Forest classifier with Landsat data, which compare the changes in two parts over time.
Figure 2.
The classified land use and land cover (LULC) maps for upper and lower parts of HSCZ for years 1998 and 2015 from Random Forest classifier with Landsat data, which compare the changes in two parts over time.
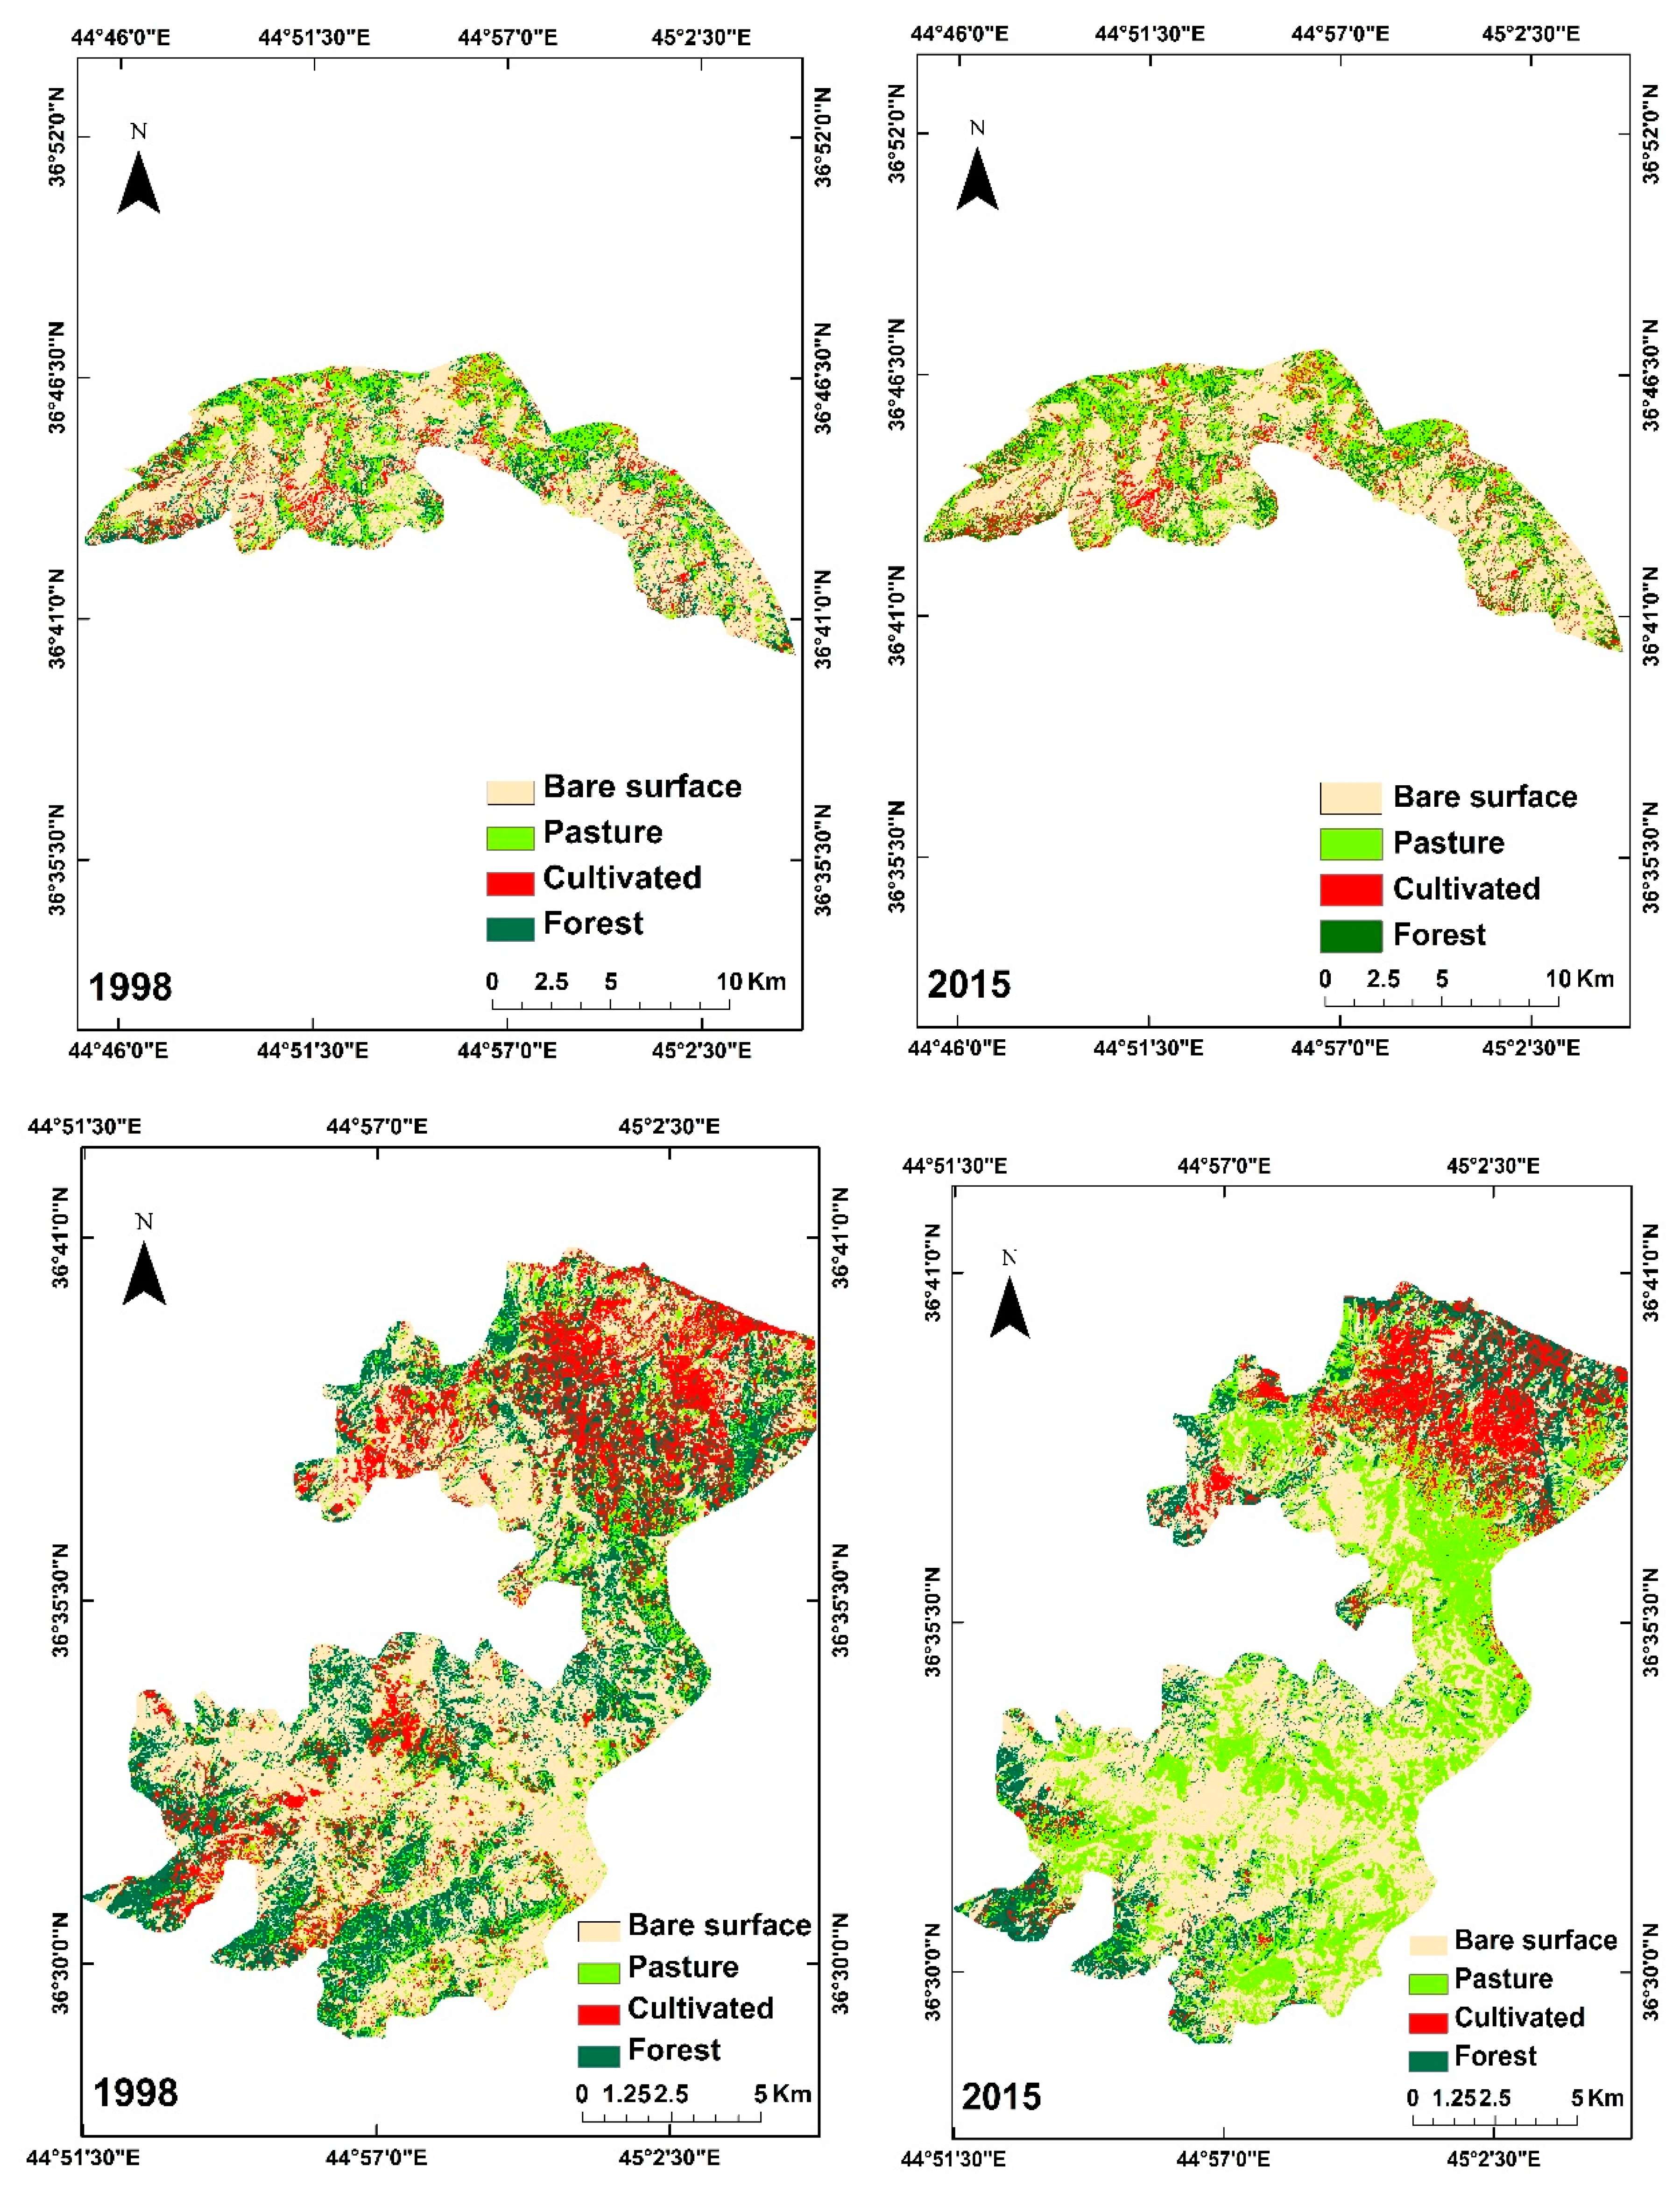
Figure 3.
LULC change by category in two time spans (1998–2015) in the upper and lower parts of HSCZ.
Figure 3.
LULC change by category in two time spans (1998–2015) in the upper and lower parts of HSCZ.
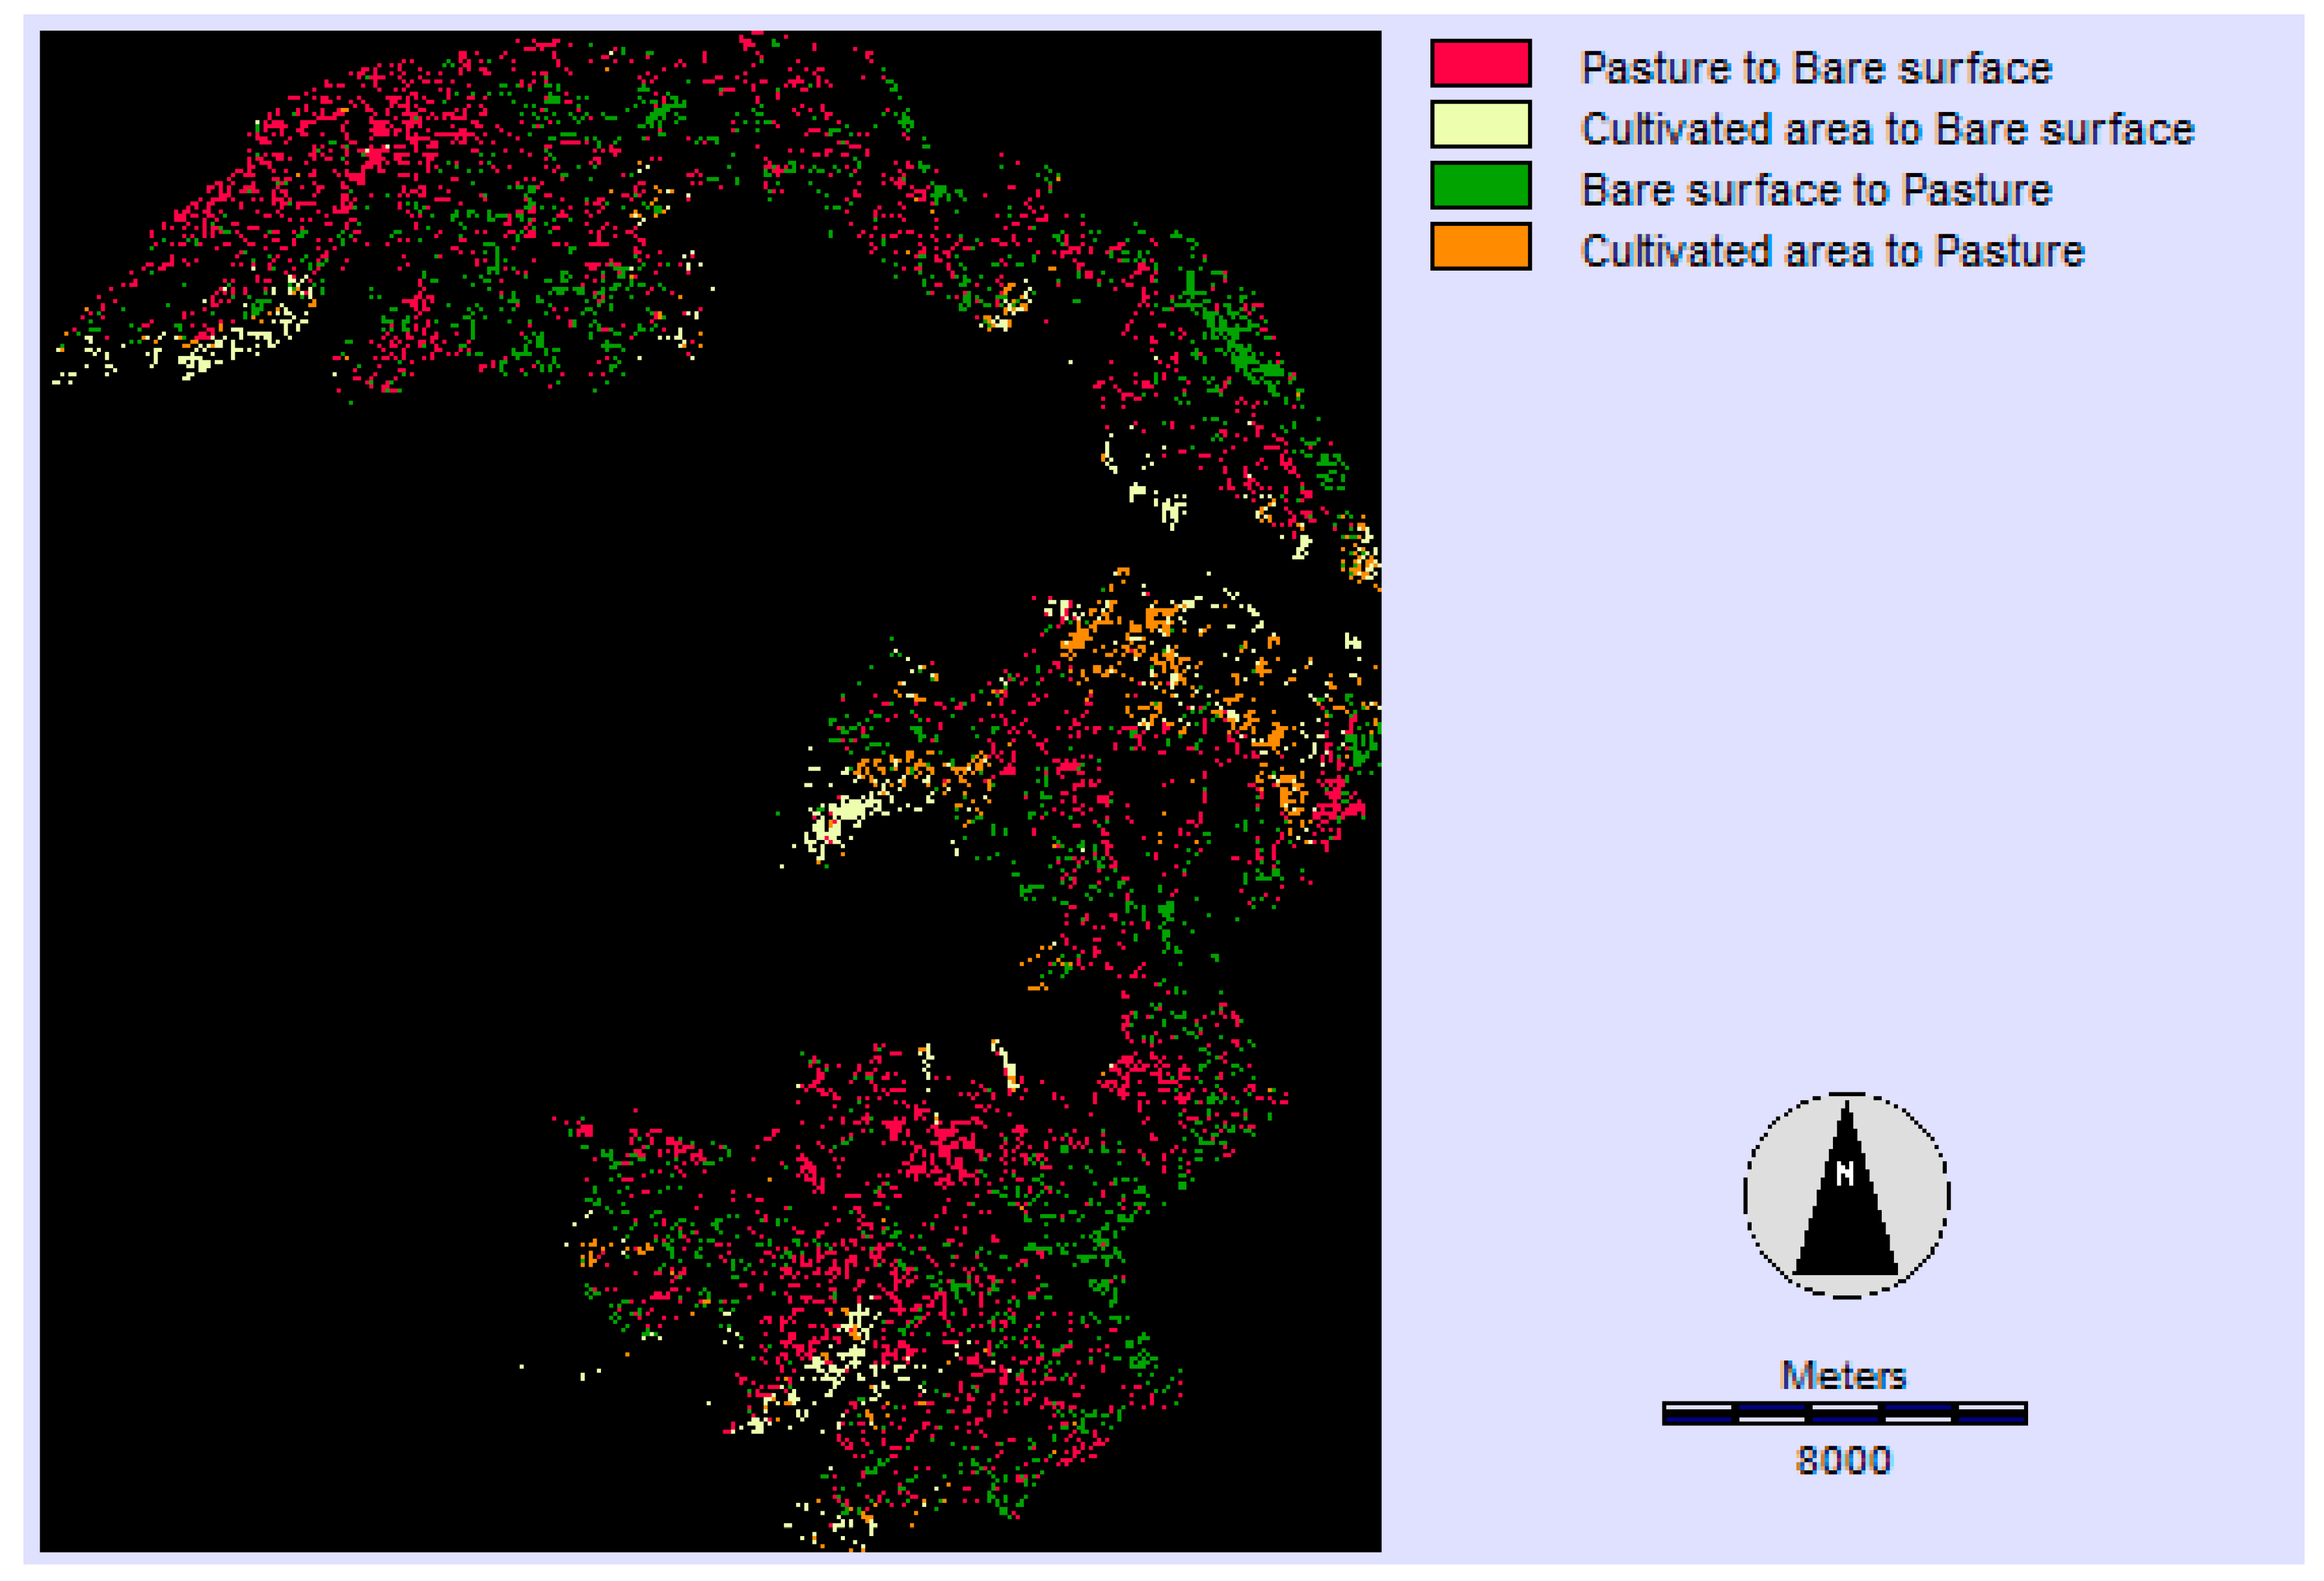
Figure 4.
Gains and losses of patch number (NP), mean patch size (MPS) and largest patch index (LPI) of LULC by category in different time periods (1998–2015) in the upper part of the HSCZ.
Figure 4.
Gains and losses of patch number (NP), mean patch size (MPS) and largest patch index (LPI) of LULC by category in different time periods (1998–2015) in the upper part of the HSCZ.
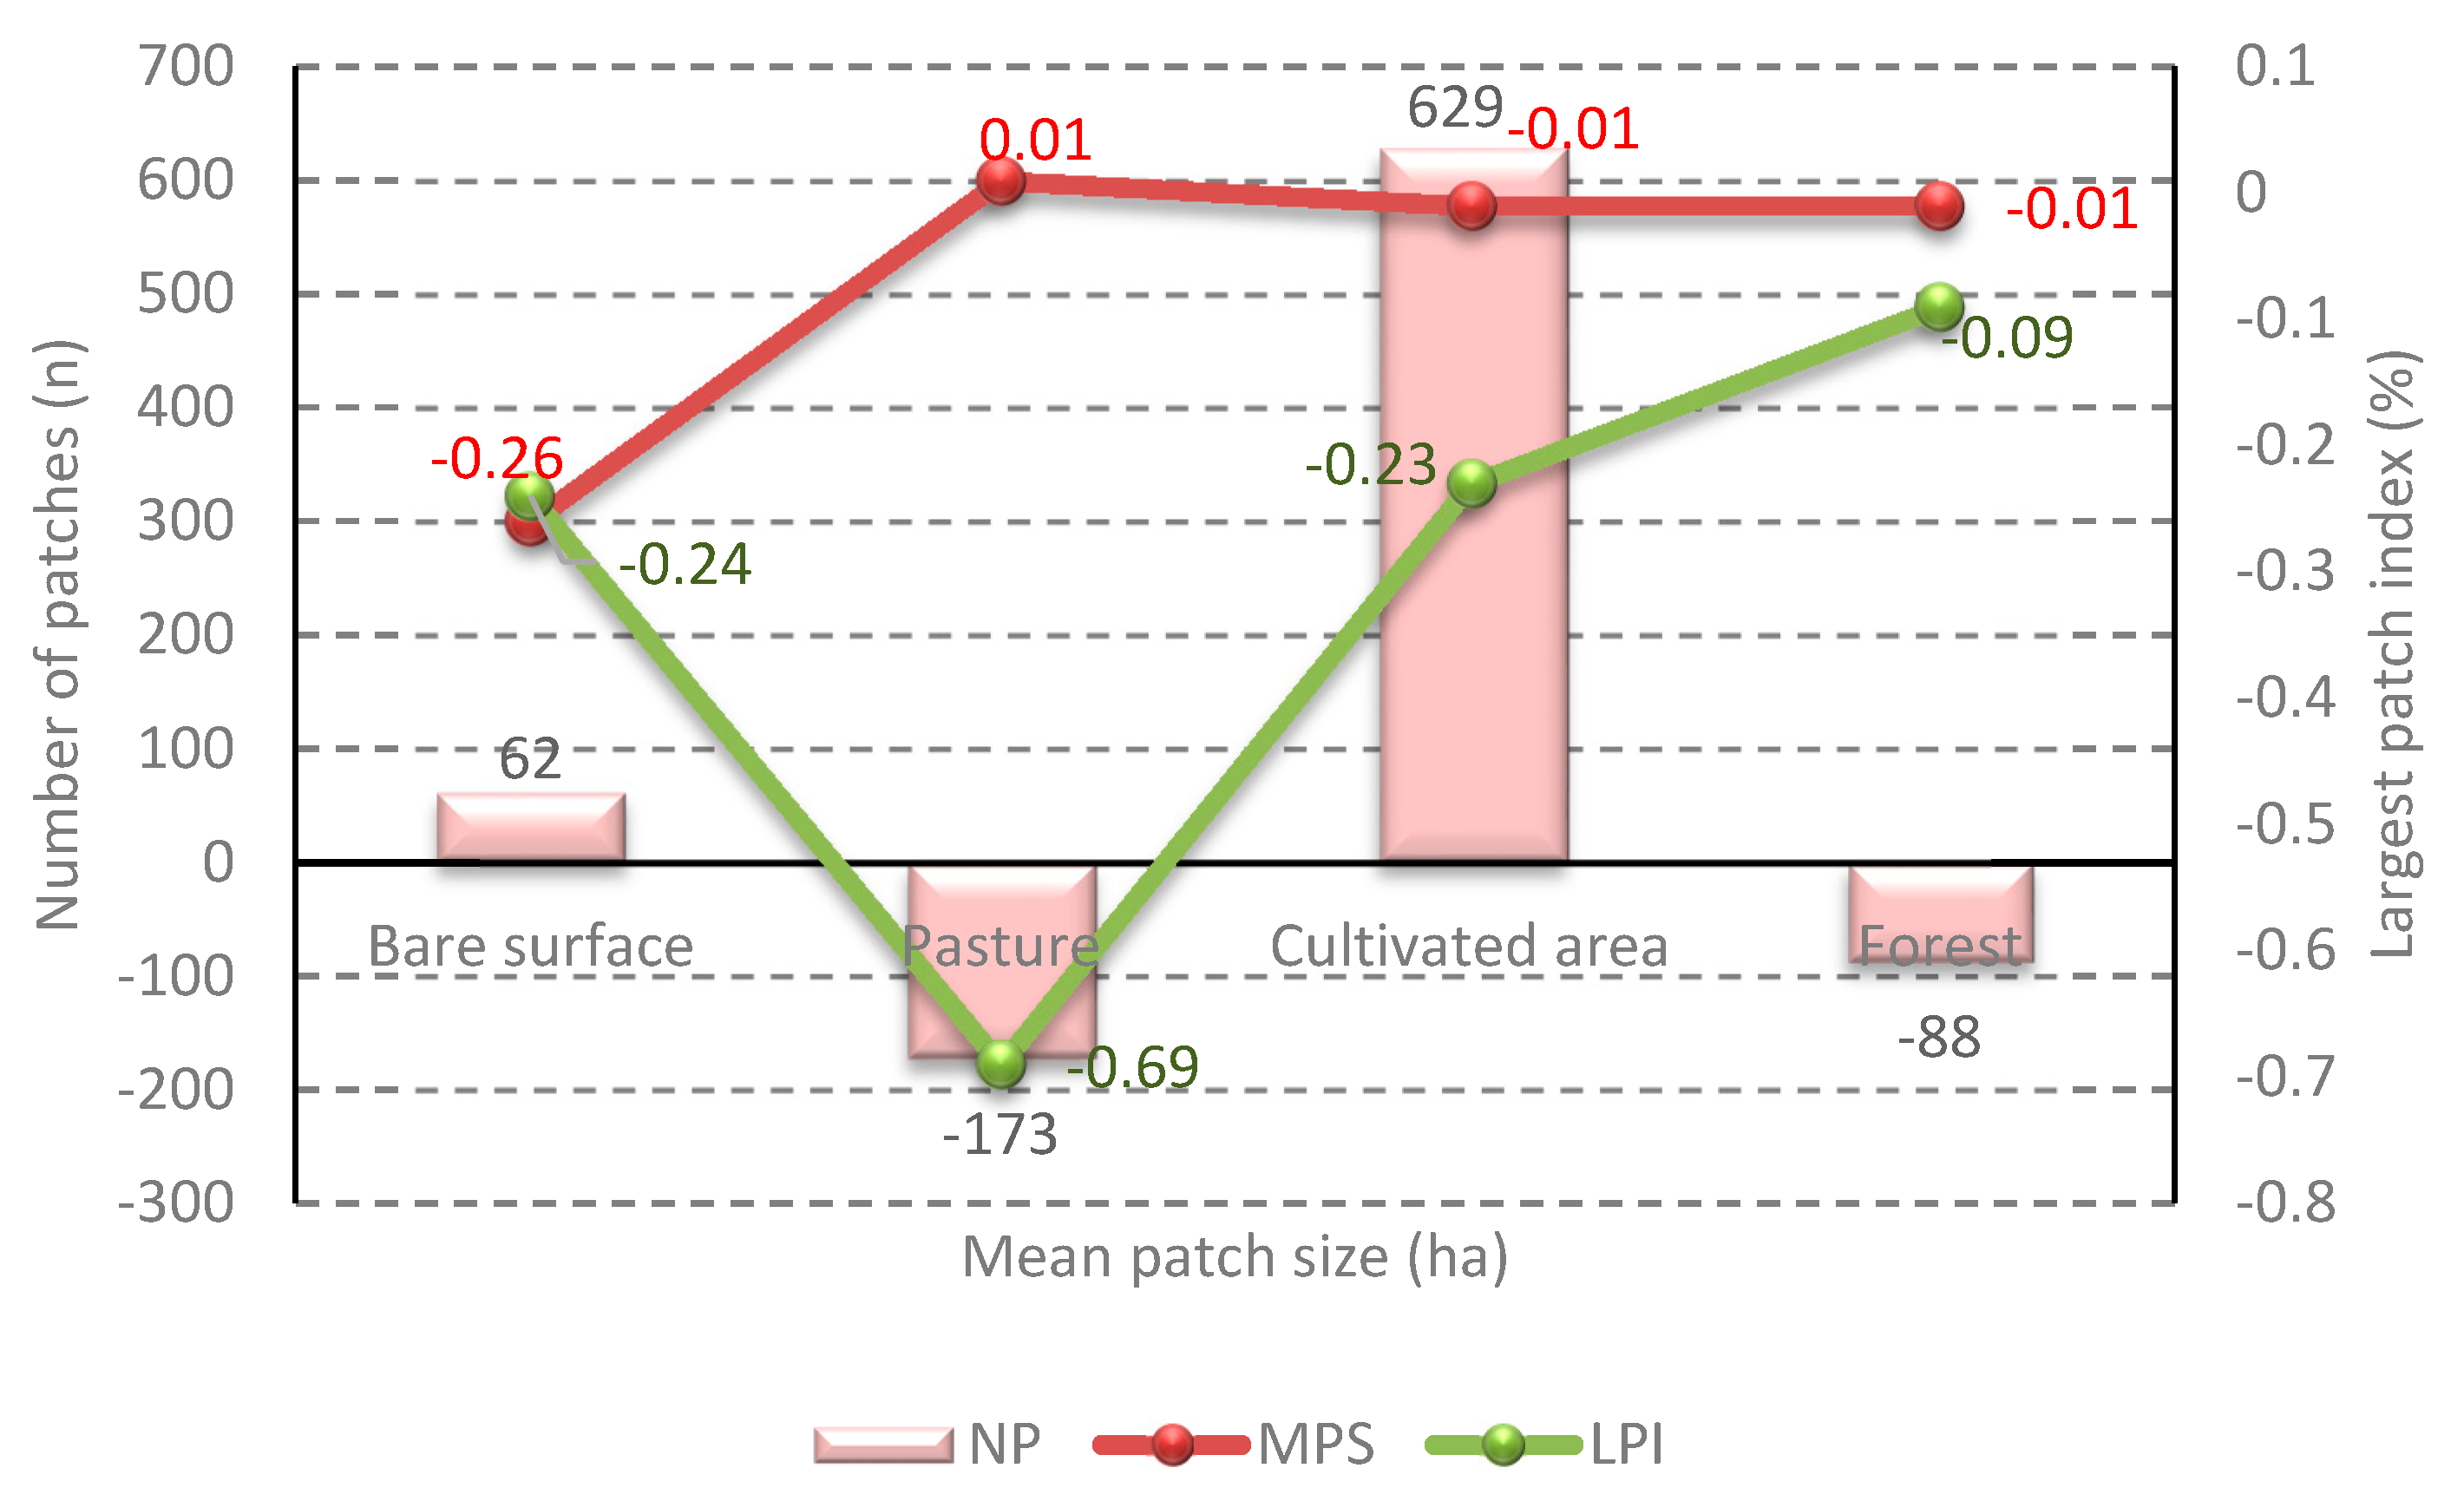
Figure 5.
Gains and losses of ENN_AM, IJI and Cohesion of LULC by category in different time periods (1998–2015) in the upper part of the HSCZ.
Figure 5.
Gains and losses of ENN_AM, IJI and Cohesion of LULC by category in different time periods (1998–2015) in the upper part of the HSCZ.
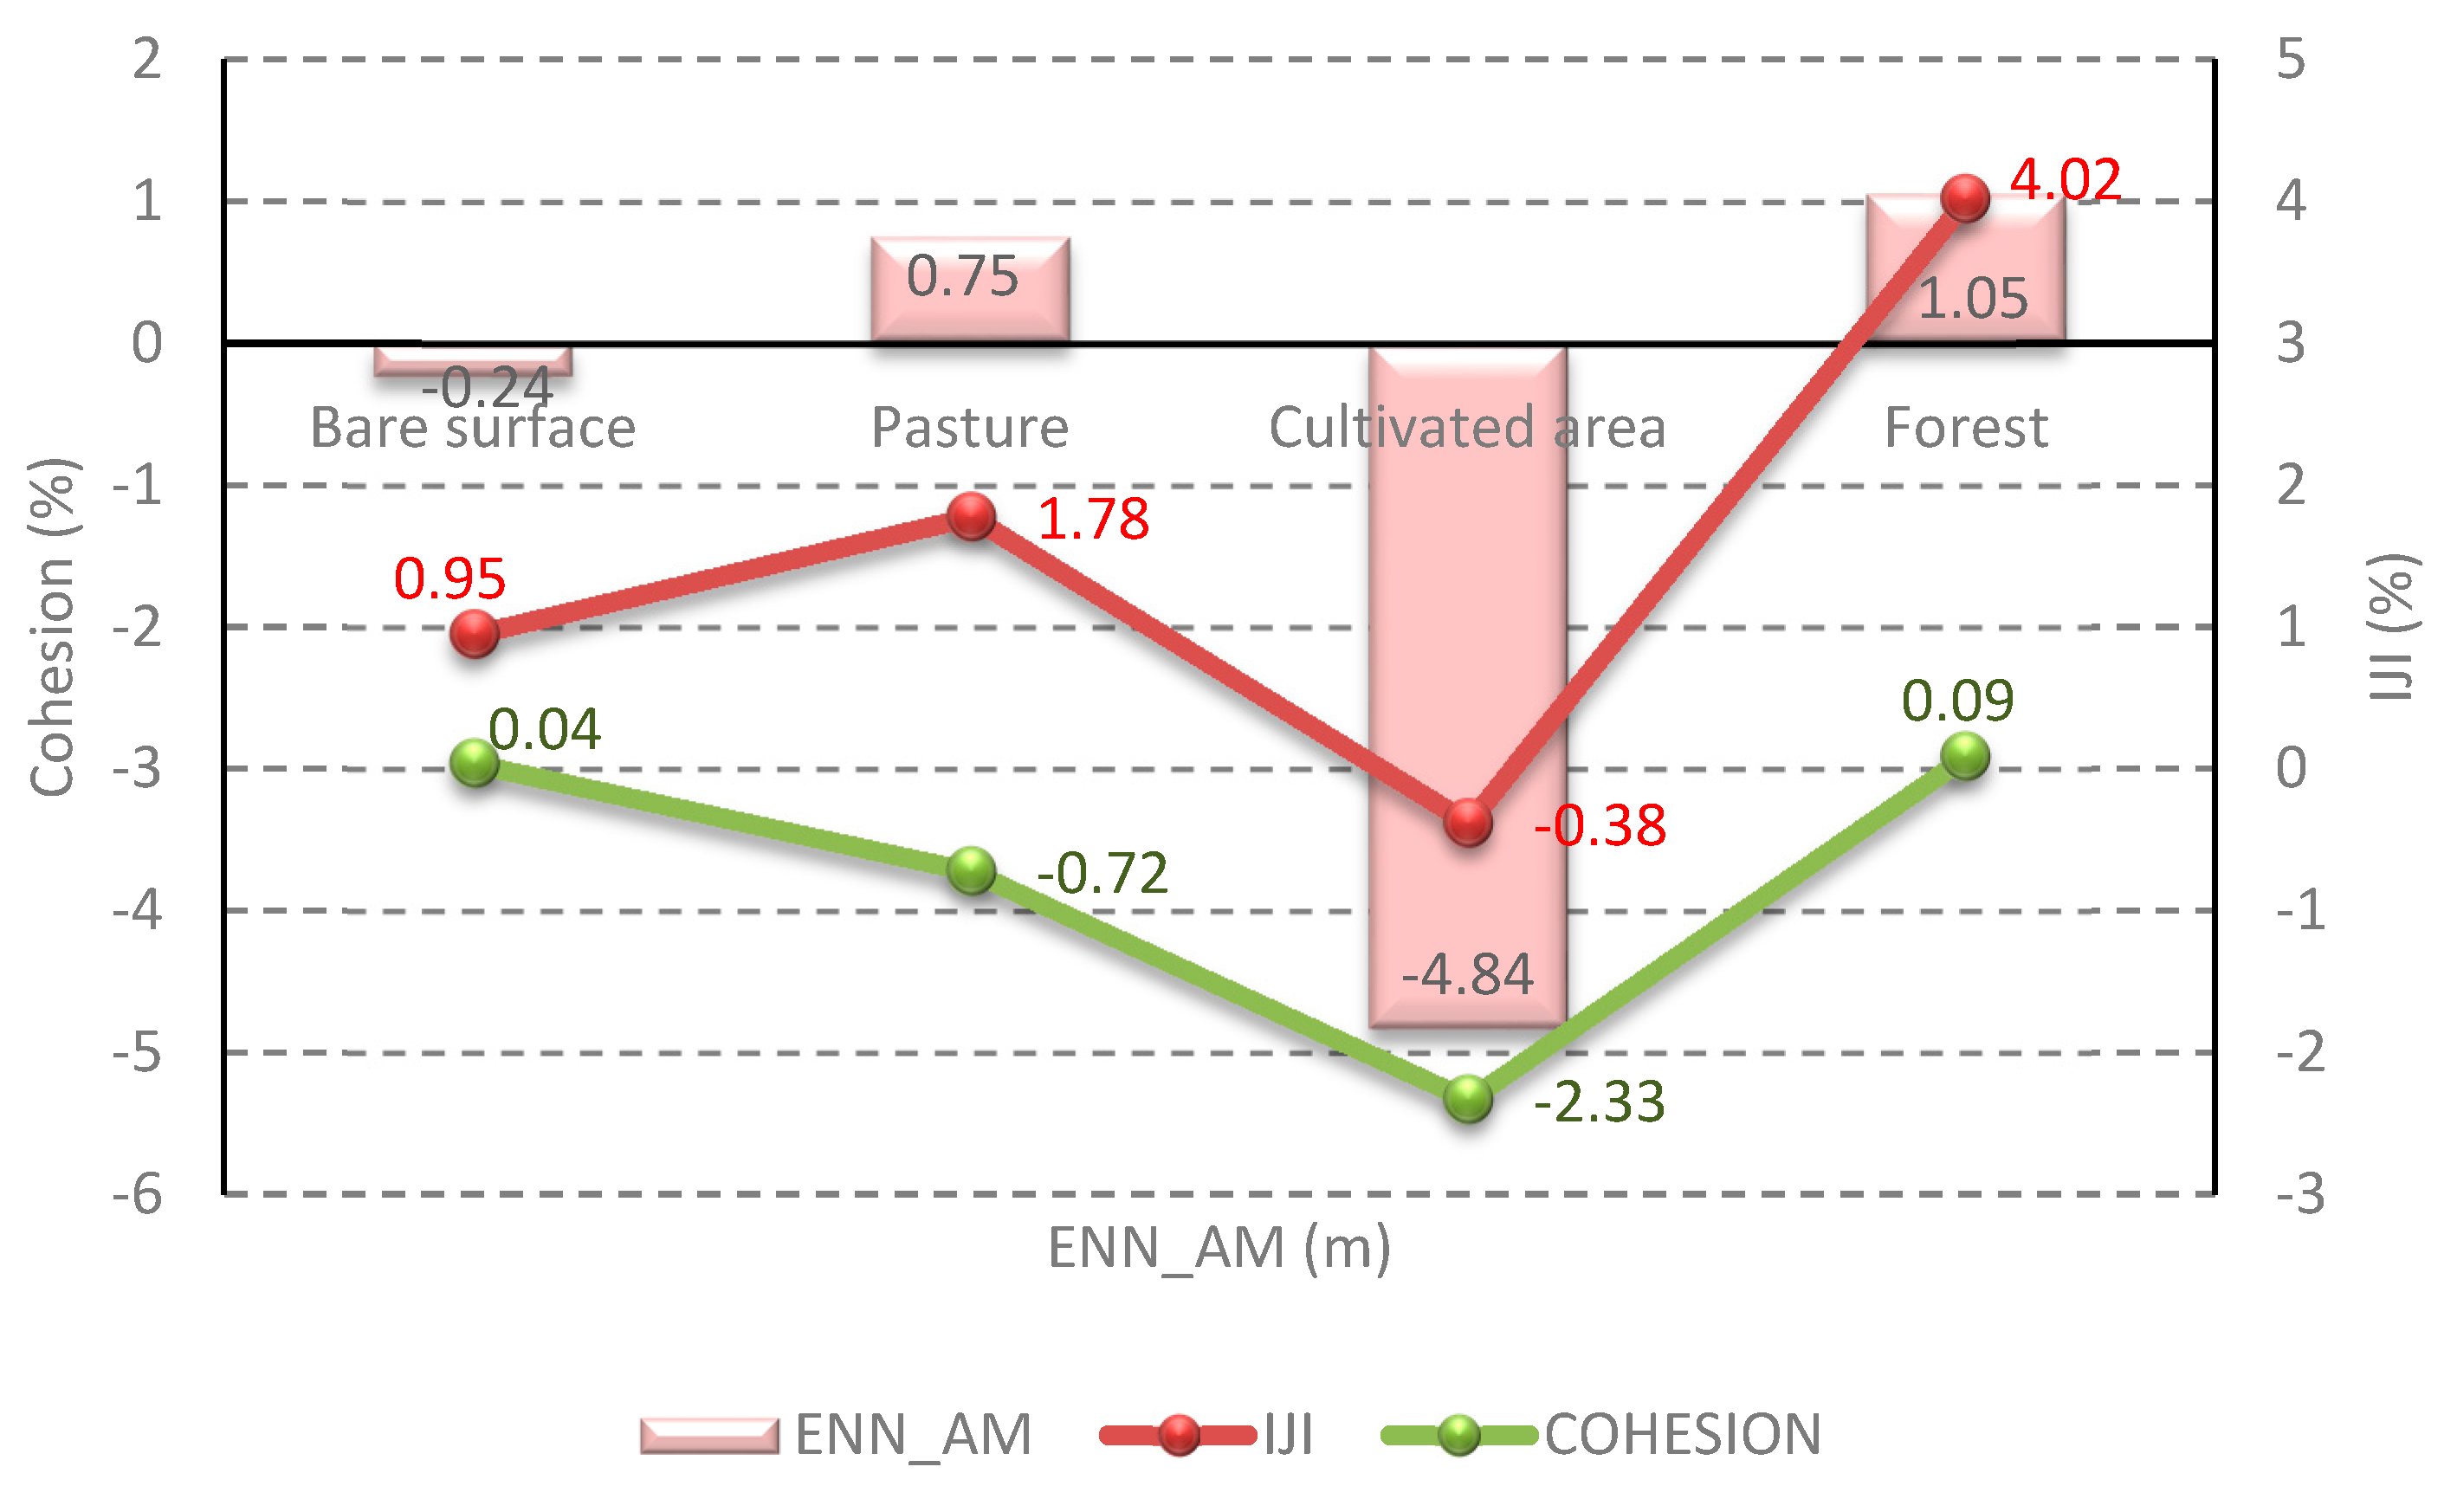
Figure 6.
Gains and losses of NP, MPS and LPI of LULC by category in different time periods (1998–2015) in the lower part of the HSCZ.
Figure 6.
Gains and losses of NP, MPS and LPI of LULC by category in different time periods (1998–2015) in the lower part of the HSCZ.

Figure 7.
Gains and losses of ENN_AM, IJI and Cohesion of LULC by category in different time periods (199–2015) in the lower part of the HSCZ.
Figure 7.
Gains and losses of ENN_AM, IJI and Cohesion of LULC by category in different time periods (199–2015) in the lower part of the HSCZ.

Table 1.
Rural population for villages around Choman district [38].
Table 1.
Rural population for villages around Choman district [38].
| Rural Rate | 2010 | 2011 | 2012 | 2013 | 2014 | 2015 |
|---|---|---|---|---|---|---|
| Choman Villages | 12,008 | 12,348 | 12,689 | 13,037 | 13,389 | 13,746 |
Table 2.
Satellite (sub-scene) images used in this study to quantify landscape patterns and land cover change.
Table 2.
Satellite (sub-scene) images used in this study to quantify landscape patterns and land cover change.
| Satellite Sensor | Path/Row | Acquisition Date | Resolution | Band Nos. |
|---|---|---|---|---|
| Landsat 7 ETM+ | 169/035 | 13 September 1998 | 30 m | 1, 2, 3, 4, 5, 7 |
| Landsat 8 LDCM | 169/035 | 24 August 2015 | 30 m | 1, 2, 3, 4, 5, 7, 8, 9 |
Table 3.
Metrics selected at class level for the quantification of landscape patterns in HSCZ.
| Metrics * | Units | Description |
|---|---|---|
| Percentage of land (PLAND) | % | Amount of the landscape occupied by certain LULC class [7] |
| Number of patches (NP) | n | Number of patches per class [7] |
| Largest patch index (LPI) | % | Percentage of landscape accounted for by largest patch [20] |
| Mean patch size (MPS) | ha | Mean area of patches of the same LULC class [62] |
| Euclidian Nearest Neighborhood | m | The measure of patch context to quantify patch isolation [62] |
| Distance (ENN_AM) | ||
| Interspersion and juxtaposition (IJI) | % | Degree of intermixing of class patch types [7] |
| COHESION (Cohesion) | % | The physical connectedness of the corresponding class patch [62] |
* Definitions and equations for calculation of the metrics are provided by McGarigal and Marks (1995), and McGarigal and Cushman (2002).
Table 4.
Comparison between the accuracies of the two classification algorithms assessed by independent validation data in the upper and lower parts for 1998 and 2015 in HSCZ.
Table 4.
Comparison between the accuracies of the two classification algorithms assessed by independent validation data in the upper and lower parts for 1998 and 2015 in HSCZ.
| Land-Cover Class | MLC | RF | ||
|---|---|---|---|---|
| 1998-Upper Part | 2015-Upper Part | 1998-Upper Part | 2015-Upper Part | |
| Overall accuracy (%) | 66.20 | 81 | 98 | 98 |
| κ | 0.55 | 0.74 | 0.97 | 0.97 |
| 1998-Lower Part | 2015-Lower Part | 1998-Lower Part | 2015-Lower Part | |
| Overall accuracy (%) | 57 | 84 | 99 | 99 |
| κ | 0.67 | 0.79 | 0.98 | 0.99 |
Table 5.
Metrics comparison and changes in PLAND at land cover class level for 1998 and 2015 in the upper part (up) and lower part (lp) of HSCZ.
Table 5.
Metrics comparison and changes in PLAND at land cover class level for 1998 and 2015 in the upper part (up) and lower part (lp) of HSCZ.
| LULC Class | Up-1998 | Up-2015 | Lp-1998 | Lp-2015 |
|---|---|---|---|---|
| Bare surface | 51.84 | 51.49 | 44.89 | 43.80 |
| Pasture | 22.43 | 23.47 | 12.21 | 30.76 |
| Cultivated area | 10.19 | 8.80 | 15.95 | 9.80 |
| Forest | 15.52 | 16.14 | 26.93 | 15.76 |
© 2018 by the authors. Licensee MDPI, Basel, Switzerland. This article is an open access article distributed under the terms and conditions of the Creative Commons Attribution (CC BY) license (http://creativecommons.org/licenses/by/4.0/).
Share and Cite
MDPI and ACS Style
Hamad, R.; Kolo, K.; Balzter, H. Post-War Land Cover Changes and Fragmentation in Halgurd Sakran National Park (HSNP), Kurdistan Region of Iraq. Land 2018, 7, 38. https://doi.org/10.3390/land7010038
AMA Style
Hamad R, Kolo K, Balzter H. Post-War Land Cover Changes and Fragmentation in Halgurd Sakran National Park (HSNP), Kurdistan Region of Iraq. Land. 2018; 7(1):38. https://doi.org/10.3390/land7010038
Chicago/Turabian StyleHamad, Rahel, Kamal Kolo, and Heiko Balzter. 2018. "Post-War Land Cover Changes and Fragmentation in Halgurd Sakran National Park (HSNP), Kurdistan Region of Iraq" Land 7, no. 1: 38. https://doi.org/10.3390/land7010038
Note that from the first issue of 2016, this journal uses article numbers instead of page numbers. See further details here.