Article

System Properties Determine Food Security and Biodiversity Outcomes at Landscape Scale: A Case Study from West Flores, Indonesia

1
Faculty of Sustainability, Leuphana University, Universitätsallee 1, 21335 Lüneburg, Germany
2
Center for Tropical Environmental and Sustainability Science, James Cook University, McGregor Rd, Smithfield, QLD 4878, Australia
*
Author to whom correspondence should be addressed.
Submission received: 28 February 2018 / Revised: 14 March 2018 / Accepted: 17 March 2018 / Published: 20 March 2018

Abstract

:
The food-biodiversity nexus is a concept that defines and characterizes the complex interactions between agricultural systems and biodiversity conservation. Here we use a social-ecological systems approach that combines fuzzy cognitive mapping and graph theoretic analyses to uncover system properties that determine food security and biodiversity outcomes at a landscape scale. We studied a rice-based agricultural landscape system situated in Mbeliling district of West Flores, Indonesia. A graphical representation of the Mbeliling district food-biodiversity nexus was created by local experts. The representation revealed system properties that help reconcile the trade-offs between food security and biodiversity conservation. The graph represented a diverse set of food security and biodiversity nodes, and showed that there is not a simple dichotomy between ‘production and protection’. The analysis captured greater complexity than popular academic concepts such as land sparing–land sharing or sustainable intensification. Three major themes emerged from the graph. We found distinct clusters of factors influencing biodiversity and food security. We named these sources of influence (1) Modernisation and sustainable farming; (2) Knowledge and management; and (3) Governance and processes. Component 2 was the most representative of emergent system properties that contribute positively to managing a sustainable food-biodiversity nexus in the Mbeliling landscape. The key determinants of outcomes were: improving agronomic practices, diversifying production, maintaining forest cover and connectivity, and using knowledge and natural resource management processes to mitigate the main drivers of change. Our approach highlights the complexities in the food-biodiversity nexus, and could have wide application in other locations.

1. Introduction

Achieving food security for all people while conserving biodiversity and ecosystem services are two, strongly linked, challenges fundamental to securing global sustainability. Global leadership has committed to achieving food security and conserving biodiversity, for example, by agreeing to the Sustainable Development Goals (SDG2—End hunger, achieve food security and improved nutrition, and promote sustainable agriculture; [1]) and the Aichi Targets [2] for biodiversity loss. What is not clear and is contested by many parties is the appropriate way to reconcile these, often competing, goals [3,4,5,6,7,8].
The academic discourse on the food-biodiversity challenge has been dominated by two broad thematic framings [9]. The first discourse is a ‘biophysical-technical’ framing that focuses on food production as the major impediment to better food security and biodiversity conservation outcomes, prescribing solutions that are generalized across systems [10,11,12,13,14]. Such biophysical-technical framings argue that food production must increase to meet rising global demand and that increases in agricultural output can be met by increasing the efficiency of production per unit area of land. Simultaneously, conservation targets can be met by creating protected areas. Within this framing are approaches such as ‘sustainable intensification of agriculture’ [12] and the ‘land sparing versus land sharing’ framework [10]. Sustainable intensification advocates a suite of interventions to increase agricultural yields per unit area of land without impacting the environment: for example, through integrated pest management, conservation agriculture, agroforestry, aquaculture, and improved varieties. The land sparing versus land sharing framework typically advocates localized intensification as the means to produce more food while simultaneously protecting (i.e., “sparing”) nearby areas for conservation [7,10].
In contrast to this, the second major framing can be described as ‘socio-political’ [9], focusing on human capital, governance, and power relations, and emphasises themes of equity and justice, food sovereignty, empowerment, agroecology, and social-ecological development [15,16]. This framing criticises the ‘production’ philosophy, which espouses a simple positive relation between food production and food security or indeed a simple negative relation between food production and biodiversity. The primary focus of this socio-political framing is on achieving food security and environmental sustainability through non-technical mechanisms such as better governance or processes that ensure greater social justice.
One could argue that the current academic debate on the food-biodiversity nexus lacks recognition of the importance of context and favours a scientific reductionist approach. This approach can result in measures to protect biodiversity at the expense of local people and their livelihoods. Indeed, the discourse often, frustratingly, still portrays local people as the cause of environmental problems and ignores the reality that the causes of environmental degradation are complex and multi-scaled. This criticism extends back to the (re)-framing of analyses on poverty and environmental degradation led by Chambers [17,18]. In his critiques of both development practice and attempts to integrate conservation and development, Chambers explicitly addressed academic habits of tackling complex issues with a classic reductionist approach that often mis-framed human-environment problems as simple issues with technical solutions. An example of mis-framing the complex social-ecological problem of poverty is what Chambers described as ‘economic thinking’. Economic thinking postulated that employment will provide poor people paid employment to escape poverty. The solution to poverty therefore lay in government policies that focussed on increasing the labour market by encouraging business creation and expansion. This singular solution might very well work for poverty in cities but is severely limited in rural landscapes where people have ‘livelihoods’ rather than ‘jobs’. Rural people’s livelihoods consist of a mixture of agricultural production for consumption, sales for income, and under certain conditions the sale of labour for income. Chambers also explained ‘environment thinking’ in the context of deforestation and degradation. Conservationists focus on protecting forests from people, not recognising sufficiently that these very people rely on forests for food, fibre and other values [19].
In order to overcome overly simple framings (i.e., land sparing-sharing, sustainable intensification), we advocate a systems approach. A systems approach can be used to map in detail the nature of multiple interactions between food security and biodiversity conservation—such that system properties are identified that benefit both food security and biodiversity conservation [4,20]. Rather than focussing on optimizing either food security or biodiversity conservation, and by association adopting a default trade-offs mentality, a systems approach seeks to empirically examine landscape-scale systems in order to identify key factors influencing the food-biodiversity nexus. The goal then is to identify system properties that afford an opportunity to harmonise the often competing goals of increasing food security and conserving biodiversity. Adopting a systems approach could shift the discourse from a trade-offs framing of analysis to one that searches for synergies [20].
In this paper, we applied such a systems approach to a landscape in West Flores, Indonesia. We focused on Indonesia because of its recent history regarding food, poverty and development policies that inter alia strongly favoured intensified food production, and Indonesia’s importance as a place of high biodiversity value, containing some of the world’s remaining tropical forests. We now provide more detailed information about Indonesia’s historical and contemporary food security situation and its significant biodiversity assets, with contextual information regarding the case study landscape in West Flores that are mostly dependent on forest cover.
Indonesia’s food policy has for many decades focused on rice production [21]. Soon after Indonesia gained independence it experienced food market and price instability. In the early 1960s, President Sukarno introduced policies to intensify agriculture with a focus on rice production in order to minimize price variability, feed the bangsa (the Bahasa Indonesia word that abstractly describes all society), and increase political stability [22]. His early policies and programmes largely failed. The area of land in production and rice yields declined as government interventions in agriculture increased. Rice production declined as a result of poorly designed policies and missing infrastructure [23]. Following the presidency of Sukarno, agricultural policies were reformed and strengthened during President Suharto’s 31 years in power. Suharto was raised in a rice farming family—his stepfather was a farmer. He saw political opportunity in supporting smallholder rice farmers, investing financial and political capital into creating an Indonesia that had a self-sufficient food system based on rice cultivation. Suharto’s programmes of state assistance to rice farmers combined easier financial terms for borrowing money, subsidies for inputs, extension services to help farmers implement better farming systems, and a massive sustained investment in irrigation infrastructure. Farmers received substantial state subsidies for inputs (e.g., fertiliser), and minimum prices for their product. Despite their good intentions these support mechanisms distorted the market for rice and other staple crops, inflating domestic rice prices between 30–60% compared to international prices [24].
In addition to supporting rice producers, Indonesia’s “RASKIN programme” provides heavily subsidized rice to poor households. A poor household may purchase up to 15 kg of rice per month at a fixed price of IDR 1600 (~0.12 USD) per kilogram. However, typically households only purchase between 30% and 60% of their entitlement and often pay higher than expected prices because of poor government management [25]. Indonesia’s current government continues to pursue food self-sufficiency by focusing on rice production and aims to reduce rice imports to zero. This suggests that food security in the Indonesian context is narrowly defined as the supply, availability, and access to rice as it is the most important staple food for households.
Broadly, food balance data shows that the per capita available energy from all food production is approximately 2646 kcal/person/day, more than the recommended 2200 kcal/Day for a sedentary lifestyle [26]. However, actual calorie consumption was estimated in 2014 to be approximately 1869 kcl/person/day—well below the recommended daily intake. Similarly, available protein is approximately 58.8 g/Day/person, above the recommended level of 56 g/person/day [26] but again the average consumption is only 54 g/person/day. In addition to these discrepancies, the consumption is of course not even, resulting in widespread under-nutrition throughout Indonesia: West Papua and the islands east of Bali are the most food insecure [25].
On the ecological side, Indonesia, along with Brazil and central Africa, contains the vast majority of the world’s remaining tropical forests, including extraordinary levels of biodiversity and carbon stocks [27]. Indonesia has experienced several decades of rapid deforestation and forest degradation. Vast areas of tropical forest have been logged, cleared for industrial plantations and subjected to hundreds of years of ‘slash and burn’ agriculture [28]. The islands of Sumatra and Kalimantan (Indonesian Borneo) have been particularly hard hit by land use change [29,30], and the impact on biodiversity has been profound [31]. However, the conversion of forests and other land cover types has benefitted livelihoods and promoted economic growth pulling many millions of people out of poverty [32]. While deforestation has recently slowed in Indonesia, large-scale industrial agriculture and wildfires continue to threaten biodiversity especially on the islands of Sumatra, Borneo, and Papua.

2. Materials and Methods
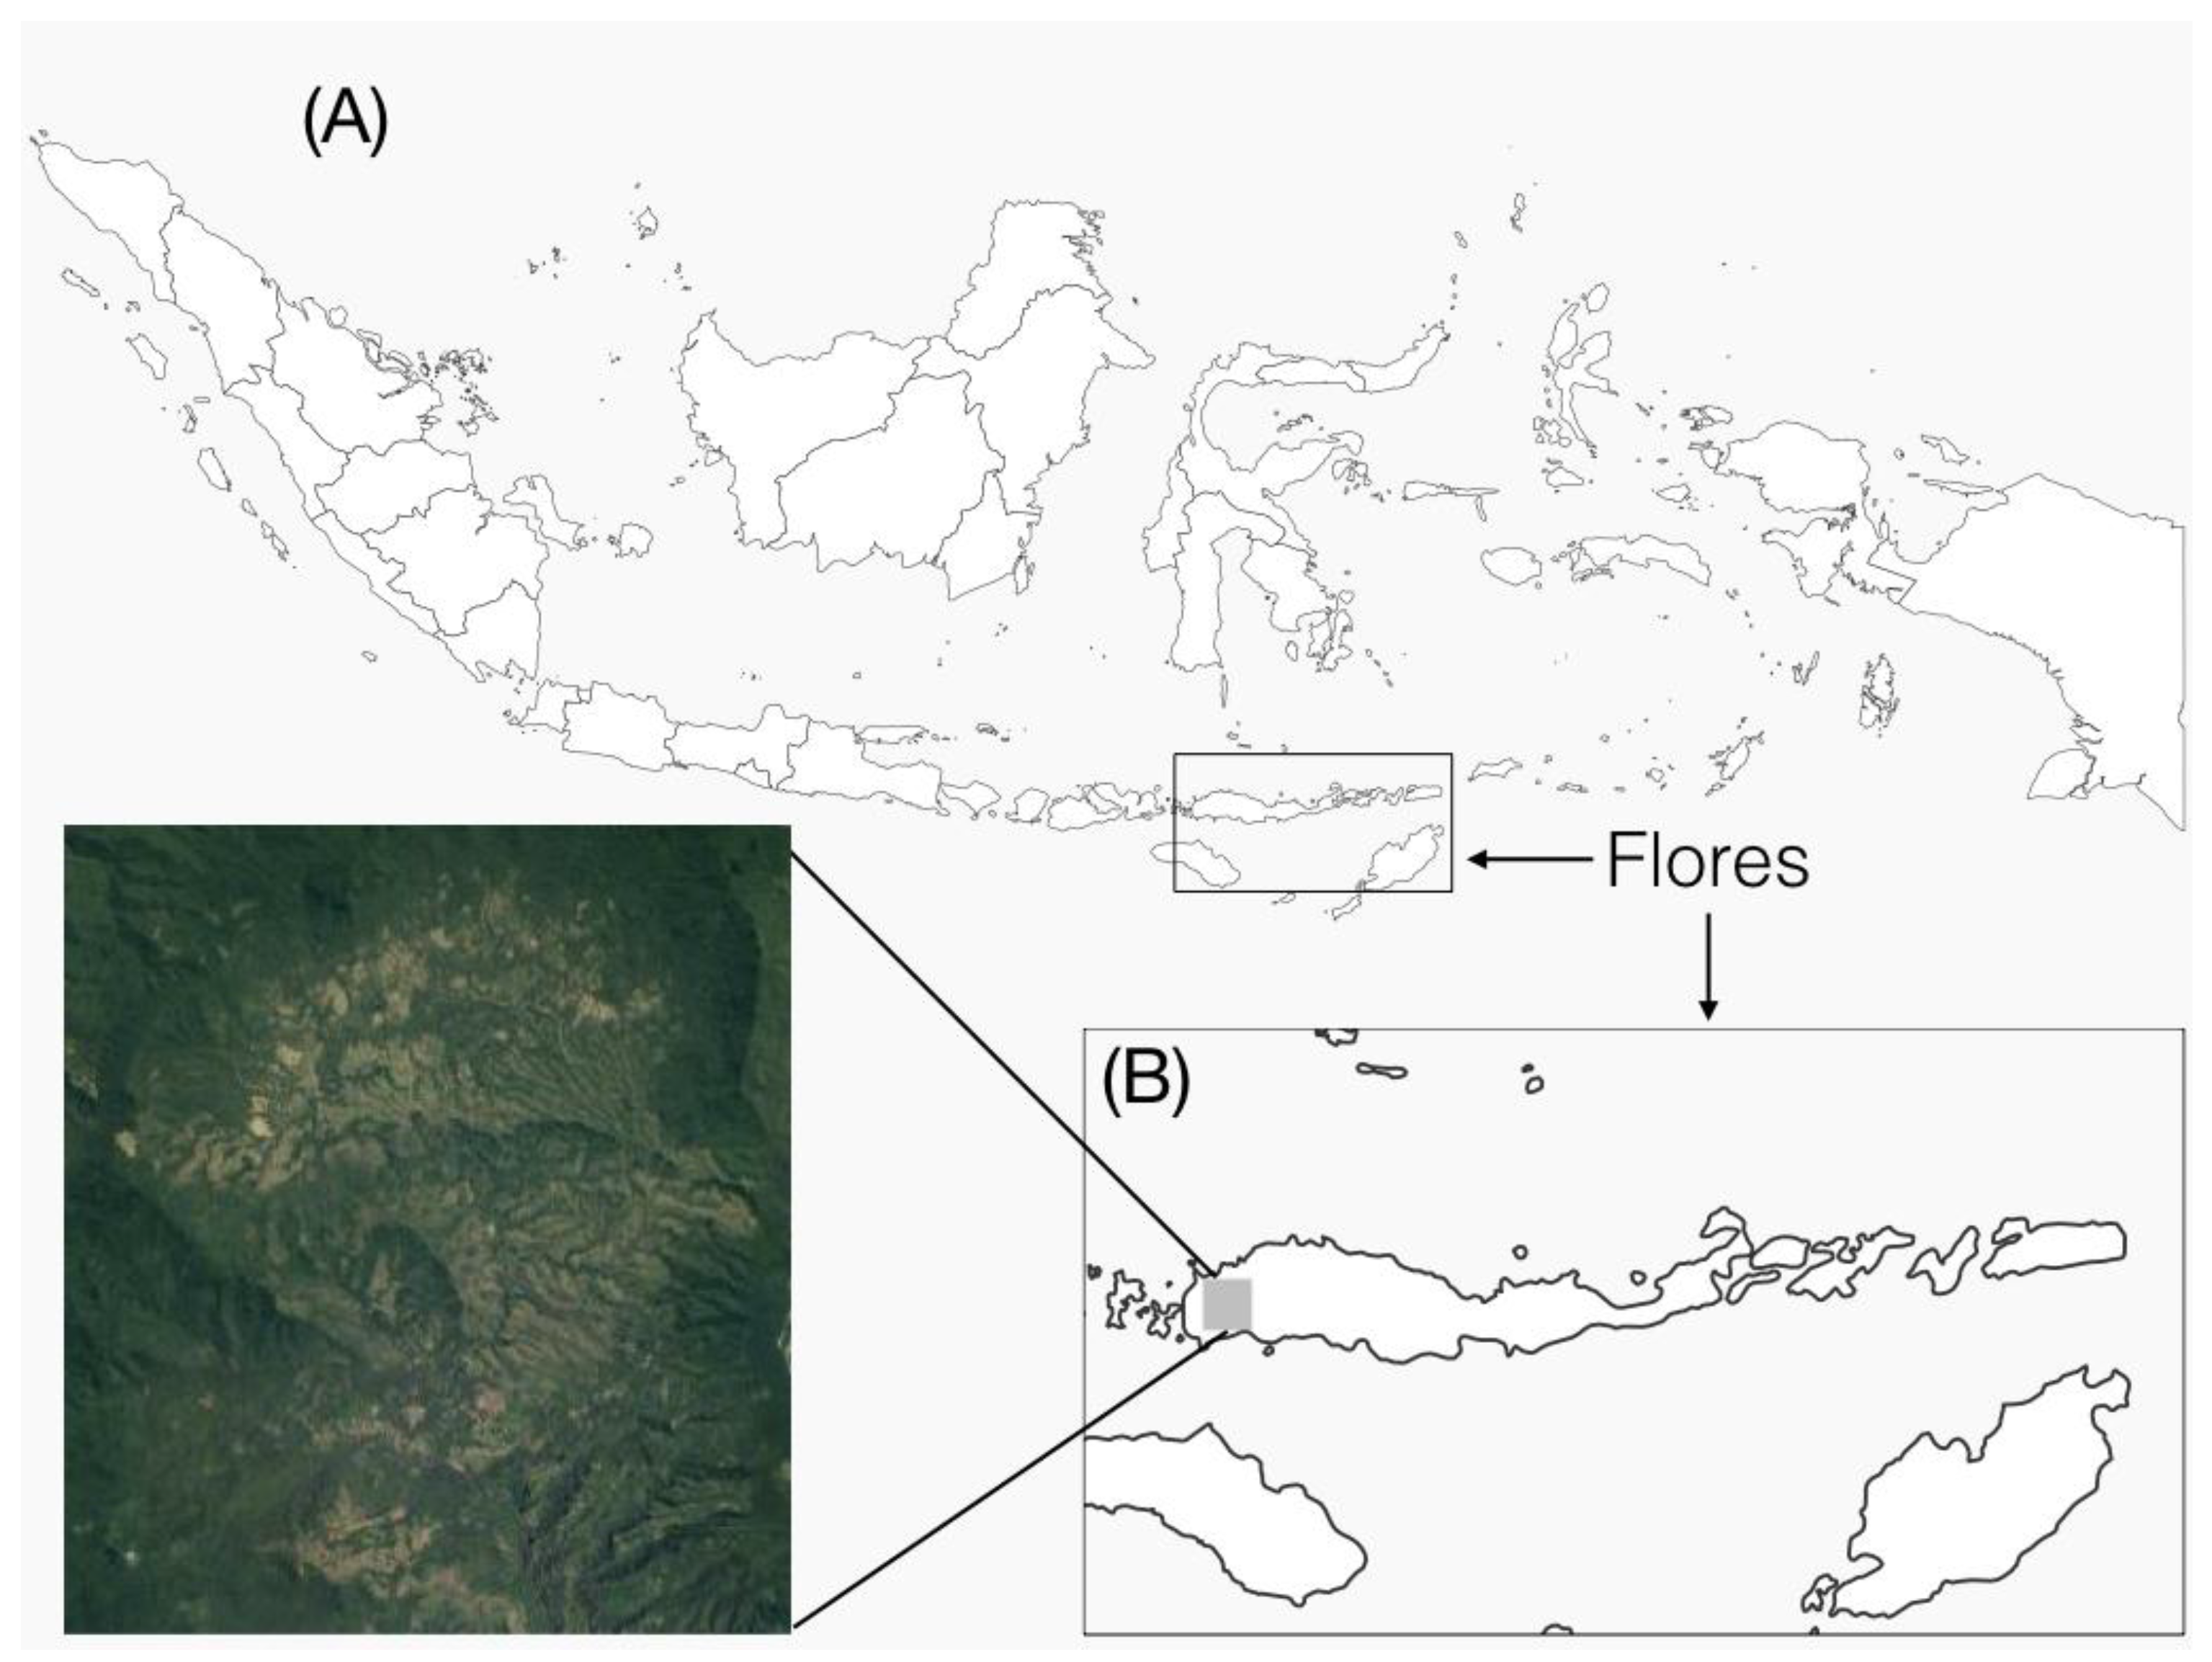
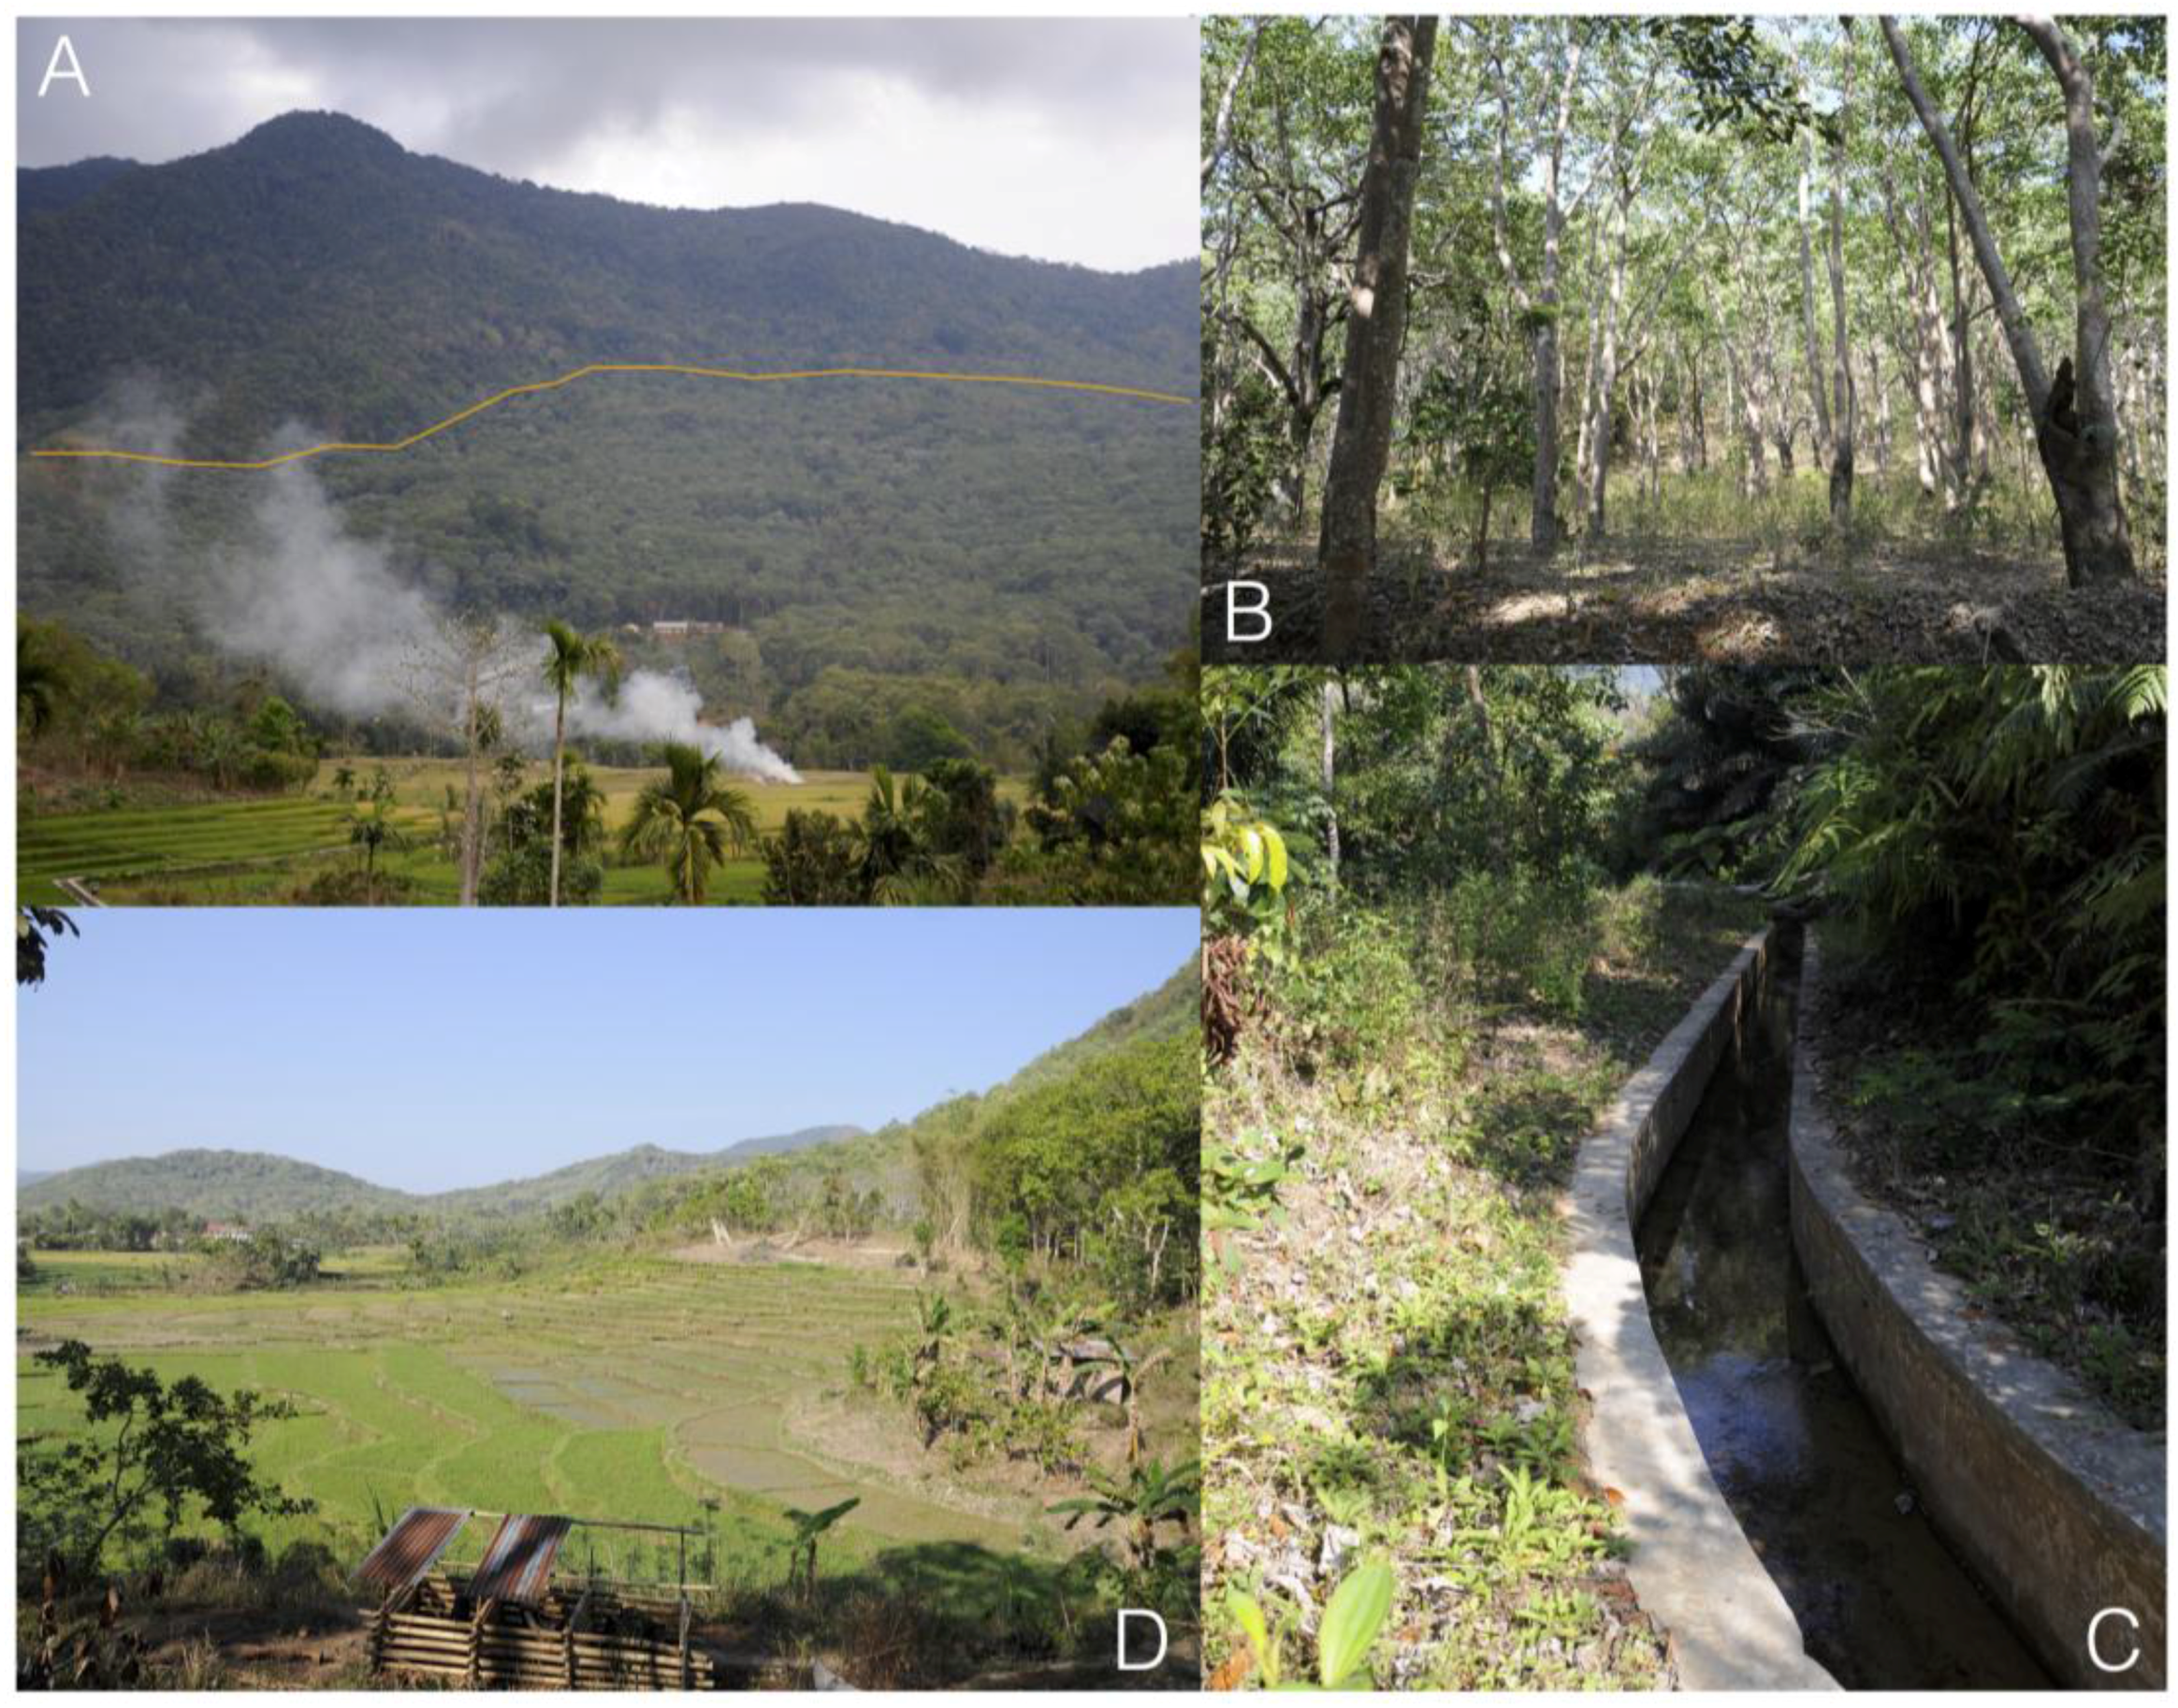
2.1. The Landscape

Our study focused on the Mbeliling landscape (hereafter ‘the landscape’) which is situated in the Manggarai Barat district (Kabupaten) on the island of Flores, which itself is located in the Nusa Tengara Timur province (NTT) (Figure 1). We defined the landscape as the area of interest to Birdlife Indonesia who were working with local communities to improve livelihoods and conserve rare and endangered birds. The landscape measures approximately 940 km2 and contains 27 villages with a total population of approximately 34,000 people. 19.60% of the population of NTT fall below the Indonesian defined poverty threshold, nearly double the national average of 10.96%. NTT also suffers some of Indonesia’s highest rates of stunting, wasting, and underweight of children less than five years of age [33]. Manggarai Barat is classified by the Indonesian government as ‘Priority 2—severely vulnerable to food insecurity’ [25]. Some attributes of Priority 2 districts are: more than 40% of children under five years of age are stunted; 15–20% of the population live below the poverty line; more than 20% of villages lack roads and 30–40% of households lack access to clean water.
The NTT region experienced a net loss of 39,381 ha of forest between 2000 and 2014 (http://www.globalforestwatch.org/country/idn). The major land cover types in the landscape are primary forest—mostly on the steep slopes of mountains—degraded secondary forest, agriculture, and agroforest (Figure 2A,B,D). Flores lies in a centre of vertebrate and plant endemism within the Oriental biogeographic region [34]. The region of West Flores is recognized as an Important Bird Area by Birdlife International and is the habitat of several rare and endangered bird species. Butchart et al. [35] recorded 162 bird species, of which 25 were restricted range species. Five endemic birds are found in this landscape: Flores Lorikeet (Trichoglossus weberi), the endangered Flores Hanging Parrot (Loriculus flosculus), the endangered Flores Scops-Owl (Otus alfredi) [36], the endangered Flores Crow (Corvus florensis), and the endangered Flores Monarch (Monarcha sacerdotum) [37]. West Flores also lies in the centre of the range of the critically endangered Flores Hawk Eagle (Nisaetus floris) [37]. These species attract a growing number of bird watching tourists and ornithologists.

2.2. Cognitive Mapping Workshop and Data Collection

The Mbeliling landscape in Indonesia was chosen for two reasons: (1) it is considered food insecure and contains important biodiversity assets; and (2) existence of local expertise with respect to food security and biodiversity conservation. Here we use ‘local expertise’ to refer to people with knowledge about the landscape, whether that be knowledge of food security, agriculture, biodiversity, government policy, or governance. Combining these types of expertise is necessary to break free from overly simple framings of the food-biodiversity challenge. Twelve participants were identified and involved in fuzzy cognitive mapping. Together, they had experience in many fields of research and practice, including anthropology, sustainable livelihoods, conservation science, forestry, ecotourism, agriculture, and ecology.
Our key partners in this exercise were James Cook University, which has been heavily involved in landscape level studies focussing on conservation and development throughout the Indonesian archipelago, and Burung Indonesia—Birdlife International’s Indonesian affiliate. Burung Indonesia has been coordinating the landscape-scale conservation and natural resource management project in Mbeliling for eight years (2007–2015).
The workshop involved a simple three-step process that we call ‘Identify, connect, reflect’. First, the experts identified the nodes of the landscape that contribute to food security or biodiversity conservation. Second, they then connected important issues within the landscape system. Third, they reflected on the issues and their connections with relevance to food security and biodiversity conservation.
During the process, we stressed that the focus was on landscape-scale issues and was not meant to represent a generalised, or global, perspective on food security and biodiversity conservation. We also pre-defined the physical boundary of the landscape in order to provide the experts with a basic frame of reference (see Figure 1). Previous pilot workshops held at Leuphana University and Leeds University discovered that experts could be defined by two broad types of knowledge they had about their systems of study (unpublished data). One type was strongly place-based with detailed knowledge about the landscape and the dynamics of the social-ecological system. The second type reflected knowledge at a national or global scale, lacking detailed understanding at the landscape scale. The key to maximising the value of the latter type of expert was to elicit information that would affect the landscape system of interest, for example in relation to national policy, external economic influences, or influential global events.
With the focus clearly on the landscape scale the actors defined the content and conceptual boundary of the network. Before the experts began defining the network we primed the group with two major definitions of interest. First, we used the United Nations Food and Agriculture Organisation’s definition of food security: Food security is a situation that exists when all people, at all times, have physical, social and economic access to sufficient, safe and nutritious food that meets their dietary needs and food preferences for an active and healthy life [38]. Second, we used the Convention on Biological Diversity definition of biodiversity: Biodiversity is the variability among living organisms from all sources including terrestrial, marine and other aquatic ecosystems, and the ecological complexes of which they are part; this includes diversity within species, between species, and of ecosystems (United Nations 1992). We stressed that this definition also included agricultural biodiversity, especially important in many lower-intensity and subsistence production systems [19].

2.2.1. Step I: Identify

Any expert within the group could identify nodes for inclusion in the network. Nodes were identified by writing a word or short phrase on a ‘sticky’ note and attaching it to a wall of the workshop room. After all initial nodes had been collected, each workshop participant was given five points, and was asked to allocate a maximum of one point to five different nodes—those they thought were most important nodes irrespective of their classification as ‘biodiversity’ or ‘food security’.

2.2.2. Step II: Connect

The experts connected the nodes. A connection between two nodes represented any type of association. In simplest terms, a connection represented the cognitive connection between two nodes. Defining connections broadly can lead to claims of ‘everything being connected to everything’ and therefore the connections lose all meaning. We therefore stressed to the experts that a connection must at least be definable or explainable to anyone who questioned the existence of a connection between two nodes. Many of the connections were challenged openly and discussed within the group, and the experts frequently discussed the rationale of some connections and from these discussions they decided whether or not the connections were appropriate. The connections were not directional, that is, they did not assume a cause-and-effect relationship between the nodes. Many of the connections were challenged openly and discussed within the group. Contextual information about the landscape emerged throughout the discussions during this step and was recorded in note form.

2.2.3. Step III: Reflect

The final step was a period of reflection when the experts could explain the landscape context, the nodes that they identified, and the connections between the nodes. Some of the reflection process emerged as the experts made the connections between nodes, during step II, rather than being discussed solely after the network was completed. The discussions were recorded in note form. The reflection process provided the experts and the researchers with the opportunity to provide context to the network by creating a coherent narrative describing its complexity, main drivers, and challenges and opportunities for reconciling food security and biodiversity conservation.

2.3. Analysis: Network Properties and Social-Ecological System Characteristics

We converted the drawn network into a data file by first numbering all the nodes and then defining all the connections between nodes. These data were stored in text files. The data were analysed using R version 3.0.1 [39]. We built and analysed the network using the ‘igraph’ package [40].
We calculated two measures of centrality for each node in the network—betweenness centrality, and degree centrality. Betweenness centrality is a global level description of a node’s ‘centrality’ in a network. It measures how frequently shortest path connections, between any two nodes in the network, pass through a particular node in the network. If a node is more central in the network then it is contained in shortest paths across the network between any two nodes. Betweenness centrality is useful to identify nodes that are “central” to the overall graph, or that hold it together. In contrast, degree centrality refers to the number of vertices connected to a particular node. Here, this measure simply helped to identify nodes that were connected to a particularly large number of other nodes. Degree centrality measures the number of edges connected to a particular node, again reflecting the importance of nodes relative to others in the network.
Using these measures of centrality, we assessed quantitatively which nodes were ‘important’ in the network. We used the betweenness centrality measure to rank the nodes from highest importance to lowest importance. We then calculated the cumulative sum of the ranked nodes and selected the set of highest ranked nodes whose cumulative betweenness centrality summed to 50% of the total betweenness centrality. These nodes were considered the most ‘important’ in the graph.
Finally, we extracted the maximal cliques from each graph. The maximal clique represents a set of nodes that are all connected to each other. The common analogy for this graph structure is a subset of people in a social network who all consider one another to be friends. There can be many maximal cliques with the same number of nodes within the same network. We first identified all maximal cliques within the network, and then calculated the frequencies at which each node was found across all maximal cliques.

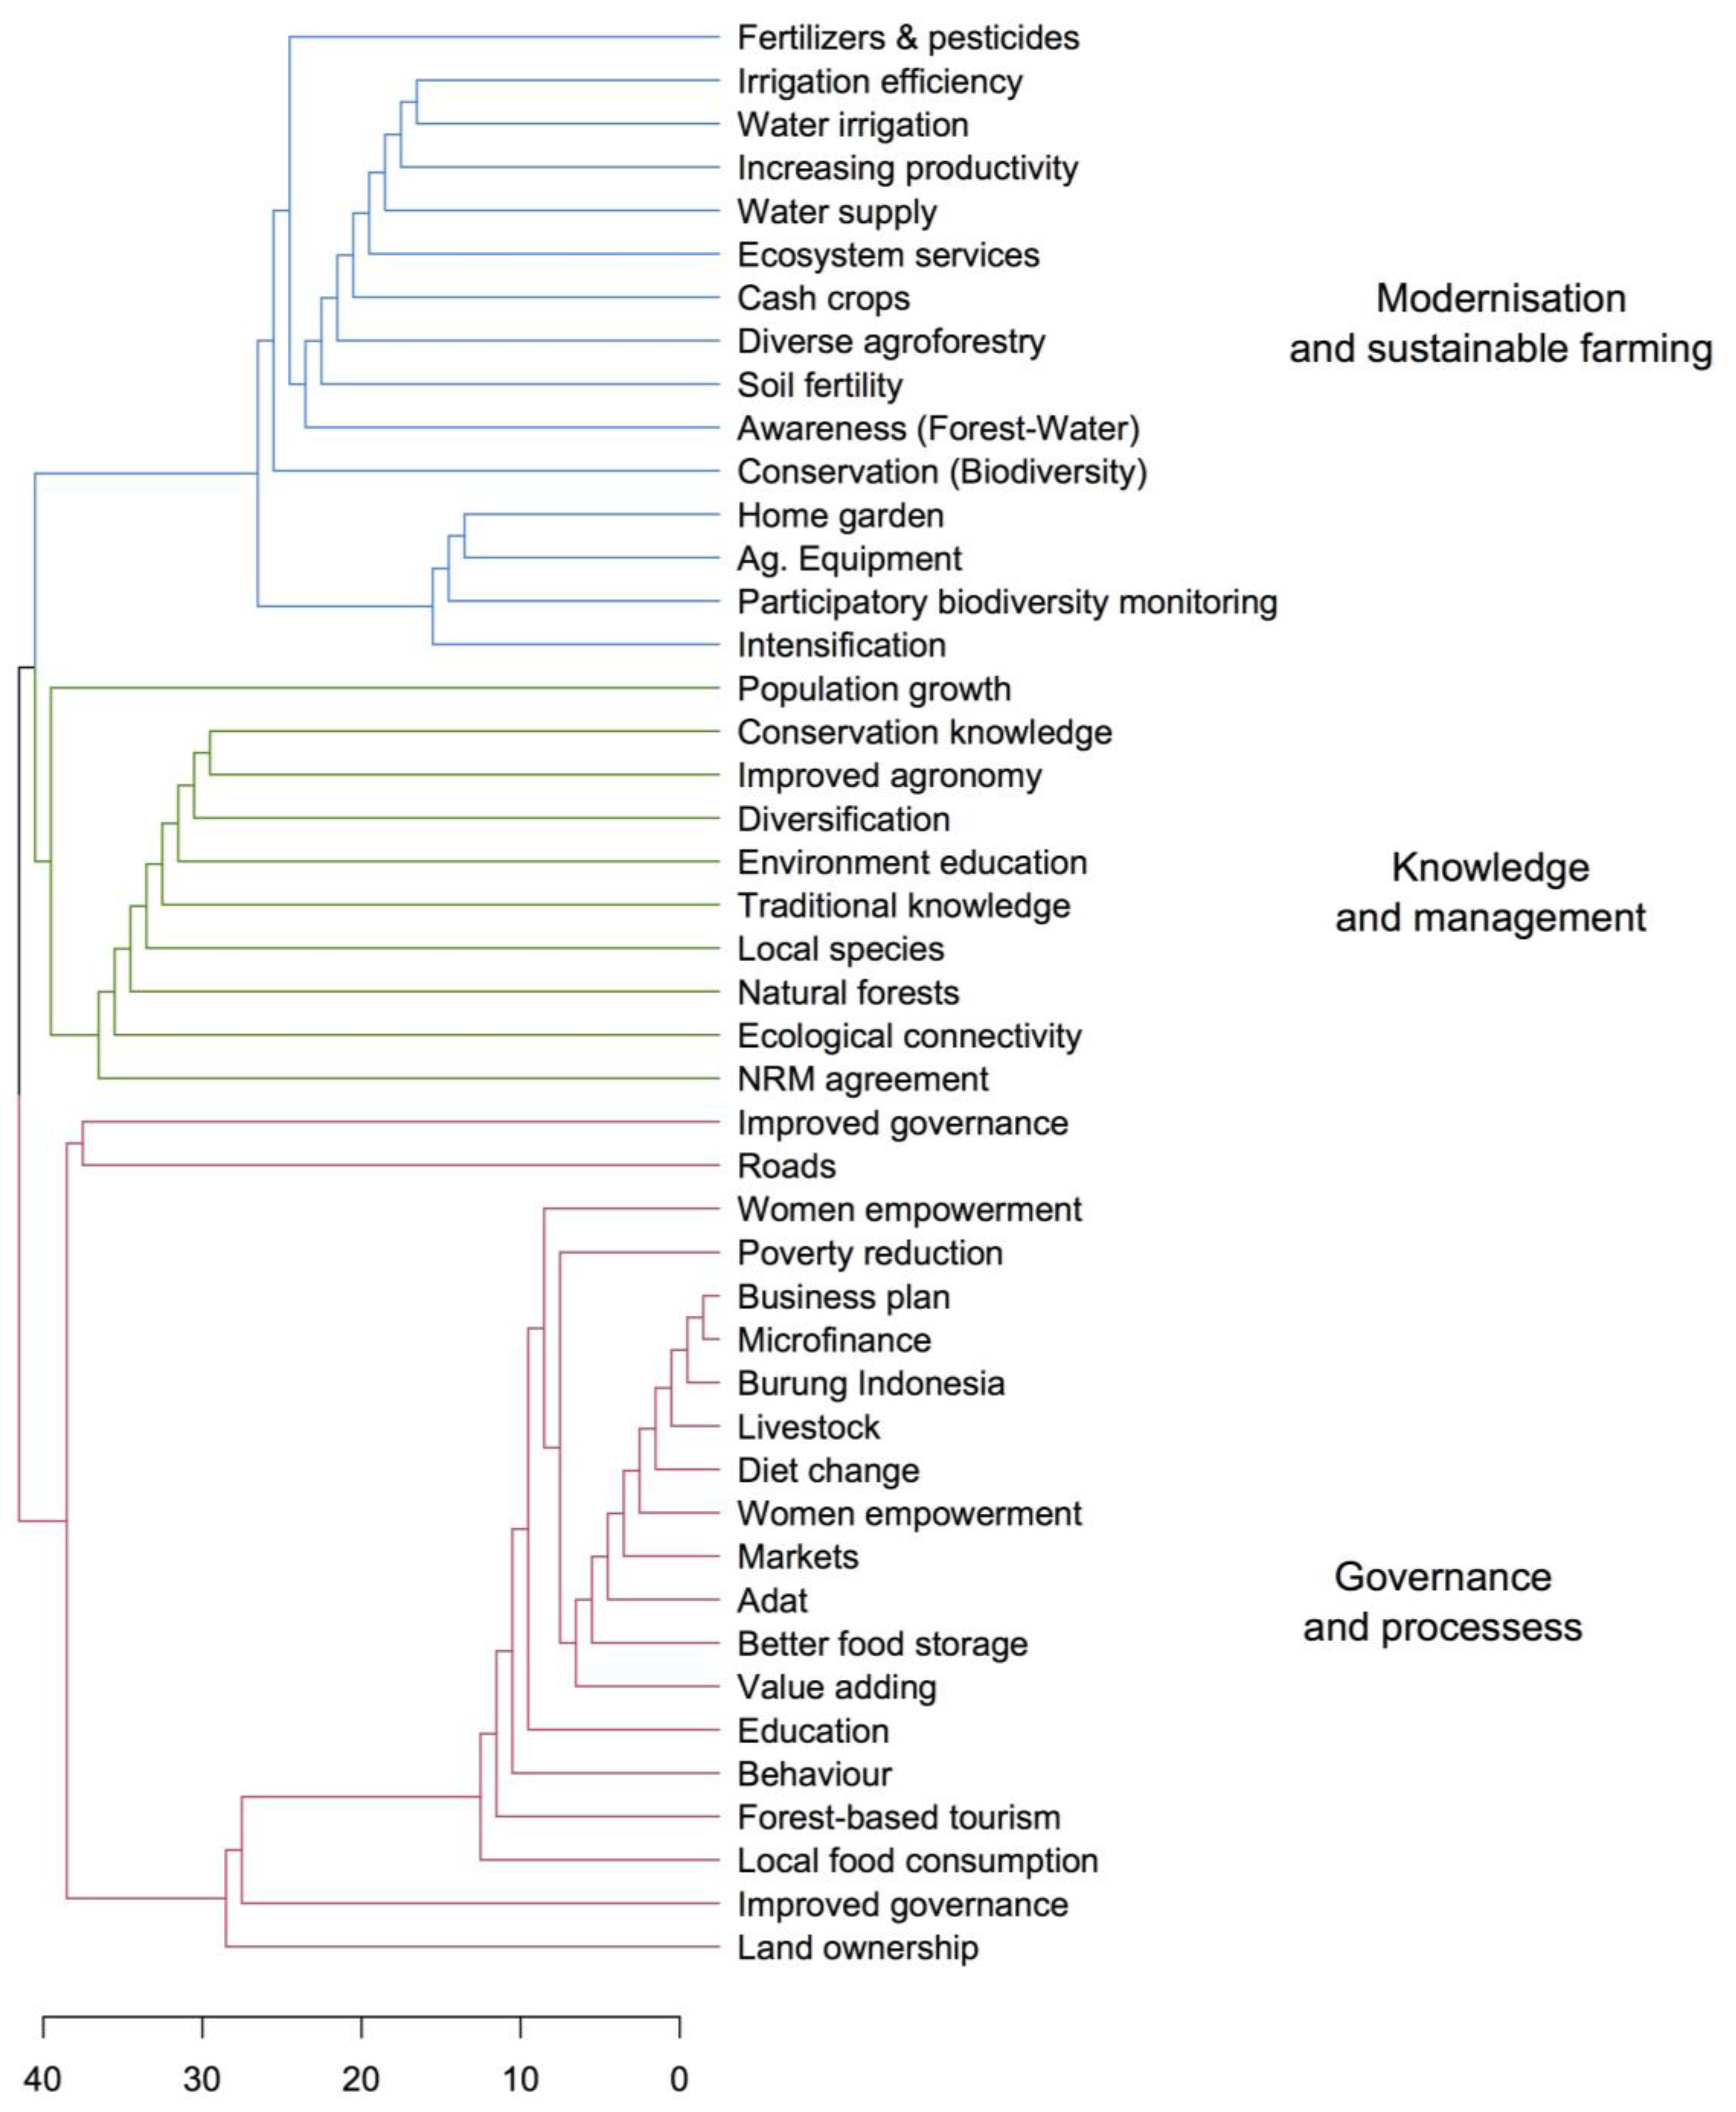
2.4. Cluster Detection

Here we use the term ‘cluster’ to represent groups of nodes with dense connections within groups and sparse connections between groups (see glossary). That is, nodes within a community are more connected to each than to other parts of the network. Synonyms of ‘community’ are cluster, module, and group but they all refer to describing the sub-structure of a graph. We simplified the graph before we did community detection analysis. Graph simplification involves removing edge loops—edges that start and end on the same node—and multiple edges between nodes. Simplifying graphs before community detection is essential for the community detection algorithm to work. Information is lost during this process, but for our analysis any reduction in edges was actually a correction of workshop process error i.e., we were only interested in whether two nodes were connected, thus extra nodes were redundant information and their loss is inconsequential for the analysis. We used the ‘fast greedy’ algorithm to identify the communities in the network [41]. The communities were visualized in network and dendrogram form for interpretation. We also report the modularity score derived from the community detection analysis. The modularity score indicates the density of connections within clusters.

2.5. Graph Narratives

By combining the graph analysis and qualitative data (landscape observations and subsequent discussions) we described the food security and biodiversity conservation nexus in the social-ecological system. Specifically, we focused on the network communities and how the nodes within each community related to each other in the context of the food-biodiversity nexus. We produced a descriptive narrative for each community based on prior information about the region and landscape, and the information gathered during the workshop, and the network itself.

3. Results and Discussion

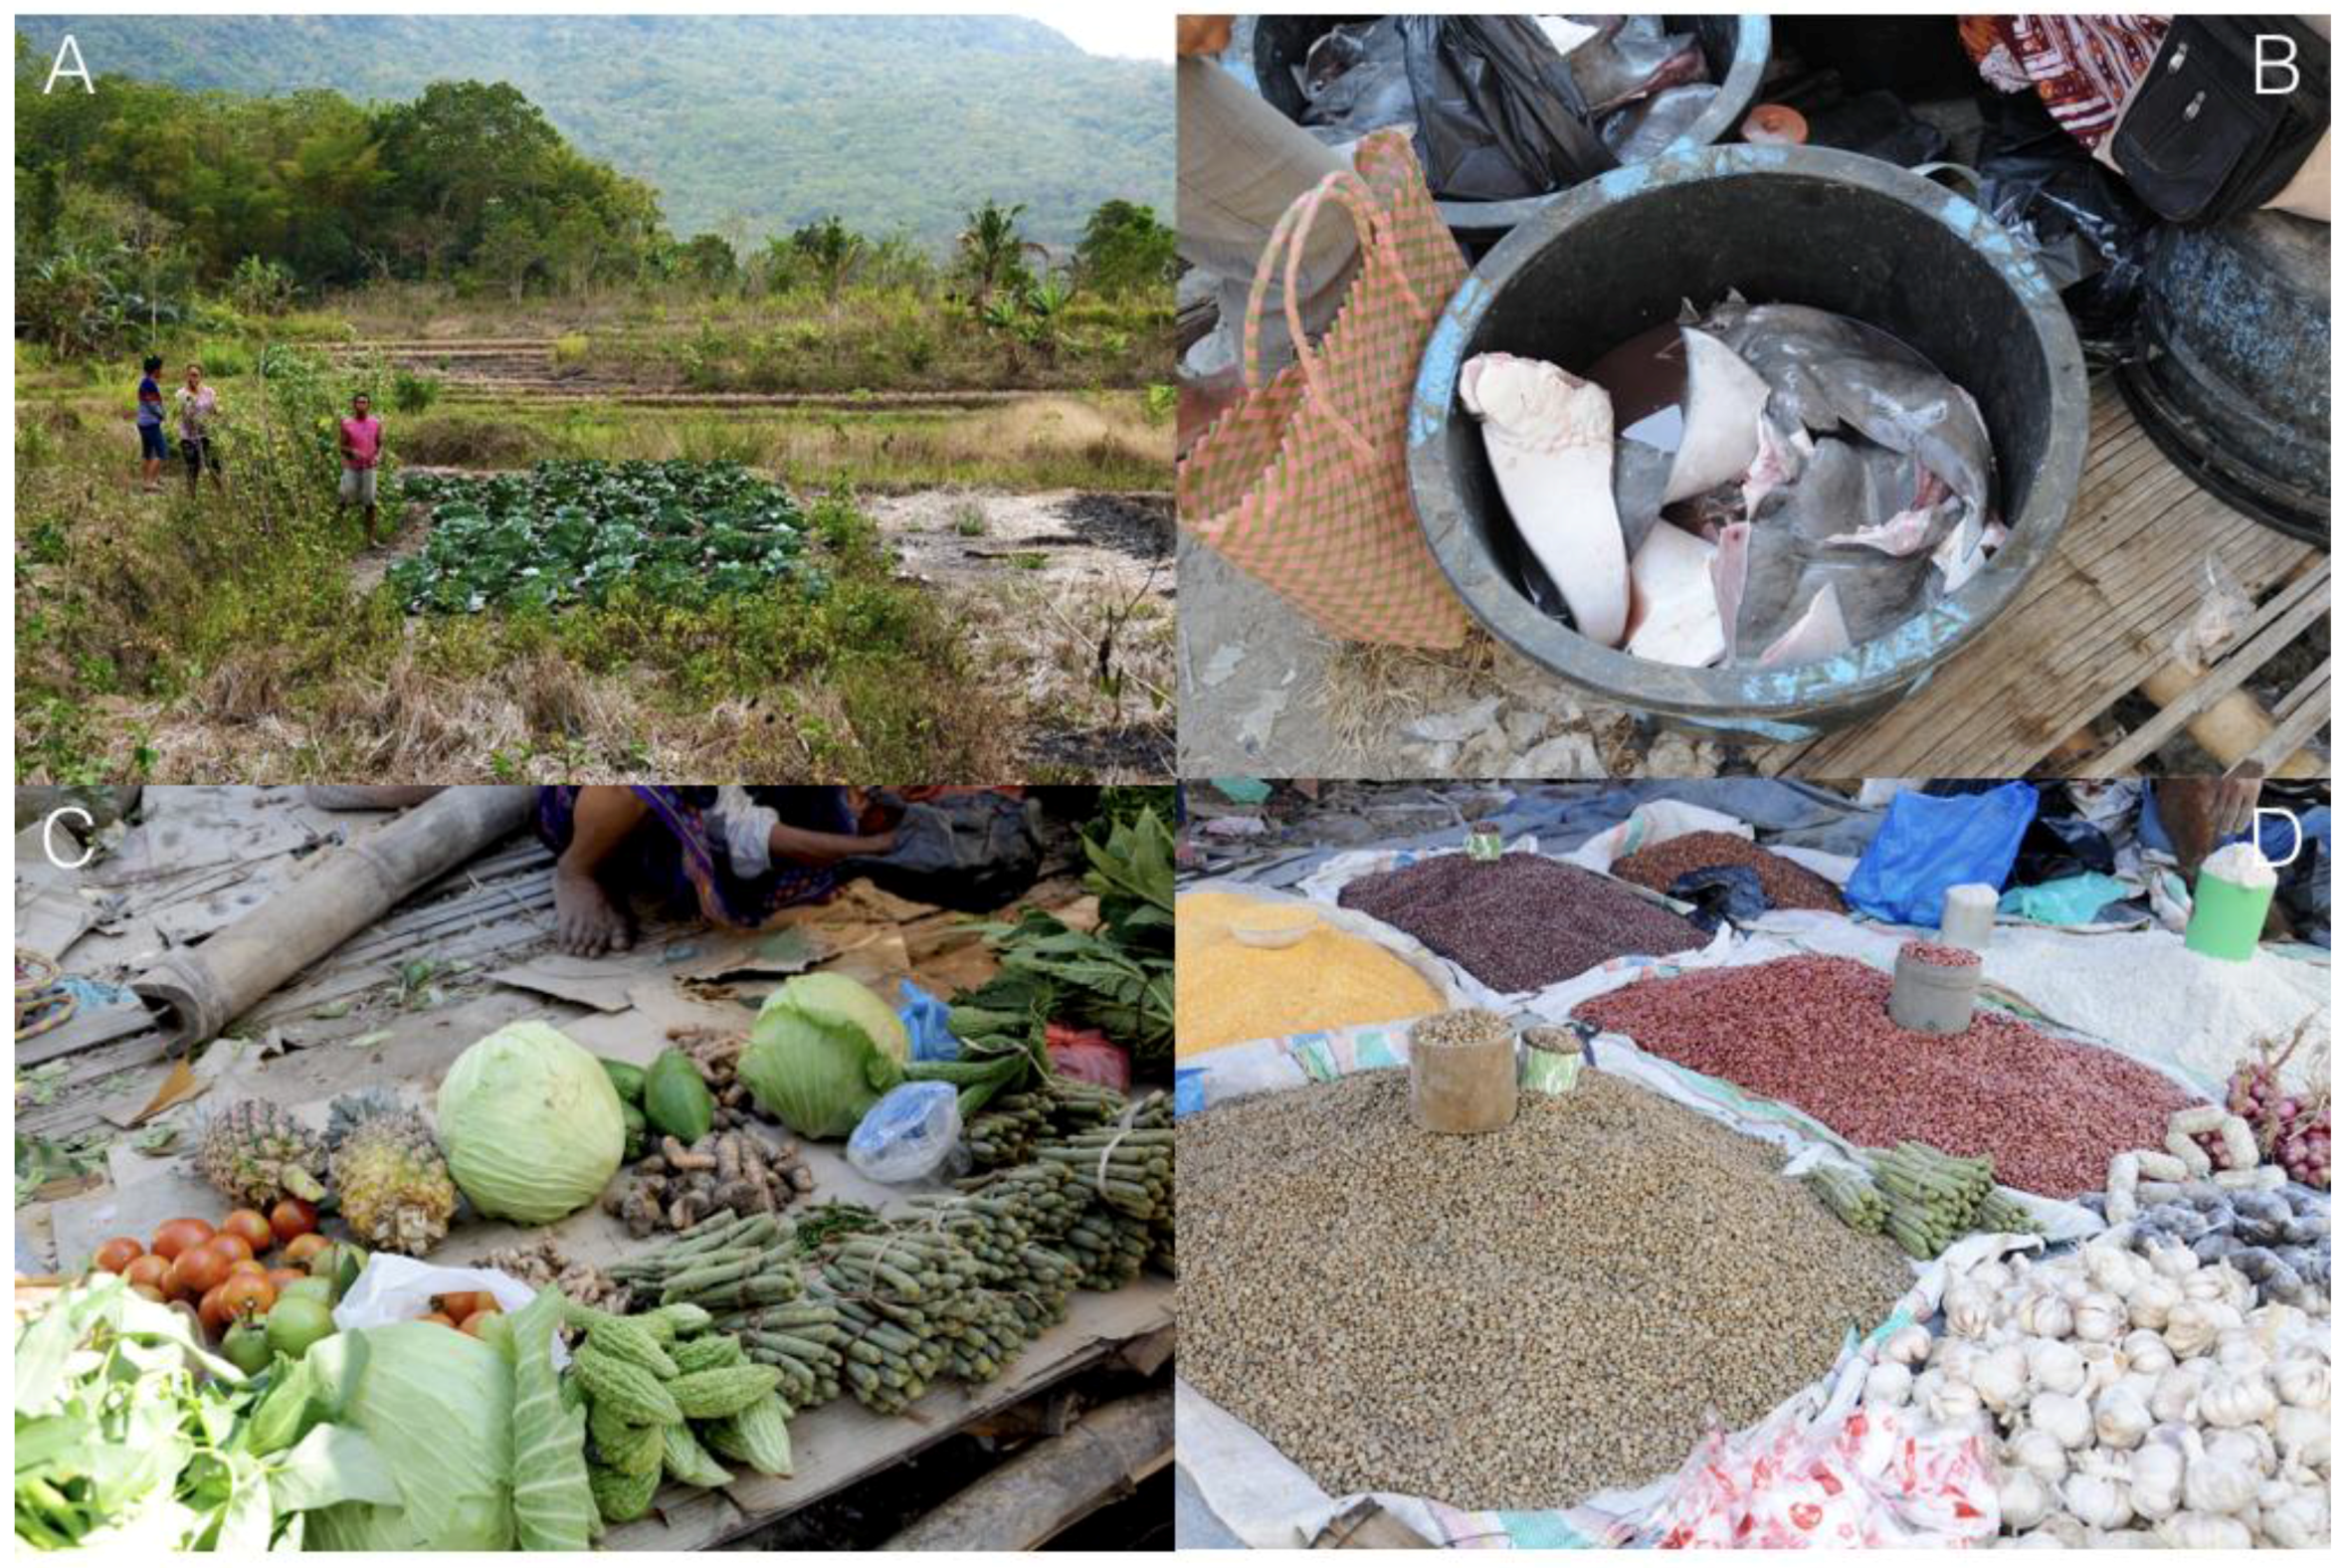
3.1. Observations of the Landscape

Households typically had three parcels of land dedicated to agriculture. Of these three parcels one is dedicated to irrigated rice (Sawa) and is approximately 600 m2. A ‘home garden’ is almost ubiquitous across all households, producing a variety of products. We recorded thirty varieties of fruits and vegetables during our fieldwork (Table A1). A small percentage of farmers—probably land poor—practice slash-and-burn rice agriculture, locally referred to as ladang and commonly referred to as swidden agriculture in the literature. Ladang rice agriculture is a rain-fed, annual, component of a household’s overall livelihood strategy. Crops besides rice are also grown in these areas. After one year the slashed area is usually abandoned. Small patches of ladang were seen on the middle and high slopes of forested areas above the Kemiri agroforests (see below). These areas were easy to recognise as the farmers were burning the area prior to planting. Ladang agriculture is not a dominant form of agriculture in Mbeliling suggesting that most households are producing or consuming enough food for their needs. Land tenure insecurity, and confusion about land ownership was a common theme encountered during discussions.
Agroforestry is now a widespread land-use in the landscape (Figure 2A). Kemiri, commonly known as Candlenut (Euphorbiaceae: Aleurites moluccana) is grown exclusively for cash and mostly exported to Surabaya. Kemiri is an ingredient in food and the oil is used in a variety of cosmetics and other products. Local people reported that they began planting Kemiri agroforests several decades ago and the landscape is in parts dominated by these tall agroforests that abut the forests on the steeper slopes of mountains. Kemiri was promoted by government and NGOs as a livelihood and development strategy to minimise swidden agriculture and reduce deforestation and degradation (Personal observation). Kemiri has been widely planted and appears to have reduced forest encroachment while providing a positive benefit to livelihoods. It also provides biodiversity benefits. Burung Indonesia have recorded numerous species of birds in the Kemiri agroforests including some endemics. Swidden agriculture is now rare in the landscape but still exists high on steep hills surrounding the paddy fields and above the Kemiri agroforest zone (solid line in Figure 2A). Discussions with local people indicated that they are no longer planting Kemiri despite it being a critical contributor to household income.
The workshop experts did not consider food security to be a problem in this landscape despite the government classifying Manggarai Barat as severely food insecure. However, experts and farmers appeared to consider food security in a single dimension: availability of rice. At the national scale, the government uses the World Food Programme’s definitions of food security that are based on multiple criteria. At the local scale food security was defined by whether households have sufficient supplies of rice for most meals throughout the day and the year.
The villages in the landscape are accessible by roads that are in poor condition. Despite the poor condition of the road there is a constant flow of food into the landscape. The Saturday morning market sells a diverse range of products: marine fish, pulses (brown and yellow lentils, mung beans), red and brown beans, and varieties of ready-made noodles (Figure 3C).
Bird tourism is a small part of the economy in Mbeliling. Burung Indonesia estimated that approximately 50 bird tourists visited the landscape in the previous twelve months. During the eight years of Burung Indonesia’s presence in the landscape they have observed most, if not all bird species, in the Kemiri agroforest and regrowth areas surrounding the Mbeliling protected forest—even the endemic iconic species that bird tourists have at the top of their checklists. The agroforestry areas are good for bird tourism and provide birdwatchers with many more opportunities to observe birds, compared to the much denser forests where observing birds is more difficult (Figure 2B). Greater scope for bird ecotourism exists given the extensive agroforests and natural forest remaining in the landscapes. Access by road and the remoteness of the landscape are barriers to increasing this income stream. The poor road quality is an impediment to accessing the landscape, but it may also be a barrier to expanded exploitation of natural resources in the area.
Households in Mbeliling do not appear to rely heavily on fuelwood for cooking. Food is cooked using mostly kerosene and gas (LPG). In 2007 the Indonesian government implemented a rapid energy transition policy focussed on reducing the use of kerosene and replacing it with LPG [42]. This programme was not implemented in NTT. The availability of alternative cooking fuel is likely to reduce impacts on forests.
Refrigeration is mostly absent from households in the landscape. Electricity infrastructure exists but does not supply electricity to many households. In the recent past a private company invested in infrastructure—poles, wires, and household meters—with the aim of supplying household electricity, using diesel powered generators. However, the project failed and individual households now generate electricity using small generators. Only a few households have electricity generators, using them mainly during the evening (approximately 6–9 pm).
Increased tourism activity in the coastal town of Labuan Bajo, the port of entry for the Komodo National Park, is providing economic opportunities for households in Manggarai Barat. A farmer co-operative has been established in Labuan Bajo, to sell agricultural products from Mbeliling. Typical products include coffee, honey, chilli and assortments of fruits and vegetables. The co-operative is trying to establish commercial relationships with hotels in Labuan Bajo so that they can sell their products directly to them. This may have unintended positive or negative impacts on local diets in the landscape: demand for tourist-friendly products may influence the diversity of products grown for local consumption.
Difficulty securing land tenure and unclear tenure and property rules were a common problem expressed during the workshop. Experts gave one example: households are reluctant to invest in agroforestry because of unclear property rights. The government allows people to plant trees on state land and harvest the products (e.g., fruits, rubber) but does not allow them to fell the trees. Furthermore, and more specifically related to Mbeliling, the government expanded the state-owned forest boundary after agroforests were established making it unclear whether or not households still have access to their investment, or whether it has become the property of the state. Unclear land tenure and property rights make it difficult for people to realise long-term pathways out of poverty. Insecure land tenure is thus a persistent problem that could be influencing behaviours that impact conservation and food production.

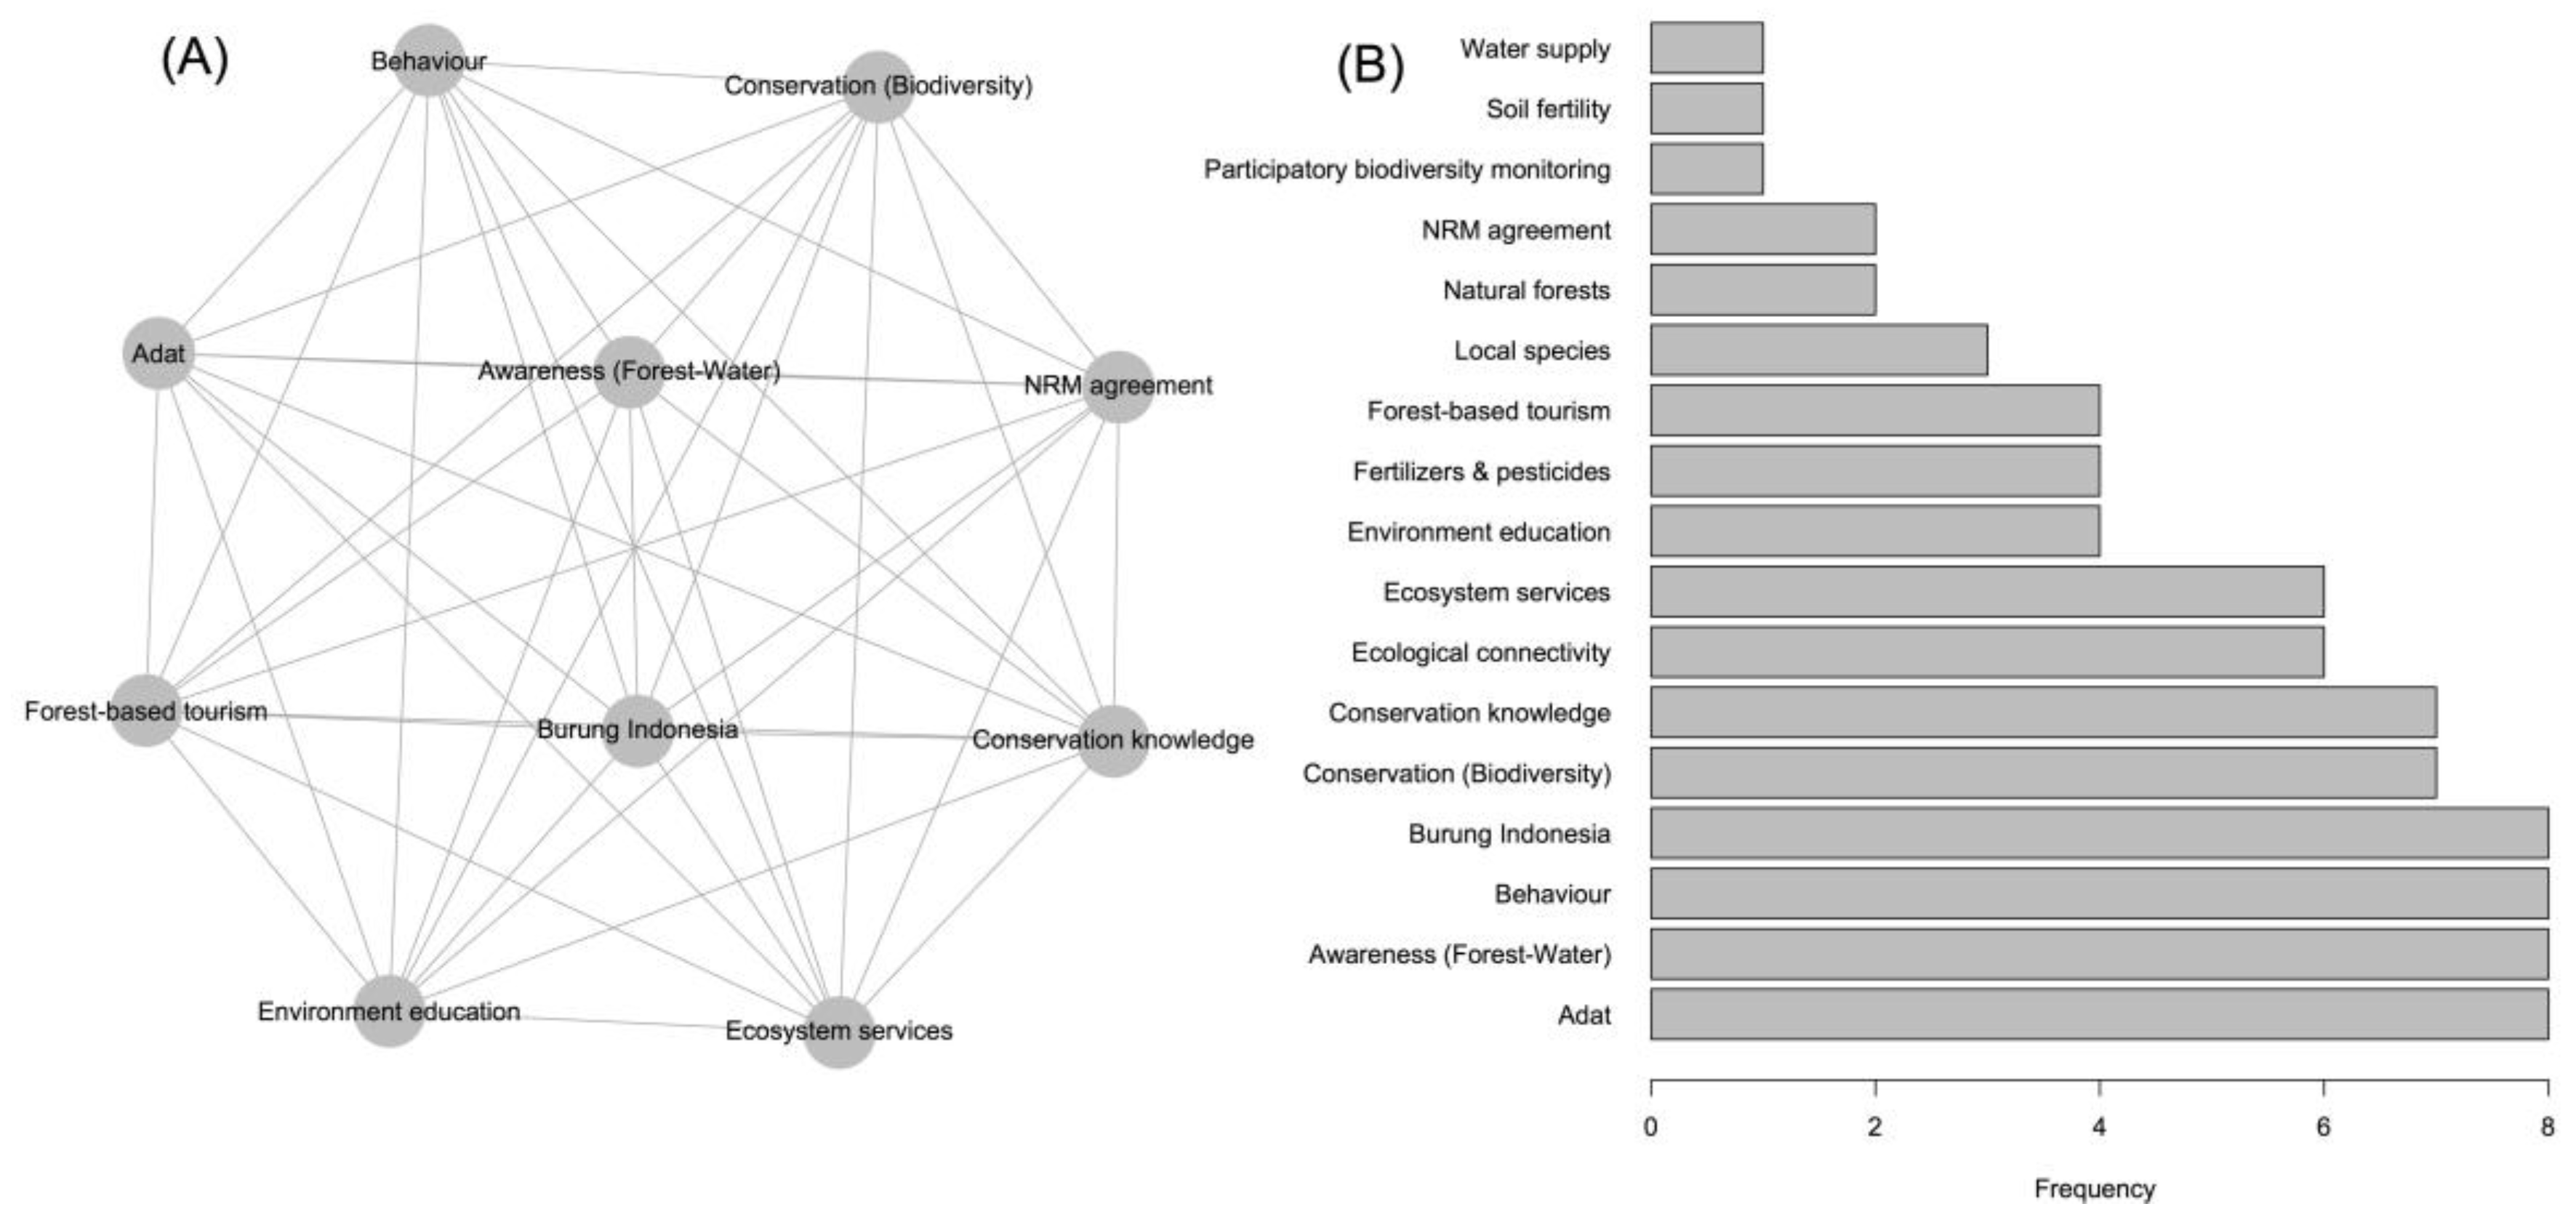
3.2. Network Properties

The network had 45 nodes and 499 edges. Nineteen nodes related to biodiversity conservation and 26 nodes related to food security (Table 1). The mean number of connections per node for the graph was 16.22 (SD = 8, variance = 64.13); for food security nodes the mean was 10.76 (SD = 4.05) and for biodiversity nodes it was 23.68 (SD = 5.67). The biodiversity nodes had on average 12.91 (SE = 1.149) more edges than nodes in the food security group (F1,43 = 79.47, p < 0.001, adjusted r-squared = 0.64). In terms of betweenness, biodiversity nodes were ranked consistently higher than food security nodes. The mean betweenness for the graph was 14.22 (SD = 17.35); for food security nodes the mean was 4.34 (SD = 4.80) and for biodiversity conservation nodes it was 27.73 (SD = 19.25; F1,43 = 44.18, p < 0.001, adjusted r-squared = 0.49).

3.3. Rank Importance of Nodes

Seven nodes represented 50% of the total betweenness of nodes, ranked as follows: (1) NRM agreement, (2) Burung Indonesia, (3) Behaviour, (4) Conservation (Biodiversity), (5) Water supply, (6) Environment education, and (7) Ecosystem services (Table 1). We identified eight maximal cliques within the network. An example of one of the maximal cliques is shown in Figure 4A. This clique contains ten nodes all of which are found in the ‘importance’ set except Adat (local laws, customs, and traditions), Forest-based tourism and Conservation knowledge. A subset of 17 nodes populated the eight cliques (Figure 4B). The nodes called NRM agreement, Environment education, Conservation (Biodiversity), and Burung Indonesia were included in all maximal cliques.

3.4. Clusters and System Properties

The simplified graph contained 45 nodes and 365 edges. The community detection analysis classified nodes into three clusters (modularity score = 0.14, Figure 5; Table 1). We named these three clusters of nodes ‘Modernisation and sustainable farming’, ‘Knowledge and management’, and ‘Governance and processes’. All three clusters had a mixture of a priori identified food security nodes and biodiversity conservation nodes. Two node names were classified as belonging to both food security and biodiversity, by the experts: Women’s empowerment and improved governance. This may reflect their importance to both issues.

3.4.1. Cluster 1: Modernisation and Sustainable Farming

This cluster of nodes characterised a modernised, more productive, and sustainable agricultural system. It emphasised a system that could produce a surplus of food from a diverse set of crops, boosting incomes and food security, while conserving and managing the natural capital in the landscape. This cluster described a diverse set of three capital asset groups:
  • Physical inputs (capital) for agricultural production and livelihoods: water, fertilizer, pesticides, agricultural equipment.
  • Natural capital that underpins production: ecosystem services, soil fertility, biodiversity.
  • Human capital (implicit) that facilitates better production while managing (minimizing) further environmental impact.
Experts provided context and examples that represented interactions between the nodes in this cluster. For example, participants discussed the need to increase yields to produce more food and generate more cash income but not at a greater cost to the environment and human health. They saw the need for more inputs but were concerned about the increased use of pesticides and fertilizers and their impact on biodiversity and human health. Experts also mentioned ‘intensification’ in conjunction with participatory biodiversity monitoring to ensure that farmers could improve their livelihoods but also take responsibility for sustainably managing the surrounding landscape. A node that was discussed repeatedly was the connection between the forest, water, and rice production—named ‘Awareness (forest-water)’ (Figure 2C, Table 1). The surrounding mountains and forests supply the irrigation system with water for growing rice. This system was constructed in the recent past using international donor money. This node of the cluster seems critical for food production (rice and other crops) throughout the year. The importance of this infrastructure was recognized as was the need to maintain tree cover to supply water to the landscape, and the city of Labuan Bajo.

3.4.2. Cluster 2: Knowledge and Management

This cluster of nodes characterises the associations between knowledge, natural assets, improved production and conservation systems (e.g., agronomy and ecological connectivity) through a landscape-scale natural resource management agreement negotiated by Burung Indonesia. Several nodes of biodiversity conservation are included: NRM agreement, ecological connectivity, natural forests, local species, environment education (sic), and conservation knowledge. Expert discussions emphasised the need to change practices through the use of traditional and new knowledge: improving agronomy, diversifying production, educating farmers, and maintaining key assets, or system attributes, that support biodiversity. These themes were discussed in the context of Burung Indonesia’s implementation of a long-term natural resource management plan with the cooperation of dozens of households across 27 villages (Burung Indonesia project report). Education and knowledge were also mentioned as crucial nodes, embedded within the natural resource management plan, with respect to educating farmers about the need to conserve forests in order to maintain the critical source of water for rice production. This example was one of many that discussed interactions between nodes both within and between clusters, in this case Awareness (Forest-Water) with inter alia NRM agreement.

3.4.3. Cluster 3: Governance and Processes

This cluster contains nodes that describe governance, social and physical infrastructure, behaviour change and empowerment, and institutions that could support improved livelihoods, food security and biodiversity conservation. A common issue raised during the discussion was the lack of clear land tenure and rules governing farmers and the need for institutional support for local economic growth opportunities. Representatives of Burung Indonesia discussed their efforts to help local people to diversify their livelihoods, improving their incomes, leading to increasing food security and less pressure on forests by expanding agriculture. Nodes described empowering women, finance, creating business plans, improving livestock production, and implementing food storage to keep surplus production. Underpinning these nodes are roads, better governance, land tenure, and markets: these are what we consider to be enabling system properties.

3.5. Implications and Future Priorities

Properly addressing the dual challenge of increasing food security and conserving biodiversity will require researchers, practitioners and local people to embrace complexity and diversity. The food-biodiversity discourse often neglects complexity in favour of reductionism. Our place-based analysis of the Mbelliling landscape has shown just how complex the food-biodiversity nexus can be. Our analysis also shows, more importantly, that there are nodes within the nexus—apart from intensified agriculture and protecting land for biodiversity—that could improve the system: nodes that lack attention in the dominant academic discourse but are important for local stakeholders. These nodes represent the multiple dimensions of people’s needs and the difficult task of managing landscapes where there are multiple, often competing, objectives [43,44]. The emphasis on nodes and system properties beyond production and protection demonstrates to some degree the level of disconnect between ‘global’ narratives and local realities. In order to effect long-lasting improvements that are socially and economically just, old paradigms must be replaced with more holistic, inclusive, and multifaceted approaches [44]. Land management systems such as land sparing and land sharing play to the fallacy of simplified win-win outcomes that are largely unfounded in the literature [43]. More recently, the landscape approach has been advocated by researchers and international agencies as one possible way to navigate the food-biodiversity nexus but at present lacks rigorous assessment of the outcomes, particularly with respect to implementation and reporting of outcomes for livelihoods and biodiversity [44,45]. Nevertheless, it provides a useful framework for moving beyond paradigms that optimise some dimensions of social-ecological systems at the expense of others, often with negative outcomes for people and nature.
Our network analysis was congruent in some respects with the academic food-biodiversity discourse. Cluster one focussed on agriculture and improving production sensu ‘sustainable intensification’ [46]. Cluster two focussed on improving the nodes of the natural system, but in a relatively holistic fashion by trying to harmonise natural asset protection with agriculture. Cluster three—perhaps the most important—identified institutions, infrastructure, and processes as important nodes that we suggest would enable the system to improve along its technical and biophysical dimensions [9]. We suggest that this last cluster of nodes (including knowledge, infrastructure, ‘social capital’, gender) describes most parsimoniously the set of system properties that determine food security and biodiversity in this landscape: a combination of natural assets and processes of production, coupled with the knowledge to implement strategies that provide better outcomes for agriculture (i.e., Improved agronomy, diversification of agriculture, NRM agreement) and biodiversity conservation (i.e., Conservation knowledge, environmental education, local species, natural forests, ecological connectivity). In essence this cluster represents a set of nodes that are beneficial for both food security and biodiversity conservation. A combination of physical capital and human capital is positively associated with system properties that enhance the food-biodiversity nexus. This supports the findings of a recent analysis that suggests that social-ecological systems of ‘win-win’ landscapes are composed of strong social capital and enabling infrastructure [20].

4. Conclusions

We used a social-ecological systems perspective, applied at the landscape scale, to identify system properties that benefit the harmonization of food security and biodiversity conservation. Using a novel network approach, we showed that addressing the food-biodiversity nexus in our case study landscape will require simultaneous action on three main themes: (1) Modernisation and sustainable farming; (2) Knowledge and management; and (3) Governance and processes. The third theme, representing nodes of governance, institutions and processes appears particularly important. Outside West Flores, we hope our approach highlights the need to look beyond simple framings, and offers preliminary insights of key system properties that are important to link successfully food security and biodiversity conservation in both theory and practice.

Acknowledgments

We thank the workshop participants, especially the staff of Burung Indonesia, Terry Sunderland, The Centre for International Forestry Research (CIFOR), James Langston and Rebecca Riggs. This project was made possible through a European Research Council Consolidator Grant awarded to Joern Fischer.

Author Contributions

N.F.C., J.H., D.A. and J.F. conceived and designed the research; N.F.C, J.S. and A.K.B. collected the data; N.F.C. analyzed the data; N.F.C. wrote the paper which received substantial review, input and improvement from all authors.

Conflicts of Interest

The authors declare no conflict of interest. The founding sponsors had no role in the design of the study; in the collection, analyses, or interpretation of data; in the writing of the manuscript, and in the decision to publish the results.

Nomenclature

NodeA node is one of two basic building blocks of networks, the other being an edge. Nodes ‘element’ in a network and can represent anything: physical objects, ideas, processes. A node can be connected to one or more other nodes, or it can be isolated from all other nodes in the network.
EdgeA connection between two nodes in a network.
ComponentOne or more nodes connected to each other but not connected to one or more other components. An isolated sub-group of one or more connected nodes.
CommunityA group of nodes in a network that are more connected to each other than to other nodes, or communities of nodes, in the network.
NetworkA set of nodes and edges defined as G = (V, E) where G is the network or graph, V are the nodes or vertices, and E are the set of edges joining nodes within the network.
CliqueA clique is a subgraph of a larger graph (G). A maximal clique is a clique that cannot be extended by including adjacent nodes [47].
System propertiesA set of one or more nodes of a system that affect its dynamics and performance. System properties, their interactions with each other, and their magnitude can affect the performance of the system.

Appendix A

Table A1. Food crops grown in the study landscape.
Common NameScientific Name
SoursopAnnona muricata
Star appleChrysophyllum cainito
RambutanNephelium lappaceum
LanganDimocarpus longan
CucumberMomordica charantia
FernsUnknown
CocaoTheobroma cacao
PapayaCarica papaya
RiceOryza
MangoMangifera
TomatoSolanum
ChilliCapsicum
CoffeeCoffea arabica
ClovesSyzygium aromaticum
Sweet potatoIpomoea batatas
‘Hairy’ yamDioscorea
PumpkinCucurbita
CabbageBrassica oleracea
Candle nutAleurites moluccana
MahoganySwietenia macrophylla
BananaMusa
CarrotDaucus carota
CasavaManihot esculenta
‘Green’ bananaMusa
TaroColocasia
BroccoliBrassica oleracea
SpinachSpinacia
PineappleAnanas comosus
CoconutCocos nucifera
WombokBrassica rapa
Snake beanVigna unguiculata
CashewAnacardium occidentale

References

  1. United Nations Sustainable Development Goals. Available online: http://www.un.org/sustainabledevelopment/sustainable-development-goals/ (accessed on 1 January 2016).
  2. United Nations Strategic Plan for Biodiversity 2011–2020, Including Aichi Biodiversity Targets. Available online: https://www.cbd.int/sp/targets/ (accessed on 1 January 2016).
  3. Fischer, J.; Brosi, B.; Daily, G.C.; Ehrlich, P.R.; Goldman, R.; Goldstein, J.; Lindenmayer, D.B.; Manning, A.D.; Mooney, H.A.; Pejchar, L.; et al. Should agricultural policies encourage land sparing or wildlife-friendly farming? Front. Ecol. Environ. 2008. [Google Scholar] [CrossRef]
  4. Fischer, J.; Abson, D.J.; Bergsten, A.; French Collier, N.; Dorresteijn, I.; Hanspach, J.; Hylander, K.; Schultner, J.; Senbeta, F. Reframing the Food-Biodiversity Challenge. Trends Ecol. Evol. 2017, 32, 335–345. [Google Scholar] [CrossRef] [PubMed]
  5. Perfecto, I.; Vandermeer, J. The agroecological matrix as alternative to the land-sparing/agriculture intensification model. Proc. Natl. Acad. Sci. USA 2010, 107, 5786–5791. [Google Scholar] [CrossRef] [PubMed]
  6. Chappell, M.J.; LaValle, L.A. Food security and biodiversity: Can we have both? An agroecological analysis. Agric. Hum. Values 2011, 28, 3–26. [Google Scholar] [CrossRef]
  7. Phalan, B.; Onial, M.; Balmford, A.; Green, R.E. Reconciling food production and biodiversity conservation: Land sharing and land sparing compared. Science 2011, 333, 1289–1291. [Google Scholar] [CrossRef] [PubMed]
  8. Kremen, C.; Iles, A.; Bacon, C. Diversified farming systems: An agroecological, systems-based alternative to modern industrial agriculture. Ecol. Soc. 2012, 17. [Google Scholar] [CrossRef]
  9. Glamann, J.; Hanspach, J.; Abson, D.J.; Collier, N.; Fischer, J. The intersection of food security and biodiversity conservation: A review. Reg. Environ. Chang. 2015. [Google Scholar] [CrossRef]
  10. Green, R.E. Farming and the Fate of Wild Nature. Science 2005, 307, 550–555. [Google Scholar] [CrossRef] [PubMed]
  11. Foley, J.A.; Ramankutty, N.; Brauman, K.A.; Cassidy, E.S.; Gerber, J.S.; Johnston, M.; Mueller, N.D.; O’Connell, C.; Ray, D.K.; West, P.C.; et al. Solutions for a cultivated planet. Nature 2011, 478, 337–342. [Google Scholar] [CrossRef] [PubMed]
  12. Garnett, T.; Appleby, M.C.; Balmford, A.; Bateman, I.J.; Benton, T.G.; Bloomer, P.; Burlingame, B.; Dawkins, M.; Dolan, L.; Fraser, D.; et al. Sustainable Intensification in Agriculture: Premises and Policies. Science 2013, 341, 33–34. [Google Scholar] [CrossRef] [PubMed] [Green Version]
  13. Sayer, J.; Cassman, K. Agricultural Innovation to Protect the Environment. PNAS 2013, 110, 8345–8348. [Google Scholar] [CrossRef] [PubMed]
  14. Godfray, H.C.J.; Garnett, T. Food security and sustainable intensification Food security and sustainable intensification. Philos. Trans. R. Soc. 2014, 369, 1–10. [Google Scholar] [CrossRef] [PubMed]
  15. Altieri, M.A.; Funes-Monzote, F.R.; Petersen, P. Agroecologically efficient agricultural systems for smallholder farmers: Contribution to food sovereignty. Agron. Sustain. Dev. 2011, 32, 1–13. [Google Scholar] [CrossRef]
  16. Chappell, M.J.; Wittman, H.; Bacon, C.M.; Ferguson, B.G.; Barrios, L.G.; Barrios, R.G.; Jaffee, D.; Lima, J.; Méndez, V.E.; Morales, H.; et al. Food sovereignty: An alternative paradigm for poverty reduction and biodiversity conservation in Latin America. F1000Research 2013, 2, 235. [Google Scholar] [CrossRef] [PubMed]
  17. Chambers, R. Rural Development: Putting the Last First; Longman Inc.: Essex, UK, 1983. [Google Scholar]
  18. Chambers, R. Poverty and Livelihoods: Whose Reality Counts. Environ. Urban. 1992, 7, 173–204. [Google Scholar] [CrossRef]
  19. Sunderlin, W.D.; Belcher, B.; Santoso, L.; Angelsen, A.; Burgers, P.; Nasi, R.; Wunder, S. Livelihoods, forests, and conservation in developing countries: An overview. World Dev. 2005, 33, 1383–1402. [Google Scholar] [CrossRef]
  20. Hanspach, J.; Abson, D.J.; French Collier, N.; Dorresteijn, I.; Schultner, J.; Fischer, J. From trade-offs to synergies in food security and biodiversity conservation. Front. Ecol. Environ. 2017, 15. [Google Scholar] [CrossRef]
  21. Barbier, E.B. Cash crops, food crops, and sustainability: The case of Indonesia. World Dev. 1989, 17, 879–895. [Google Scholar] [CrossRef]
  22. Neilson, J.; Wright, J. The state and food security discourses of Indonesia: Feeding the bangsa. Geogr. Res. 2017, 131–143. [Google Scholar] [CrossRef]
  23. Timmer, C.P. The Political Economy of Rice in Asia: Indonesia; Stanford University Food Research Institute, Food Research Institute Study: Stanford, CA, USA, 1975; Volume 14. [Google Scholar]
  24. OECD. OECD Review of Agricultural Policies: Indonesia; OECD Publishing: Paris, France, 2012; Available online: http://dx.doi.org/10.1787/9789264179011-en (accessed on 1 March 2018).
  25. World Food Programme. Food Security and Vulnerability Atlas of Indonesia; World Food Programme: Rome, Italy, 2015. [Google Scholar]
  26. Food and Agriculture Organisation. Food Balance Data Sheets. Available online: http://ref.data.fao.org/dataset?entryId=48dc9161-53e2-4883-93c0-8f099e5e67ab (accessed on 20 July 2001).
  27. Murray, J.P.; Grenyer, R.; Wunder, S.; Raes, N.; Jones, J.P.G. Spatial patterns of carbon, biodiversity, deforestation threat, and REDD+ projects in Indonesia. Conserv. Biol. 2015, 29, 1434–1445. [Google Scholar] [CrossRef] [PubMed]
  28. Abood, S.A.; Lee, J.S.H.; Burivalova, Z.; Garcia-Ulloa, J.; Koh, L.P. Relative Contributions of the Logging, Fiber, Oil Palm, and Mining Industries to Forest Loss in Indonesia. Conserv. Lett. 2015, 8, 58–67. [Google Scholar] [CrossRef]
  29. Curran, L.M.; Trigg, S.N.; McDonald, A.K.; Astiani, D.; Hardiono, Y.M.; Siregar, P.; Caniago, I.; Kasischke, E. Lowland forest loss in protected areas of Indonesian Borneo. Science 1999, 286, 2184–2188. [Google Scholar] [CrossRef] [PubMed]
  30. Margono, B.A.; Turubanova, S.; Zhuravleva, I.; Potapov, P.; Tyukavina, A.; Baccini, A.; Goetz, S.; Hansen, M.C. Mapping and monitoring deforestation and forest degradation in Sumatra (Indonesia) using Landsat time series data sets from 1990 to 2010. Environ. Res. Lett. 2012, 7, 34010. [Google Scholar] [CrossRef]
  31. Sodhi, N.S.; Koh, L.P.; Brook, B.W.; Ng, P.K.L. Southeast Asian biodiversity: An impending disaster. Trends Ecol. Evol. 2004, 19, 654–660. [Google Scholar] [CrossRef] [PubMed]
  32. Sumner, A.; Edward, P. Assessing Poverty Trends in Indonesia by International Poverty Lines. Bull. Indones. Econ. Stud. 2014, 50, 207–225. [Google Scholar] [CrossRef]
  33. Ministry of Health. National Report on Basic Health Research RISKESDAS, 2013; Ministry of Health: Jakarta, Indonesia, 2014.
  34. Holt, B.G.; Lessard, J.-P.; Borregaard, M.K.; Fritz, S.A.; Araujo, M.B.; Dimitrov, D.; Fabre, P.-H.; Graham, C.H.; Graves, G.R.; Jonsson, K.A.; et al. Response to Comment on “An Update of Wallace’s Zoogeographic Regions of the World.”. Science 2013, 341. [Google Scholar] [CrossRef] [PubMed]
  35. Butchart, S.; Brooks, T.; Davies, C.; Dharmaputra, G.; Dutson, G.; Lowen, J.; Sahu, A. The conservation status of birds on Flores and Sumbawa, Indonesia. Conserv. Int. 1996, 6, 335–370. [Google Scholar] [CrossRef]
  36. Hutchinson, R.; Eaton, J.; Demeulemeester, B.; Rheindt, F.E. Observations of Flores Scops Owl Otus alfredi on Flores, Indonesia, with a first description of its vocalisations. Forktail 2007, 23, 184–187. [Google Scholar]
  37. Birdlife International IUCN Red List for Birds. Available online: http://datazone.birdlife.org/home (accessed on 1 March 2017).
  38. Food and Agriculture Organization (FAO). The State of Food Insecurity in the World 2001; Food and Agriculture Organization: Rome, Italy, 2002. [Google Scholar]
  39. R Core Team. R: A Language and Environment for Statistical Computing. Available online: https://www.R-project.org/ (accessed on 1 March 2017).
  40. Csardi, G.; Nepusz, T. The igraph software package for complex network research, 2006. Int. J. Complex Syst. 2006, 1695, 1–9. [Google Scholar]
  41. Clauset, A.; Newman, M.E.; Moore, C. Finding community structure in very large networks. Phys. Rev. E 2004, 70, 66111. [Google Scholar] [CrossRef] [PubMed]
  42. Budya, H.; Yasir Arofat, M. Providing cleaner energy access in Indonesia through the megaproject of kerosene conversion to LPG. Energy Policy 2011, 39, 7575–7586. [Google Scholar] [CrossRef]
  43. Sayer, J.; Campbell, B.M. The Science of Sustainable Development: Local Livelihoods and the Global Environment; Cambridge University Press: Cambridge, UK, 2004. [Google Scholar]
  44. Sayer, J.; Sunderland, T.; Ghazoul, J.; Pfund, J.-L.; Sheil, D.; Meijaard, E.; Venter, M.; Boedhihartono, A.K.; Day, M.; Garcia, C.; et al. Ten principles for a landscape approach to reconciling agriculture, conservation, and other competing land uses. Proc. Natl. Acad. Sci. USA 2013, 110, 8349–8356. [Google Scholar] [CrossRef] [PubMed]
  45. Reed, J.; Van Vianen, J.; Deakin, E.L.; Barlow, J.; Sunderland, T. Integrated landscape approaches to managing social and environmental issues in the tropics: Learning from the past to guide the future. Glob. Chang. Biol. 2016, 22, 2540–2554. [Google Scholar] [CrossRef] [PubMed]
  46. Pretty, J.N. The sustainable intensification of agriculture. Nat. Resour. Forum 1997, 21, 247–256. [Google Scholar] [CrossRef]
  47. Harary, F. Graph Theory, 1st ed.; Addison-Wesley Publishing Company: Reading, UK, 1969. [Google Scholar]
Figure 1. (A) A map of Indonesia, (B) A map of the Tengara Timur province West Flores, Indonesia. Inset picture of the landscape in West Flores represents the landscape we called Mbeliling.
Land 07 00039 g001
Figure 2. The landscape of Manggarai Barat. (A) Forested hillsides showing the boundary between the candlenut (Aleurites moluccana) agroforest and primary forest on steeper slopes. In the foreground are rice fields and a small fire burning crop residue; (B) A kemiri agroforest and mixed cropping gardens—home gardens—surround the rice fields; (C) an irrigation canal which the brings water from a small dam in the mountains to the rice fields in the valley; (D) irrigated rice fields and mixed production forest and homegardens (right).
Land 07 00039 g002
Figure 3. (A) A vegetable field in the foreground surrounded by paddy fields. This vegetable field is in a rain fed rice field. During the rainy season it will be used for rice cultivation. (BD) Typical food items for sale at the local market held on Saturday; (B) shark fin; (C) vegetables and fruits; (D) pulses. Most of the items in (D) are imported from outside the landscape: garlic, red beans, brown beans, shallots (small red onions), palm sugar, brown and yellow lentils.
Land 07 00039 g003
Figure 4. (A) One representation of a maximal clique in the Mbeliling network. The network had eight maximal cliques each containing ten nodes. Every node in the largest clique is connected to all other nodes. (B) Frequency of each node occurring in the largest cliques.
Land 07 00039 g004
Figure 5. The Mbeliling food security and biodiversity conservation nexus network represented as a dendrogram. The dendrogram shows the node names at the tips of the branches of the ‘tree’. The relationships between nodes are represented by the distances between them. The nodes are classified into clusters based on the fastgreedy algorithm, and shown as different coloured branches. (1) Modernisation and sustainable farming; (2) Knowledge and management; and (3) Governance and processes.
Land 07 00039 g005
Table 1. Nodes of the Mbeliling landscape food security and biodiversity conservation nexus. Each node has a name and a short description of the node theme. The shaded rows represent the nodes whose cumulative betweenness sums to 50% of the total betweenness. ‘D’ is the degree for each node; ‘BW’ the betweenness value for each node; ‘Cluster’ is the cluster group that each node belongs to; ‘Cum. Sum. Betweenness’ is the cumulative sum of the betweenness of the nodes, ranked by their individual betweenness values.
Node Name and DescriptionDBWClusterCum. Sum Betweenness
NRM (Natural Resource Management) agreement: a multi-village landscape management agreement, brokered by Burung Indonesia, focussed on both biodiversity conservation and agriculture.3463.64163.64
Burung Indonesia: bird conservation group affiliated with Birdlife International.3263.242126.88
Behaviour: farmer and household behaviour towards land management, forests, and biodiversity.2943.662177.10
Conservation (Biodiversity): the conservation of landscape biodiversity2722.383220.77
Water supply: water, captured by the forest and used for agriculture and domestic consumption.2524.723264.39
Environment education: providing knowledge to local peoples about the value of nature including provisioning ecosystem services.2520.671305.77
Ecosystem services: the various provisioning, regulating, supporting and cultural services in the landscape.2641.383344.99
Awareness (Forest-Water): increasing the awareness of individuals about the importance of forest cover for water supply.2850.223377.75
Poverty reduction: reducing poverty increases food security and reduces pressure on natural resources and biodiversity.2739.222402.47
Adat: Local behaviours, rules, and institutions.2743.622424.85
Women empowerment: increasing women’s ability to secure improved livelihoods so that they can benefit from system improvements.2432.762445.52
Forest-based tourism: using the forest to generate non-extractive income.2215.912463.79
Diverse agroforestry: Maintaining candlenut agroforestry and investing in new types of (agro)forestry.2013.263480.00
Participatory biodiversity monitoring: villages participate in monitoring biodiversity in the landscape.2116.213495.91
Improved governance: includes important issues like land tenure reform and more transparent governance of forests.2013.662509.57
Diversification: increasing the diversity of agricultural production1911.421522.83
Conservation knowledge: local and other knowledge that contributes to conservation of biodiversity.198.591534.35
Markets: better access to markets outside of the landscape, especially Labuan Bajo.1511.522545.77
Roads: better roads within the landscape and linking the landscape to markets.1610.342556.19
Education: Improving the level of formal and informal education of people in the landscape.165.902566.53
Intensification: sensu ‘sustainable intensification of agriculture’ (Garnett and Godfray 2012): the increase in agricultural output per unit area of land, using sustainable approaches.167.243576.15
Increasing productivity: increasing yield per hectare.1818.273584.74
Local species: Local and endemic species contributing to biodiversity value.154.141593.27
Natural forests: Forest not logged or degraded by human use, usually higher on the mountains and slopes.178.531600.51
Diet change: reducing dependence on rice and adopting a more diverse diet.101.502606.41
Value adding: producing and processing agricultural products with more value than the raw product e.g., roasting and marketing coffee instead of selling the raw beans.1310.432612.27
Water irrigation: the water used for irrigating rice crops.132.003616.41
Livestock: animals used for food, work, and as a store of financial capital.102.732619.73
Soil fertility: maintaining soil fertility and minimising negative impacts of fertilizers and biocides.131.253622.47
Microfinance: providing small loans for local businesses and households.109.622624.73
Ag. Equipment: equipment used, and needed, for agriculture.105.863626.73
Traditional knowledge: local people’s knowledge and management of natural resources, including knowledge of agrobiodiversity, farming systems, and biodiversity.101.381628.37
Population growth: the rate of human population growth, most recently estimated at ~3%81.271629.95
Women empowerment: increasing women’s ability to secure improved livelihoods so that they can benefit from system improvements.91.642631.45
Land ownership: providing land ownership/use certificates for households.81.132632.83
Better food storage: infrastructure to store food, minimising waste and increasing food utilisation.60.142634.10
Improved governance: includes important issues like land tenure reform and more transparent governance of forests.90.482635.35
Fertilizers and pesticides: the use of fertilizers and pesticides to produce food, increase and maintain yields.123.333636.53
Local food consumption: maintaining and improving local food consumption coupled with diversifying diets.82.262637.66
Ecological connectivity: maintaining habitat connectivity to conserve species.121.181638.64
Home garden: the production of food in home gardens. Usually fruits, vegetables and spices.61.583639.12
Improved agronomy: increasing yields and minimising biodiversity impacts through improved farming systems.70.261639.40
Irrigation efficiency: Maintaining and increasing the efficiency of the rice irrigation system, through technical and management approaches.80.203639.66
Cash crops: provide cash income to purchase food not grown locally. An important livelihood component.70.983639.86
Business plan: facilitating—through Burung Indonesia—households and villages to develop business plans focussed on agriculture and other economic opportunities like bird tourism and homestay accommodation.30.282640.00

