Monitoring and Analysing Land Use/Cover Changes in an Arid Region Based on Multi-Satellite Data: The Kashgar Region, Northwest China

Abstract
:1. Introduction
2. Materials and Methods
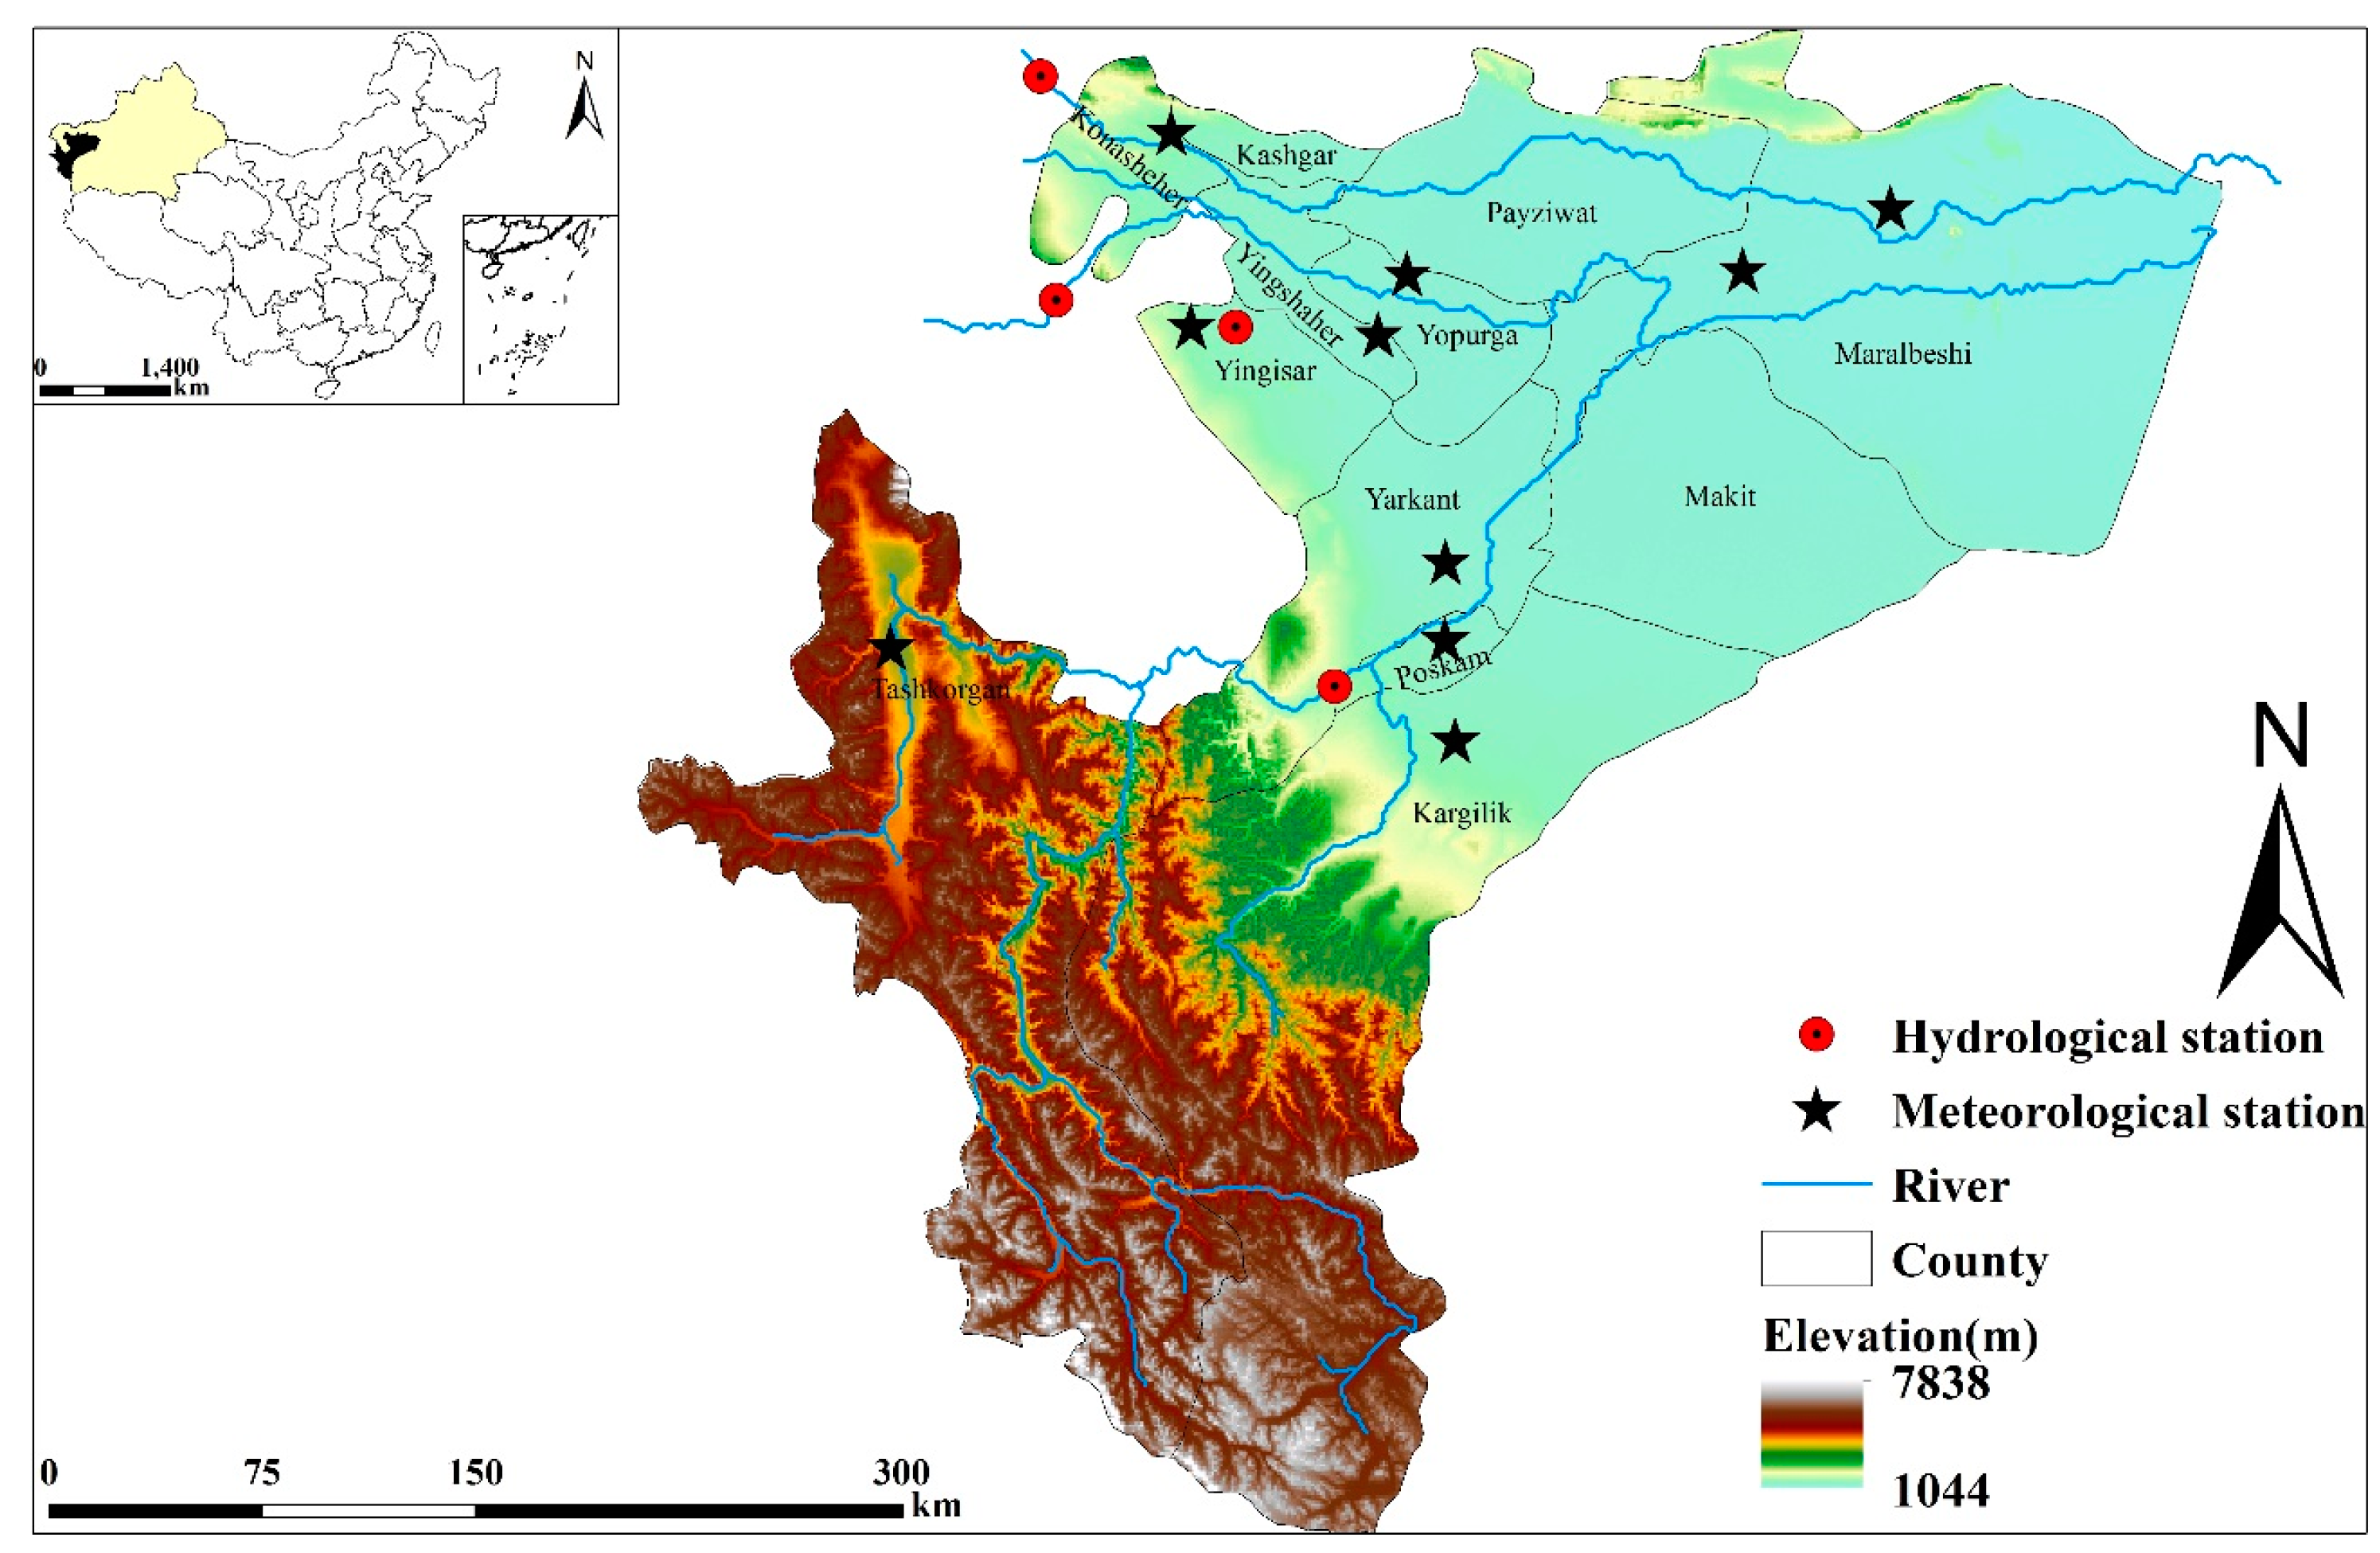
2.1. Study Area
2.2. Data
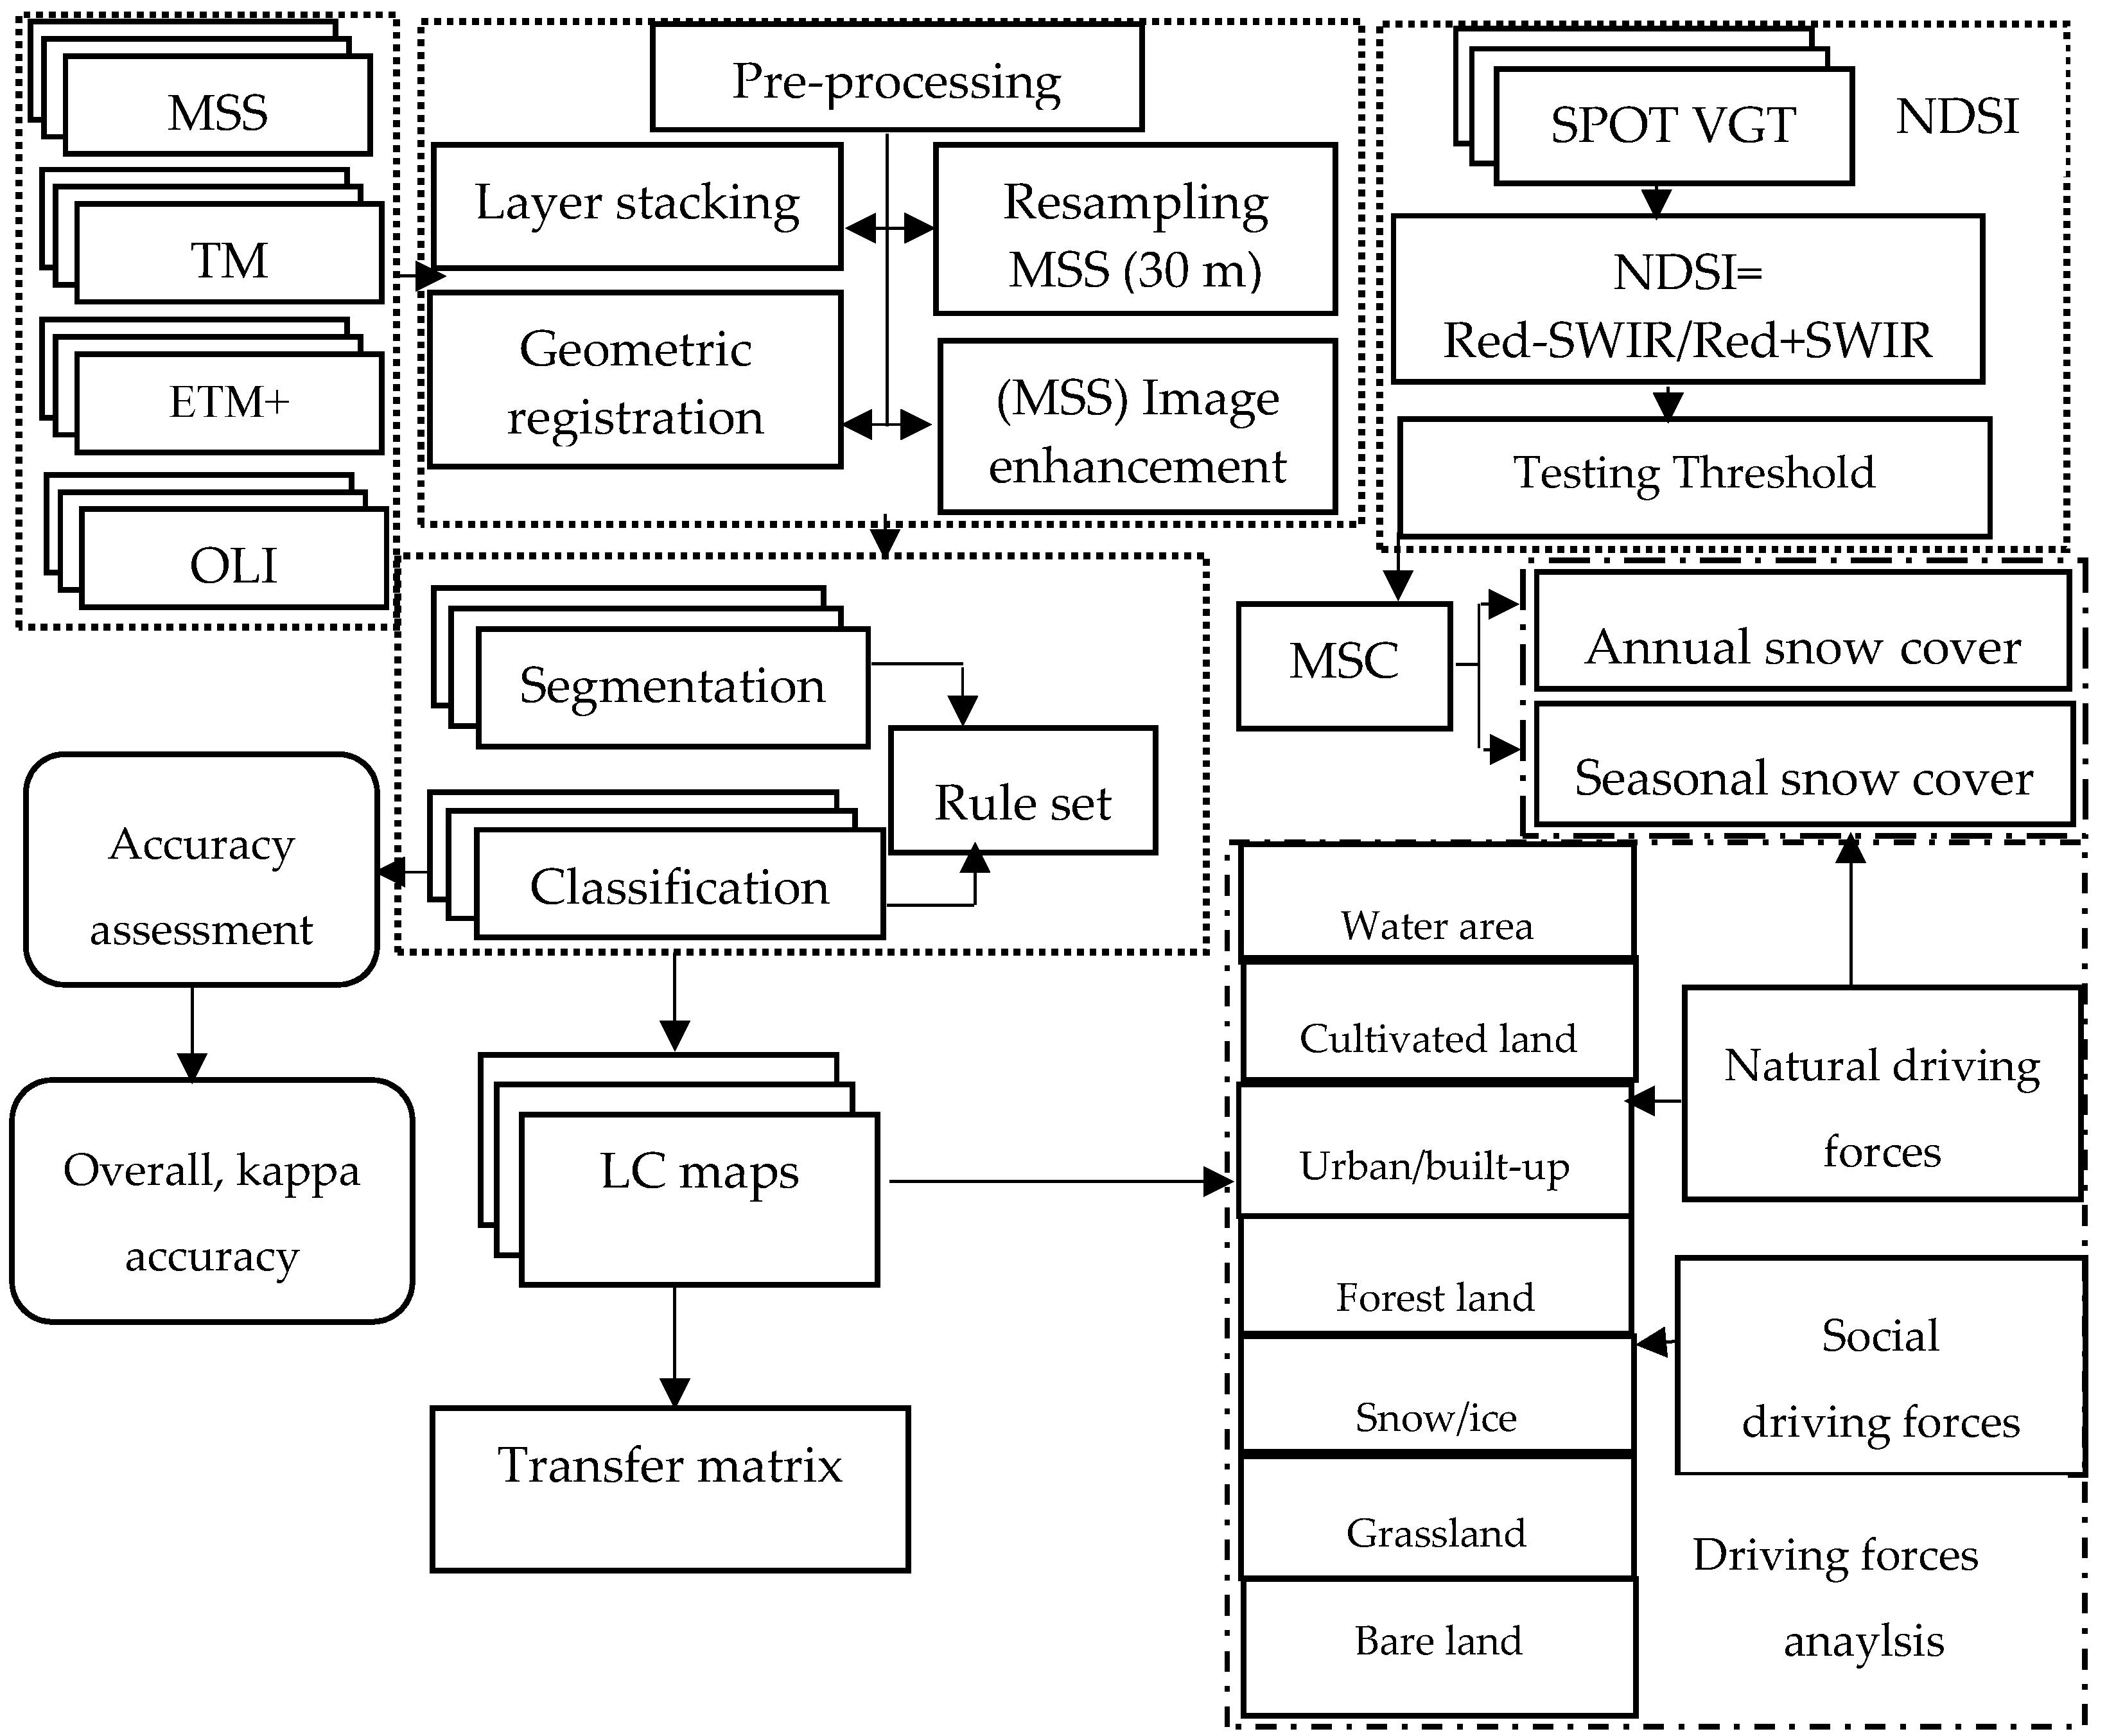
2.3. Methodology
2.3.1. Land Cover Mapping
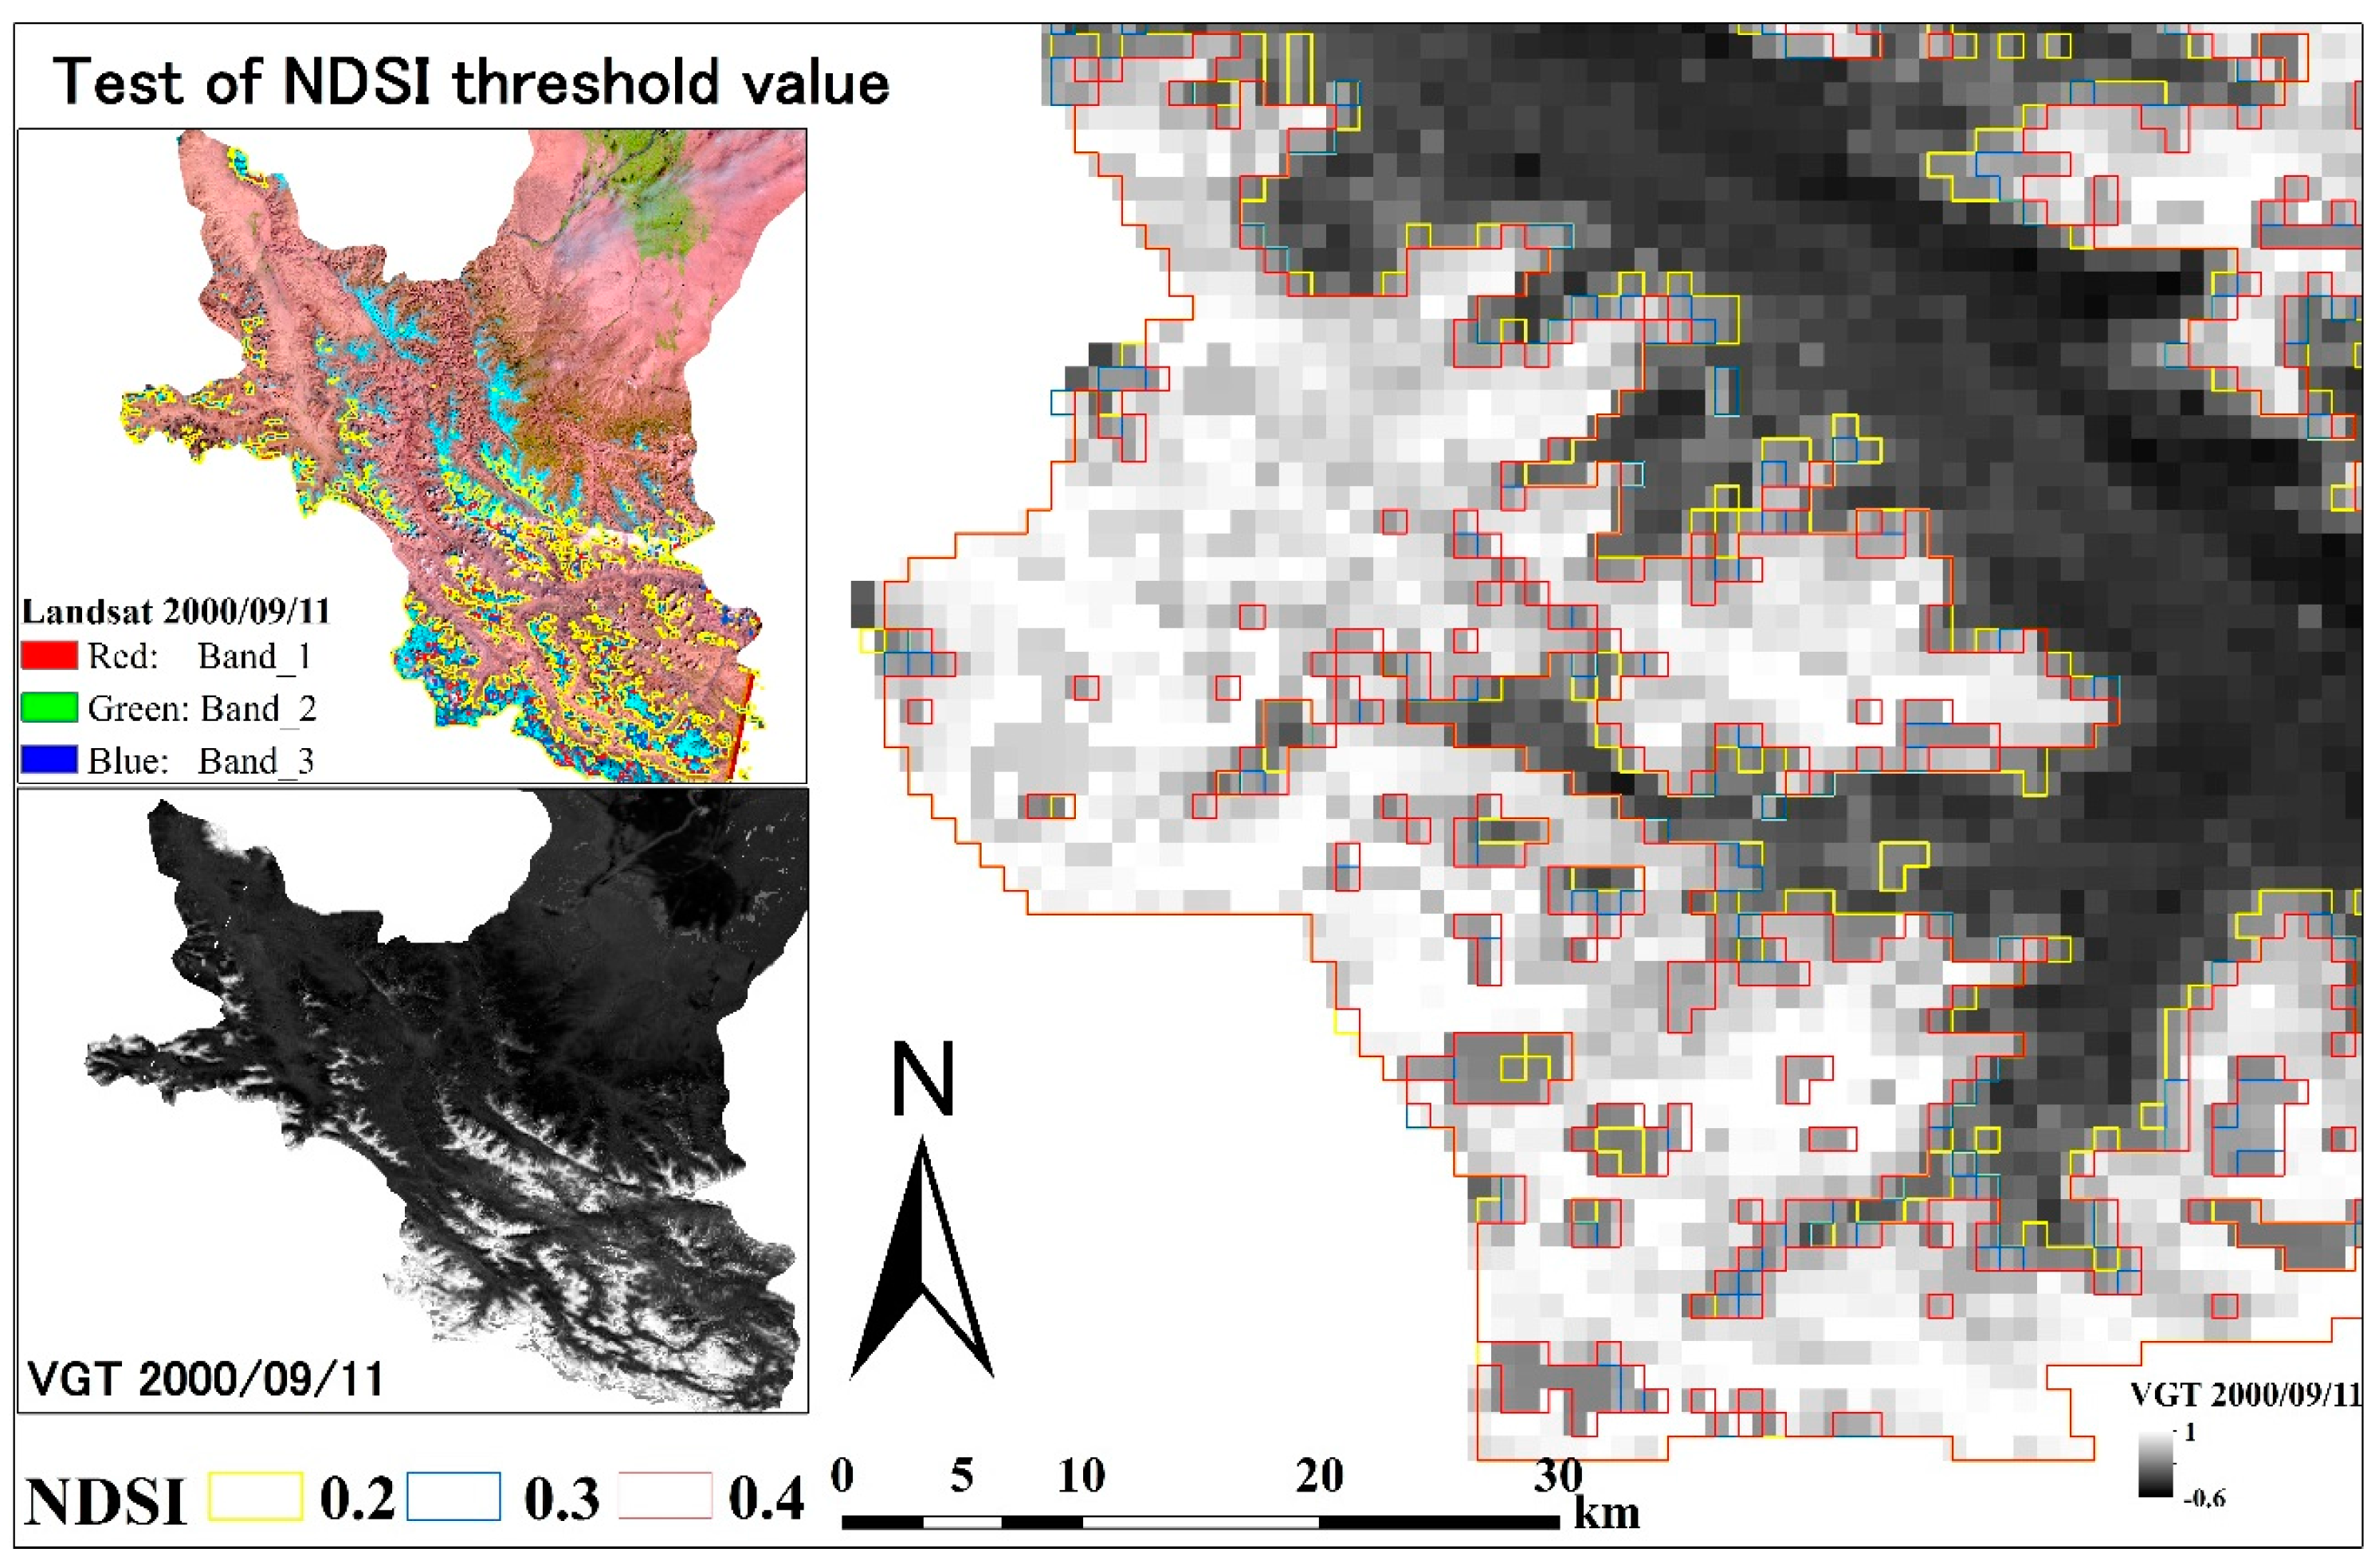
2.3.2. Snow Cover Changes
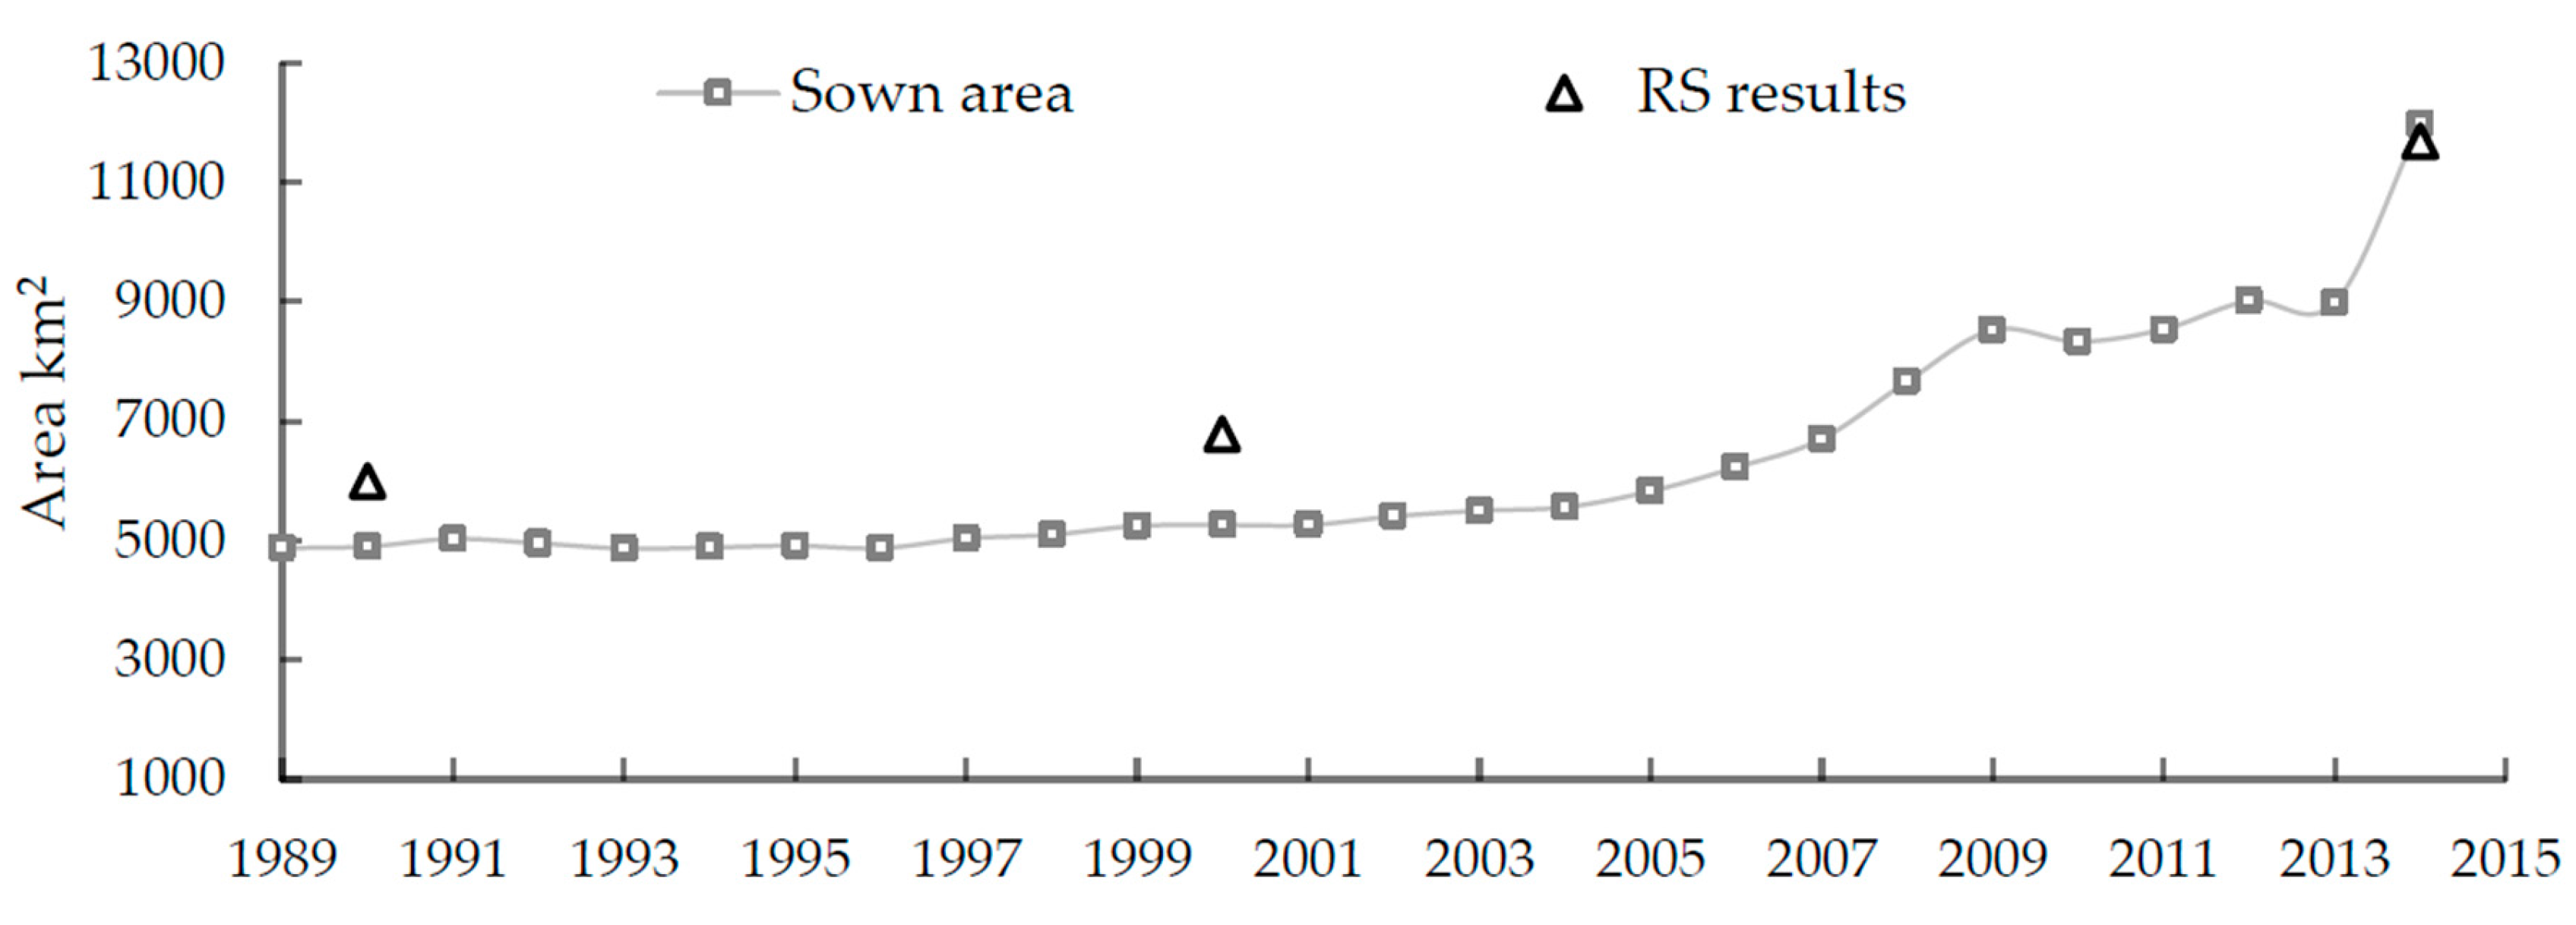
2.3.3. Accuracy Assessment
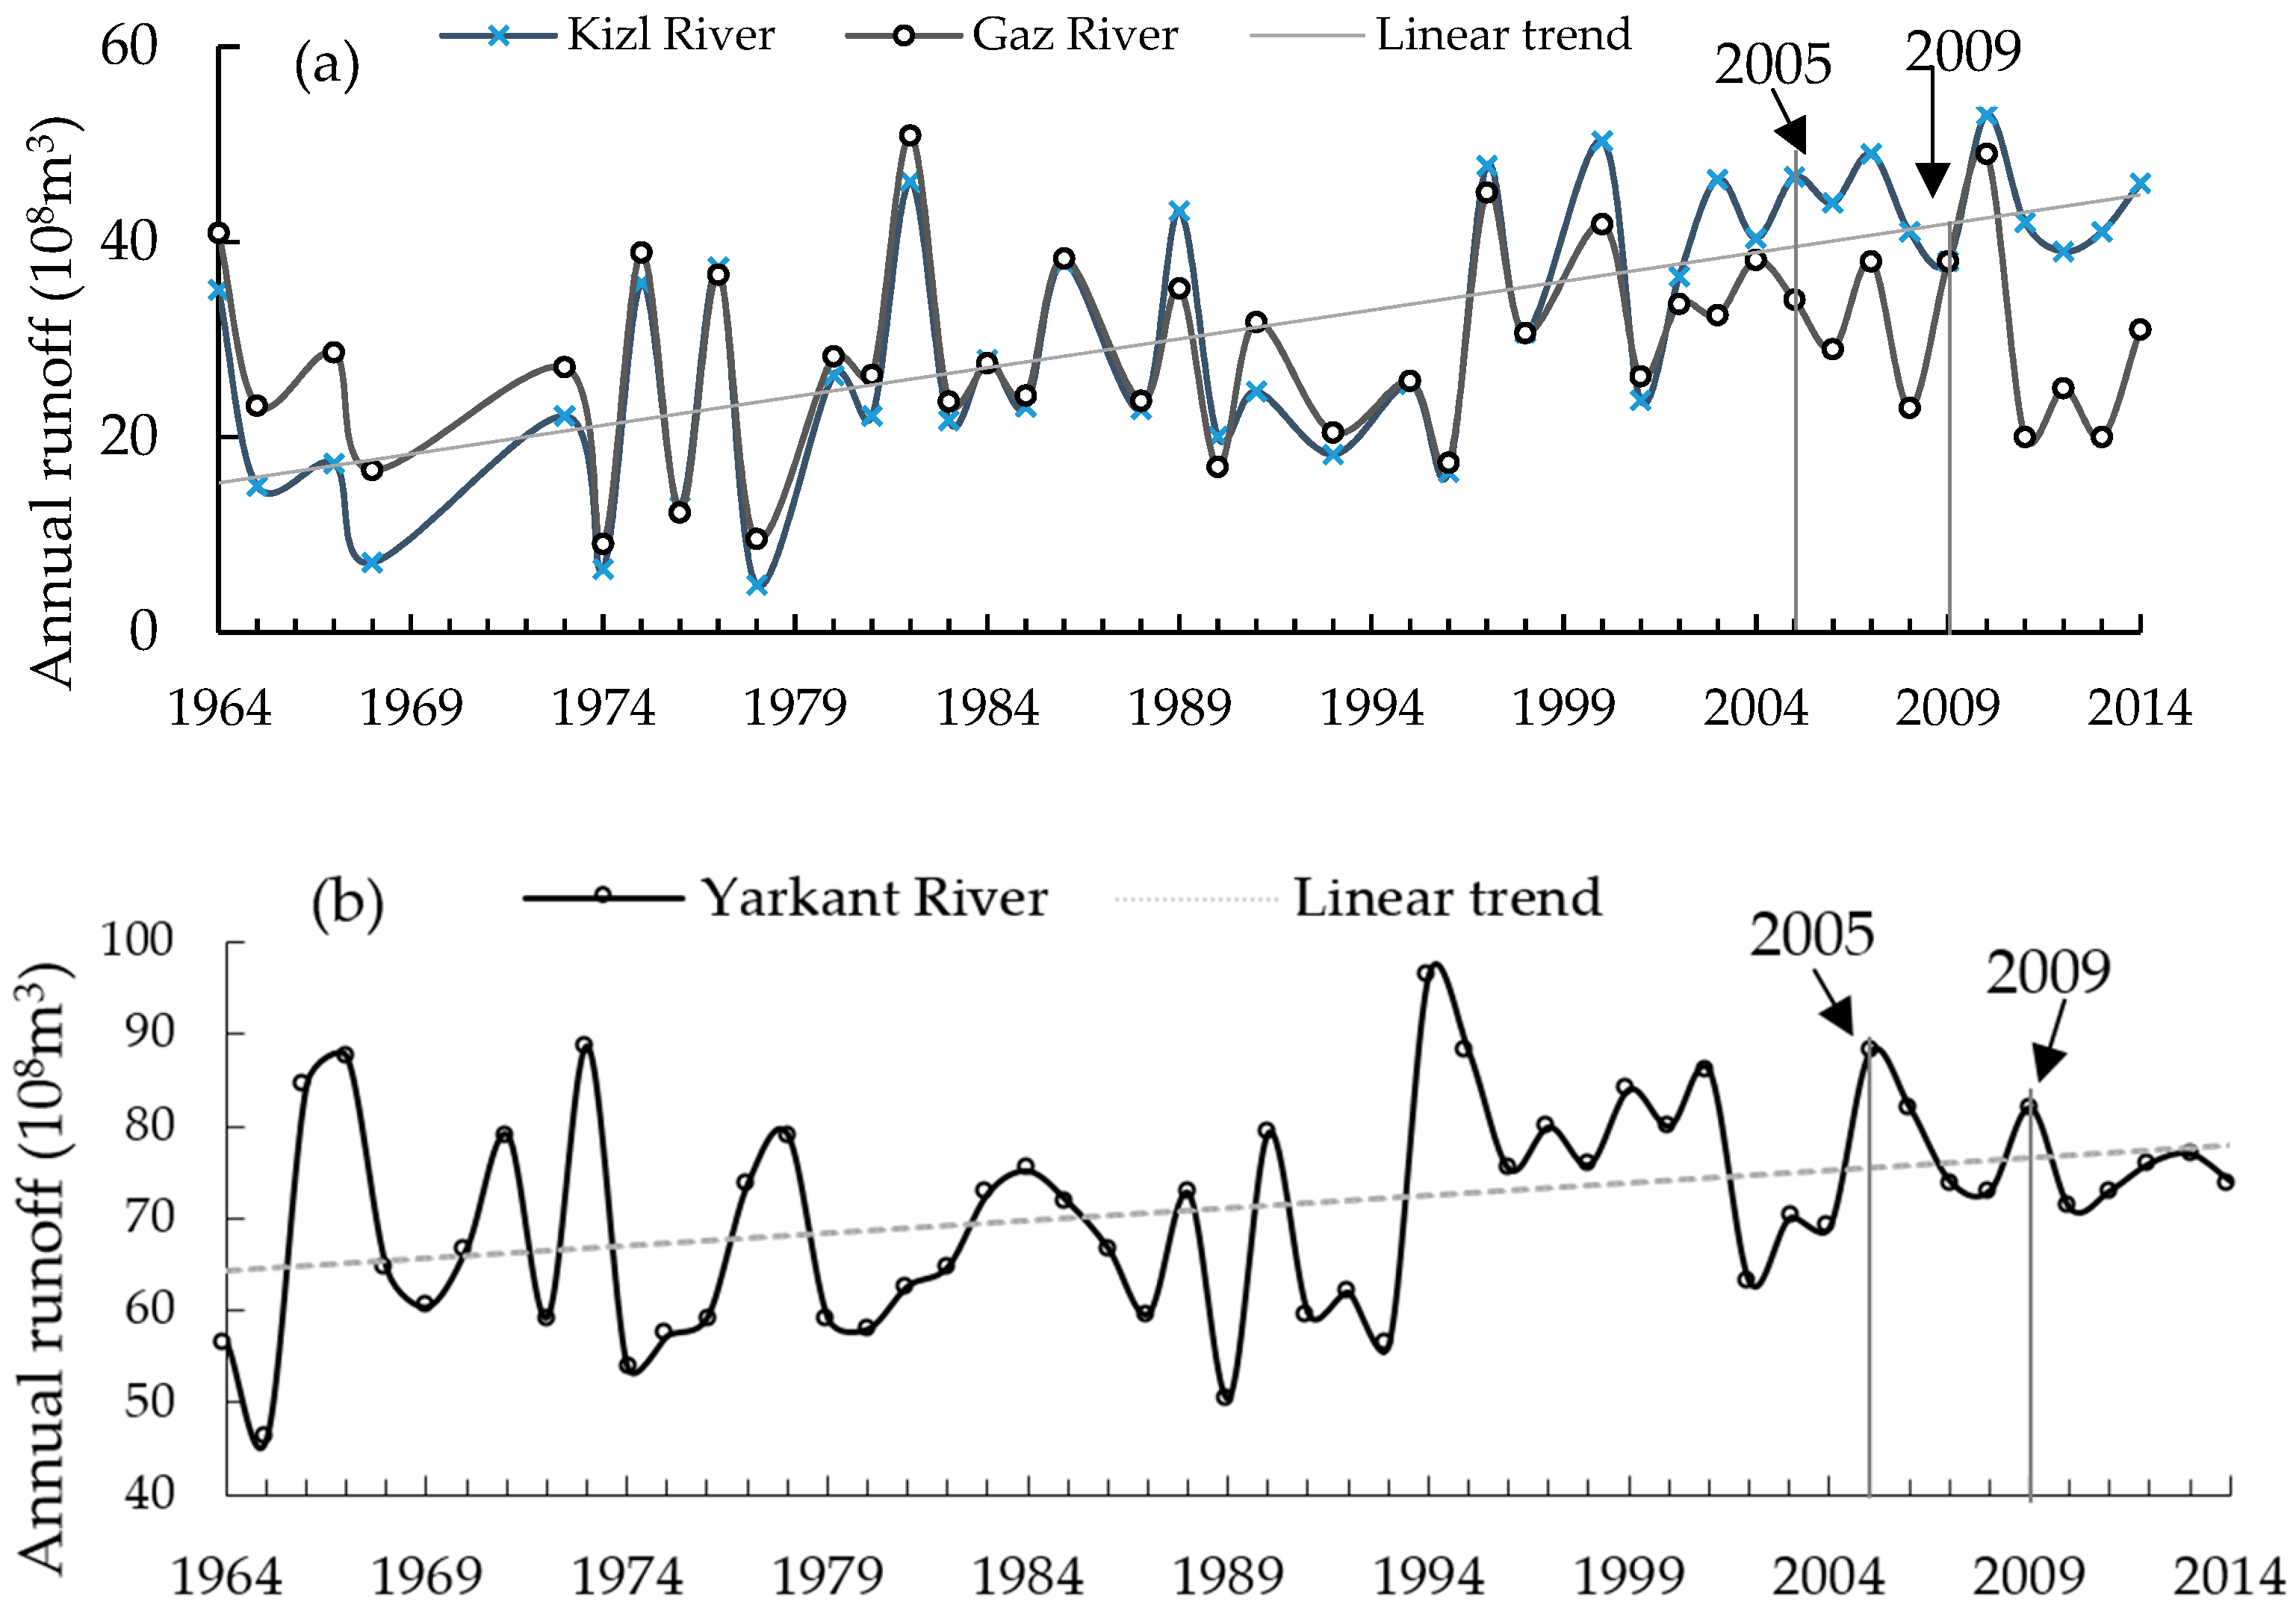
2.3.4. Trend Analysis with the Mann-Kendall Test for Hydro-Climate Variables
3. Results
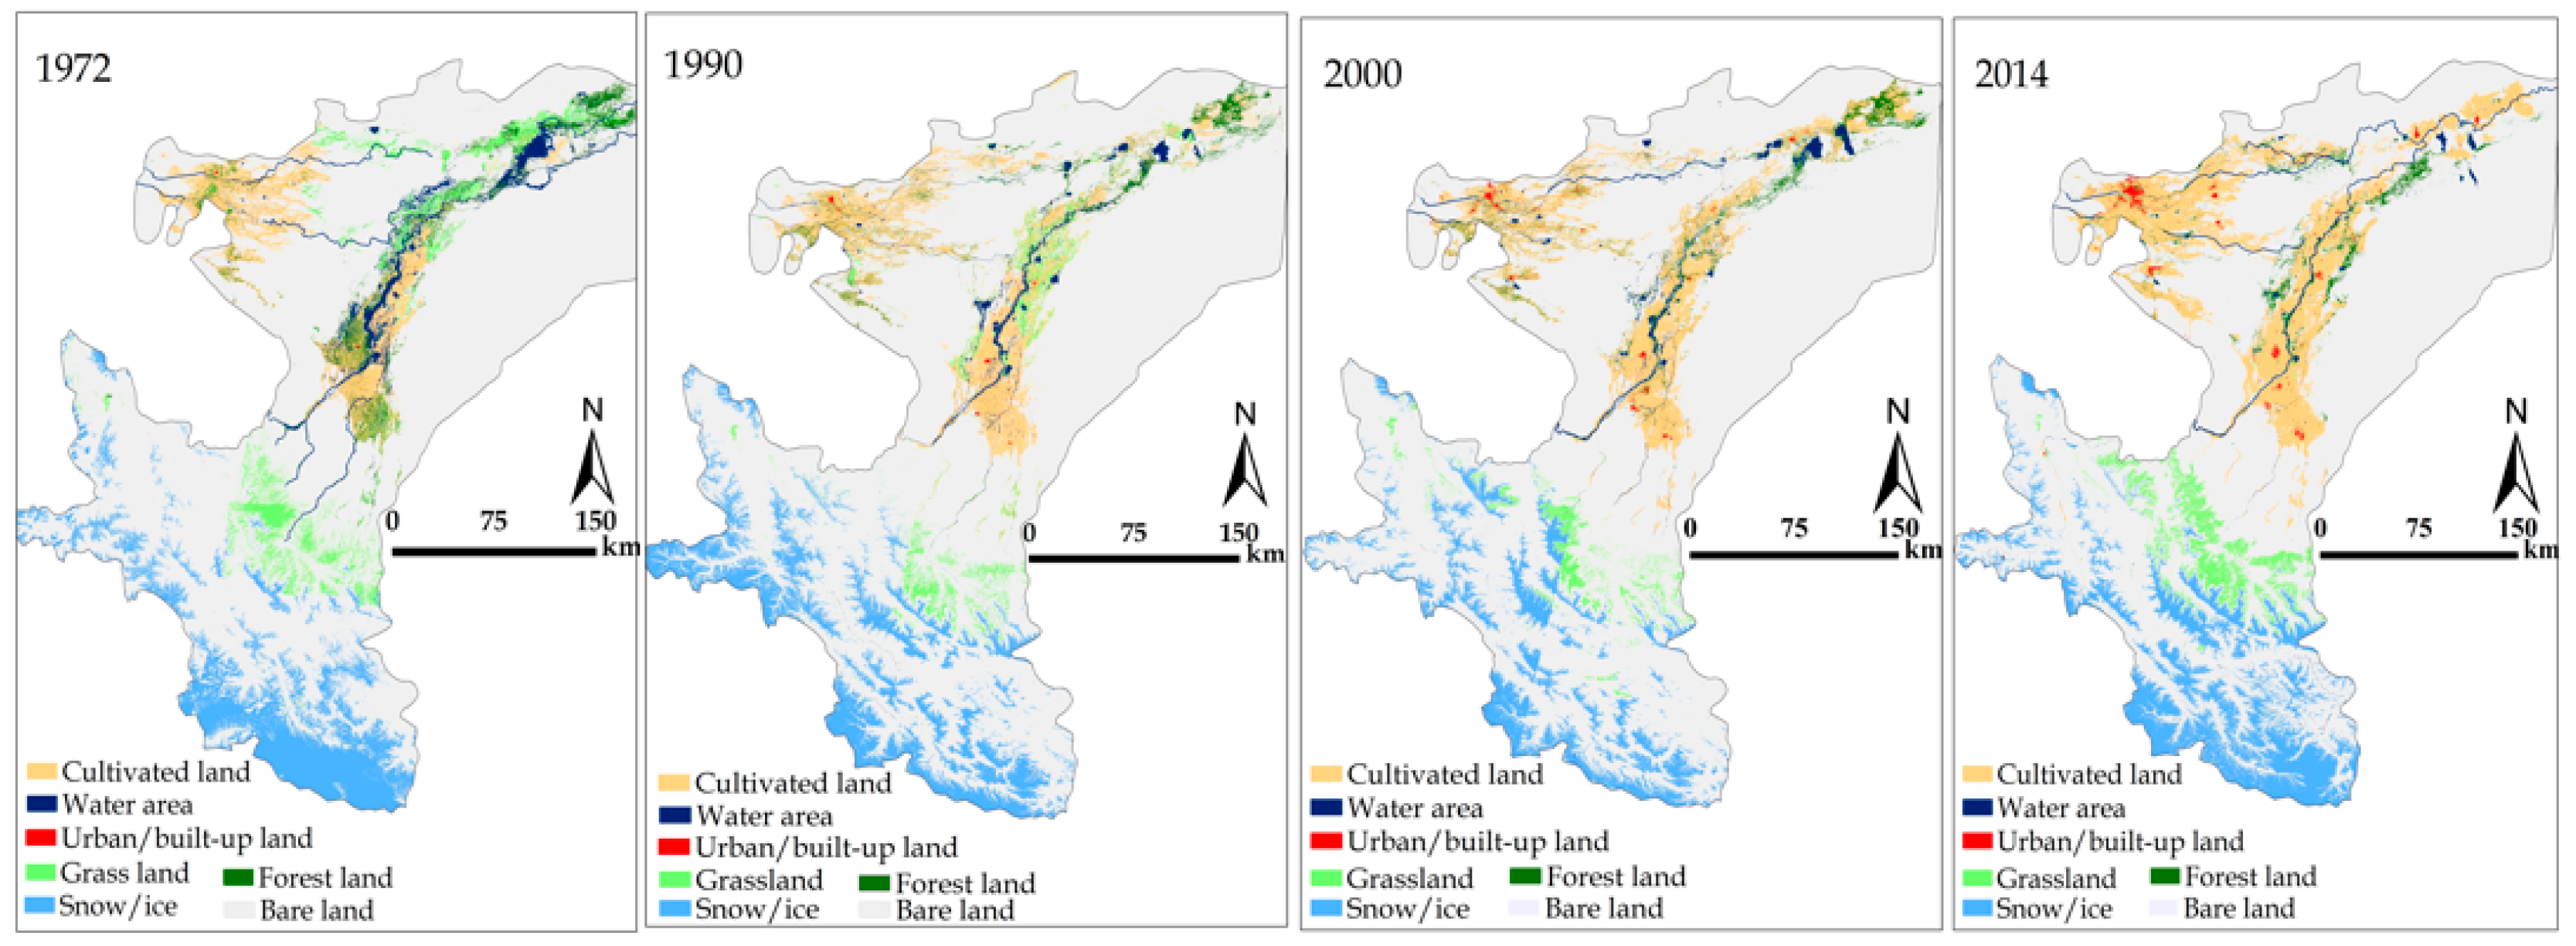
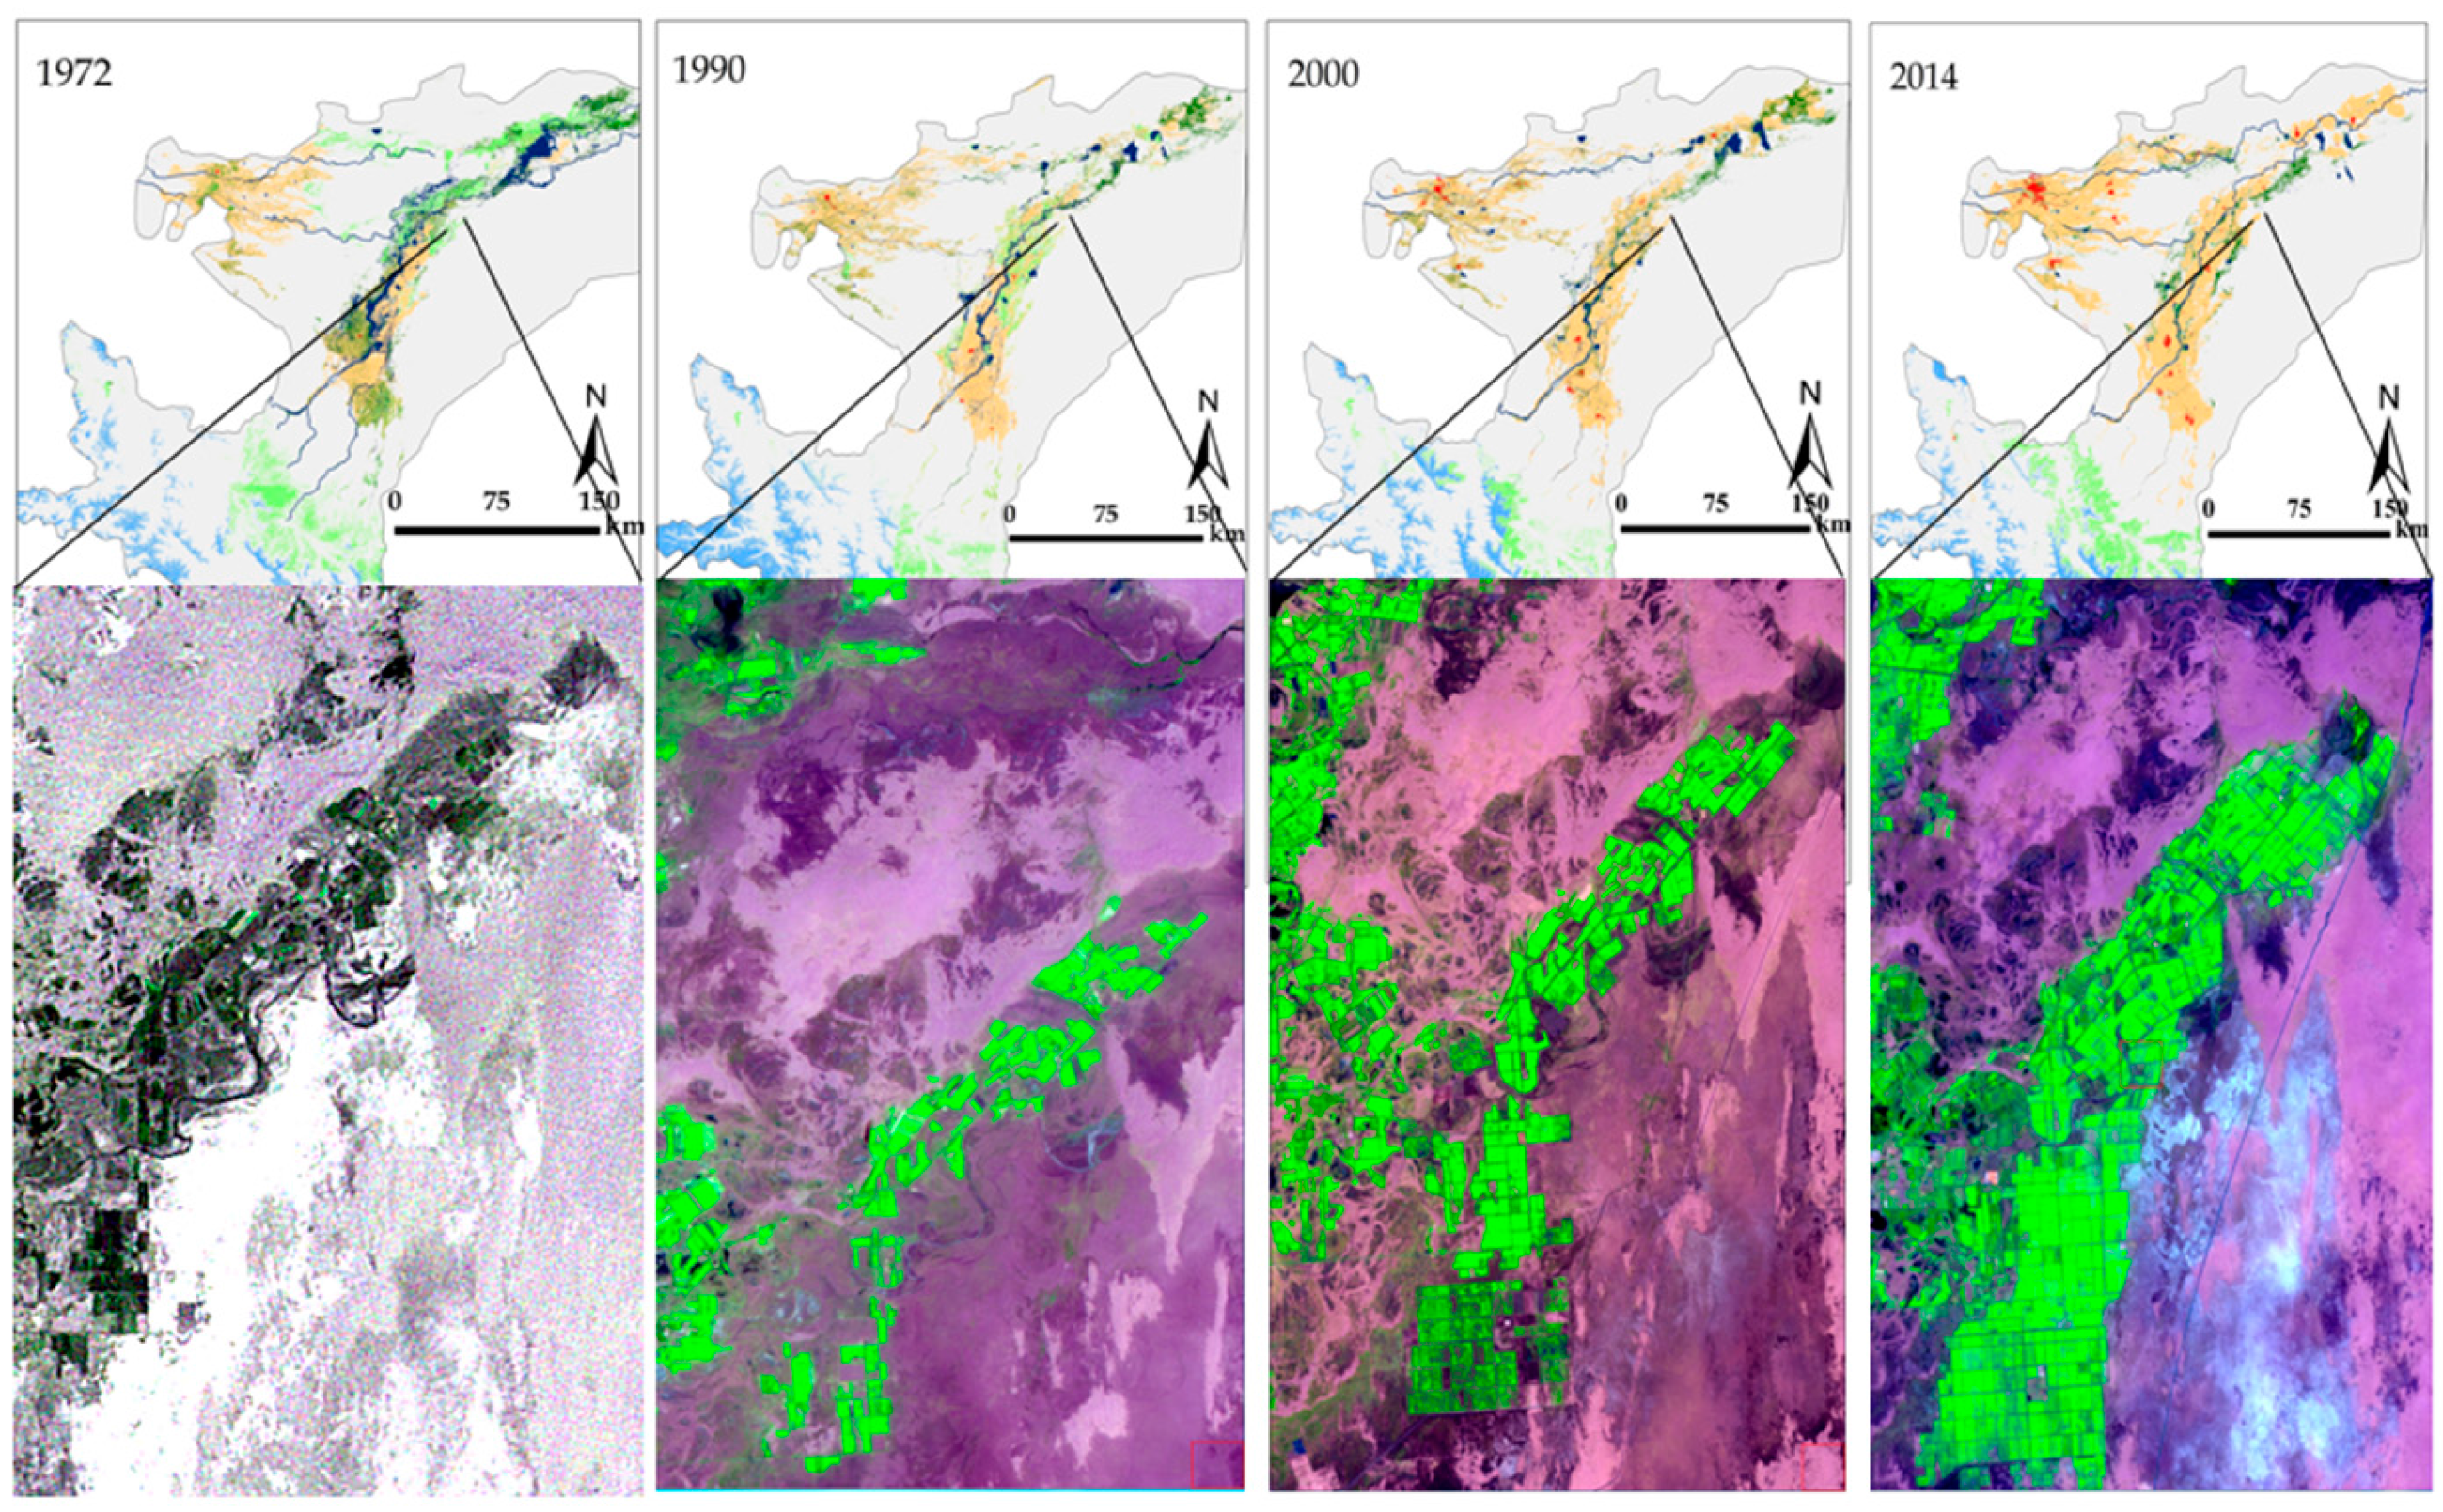
3.1. Land Cover Mapping
3.2. Snow Cover Changes
4. Discussion
4.1. Natural Driving Forces of LUCC
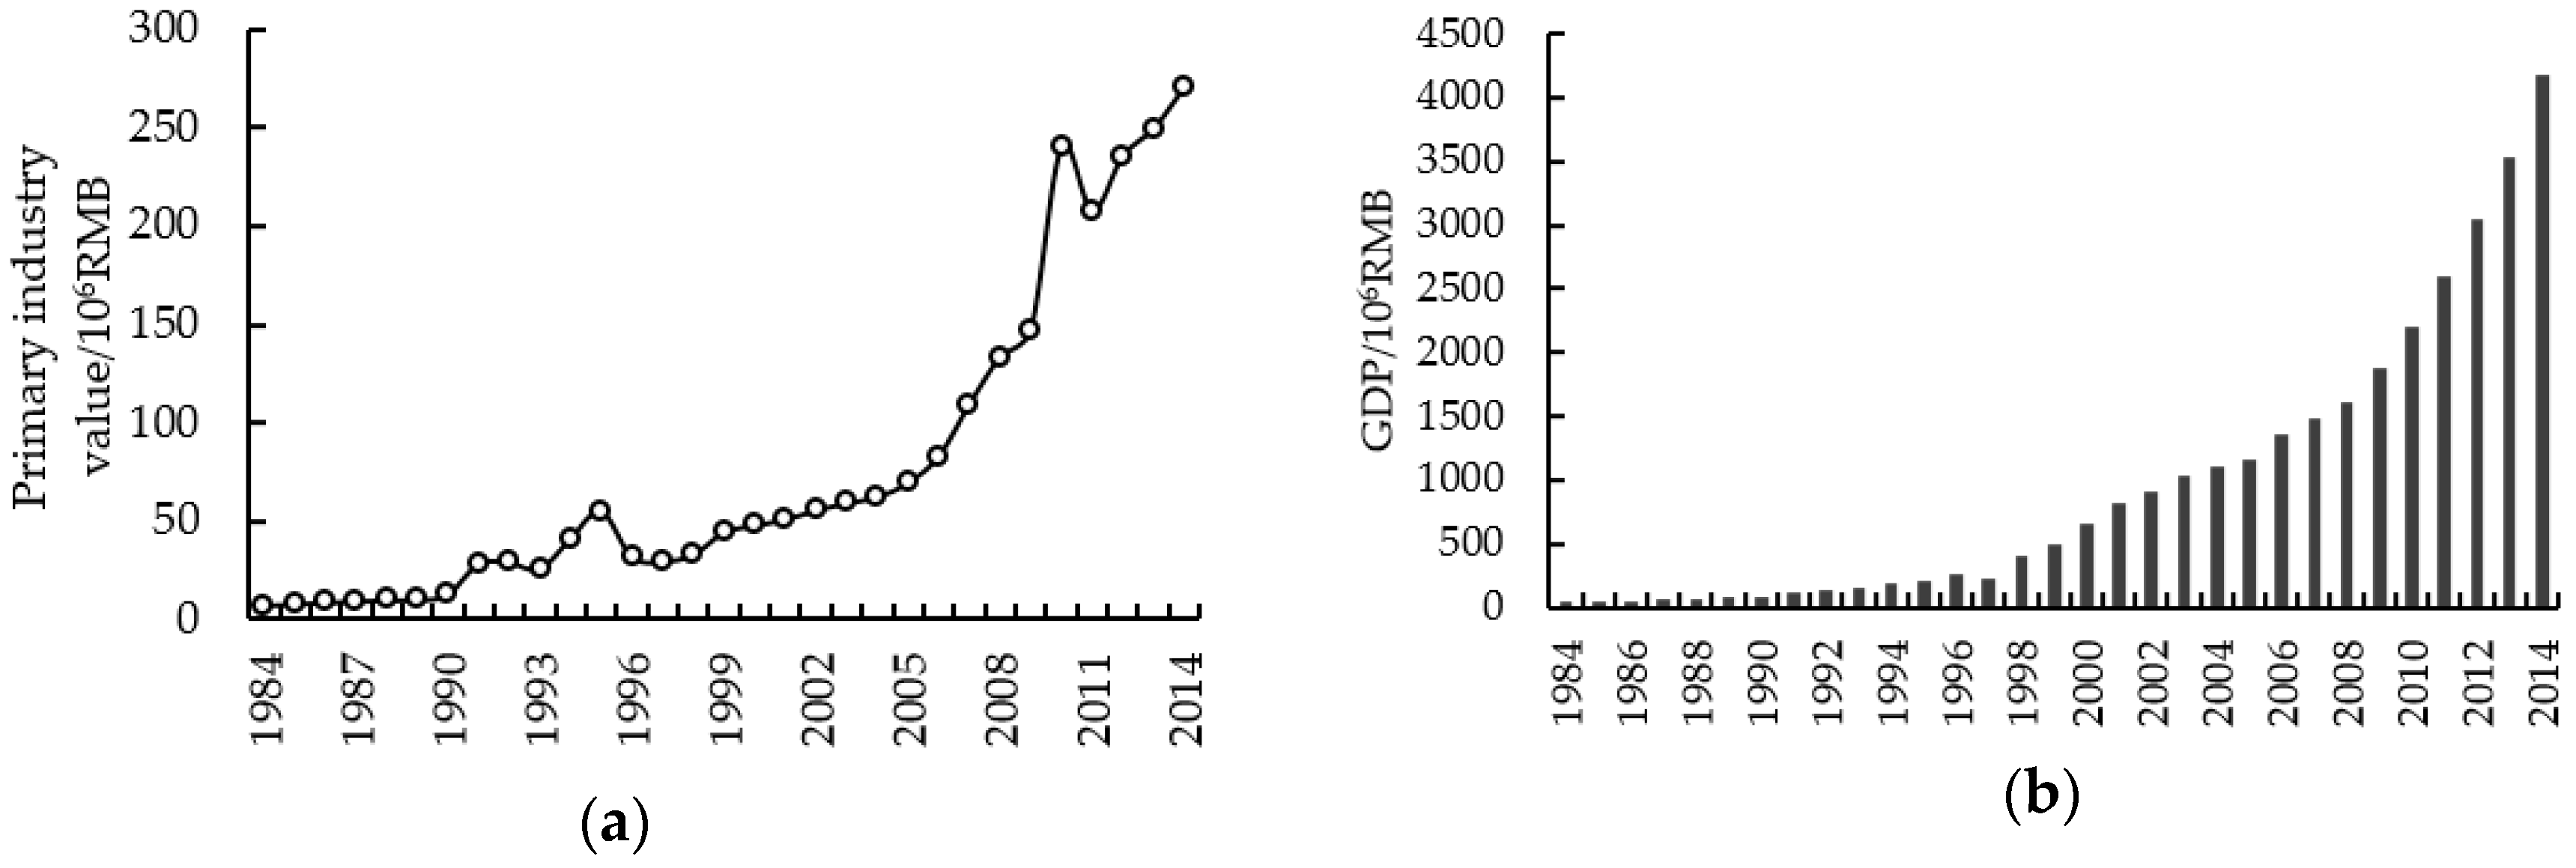
4.2. Social Driving Forces of LUCC
4.2.1. Impact of increasing of population on LUCCs
4.2.2. Impact of Policy-Induced Agricultural Land Development on LUCCs
5. Conclusions
Acknowledgments
Author Contributions
Conflicts of Interest
References
- Townshend, J.R. Improved Global Data for Land Applications; IGBP Report 20; International Geosphere-Biosphere Programme: Stockholm, Sweden, 1992. [Google Scholar]
- Lambin, E.F.; Baulies, X.; Bockstael, N.; Fischer, G.; Krug, T.; Leemans, R.; Moran, E.F.; Rindfuss, R.R.; Sato, Y.; Skole, D.; et al. Land-Use and Land-Cover Change (LUCC): Implementation Strategy; IGBP Report 48, IHDP Repot 10; International Geosphere-Biosphere Programme: Stockholm, Sweden; International Human Dimensions on Global Environmental Change Programme: Bonn, Germany, 1999; p. 125. [Google Scholar]
- Lambin, E.F.; Turner, B.L.; Geist, H.J.; Agbola, S.B.; Angelsen, A.; Bruce, J.W.; Xu, J. The causes of land-use and land-cover change: Moving beyond the myths. Glob. Environ. Chang. Hum. Policy Dimens. 2001, 11, 261–269. [Google Scholar] [CrossRef]
- Murphree, M.W.; Cumming, D.H.M. Savanna land use: Policy and practice in Zimbabwe. In The World’s Savanna’s: Economic Driving Forces, Ecological Constraints and Policy Options for Sustainable Land Use; UNESCO and Parthenon Publishing Group: Paris, France, 1993; pp. 139–178. [Google Scholar]
- Blaikie, P.; Brookfield, H. Land Degradation and Society; Methuen: New York, NY, USA, 1987. [Google Scholar]
- Grübler, M.A.; Meyer, W.B.; Turner, B.L. Changes in Land Use and Land Cover: A Global Perspective; University of Cambridge: Cambridge, UK, 1994; pp. 287–328. [Google Scholar]
- Rockwell, R.C. Culture and cultural change. In Changes in Land Use and Land Cover: A Global Perspective; Cambridge University Press: Cambridge, UK, 1994; pp. 357–359. [Google Scholar]
- Sanderson, S. Political-Economic Institutions. In Changes in Land Use and Land Cover: A Global Perspective; Meyer, W.B., Turner, B.L., Eds.; Cambridge University Press: Cambridge, UK, 1994; p. 369. [Google Scholar]
- Yang, Y.; Feng, Z.; Huang, H.Q.; Lin, Y. Climate induced changes in crop water balance during 1960–2001 in Northwest China. Agric. Ecosyst. Environ. 2008, 127, 107–118. [Google Scholar] [CrossRef]
- Román-Cuesta, R.M.; Carmona, M.C.; Lizcano, G.; New, M.; Silman, M.; Knoke, T.; Malhi, Y.; Oliveras, I.; Asbjornsen, H.; Vuille, M. Synchronous fire activity in the tropical high Andes: An indication of regional climate forcing. Glob. Chang. Biol. 2014, 20, 1929–1942. [Google Scholar] [CrossRef] [PubMed]
- Kicklighter, D.W.; Cai, Y.; Zhuang, Q.; Parfenova, E.I.; Paltsev, S.; Sokolov, A.P.; Melillo, J.M.; Reilly, J.M.; Tchebakova, N.M.; Lu, X. Potential influence of climate-induced vegetation shifts on future land use and associated land carbon fluxes in northern Eurasia. Environ. Res. Lett. 2014, 9, 35004. [Google Scholar] [CrossRef]
- Beilin, R.; Lindborg, R.; Stenseke, M.; Pereira, H.M.; Llausàs, A.; Slätmo, E.; Cerqueira, Y.; Navarro, L.; Rodrigues, P.; Reichelt, N.; et al. Analysing how drivers of agricultural land abandonment affect biodiversity and cultural landscapes using case studies from Scandinavia, Iberia and Oceania. Land Use Policy 2014, 36, 60–72. [Google Scholar] [CrossRef]
- Zhen, D.Z. Concept, cause and control of desertification in China. Quaternaryences 1998, 18, 145–155. (In Chinese) [Google Scholar]
- Nian, F.L.; Jie, T. Comprehensive Study of Ecological Environmental Geology in the Western Plain of the Tarim Basin of China; Jilin University Publishing House: Changchun, China, 1992; pp. 89–185. (In Chinese) [Google Scholar]
- Guo, Q.Z. Study of the cycle of materials in soil-sphere and soil development. Soil 1991, 123, 1–3. (In Chinese) [Google Scholar]
- Jia, B.Q. Approach to some theoretical problem on oasis landscape. Arid Land Geogr. 1996, 16, 56–65. (In Chinese) [Google Scholar]
- Chen, Y.N.; Li, B.F.; Li, Z.; Li, W.H. Water resources formation and conversion and water security in arid region of Northwest China. J. Geogr. Sci. 2016, 26, 939–952. [Google Scholar] [CrossRef]
- Anwaer, M.; Zhang, X.L.; Tashkin, J. Temporal and Spatial of Water Use and the Driving Mechanism in Kashgar District, Xinjiang. J. Beijing Norm. Univ. (Nat. Sci.) 2010, 46, 202–207. (In Chinese) [Google Scholar]
- Anwaer, M.; Zhang, X.L.; Yang, D.G. Grey Relational Analysis of Change of Urbanization and Water Use Structure in Kashkar District, Xinjiang. J. Desert Res. 2011, 31, 261–266. (In Chinese) [Google Scholar]
- Mansur, S.; Abulimiti, A.; Reyihangul, W. Cultivated land change and its ground water level response in kashghar in last decade. J. Arid Land Resour. Environ. 2011, 25, 145–151. (In Chinese) [Google Scholar]
- Abudoukerimu, A.; Qin, R.; Yilidarjiang, T.; Xin, Z.F. Climatic variation characteristics in Kashi Region during 1961–2010. Desert Oasis Meteorol. 2012, 6, 34–40. (In Chinese) [Google Scholar]
- National Bureau of Statistics. Xinjiang Statistical Year Book (1984–2014); China Statistical Press: Beijing, China, 2016.
- Li, P.Y. Evaluation and rational development and utilization of water resources in the Xinjiang Uigur Autonomus Region. Arid Land Geogr. 1987, 110, 13–48. (In Chinese) [Google Scholar]
- Definiens. Definiens Professional 5 User Guide; Definiens AG: München, Germany, 2006; p. 15. [Google Scholar]
- Abdullah, F.A.; Lalit, K.; Priyakant, S. Urban land cover change modelling using time-series satellite images: A case study of urban growth in five cities of Saudi Arabia. Remote Sens. 2016, 8, 838. [Google Scholar] [CrossRef]
- Yu, W.; Zhou, W.; Qian, Y.; Yan, J. A new approach for land cover classification and change analysis: Integrating backdating and an objective-based method. Remote Sens. Environ. 2016, 177, 37–47. [Google Scholar] [CrossRef]
- Benedictsson, J.A.; Swain, P.H.; Ersoy, O.K. Neural network approaches versus statistical methods in classification of multisource remote sensing data. IEEE Trans. Geosci. Remote Sens. 1990, 28, 540–551. [Google Scholar] [CrossRef]
- Xiang, M.X.; Stephen, B.; Ji, Y.L.; Da, F.Z.; Ming, L.L. Charaterization of forest types in Northeastern China, using multi-temporal SPOT-4 VEGETATION sensor data. Remote Sens. Environ. 2002, 82, 335–348. [Google Scholar] [CrossRef]
- Vegetation User Guide. Available online: http://www.spot-vegetation.com/userguide/userguide.htm (accessed on 9 June 2011).
- Crane, R.G.; Anderson, M.R. Satellite discrimination of snow/cloud surfaces. Int. J. Remote Sens. 1984, 5, 213–223. [Google Scholar] [CrossRef]
- Xiao, X.; Moore, B.; Qin, X.; Shen, Z.; Boles, S. Observations of alpine snow and ice cover in Asia: Using multi-temporal VEGETATION sensor data. Int. J. Remote Sens. 2002, 23, 2213–2228. [Google Scholar] [CrossRef]
- Hall, D.K.; Crawford, C.J.; DiGirolamo, N.E.; Riggs, G.A.; Foster, J.L. Development of methods for mapping global snow cover using Moderate Resolution Imaging Spectroradiometer Data. Remote Sens. Environ. 1995, 54, 127–140. [Google Scholar] [CrossRef]
- Kondoh, A.; Suziki, R. Snow cover mapping and its internnual variation in Northern Eurasia, Japan. J. Jpn. Soc. Hydrol. Water Resour. 2005, 18, 695–702. (In Japanese) [Google Scholar] [CrossRef]
- Kendall, M.G. Rank Correlation Methods, 4th ed.; Charles Griffin: London, UK, 1975. [Google Scholar]
- Mann, H.B. Non-parametric test against trend. Econometrica 1945, 13, 245–259. [Google Scholar] [CrossRef]
- Mitchell, J.M.; Dzerdzeevskii, B.; Flohn, H.; Hofmeyr, W.L.; Lamb, H.H.; Rao, K.N.; Wallen, C.C. Climate Change; WMO Technical Note No. 79; World Meteorological Organization: Geneva, Switzerland, 1966; p. 79. [Google Scholar]
- Partal, T.; Kahya, E. Trend analysis in Turkish precipitation data. Hydrol. Process. 2006, 20, 2011–2026. [Google Scholar] [CrossRef]
- Xu, J.H.; Chen, Y.N.; Li, W.H.; Nie, Q.; Hong, Y.L.; Yang, Y. The nonlinear hydro-climatic process in the Yarkant River, northwest China. Stoch. Environ. Res. Risk Assess. 2013, 27, 389–399. [Google Scholar] [CrossRef]
- Anderson, J.R.; Hardy, E.E.; Roach, J.T.; Witmer, R.E. A Land Use and Land Cover Classification System for Use with Remote Sensor Data; Geological Survey U.S.: Listeria, VA, USA, 1976; Volume 964, p. 28.
- Chen, L. Analysis on Interannual Variation of Different Grassland Types in Tashkurgan County. Pratacult Anim. Husb. 2010, 9, 18–21. (In Chinese) [Google Scholar]
- Ke, Q.D.; Bai, Q.X.; Guan, J.W. Snow accumulation variability at altitude of 7010m a.s.l. in Muztag Ata Mountain in Pamir Plateau during 1958–2002. J. Hydrol. 2015, 531, 912–918. [Google Scholar] [CrossRef]
- Luo, G.P.; Zhou, C.; Chi, X. Process of land use/land cover change in the Oasis of Arid Region. Acta Geogr. Sin. 2003, 58, 63–72. (In Chinese) [Google Scholar]
- Hietel, E.K.; Waldhardt, R.N.; Otte, A.N. Linking socio-economic factors, environment and land cover in the German Highlands, 1945–1999. J. Environ. Manag. 2005, 75, 133–143. [Google Scholar] [CrossRef]
- Chen, Y.N.; Li, Z.; Fan, Y.T.; Wang, H.J.; Deng, H.J. Progress and prospects of climate change impacts on hydrology in the arid region of northwest China. Environ. Res. 2015, 139, 11–19. [Google Scholar] [CrossRef] [PubMed]
- Abudoukerimu, A.; Hu, S.Q.; Nuerpatiman, M.R. Analysis on the Impact of Climate Change on Yield and Yield of Cotton in Kashgar, Xinjiang. Chin. J. Eco-Agric. 2015, 23, 919–930. (In Chinese) [Google Scholar]
- Rango, A.; Martinec, J. Areal extent of seasonal snow cover in a changed climate. Nord. Hydrol. 1994, 25, 233–246. [Google Scholar]
- Jiang, Y.; Zhou, C.H.; Cheng, W.M. Streamflow trends and hydrological response to climatic change in Tarim headwater basin. J. Geogr. Sci. 2007, 17, 51–61. [Google Scholar] [CrossRef]
- Dong, H.S.; Shi, Y.L.; Yong, J.D.; Lian, F.D.; Jun, L.X.; Li, J. Glacier changes during the last forty years in the Tarim Interior River Basin, northwest China. Prog. Nat. Sci. 2009, 19, 727–732. [Google Scholar] [CrossRef]
- Chen, Y.N.; Takeuchi, K.; Xu, C.C.; Chen, Y.P.; Xu, Z.X. Regional climate change and its effects on river runoff in the Tarim Basin, China. Hydrol. Process. 2006, 20, 2007–2216. [Google Scholar] [CrossRef]
- Xu, C.C.; Chen, Y.N.; Hamid, Y.M.; Tashpolat, T.Y.; Chen, Y.P.; Ge, H.T.; Li, W.H. Long-term change of seasonal snow cover and its effects on river runoff in the Tarim River basin, northwestern China. Hydrol. Process. 2009, 23, 2045–2055. [Google Scholar] [CrossRef]
- Zhang, Q.; Xu, C.; Tao, H.; Jiang, T.; Chen, Y. Climate changes and their impacts on water resources in the arid regions: A case study of the Tarim River Basin, China. Stoch. Environ. Res. Risk Assess. 2010, 24, 349–358. [Google Scholar] [CrossRef]
- Lin, N.-F.; Tang, J.; Han, F.-H. Eco-environmental problems and effective utilization of water resources in the Kashi Plain, western Terim Basin, China. Hydrogeol. J. 2001, 9, 202–207. [Google Scholar] [CrossRef]
- Zhou, Y.; Wang, J.; Ma, A.; Qi, Y.; Bayea, Y. Study on land use dynamics based on RS and GIS in Linze County. J. Desert Res. 2003, 23, 142–146. (In Chinese) [Google Scholar]
- Zhang, H.; Wu, J.; Zheng, Q.; Yu, Y. A preliminary study of oasis evaluation in the Tarim Basin, Xinjiang, China. J. Arid Environ. 2003, 55, 545–553. [Google Scholar] [CrossRef]
- Wang, Y.; Xi, X.; Li, Y.; Xu, H. Analysis of the land-using and environmental effect in the middle reach of the Tarim River. J. Anhui Agric. Sci. 2008, 36, 6434–6436. (In Chinese) [Google Scholar]
- Til, F.K.; Yusunjiang, M.; Lin, L.; Reiner, D. Development of agricultural land and water use and its driving forces along the Aksu and Tarim River, P.R. China. Environ. Earth Sci. 2015, 73, 517–531. [Google Scholar] [CrossRef]
- Qiu, J.Z.; Bo, J.F.; Li, D.C.; Wen, W.Z.; Qin, K.Y.; Guo, B.L.; Hubert, G. Dynamics and driving factors of agricultural landscape in the semiarid hilly area of the Loess Plateau, China. Agric. Ecosyst. Environ. 2004, 103, 535–543. [Google Scholar] [CrossRef]
- Jiang, L.W.; Tong, Y.F.; Zhao, Z.J.; Li, T.H.; Liao, J.H. Water Resources, Land Exploration and Population Dynamics in Arid Areas—The Case of the Tarim River Basin in Xinjiang of China. Popul. Environ. 2005, 26, 471–503. [Google Scholar] [CrossRef]
- Yu, Y.; Xiao, L.Z.; Jun, L.; Wei, D.; Wei, Y.Z.; Chao, G. Spatial integration of oasis city group around the western margins of the Tarim Basin. J. Arid Land 2010, 2, 214–221. [Google Scholar] [CrossRef]
- Kennedy, J.J. From the tax-for-fee reform to the abolition of agricultural taxes: The impact on township governments in North-West China. China Q. 2007, 189, 43–59. [Google Scholar] [CrossRef]
- Ito, J.; Ni, J. Capital deepening, land use policy, and self-sufficiency in China’s grain sector. China Econ. Rev. 2013, 24, 95–107. [Google Scholar] [CrossRef]
- André, B.S. Introduction to spatial economic zones in China, illustrated by the Special Economic Development Zones of Horgos and Kashagr (Xinjiang Province). In Jusletter; Wiegand, W., Montani, S., Kummer, F., Eds.; Weblaw: Bern, Switzerland, 2014; p. 16. [Google Scholar]
- Howard, K.W.F.; Howard, K.K. The new “Silk Road Economic Belt” as a threat to the sustainable management of Central Asia’s transboundary water resources. Environ. Earth Sci. 2016, 75, 976. [Google Scholar] [CrossRef]


| Data Category | Sensor | Date | Resolution | Path/Row | Sources of Data |
|---|---|---|---|---|---|
| Remote sensing data | MSS | 1972 (From June to October) | 60 m | P147R32~P149/35 | USGS |
| TM | 1990 (From June to September) | 30 m | P147R32~P149/35 | ||
| ETM+ | 2000 (From June to September) | 30 m | P147R32~P149/35 | ||
| OLI | 2014 (From June to September) | 30 m | P147R32~P149/35 | ||
| SPOT-4 | 1 January 1999–30 May 2014 | 1 km | 71°39′~79°52′ E 35°28′~40°18′ N | VITO | |
| Hydrological data (annual runoff) | - | 1964–2014 | Station data | - | Karbal, Kirik, Kaqung Stations |
| Meteorological data(annual temperature, precipitation, evaporation) | - | 1964–2014 | Station data | - | Kashgar, Yarkant, Maralbeshi Tashkorgan stations |
| Statistical data | - | 1984–2014 | - | Xinjiang Statistical Year Book | |
| Reference data | Google Earth | 11 August 1972 Landsat 29 June 1973 Landsat 31 August 1990 Landsat 31 December 2000 Landsat 31 July 2013 Airbus 6 August 2013 Airbus 25 May 2014 Airbus 10 June 2014 Digital Globe 19 September 2014 Digital Globe | P147R32~P149/35 | ||
| GDEM | 17 October 2011 | 30 m | P147R32~P149/35 | USGS |
| Classes | Definition |
|---|---|
| Urban/build-up area | Urban area, villages, industrial and commercial areas, transportation, communication and utilities |
| Cultivated land | Crop fields, cotton fields, vegetable lands, irrigated land, non-irrigated vegetation |
| Water | All areas of open water, rivers, streams, channels, lakes, reservoir and ponds, bottomland, swampland |
| Grassland | Dense grass, moderate grass, sparse grass, |
| Forest | Dense forest, scrubland, Sparse forest, orchards, groves, shrubland |
| Snow/ice | Glacier, snow, ice |
| Bare land | Desert, Gobi, salinized land, area of thin soil, rock, almost no vegetation cover |
| Land Cover Classes | 1972 | 1990 | 2000 | 2014 | ||||
|---|---|---|---|---|---|---|---|---|
| Users’ Accuracy | Producers’ Accuracy | Users’ Accuracy | Producers’ Accuracy | Users’ Accuracy | Producers’ Accuracy | Users’ Accuracy | Producers’ Accuracy | |
| Urban | 86% | 67% | 100% | 95% | 100% | 91% | 100% | 68% |
| Water | 100% | 78% | 97% | 97% | 100% | 88% | 100% | 90% |
| Grassland | 91% | 91% | 88% | 65% | 100% | 69% | 100% | 96% |
| Cultivated land | 80% | 97% | 89% | 97% | 94% | 100% | 91% | 100% |
| Forestland | 90% | 60% | 76% | 73% | 98% | 91% | 87% | 81% |
| Snow/ice | 100% | 100% | 100% | 100% | 100% | 94% | 100% | 97% |
| Bare land | 87% | 100% | 92% | 100% | 68% | 100% | 73% | 100% |
| Overall accuracy | 88% | 93% | 93% | 91% | ||||
| Kappa statistic | 0.86 | 0.92 | 0.91 | 0.90 | ||||
| Year | 1972 | 1990 | 2000 | 2014 | ||||
|---|---|---|---|---|---|---|---|---|
| Land Cover Class | Total Area (km2) Percentage (%) | |||||||
| Water area | 2762.9 | 2.4 | 1925.6 | 1.6 | 1291.2 | 1.1 | 1062.4 | 0.9 |
| Cultivated land | 4148.6 | 3.6 | 5991.4 | 5.2 | 6572.5 | 5.7 | 11,677.5 | 10.2 |
| Urban/Built up | 40.2 | 0.4 | 96.3 | 0.8 | 169.2 | 1.5 | 392.8 | 3 |
| Grassland | 4779.1 | 4.1 | 3701.3 | 3.2 | 2680.6 | 2.3 | 3302.5 | 2.9 |
| Forest land | 3584.5 | 3.1 | 2991.1 | 2.6 | 1545.7 | 1.3 | 1344.5 | 1.2 |
| Snow/ice | 10,838.8 | 10 | 10,789.5 | 9.4 | 8987.8 | 7.8 | 10,001.2 | 8.7 |
| Bare land | 87,558.4 | 77 | 88,417.0 | 77 | 92,665.5 | 80 | 86,131.7 | 74 |
| Total area | 113,912.5 | 100 | 113,912.5 | 100 | 113,912.5 | 100 | 113,912.5 | 100 |
| Land Cover Classes in 1972 (km2) | Land Cover Classes in 2014 (km2) | |||||||
|---|---|---|---|---|---|---|---|---|
| Water | Cultivated Land | Urban/Built-up | Grassland | Forestland | Snow/Ice | Bare Land | Total | |
| Water | 954 | 151 | 0.01 | 157 | 70 | 456 | 974.8 | 2762.8 |
| Cultivated land | 27.1 | 2631 | 205.75 | 711 | 402 | 0.21 | 171.5 | 4148.5 |
| Urban/built-up | 0.23 | 5.9 | 28.99 | 0.1 | 0.02 | 0 | 5 | 40.2 |
| Grassland | 0.12 | 1913 | 13.6 | 2196 | 29.06 | 316 | 311.9 | 4779.6 |
| Forestland | 0.1 | 2328 | 10.74 | 9.4 | 843 | 52.4 | 340.8 | 3584.4 |
| Snow/ice | 1.45 | 1.6 | 0.00 | 38.9 | 0.19 | 8456 | 2340.6 | 10,838.7 |
| Bare land | 79.4 | 4647 | 133.4 | 189.9 | 0.01 | 720.6 | 81,987 | 87,757.4 |
| Total 2014 | 1062.4 | 11,677.5 | 392.4 | 3302.5 | 1344.5 | 10,001.2 | 86,131.6 | 113,911.88 |
| Kashgar * | Maralbishi * | Yarkant * | Tashkorgan * | Kaqun + | Karbel + | Kirik + | ||||||||
|---|---|---|---|---|---|---|---|---|---|---|---|---|---|---|
| Zc | β | Zc | β | Zc | β | Zc | β | Zc | β | Zc | β | Zc | β | |
| T | 5.01 | 0.11 | 3.14 | 0.02 | 4.13 | 0.03 | 2.09 | 0.04 | - | - | - | - | - | - |
| P | 2.59 | 0.57 | 3.05 | 0.12 | 3.19 | 0.46 | 4.15 | 0.23 | - | - | - | - | - | - |
| E | 3.10 | 0.02 | 3.15 | 0.04 | 2.04 | 0.04 | −0.54 | −0.04 | - | - | - | - | - | - |
| R | - | - | - | - | - | - | - | 0.64 | 0.11 | 1.2 | 0.1 | 1.19 | 0.36 | |
© 2018 by the authors. Licensee MDPI, Basel, Switzerland. This article is an open access article distributed under the terms and conditions of the Creative Commons Attribution (CC BY) license (http://creativecommons.org/licenses/by/4.0/).
Share and Cite
Maimaitiaili, A.; Aji, X.; Matniyaz, A.; Kondoh, A. Monitoring and Analysing Land Use/Cover Changes in an Arid Region Based on Multi-Satellite Data: The Kashgar Region, Northwest China. Land 2018, 7, 6. https://doi.org/10.3390/land7010006
Maimaitiaili A, Aji X, Matniyaz A, Kondoh A. Monitoring and Analysing Land Use/Cover Changes in an Arid Region Based on Multi-Satellite Data: The Kashgar Region, Northwest China. Land. 2018; 7(1):6. https://doi.org/10.3390/land7010006
Chicago/Turabian StyleMaimaitiaili, Ayisulitan, Xiaokaiti Aji, Akbar Matniyaz, and Akihiko Kondoh. 2018. "Monitoring and Analysing Land Use/Cover Changes in an Arid Region Based on Multi-Satellite Data: The Kashgar Region, Northwest China" Land 7, no. 1: 6. https://doi.org/10.3390/land7010006