Berenty Reserve—A Gallery Forest in Decline in Dry Southern Madagascar—Towards Forest Restoration

 and
and
Abstract
:1. Introduction
2. Methods and Materials
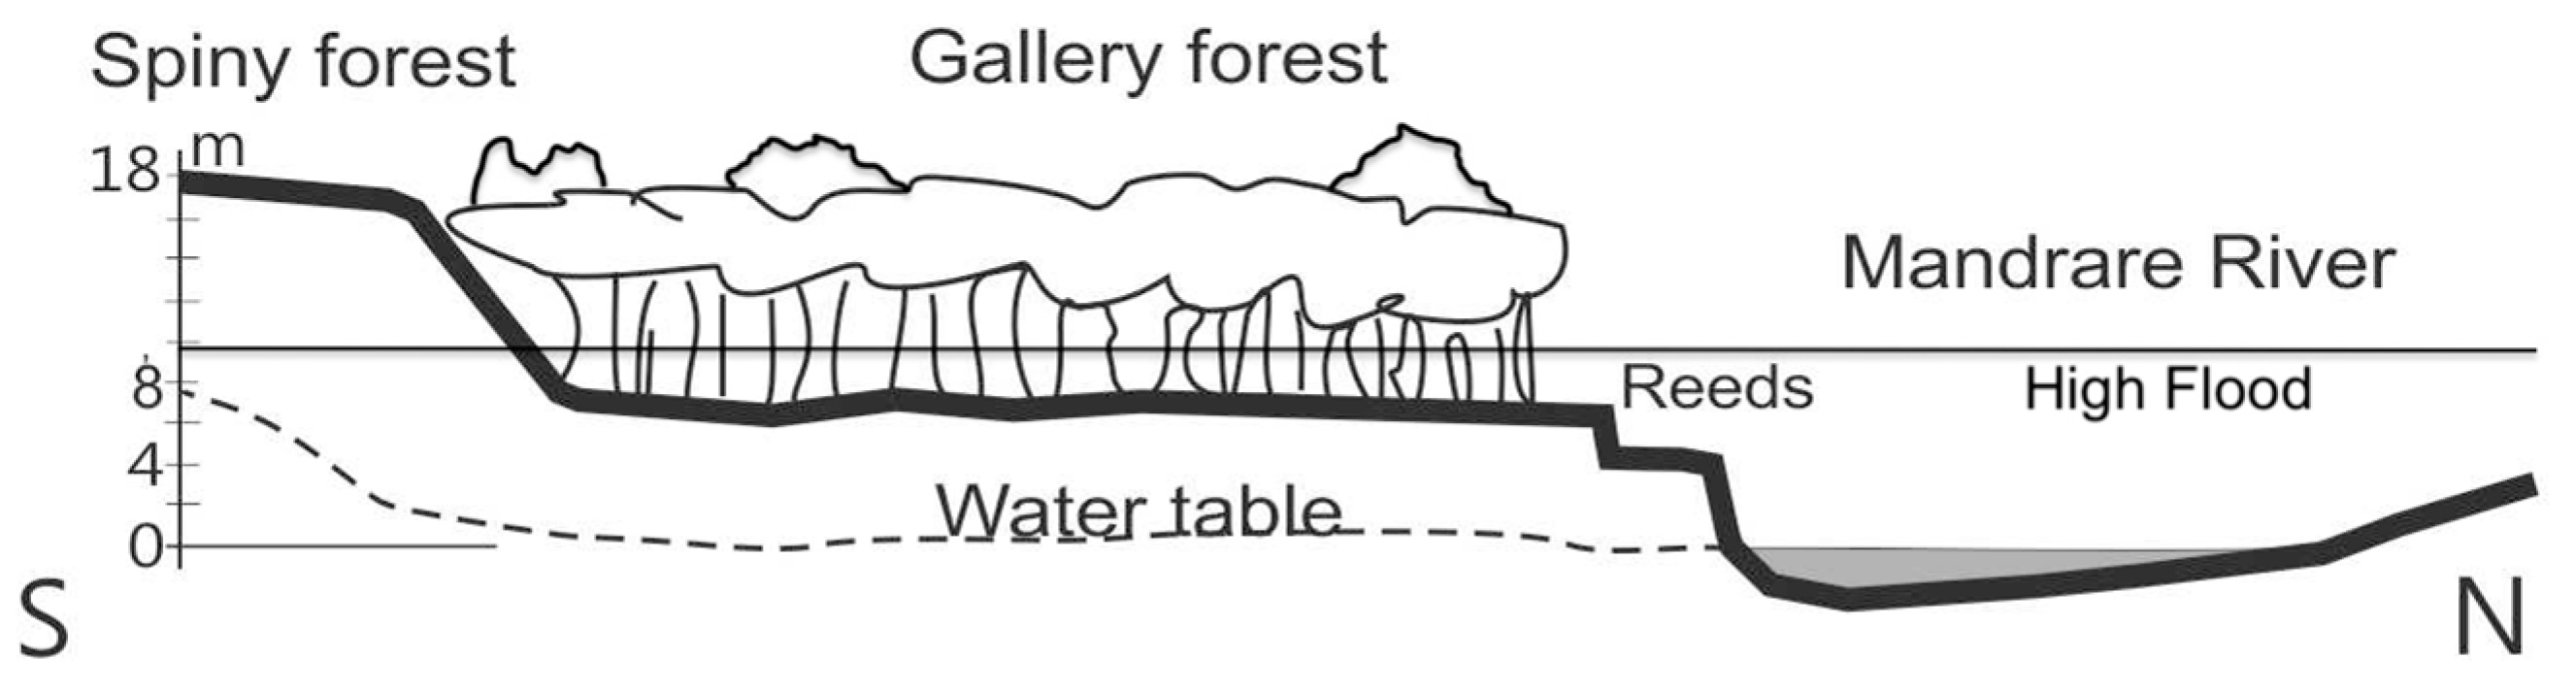
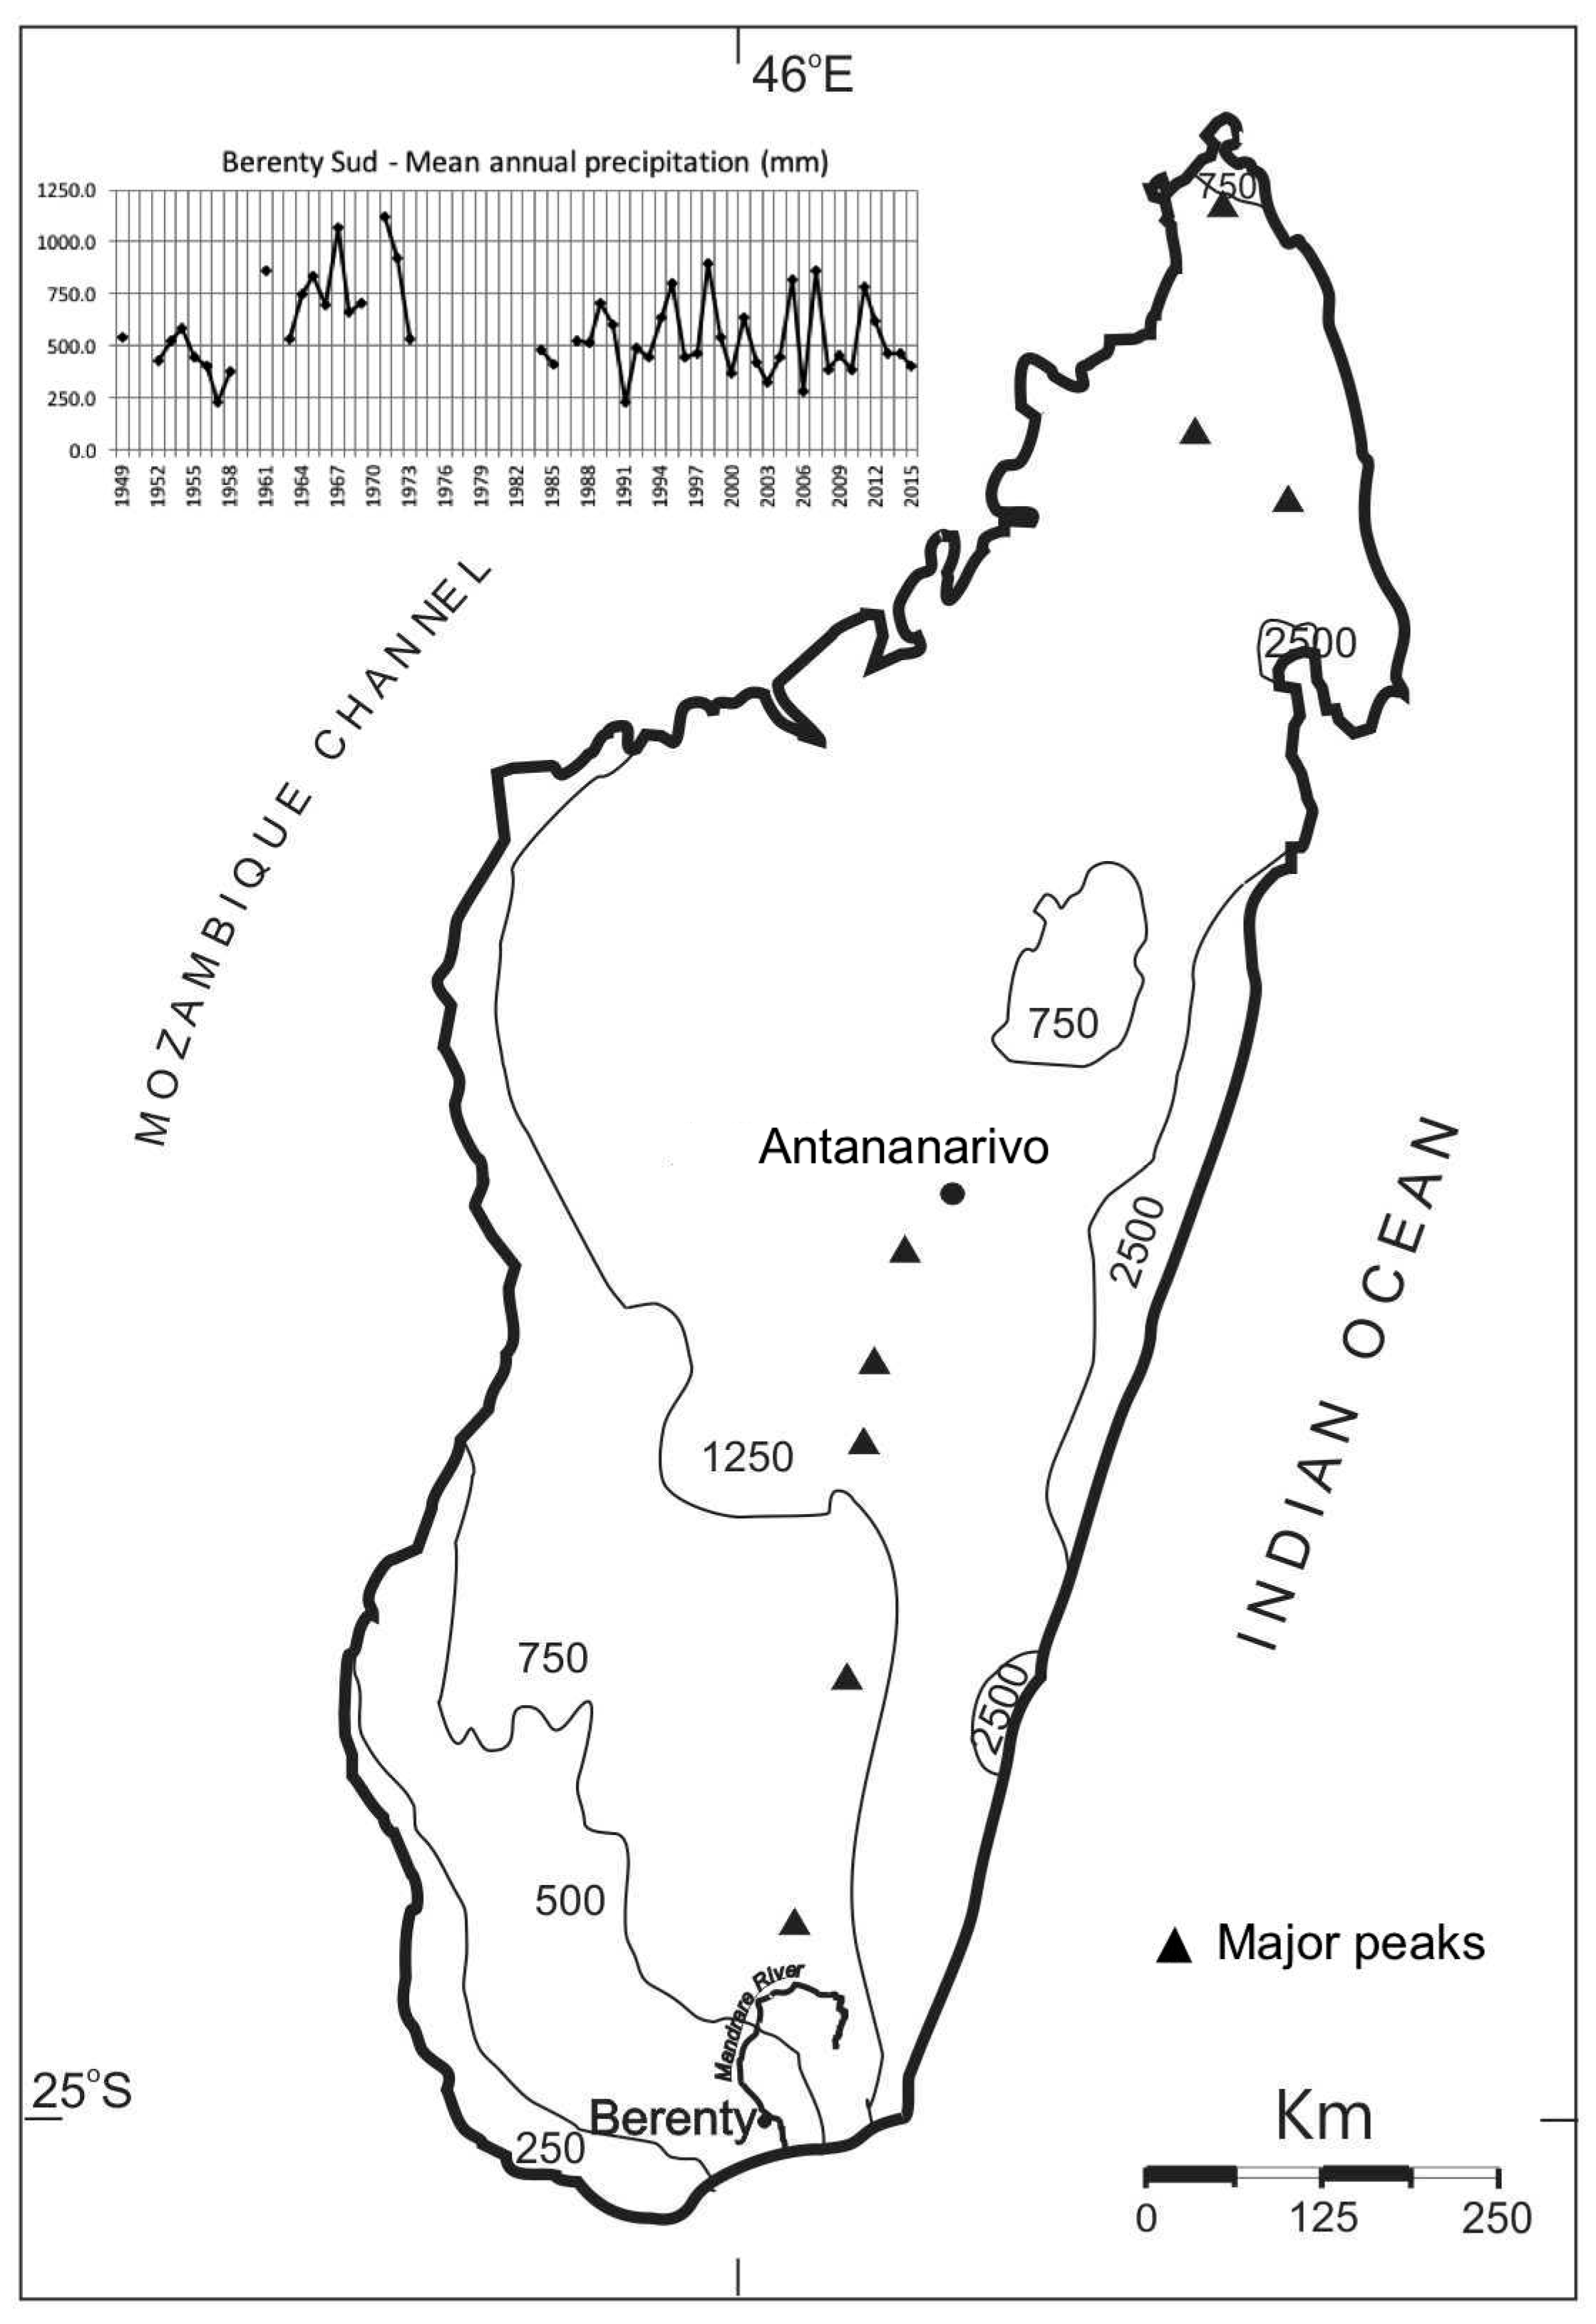
2.1. Study Area
2.2. Objectives
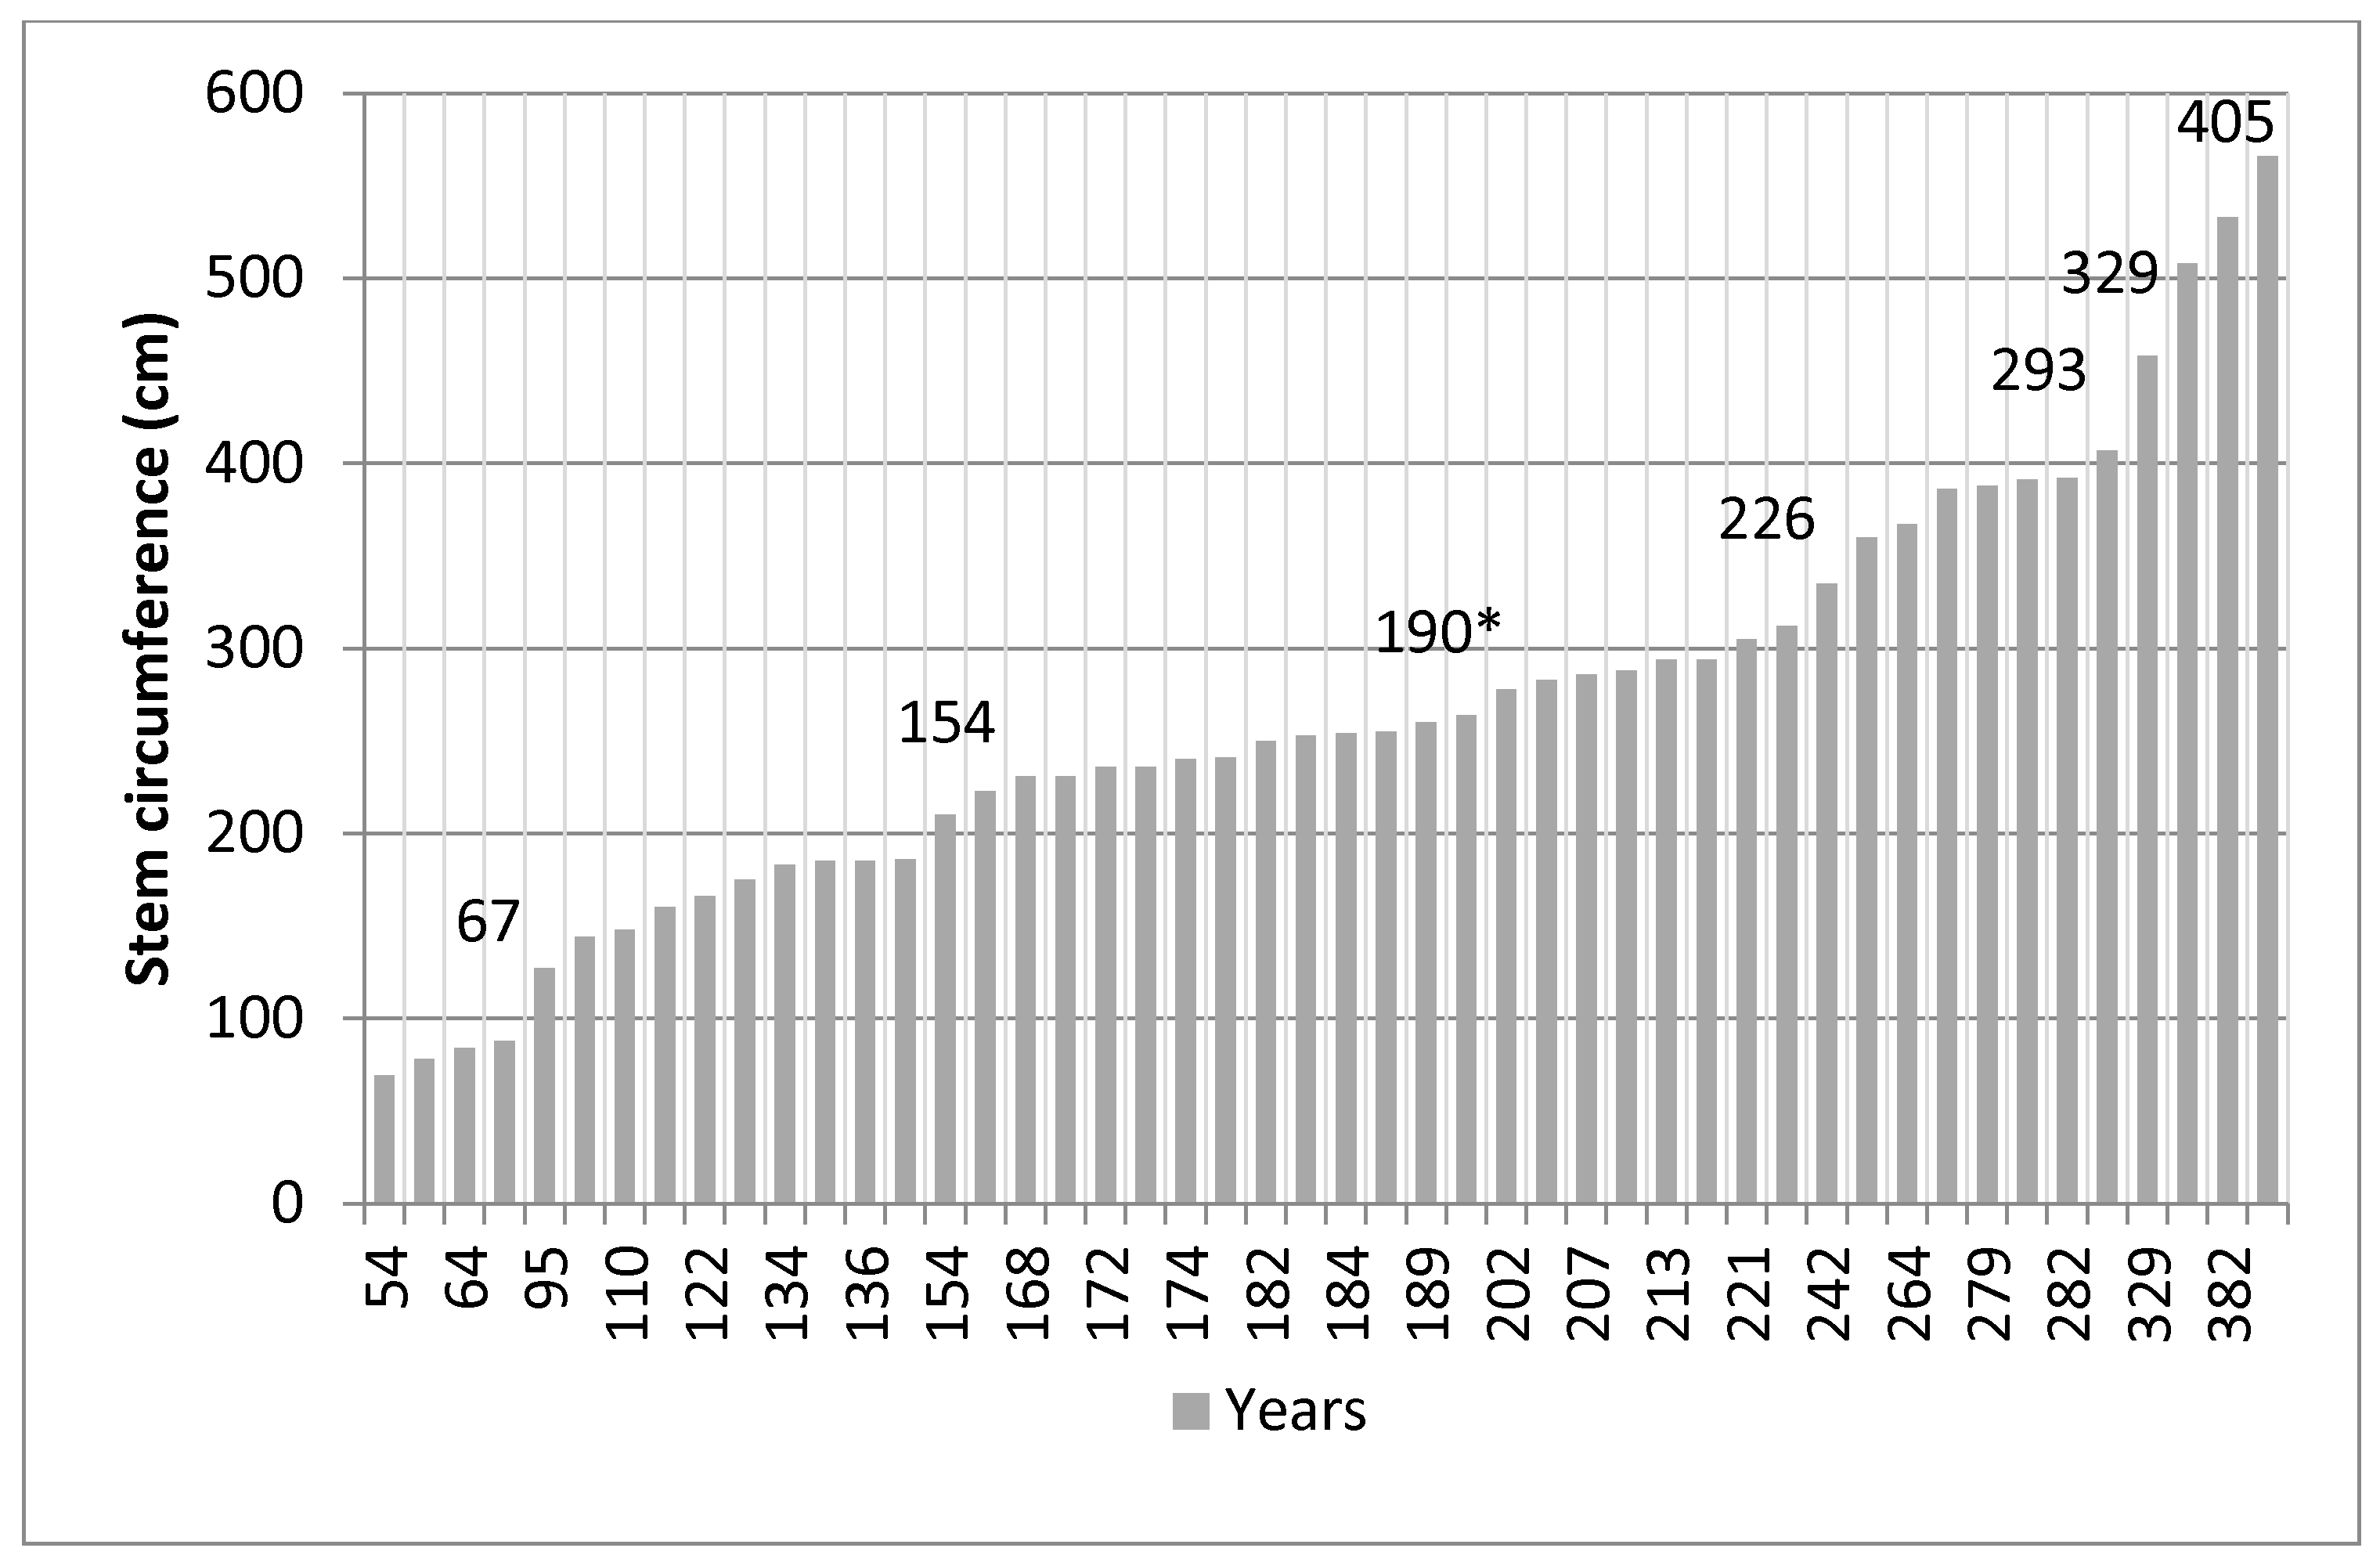
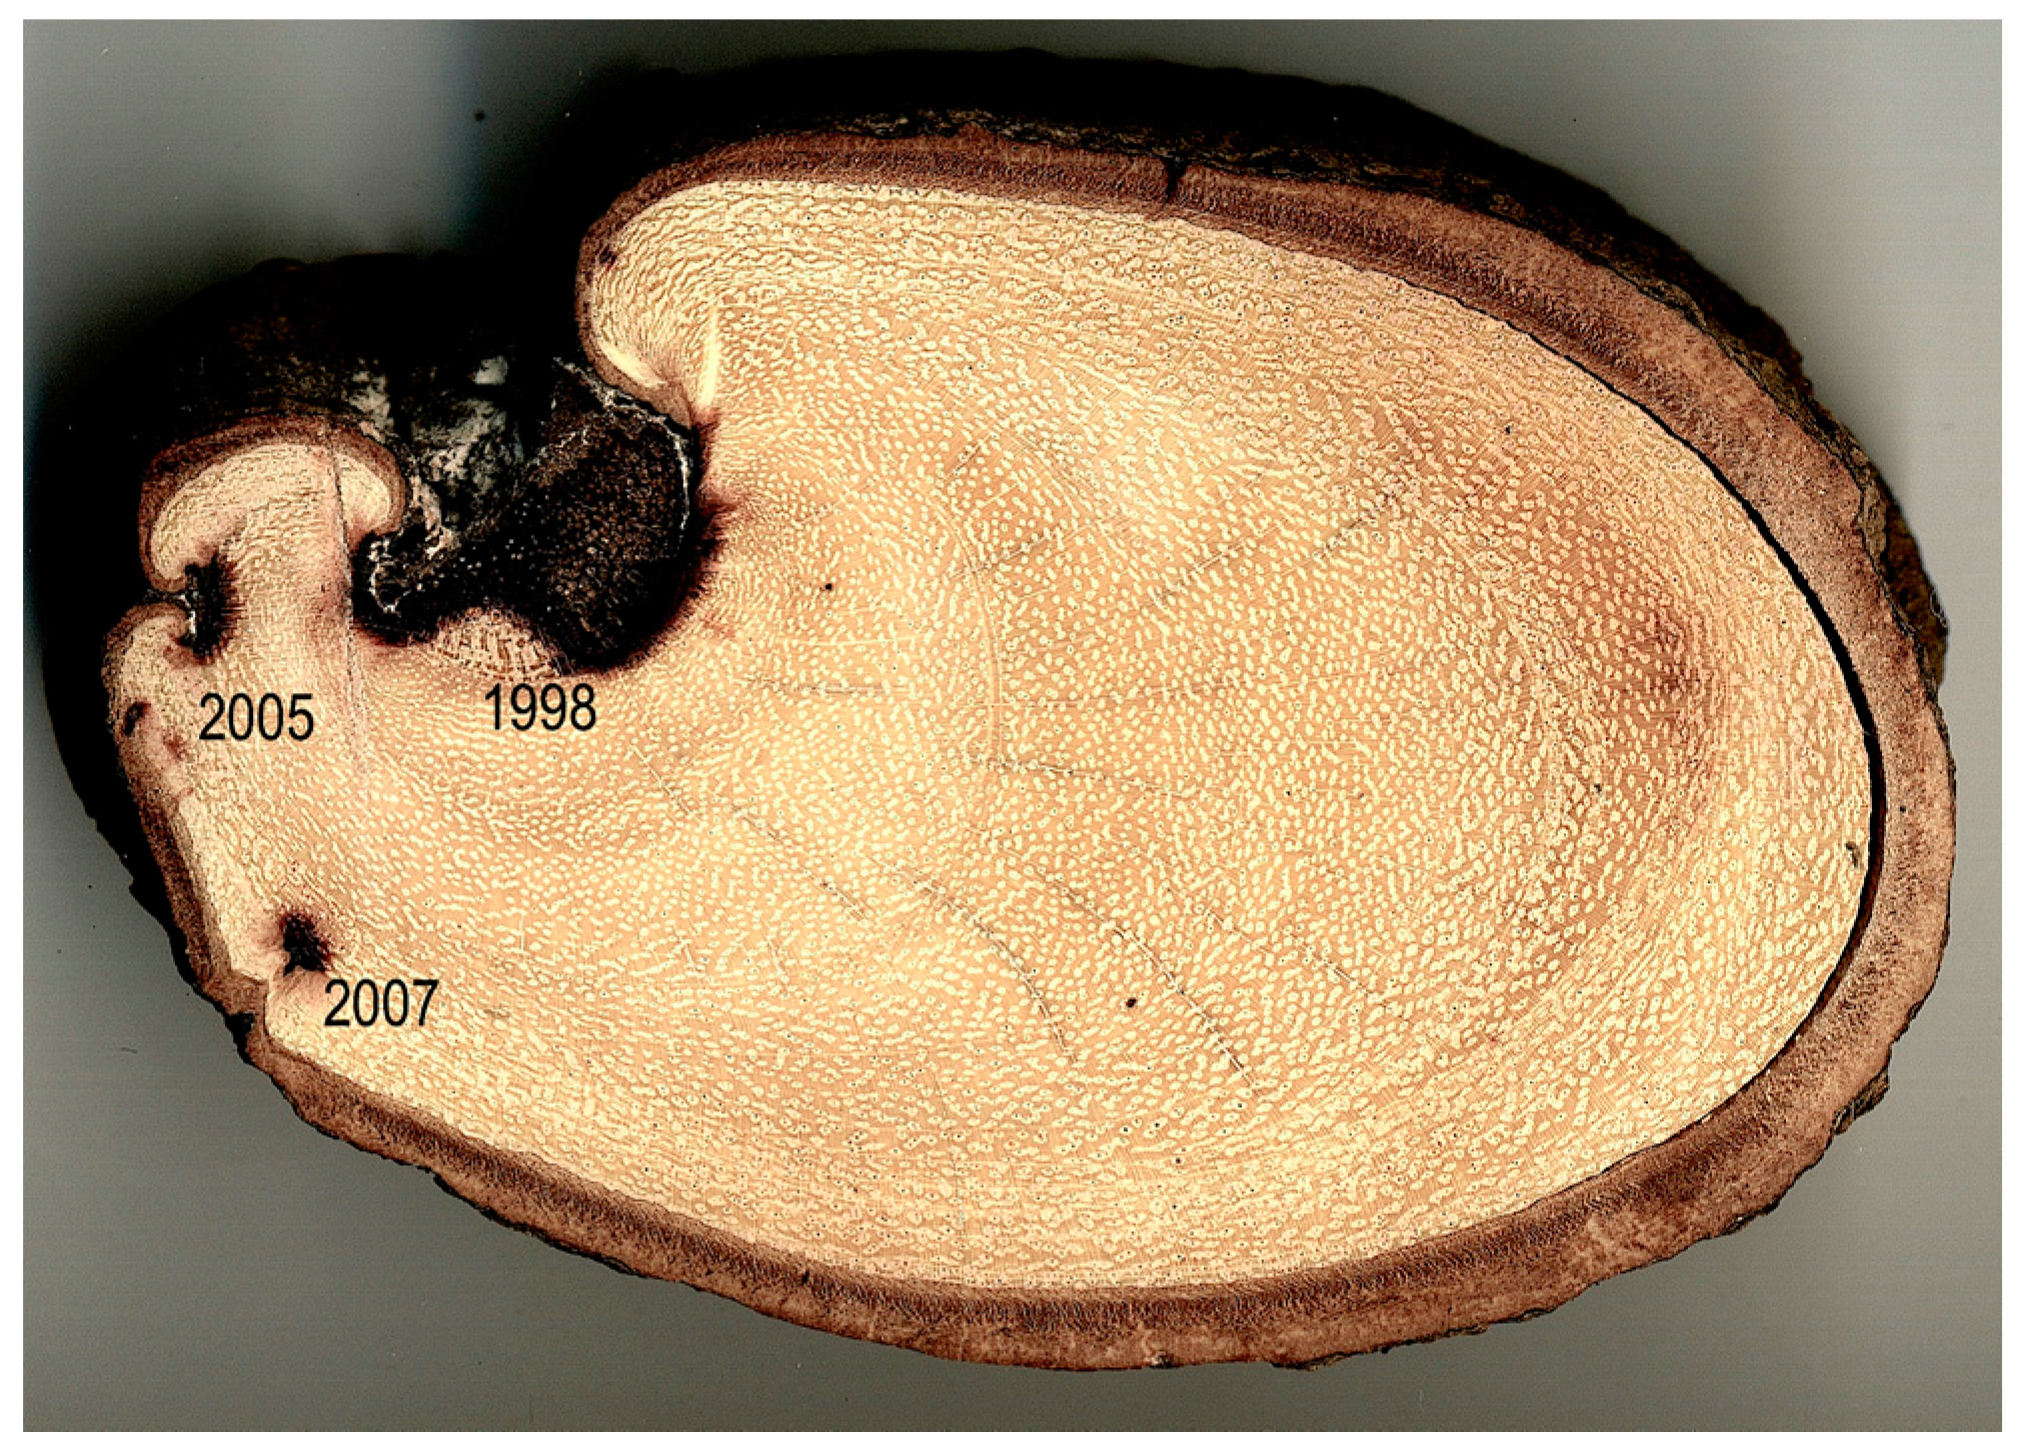
2.3. Tree Age
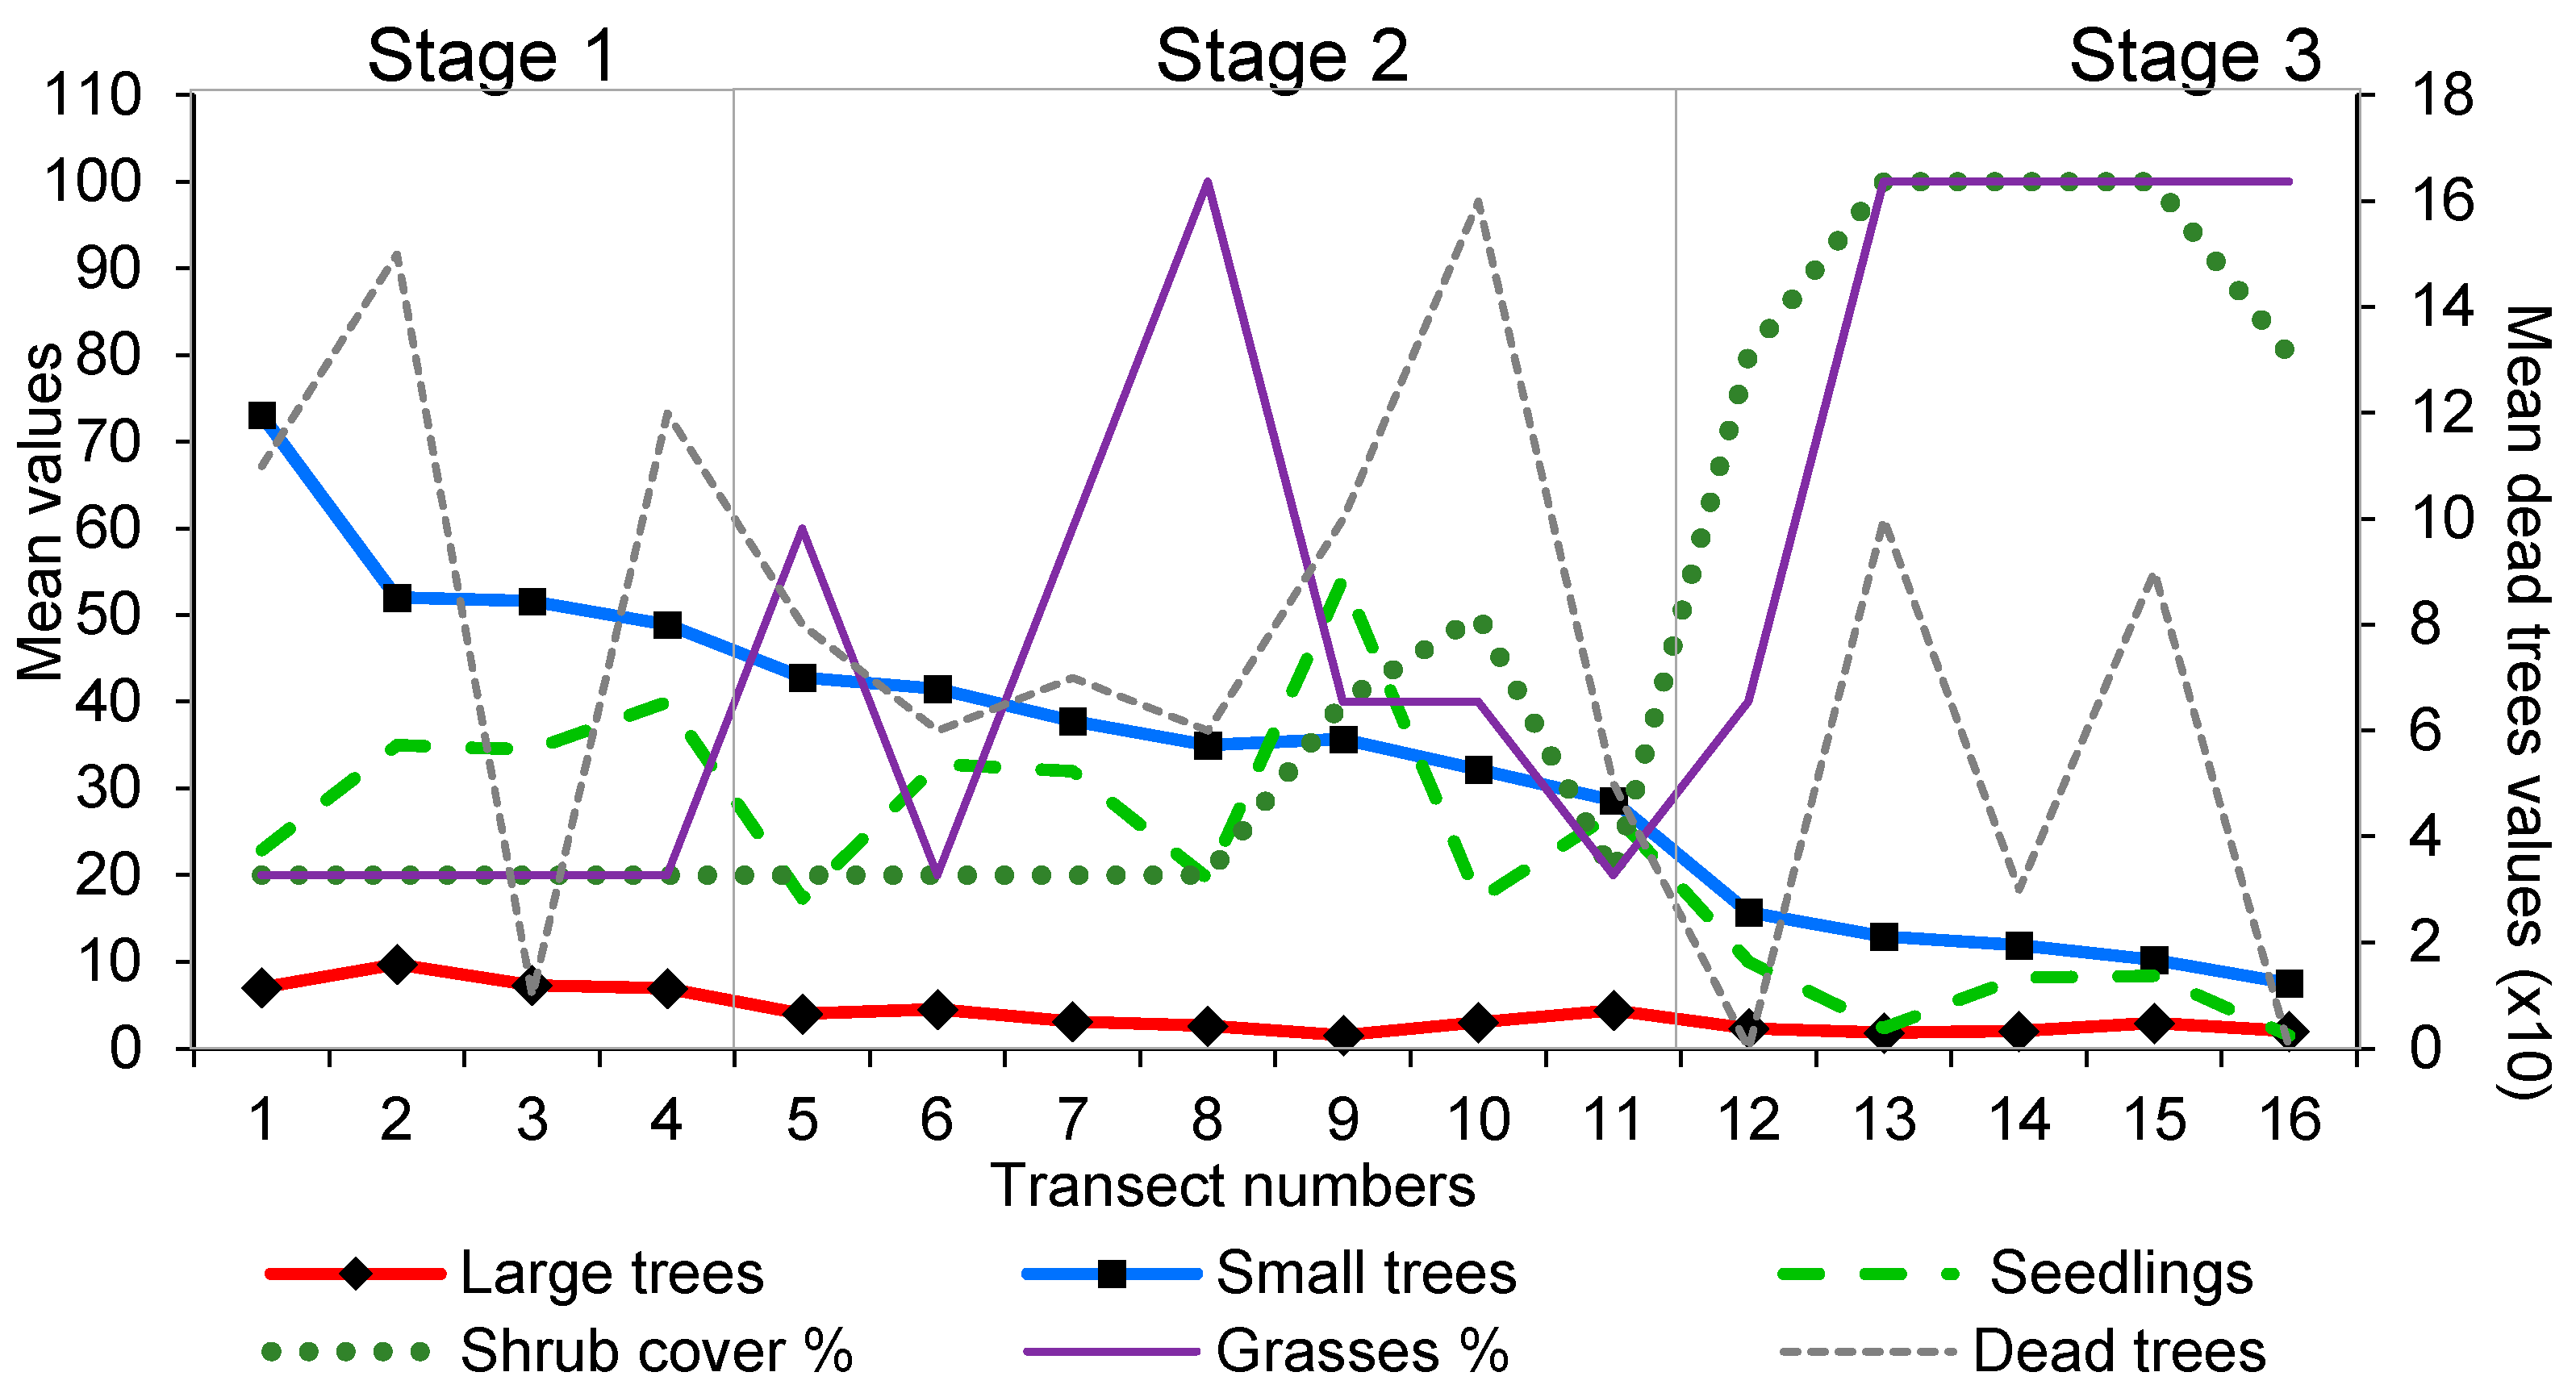
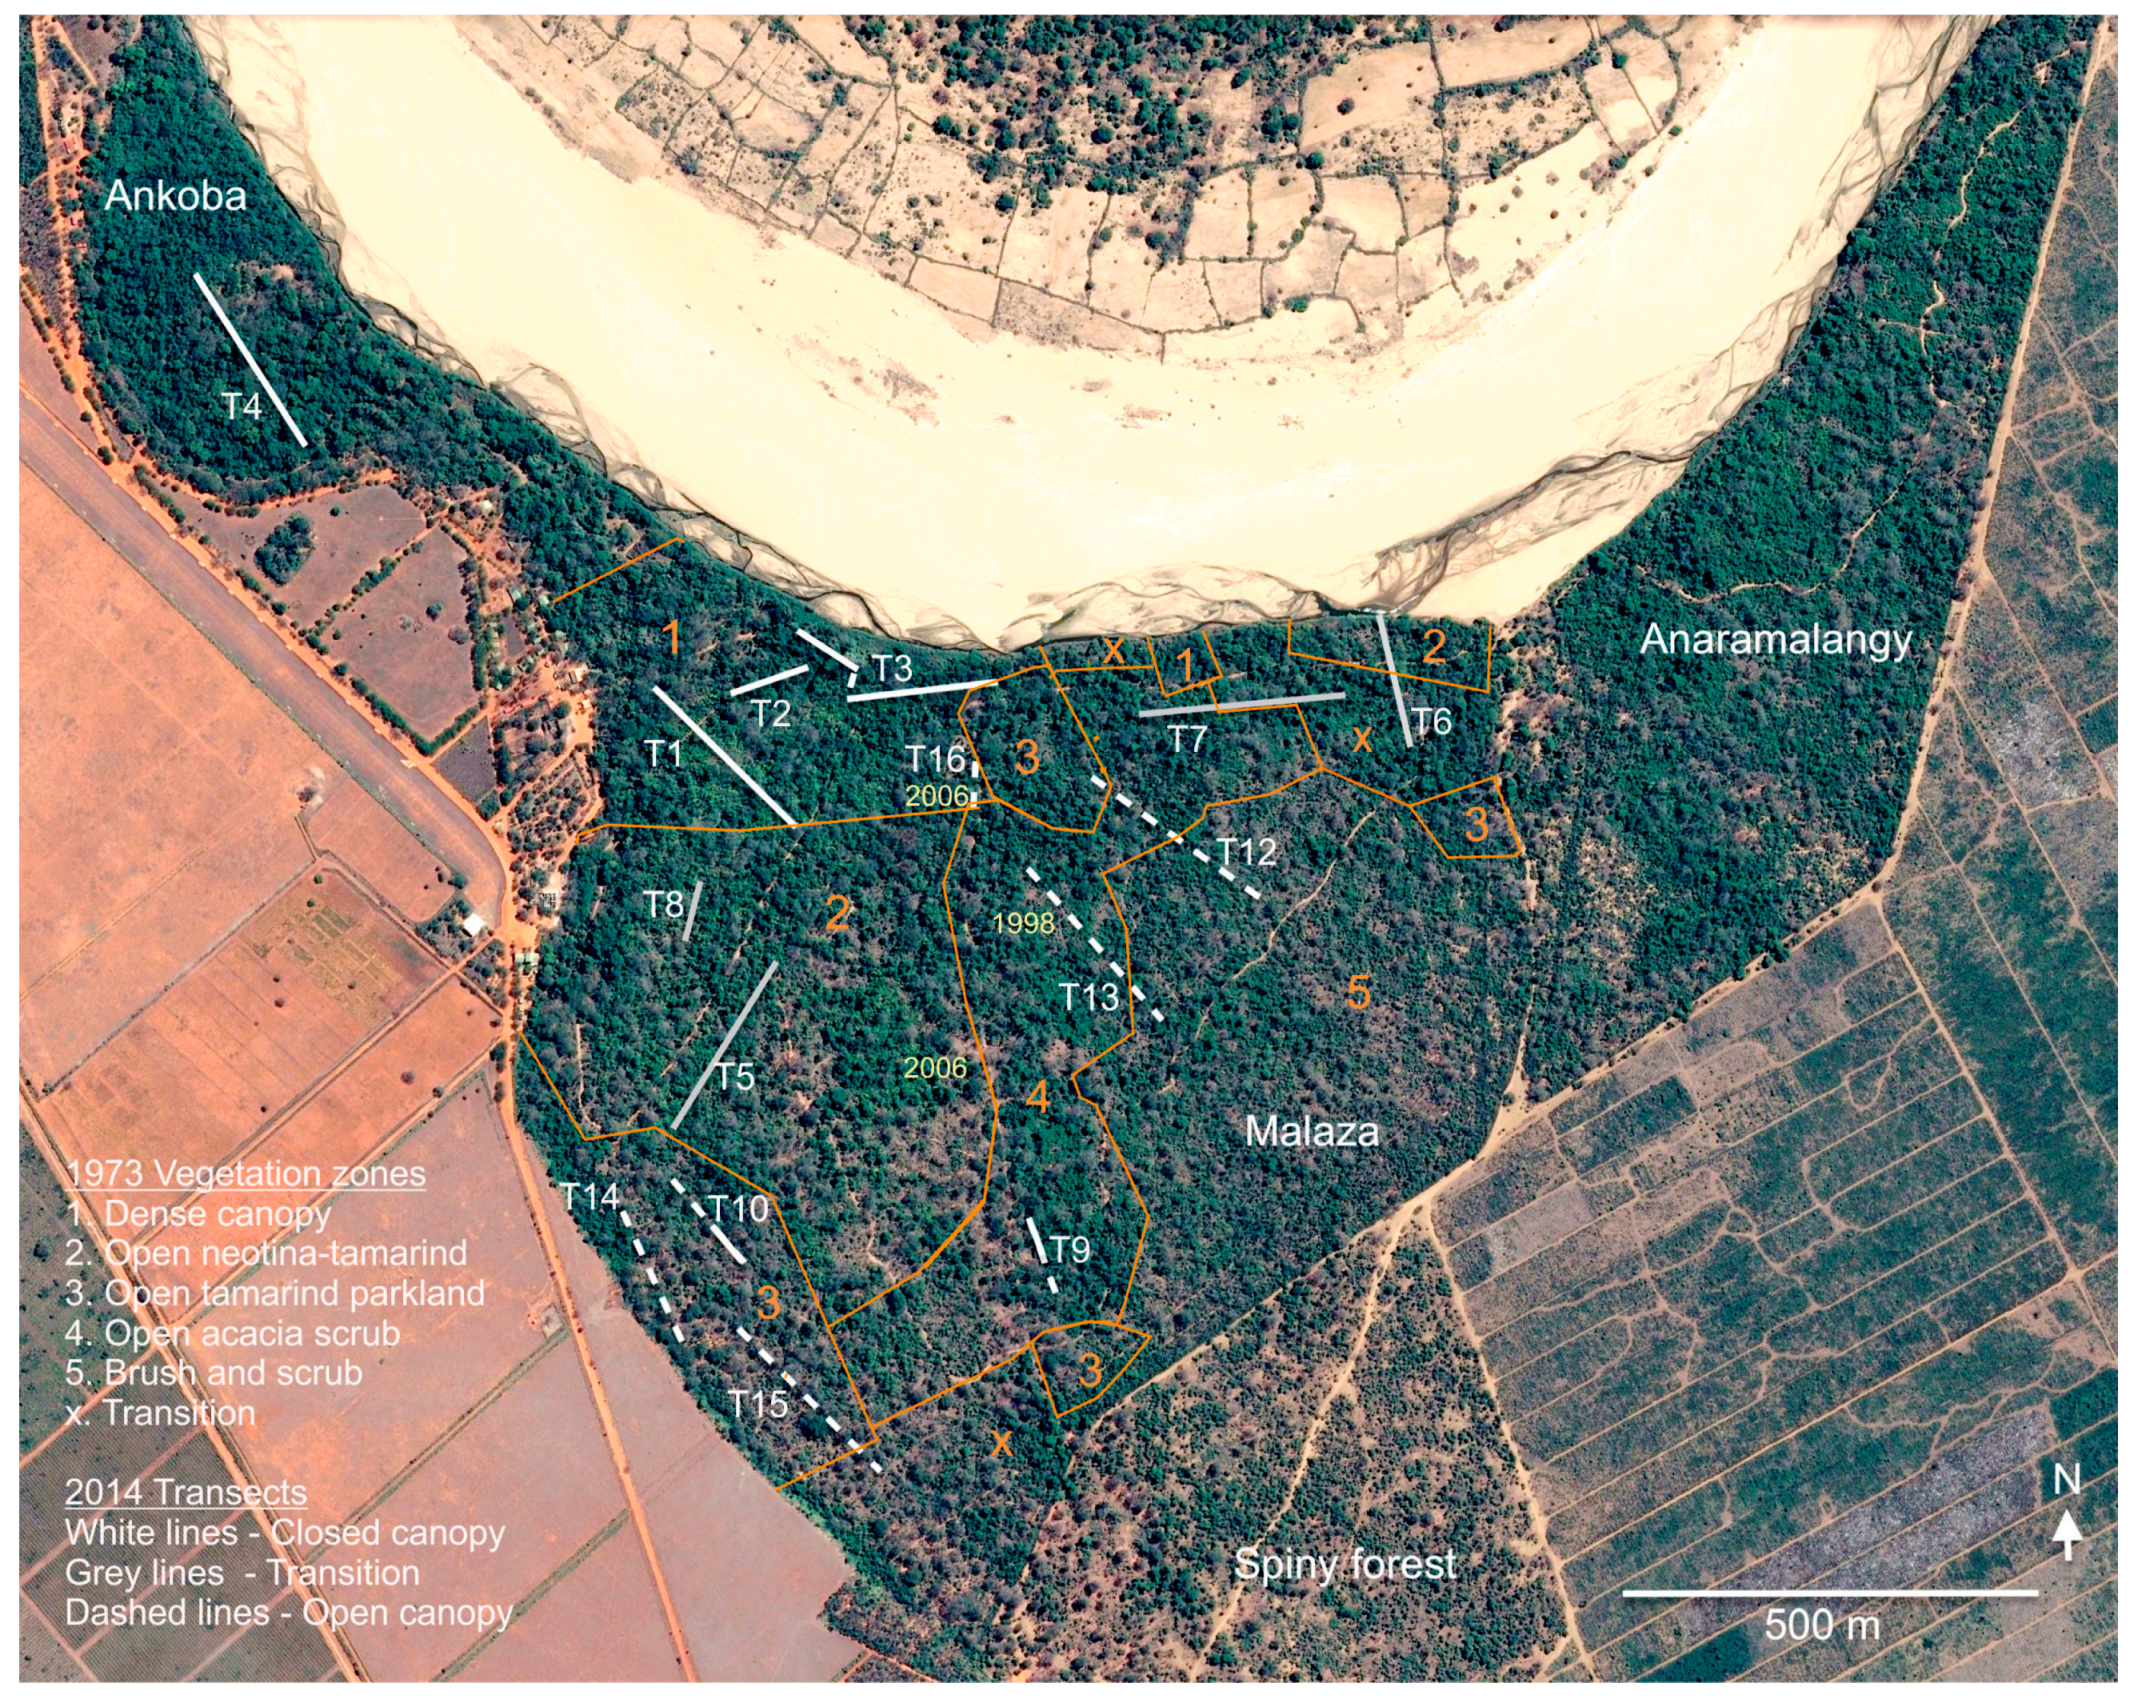
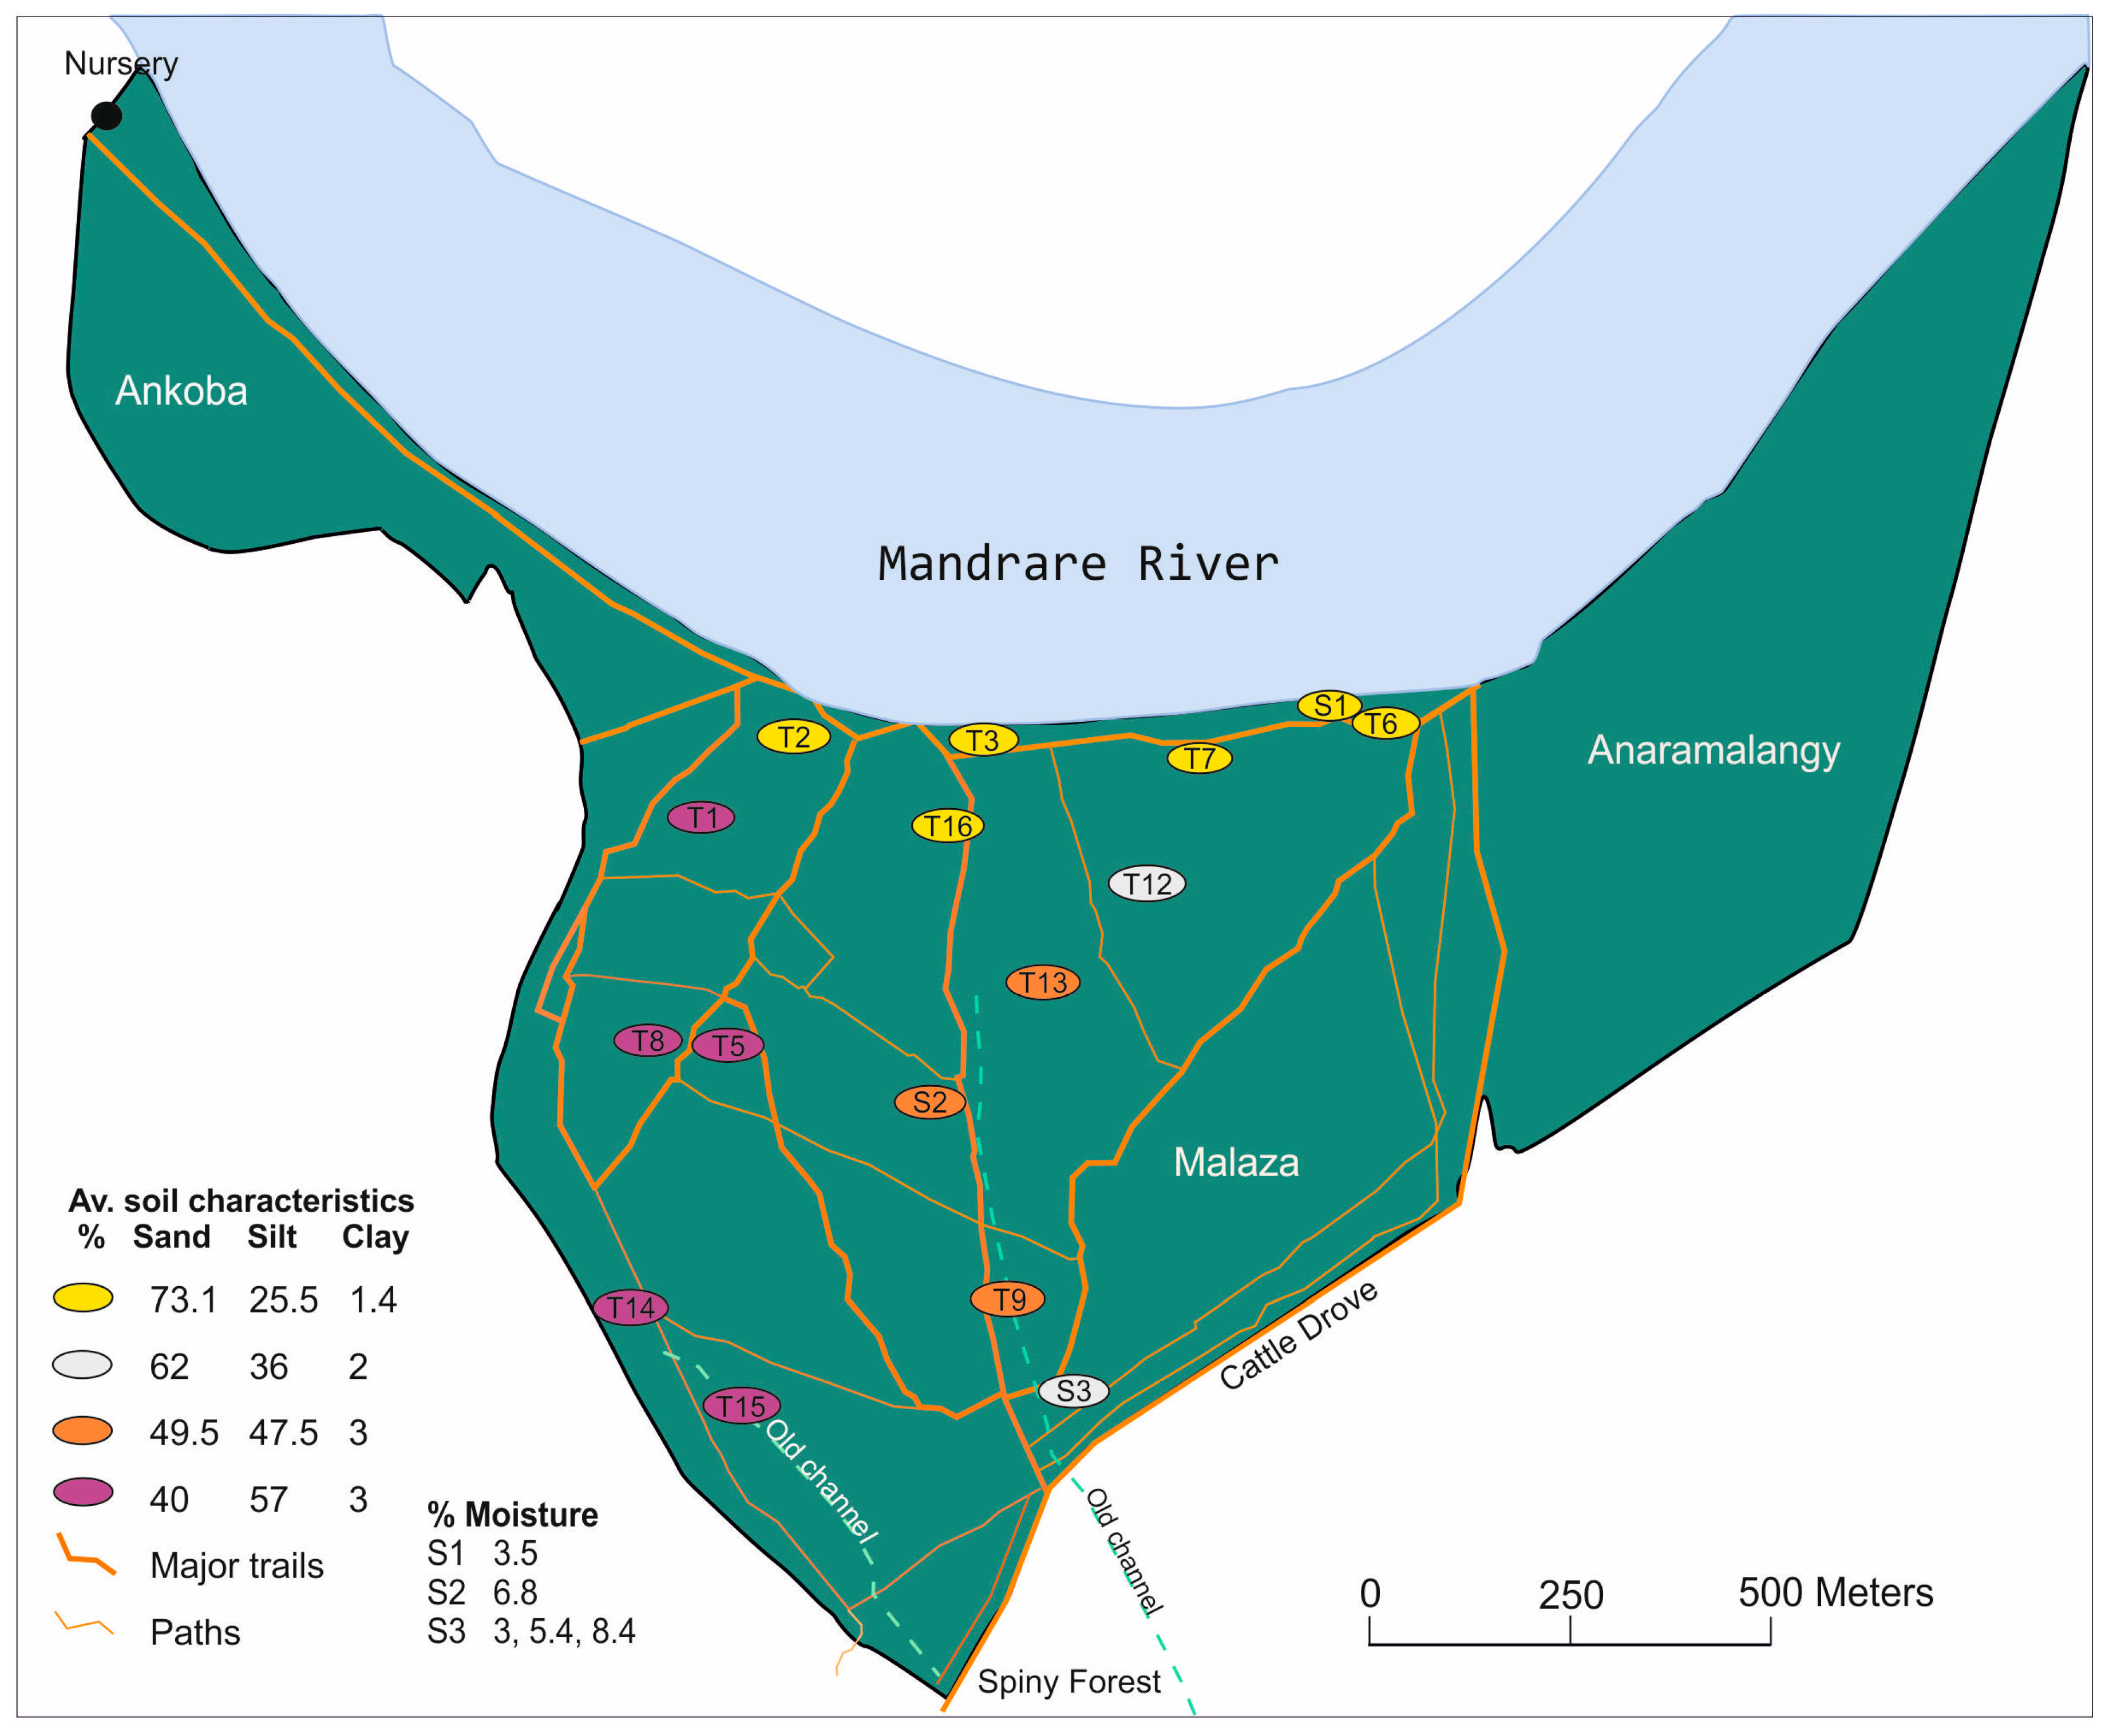
2.4. Vegetation Survey
- Stage 1: at least 25 regenerants per circle, few shrubs and grasses and a high number of tree seedlings.
- Stage 2: at least 25 regenerants per circle, a moderate to low cover of shrubs and tree cover that is frequently insufficient to shade out the grasses. Large-tree numbers are declining as are seedling numbers.
- Stage 3: fewer than 25 regenerants per circle, shrubs and grasses dominate, large trees are rare and seedling numbers are greatly reduced.
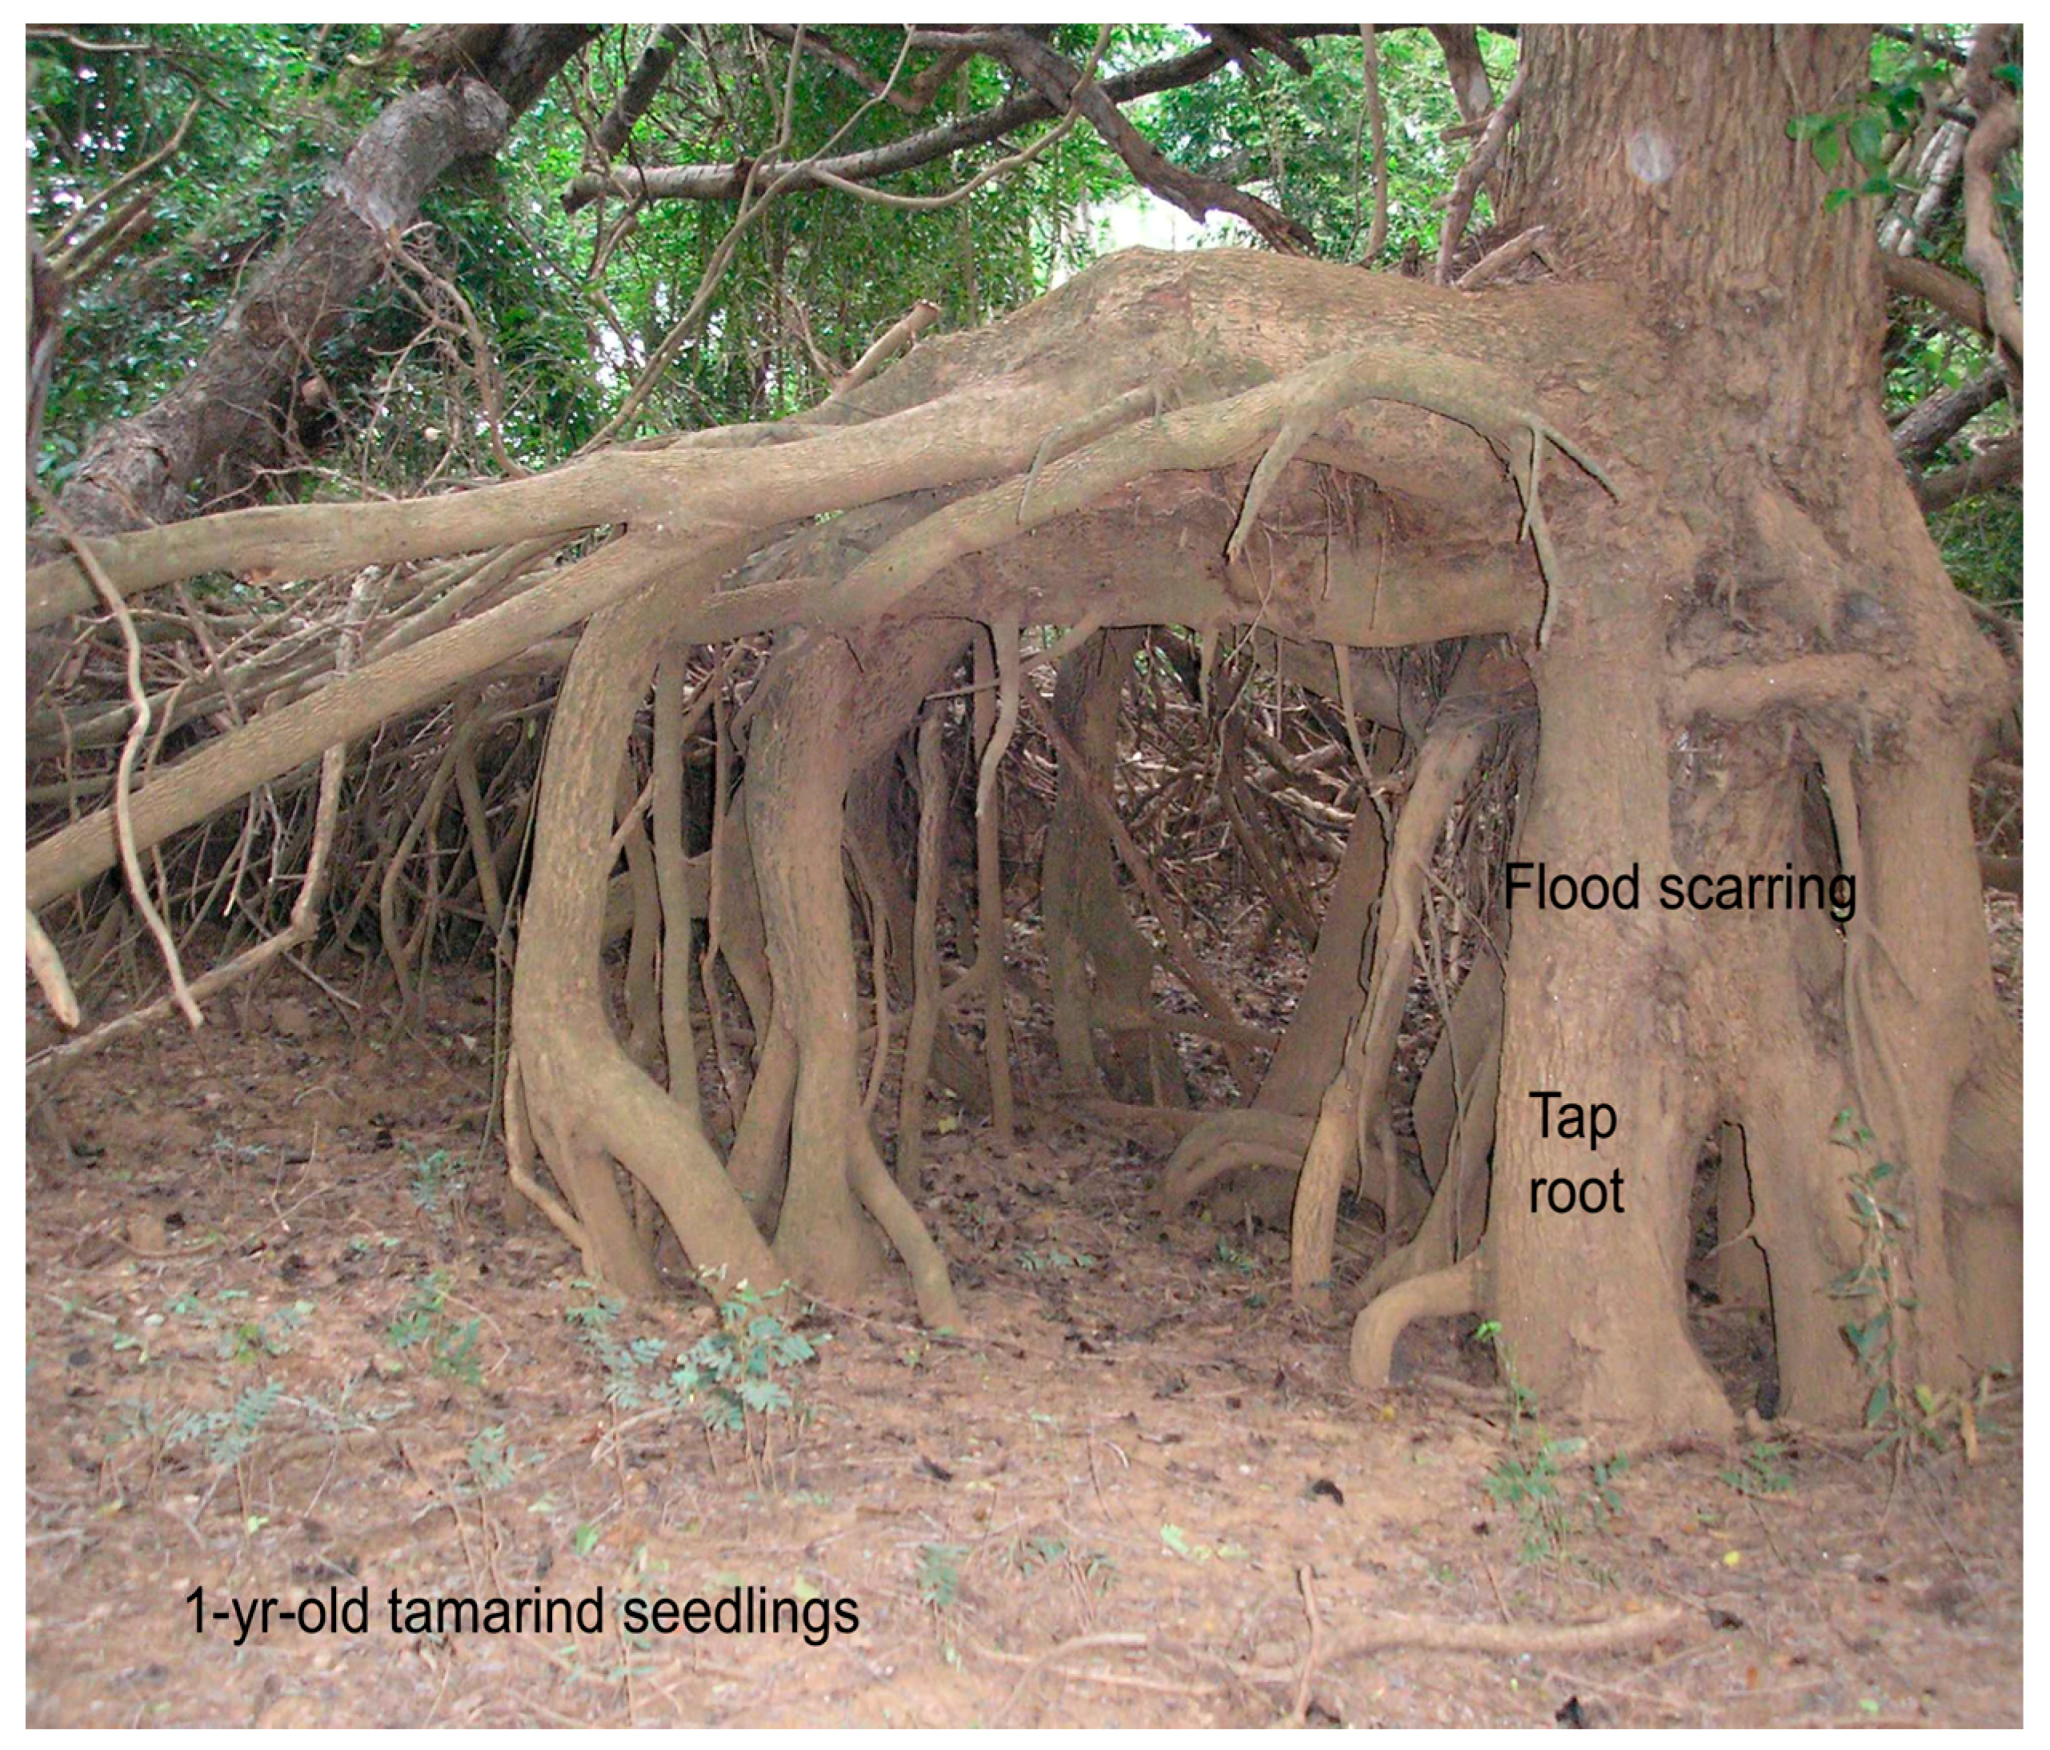
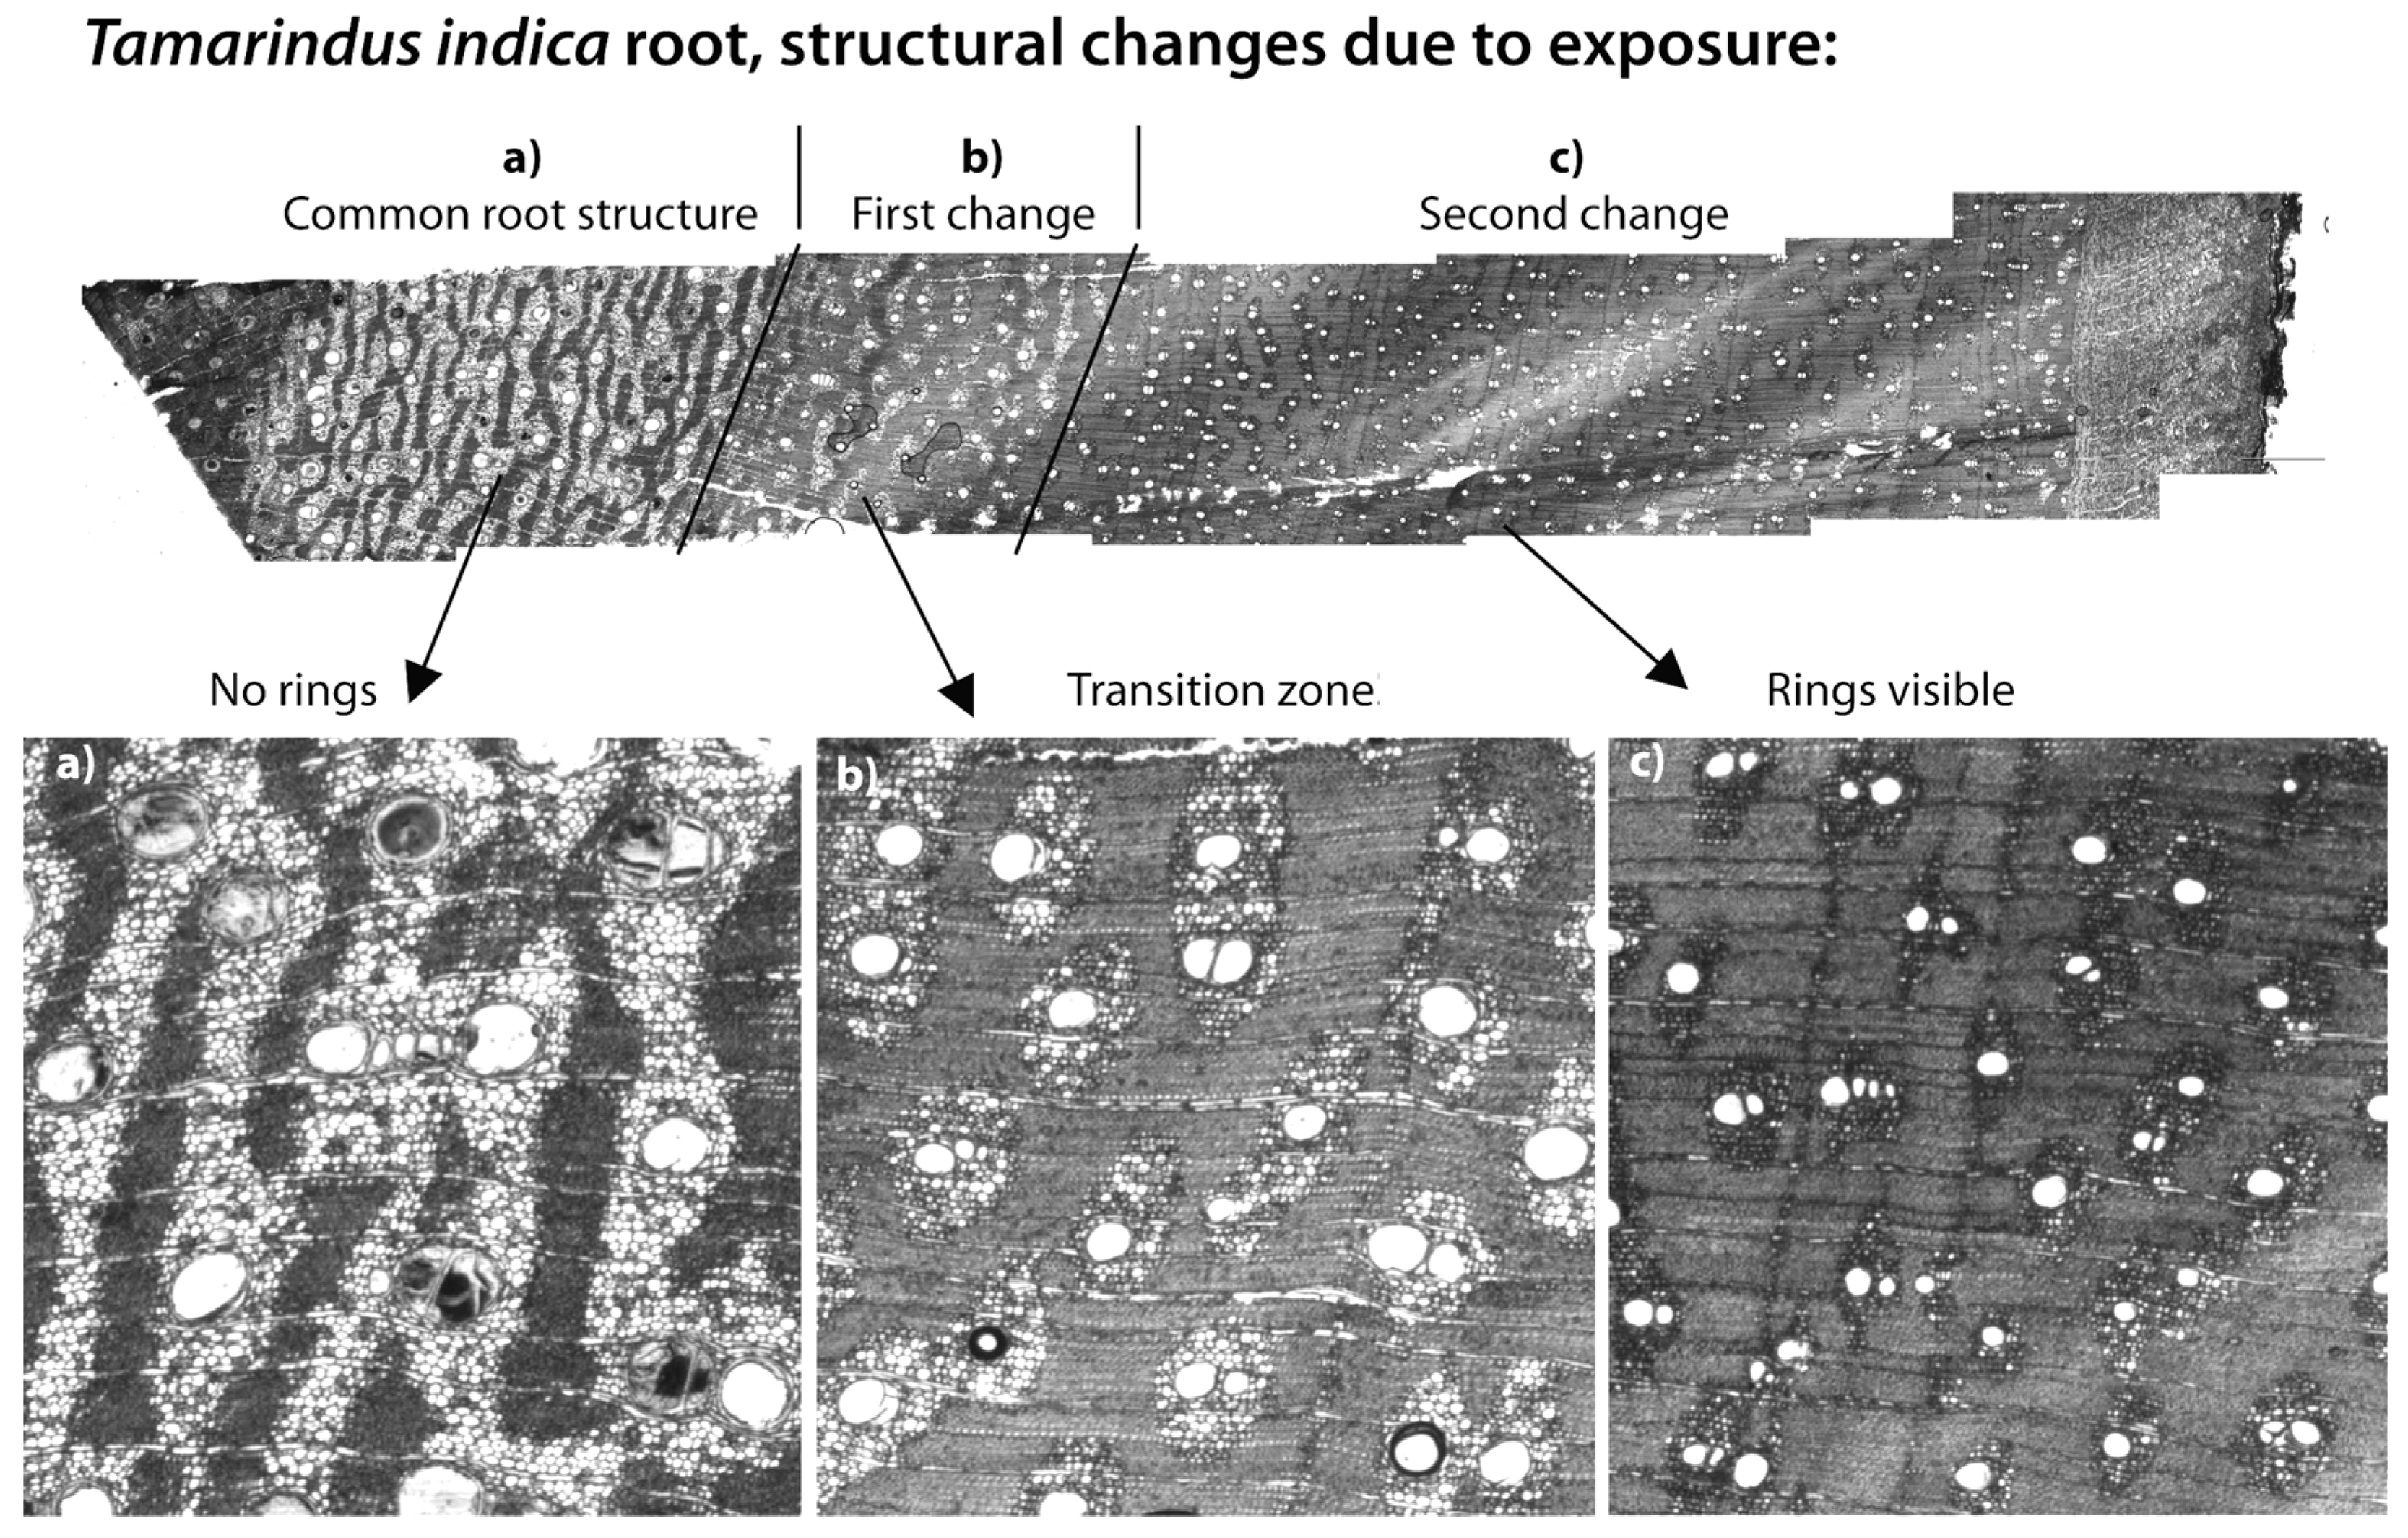
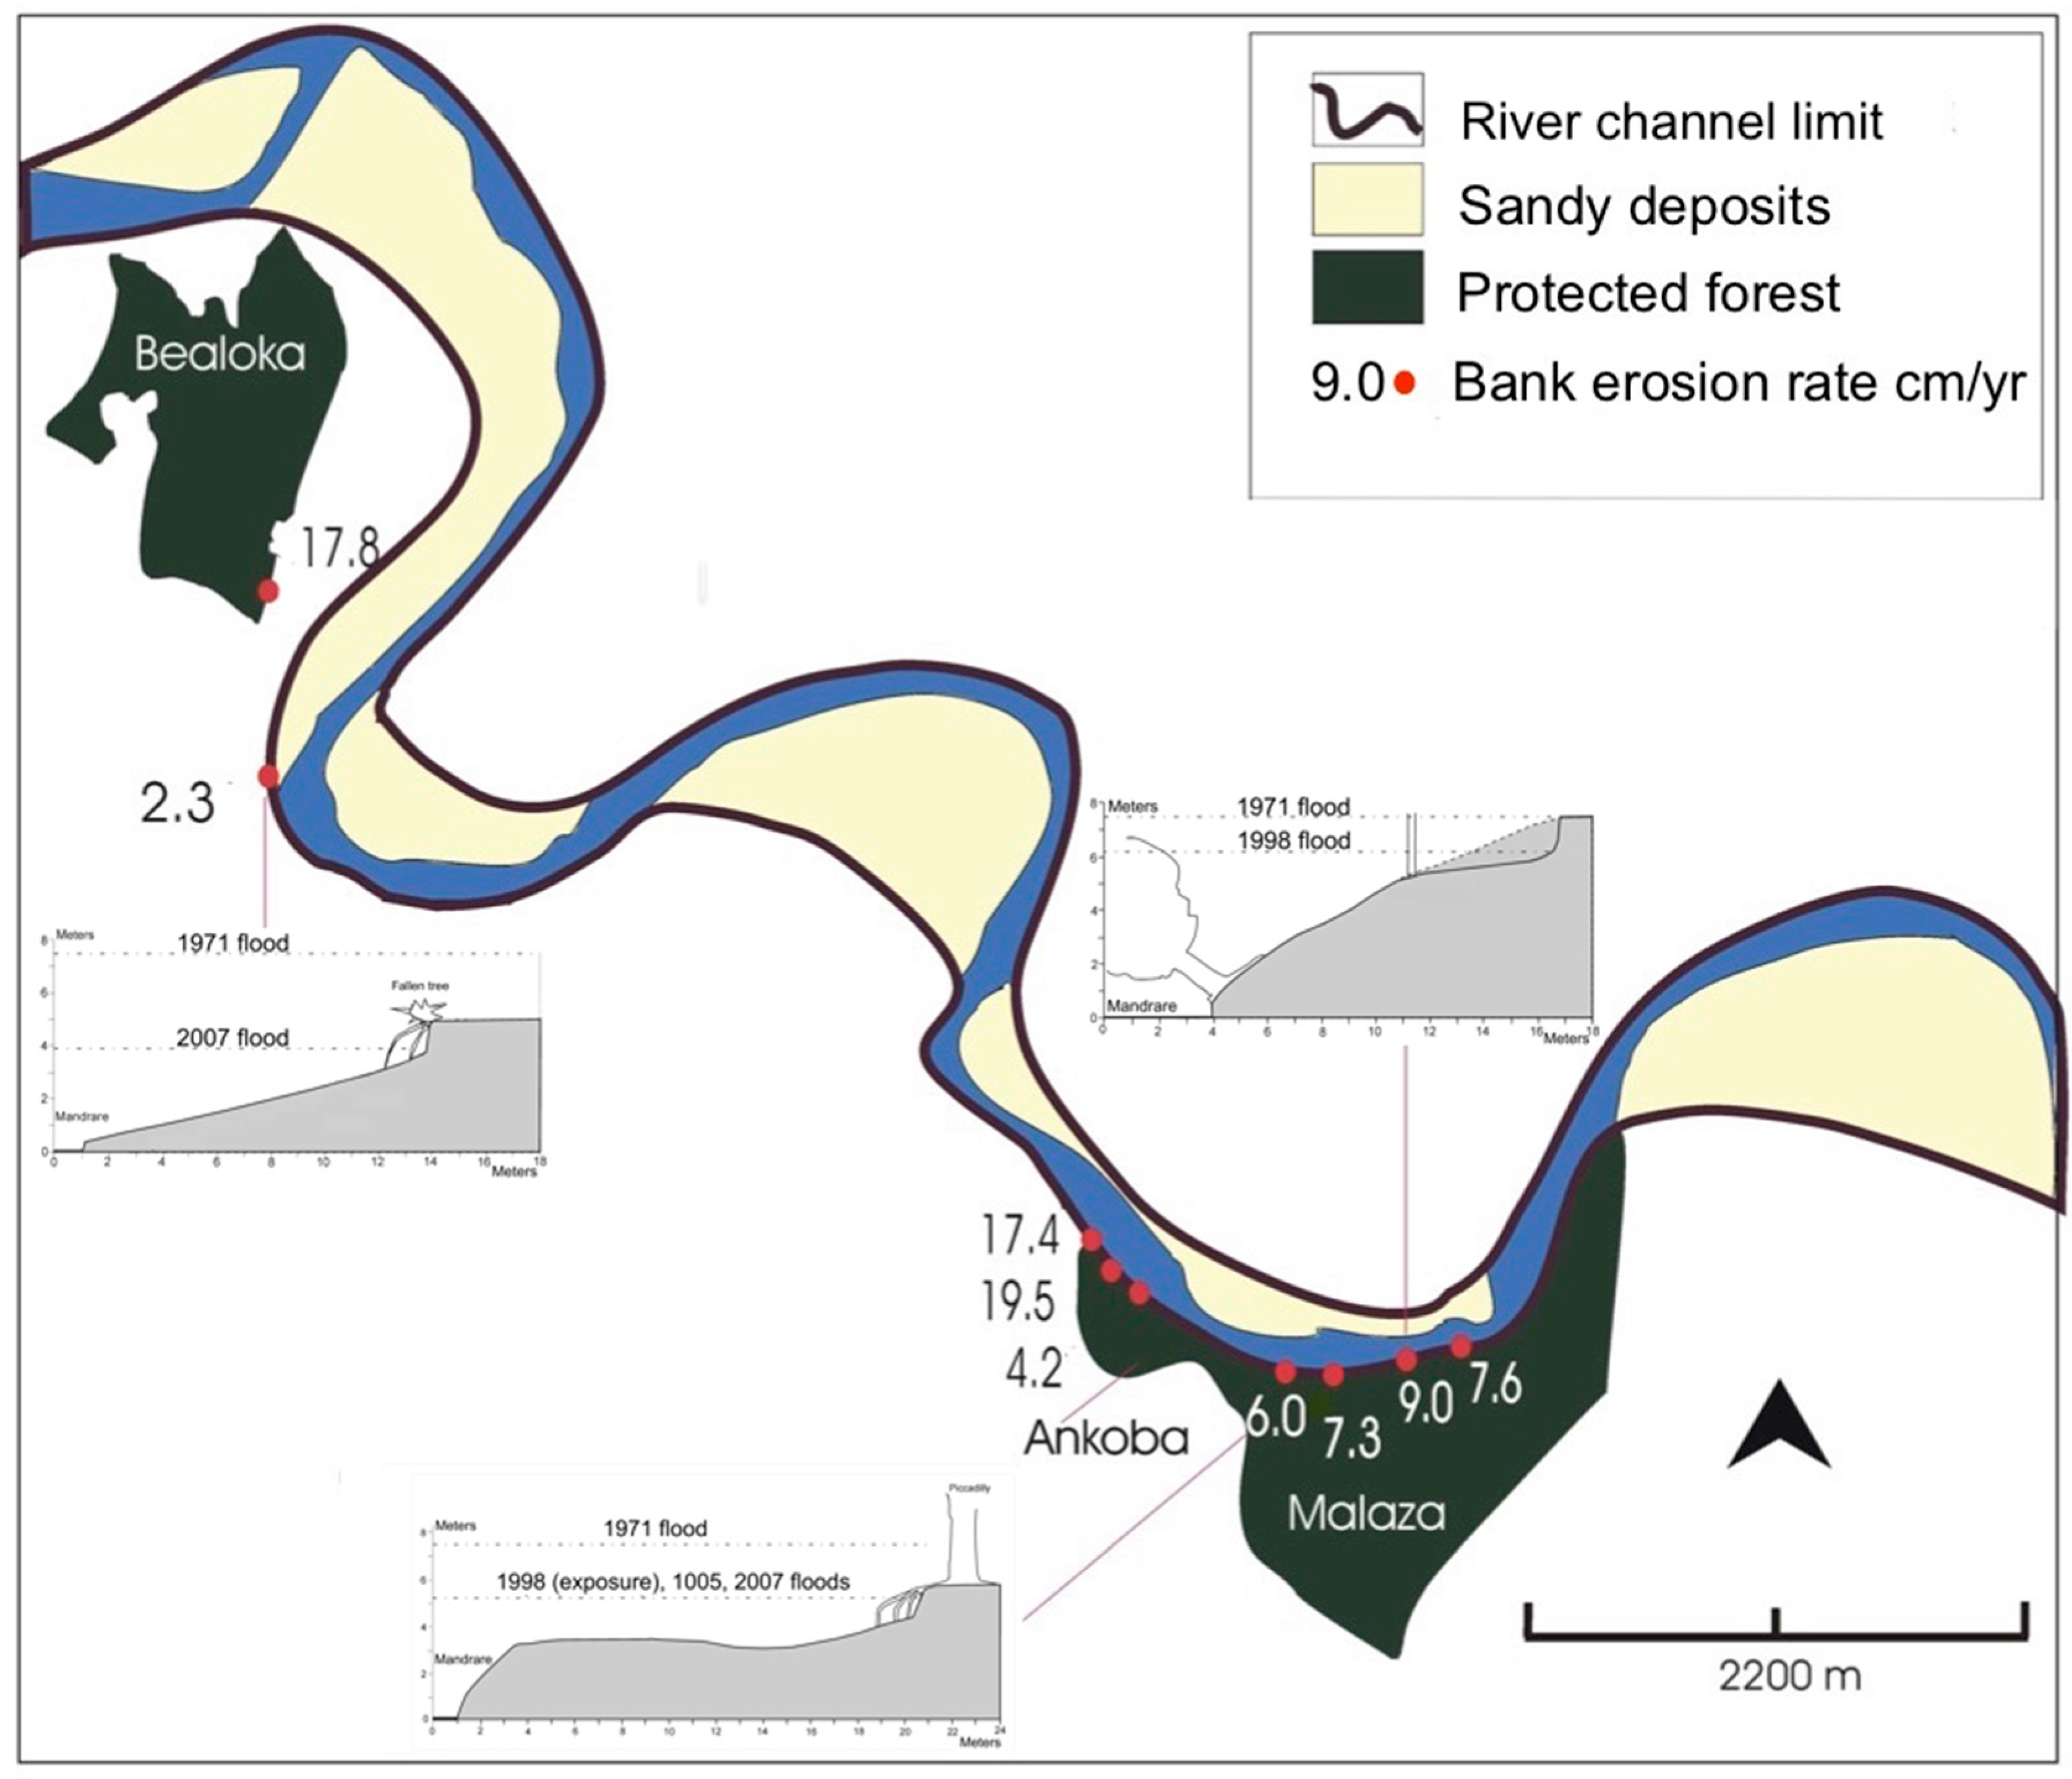
2.5. Riverbank Erosion and Roots
2.6. Soil Analysis and Leaf Identification
3. Results
3.1. Tree Age and Regeneration
3.2. Vegetation Survey
3.3. Riverbank Erosion
3.4. Soil Analysis
4. Discussion
4.1. Tamarind Age and Regeneration
4.2. Cissus Quadrangularis, Pests and Pathogens
4.3. Climate
4.4. Growth Variables
4.5. Limitations
4.6. Future Intervention and Work
5. Summarizing Remarks
- Firstly, almost 50% of the tamarinds in Malaza are nearing the accepted 200-year life span of the species, although this study finds that exceptionally advantaged specimens can live twice as long (Figure 5).
- Secondly, the loss of ageing tamarinds and lack of tamarind regeneration under the continuous canopy will lead to changes in vegetation character. Either lower-canopy species will predominate, with Neotina, Acacia, Albitzia and the occasional surviving tamarind providing a thin upper canopy (as in our Stage 2 zone); or
- thirdly, wherever there are large sunlit gaps Cissus will invade and overwhelm all seedlings and young trees, as is currently occurring in stage 3 areas and increasingly in stage 2 (Figure 6).
Acknowledgments
Author Contributions
Conflicts of Interest
References
- Waeber, P.O.; Wilmé, L.; Ramamonjisoa, B.; Garcia, C.; Rakotomalala, D.; Rabemananjara, Z.H.; Kull, C.A.; Ganzhorn, J.U.; Sorg, J.-P. Dry forests in Madagascar: Neglected and under pressure. Int. For. Rev. 2015, 17, 127–148. [Google Scholar] [CrossRef]
- Vieira, D.L.M.; Scanot, A. Principles of natural regeneration of dry tropical forests for regeneration. Restor. Ecol. 2006, 4, 11–20. [Google Scholar] [CrossRef]
- Aronson, J.; Vallauri, D.; Jaffré, T.; Lowry, I.I. PP 2005: Restoring dry tropical forests. In Forest Restoration in Landscapes: Beyond Planting Trees; Mansourian, S., Vallauri, D., Eds.; Springer Science + Business Media, Inc.: New York, NY, USA, 2005; pp. 285–290. [Google Scholar] [CrossRef]
- Scales, I.R. The future of conservation and development in Madagascar: Time for a new paradigm? Madag. Conserv. Dev. 2014, 9, 5–12. [Google Scholar] [CrossRef]
- Seddon, N.; Butchart, S.; Tobias, J.; Yount, J.W.; Rémi Ramanampamonjy, J.; Randrianizahana, H. Conservation issues and priorities in the Mikea Forest of south-west Madagascar. Oryx 2000, 34, 287–304. [Google Scholar] [CrossRef]
- Sussman, R.W.; Rakotozafy, A. Plant Diversity and Structural Analysis of a Tropical Dry Forest in Southwestern Madagascar. Biotropica 1994, 26, 241–254. [Google Scholar] [CrossRef]
- Kassi N’Dja, J.K.; Decocq, G. Successional patterns of plant species and community diversity in a semi-deciduous tropical forest under shifting cultivation. J. Veg. Sci. 2008, 19, 809–820. [Google Scholar] [CrossRef]
- Blumenfeld-Jones, K.; Randriamboavonjy, T.M.; Williams, G.; Mertl-Millhollen, A.S.; Pinkus, A.; Rasamimanana, H. Tamarind recruitment and long-term stability in the gallery forest at Berenty, Madagascar. In Ringtailed Lemur Biology; Jolly, A., Sussman, R.W., Koyama, N., Rasamimanana, H., Eds.; Springer Science + Business Media, LLC: New York, NY, USA, 2006; pp. 69–85. ISBN 10: 0-387-32669-3. [Google Scholar]
- Jolly, A. Berenty Reserve, Madagascar: A long time in a small space. In Long-Term Field Studies of Primates; Kappeler, P.M., Watts, D.P., Eds.; Springer-Verlag: Berlin/Heidelberg, Germany, 2012; pp. 1–464. ISBN 978-3-642-22513-0. [Google Scholar]
- Budnitz, N.; Dainis, K. Lemur catta: Ecology and Behaviour. In Lemur Biology; Tattersall, I., Sussman, R.W., Eds.; Plenum: New York, NY, USA, 1975; pp. 219–236. [Google Scholar]
- Kuaraksa, C.; Elliott, S. The use of Asian Ficus species for restoring tropical forests ecosystems. Restor. Ecol. 2012, 21, 86–95. [Google Scholar] [CrossRef]
- Fitchett, J.M.; Grab, S.W. A 66-year tropical cyclone record for south-east Africa: Temporal trends in a global context. Int. J. Climatol. 2014, 34, 3604–3615. [Google Scholar] [CrossRef]
- Jolly, A.; Koyama, N.; Rasamimanana, H.; Crowley, H.; Williams, G. Berenty Reserve: A research site in southern Madagascar. In Ringtailed Lemur Biology; Jolly, A., Sussman, R.W., Koyama, N., Rasamimanana, H., Eds.; Springer Science + Business Media, LLC: New York, NY, USA, 2006; pp. 32–42. ISBN 10: 0-387-32669-3. [Google Scholar]
- Binggeli, P. Cactaceae, Opuntia spp., Prickly Pear. In The Natural History of Madagascar; Goodman, S.M., Benstead, J.P., Eds.; University of Chicago Press: Chicago, IL, USA, 2003; pp. 257–268. [Google Scholar]
- Rambeloarivony, H.; Jolly, A. Berenty Reserve: Past, Present and Future. In Leaping Ahead. Developments in Primatology: Progress and Prospects; Masters, J., Gamba, M., Génin, F., Eds.; Springer Science + Business Media: New York, NY, USA, 2013; Volume 153, pp. 353–359. [Google Scholar]
- Rinn, F. Eine neue Method zur Berechnung von Jahrringparametern. Auszug aus der Diplomarbeit. Ph.D. Thesis, Universität Heidelberg, Heidelberg, Germany, 1988; pp. 1–86. [Google Scholar]
- Rinn, F. TSAP-Win Time Series Analysis and Presentation for Dendrochronology and Related Applications; Version 0.53 for Microsoft Windows; Rinn Tech.: Hedelberg, Germany, 2003; pp. 1–88. [Google Scholar]
- Elliott, S.; Blakesley, D.; Hardwick, K. Restoring Tropical Forests: A Practical Guide; Kew Publishing: Royal Botanic Gardens, Kew, UK, 2013; pp. 72, 118–125. ISBN 978-1-84246-442-7. Available online: http://www.forru.org/en/content.php?mid=78 (accessed on 14 November 2017).
- Harris, L.D. Edge effects and conservation of biotic diversity. Conserv. Biol. 1988, 2, 330–332. [Google Scholar] [CrossRef]
- Mertl-Millhollen, A.S.; Rambeloarivony, H.; Miles, W.; Kaiser, V.A.; Gray, L.; Dorn, L.T.; Williams, G.; Rasamimanana, H. The influence of tamarind tree quality and quantity on Lemur catta behavior. In Ringtailed Lemur Biology; Jolly, A., Sussman, R.W., Koyama, N., Rasamimanana, H., Eds.; Springer Science + Business Media, LLC: New York, NY, USA, 2006; pp. 102–118. ISBN 978-0-387-34126-2. [Google Scholar]
- Gärtner, H.; Schweingrube, F.H.; Dikau, R. Determination of erosion rates by analyzing structural changes in the growth pattern of exposed roots. Dendrochronologia 2001, 19, 81–91. [Google Scholar]
- Gärtner, H. Tree roots. Methodological review and new development in dating and quantifying erosive processes. Geomorphology 2007, 86, 243–251. [Google Scholar] [CrossRef]
- Gärtner, H.; Lucchinetti, S.; Schweingruber, F.H. New perspectives for wood anatomical analysis in Dendrosciences: The GSL1-microtome. Dendrochronologia 2014, 32, 47–51. [Google Scholar] [CrossRef]
- Heiri, O.; Lotter, A.F.; Lemcke, G. Loss on ignition as a method for estimating organic and carbonate content in sediments: Reproducibility and comparability of results. J. Paleolimnol. 2001, 25, 101–110. [Google Scholar] [CrossRef]
- Ryżak, M.; Bieganowski, A. Methodological aspects of determining soil particle-size distribution using the laser diffraction method. J. Plant Nutr. Soil Sci. 2011, 174, 624–633. [Google Scholar] [CrossRef]
- Koyama, N.; Soma, T.; Ichino, S.; Takahata, Y. Home range of ringtail lemur troops. In Ringtailed Lemur Biology; Jolly, A., Sussman, R.W., Koyama, N., Rasamimanana, H., Eds.; Springer Science + Business Media, LLC: New York, NY, USA, 2006; pp. 86–101. [Google Scholar]
- Rasamimanana, H.; Ratovonirina, J.A.; Jolly, A.; Pride, E. Storm Damage at Berenty Reserve. Lemur News 2000, 5, 7–8. [Google Scholar]
- Hazelton, P.; Murphy, B. Interpreting soil test results: What do all the numbers mean? Eur. J. Soil Sci. 2007, 58, 1219–1220. [Google Scholar]
- Parvez, S.S.; Parvez, M.M.; Fujii, Y.; Gemma, H. Allelopathic competence of Tamarindus indica L. root involved in plant growth regulation. Plant Growth Regul. 2003, 41, 139–148. [Google Scholar] [CrossRef]
- Parvez, S.S.; Parvez, M.M.; Nishihara, E.; Gemma, H.; Fujii, Y. Tamarindus indica L. leaf is a source of allelopathic substance. Plant Growth Regul. 2003, 40, 107–115. [Google Scholar] [CrossRef]
- Parvez, S.S.; Parvez, M.M.; Fujii, Y.; Gemma, H. Differential allelopathic expression of bark and seed of Tamarindus indica L. Plant Growth Regul. 2004, 42, 245–252. [Google Scholar] [CrossRef]
- Mangan, S.A.; Schnitzer, S.A.; Herre, E.A.; Mack, K.M.; Valencia, M.C.; Sanchez, E.I.; Bever, J.D. Negative plant-soil feedback predicts tree-species relative abundance in a tropical forest. Nature 2010, 446, 752–755. [Google Scholar] [CrossRef] [PubMed]
- Martínez-Izquierdo, L.; García, M.M.; Powers, J.S.; Schnitzer, S.A. Lianas suppress seedling growth and survival of 14 tree species in a Panamanian tropical forest. Ecology 2016, 97, 215–224. [Google Scholar] [CrossRef] [PubMed]
- Addo-Fordjour, P.; Rahmad, Z.B.; Shahrul, A.M.S. Effects of human disturbance on liana community diversity and structure in a tropical rainforest, Malaysia: Implication for conservation. J. Plant Ecol. 2012, 5, 391–399. [Google Scholar] [CrossRef]
- Crowley, H.M. Berenty Reserve Management Plan; Wildlife Preservation Trust International: Philadelphia, PA, USA, 1995. [Google Scholar]
- Dietze, M.; Matthes, J.H. A general ecophysiological framework for modelling the impacts of pests and pathogens on forest ecosystems. Ecol. Lett. 2014, 17, 1418–1426. [Google Scholar] [CrossRef] [PubMed]
- Tadross, M.; Randriamarolaza, L.; Rabefitia, Z.; Zheng, K.Y. Climate Change in Madagascar; Recent Past and Future; Climate Systems Analysis Group, University of Cape Town: South Africa; World Bank: Washington, DC, USA, 2008; pp. 1–17. Available online: http://www.csag.uct.ac.za/%7Emtadross/Madagascar%20Climate%20Report.pdf (accessed on 1 October 17).
- Rasamimanana, N.; Ratsirarson, J.; Richard, A.F. Influence de la variabilité climatique sur la phénologie de la forêt de la Réserve Speciale de Beza Mahafaly. Malagasy Nat. 2012, 6, 67–82. [Google Scholar]
- Duan, L.; Liu, T.; Wang, X.; Luo, Y.; Wang, W.; Liu, X. Water table fluctuation and its effects on vegetation in a semi-arid environment. Hydrol. Earth Syst. Sci. Discuss. 2011, 8, 3271–3304. [Google Scholar] [CrossRef]
- Costello, J.F.; Leeder, J.; Strang, M. Drivers of the distribution of a dominant riparian tree species (eucalyptus coolabah) on a dryland river system, Diamantina River, Lake Aire Basin. Paper 2667, Hydrology-ecology interactions, G9. In Proceedings of the 11th International Symposium on Ecohydraulics, Melborne, Australia, 7–12 February 2016; The University of Melbourne: Melborne, Australia, 2016. ISBN 978-0-7340-5339-8. [Google Scholar]
- Ranaivoson, T.; Brinkmann, K.; Rakouth, B.; Buerkert, A. Distribution, biomass and local importance of tamarind trees in south-western Madagascar. Glob. Ecol. Conserv. 2015, 4, 14–25. [Google Scholar] [CrossRef]


| Malaza 1936 | Ankoba 1950 | River bed | Bealoka 1985 | Burnt 1998 | River Bed | Burnt 2006 | |||||||||||
|---|---|---|---|---|---|---|---|---|---|---|---|---|---|---|---|---|---|
| Transect | 1 | 3 | 3 | 4 | 5 | 6 | 7 | 8 | 9 | 10 | 11 | 12 | 13 | 14 | 15 | 16 | |
| Length (m) | 250 | 250 | 250 | 250 | 250 | 150 | 250 | 75 | 100 | 125 | 250 | 250 | 250 | 225 | 250 | 50 | |
| STAGE 1—continuous canopy | STAGE 2—transitional canopy | STAGE 3—open dryland | |||||||||||||||
| Average large + regenerants − SD | 80 21.0 | 61.7 12.8 | 58.9 20.6 | 55.7 11.5 | 46.8 21.9 | 46 12.2 | 40.9 12.6 | 37.6 1.9 | 37.2 27.1 | 35.2 14.9 | 33.0 13.9 | 13.1 9.3 | 14.7 12.4 | 14 9.3 | 13.8 9.2 | 9.5 3.5 | |
| Average large trees (>30 cm girth) − SD | 7 5.4 | 9.7 4.0 | 7.3 2.9 | 6.9 3.0 | 4.0 2.4 | 4.5 1.6 | 3.1 2.0 | 2.6 0.9 | 1.5 0.5 | 3 2.6 | 4.4 2.0 | 2.9 5.4 | 1.8 2.7 | 1.9 1.8 | 2 1.7 | 2 2.0 | |
| Average regenerants (<30 cm girth) − SD | 73.1 20.1 | 52 13.9 | 51.6 20.3 | 48.9 1.9 | 42.8 22.7 | 41.5 11.7 | 37.8 12.2 | 35 1.6 | 35.7 27.0 | 32.2 12.5 | 28.6 12.4 | 10.2 8.4 | 12.9 10.8 | 12.1 8.4 | 11.9 8.0 | 7.5 1.5 | |
| Average all seedlings (<50 cm ht)Average tamarind seedlings | 22.9 Not counted | 35.0 8.5 | 34.5 11.7 | 40 8.4 | 17.3 0.2 | 32.8 2.5 | 32 0.9 | 19.6 0.6 | 54.3 27 | 17.2 0.6 | 27.2 9.5 | 3.7 0.2 | 2.4 0.1 | 13 3.9 | 8.2 0.3 | 2.5 0 | |
| Shrub cover ht range (cm) | low 10–200 | low 100–150 | low 7–150 | low 10–200 | low/mod 15–200 | low/high 130–800 | low/mod 30–200 | low/mod 200 | low/mod 50–150 | mod/high 200–250 | low 20–200 | mod 25–200 | mod 30–200 | mod/high 100–300 | mod 100–200 | low/high 70–150 | |
| Lianas/vines nos of circles. | Few mod many | 6 1 3 | 1 3 | 7 2 1 | 7 1 2 | 3 1 6 | 1 1 4 | 1 3 6 | 3 | 1 2 1 | 1 4 | 2 2 6 | 6 4 | 4 1 5 | 2 1 6 | 7 2 1 | 1 1 |
| Grass cover % ht-range (cm) | low 5–10 | low 0–10 | low 5–10 | low 5–20 | low/mod 10–50 | low/high 0–10 | low/high 5–150 | high 10 | low/high 15–75 | mod 15–100 | low5 –15 | high 100–150 | high 5–500 | low/mod 5–100 | mod/high 20–280 | high 30–40 | |
| Bare soil % cover | 3.2 | 0 | 1 | 0 | 0.5 | 4 | 0 | 0.2 | 0.1 | 0.1 | 0.9 | 4.7 | 2 | 0.1 | 2.5 | 1 | |
| Dead trees | 11 | 6 | 1 | 12 | 8 | 4 | 7 | 2 | 4 | 8 | 5 | 9 | 10 | 0 | 3 | 0 | |
| Transect (T) | 1 | 2 | 3 | 4 | 5 | 6 | 7 | 8 | 9 | 10 | 11 | 12 | 13 | 14 | 15 | 16 | |
|---|---|---|---|---|---|---|---|---|---|---|---|---|---|---|---|---|---|
| DRYLAND | STAGE 1 | STAGE 2 | STAGE 3 | % | |||||||||||||
| Enterospermum* | x | x | x | x | x | x | x | x | x | x | x | x | x | x | 7 | ||
| Strychnos madagascariensis | x | x | x | x | x | x | x | x | x | x | x | x | x | 7 | |||
| Euphorbia* | x | x | x | x | x | x | x | x | x | 5 | |||||||
| Hazunta modesta | x | x | x | x | x | x | x | x | x | 5 | |||||||
| Grewia* | x | x | x | x | x | x | x | 4 | |||||||||
| Salvadora angustifolia | x | x | x | x | 2 | ||||||||||||
| LOWER CANOPY | |||||||||||||||||
| Celtis philippensis | x | x | x | x | x | x | x | x | x | x | x | x | x | x | x | x | 8 |
| Rinorea greveana | x | x | x | x | x | x | x | x | x | x | x | x | x | x | x | x | 8 |
| Crataeva excelsa | x | x | x | x | x | x | x | x | x | x | x | x | x | x | x | x | 8 |
| Quisivianthe papinae | x | x | x | x | x | x | x | x | x | x | x | x | x | x | 7 | ||
| Celtis bifida | x | x | x | x | x | x | x | x | x | x | x | 6 | |||||
| Rubiaceae sp. ** | x | x | x | x | x | x | x | x | x | x | x | 6 | |||||
| Tricalysia sp. ** | x | x | x | x | x | x | x | 4 | |||||||||
| Celtis gomphophylla | x | x | 1 | ||||||||||||||
| Cordia caffra | x | - | |||||||||||||||
| UPPER CANOPY | |||||||||||||||||
| Tamarindus indica ** | x | x | x | x | x | x | x | x | x | x | x | x | x | x | 7 | ||
| Albizia polyphilla | x | x | x | x | x | x | x | x | x | x | x | 6 | |||||
| Neotina isoneura | x | x | x | x | x | x | x | x | x | x | 5 | ||||||
| Acacia rovumae | x | x | x | x | x | x | x | x | x | 5 | |||||||
| TOTAL SPECIES | |||||||||||||||||
| Dryland species | 3 | 3 | 1 | 4 | 4 | 3 | 4 | 4 | 3 | 4 | 3 | 6 | 4 | 4 | 5 | 1 | |
| Lower canopy | 7 | 7 | 8 | 7 | 5 | 5 | 6 | 5 | 4 | 4 | 6 | 7 | 4 | 6 | 5 | 7 | |
| Upper canopy | 4 | 3 | 4 | 4 | 3 | 2 | 4 | 1 | 1 | 4 | 3 | 2 | 2 | 4 | 3 | 1 | |
| AVERAGE spp./circle | 1.4 | 3.2 | 1.3 | 1.5 | 1.2 | 1.6 | 1.4 | 3.3 | 2.0 | 2.4 | 1.2 | 1.5 | 1.1 | 1.4 | 1.3 | 4.5 | |
© 2018 by the authors. Licensee MDPI, Basel, Switzerland. This article is an open access article distributed under the terms and conditions of the Creative Commons Attribution (CC BY) license (http://creativecommons.org/licenses/by/4.0/).
Share and Cite
Winchester, V.; Hardwick, K.; Rasamimanana, H.; Raharison, S.M.; Mertl-Millhollen, A.; Gärtner, H.; McCrae, J. Berenty Reserve—A Gallery Forest in Decline in Dry Southern Madagascar—Towards Forest Restoration. Land 2018, 7, 8. https://doi.org/10.3390/land7010008
Winchester V, Hardwick K, Rasamimanana H, Raharison SM, Mertl-Millhollen A, Gärtner H, McCrae J. Berenty Reserve—A Gallery Forest in Decline in Dry Southern Madagascar—Towards Forest Restoration. Land. 2018; 7(1):8. https://doi.org/10.3390/land7010008
Chicago/Turabian StyleWinchester, Vanessa, Kate Hardwick, Hantanarina Rasamimanana, Sahoby M. Raharison, Anne Mertl-Millhollen, Holger Gärtner, and Janet McCrae. 2018. "Berenty Reserve—A Gallery Forest in Decline in Dry Southern Madagascar—Towards Forest Restoration" Land 7, no. 1: 8. https://doi.org/10.3390/land7010008