Article

Model-Based Comparison of Antibody Dimerization in Continuous and Batch-Wise Downstream Processing

Department of Chemical Engineering, Lund University, P.O. Box 124, SE-221 00 Lund, Sweden
*
Author to whom correspondence should be addressed.
Antibodies 2015, 4(3), 157-169; https://doi.org/10.3390/antib4030157
Submission received: 31 March 2015 / Revised: 23 June 2015 / Accepted: 6 July 2015 / Published: 10 July 2015
(This article belongs to the Special Issue Optimized Antibody Recovery and Purification Methods)

Abstract

:
Monoclonal antibodies are generally produced using a generic platform approach in which several chromatographic separations assure high purity of the product. Dimerization can occur during the fermentation stage and may occur also during the downstream processing. We present here simulations in which a traditional platform approach that consist of protein A capture, followed by cation-exchange and anion-exchange chromatography for polishing is compared to a continuous platform in which dimer removal and virus inactivation are carried out on a size-exclusion column. A dimerization model that takes pH, salt concentration and the concentration of antibodies into account is combined with chromatographic models, to be able to predicted both the separation and the degree to which dimers are formed. Purification of a feed composition that contained 1% by weight of dimer and a total antibody concentration of 1 g/L was modeled using both approaches, and the amount of antibodies in the continuous platform was at least 4 times lower than in the traditional platform. The total processing time was also lower, as the cation-exchange polish could be omitted.

1. Introduction

The use of monoclonal antibodies as biopharmaceuticals is becoming more popular [1,2], and thus antibody dimerization during preparation and the subsequent removal of aggregates are becoming increasingly studied areas. When modeling the purification of antibodies from dimers, the main focus has been on the removal of dimers produced during the upstream processing. Dimerization that occurs during the upstream processing is, however not a major purification problem, since the removal of such dimers is a straightforward problem in process design. The removal of dimers formed during the downstream processing, however, is more complicated.
Monoclonal antibodies are usually produced in a bioreactor, and a series of separation steps is subsequently used to isolate and purify the product [2,3,4]. This downstream processing normally consists of chromatographic purification steps that are run in batch mode, with storage tanks between each unit operation. Great efforts have been dedicated to minimizing the idle time and the volume and number of unit operations in the downstream processing. An increased interest in personalized pharmaceuticals and the technical advances in disposable equipment and protein capture have made it possible to run an integrated downstream process in which the storage tanks can be replaced with size-exclusion chromatography (SEC) columns.
Several models have been developed to describe the separation of antibodies, dimers and other impurities during the downstream processing. Perez-Almodovar and Carta [5] showed that break-through of a protein A column can be modeled with different mechanistic models. Ng et al. [6] showed how an integrated calibration and optimization could be used to model and optimize a protein A capture step of polyclonal IgG. Borg et al. [7] used modeling to study the effects of twelve process parameters on the separation process in a cation-exchange chromatography (CIEX) step. These models, however, do not include the dimerization that occurs during the separation steps. Guo et al. [8] showed that dimerization can occur due to interaction with the stationary phase, while Ojala et al. [9] showed that dimers of the antibodies are formed in the mobile phase. Arosio et al. [10] expanded the Lumry-Eyring model [11] to include the effects of reversibility.
The concentration of dimers in the downstream process changes as the buffer conditions change [12]. Removal of the dimers results in a loss of monomeric antibodies, as the removal can drive the reaction to form even more dimers. Hold-up times of up to a couple of hours are common between process steps in the downstream processing [13]. Dimerization is a time-dependent reversible process [9], and it is therefore desirable to know how these hold-up times influence the yield of the process.
We present here a comparison between a continuous process and a batch-wise process, and we focus on the influence of the reversible dimerization reaction. Mechanistic models for the various chromatographic steps and for the dimerization in the mobile phase are used to predict the dimerization during the downstream processing. Chromatographic separation run in bind and elute mode can cause antibody unfolding and dimerization, and it is therefore important to evaluate whether such steps are necessary. Two different processes are considered. First, a batch-wise approach to antibody production is considered in which protein A is used as a capture step, followed by virus inactivation and cation-exchange chromatography. Second, an integrated approach is considered, in which the pool from protein A capture is directly loaded onto a SEC column, which not only inactivates viruses but also separates dimers. The dimerization occurring on the stationary phase is disregarded and the study focuses on dimerization in the mobile phase.

2. Theory

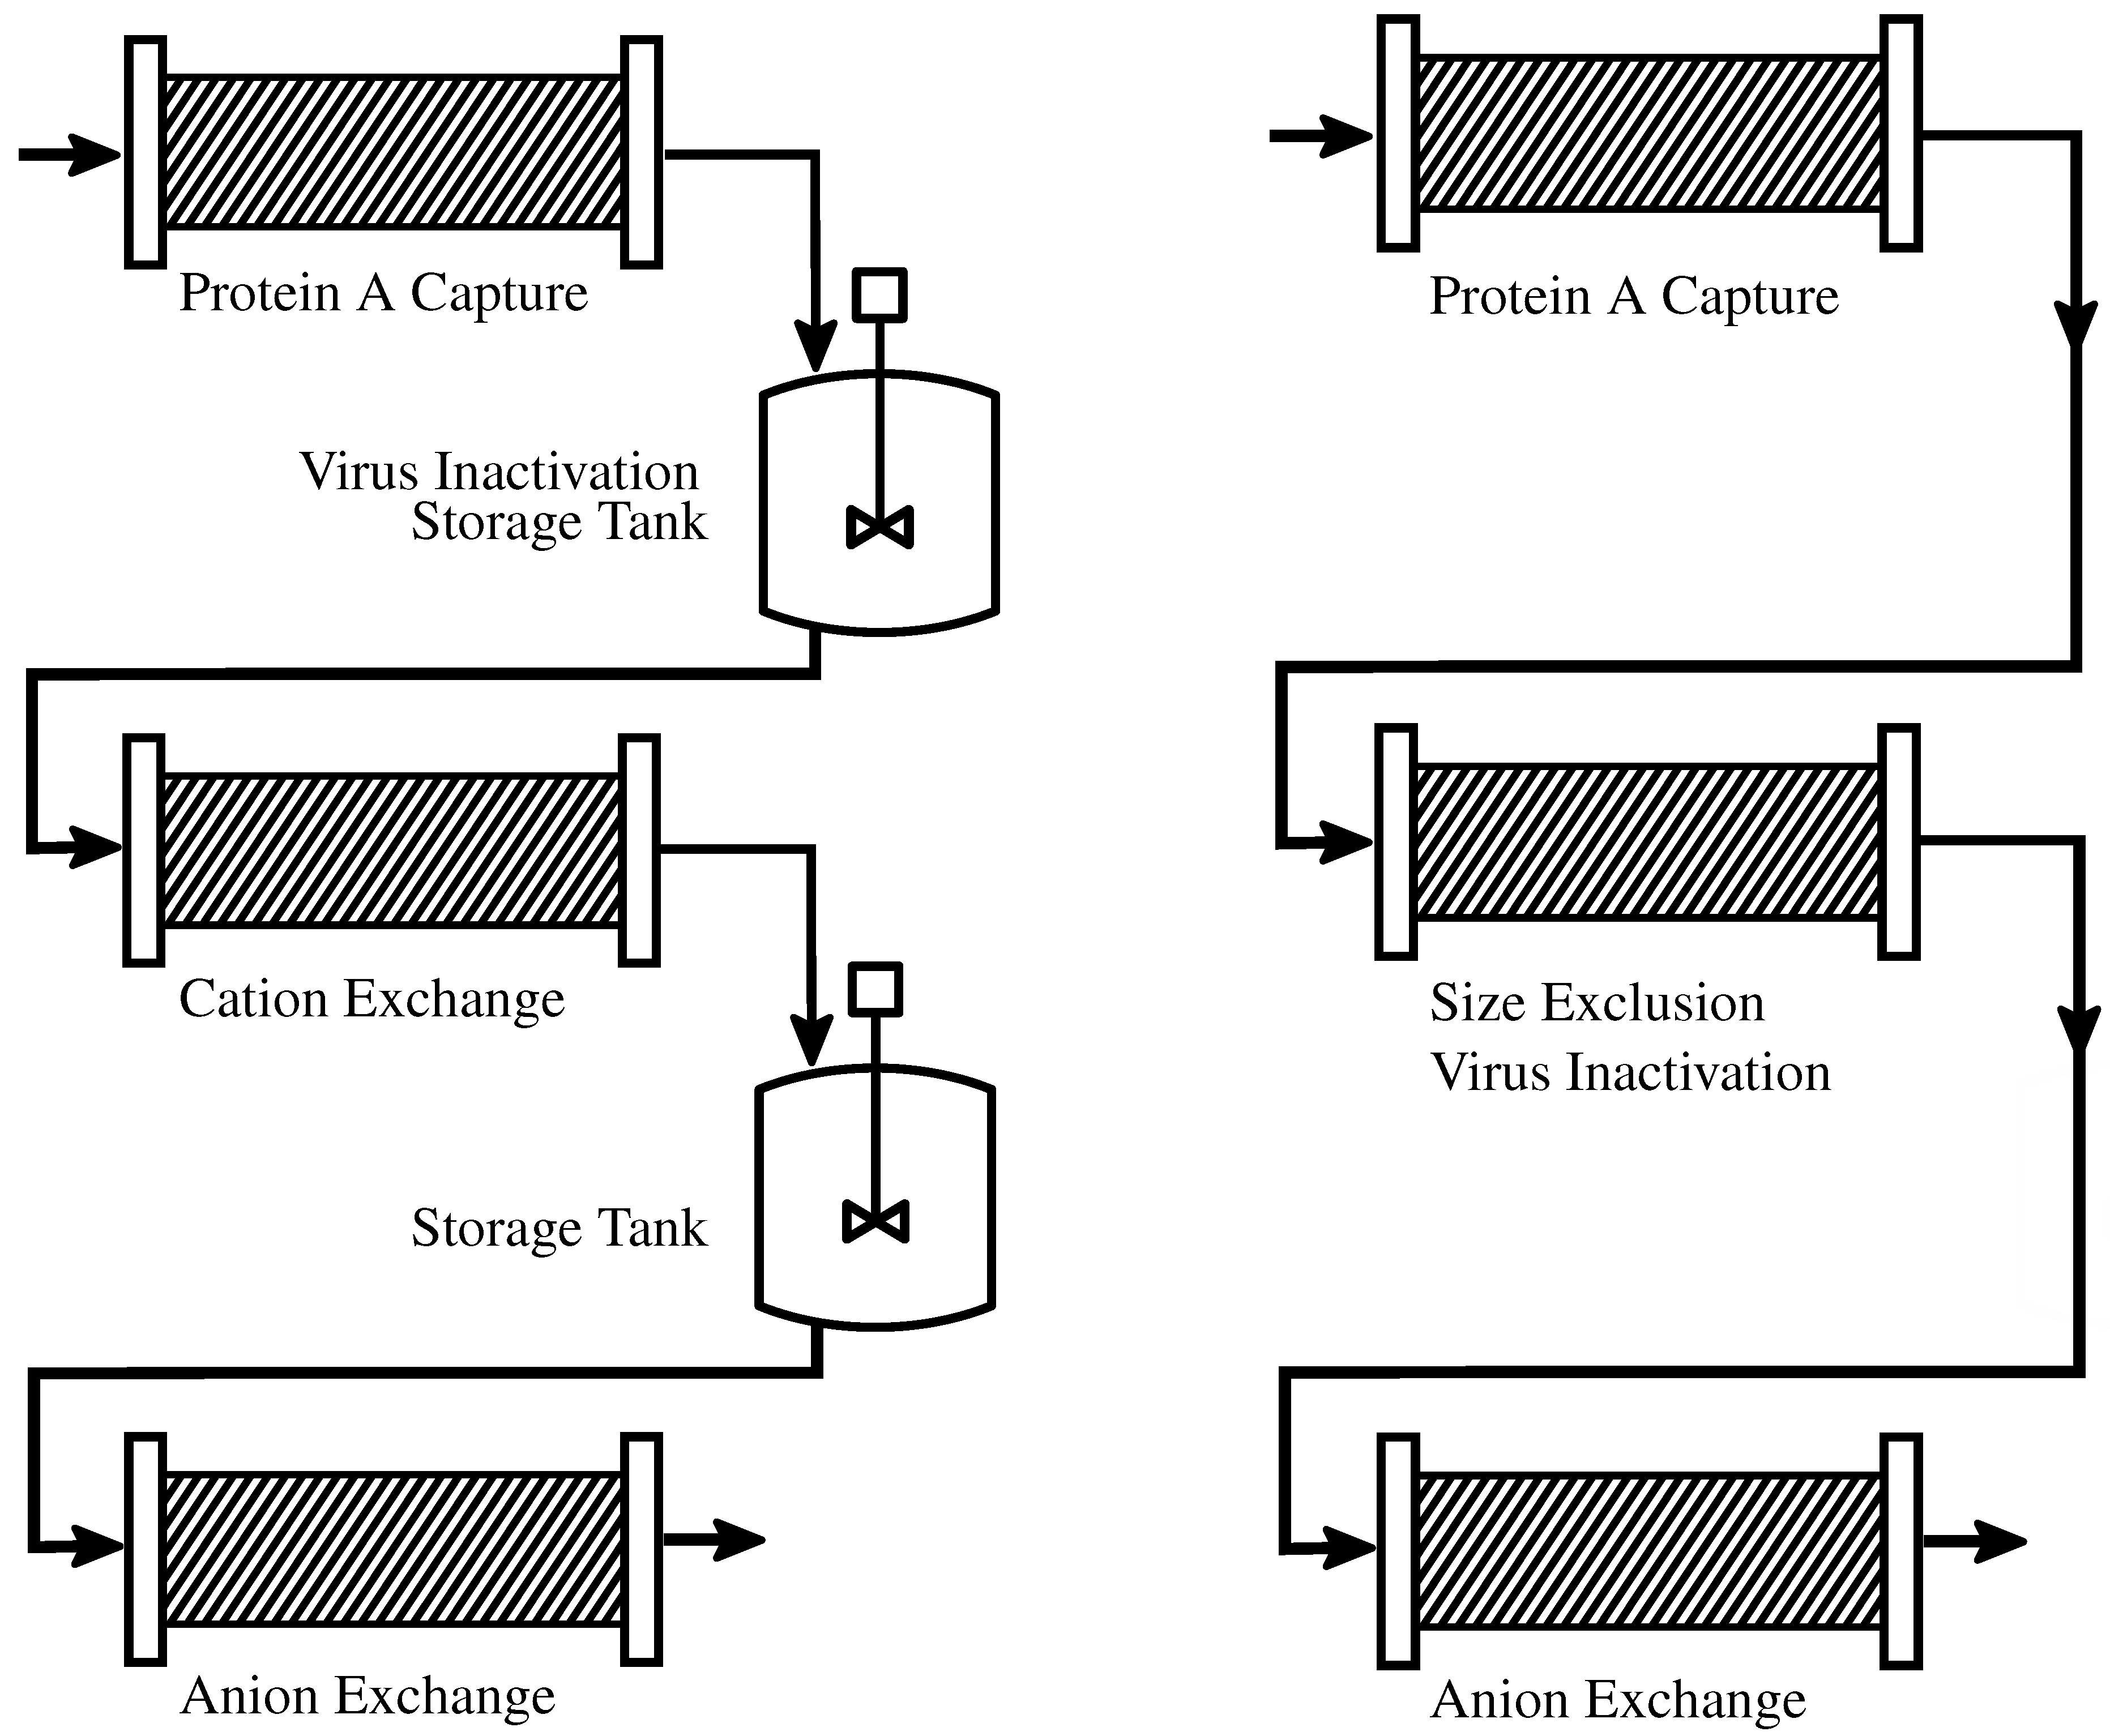
2.1. Downstream Processing Platform

The design of the downstream processing platform differs between different antibodies and between different manufacturers. Figure 1 shows a batch-wise and a continuous antibody purification process.
Figure 1. A batch-wise process is shown on the left and a continuous process on the right.
Antibodies 04 00157 g001
Protein A chromatography is used as the capture step at the beginning of the purification process in two thirds of commercially available antibody downstream processes [2]. In this step, antibodies and aggregates bind to the stationary phase, while impurities are eluted. The Fc region of the antibody is the part that binds to the protein A in the column [14]. This is a hydrophobic interaction that is pH-sensitive. The adsorption becomes weaker when the pH is lowered, and the antibodies are eluted. To make the downstream process continuous some buffer exchange step is needed. The buffer exchange step can be realized by adding a SEC column after the Protein A capture. The SEC step can then both remove aggregates and change the buffer conditions. The following AIEX step can then be run in weak partitioning mode [15] to remove host cell proteins (HCP) and leached Protein A.

2.1.1. Batch-Wise Processes

A virus inactivation step, during which the pH is lowered to 3.8, follows the capture [4]. This pH is maintained for an hour before it is adjusted to a pH that is suitable for the polishing steps. The polishing steps usually take place on a cation-exchange chromatography (CIEX) column and an anion-exchange chromatography (AIEX) column. The antibodies are loaded onto the CIEX column in a buffer at pH 5 with a sodium chloride concentration of 100 mM. A salt gradient from 100 mM to 600 mM is used to elute the antibodies. The AIEX column is run in weak partitioning mode and can be disregarded, as aggregates do not form at the conditions at which it is operated.
The concentration of antibodies is very high at certain stages of the capture step and during the CIEX polishing step. The elution conditions, low pH and high salt concentration, may also promote the formation of aggregates [9].

2.1.2. Continuous Processes

Size-exclusion columns (SECs) are used in continuous processes, instead of the storage tanks, and the virus inactivation step, of the batch-wise processes. The pH in the column is lowered to 3.8 and maintained at this value for an hour to inactivate the viruses. The pH is then increased to 8 and the salt concentration maintained at 100 mM to prepare the antibodies for loading onto the AIEX column. Downstream processing in this case comprises only three operations, in contrast to the five required during batch-wise processes. Furthermore, the steps of binding to the CIEX column and elution for it, which can cause additional dimerization are omitted.

2.2. Aggregation Model

The reaction model, developed by Ojala et al. [9], is based on a reversible reaction in which monomeric antibodies (M) form dimers (D) according to:
2 M D
The reaction rate, denoted Q T , i , Q b , i and Q p , i in Equations (5), (9) and (13) can thus be described by:
Q j , i = ξ i k k ( K e q C j , M 2 - C j , D ) , i { M , D } , j { T , b , p }
where ξ i is 1 for dimers and –2 for monomers, k k is the dissociation rate constant, C j , M is the molar concentration of monomers, C j , D is the molar concentration of dimers and K e q the equilibrium constant which depends on the concentration of salt, s, according to Equation (3). Subindex j denotes the domain in which the reaction takes place, T is the mobile phase outside and inside of the particle pores, b is the mobile phase outside of the particle pores and p is the mobile phase inside the particle pores.
K e q = - 0.39 s + 380
The dissociation rate constant, k k depends on pH according to:
log ( k k ) = - 1.8 p H + 3.7

2.3. Column Models

Ng et al. [6] have presented a column model that describes the protein A capture on an AbSolute column of volume 1.67 mL. The model assumed an antibody feed with a concentration of 1 g/L at pH 7.4, containing 1% by weight of dimers. It was assumed that dimers have the same kinetic and transport properties as monomers. The column was loaded for 15 column volumes (CV) then washed for 3 CV. Antibodies were eluted by 3 CV at pH 3.8. This model was used to predict the separation in the Protein A capture step. Ojala [16] have presented a SEC column model for the separation of antibodies on a Superdex 200 column of volume 319 mL which was used to predict the separation in the SEC column step. Borg et al. [7] have presented a model to describe the CIEX separation on a Fractogel S O 3 - column of volume 133 mL. Antibodies were eluted using a salt gradient of volume 20 CV from 100 mM to 600 mM at a flow rate of 4.8 CV/h. The CIEX polishing step was modeled using this model.

2.3.1. Protein A Column Model

A transport-dispersive model [6] (Equations (5)–(8)) with an additional reaction term (Equation (2)) was used to describe the separation during the capture step:
C T , i t = D a p p 2 C T , i z 2 - v ε T C T , i z - 1 - ε T ε T q i t - Q T , i
where C T , i is the concentration of component i in the mobile phase, t is time, D a p p is the apparent dispersion, z is the axial coordinate, v is the superficial velocity, ε T is the total void ratio and q i is the concentration of component i in the stationary phase. The rate of adsorption is given by:
q i t = k m ( q i * - q i )
where k m is the mass transfer coefficient and q i * is the concentration of component i in the stationary phase at equilibrium. The mass transfer coefficient and the concentrations at equilibrium are given by Equations (7) and (8).
k m = k m a x S 1 + ( 1 - S 1 ) 1 - q i q m a x S 2
q i * = q m a x K A p H p H r e f n C T , i 1 + K A p H p H r e f n C T , i
where k m a x is the maximum mass transfer coefficient, S 1 is a saturation-dependent constant, S 2 is the saturation-dependent order, q m a x is the maximum binding capacity, K A is the association equilibrium constant, p H r e f is the reference pH and n is the pH-dependent equilibrium order.

2.3.2. IEX and SEC Column Models

A general rate model was used to describe the separation in the CIEX and SEC column:
C b , i t = D a x 2 C b , i z 2 - u C b , i z - 3 R p 1 - ε c ε c k f , i C p , i | r = R p - C b , i - Q b , i
where C b , i is the concentration of component i in the mobile phase outside of the particle pores, t is time, z the axial coordinate, R p is the stationary phase particle radius , ε c the column void ratio and r the radial coordinate. Q b , i is described by Equation (2). The dispersion coefficient, D a x , is given by:
D a x = 2 R p u P e
where P e is the Peclet number, and the interstitial velocity, u, is calculated using Equation (11):
u = F ε c R c o l 2 π
where F is the flow rate, R c o l the column radius. The film transport rate for component i, k f , i is described by the Wilson-Geankopolis correlation:
k f , i = 1.09 u 1 / 3 ε c D M , i 2 R p 2 / 3
where D M , i is the free diffusion coefficient. The concentration of component i in the mobile phase inside the particle pores, C p , i , is calculated using:
C p , i t = 1 r 2 ε p , i r 2 D e , i C p , i r r - 1 - ε p ε p , i q i t - Q p , i
where ε p , i is the apparent particle porosity for component i, D e , i is the effective diffusion coefficient of component i, ε p the particle porosity and Q p , i is the reaction rate, as given by Equation (2). No adsorption occurs in the SEC column, thus q i / t is zero. Adsorption of the components in the CIEX column is described by a steric mass action model [17,18]:
q i t = k k i n , i C p , i H i 1 - j = 1 n c o m p q j q m a x , j ν i - s ν i q i
where k k i n , i is the adsorption kinetic parameter for component i, H i is the equilibrium of adsorption for component i and ν i the amount of ligands bound to component i. The maximum amount of component i that can be adsorbed on to the particle surface, q m a x , i , is given by:
q m a x , i = Λ ν i + σ i
where Λ is the total amount of ligands on the surface of the particle and σ i the amount of ligands blocked by component i. Equation (16) is used to preserve electroneutrality.
s t = - ν i 1 - ε p ε p , i q i t

2.4. Boundary Conditions and Initial Values

A Dirichlet boundary condition was used in the column inlet (Equation (17)) and a homogeneous von Neumann boundary condition was used at the outlet (Equation (18)) for the transport-dispersive model. During the loading of the column the concentration in the inlet is the same as the feed concentration, 1 g/L in total, otherwise the inlet concentration is zero. The time at which the load starts is denoted t 0 and the final time of the load is denoted t f . The column is initially assumed to contain only buffer solution and no monomers or dimers in either mobile or stationary phase (Equation (19)).
C i | z = 0 = C T , i , i n l e t ( t ) where C T , i , i n l e t ( t ) 0 for t 0 < t < t f
C T , i z z = L = 0
where L is the length of the column.
C T , i ( t = 0 , z ) = C T , i , i n i t i a l , q i ( t = 0 , z ) = 0
For the general rate model, a Dirichlet boundary condition was used in the column inlet (Equation (20)) and a homogeneous von Neumann boundary condition was used at the outlet (Equation (21)). For the batch process the inlet concentration was set to the storage tank concentration during the loading and for the continuous process the inlet concentration was set to the outlet concentration of the previous column. The time at which the load starts is denoted τ 0 and the final time of the load is denoted τ f . The column is initially assumed to contain only buffer solution and no monomers or dimers in either mobile or stationary phase (Equation (22)).
C b , i | z = 0 = C b , i , i n l e t ( t ) where C b , i , i n l e t ( t ) 0 for τ 0 < t < τ f
C b , i z z = L = 0
C b , i ( t = 0 , z ) = C b , i , i n i t i a l , C p , i ( t = 0 , z ) = C p , i , i n i t i a l , q i ( t = 0 , z ) = 0
A flux boundary condition was used for the particle surface (Equation (23)) and a homogeneous von Neumann boundary condition was used at the center of the particle (Equation (24)).
C p , i r r = R p = k f , i D e , i C p , i | r = R p - C b , i
C p , i r r = 0 = 0

2.5. Simulation

The transport-dispersive model used to describe the protein A capture step was discretized using the Method of Lines [19]. The spatial derivatives were approximated using the finite volume method [20] with 100 finite volumes in the axial direction. For the SEC and CIEX columns, 100 finite volumes were used in the axial dimension, and seven volumes were used in the radial dimension. A fifth-order weighted essentially non-oscillating scheme (WENO) [21] was used to estimate the convection in the columns, and a central second-order approximation was used for the diffusion in the particles. The resulting sets of ordinary differential equations were solved using the ode15s [22] function in MATLAB.

3. Results and Discussion

Figure 2 shows the chromatogram obtained when the capture steps were run under the same conditions in the two processes. Essentially no dimers are formed during the protein A capture, as can be seen in Table 1. This was expected, as the model considers only the dimerization in the mobile phase. Even though the concentration of antibodies is five times higher in the collected pool than in the load, and the pH and salt concentrations are low, the time spent under those conditions is much shorter than the time spent adsorbed on stationary phase.
Figure 2. Simulated protein A capture chromatogram. As identical conditions are used, identical chromatograms were obtained in the batch-wise and continuous processes. The solid line (−) is the total concentration of antibodies in the eluate from the column, i { M , D } C T , i ( t , z = L ) , and the dashed lines ( - - ) the cut points for pooling.
Antibodies 04 00157 g002
Table 1. The massfraction of dimer, x D , after the different unit operations in the batch and continuous processes. The values for cation-exchange chromatography (CIEX) and ize-exclusion chromatography (SEC) elute are the integral mean of the total dimer fraction in the column outlet, i.e., not the dimer fraction in the pool.
Fraction of Dimer, x D
Batch Continuous
Protein A Feed 1.000 · 10 - 2
Protein A Elute 1.005 · 10 - 2
End of Virus Inactivation 4.825 · 10 - 2
End of Storage 4.857 · 10 - 2
CIEX Elute 4.948 · 10 - 2
SEC Elute 1.005 · 10 - 2
Figure 3 shows the mass fraction of dimers during all three operations in the batch-wise process. The pool was collected and held at a pH of 3.8 for an hour to inactivate viruses after the capture step. These conditions are very harsh, and the mass fraction of dimer increases from 1.005 · 10 - 2 to 4.825 · 10 - 2 . Aggregation is known to occur during the virus inactivation step [2]. After the virus inactivation, the pH was increased to 5 and the antibodies were stored for 7 h. Some dimers formed during storage and the mass fraction of dimers increased to 4.857 · 10 - 2 but the increase was much smaller than the increase during virus inactivation.
Figure 3. x D during batch-wise downstream processing. (A) is the upstream processing and protein A capture; (B) is the virus inactivation; (C) is the storage and pH adjustment and (D) is the CIEX polishing.
Antibodies 04 00157 g003
The massfraction of dimers increased to 4.948 · 10 - 2 during the CIEX polish. A fairly small increase considering that the concentration of antibodies is very high during the elution. This may be due to the fact that dimerization is very slow at pH 5, and the equilibrium is shifted towards monomers at high salt concentrations [9], which are conditions in which the antibodies are eluted. The interaction of antibodies with the stationary phase promotes the formation of aggregates [23,24,25], but the mechanism is unknown. Figure 4 presents the simulated chromatogram of the CIEX step. The dimer concentration is multiplied by ten to give the same scale as the monomer concentration.
In continuous downstream processing, the pool that elutes after the protein A capture is loaded directly onto the SEC column. The flow rate is lowered to achieve a residence time of one hour at pH 3.8, after which the antibodies are eluted at pH 8. Figure 5 shows the excellent separation of monomers and dimers on the SEC column. The disadvantage of separating monomers and dimers on the SEC column is that the capacity of the column is much lower than the capacity of a CIEX column. To compensate for the lower capacity, a larger column and more solvent is needed to obtain the same productivity. There are two main advantages of the continuous process. First, a CIEX polishing step is not needed to remove aggregates, since the dimers and monomers can be separated. Second, very few dimers are formed during the virus inactivation (Figure 5). The dimer concentration is multiplied by ten to give the same scale as the monomer concentration. The separation of monomers and dimers would promote the formation of dimers, but separation as well as dilution, due to the dispersion in the column, will keep the concentration of monomer and dimer at the equilibrium.
Figure 4. Chromatogram for the CIEX polishing and removal of aggregates during the batch-wise process. Solid line (−) is the monomers and dashed line ( - - ) is the ten times the dimers concentration.
Antibodies 04 00157 g004
Figure 5. The top figure shows the simulated chromatogram during continuous virus inactivation. Solid line (−) is the monomers and dashed line ( - - ) is the ten times the dimers concentration. The bottom figure shows how x D changes over time in the column. As the dimers elute, x D approached zero.
Antibodies 04 00157 g005
These advantages needs to be weighed against the disadvantages, i.e., larger column and solvent consumption in the SEC column.
There are several types for monoclonal antibodies which may exhibit other types or pathways for dimerization. Arosio et al. [10] showed another pathway for dimerization and formation of higher order aggregates under the same conditions as used in this paper. The results presented in this paper might not be applicable if the antibodies follow another aggregation pathway as the amount and type of dimer may vary from the dimers studies here. Irreversible dimers and higher order aggregates can be removed early on as they do not affect amount of monomers. To maximize the yield, reversible dimers should not be removed during the downstream processing as they can form monomers again before or during the formulation. The drawback is that reformation of monomers from dimers can be very slow and the overall productivity of the process will be lower. Ojala et al. [9] showed that reformation of monomers from dimers can take several days. Taking this into account the continuous process presented here would still be beneficial even if the reversible dimers are not removed during the downstream processing as the total process time is lower for the continuous process.

4. Conclusions

It is vital to include mobile phase dimerization when modeling batch-wise downstream processing, since it has a profound effect on the yield and productivity. This effect takes place both directly through loss of product, and indirectly through changes in concentration at the inlet to the CIEX. The fraction of dimers present changes most radically during the virus inactivation, due to the low pH and salt concentration. The amount of dimers formed as well as the process time will be lower when SEC columns are used, rather than storage tanks, during the downstream process. Thus, continuous downstream processing should be preferred over batch-wise operation from the point of view of minimizing the dimerization and process time.

Acknowledgments

The authors would like to acknowledge the support and funding from VINNOVA and Novo Nordisk A/S. Process Industrial Centre at Lund University and Process Industrial IT and Automation are acknowledged for their support.

Author Contributions

Anton Sellberg conducted most of the work and wrote the article. Frida Ojala and Bernt Nilsson helped design the study and analyse the data.

Conflicts of Interest

The authors declare no conflict of interest.

References

  1. Hagel, L.; Jagschies, G.; Sofer, G. Biopharmaceuticals Today. In Handbook of Process Chromatography, 2nd ed.; Sofer, L., Ed.; Academic Press: Amsterdam, The Netherlands, 2008; pp. 1–22. [Google Scholar]
  2. Marichal-Gallardo, P.A.; Álvarez, M.M. State-of-the-art in downstream processing of monoclonal antibodies: Process trends in design and validation. Biotechnol. Prog. 2012, 28, 899–916. [Google Scholar] [CrossRef] [PubMed]
  3. Westerberg, K. Modeling for Quality and Safety in Biopharmaceutical Production Processes. PhD Thesis, Lund University, Lund, Scania, Sweden, 2012. [Google Scholar]
  4. Shukla, A.A.; Hubbard, B.; Tressel, T.; Guhan, S.; Low, D. Downstream processing of monoclonal antibodies—Application of platform approaches. J. Chromatogr. B 2007, 848, 28–39. [Google Scholar] [CrossRef] [PubMed]
  5. Perez-Almodovar, E.X.; Carta, G. IgG adsorption on a new protein A adsorbent based on macroporous hydrophilic polymers. I. Adsorption equilibrium and kinetics. J. Chromatogr. A 2009, 1216, 8339–8347. [Google Scholar] [CrossRef] [PubMed]
  6. Ng, C.K.; Osuna-Sanchez, H.; Valéry, E.; Sørensen, E.; Bracewell, D.G. Design of high productivity antibody capture by protein A chromatography using an integrated experimental and modeling approach. J. Chromatogr. B 2012, 899, 116–126. [Google Scholar] [CrossRef] [PubMed]
  7. Borg, N.; Brodsky, Y.; Moscariello, J.; Vunnum, S.; Vedantham, G.; Westerberg, K.; Nilsson, B. Modeling and robust pooling design of a preparative cation-exchange chromatography step for purification of monoclonal antibody monomer from aggregates. J. Chromatogr. A 2014, 1359, 170–181. [Google Scholar] [CrossRef] [PubMed]
  8. Guo, J.; Zhang, S.; Carta, G. Unfolding and aggregation of a glycosylated monoclonal antibody on a cation exchange column. Part I. Chromatographic elution and batch adsorption behavior. J. Chromatogr. A 2014, 1356, 117–128. [Google Scholar] [PubMed]
  9. Ojala, F.; Degerman, M.; Hansen, T.B.; Broberg Hansen, E.; Nilsson, B. Prediction of IgG1 aggregation in solution. Biotechnol. J. 2014, 9, 800–804. [Google Scholar] [CrossRef] [PubMed]
  10. Arosio, P.; Barolo, G.; Müller-Späth, T.; Wu, H.; Morbidelli, M. Aggregation stability of a monoclonal antibody during downstream processing. Pharm. Res. 2011, 28, 1884–1894. [Google Scholar] [CrossRef] [PubMed]
  11. Lumry, R.; Eyring, H. Conformation changes of proteins. J. Phys. Chem. 1954, 58, 110–120. [Google Scholar] [CrossRef]
  12. Chi, E.Y.; Krishnan, S.; Randolph, T.W.; Carpenter, J.F. Physical stability of proteins in aqueous solution: Mechanism and driving forces in nonnative protein aggregation. Pharm. Res 2003, 20, 1325–1336. [Google Scholar] [CrossRef] [PubMed]
  13. Kelley, B. Very large scale monoclonal antibody purification: The case for conventional unit operations. Biotechnol. Progr. 2007, 23, 995–1008. [Google Scholar] [CrossRef] [PubMed]
  14. Deisenhofer, J. Crystallographic refinement and atomic models of a human Fc fragment and its complex with fragment B of protein A from Staphylococcus aureus at 2.9 and 2.8 ANG. resolution. Biochemistry 1981, 20, 2361–2370. [Google Scholar] [CrossRef]
  15. Kelley, B.; Tobler, S.A.; Brown, P.; Coffman, J.L.; Godavarti, R.; Iskra, T.; Switzer, M.; Vunnum, S. Weak partitioning chromatography for anion exchange purification of monoclonal antibodies. Biotechnol. Bioeng. 2008, 101, 553–566. [Google Scholar] [CrossRef] [PubMed]
  16. Ojala, F. Modeling Antibody Aggregation in Downstream Processing. PhD Thesis, Lund University, Lund, Scania, Sweden, 2015. [Google Scholar]
  17. Brooks, C.A.; Cramer, S.M. Steric mass-action ion exchange: Displacement profiles and induced salt gradients. AIChE J. 1992, 38, 1969–1978. [Google Scholar] [CrossRef]
  18. Karlsson, D.; Jakobsson, N.; Brink, K.J.; Axelsson, A.; Nilsson, B. Methodologies for model calibration to assist the design of a preparative ion-exchange step for antibody purification. J. Chromatogr. A 2004, 1033, 71–82. [Google Scholar] [CrossRef] [PubMed]
  19. Davis, M.E. Numerical methods and modeling for chemical engineers; John Wiley & Sons: New York, NY, 1984. [Google Scholar]
  20. LeVeque, R.J. Finite Volume Methods for Hyperbolic Problems; Cambridge University Press: Cambridge, UK, 2002; Volume 31. [Google Scholar]
  21. Shu, C.W. Essentially Non-Oscillatory and Weighted Essentially Non-Oscillatory Schemes for Hyperbolic Conservation Laws; Springer: Berlin, Germany; Heidelberg, Germany, 1998. [Google Scholar]
  22. Shampine, L.F.; Reichelt, M.W. The matlab ode suite. SIAM J. Sci. Comput. 1997, 18, 1–22. [Google Scholar] [CrossRef]
  23. Voitl, A.; Butté, A.; Morbidelli, M. Behavior of human serum albumin on strong cation exchange resins: I. Experimental analysis. J. Chromatogr. A 2010, 1217, 5484–5491. [Google Scholar] [CrossRef] [PubMed]
  24. Gillespie, R.; Nguyen, T.; Macneil, S.; Jones, L.; Crampton, S.; Vunnum, S. Cation exchange surface-mediated denaturation of an aglycosylated immunoglobulin (IgG1). J. Chromatogr. A 2012, 1251, 101–110. [Google Scholar] [CrossRef] [PubMed]
  25. Marek, W.; Muca, R.; Woś, S.; Piątkowski, W.; Antos, D. Isolation of monoclonal antibody from a Chinese hamster ovary supernatant. II: Dynamics of the integrated separation on ion exchange and hydrophobic interaction chromatography media. J. Chromatogr. A 2013, 1305, 64–75. [Google Scholar] [PubMed]

