Suitability of a Consensual Fuzzy Inference System to Evaluate Suppliers of Strategic Products


Department of Business Administration, University of Oviedo, Gijón Campus, 33203 Gijón, Spain
*
Author to whom correspondence should be addressed.
Symmetry 2018, 10(1), 22; https://doi.org/10.3390/sym10010022
Submission received: 12 December 2017
/
Revised: 27 December 2017
/
Accepted: 3 January 2018
/
Published: 10 January 2018
(This article belongs to the Special Issue Symmetry in Fuzzy Sets and Systems)
Abstract
:This paper designs a bidding and supplier evaluation model focused on strategic product procurement, and develops their respective evaluation knowledge bases. The model is built using the most relevant variables cited in the reviewed procurement literature and allows to compare two evaluation methods: a factor weighting method (WM) and a fuzzy inference system (FIS). By consulting an expert panel and using a two-tuples symbolic translation system, strong fuzzy partitions for all model variables are built. The method, based on central symmetry, permits to obtain the fuzzy label borders from their cores, which have been previously agreed among experts. The system also allows to agree the fuzzy rules to embed in the FIS. The results show the FIS method’s superiority as it allows to better manage the non-linear behavior and the uncertainty inherent to the supplier evaluation process.
1. Introduction
In recent years, researchers and practitioners have intensified their studies on suppliers’ selection and evaluation (SSE), as those are complex and fundamental processes to achieve flexible and efficient supply chains [1]. These processes are crucial among others, to face the growth of outsourcing [2], to facilitate the maintenance of long-term collaboration and to reduce the number of reliable suppliers who work with [3]. The SSE is perceived as a key strategic element in the actual global economy [2] due to factors such as: (a) the intensification of such globalization, (b) the product life cycle shortening and the increase of the relative cost of outsourced materials, (c) the risk and uncertainty associated with the rapid changes of the market and customer preferences, which force companies to focus on key activities to be more competitive, (d) the need to obtain and maintain competitive advantages and, (e) the intensive use of the internet in purchases [4,5,6,7,8]. Thus, to make appropriate decisions about SSE has come to play a key role in business management.
The SSE process seeks to review, evaluate and choose the appropriate suppliers that should be part of the company supply chain [9]. Those should be able to supply the requested products/services in the appropriate quantities, prices and deadlines [10].
The vast majority of the recent relevant consulted literature conceives the SSE as a multi-attribute decision problem (MADM), where a trade-off between various conflicting criteria (qualitative and quantitative) should be achieved among different solution alternatives [11]. In addition, the fuzzy sets theory has proven to be an important and powerful tool to consider the risks and uncertainties associated with certain qualitative variables in the EES models e.g., the vague nature of the human judgments’ description inherent to the assessment [1,2,7,12]. Thus, “fuzzy” versions of these MADM tools have proliferated, both in their single and hybrid applications [7,13,14]. On the other hand, the SSE models proposed in recent years tend to incorporate green, sustainable, and strategy-related factors, although they are still in an early stage of research cycle [15].
In any case, many of the SSE models are characterized by several shortcomings: (a) the lack of a desirable standardization in the terminology used, both to identify the stages of the selection process and to define and measure the number of key variables to be considered in the models; (b) the difficulty for jointly assessing historical and new suppliers [16]; (c) the difficulty to manage the uncertainty inherent to the definition of the variables and the evaluation rules of the models-especially when such definition should be reached by agreeing on the knowledge of several experts—or the uncertainty inherent to various risks present in many supply chains [17,18,19,20]; (d) the absence of clear criteria which to evaluate vendor offerings with, based on the product characteristics.
Thus, the aim of this paper is to design an SSE model, which simultaneously addresses the previous shortcomings. To this end, we propose a fuzzy inference system (FIS) for suppliers’ evaluation in the context of strategic products. This system reaches an agreement on both the partitions of the fuzzy variables involved in the FIS and their evaluation rules from the knowledge of several experts. Then, the proposed system is compared to a classic weighting factors method (weighted point-model) showing a clear superiority in its performance.
The paper is distributed into five sections. In Section 2, a review of the literature allows both to standardize the used vocabulary and identify the factors and methodologies most frequently employed in supplier evaluation. Section 3 shows the proposal of an evaluation model, explaining its operational performance, defining the factors with influence on the bid evaluation and specifying the criteria usually adopted to buy strategic products. In Section 4 two evaluation techniques are applied to the model and the results analyzed from an illustrative case study. Finally, the conclusions of the papers are presented.
2. Literature Review
In this section, a revision is made about concepts and relevant methodologies and factors used in the SSE.
2.1. Terminology Matters
Two broad approaches are distinguished in the SSE spectrum [21]: the single approach, seeking a single vendor that meets all the requirements of the buyer; and the multiple approach, where a single vendor may not satisfy all the needs of the buyer, who is then impelled to distribute the purchase among several suppliers.
Regardless of the approach, there is quite a lot of confusion regarding both the denomination and boundaries used to refer to each of the purchasing process stages. Part of that confusion stems from some authors not defining the evaluation and selection phases, the two main and subsequent stages, in a concise manner [22]. Some others, put more emphasis on the “frequency” of evaluation [23]. There are some others who conceive the evaluation embedded within the selection, instead of that which is not [24,25,26,27]. A few authors have introduced the term “ranking” with a similar meaning [28] and there are even those who add a supplier segmentation stage, for categorizing the vendors after the selection process, so that different strategies can be adopted in each of the resulting segments, in the purchasing process [29].
Recently, several authors have pointed out the need to pay more attention to a fourth stage, the pre-qualification, according to which suppliers are classified as “approved”. This stage allows to reduce the initial set of qualified suppliers on which to perform the subsequent selection [2,30]. In addition, a good pre-selection will result in more efficient final selections and in the establishment of more stable and lasting future relationships [31].
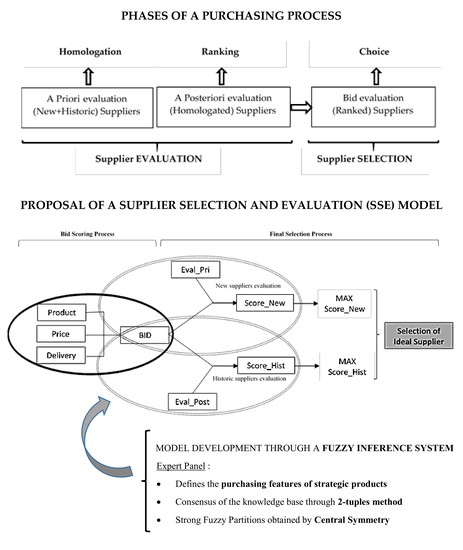
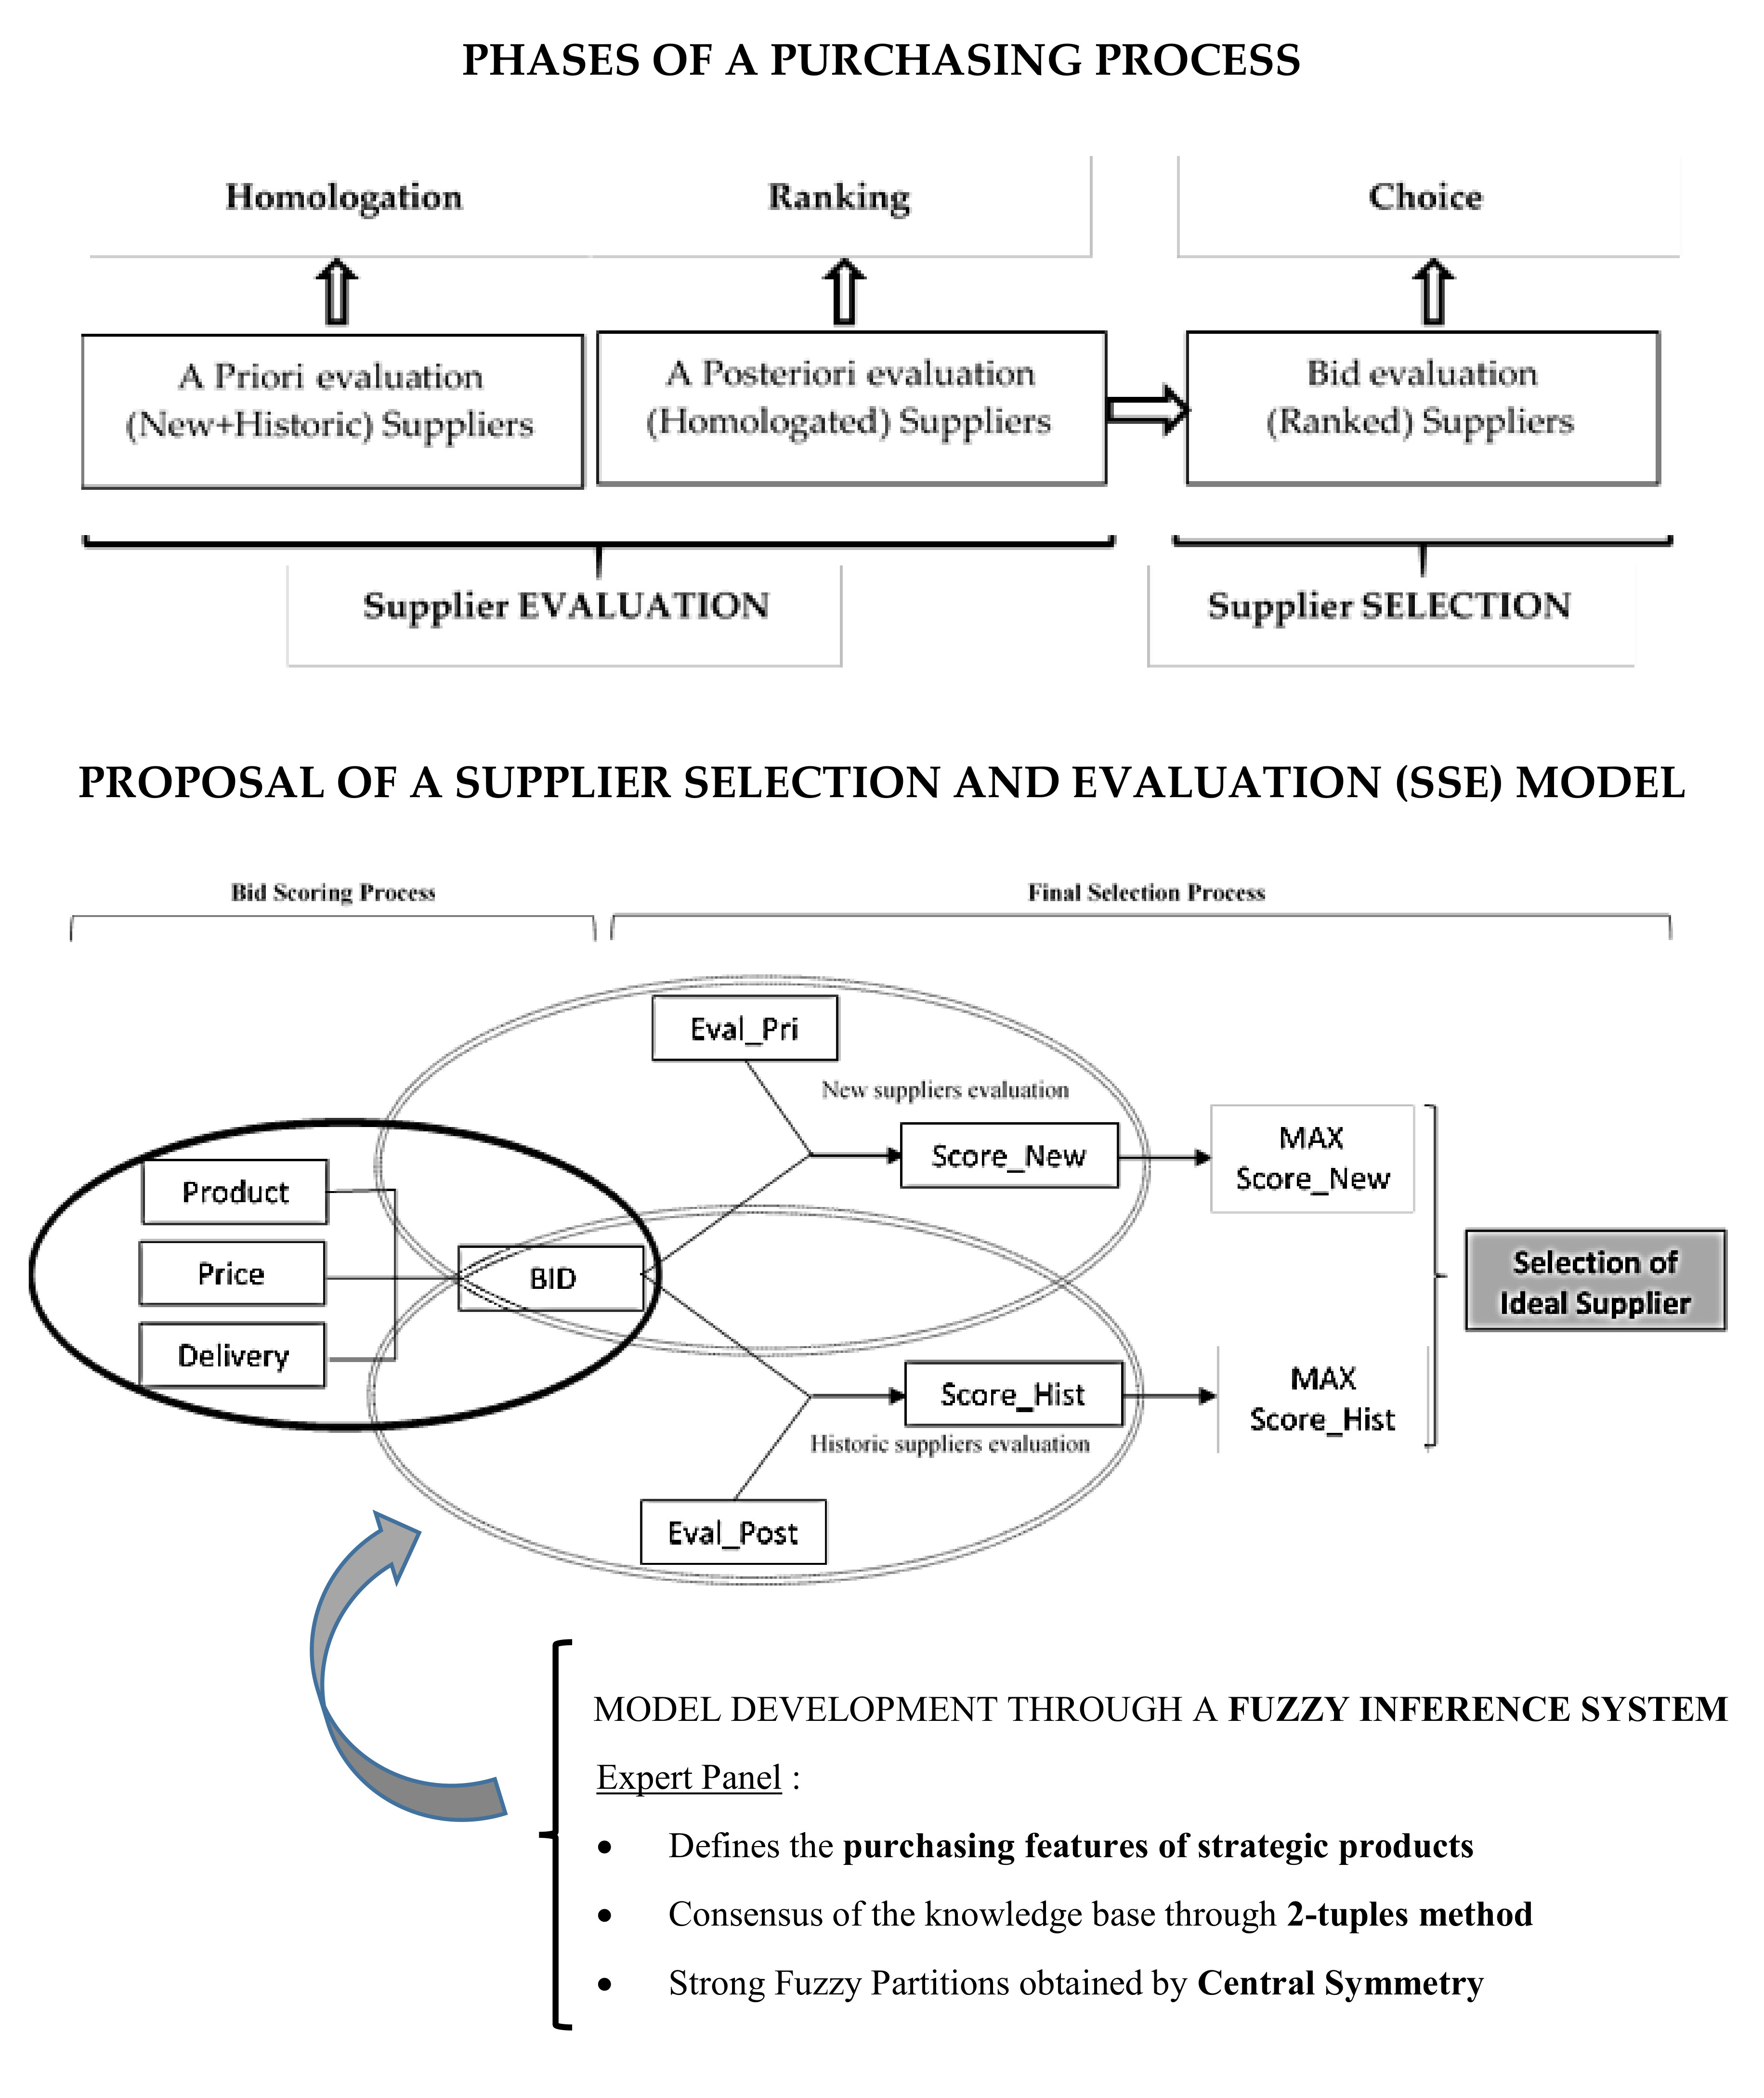
In this paper, the original evaluation proposal from Dickson [32] is chosen, differentiating between two types of evaluation. The initial evaluation, (hereinafter “a-priori” evaluation), will be applied on new suppliers in order to classify them as “approved” and establish commercial relationships with them provided that they comply with the company’s purchase requirements. The second type of evaluation, called “a-posteriori”, rounds off the a-priori evaluation by providing the supplier’s behavior analysis during the commercial relationship along time [33]. Regarding supplier selection, both evaluations should be jointly considered with the bid analysis, in order to obtain the most suitable supplier for a particular purchase. All these phases would configure the so-called “purchasing process” (see Figure 1).
2.2. Main Methodologies and Factors Used in SSE Models
Several MADM techniques have been proposed for the SSE problem: analytic hierarchy process (AHP) [34,35,36], analytic network process (ANP) [34], complex proportional assessment (COPRAS) [36,37,38], data envelopment analysis (DEA) [36,39,40,41], elimination et choix traduisant la realité (ELECTRE) [42,43], preference ranking organization method for enrichment of evaluations (PROMETHEE) [44], technique for order of preference by similarity to ideal solution (TOPSIS) [45,46,47,48,49], visekriterijumska optimizacija i kompromisno resenje (VIKOR) [50,51], decision-making trial and evaluation laboratory (DEMATEL) [52,53], multi-objective optimisation by ratio analysis (MOORA) [54], case based reasoning (CBR) [55], fuzzy inference systems [56,57], genetic algorithm (GA) [58], mathematical and goal programming (MP) [59], simple multi-attribute rating technique (SMART) [60], and their hybrids, among others. In those MADM techniques, the supplier qualification is set according to the valuation given to different relevant factors (qualitative and quantitative) in the evaluation process. On many occasions, fuzzy versions of these MADM methods have been developed to manage the uncertainty and subjective nature of some of the qualitative factors to rate more efficiently [1,35,61,62].
Several review papers tackle general SSE models in the related literature [1,63,64,65,66,67]. More recent reviews [68,69,70,71] have put their focus on “green” and “sustainability” issues of the SSE problem. Bibliography related to all the factors and techniques mentioned in those reviews is not replicated here; readers are referred to those reviews instead.
The most current collection of factors susceptible to be incorporated in SSE general models, excluding additional green/sustainable factors, which are still in an early stage of research cycle [15] are the ones shown in the review of Ho et al. [66] and summarized in Table 1.
The attributes considered in our proposal are those listed in the last column of Table 1.
As far as research on methodologies applicable to this problem is concerned, much progress has been made. The models’ construction heads to minimize purchase risks, increasing the global value for buyers and consolidating sustainable relationships over time [31]. Table 2 shows the five most commonly used methods (both pure and hybrid) according to the collections of [66] and the most recent of [1]. Although papers selected from both reviews are not based on an identical structure (period of time analyzed, papers-books-conferences, databases used), note that the hybrid techniques are the most frequently used: DEA, AHP and TOPSIS techniques, including their fuzzy versions, are the ones that stand out.
Researchers applying these methods in the SSE field highlight its soundness in terms of efficiency, flexibility and robustness. However, several authors also point out some deficiencies [7]. As regards DEA, entry criteria tend to be confused with output criteria (e.g., cost and price) and inconsistency problems may arise when qualitative criteria are subjectively assessed. Concerning AHP, problems of consistency may also arise when dealing with a large number of criteria; in addition, achieving high levels of consistency can be time consuming. Moreover, most of these techniques in SSE context could be difficult to implement in companies because the academic background of purchasing officers is better suited to the area of business administration than to computer science.
Based on the foregoing, our proposed SSE model will incorporate the factors shown in the right column of the Table 1. With regard to the qualification methodology, fuzzy inference systems (FIS) have been chosen based on several motives. First, FIS guarantee more intuitive operability than hybrid techniques, since these systems are built from natural language which fits better with the typical profile of a purchasing manager. Second, FIS allow mitigating certain disadvantages associated to traditional and more simplistic valuation techniques (e.g., weighted point model), as will be shown later in this paper. Third, FIS make it more intuitive the inclusion of consensual knowledge bases in the evaluation process (e.g., by means of a two-tuples method) improving its interpretation and allowing to incorporate the vagueness related to some qualitative factors considered in the SSE model.
3. Supplier Evaluation Model for Strategic Products Purchasing
The measurement of some variables incorporated in SSE models may depend on the evaluator’s experience and subjectivity and the type of product to be purchased. Therefore, it is convenient to design objective and systematic evaluation models that minimize the halo effect [72], which is common in supplier evaluations and purchase assignments [73].
Figure 2 depicts our SSE model proposal. Based on the evaluation of the offers, two different evaluations are proposed for new or historical suppliers. The bid evaluation knowledge will follow different criteria depending on the type of product being purchased (in this paper, the one related to strategic products, according to the Kraljic’s typologies [74,75,76]).
In the figure, the subsystem on the left evaluates a bid as a function of three factors: the product requirements, the price offered and the delivery conditions. The subsystems on the right assess new (top) or historical (bottom) suppliers based on the bid valuation and their original/historical qualifications. To obtain the original/historical ratings (a priori and a posteriori), we have followed the model proposed in [77]; for the evaluation of suppliers in commodity-type products, we have followed the model developed in [78]. This way, a global ranking to make the final selection can be established.
The indicators to evaluate the bids are detailed in Table 3 and those of the final evaluation in Table 4.
The proposed subsystems may use different methodologies to infer their evaluation (in this case, as detailed in Section 4, we have opted for a classical factor weighting method and a fuzzy inference system). Then, by concatenating the partial evaluations according to the model, the final ratings will be obtained and a supplier ranking can be established.
Knowledge about Strategic Product Bid Evaluation
When time arrives to evaluate the bids, it is crucial to take into account the type of product being purchased since the supplier relevant attributes for the decision to be made will vary depending on the criticality of the article. In this paper, Kraljic matrix typology has been selected for being one of the most effective ways to deliver accurate supplier segmentation [59]. Kraljic argued that supply items should be mapped against two key dimensions, supply risk and profit impact, which put together yield a classic two-by-two matrix with four distinct product categories: strategic (1), bottlenecks (2), leverage (3) and general or non-critical (4) see Figure 3.
Attending only to the vulnerability to the supplier’s disappearance, two different groups can be distinguished: (Group A) formed by strategic products and bottlenecks, and (Group B) formed by leverage and non-critical products. Therefore, when the need arises, purchasing of Group A products involves a high likelihood for an unexpected event in the supply chains to disrupt operations, while Group B ones usually have low risks associated. In our study, a brief Delphi study was carried out [62,63] in order to identify the most significant award criteria for strategic products type. The study’s participants were selected from a list of purchasing officers of industrial firms in the Principality of Asturias (Spain).
Interviewed companies deemed supply risk as the primary decision factor for strategic products and bottlenecks. Therefore, establishing long-term collaboration agreements with suppliers is essential to eliminate or reduce such risk and ensure product availability when needed. The study also shows “Delivery” followed by “Product” and finally “Price” as the most significant variables in scoring the bid. Additionally, it should be noted that almost all awards are made to historical suppliers. Consequently, greater emphasis must be given to the “a posteriori” evaluation, prioritizing the allocation of purchases to historical suppliers (except when their behavior does not exceed a minimum threshold set by the company itself). The study has also revealed that some of the surveyed companies requested “test orders” (requests for small amounts) to new suppliers in order to analyze their behavior, converting them into historical ones and having them in their portfolio.
4. Inference Methods Applied in the Evaluation Model
There is a wide variety of inference methodologies applicable in the context of SSE [1,66]. Among them, we have chosen two, to show how our model works: A classic factor weighting method (easy to use, although with operational and conceptual drawbacks) and a fuzzy inference system (which allows to incorporate the uncertainty of valuation of certain factors, and brings substantial advantages).
4.1. Factor Weighting Method
A factor weighting method [79], evaluates the output factor of a system as the weighted average of their input variables. Thus, once the input factors of each subsystem are assessed and their weights (Wi) defined, it is easy to find its final output rating by linear combination. Equations (1)–(3) show the valuations for the three subsystems of our proposed SSE model.
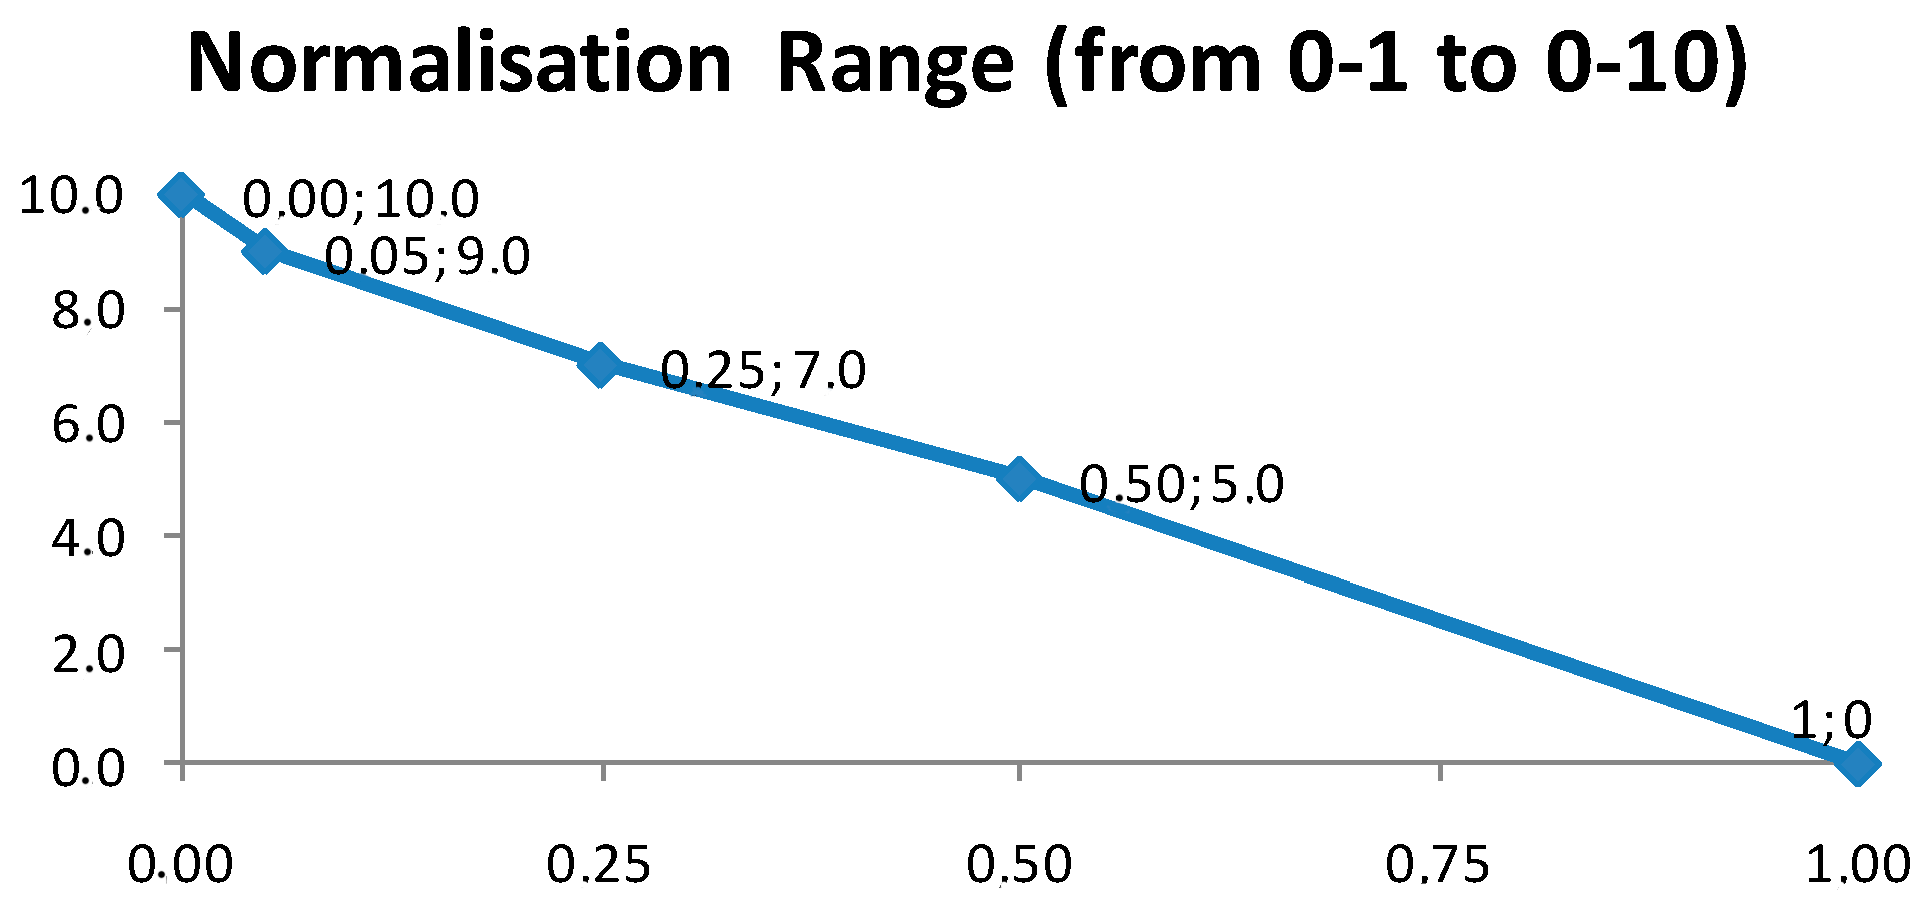
The mathematical structure of these formulas imposes a strong linear behavior in the output factors of all subsystems and it may prevent the penalty of an output factor even if a determinant input factor is poorly qualified. In our case, experts considered “Delivery” to be a decisive factor that must reach a minimum value in order to accept the bid. However, the weighting method could accept a bid with a poor value of “Delivery” whenever the rest of input variables compensate upwards such poor value. Moreover, this method forces input factor ranges to be measured in the same scale of the output factor. Thus, in our system, factor “Price” should be previously normalized (e.g., by an interpolation function) to the range [0,10] according to the values in Table 3. In addition, the evaluation knowledge implicit in these formulas is much less intuitive than the one incorporated in other rule-base systems, so it is very difficult to conceptualize the supplier evaluation carried out through this method. All these disadvantages make the weighting method to be very rigid to evaluate bids and suppliers.
Furthermore, SSE problems tend to be complex in nature and insufficiently structured [80] and must often agree the assessments of their qualitative factors subject to uncertainty and ambiguity [81]. For this reason, fuzzy inference systems emerge as an opportunity to incorporate this feature and mitigate the aforementioned disadvantages of the previous method.
4.2. Fuzzy Inference System (FIS)
Fuzzy decision support systems (also called FIS) rely on the fuzzy sets theory [82] to process linguistic values (fuzzy numbers) in their input and output factors. To develop the inference, it is necessary to define the system knowledge base, deciding: (1) how to segregate the original domains of the system variables by using linguistic labels (fuzzy numbers), and (2) the conditional rule base that will govern the inference process, involving these variables and their assignable labels. A rule of this type could be: IF [Product = Insuf & Price = Accep & Delivery = Ideal] THEN [Bid = Med], where “Insuf”, “Accep” and “Ideal” would be the assigned labels to the three input variables and “Med” the one assigned to the variable “Bid” in that specific rule. The inference process (in our case of Mamdani-type) is developed in five stages: fuzzification of crisp input values, application of logical operators in the antecedent of each rule, implication to the consequent of each rule, aggregation of the consequents of all the rules and defuzzification of the final aggregate [83]. A detailed explanation of this process can be accessed at http://www.mathworks.com/products/fuzzy-logic/.
In this paper, a panel of four experts, responsible for purchasing decisions of relevant industrial enterprises in the Principality of Asturias (Spain), collaborated with the research. The experts helped agree on both, the partitions of the fuzzy variables of the proposed model and the rule bases that allows to explain the potential assessments of all their constituent subsystems. Then, once consensus is reached on the definition of variables and the evaluation rules, the inference process can be triggered for any provider. The implementation was developed with the “Fuzzy” toolbox (v.2.0) MATLAB R2015a software © 1994-2018 The MathWorks, Inc. [84].
4.2.1. Variables Domain Partitioning Using 2-Tuplas and Central Symmetry
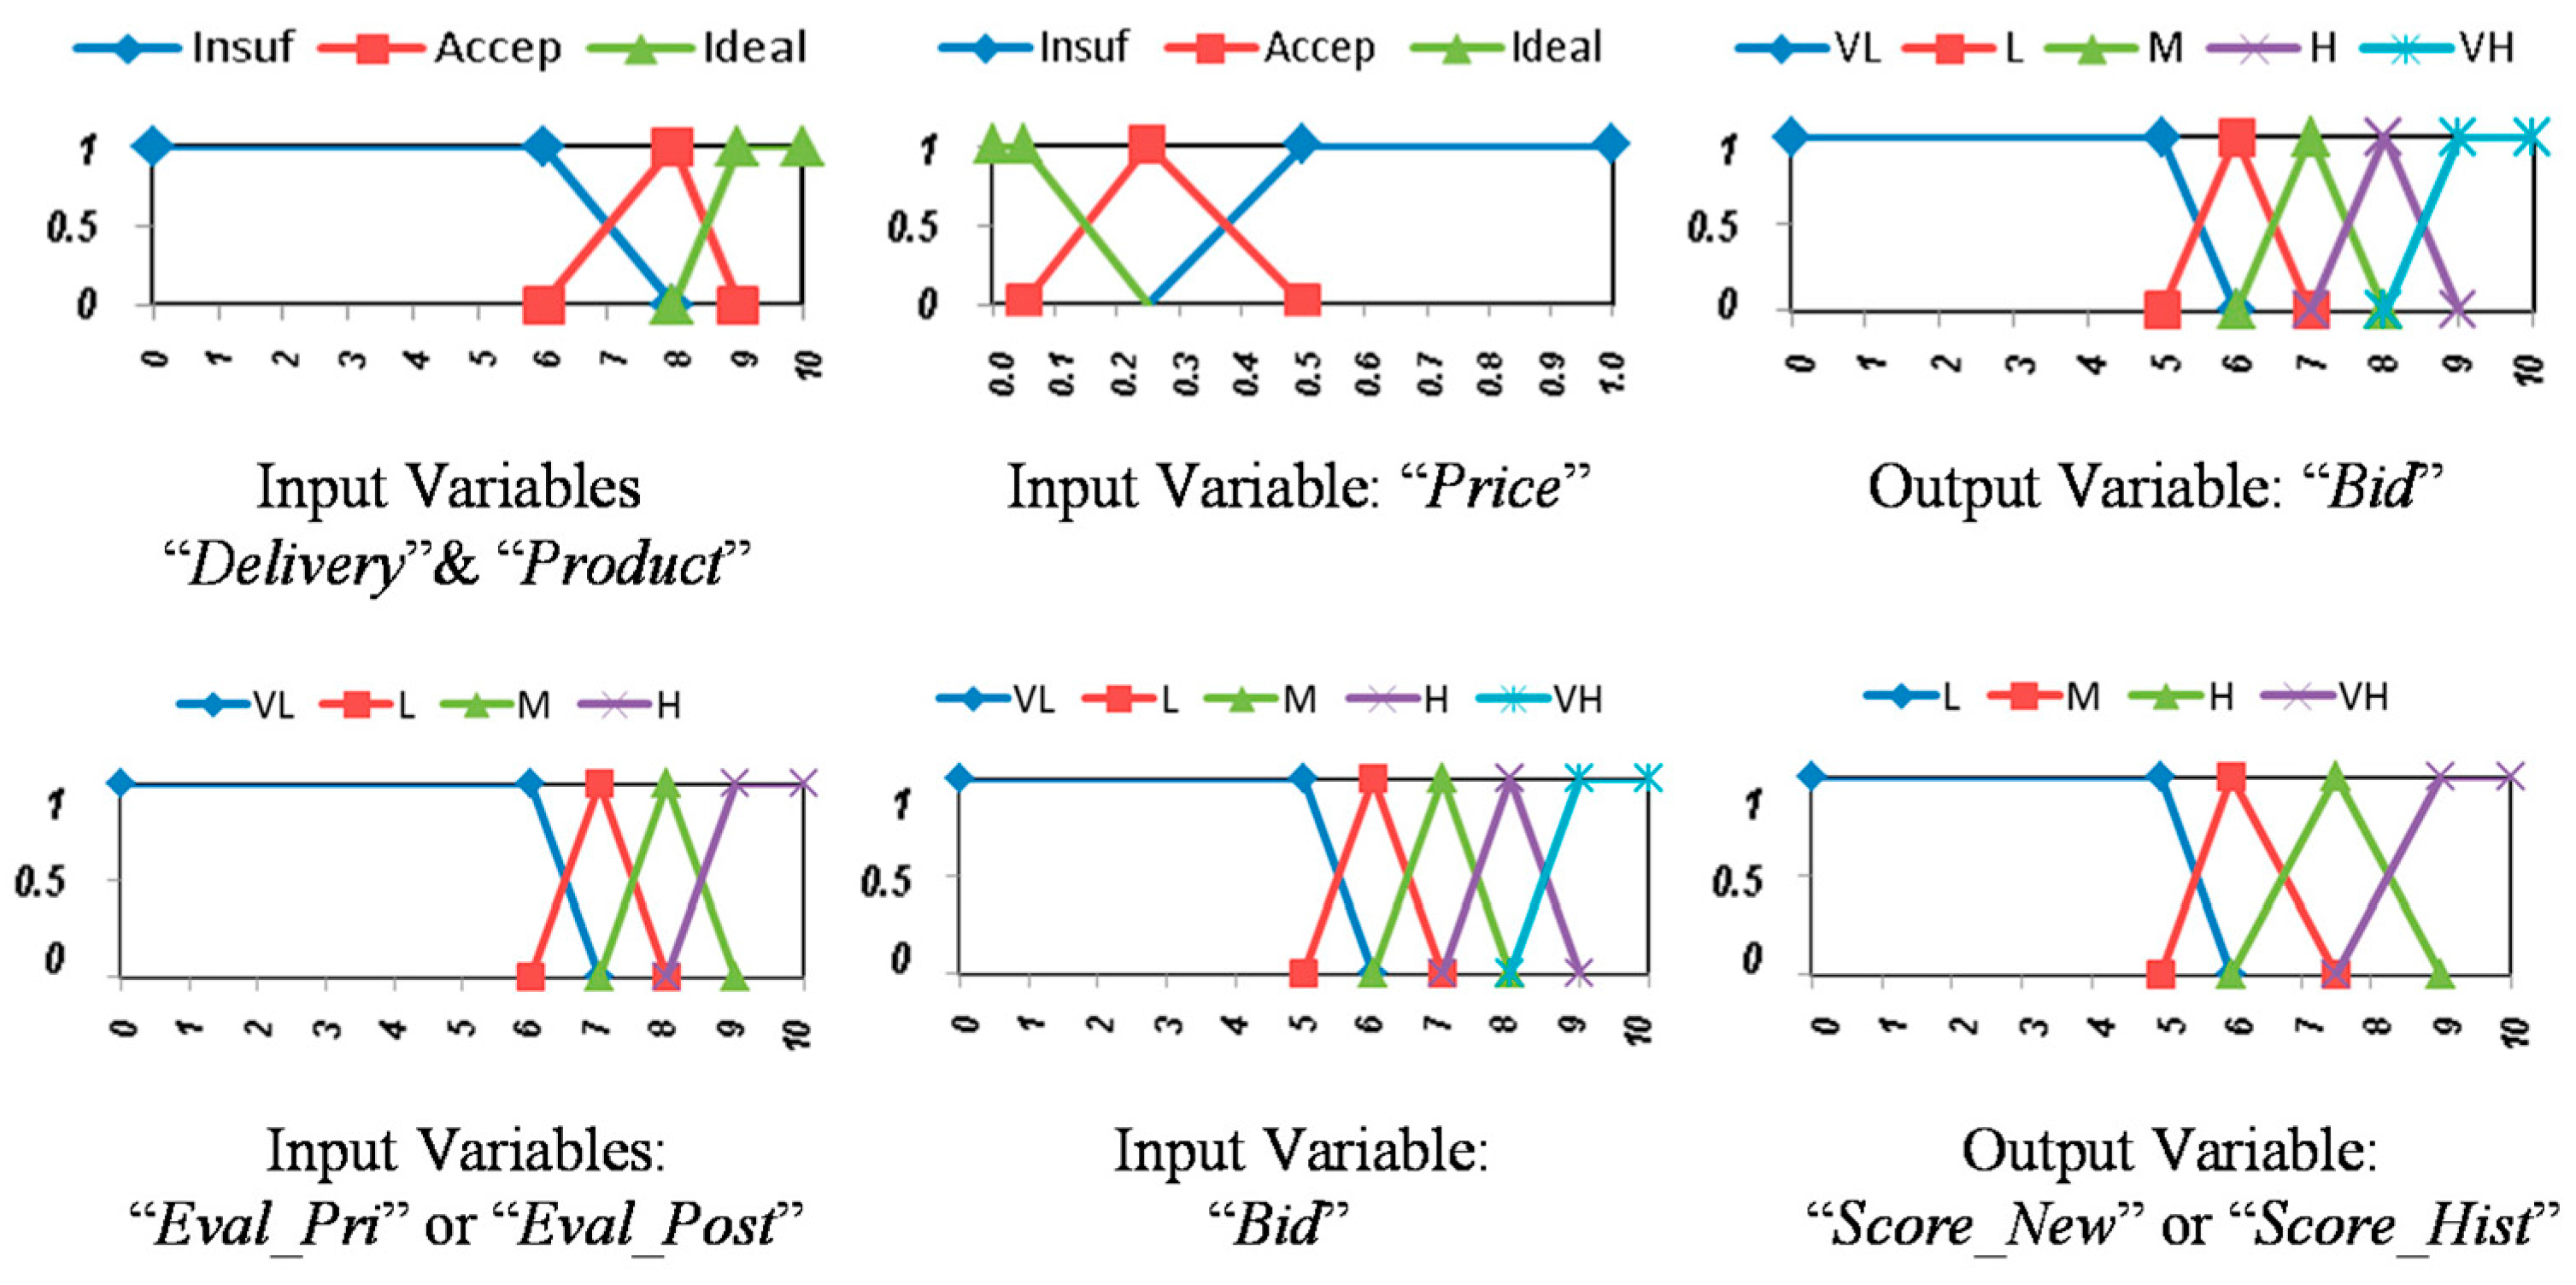
Firstly, after explaining the meaning of the variables of the subsystems in the model, and after rounding arithmetic means of the values given by the experts, it was agreed that the three input variables of the evaluation of bids subsystem [Delivery], [Product] and [Price] would be partitioned on three labels—equal among themselves for the first two. The output variable [Bid] would be defined by five labels. The subsystems for the final evaluation would have four equal labels for the input variables: [Eval_Pri]/[Eval_Post] and other four different to the previous ones but also equal each other for the output variables: [Score_New]/[Score_Hist].
To represent the semantic of the interior (extreme) labels of all domains, triangular (trapezoidal) fuzzy numbers (TFNs) were considered, since many authors consider them robust enough to linguistically express the ambiguous valuations given by the sources of information [85]. Regarding the design, strong fuzzy partitions were chosen [86], as they prove to be optimal in terms of comprehensibility by satisfying important semantics constraints as distinguishability, normalization, coverage or overlapping [87].
Core partitions were developed by a two-tuple fuzzy linguistic system, based on a symbolic translation. The system permits to manage a linguistic data as a pair of values (si, αi) where “si” is a linguistic term (from an original set “S” of linguistic terms) and “αi” is a numerical value assessed in [−0.5, 0.5) representing the symbolic translation. A detailed explanation of this model can be found in [88].
Below is the procedure used to define the core partition of the variable Bid (5 labels).
- (i)
- Definition of an ordered set {Si} of linguistic labels of preference (see Table 5).
- (ii)
- (iii)
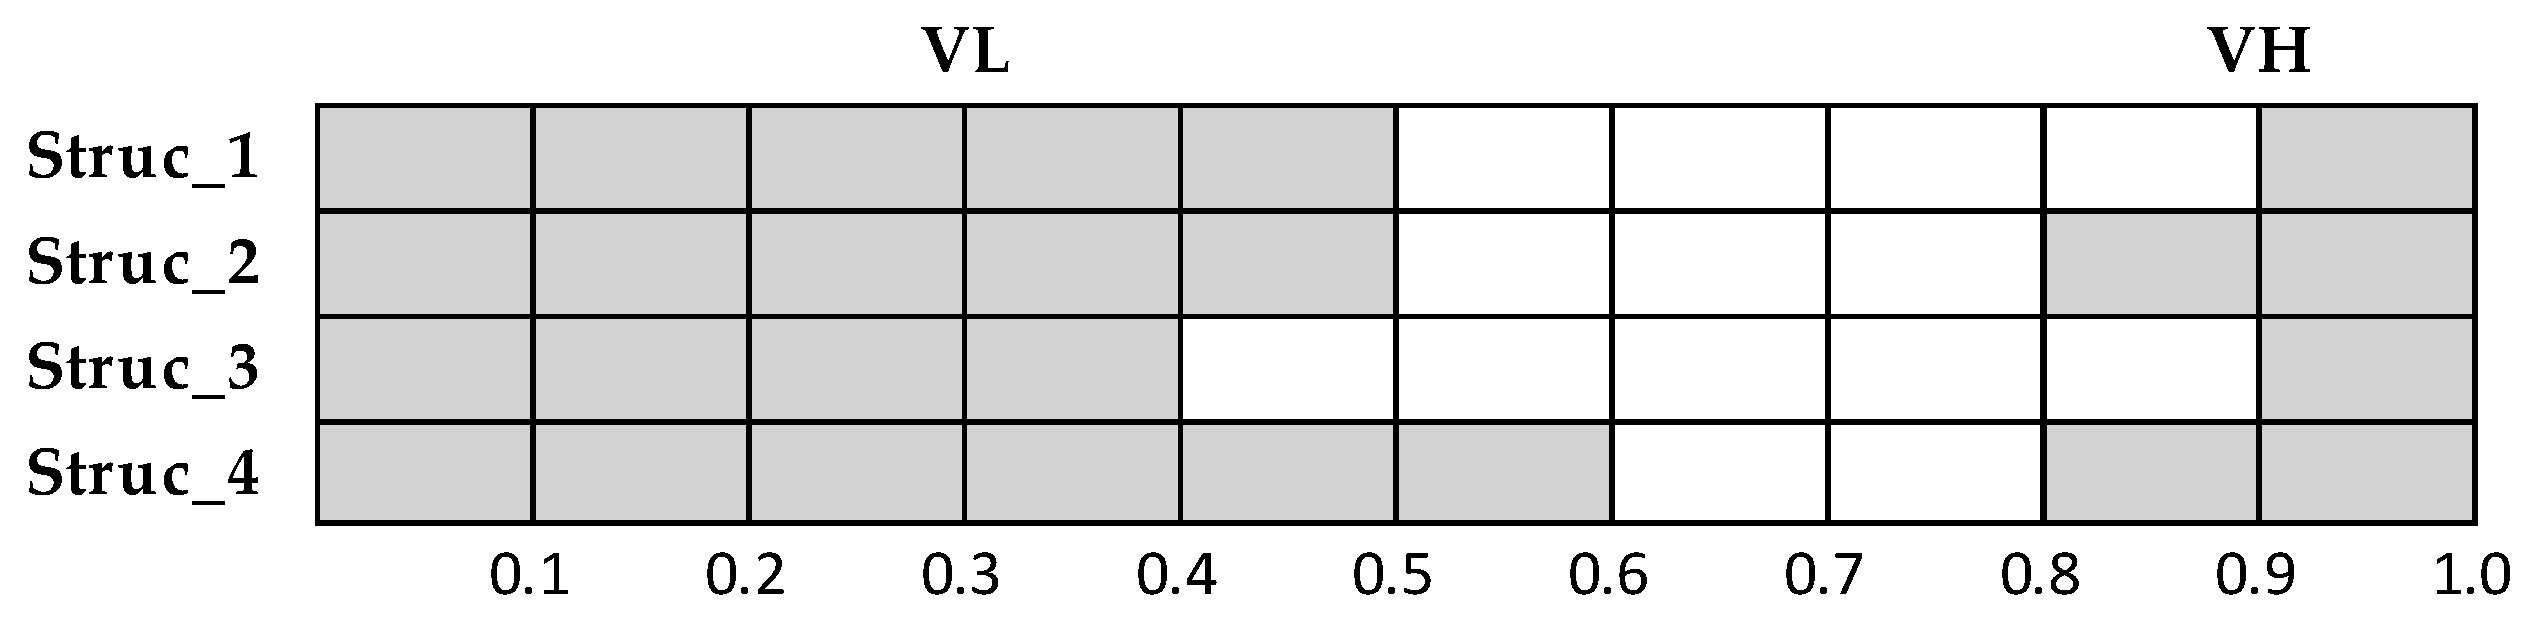
- Preference assessment {Si} from the experts for each proposed structure (see Table 6).
- (iv)
- In each structure, aggregate all the expert estimations (e.g., through the “Extended Arithmetic Mean (EAM)”, taking as values the order of labels in the scale {Si} [87]. Example: EAM (Struc_1) = (0 × 0 + 1 × 2 + 2 × 2)/4 = 1.5).
- (v)
- By means of a symbolic translation process based on the interval [−0.5, 0.5), development of the 2-tuples related to each structure (each 2-tuple should identify the original preference label nearest to the calculated EAM and its closeness (to left or right) See Figure 5.
- (vi)
- After identifying two-tuples of all structures, the one representing the highest preference according to their lexicographic order will be chosen as optimal (in this case, “Struc_1”).
- (vii)
- To obtain the cores of the internal fuzzy labels, an agreement should be reached on the value given by the experts, e.g., through modal value (mode). In this case, after revealing the cores of the external fuzzy labels, the following mode values were obtained: Low (L = 6), Medium (M = 7) and High (H = 8).
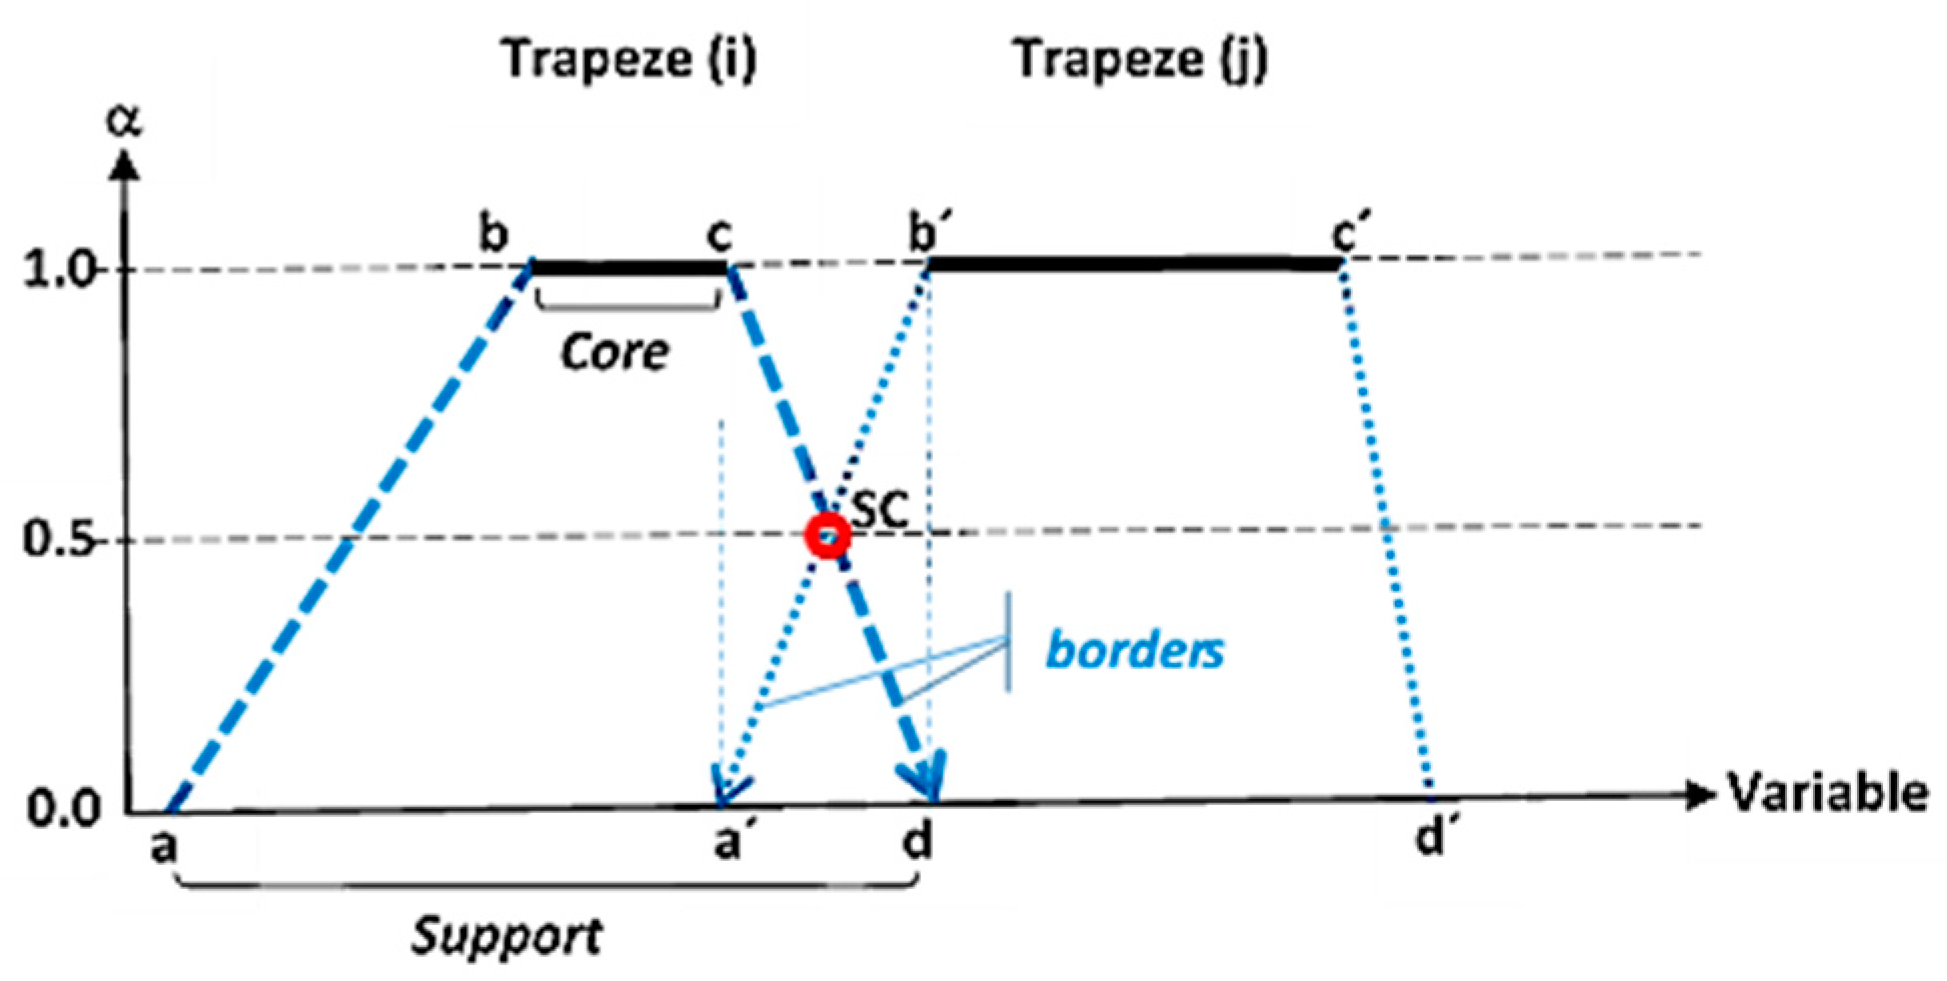
At this point, once the width-core structure was agreed by the above method, the semantic of each label can be developed by means of TFNs through a procedure based on central symmetry (taking into account the established criterion of achieving a strong fuzzy partition in each variable).
In a strong fuzzy partition (see Figure 6), two consecutive labels (i) and (j) given by their respective TFNs (a, b, c, d) and (a’, b’, c’, d’) overlap their borders at α = 0.5, so any crisp value in the overlapped zone intercept both borders at α* and (1- α*) levels respectively. In this manner, the opposite borders of each two consecutive labels can be determined by central symmetry being the symmetry center (SC) calculated as shown in Equation (4).
Once the cores of two consecutive labels have been agreed [b, c] and [b’, c’], the symmetrical points of c and b’ with respect to SC will allow determining the support points d and a’ respectively, as shown in Equations (4) and (5). Thus, to get strong fuzzy partitions, it is enough to overlap the borders of two consecutive labels at the SC level.
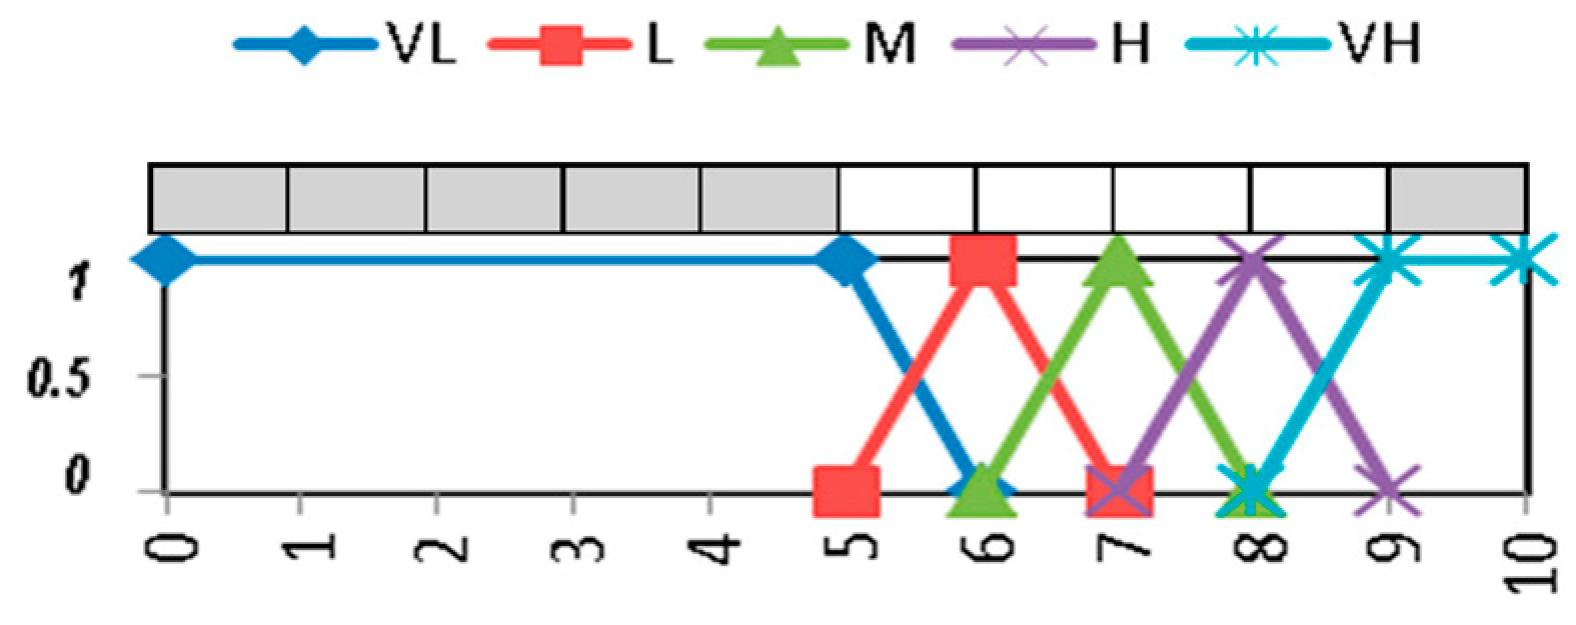
Figure 7 illustrates the final partition of the variable [BID] as an example.
Following the same procedure, the rest of the partitions in the proposed model were obtained, as can be observed in Figure 8.
4.2.2. Knowledge Elicitation for Rule Bases
On the other hand, to agree on the output label of each rule, the same symbolic translation method can be applied. In this case, experts will choose their preference (from the original set established in Table 5) for the possible output label of each rule. For example, for the antecedent of the rule: If (Product = Insuf & Price = Accep & Delivery = Ideal), experts must express their preferences regarding the possible output labels of the variable [BID]: {VL, l, M, H, VH}. Table 7 shows the calculation of two-tuples in this case, where the label “M” is the one that obtained the highest degree of preference. It should be chosen as the output label of such rule.
Table 8 and Table 9 summarise the conditional rule bases defined in the above mentioned manner for all model subsystems. The highlighted cell in Table 8, would express the rule: IF (Product = Insuf & Price = Accep & Delivery = Ideal) THEN (Bid = Med).
The embedded knowledge to evaluate the bids should be modified accordingly to the purchasing product typology and will be solely taken into account in the appropriate rule base. In this manner, the fuzzy partition of the bid subsystem variables will remain unchanged whatever purchasing product typology. The knowledge modifications will come in the assigned label to the rule output for all evaluation rules, based on the strategic product typology and according to the agreed evaluation from the experts.
4.2.3. Performance of the FIS
The designed FIS helps mitigate some drawbacks detected in the weighting method (WM). Figure 8 illustrates how the factor “Delivery” has to exceed six points for a bid to be admissible—limitation not imposed in the WM. Similarly, the direct definition of fuzzy labels exempts from the normalization process, as can be seen in the factor “Price”, straight defined in the interval [0,1].
Moreover, Table 8 and Table 9 show the inference knowledge agreed by the experts to carry out the evaluation processes in the form of rule bases. This inserted knowledge about the bid subsystem allows giving priority to the factor “Delivery” followed by “Product” and “Price”, according to the information given by the expert panel in subsection of Section 3. Therefore, the FIS knowledge is much more reliable and robust than the one offered by the WM.
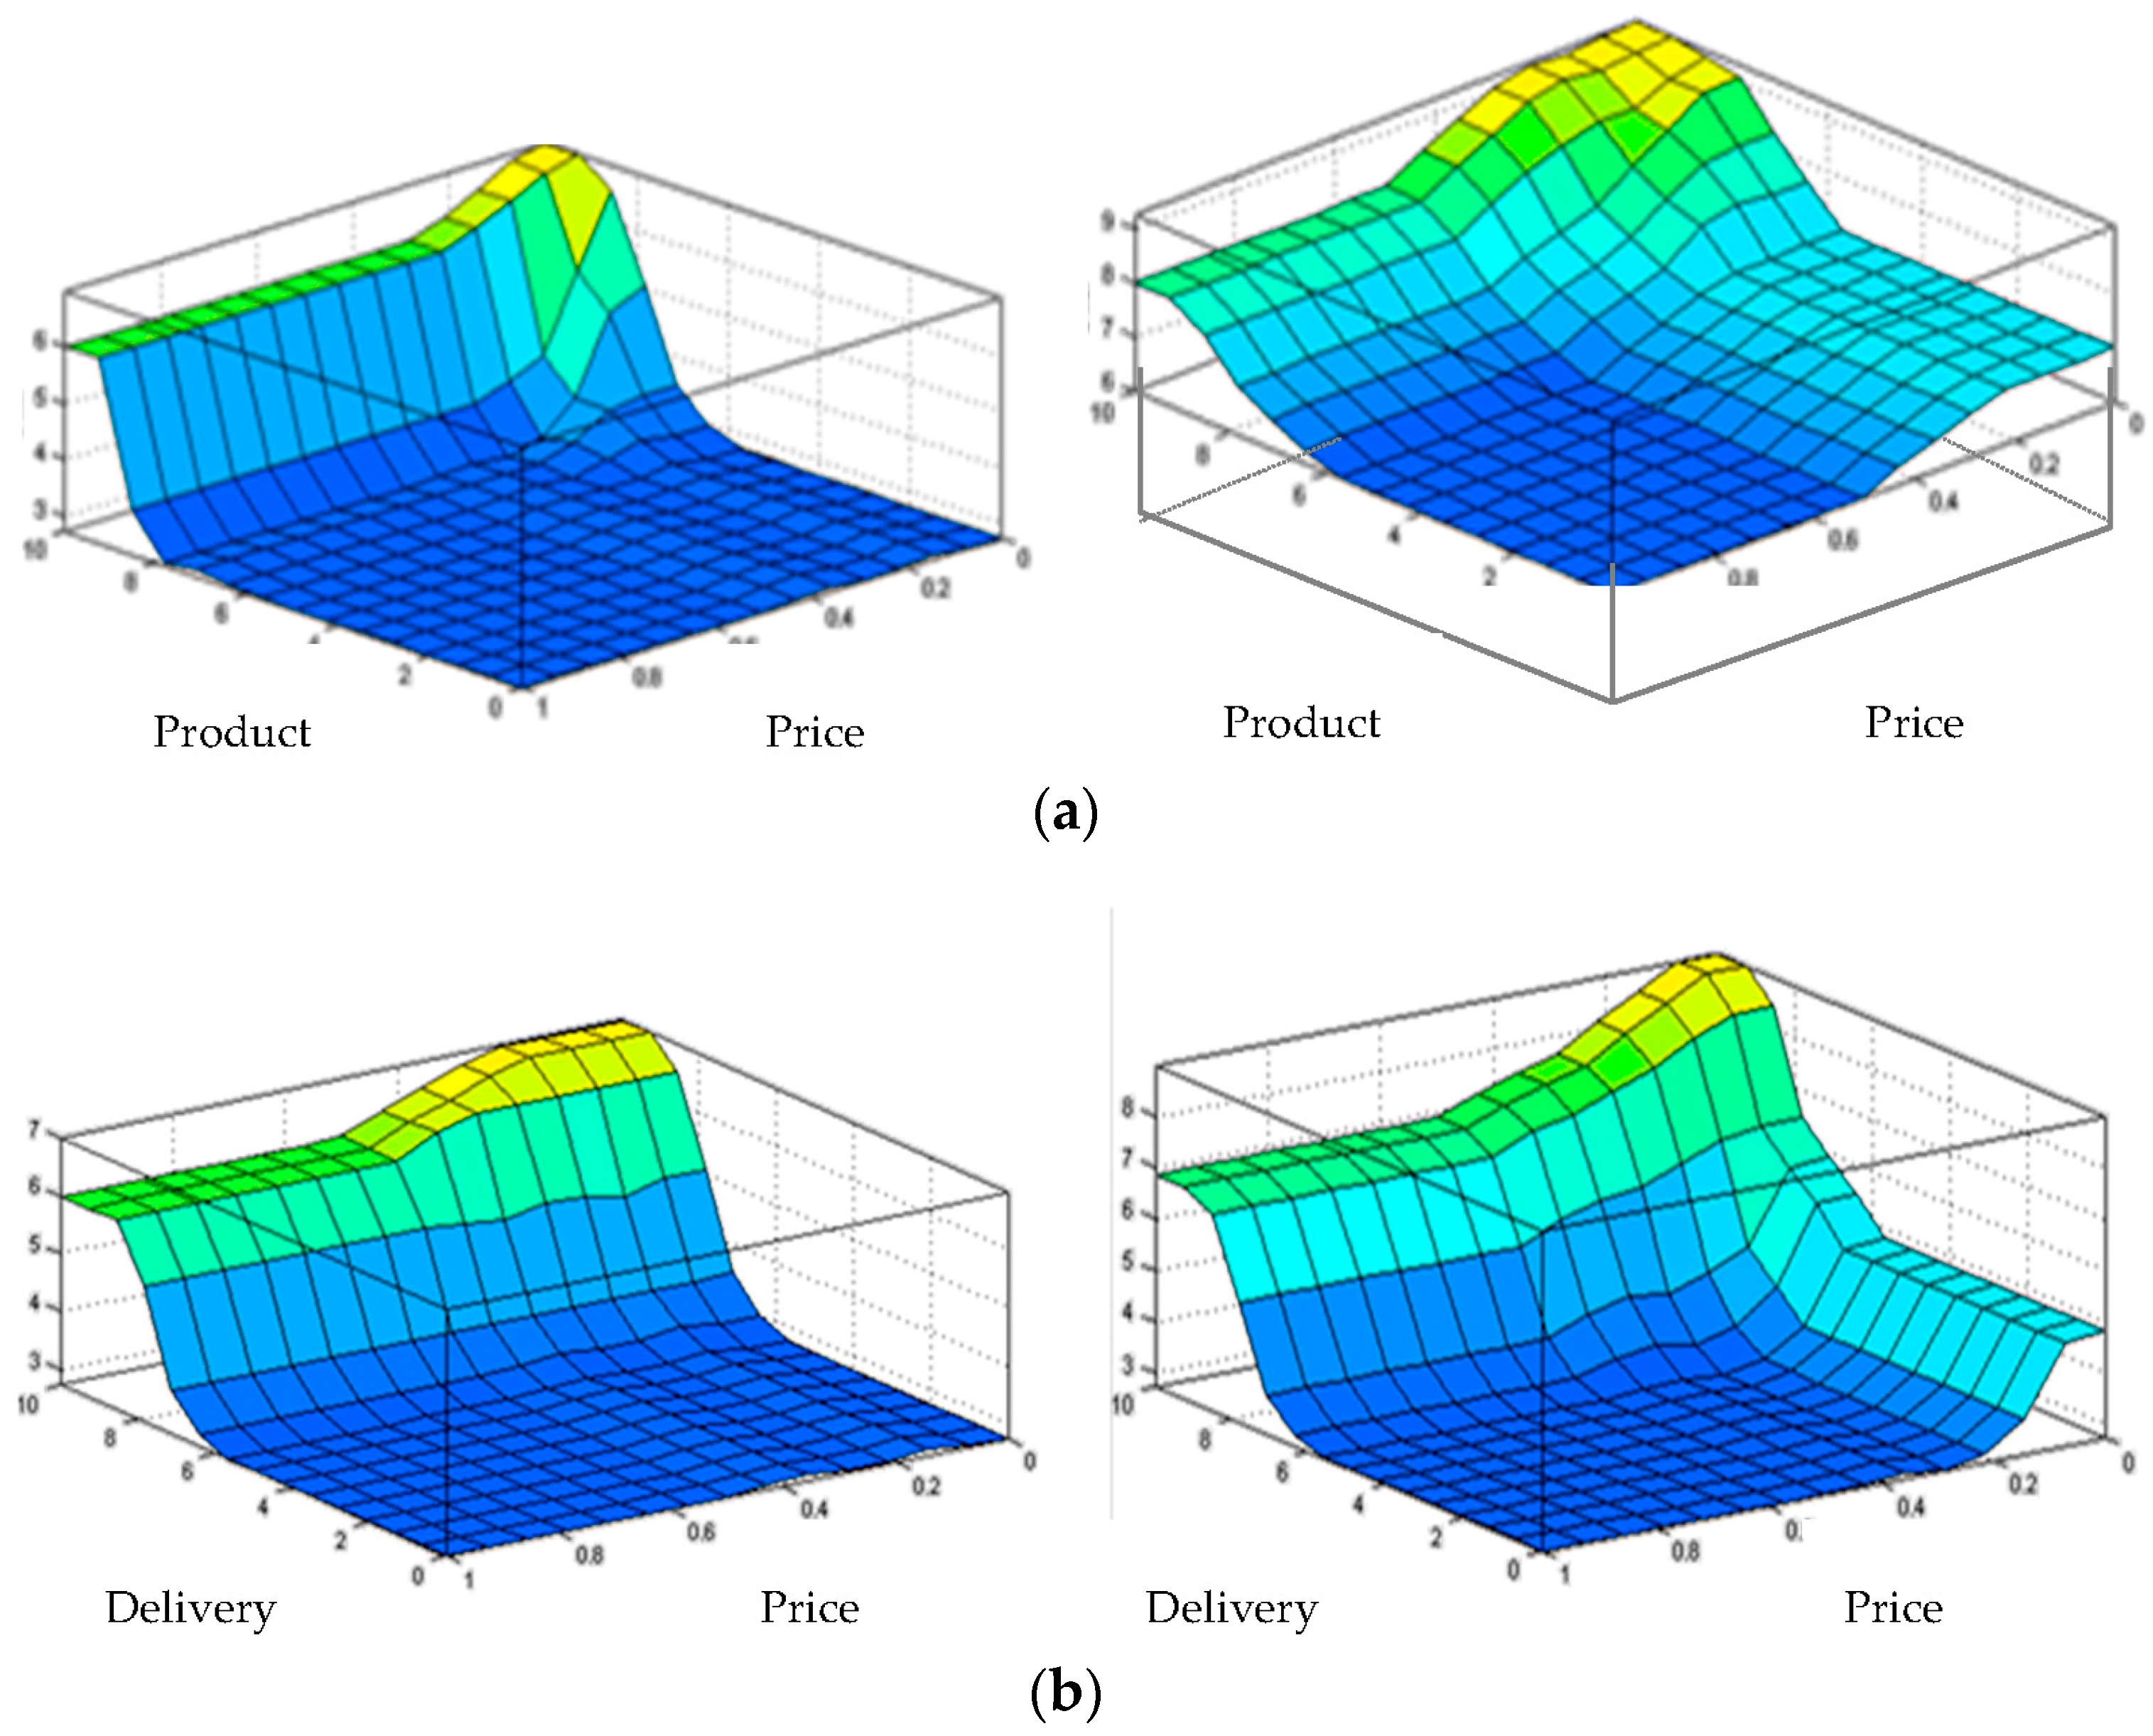
On the other hand, the inference map of each subsystem, facilitates the behavior analysis of the output factor depending on any two input factors. By way of example, the difference between maps in Figure 9a lies in the increase of bid rates when going from low values of Delivery (left) to high values (right). Both graphs also show steep increases of bid rates for high values of Product for all values of Price. Moreover, for high values of [Delivery] (right) bid scores are more sensitive to the increase of [Price] when its value is good -below 0.5-. In Figure 9b, both pictures show that the gradients of the bid significantly increases when [Delivery] exceeds the threshold of acceptability -6-. The gradients are more pronounced when the price is good, for an intermediate level of [Product]—right. All these maps are appropriate to the approaches raised by the expert panel in subsection of Section 3. According to the bid evaluation for strategic products, and denote the evaluation congruence of the bid FIS.
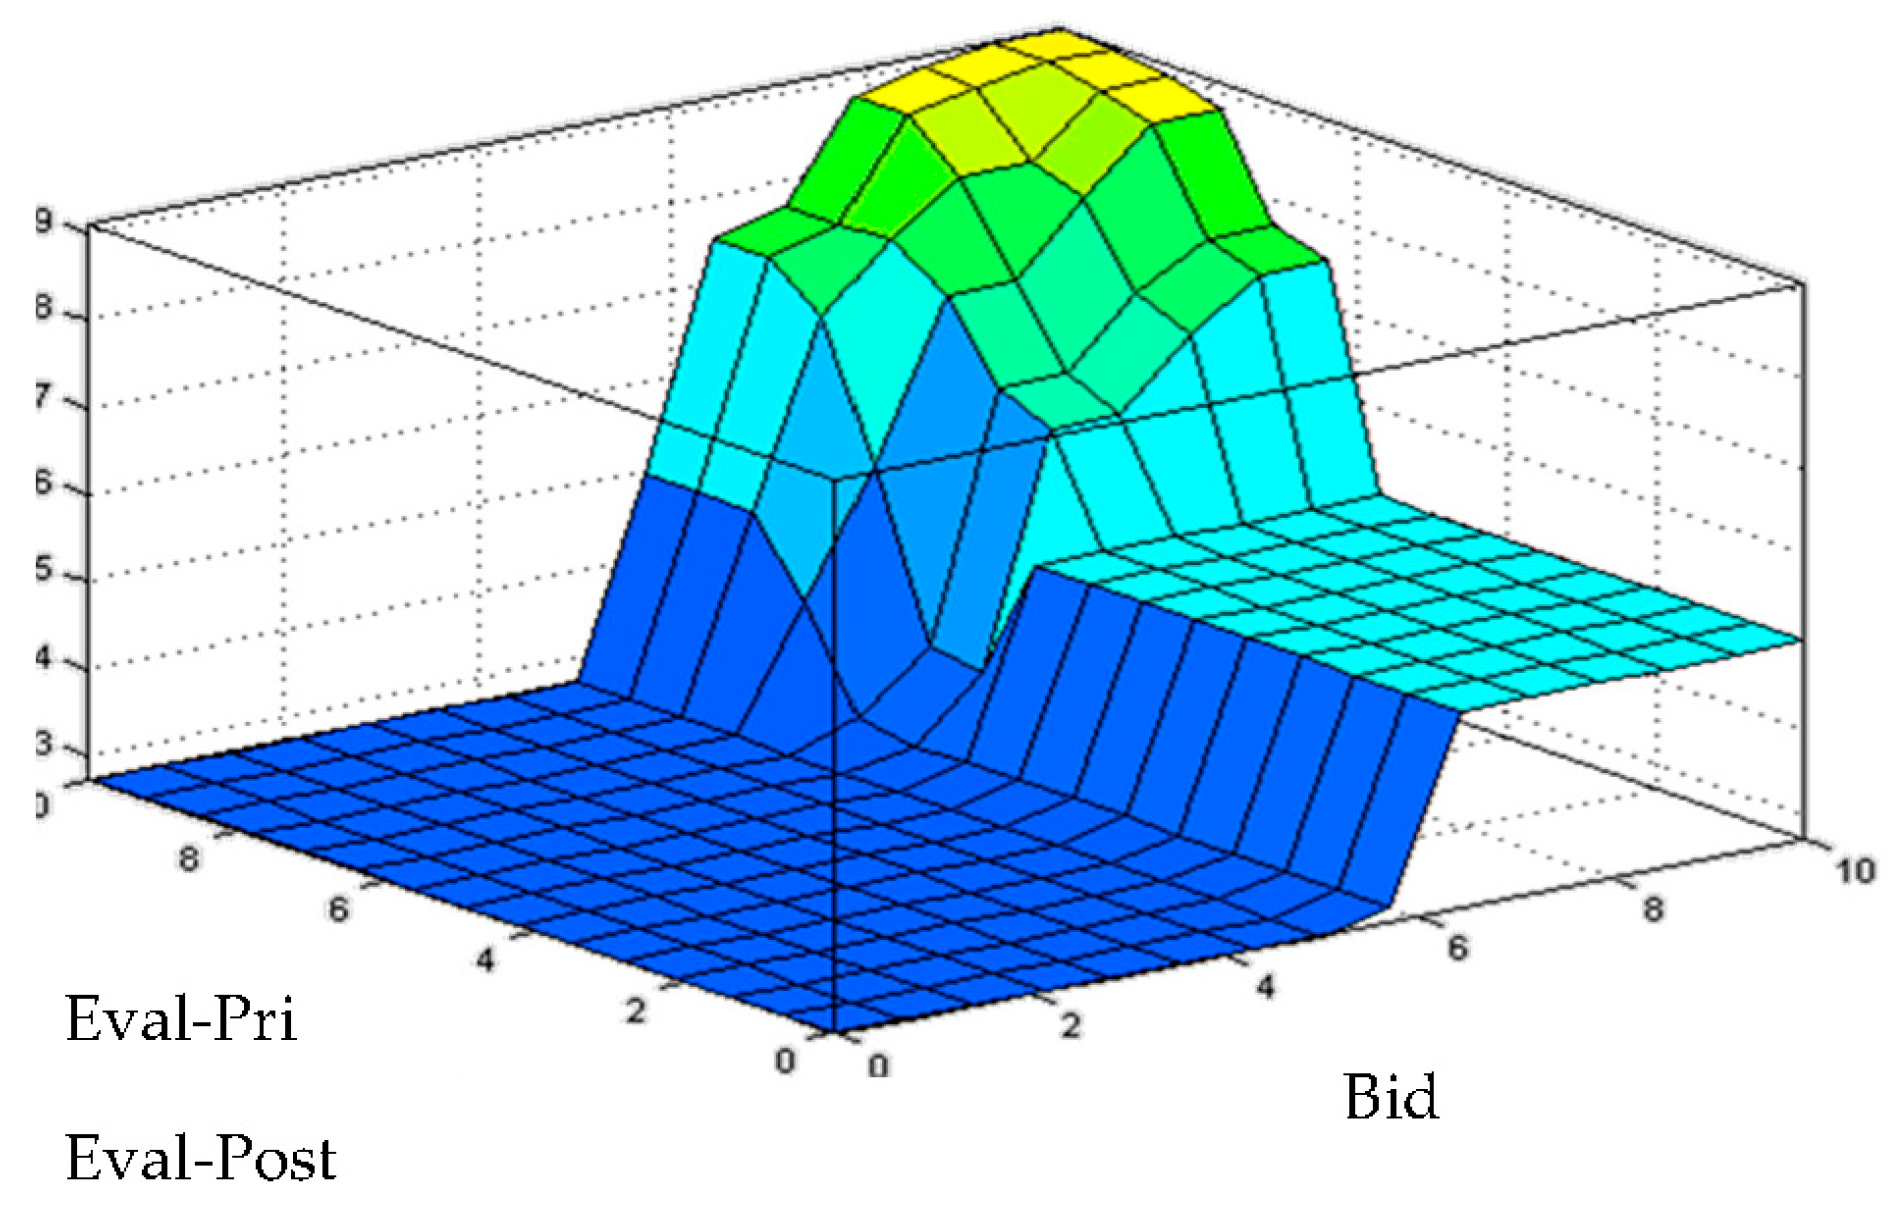
Inference map of Figure 10 shows the supplier final evaluation. Three zones are distinguished: (1) the flat area on the left, concerns inadmissible suppliers (with bid rates below “5”); (2) the flat zone on the right, refers to problematic suppliers (with a good bid rate, but a poor original score, a priori or a posteriori evaluation below “6”); (3) the rest of the map is regarding adequate suppliers (with bid rates above “5”, original scores greater than “6” and final evaluations greatly sensitive to increases in any of the input factors). This inference map also fits the suggested guidelines from the experts, denoting the evaluation congruence of the final evaluation FIS.
4.3. Case Analysis Results and Discussion
Let us suppose ten suppliers (four new and six historical), whose evaluation results are shown in Table 10, where the columns express:
- (1)–(5): Input variable values.
- (4’): Normalized values of “Price” (4) based on the interpolation function shown in Figure 11.
- (6W)/(6F): Bid scores by WM and FIS methods.
- (7): Variation rate (%) between the two methods.
- (8W)/(8F): Final evaluation by the two proposed methods.
The agreed weights in the WM were: Wpro = 0.3 Wpri = 0.1 Wdel = 0.6 for bid scoring subsystem; Wapri = 0.6 WBid = 0.4 for final evaluation subsystem in new suppliers (and Wpost = 0.8 WBid = 0.2 in historical ones).
Comparative results between the two proposed methods show significant divergences in many of the evaluated suppliers (highlighted in col (7) of Table 10). Table 11 illustrates the bid rates of the suppliers and the final chosen method that best adapts to reality according to strategic products purchasing criteria. Some of these supplier analyses are detailed below.
Supp.02: The bid value obtained by WM (7.4) is unjustifiably high, since neither [Delivery = 7.8] nor [Product = 7.5] reach the average level of acceptance “8”, and the price is also unsatisfactory (0.54). However, the bid value obtained by FIS (4.8) is more in line with the reality of the values of the independent variables. For this reason, we cannot have confidence in the final evaluation given to the supplier using WM. Thus, the low final value obtained by the FIS “2.7” is consistent with both a consistent value of [BID] = 4.8 and the low value obtained in [Eval_Pri] = 6.13.
Supp.04: The bid value obtained by WM (7.8) is quite high, which is partly consistent with the proper value of the main variable [Delivery = 9] but not too much with the second determining variable [Product = 7]. The bid value obtained by FIS (6.5) is slightly lower than the previous, which is in line with the proper value of [Delivery] and the no so good of [Product]. With this supplier, we also opted to consider a more reliable valuation obtained by the FIS method. Therefore, and because Eval_Pri has only an acceptable value (7.8), the most reliable final score obtained with this method is lower (5.7). However, this would be the highest-rated new supplier
Supp.05: This supplier bid is similarly assessed by both methods with very high punctuations (8.1 vs. 7.7), but the intermediate value of the a-posterior evaluation (6.6), decreases the final grade of the supplier with both methods (6.9 vs. 6.2). However, the value difference is the lowest among all analyzed vendors.
Supp.07/08/09: There are no substantial differences between bid qualifications by both methods, being always above an acceptable value of “6.5.” However, for these three suppliers, the score of [Eval_post] is insufficient (less than six), influencing the low ratings of the FIS method in the final evaluation “5” (suppliers located on the right plateau of Figure 10).
Table 7 summarizes the above analysis and shows how the FIS method provides a better adaptation to reality (seven out of ten suppliers showed a better fit as is shown in Table 11). In this example, the ideal supplier would be Supp05 followed by Supp04.
In this analysis, we also appreciate the advantages of the FIS versus the WM:
- (i)
- FIS provides less linearity, penalizing suppliers (02) and (06) for their low “Delivery” rates and suppliers (07), (08) and (09) for not exceeding the lower limit value in “Eval_post”.
- (ii)
- With FIS, it is not necessary to standardize the domain range of the factor “Price”.
- (iii)
- The inserted knowledge in the bid subsystem rule-base concords with the features of strategic products given by experts (priority variable: “Delivery”, followed by “Product” and lastly “Price”). Similarly, the agreed inserted knowledge in the final subsystem permits to adequately restrict the global valuation of strategic products suppliers, preventing their acceptance when “Bid” and “Eval_Pri”/”Eval_Post” factors present deficient ratings (see suppliers (03) and (07)/(08)/(09) in Table 10 and Table 11).
Finally, we have tested the two techniques on a broad set of supplier bids in order to generalize the results. The tests were performed combining low, medium and high levels of the three input factors, considering three replicas in each combination (27 × 3 = 81 cases). In more than 75% of the inferences, the FIS improved the WM due to its more restrictive character in the acceptance of suppliers of strategic products
5. Conclusions
A model for bid evaluation and supplier selection is presented. The factors included in the model were the most commonly cited in the SSE literature. The model is focused on the purchase of strategic products and allows the purchasing process to be systematized regardless of the subjective opinion of the purchasing process’ lead.
The model performance has been appraised by two methods: a weighted-point method and a fuzzy inference system. While the weighting method stands out for being an easy-to-implement qualification system, it also entails some inconveniences, such as linear evaluations, necessary normalization of the variable ranges in each subsystem, being a less intuitive system for a comprehensive interpretation of the evaluation results or the difficulty of managing the uncertainty inherent to some qualitative model variables.
The proposed FIS allow us to incorporate the non-linear nature of SSE models and making them more reliable to represent real evaluations. It is also sensitive to certain nuances, which can be incorporated in some model factors; for instance, low values for the factor “delivery” should detract from the bid assessment since it is the determinant factor in the strategic product evaluation. On the other hand, the linguistic character of the FIS allows directly to assess certain variables in its natural range, without the need to previously normalize them (as in the case of the “Price” variable).
In addition, we have shown how a simple symbolic representation method based on two-tuples allows to set the appropriate consensus on the cores of the labels to be assigned to the variables of the SSE model. Once the cores are agreed on each factor and by applying the characteristics of central symmetry, borders of each two consecutive labels can be determined, building a fuzzy strong partition for that factor. The use of the mentioned two-tuples method also makes it easier to agree on the labels to assign to each evaluation rule. In this way, the proposed approach allows to consistently design the knowledge base of the supplier evaluation model.
Finally, note that the inference maps provided by the tool make it easier to understand the knowledge behind the decision. The results prove the superiority of the FIS method (against the WM) in terms of better adaptation to the reality in supplier evaluation systems for strategic products purchases.
Author Contributions
The individual contribution and responsibilities of the authors were as follows: Nazario García and Javier Puente jointly designed the idea of the research, planned its development, analyzed the results and extracted the conclusions of the study. Isabel Fernández was in charge of the literature review and the coordination of the meetings with experts, in order to process the information gathered. She has also contributed to the drafting of the abstract and introduction. Paolo Priore has contributed to the paper by proposing the two-tuples method to reach a consensus on the knowledge base of all subsystems of the model. The discussion of the results was a task shared by the entire group. Finally, all authors have read and approved the final manuscript.
Conflicts of Interest
The authors declare no conflict of interest.
References
- Ghorabaee, M.K.; Amiri, M.; Zavadskas, E.K.; Antucheviciene, J. Supplier evaluation and selection in fuzzy environments: A review of MADM approaches. Econ. Res.-Ekon. Istraž. 2017, 30, 1073–1118. [Google Scholar] [CrossRef]
- Petriçli, G.; Emel, G.G. Determining Strategy Based Supplier Pre-Qualification Criteria with Fuzzy Relational Maps. Alphanumeric J. 2016, 4, 11–40. [Google Scholar] [CrossRef]
- Wisner, J.D.; Leong, G.; Tan, K.-C. Principles of Supply Chain Management: A Balanced Approach, 4th ed.; South-Western: Boston, MA, USA, 2015; ISBN 978-1-285-42831-4. [Google Scholar]
- Cao, Y.; Luo, X.; Kwong, C.K.; Tang, J. Supplier pre-selection for platform-based products: A multi-objective approach. Int. J. Prod. Res. 2014, 52, 1–19. [Google Scholar] [CrossRef]
- Jain, V.; Wadhwa, S.; Deshmukh, S.G. Supplier selection using fuzzy association rules mining approach. Int. J. Prod. Res. 2007, 45, 1323–1353. [Google Scholar] [CrossRef]
- Pal, O.; Gupta, A.K.; Garg, R.K. Supplier selection criteria and methods in supply chains: A review. Int. J. Soc. Manag. Econ. Bus. Eng. 2013, 7, 1403–1409. [Google Scholar]
- Simić, D.; Kovačević, I.; Svirčević, V.; Simić, S. 50 years of fuzzy set theory and models for supplier assessment and selection: A literature review. J. Appl. Log. 2017, 24, 85–96. [Google Scholar] [CrossRef]
- Yu, C.; Wong, T.N. A supplier pre-selection model for multiple products with synergy effect. Int. J. Prod. Res. 2014, 52, 5206–5222. [Google Scholar] [CrossRef]
- Aghai, S.; Mollaverdi, N.; Sabbagh, M.S. A fuzzy multi-objective programming model for supplier selection with volume discount and risk criteria. Int. J. Adv. Manuf. Technol. 2014, 71, 1483–1492. [Google Scholar] [CrossRef]
- You, X.-Y.; You, J.-X.; Liu, H.-C.; Zhen, L. Group Multi-criteria Supplier Selection Using an Extended VIKOR Method with Interval 2-tuple Linguistic Information. Expert Syst. Appl. 2015, 42, 1906–1916. [Google Scholar] [CrossRef]
- Liu, J.; Liu, P.; Liu, S.-F.; Zhou, X.-Z.; Zhang, T. A study of decision process in MCDM problems with large number of criteria. Int. Trans. Oper. Res. 2015, 22, 237–264. [Google Scholar] [CrossRef]
- Zhao, J.; You, X.-Y.; Liu, H.-C.; Wu, S.-M. An Extended VIKOR Method Using Intuitionistic Fuzzy Sets and Combination Weights for Supplier Selection. Symmetry 2017, 9, 169. [Google Scholar] [CrossRef]
- Qin, J.; Liu, X. 2-tuple linguistic Muirhead mean operators for multiple attribute group decision making and its application to supplier selection. Kybernetes 2015, 45, 2–29. [Google Scholar] [CrossRef]
- Zhang, Z.; Chen, J.; Hu, Y.; Yang, J.; Ye, Y.; Chen, J. A Dynamic Fuzzy Group Decision Making Method for Supplier Selection. J. Appl. Sci. 2013, 13, 2788–2794. [Google Scholar] [CrossRef]
- Wetzstein, A.; Hartmann, E.; Benton, W.C., Jr.; Hohenstein, N.-O. A systematic assessment of supplier selection literature—State-of-the-art and future scope. Int. J. Prod. Econ. 2016, 182, 304–323. [Google Scholar] [CrossRef]
- Bai, C.; Sarkis, J. Integrating sustainability into supplier selection with grey system and rough set methodologies. Int. J. Prod. Econ. 2010, 124, 252–264. [Google Scholar] [CrossRef]
- Meixell, M.J.; Gargeya, V.B. Global supply chain design: A literature review and critique. Transp. Res. Part E Logist. Transp. Rev. 2005, 41, 531–550. [Google Scholar] [CrossRef]
- Ojala, M.; Hallikas, J. Investment decision-making in supplier networks: Management of risk. Int. J. Prod. Econ. 2006, 104, 201–213. [Google Scholar] [CrossRef]
- Wu, D.D.; Olson, D. Enterprise risk management: A DEA VaR approach in vendor selection. Int. J. Prod. Res. 2010, 48, 4919–4932. [Google Scholar] [CrossRef]
- Wu, L.-C. Supplier selection under uncertainty: A switching options perspective. Ind. Manag. Data Syst. 2009, 109, 191–205. [Google Scholar] [CrossRef]
- Xia, W.; Wu, Z. Supplier selection with multiple criteria in volume discount environments. Omega 2007, 35, 494–504. [Google Scholar] [CrossRef]
- Kuo, R.J.; Lee, L.Y.; Hu, T.-L. Developing a supplier selection system through integrating fuzzy AHP and fuzzy DEA: A case study on an auto lighting system company in Taiwan. Prod. Plan. Control 2010, 21, 468–484. [Google Scholar] [CrossRef]
- Herbon, A.; Moalem, S.; Shnaiderman, H.; Templeman, J. Dynamic weights approach for off-line sequencing of supplier selection over a finite planning horizon. Int. J. Phys. Distrib. Logist. Manag. 2012, 42, 434–463. [Google Scholar] [CrossRef]
- Braglia, M.; Petroni, A. A quality assurance-oriented methodology for handling trade-offs in supplier selection. Int. J. Phys. Distrib. Logist. Manag. 2000, 30, 96–112. [Google Scholar] [CrossRef]
- Chan, F.T.S. Interactive selection model for supplier selection process: An analytical hierarchy process approach. Int. J. Prod. Res. 2003, 41, 3549–3579. [Google Scholar] [CrossRef]
- Chen, I.J.; Paulraj, A. Understanding supply chain management: Critical research and a theoretical framework. Int. J. Prod. Res. 2004, 42, 131–163. [Google Scholar] [CrossRef]
- Lee, E.-K.; Ha, S.; Kim, S.-K. Supplier selection and management system considering relationships in supply chain management. IEEE Trans. Eng. Manag. 2001, 48, 307–318. [Google Scholar] [CrossRef]
- Kasirian, M.N.; Yusuff, R.M. An integration of a hybrid modified TOPSIS with a PGP model for the supplier selection with interdependent criteria. Int. J. Prod. Res. 2013, 51, 1037–1054. [Google Scholar] [CrossRef]
- Rezaei, J.; Ortt, R. A multi-variable approach to supplier segmentation. Int. J. Prod. Res. 2012, 50, 4593–4611. [Google Scholar] [CrossRef]
- Karsak, E.E.; Dursun, M. An integrated fuzzy MCDM approach for supplier evaluation and selection. Comput. Ind. Eng. 2015, 82, 82–93. [Google Scholar] [CrossRef]
- Igoulalene, I.; Benyoucef, L.; Tiwari, M.K. Novel fuzzy hybrid multi-criteria group decision making approaches for the strategic supplier selection problem. Expert Syst. Appl. 2015, 42, 3342–3356. [Google Scholar] [CrossRef]
- Dickson, G.W. An analysis of vendor selection: Systems and decisions. J. Purch. 1966, 2, 5–17. [Google Scholar] [CrossRef]
- Kaufmann, L.; Carter, C.R.; Buhrmann, C. Debiasing the supplier selection decision: A taxonomy and conceptualization. Int. J. Phys. Distrib. Logist. Manag. 2010, 40, 792–821. [Google Scholar] [CrossRef]
- Luthra, S.; Govindan, K.; Kannan, D.; Mangla, S.K.; Garg, C.P. An integrated framework for sustainable supplier selection and evaluation in supply chains. J. Clean. Prod. 2017, 140, 1686–1698. [Google Scholar] [CrossRef]
- Rajesh, R.; Ravi, V. Supplier selection in resilient supply chains: A grey relational analysis approach. J. Clean. Prod. 2015, 86, 343–359. [Google Scholar] [CrossRef]
- Liao, C.-N.; Fu, Y.-K.; Wu, L.-C. Integrated FAHP, ARAS-F and MSGP methods for green supplier evaluation and selection. Technol. Econ. Dev. Econ. 2016, 22, 651–669. [Google Scholar] [CrossRef]
- Yazdani, M.; Chatterjee, P.; Zavadskas, E.K.; Zolfani, S.H. Integrated QFD-MCDM framework for green supplier selection. J. Clean. Prod. 2017, 142, 3728–3740. [Google Scholar] [CrossRef]
- Liou, J.J.H.; Tamošaitienė, J.; Zavadskas, E.K.; Tzeng, G.-H. New hybrid COPRAS-G MADM Model for improving and selecting suppliers in green supply chain management. Int. J. Prod. Res. 2016, 54, 114–134. [Google Scholar] [CrossRef]
- Azadi, M.; Jafarian, M.; Saen, R.F.; Mirhedayatian, S.M. A new fuzzy DEA model for evaluation of efficiency and effectiveness of suppliers in sustainable supply chain management context. Comput. Oper. Res. 2015, 54, 274–285. [Google Scholar] [CrossRef]
- Yang, J.-B.; Wang, H.-H.; Wang, W.-C.; Ma, S.-M. Using data envelopment analysis to support best-value contractor selection. J. Civ. Eng. Manag. 2016, 22, 199–209. [Google Scholar] [CrossRef]
- Puri, J.; Yadav, S.P.; Garg, H. A new multi-component DEA approach using common set of weights methodology and imprecise data: An application to public sector banks in India with undesirable and shared resources. Ann. Oper. Res. 2017, 259, 351–388. [Google Scholar] [CrossRef]
- Sangaiah, A.K.; Gopal, J.; Basu, A.; Subramaniam, P.R. An integrated fuzzy DEMATEL, TOPSIS, and ELECTRE approach for evaluating knowledge transfer effectiveness with reference to GSD project outcome. Neural Comput. Appl. 2017, 28, 111–123. [Google Scholar] [CrossRef]
- Ertay, T.; Kahveci, A.; Tabanli, R.M. An integrated multi-criteria group decision-making approach to efficient supplier selection and clustering using fuzzy preference relations. Int. J. Comput. Integr. Manuf. 2011, 24, 1152–1167. [Google Scholar] [CrossRef]
- Hashemian, S.M.; Behzadian, M.; Samizadeh, R.; Ignatius, J. A fuzzy hybrid group decision support system approach for the supplier evaluation process. Int. J. Adv. Manuf. Technol. 2014, 73, 1105–1117. [Google Scholar] [CrossRef]
- Polat, G.; Eray, E.; Bingol, B.N. An integrated fuzzy MCGDM approach for supplier selection problem. J. Civ. Eng. Manag. 2017, 23, 926–942. [Google Scholar] [CrossRef]
- Yang, W.; Chen, Z.; Zhang, F. New group decision making method in intuitionistic fuzzy setting based on TOPSIS. Technol. Econ. Dev. Econ. 2017, 23, 441–461. [Google Scholar] [CrossRef]
- Li, D.F. TOPSIS-Based Nonlinear-Programming Methodology for Multiattribute Decision Making with Interval-Valued Intuitionistic Fuzzy Sets. IEEE Trans. Fuzzy Syst. 2010, 18, 299–311. [Google Scholar] [CrossRef]
- Kumar, K.; Garg, H. TOPSIS method based on the connection number of set pair analysis under interval-valued intuitionistic fuzzy set environment. Comput. Appl. Math. 2016, 1–11. [Google Scholar] [CrossRef]
- Kumar, K.; Garg, H. Connection number of set pair analysis based TOPSIS method on intuitionistic fuzzy sets and their application to decision making. Appl. Intell. 2017, 1–8. [Google Scholar] [CrossRef]
- Shemshadi, A.; Shirazi, H.; Toreihi, M.; Tarokh, M.J. A fuzzy VIKOR method for supplier selection based on entropy measure for objective weighting. Expert Syst. Appl. 2011, 38, 12160–12167. [Google Scholar] [CrossRef]
- Kahraman, C.; Onar, S.C.; Oztaysi, B. Fuzzy Multicriteria Decision-Making: A Literature Review. Int. J. Comput. Intell. Syst. 2015, 8, 637–666. [Google Scholar] [CrossRef]
- Dalalah, D.; Hayajneh, M.; Batieha, F. A fuzzy multi-criteria decision making model for supplier selection. Expert Syst. Appl. 2011, 38, 8384–8391. [Google Scholar] [CrossRef]
- Liou, J.J.H.; Chuang, Y.-C.; Tzeng, G.-H. A fuzzy integral-based model for supplier evaluation and improvement. Inf. Sci. 2014, 266, 199–217. [Google Scholar] [CrossRef]
- Balezentis, A.; Balezentis, T. A Novel Method for Group Multi-Attribute Decision Making with Two-Tuple Linguistic Computing: Supplier Evaluation under Uncertainty. Econ. Comput. Econ. Cybern. Stud. Res. 2011, 45, 5–29. [Google Scholar]
- Zhao, K.; Yu, X. A case based reasoning approach on supplier selection in petroleum enterprises. Expert Syst. Appl. 2011, 38, 6839–6847. [Google Scholar] [CrossRef]
- Ghadimi, P.; Heavey, C. Sustainable Supplier Selection in Medical Device Industry: Toward Sustainable Manufacturing. Procedia CIRP 2014, 15, 165–170. [Google Scholar] [CrossRef]
- Amindoust, A.; Ahmed, S.; Saghafinia, A.; Bahreininejad, A. Sustainable supplier selection: A ranking model based on fuzzy inference system. Appl. Soft Comput. 2012, 12, 1668–1677. [Google Scholar] [CrossRef]
- Zhang, H.; Deng, Y.; Chan, F.T.S.; Zhang, X. A modified multi-criterion optimization genetic algorithm for order distribution in collaborative supply chain. Appl. Math. Model. 2013, 37, 7855–7864. [Google Scholar] [CrossRef]
- Tavana, M.; Shabanpour, H.; Yousefi, S.; Saen, R.F. A hybrid goal programming and dynamic data envelopment analysis framework for sustainable supplier evaluation. Neural Comput. Appl. 2017, 28, 3683–3696. [Google Scholar] [CrossRef]
- Schramm, F.; Morais, D.C. Decision support model for selecting and evaluating suppliers in the construction industry. Pesqui. Oper. 2012, 32, 643–662. [Google Scholar] [CrossRef]
- Büyüközkan, G.; Göçer, F. Application of a new combined intuitionistic fuzzy MCDM approach based on axiomatic design methodology for the supplier selection problem. Appl. Soft Comput. 2017, 52, 1222–1238. [Google Scholar] [CrossRef]
- Garg, H.; Kumar, K. Some Aggregation Operators for Linguistic Intuitionistic Fuzzy Set and Its Application to Group Decision-Making Process Using the Set Pair Analysis. Arab. J. Sci. Eng. 2017, 1–15. [Google Scholar] [CrossRef]
- Aissaoui, N.; Haouari, M.; Hassini, E. Supplier selection and order lot sizing modeling: A review. Comput. Oper. Res. 2007, 34, 3516–3540. [Google Scholar] [CrossRef]
- De Boer, L.; Labro, E.; Morlacchi, P. A review of methods supporting supplier selection. Eur. J. Purch. Supply Manag. 2001, 7, 75–89. [Google Scholar] [CrossRef]
- Degraeve, Z.; Labro, E.; Roodhooft, F. An evaluation of vendor selection models from a total cost of ownership perspective. Eur. J. Oper. Res. 2000, 125, 34–58. [Google Scholar] [CrossRef]
- Ho, W.; Xu, X.; Dey, P.K. Multi-criteria decision making approaches for supplier evaluation and selection: A literature review. Eur. J. Oper. Res. 2010, 202, 16–24. [Google Scholar] [CrossRef]
- Weber, C.A.; Current, J.R.; Benton, W.C. Vendor selection criteria and methods. Eur. J. Oper. Res. 1991, 50, 2–18. [Google Scholar] [CrossRef]
- Genovese, A.; Koh, S.C.L.; Bruno, G.; Esposito, E. Greener supplier selection: State of the art and some empirical evidence. Int. J. Prod. Res. 2013, 51, 2868–2886. [Google Scholar] [CrossRef]
- Govindan, K.; Rajendran, S.; Sarkis, J.; Murugesan, P. Multi criteria decision making approaches for green supplier evaluation and selection: A literature review. J. Clean. Prod. 2015, 98, 66–83. [Google Scholar] [CrossRef]
- Lee, T.R.; Phuong Nha Le, T.; Genovese, A.; Koh, L.S.C. Using FAHP to determine the criteria for partner’s selection within a green supply chain: The case of hand tool industry in Taiwan. J. Manuf. Technol. Manag. 2011, 23, 25–55. [Google Scholar] [CrossRef]
- Zimmer, K.; Fröhling, M.; Schultmann, F. Sustainable supplier management—A review of models supporting sustainable supplier selection, monitoring and development. Int. J. Prod. Res. 2016, 54, 1412–1442. [Google Scholar] [CrossRef]
- Balzer, W.K.; Sulsky, L.M. Halo and performance appraisal research: A critical examination. J. Appl. Psychol. 1992, 77, 975–985. [Google Scholar] [CrossRef]
- Nakayama, M.; Sutcliffe, N.G. Exploratory analysis on the halo effect of strategic goals on IOS effectiveness evaluation. Inf. Manag. 2005, 42, 275–288. [Google Scholar] [CrossRef]
- Gelderman, C.J.; Van Weele, A.J. Handling measurement issues and strategic directions in Kraljic’s purchasing portfolio model. J. Purch. Supply Manag. 2003, 9, 207–216. [Google Scholar] [CrossRef]
- Hudnurkar, M.; Rathod, U.; Jakhar, S.K. Multi-criteria decision framework for supplier classification in collaborative supply chains: Buyer’s perspective. Int. J. Product. Perform. Manag. 2016, 65, 622–640. [Google Scholar] [CrossRef]
- Kraljic, P. Purchasing must become supply management. Harv. Bus. Rev. 1983, 61, 109–117. [Google Scholar]
- García, N.; Puente, J.; Fernandez, I.; Gomez, A. How to improve the suppliers evaluation process using fuzzy inference systems. DYNA 2014, 89, 449–456. [Google Scholar]
- García, N.; Puente, J.; Fernández, I.; Priore, P. Supplier selection model for commodities procurement. Optimised assessment using a fuzzy decision support system. Appl. Soft Comput. 2013, 13, 1939–1951. [Google Scholar] [CrossRef]
- Timmerman, E. An Approach to Vendor Performance Evaluation. J. Purch. Mater. Manag. 1986, 22, 2–8. [Google Scholar] [CrossRef]
- Chen, C.-T.; Lin, C.-T.; Huang, S.-F. A fuzzy approach for supplier evaluation and selection in supply chain management. Int. J. Prod. Econ. 2006, 102, 289–301. [Google Scholar] [CrossRef]
- Amid, A.; Ghodsypour, S.H.; O’Brien, C. Fuzzy multiobjective linear model for supplier selection in a supply chain. Int. J. Prod. Econ. 2006, 104, 394–407. [Google Scholar] [CrossRef]
- Zadeh, L.A. Fuzzy sets. Inf. Control 1965, 8, 338–353. [Google Scholar] [CrossRef]
- Chen, C.; Klein, C.M. An efficient approach to solving fuzzy MADM problems. Fuzzy Sets Syst. 1997, 88, 51–67. [Google Scholar] [CrossRef]
- Gaines, B.R.; Mamdani, E.H. Fuzzy Reasoning and Its Applications; Academic Press: London, UK; New York, NY, USA, 1981; ISBN 978-0-12-467750-0. [Google Scholar]
- Delgado, M.; Verdegay, J.L.; Vila, M.A. Linguistic decision-making models. Int. J. Intell. Syst. 1992, 7, 479–492. [Google Scholar] [CrossRef]
- Ruspini, E.H. A new approach to clustering. Inf. Control 1969, 15, 22–32. [Google Scholar] [CrossRef]
- Mencar, C.; Fanelli, A.M. Interpretability constraints for fuzzy information granulation. Inf. Sci. 2008, 178, 4585–4618. [Google Scholar] [CrossRef]
- Herrera, F.; Martinez, L. A 2-tuple fuzzy linguistic representation model for computing with words. IEEE Trans. Fuzzy Syst. 2000, 8, 746–752. [Google Scholar] [CrossRef]
- Arena, P.; Fazzino, S.; Fortuna, L.; Maniscalco, P. Game theory and non-linear dynamics: The Parrondo Paradox case study. Chaos Solitons Fractals 2003, 17, 545–555. [Google Scholar] [CrossRef]
Figure 1.
Steps in the purchasing process.
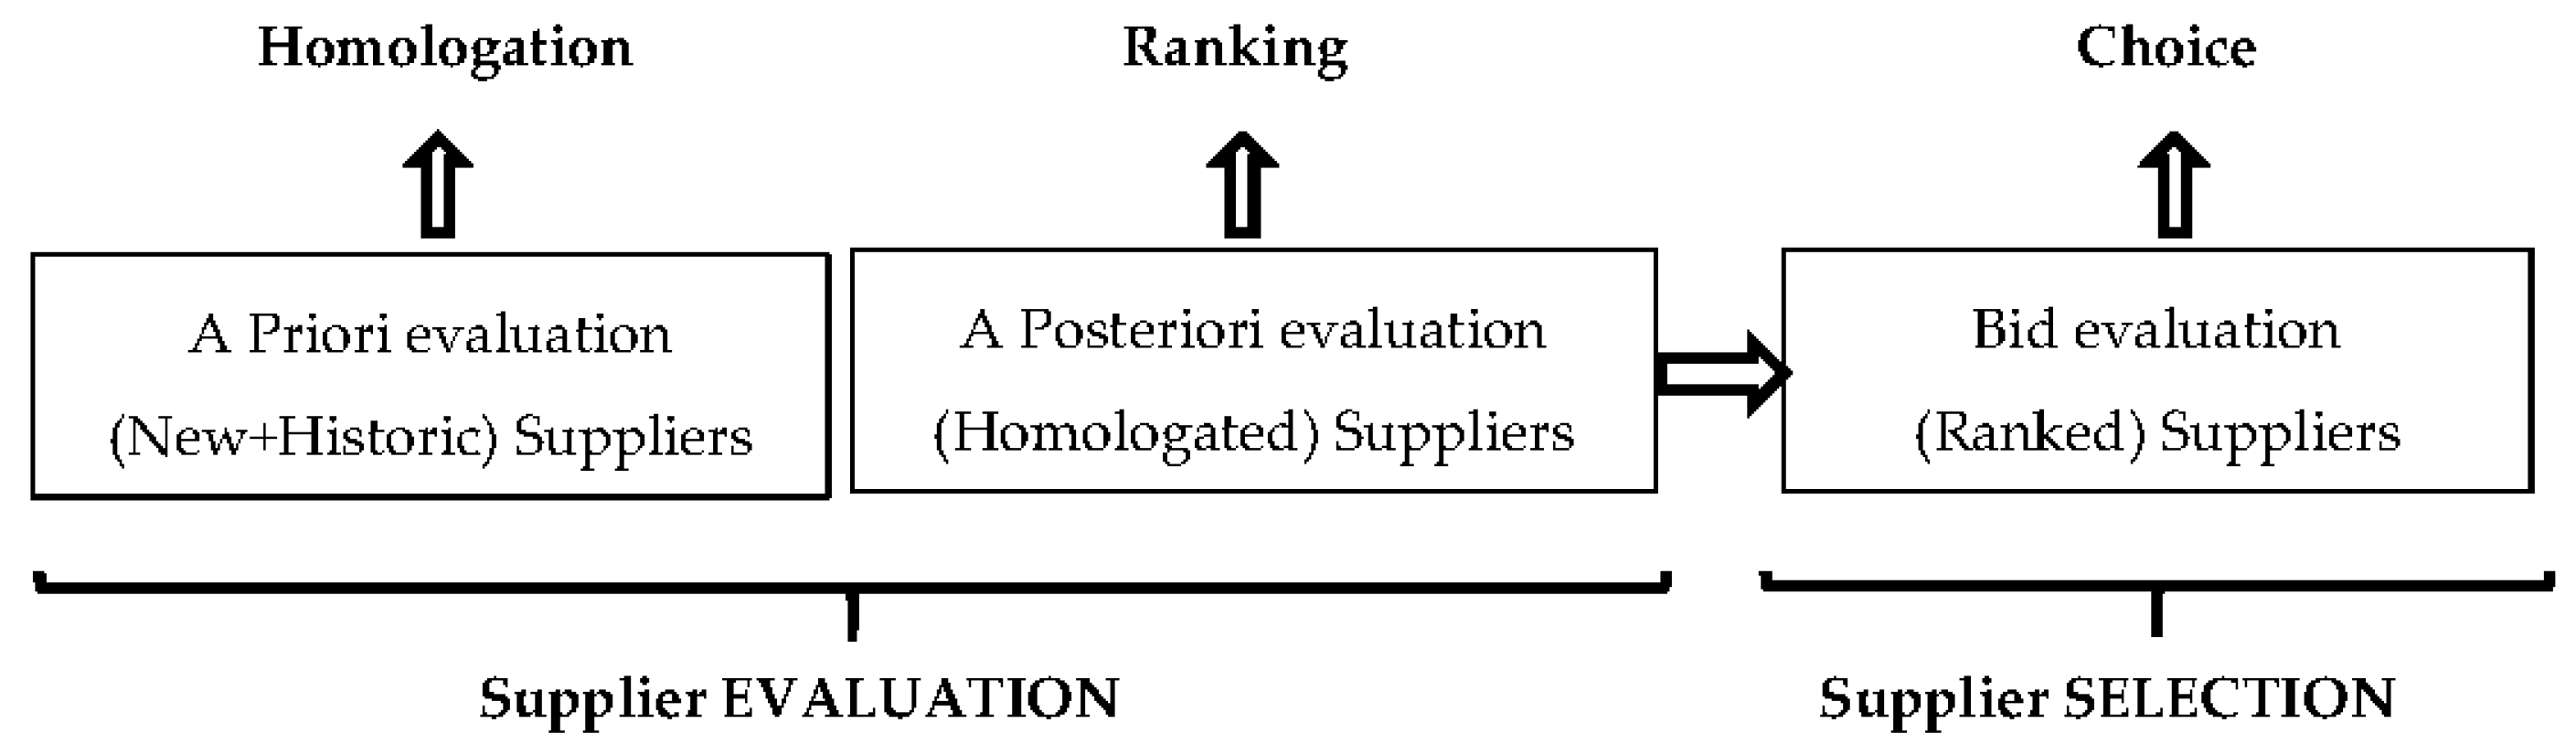
Figure 2.
The proposed SSE model.
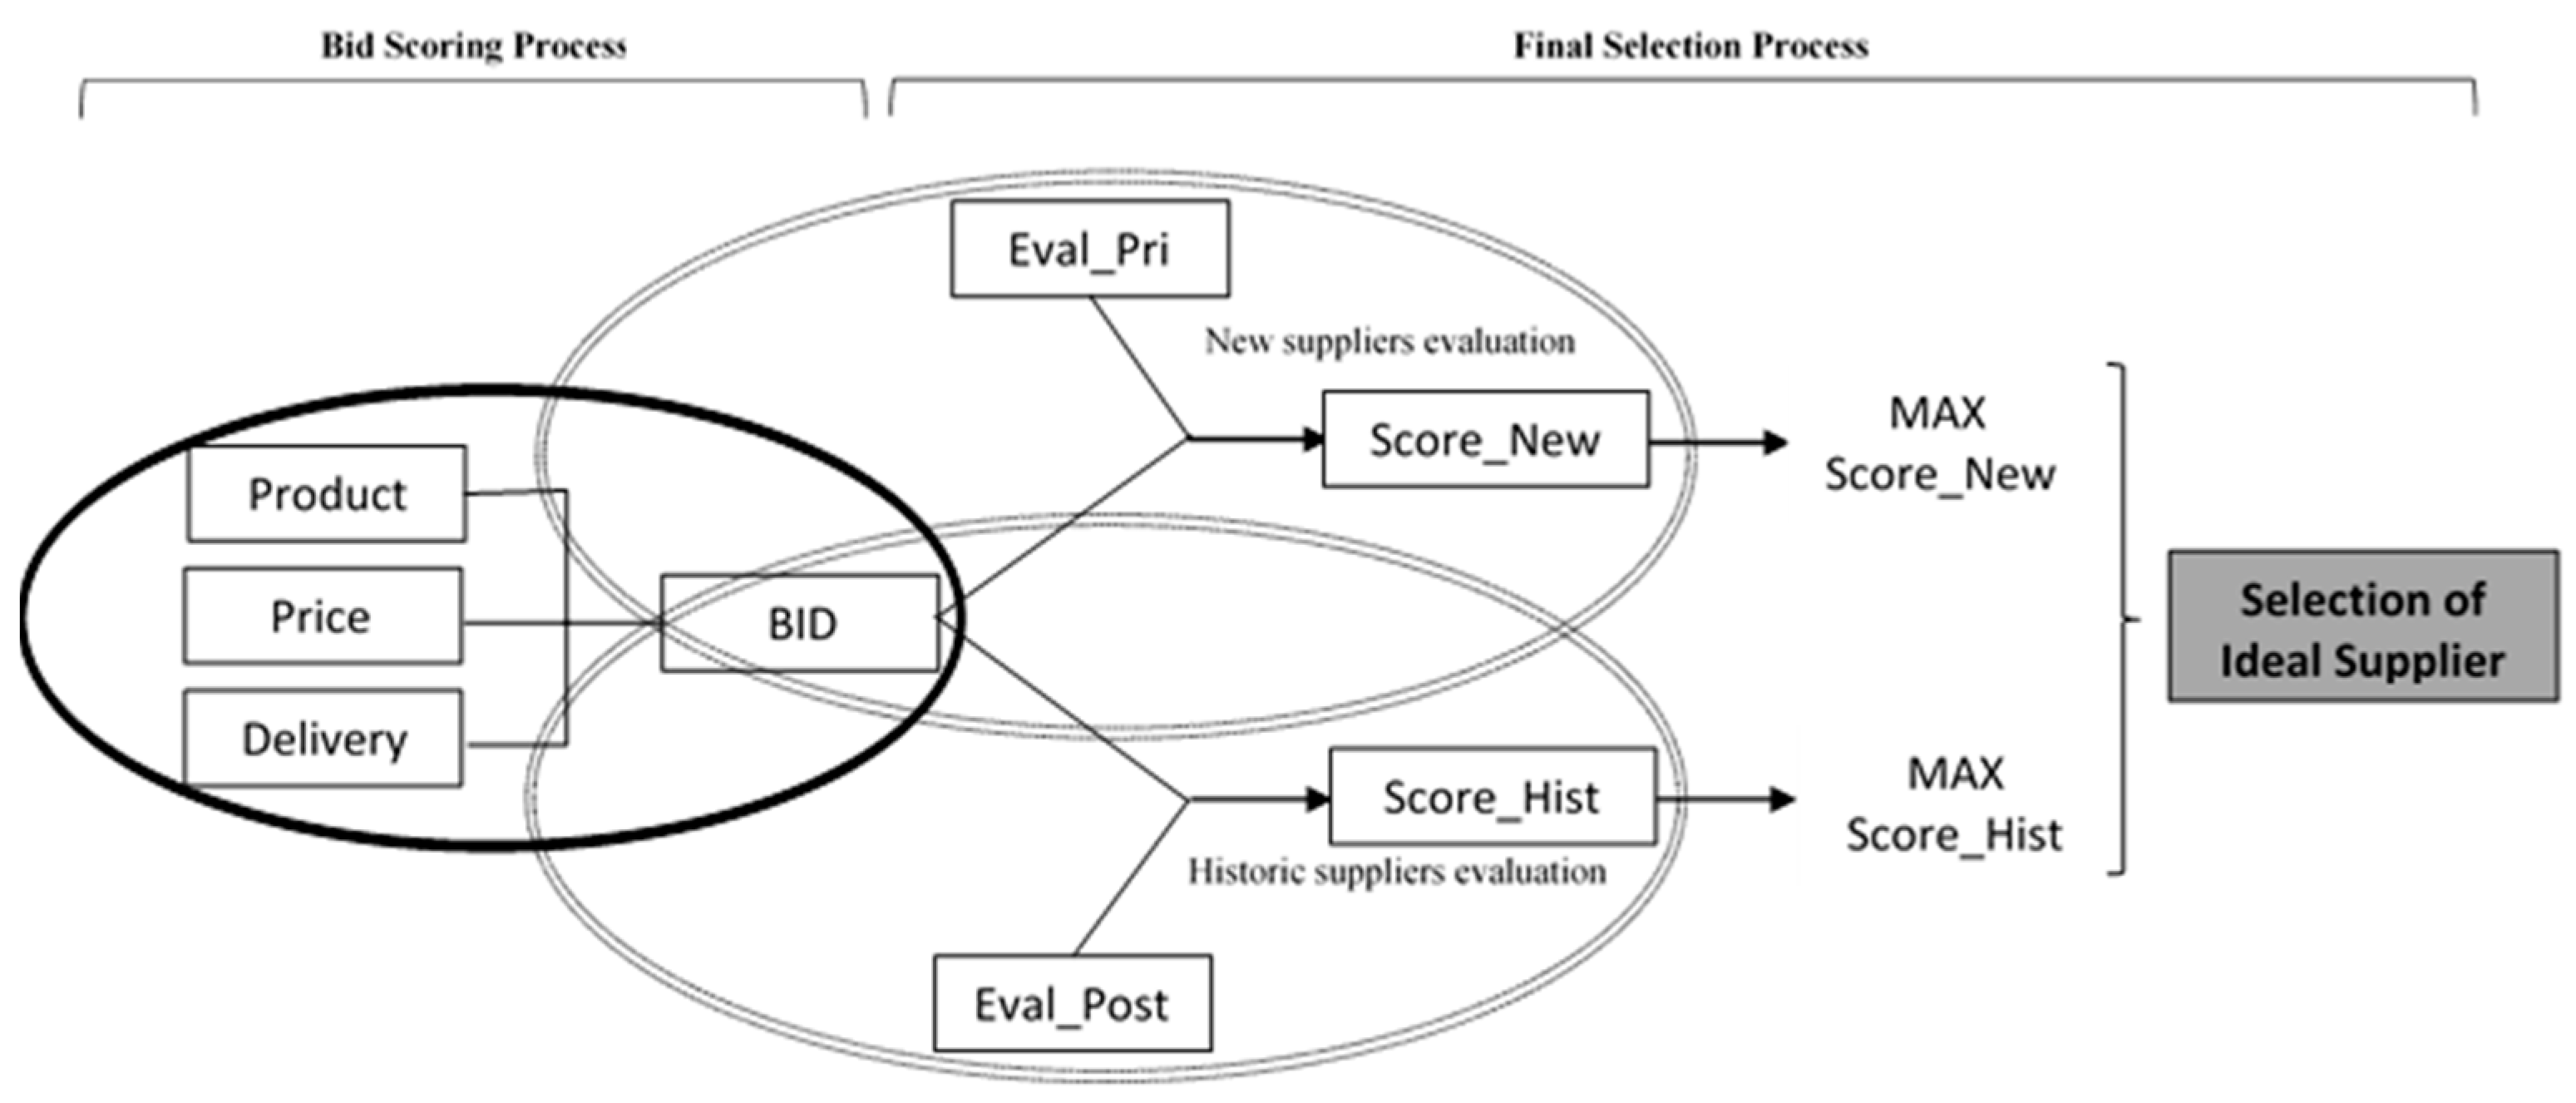
Figure 3.
Product categories on Kraljic matrix.
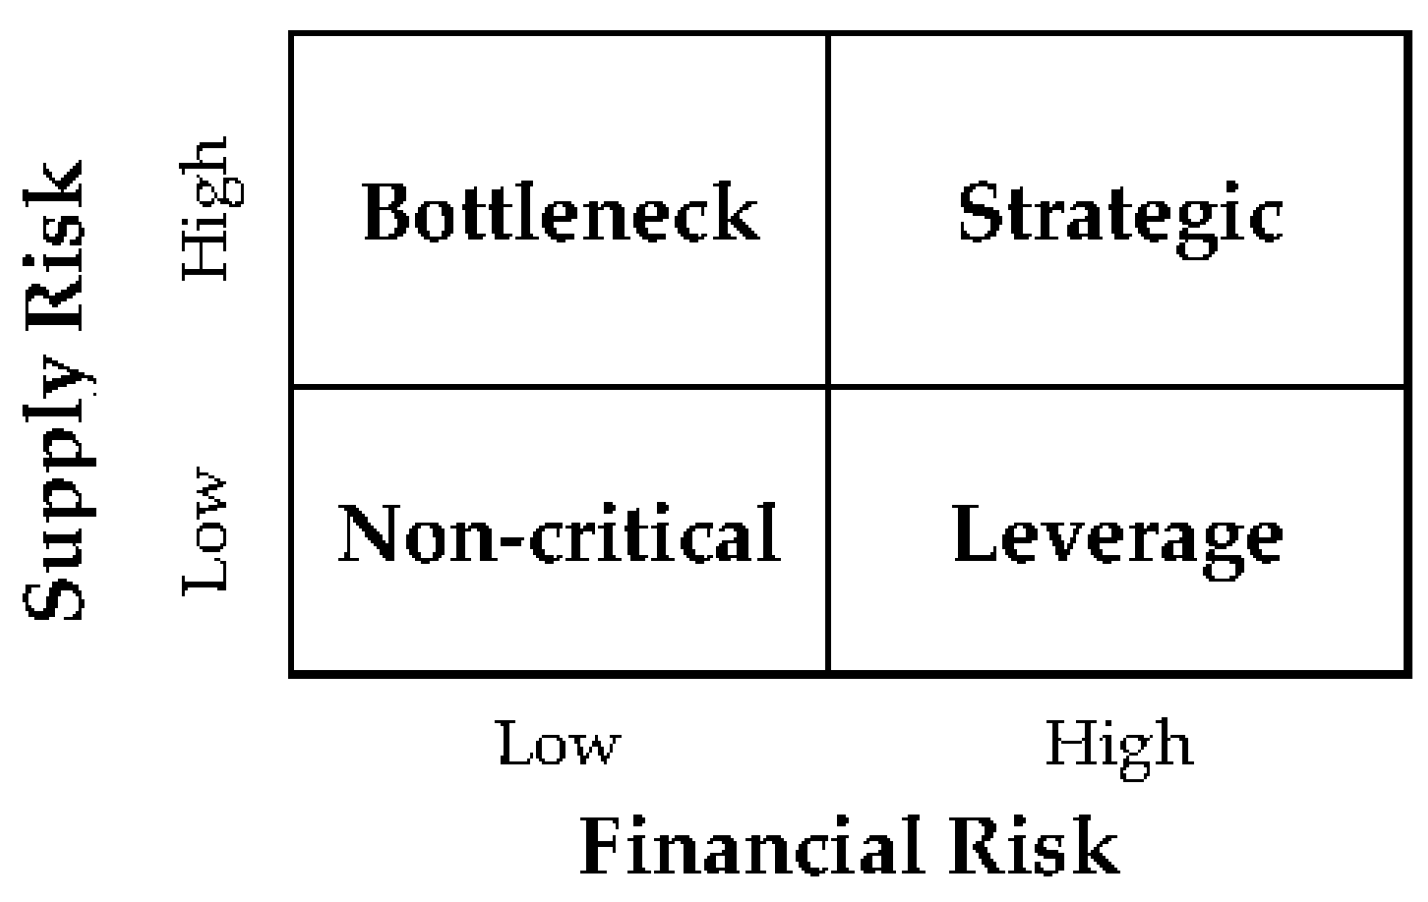
Figure 4.
Alternative core-width structures for the extreme labels of variable [BID].

Figure 5.
Symbolic translation from EAM = 1.5 to 2-tuple = (T, −0.5).
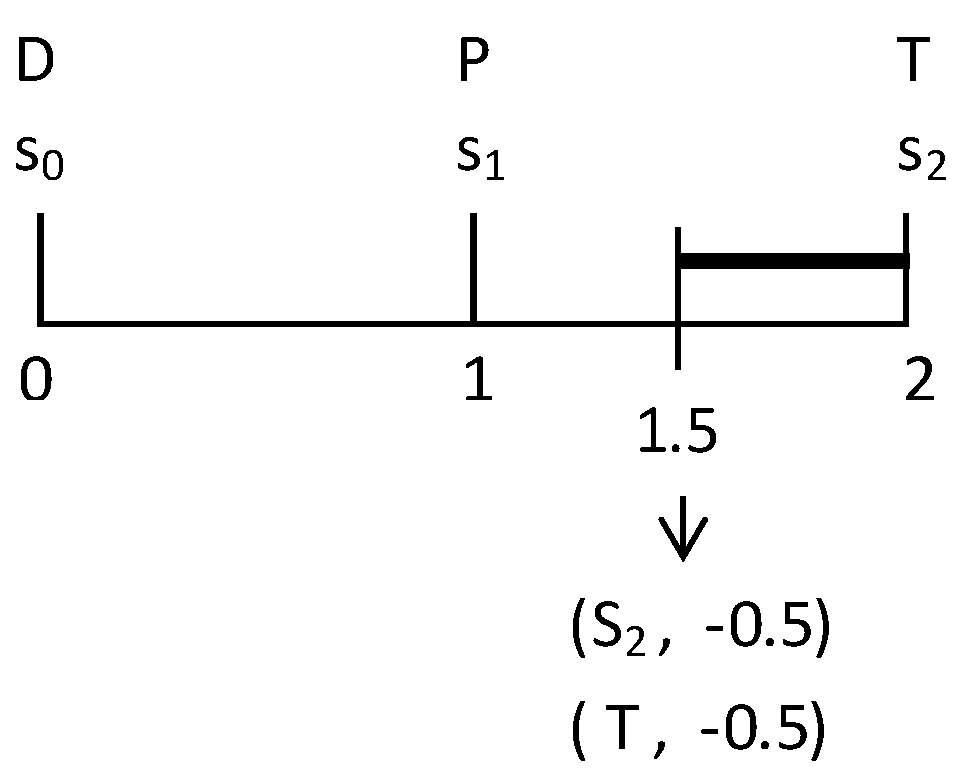
Figure 6.
Fuzzy strong partition from the agreed cores.

Figure 7.
Domain partitioning of the variable [BID].

Figure 8.
Fuzzy Variables for the “bid” and “Final evaluation” of the suppliers.

Figure 9.
(a) Bid inference maps for strategic products based on Product/Price variables. Constant value of Delivery: Low (left) and High (right); (b) Bid inference maps for strategic products based on Delivery/Price variables. Constant value of Product: Low (left) and High (right).
Figure 9.
(a) Bid inference maps for strategic products based on Product/Price variables. Constant value of Delivery: Low (left) and High (right); (b) Bid inference maps for strategic products based on Delivery/Price variables. Constant value of Product: Low (left) and High (right).

Figure 10.
Final evaluation of suppliers.

Figure 11.
Piecewise interpolation function for variable “Price”.

Table 1.
Most significant factors used in suppliers’ selection and evaluation (SSE) models. Adapted from [66].
Table 1.
Most significant factors used in suppliers’ selection and evaluation (SSE) models. Adapted from [66].
| Variable Mentioned in Literature | Frequency of Mention | % | Name Assigned in the Proposed Model |
|---|---|---|---|
| Quality | 68 | 16.7% | Q_System |
| Delivery | 64 | 15.7% | Delivery |
| Price/Cost | 63 | 15.4% | Price |
| Manufacturing capability | 39 | 9.6% | Structure |
| Service | 35 | 8.6% | Response |
| Management | 25 | 6.1% | Structure/Product |
| Technology | 25 | 6.1% | Structure/Product |
| Research & Development | 24 | 5.9% | Structure/Product |
| Finance | 23 | 5.6% | Economic |
| Flexibility | 18 | 4.4% | Quality/Response |
| Reputation | 15 | 3.7% | Structure |
| Relationship | 3 | 0.7% | n.a. |
| Risk | 3 | 0.7% | n.a. |
| Safety & Environment | 3 | 0.7% | n.a. |
Table 2.
Most frequently used methods in SSE.
| 2010—Adapted from [66] | |||||
| Single | papers | % | Hybrid | papers | % |
| DEA | 14 | 35.0% | AHP+ others | 16 | 39.0% |
| MP | 9 | 22.5% | Fuzzy+ others | 9 | 22.0% |
| AHP | 7 | 17.5% | MP+ others | 8 | 19.5% |
| CBR | 7 | 17.5% | DEA+ others | 5 | 12.2% |
| ANP | 3 | 7.5% | SMART+ others | 3 | 7.3% |
| 2017—Adapted from [1] | |||||
| Single | papers | % | Hybrid | papers | % |
| AHP | 29 | 36.7% | AHP+ others | 56 | 42.4% |
| TOPSIS | 28 | 35.4% | TOPSIS+ others | 47 | 35.6% |
| VIKOR | 10 | 12.7% | ANP+ others | 21 | 15.9% |
| ANP | 7 | 8.9% | VIKOR+ others | 8 | 6.1% |
| DEMATEL | 5 | 6.3% | |||
Table 3.
Indicators for the Bid evaluation subsystem.
| Variable Names | Description | Data Source | Variable Score Calculus | Range and Interpretation | |
|---|---|---|---|---|---|
| Input Variables | [Product] | Measures the adaptability of the product to the requirements of the company: Multi-functionality, ease of storage, proper packaging, shelf life, guarantee ... | Questionnaire designed “ad hoc” | Proportion of points obtained in the survey respect to the total possible points × 10 | Range: 0–10 <6: Deficient ~8: Acceptable >9: Optimal |
| [Price] | Rate of change in the price of the supplier’s bid with respect to the minimum bid (taking into account collateral aspects such as the payment period, the discount or taxes) | Provider bids. | Range: 0–1 >0.50: Deficient ~0.25: Acceptable <0.05: Optimal | ||
| [Delivery] | Measures the adaptability to the transportation company used by the supplier and the delivery conditions, the adaptation of the batch size, frequency and delivery schedules, handling units, identification and labelling, returns at no cost ... | Questionnaire design “ad hoc” | Proportion of points obtained in the survey respect to the total possible points × 10 | Range: 0–10 <6: Deficient ~8: Acceptable >9: Optimal | |
| Output Variable | [BID] | Score of the Provider’s bid. | Values awarded [Product], [Price] and [Delivery] | Weighting Method (WM) or Fuzzy Inference System (FIS) | Range: 0–10 <6: Deficient ~8: Acceptabl e >9: Optimal |
Table 4.
Indicators for the Final evaluation subsystems.
| Variable Names | Description | Data Source | Variable Score Calculus | Range and Interpretation | |
|---|---|---|---|---|---|
| Input Variables | [Eval_Pri] or [Eval_Post] | “A Priori” or “A posteriori” score of the supplier | List of Approved Suppliers or Historical behavior reports | Previous evaluation process | Range: 0–10 <6: Not approved ~8: Acceptable >9: Optimal |
| [BID] | Score of the supplier’s bid | Assigned values to [Product], [Price] and [Delivery] | (WM) or (FIS) | Range: 0–10 <6: Deficient ~8: Acceptable >9: Optimal | |
| Output Variable | [SCORE_New] or [SCORE_Hist] | Score of a new supplier or Score of a previous supplier | Assigned values to [Eval_Pri] or [Eval_Post], and [BID]—from previous subsystem | (WM) or (FIS) | Range: 0–10 <6: Deficient ~8: Acceptable >9: Optimal |
Table 5.
Set of preference linguistic terms.
| Label | Concept | TrFNs | 2-Tuples | |
|---|---|---|---|---|
| s0 | D | Disagreement | (0.0 0.0 0.3 0.5) | (D, 0) |
| s1 | P | Partial Agreement | (0.3 0.5 0.5 0.7) | (P, 0) |
| s2 | T | Total Agreement | (0.5 0.7 1.0 1.0) | (T, 0) |
Table 6.
Preference assessment from the experts in four proposed structures to define the cores of the partition.
Table 6.
Preference assessment from the experts in four proposed structures to define the cores of the partition.
| Struc_1 | Struc_2 | Struc_3 | Struc_4 | |
|---|---|---|---|---|
| Exp1 | T | P | - | - |
| Exp2 | T | - | - | P |
| Exp3 | P | T | - | - |
| Exp4 | P | - | T | - |
| EAM | 1.5 | 0.75 | 0.5 | 0.25 |
| 2-tuples | (T, −0.5) | (P, −0.25) | (P, −0.5) | (D, 0.25) |
Table 7.
Rating on linguistic preferences by experts in five alternative labels to define the output label of a rule.
Table 7.
Rating on linguistic preferences by experts in five alternative labels to define the output label of a rule.
| - | VL | L | M | H | VH |
|---|---|---|---|---|---|
| Exp1 | - | P | T | - | - |
| Exp2 | - | - | P | T | P |
| Exp3 | P | T | P | - | - |
| Exp4 | - | P | T | P | - |
| EAM | 0.25 | 1.00 | 1.5 | 0.75 | 0.25 |
| 2-tuples | (D, 0.25) | (P, 0.00) | (T, −0.5) | (P, −0.25) | (D, 0.25) |
Table 8.
Base of rules for evaluation of bids in strategic products.
| Delivery | |||||||||||
|---|---|---|---|---|---|---|---|---|---|---|---|
| Insuf | Accep | Ideal | Insuf | Accep | Ideal | Insuf | Accep | Ideal | |||
| Product | Insuf | VL | VL | L | L | M | M | H | H | VH | BID |
| Accep | VL | VL | L | L | M | M | H | H | VH | ||
| Ideal | VL | VL | L | L | M | M | H | H | VH | ||
| Insuf | Accep | Ideal | |||||||||
| Price | |||||||||||
| VL = Very Low/L = Low/M = Medium/H = High/VH = Very High | |||||||||||
Table 9.
Base of rules for the final evaluation subsystem.
| Eval_Pri or Eval_Post | ||||||
|---|---|---|---|---|---|---|
| VL | L | M | H | |||
| BID | VL | L | L | L | L | |
| L | L | L | M | H | Score_New | |
| M | L | M | H | H | or | |
| H | L | M | H | VH | Score_Hist | |
| VH | L | H | VH | VH | ||
Table 10.
Numerical example. Evaluation Results.
| [1] | [2] | [3] | [4] | [4’] | [5] | [6W] | [6F] | [7] | [8W] | [8F] | ||||
|---|---|---|---|---|---|---|---|---|---|---|---|---|---|---|
| New/Hist | Eval_Pri | Eval_Post | Product | Price | Price’ | Delivery | Bid (WM) | Bid (FIS) | Variation Rate (%) | Final Eval (WM) | Final Eval (FIS) | |||
| New | Hist | New | Hist | |||||||||||
| SUPP 01 | New | 7.17 | 6.0 | 0.03 | 9.4 | 8.7 | 8.0 | 6.7 | 15.83% | 7.5 | 4.3 | |||
| SUPP 02 | New | 6.13 | 7.5 | 0.54 | 4.6 | 7.8 | 7.4 | 4.8 | 35.05% | 6.6 | 2.7 | |||
| SUPP 03 | New | 8.30 | 3.2 | 0.12 | 8.3 | 2.8 | 3.5 | 2.8 | 19.31% | 6.4 | 2.7 | |||
| SUPP 04 | New | 7.87 | 7.0 | 0.75 | 2.5 | 9.0 | 7.8 | 6.5 | 16.13% | 7.8 | 5.7 | |||
| SUPP 05 | Hist | 6.66 | 9.0 | 0.04 | 9.2 | 7.4 | 8.1 | 7.7 | 4.47% | 6.9 | 6.2 | |||
| SUPP 06 | Hist | 8.08 | 6.5 | 0.33 | 6.4 | 6.1 | 6.2 | 2.9 | 53.57% | 7.7 | 2.7 | |||
| SUPP 07 | Hist | 5.28 | 7.5 | 0.19 | 7.6 | 9.5 | 8.7 | 8.1 | 7.00% | 6.0 | 5.0 | |||
| SUPP 08 | Hist | 5.91 | 8.5 | 0.03 | 9.4 | 7.0 | 7.7 | 7.0 | 8.97% | 6.3 | 5.0 | |||
| SUPP 09 | Hist | 5.51 | 7.0 | 0.75 | 2.5 | 9.0 | 7.8 | 6.5 | 16.13% | 6.0 | 5.0 | |||
| SUPP 10 | Hist | 7.32 | 3.2 | 0.12 | 8.3 | 2.8 | 3.5 | 2.8 | 19.31% | 6.6 | 2.7 | |||
Table 11.
Analysis of the differences in the bid and supplier scores by using both methods.
| Bid Subsystem | Final Evaluation Subsystem | |||
|---|---|---|---|---|
| Behaviour WM | Behaviour FIS | Chosen Method | Score | |
| SUPP 01 | √ | √√ | FIS | 4.3 |
| SUPP 02 | X | √ | FIS | 2.,7 |
| SUPP 03 | √ | √√ | FIS | 2.7 |
| SUPP 04 | √ | √√ | FIS | 5.7 |
| SUPP 05 | √ | √ | WM/FIS | 6.9/6.2 |
| SUPP 06 | X | √ | FIS | 2.7 |
| SUPP 07 | √ | √ | FIS | 5.0 |
| SUPP 08 | √ | √ | FIS | 5.0 |
| SUPP 09 | √ | √√ | FIS | 5.0 |
| SUPP 10 | √ | √√ | FIS | 2.7 |
“X”: Lack of fit between the method score and reality in strategic products; “√“: Good fit; “√√“: Substantial improvement of supplier evaluation when using FIS.
© 2018 by the authors. Licensee MDPI, Basel, Switzerland. This article is an open access article distributed under the terms and conditions of the Creative Commons Attribution (CC BY) license (http://creativecommons.org/licenses/by/4.0/).
Share and Cite
MDPI and ACS Style
Garcia, N.; Puente, J.; Fernandez, I.; Priore, P. Suitability of a Consensual Fuzzy Inference System to Evaluate Suppliers of Strategic Products. Symmetry 2018, 10, 22. https://doi.org/10.3390/sym10010022
AMA Style
Garcia N, Puente J, Fernandez I, Priore P. Suitability of a Consensual Fuzzy Inference System to Evaluate Suppliers of Strategic Products. Symmetry. 2018; 10(1):22. https://doi.org/10.3390/sym10010022
Chicago/Turabian StyleGarcia, Nazario, Javier Puente, Isabel Fernandez, and Paolo Priore. 2018. "Suitability of a Consensual Fuzzy Inference System to Evaluate Suppliers of Strategic Products" Symmetry 10, no. 1: 22. https://doi.org/10.3390/sym10010022
Note that from the first issue of 2016, this journal uses article numbers instead of page numbers. See further details here.