Carbon Oxides Gases for Occupancy Counting and Emergency Control in Fog Environment


1
Department of Computer and Information Science, University of Macau, Taipa 999078, Macau
2
School of Computer Science, North China University of Technology, Beijing 100144, China
*
Authors to whom correspondence should be addressed.
Symmetry 2018, 10(3), 66; https://doi.org/10.3390/sym10030066
Submission received: 10 February 2018
/
Revised: 10 March 2018
/
Accepted: 12 March 2018
/
Published: 15 March 2018
(This article belongs to the Special Issue Emerging Approaches and Advances in Big Data)
Abstract
:The information of human occupancy plays a crucial role in building management. For instance, fewer people, less demand for heat and electricity supply, and vice versa. Moreover, when there is a fire in a building, it is convenient to know how many persons in a single room there are in order to plan a more efficient rescue strategy. However, currently most buildings have not installed adequate devices that can be used to count the number of people, and the most popular embedded fire alarm system triggers a warning only when a fire breaks out with plenty of smoke. In view of this constraint, in this paper we propose a carbon oxides gases based warning system to detect potential fire breakouts and to estimate the number of people in the proximity. In order to validate the efficiency of the devised system, we simulate its application in the Fog Computing environment. Furthermore, we also improve the iFogSim by giving data analytics capacity to it. Based on this framework, energy consumption, latency, and network usage of the designed system obtained from iFogSim are compared with those obtained from Cloud environment.
1. Introduction
With the development of sensor network technologies, multiple forms of objects surrounding us can be connected to the network through a nearby access point. The proliferation of sensing devices in communicating-actuating networks paved the way for the Internet of Things (IoT) [1], while simultaneously generating enormous amounts of data. Data collected by sensors are transmitted or analyzed to yield a better understanding of the current states, make intelligent decisions or predict future trends. Cloud Computing [2], which enables ubiquitous, convenient, on-demand network access to a shared pool of configurable computing resources (e.g., networks, servers, storage, applications, and services), can be rapidly provisioned and released with minimal management effort or service provider interaction. The “pay-as-you-go” Cloud Computing model is an efficient alternative for customers to store or analyze data. Some public Cloud service vendors, such as Google Cloud Dataproc, provide virtual machines with managed data analytics frameworks like Apache Spark or Hadoop for batch processing, querying, streaming and machine learning. Tremendous data such as multimedia data [3] can be processed in Cloud efficiently. Wireless Sensor Networks (WSNs) combined with Cloud makes it easier to share and analyze data on-the-fly, meanwhile providing Sensing as a Service (SaaS) and Sensor Event as a Service (SEaaS) to the clients over the Internet [4]. Applications of WSN, such as weather forecasting [5], health care [6], 3D scene reconstruction [7], smart car [8] have been studied in Cloud environment. However, when considering real-time processing, uploading/downloading to/from Cloud may cause longer latencies due to network transmission or congestion. In order to satisfy delay requirements of latency-sensitive applications, in 2012, Cisco proposed the definition of Fog Computing [9], which extends the Cloud Computing to the edge of the network. Fog Computing is located between end devices and traditional Cloud Computing Data Centers. It provides computing, storage and networking services in order to make it convenient for critical Internet of Things services and applications. Authors in [10] also pointed out that Fog computing has emerged as a promising edge device to decentralize data processing, decrease latency, and bring more reliability for WSNs in IoT. Pooranian et al. [11] proposed an Internet of Everything architecture for Fog Computing with energy-aware algorithm for Fog data center. Shojafar et al. [12] proposed an energy-efficient adaptive resource scheduler for Networked Fog Centers (NetFCs) and provide real-time services to vehicular clients. In [13], the authors presented a Fog-supported smart city network architecture in which the applications running on things jointly compute, route, and communicate with one another through the smart city environment to decrease latency and improve energy provisioning and the efficiency of services among things with different capabilities.
For the past decades, fire has caused many losses and personal injuries around the world. Usually, people prevent fire passively by fire alarm systems triggered by dense smoke. When there is a fire, informations about the room/building is very crucial for fire fighters, which can help them to make rescue strategy properly. However, traditional alarm systems cannot provide useful information about the room states. Motivated by these considerations, we present an intelligent system for fire control and occupancy counting, where machine learning algorithms are adopted to build a model to describe the relationship between the concentration of CO and human occupancy. Notice that the emergency control application requires prompt processing, considering the limit computing power of local computers, it is highly possible that the computer is not able to handle complex computing tasks. Fog Computing spreads communication and computing resources over the wireless access network which is capable of providing the resource augmentation to resource and energy-limited wireless devices [11]. In the view of this merit of Fog, we design the emergency control and occupancy counting application in a Fog Computing environment.
Human occupancy information is important for modern Building Management Systems (BMSs). Ideally, heating, ventilation and air conditioning within a building or a room should be adjusted according to the number of people so as to reduce energy consumption and costs. Furthermore, by knowing the human occupancy in a room at a certain time, the building manager is able to monitor and guide people to appropriate rooms instead of letting them search one by one. Moreover, the human occupancy information is crucial during emergency situations such as fire breakouts. It can help firefighters in implementing rescue operations. Despite the requirement in counting the number of people, many buildings are not equipped with adequate devices to estimate human occupancy. Installing cameras allows security officers to monitor people in real time, although this may raise privacy concerns. Thus, large amounts of inexpensive, low-energy sensors with convenient networking capabilities are needed in the design of an intelligent BMS.
There are a number of standards and technologies for WSNs, which typically include WiFi (IEEE 802.11), IEEE 802.15.4, and Bluetooth Low Energy (BLE). Wi-Fi can provide higher data throughput and range. It is widely used to access networks but it consumes more energy which is a common disadvantage across WSNs. By contrast, IEEE 802.15.4 was specifically designed to work with low power, low data rate, and it has a low cost. In contrast, a similar protocol, ZigBee, enriches IEEE 802.15.4 by adding network, security layers and an application framework, offering a scalable architecture with end-to-end IPv6 networking [14]. Another important technology is Bluetooth. Traditional Bluetooth can only consist of seven active slaves, which limits the scale of WSNs. The BLE is intended to reduce power consumption and costs while extending the communication range. Although different types of technologies have been designed for WSNs, in this paper we simulate the ZigBee environment as it has been used in many practical applications, such as smart power switches or door locks.
Various sensors can be used for estimating the number of people or for detecting a fire breakout. Despite almost all modern buildings being equipped with smoke alarms, these can only issue a warning after the fire has started to expand. We prefer to monitor an environment which may have abnormal changes, and take action before the smoke density exceeds the threshold. The most popular device for counting people is the passive infrared (PIR) motion sensor. However, this type of sensor is only able to detect motion in an area instead of human occupancy, which means that the head count of the people would correspond to one reading [15]. In [16], the authors also compared the accuracy of occupancy in an office when using single (0.201), double (0.978) and triple (0.999) PIR sensors. Thus, in order to estimate the occupancy with reasonable accuracy, the number of PIR sensors may increase. As opposed to PIR sensors, gas sensors detect content changes in real time. As humans exhale carbon dioxide, gas diffusion makes the concentration relatively balanced, especially in an enclosed space. In addition, we choose carbon oxides gas sensors for occupancy detection because of two other reasons: (1) we want to use gas concentration to estimate human occupancy approximately; (2) we intend to monitor gas concentration and trigger an alarm before a fire breakout occurs since carbon oxides gas content changes significantly when there is a fire.
Actually, this is not the first attempt at counting people using carbon oxide sensor data. Arief-Ang et al. [17] pointed out that there is a correlation between CO and occupancy. They developed a time-series model to predict the number of people in an academic staff room and cinema theatre. Jiang et al. [18] proposed an indoor estimator based on real-time CO measurements. They used a Feature Scaled Extreme Learning Machine algorithm, which is a variation of the standard Extreme Learning Machine (ELM), to identify the dynamic model. In [19], the authors presented a simple algorithm which uses indoor carbon dioxide concentrations to provide estimated occupancy profiles in office buildings. They also provided arguments to estimate the reliability and usefulness for service. Basu et al. [20] proposed the PerCCS algorithm which uses task-driven Sparse Non-negative Matrix Factorization (SNMF) to learn about the CO data. They explored the possibility of estimating a person count from CO sensors already integrated in everyday room air-conditioning infrastructures. Multiple sensors (e.g., CO, light, motion, sound, temperature, non-directional doorway beam-break sensors) were combined to recognize human occupancy in [21,22,23].
Motivated by the works mentioned above, the main contributions of this paper include: (i) Design a WSN system to estimate human occupancy and potential fire in Fog Computing environment. Carbon oxide gases data are collected and analyzed, and the latency of control loop is compared with that obtained from Cloud platform; (ii) Extend a Fog computing simulator-iFogSim by giving it data analysis capacity. The original discrete event based framework focuses on the behavior of fog devices. Some object models may not specify with more realistic details. For example, tuples transmitted among devices which are used for describing information exchange do not carry data; (iii) Use machine learning algorithms to train and test the occupancy model based on the collected data.
2. Materials and Methods
In this section, we introduce an application of wireless sensor networks that can be used to measure the concentrations of CO and CO gases. The human occupancy counting and emergency detection systems are designed and implemented in a Fog Computing simulator called iFogSim, which is improved by giving the capacity of data processing.
2.1. Wireless Sensor Network
There are mainly three types of devices involved in the system: ZigBee Coordinator, ZigBee Router and ZigBee End Device. In what follows, more details about those devices are presented.
ZigBee Coordinator: The function of coordinator is to choose a channel and network identity (PAN ID), to maintain the entire network, to design security policies and to communicate with other devices. It is the beginning of the entire network and has the highest authority. Moreover, it is worth pointing out that only one ZigBee coordinator is needed for each ZigBee network.
ZigBee Router: The router stores routing protocol which is used for network data routing and data transmission.
ZigBee End Device: The end device is a specific implementation of the data acquisition. It cannot forward the messages from one node to another.
Those three devices mentioned above can be divided into two groups based on their functional integrities, including Full Function Devices (FFDs) and Reduce Function Devices (RFDs). FFDs can be worked as coordinator, router or terminal device, while the RFDs can only be used as end device. A FFD is capable of communicating with multiple RFDs or FFDs simultaneously, whereas a RFD can only communicate with one FFD. Although ZigBee can transmit signals over a kilometer by increasing the transmit power, its strength will weaken when travelling through obstacles like walls. Thus, a large scale of wireless sensor network should have routers, repeaters or other equipment to extend its network coverage.
To illustrate the working principle of ZigBee, an architecture of WSNs in a building is displayed in Figure 1. One or more sensors can be installed in a single room, and each of them can only communicate with its nearest router. The router is placed along the corridor or within a room according to its signal overlay area, and it is able to send signals to its neighbor router or the coordinator. A coordinator transmits data to a computer by interfaces, then data is processed in the computing center for further analysis. Figure 2 presents a typical room from Data Analytics and Collaborative Computing (DACC) Laboratory [24] is equipped with sensor network devices, and each independent space has a sensor. Here it is necessary to remark that the number of required sensors depends on the size of the room and the range of sensing.
2.2. Data Analytics
After obtaining data from coordinators in WSNs, we need to mine potential valuable knowledge from these raw data, like occupancy counting and safety level. The Data Analytics Module consists of two parts, the off-line model building and the online data analysis. The off-line model building uses an extremely large amount of data to train/test data. Various machine learning algorithms can be applied in this step for the purpose of finding an optimal model to predict new data. This procedure usually lasts for a long time or needs to be done repeatedly so as to find the best parameters. The on-line prediction step processes real-time sensing data transmitted to the computing unit. Firstly, the model obtained from the previous step will be loaded. Then the model is applied to evaluate the room state and estimate the occupancy. Finally, these results will be sent to a display for monitoring or storage for further application. The reader is referred to Figure 3 for illustration.
2.3. Simulation Platform
We use a Fog Computing simulator iFogSim [25] to simulate the designed system. iFogSim is a toolkit for modeling and simulation of resource management in Internet of Things, Edge and Fog Computing environment. It can model IoT and Fog environments and measure the impact of resource management techniques in terms of latency, network congestion, energy consumption, and cost. Although event-based iFogSim can simulate various objects in different application scenarios, it does not have real-time data processing capacity. For example, Sensor class is able to simulate the behavior of a sensor, such as location, destination module name, tuple type, transmission latency, the interval to send data. However, it cannot set the value of sensing data. In light of this constraint, this section describes modifications of some classes of the modeling language in iFogSim.
2.3.1. Tuple
In iFogSim, Tuples form the fundamental units of communication between entities, which is inherited from the Cloudlet class of CloudSim. A tuple is characterized by its type, source and destination application modules. The attributes of the class are specified by the processing requirements (defined as Million Instructions (MI)) and the length of data encapsulated in the tuple. We add some parameters shown in Table 1, where records the sensor which creates the . We also introduce two parameters and to denote the CO and CO concentration, respectively. marks the sensing/creation time of a tuple. Moreover, and are defined to present the predicted number of people and the safety level of a room.
2.3.2. Sensor
Instances of the class are entities that act as IoT sensors. It contains a reference attribute to the gateway Fog device to which the sensor is connected, and the latency of connection between them. It also defines the output characteristics of the sensor and the distribution of tuple inter-transmission or inter-arrival time—which identifies the tuple arrival rate at the gateway. To simulate the input data distribution, we add two parameters and . is added to record tuples in a certain time. Table 2 gives attributes that we added in.
2.3.3. FogDevice
This class specifies hardware characteristics of Fog devices and their connections to other Fog devices, sensors and actuators. is extended from the class in CloudSim, it has attributes, such as accessible memory, processor, storage size, uplink and downlink bandwidths. also defines resources scheduling, modules deployment policy, etc. Notice that Fog device can compute the processing time of a tuple. However, it does not have the ability to analyze real data. Taking this limitation into account, we modify class and add data process unit to function executeTuple() as presented in Algorithm 1. The Fog device firstly judges whether a tuple is sent from a sensor and has not been processed. Only if this Fog device has data analysis capacity, the tuple will be stored in the buffer list. Line 2 to 5 limits the buffer size of a sensor, and ensure it carry the latest tuples. Step 7 loads the machine learning model and predict occupancy and state. Details about the prediction model are given in the following paragraph.
| Algorithm 1 ExecuteTuple() |
| Input: Tuple |
| Output: Tuple marked with and |
| 1: if the tuple is sent from south to the current module, and current fog device carries the data |
| processing module then |
| 2: Add the tuple to the of the sensor |
| 3: if then |
| 4: Remove the earliest tuple in |
| 5: end if |
| 6: Eliminate noise and outliers according to |
| 7: Load data analytics model, predict and |
| 8: end if |
2.4. Prediction Model
The correlation between CO concentration and occupants is affected by the size of space, temperature, ventilation, etc. Therefore, there may not be a unified formula to calculate the number of people. In this paper, we assume that the concentration of CO in a regular room, which does not change greatly during a few days. In this case, we could discover a relatively reasonable correlation between gas concentration and occupants. In papers [18,19,21,26], the authors recorded actual CO concentration in a certain time under a specific room condition.
The spread of CO/CO is affected by many factors, such as the size of room, windows, air-conditioning, ceiling height and temperature. Considering the fact that there always exists a latency between the changes in human occupancy and the alteration of sensors’ readings, the human occupancy estimated using CO/CO sensors is in fact an average of the occupancy over a period of time. Notice that when there is a fire, the concentration of CO/CO will increase dramatically at the same time. In this case, we will not use the increased CO to estimate the human occupancy, but use the CO reading before the moment when its concentration increases dramatically.
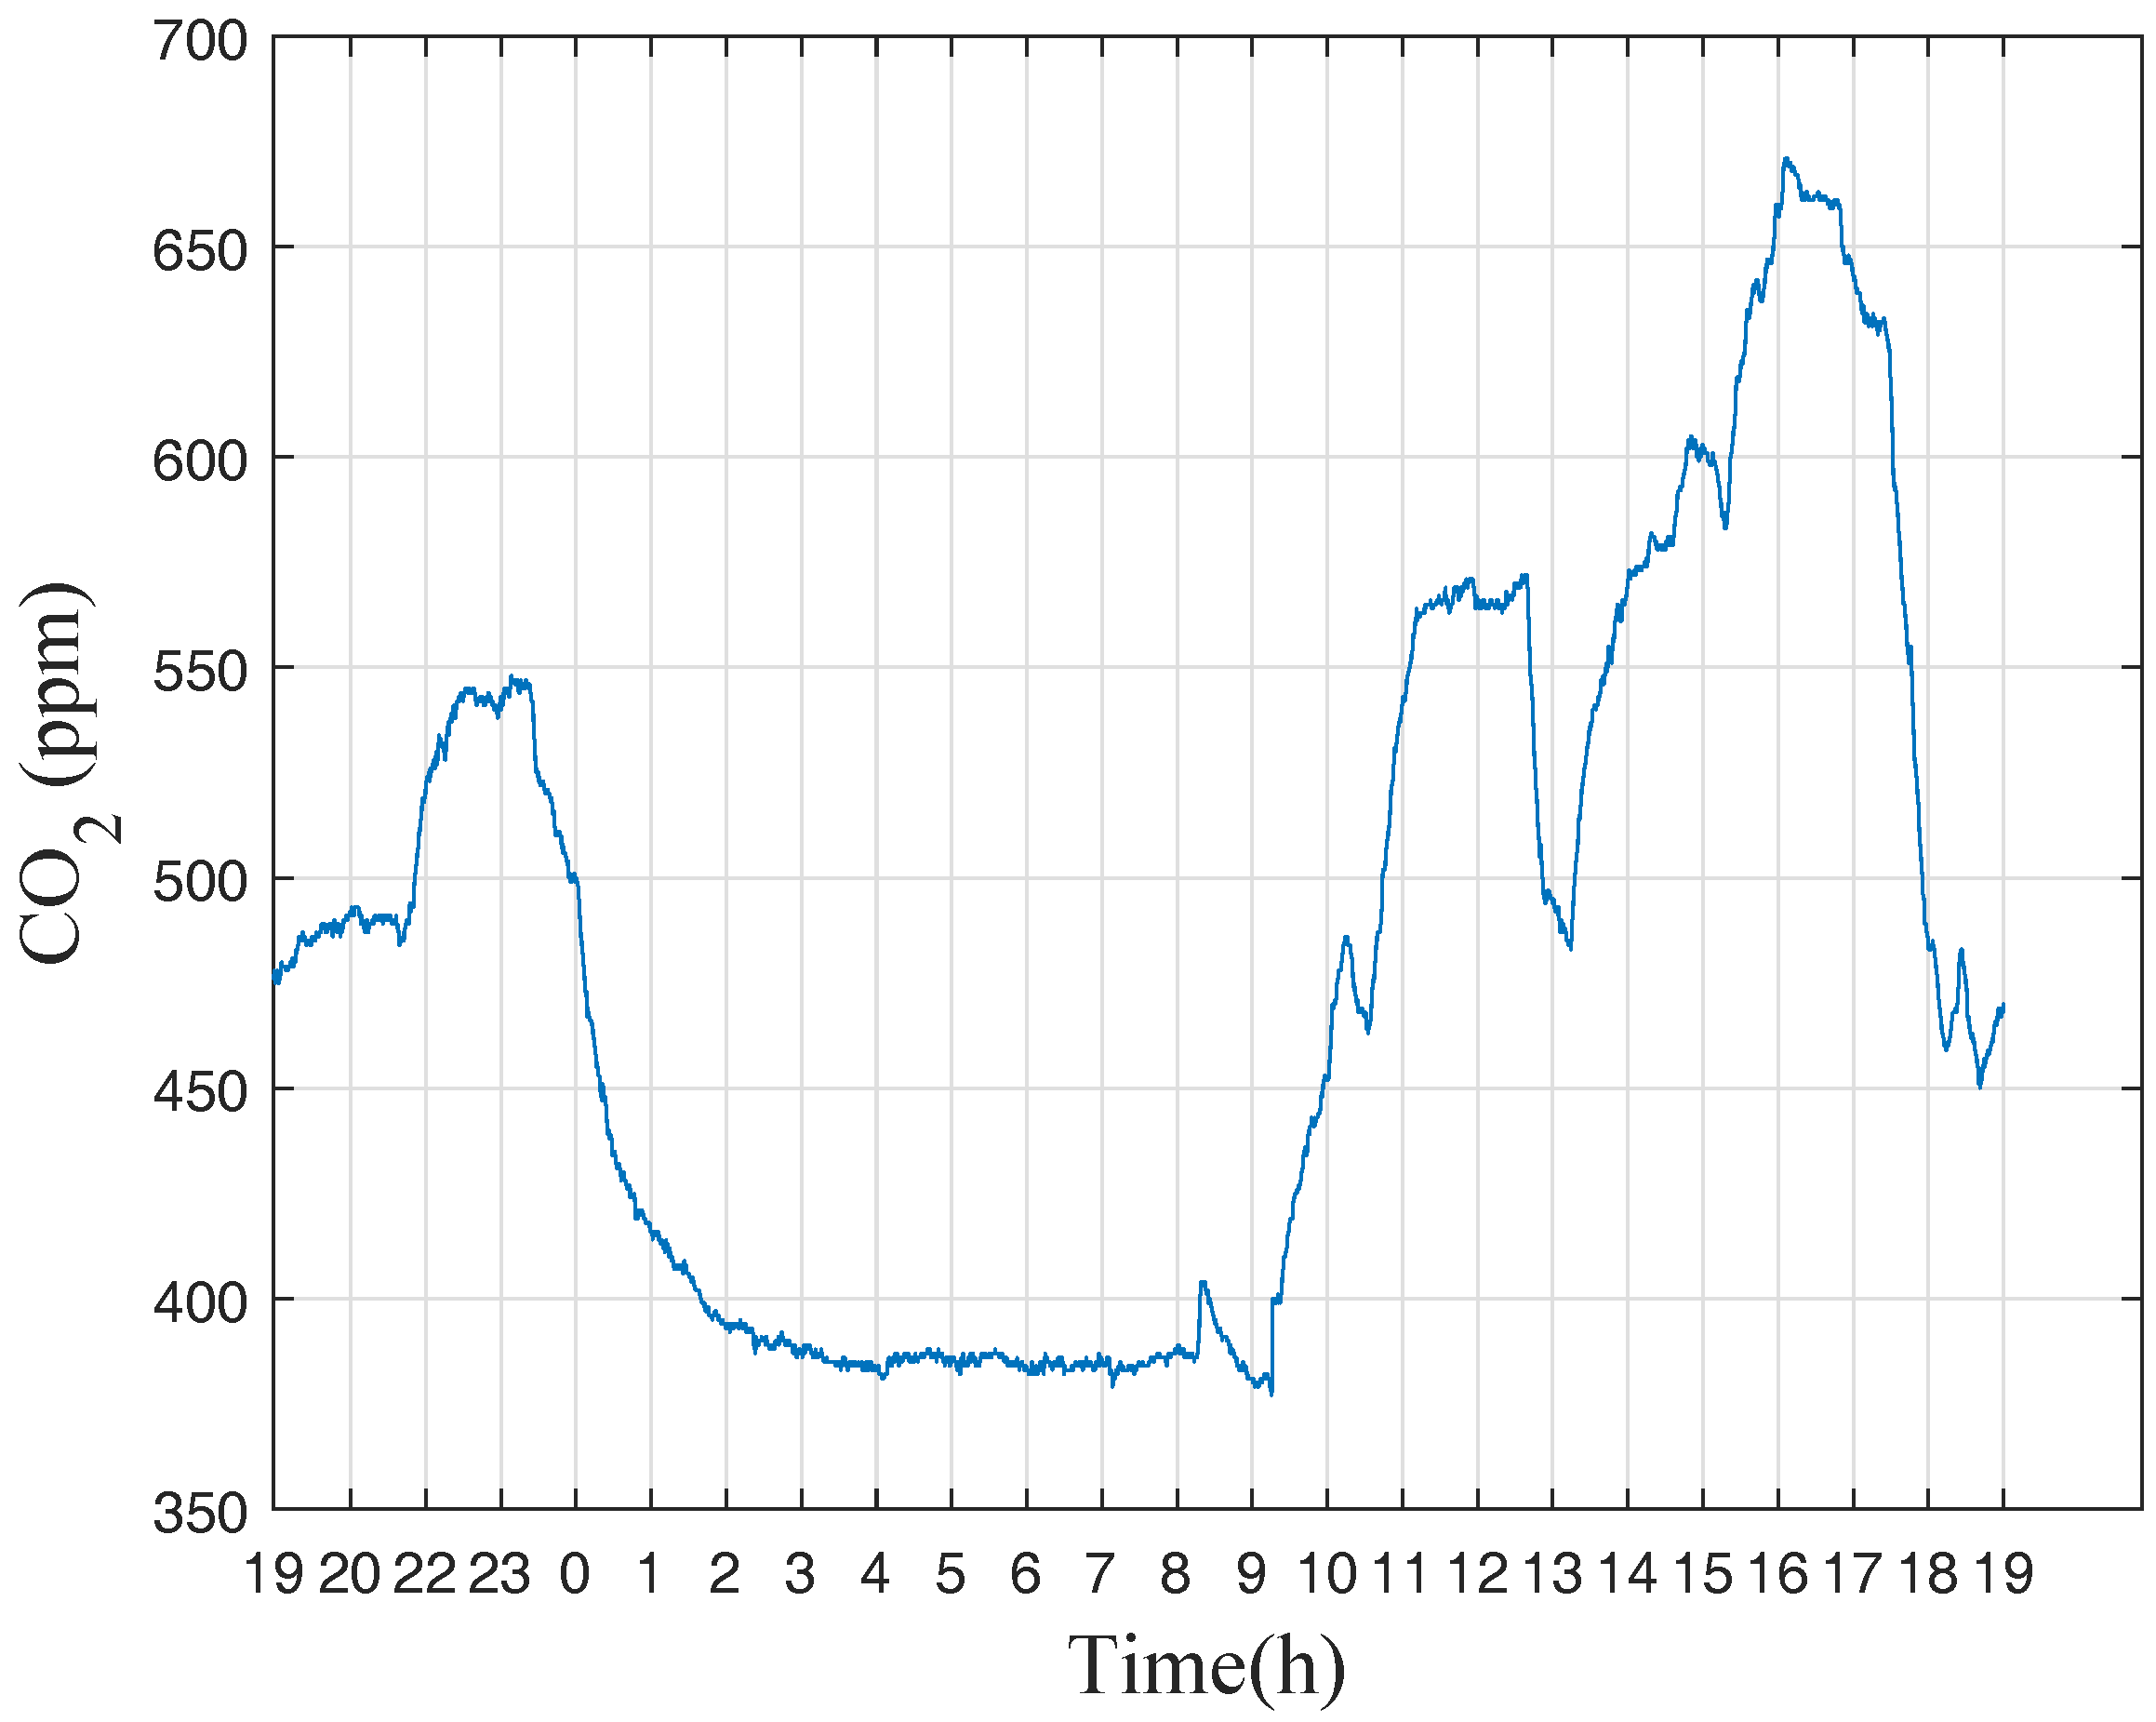
We set up an experiment to collect indoor human occupancy data, then use machine learning algorithms to train and test the model. We use SenseAir S8 [27] (Figure 4) to collect CO data. The sensor is placed in a single lab room with the width, length and height of the area are , and respectively. The CO concentration during a day within a lab is displayed in Figure 5. During the day the number of people is up to 2. At night from to , the CO concentration has the lowest value as nobody stay in the lab. There are some fluctuations in the daytime because of the changes in occupancy or other factors like opening the door.
Moreover, we set up another experiment which lasts for 3 h. The maximum occupancy is 9, and the number of people increases every half an hour. Examples of collected data are shown in Table 3. Notice that it takes some time for CO to diffuse the full room. As a consequence, there is a delay between the time of people entering/exiting the room and the increase/decrease of the CO readings. As described in paper [17], Upper Bound (UB) is defined to evaluate the time lag, which is calculated by the following formula,
For this lab room, the UB value is 0.6336. This small value means the influence of time lag on data reading and analysis is minimal. For the sake of simplicity, we do not consider time lag under this circumstance.
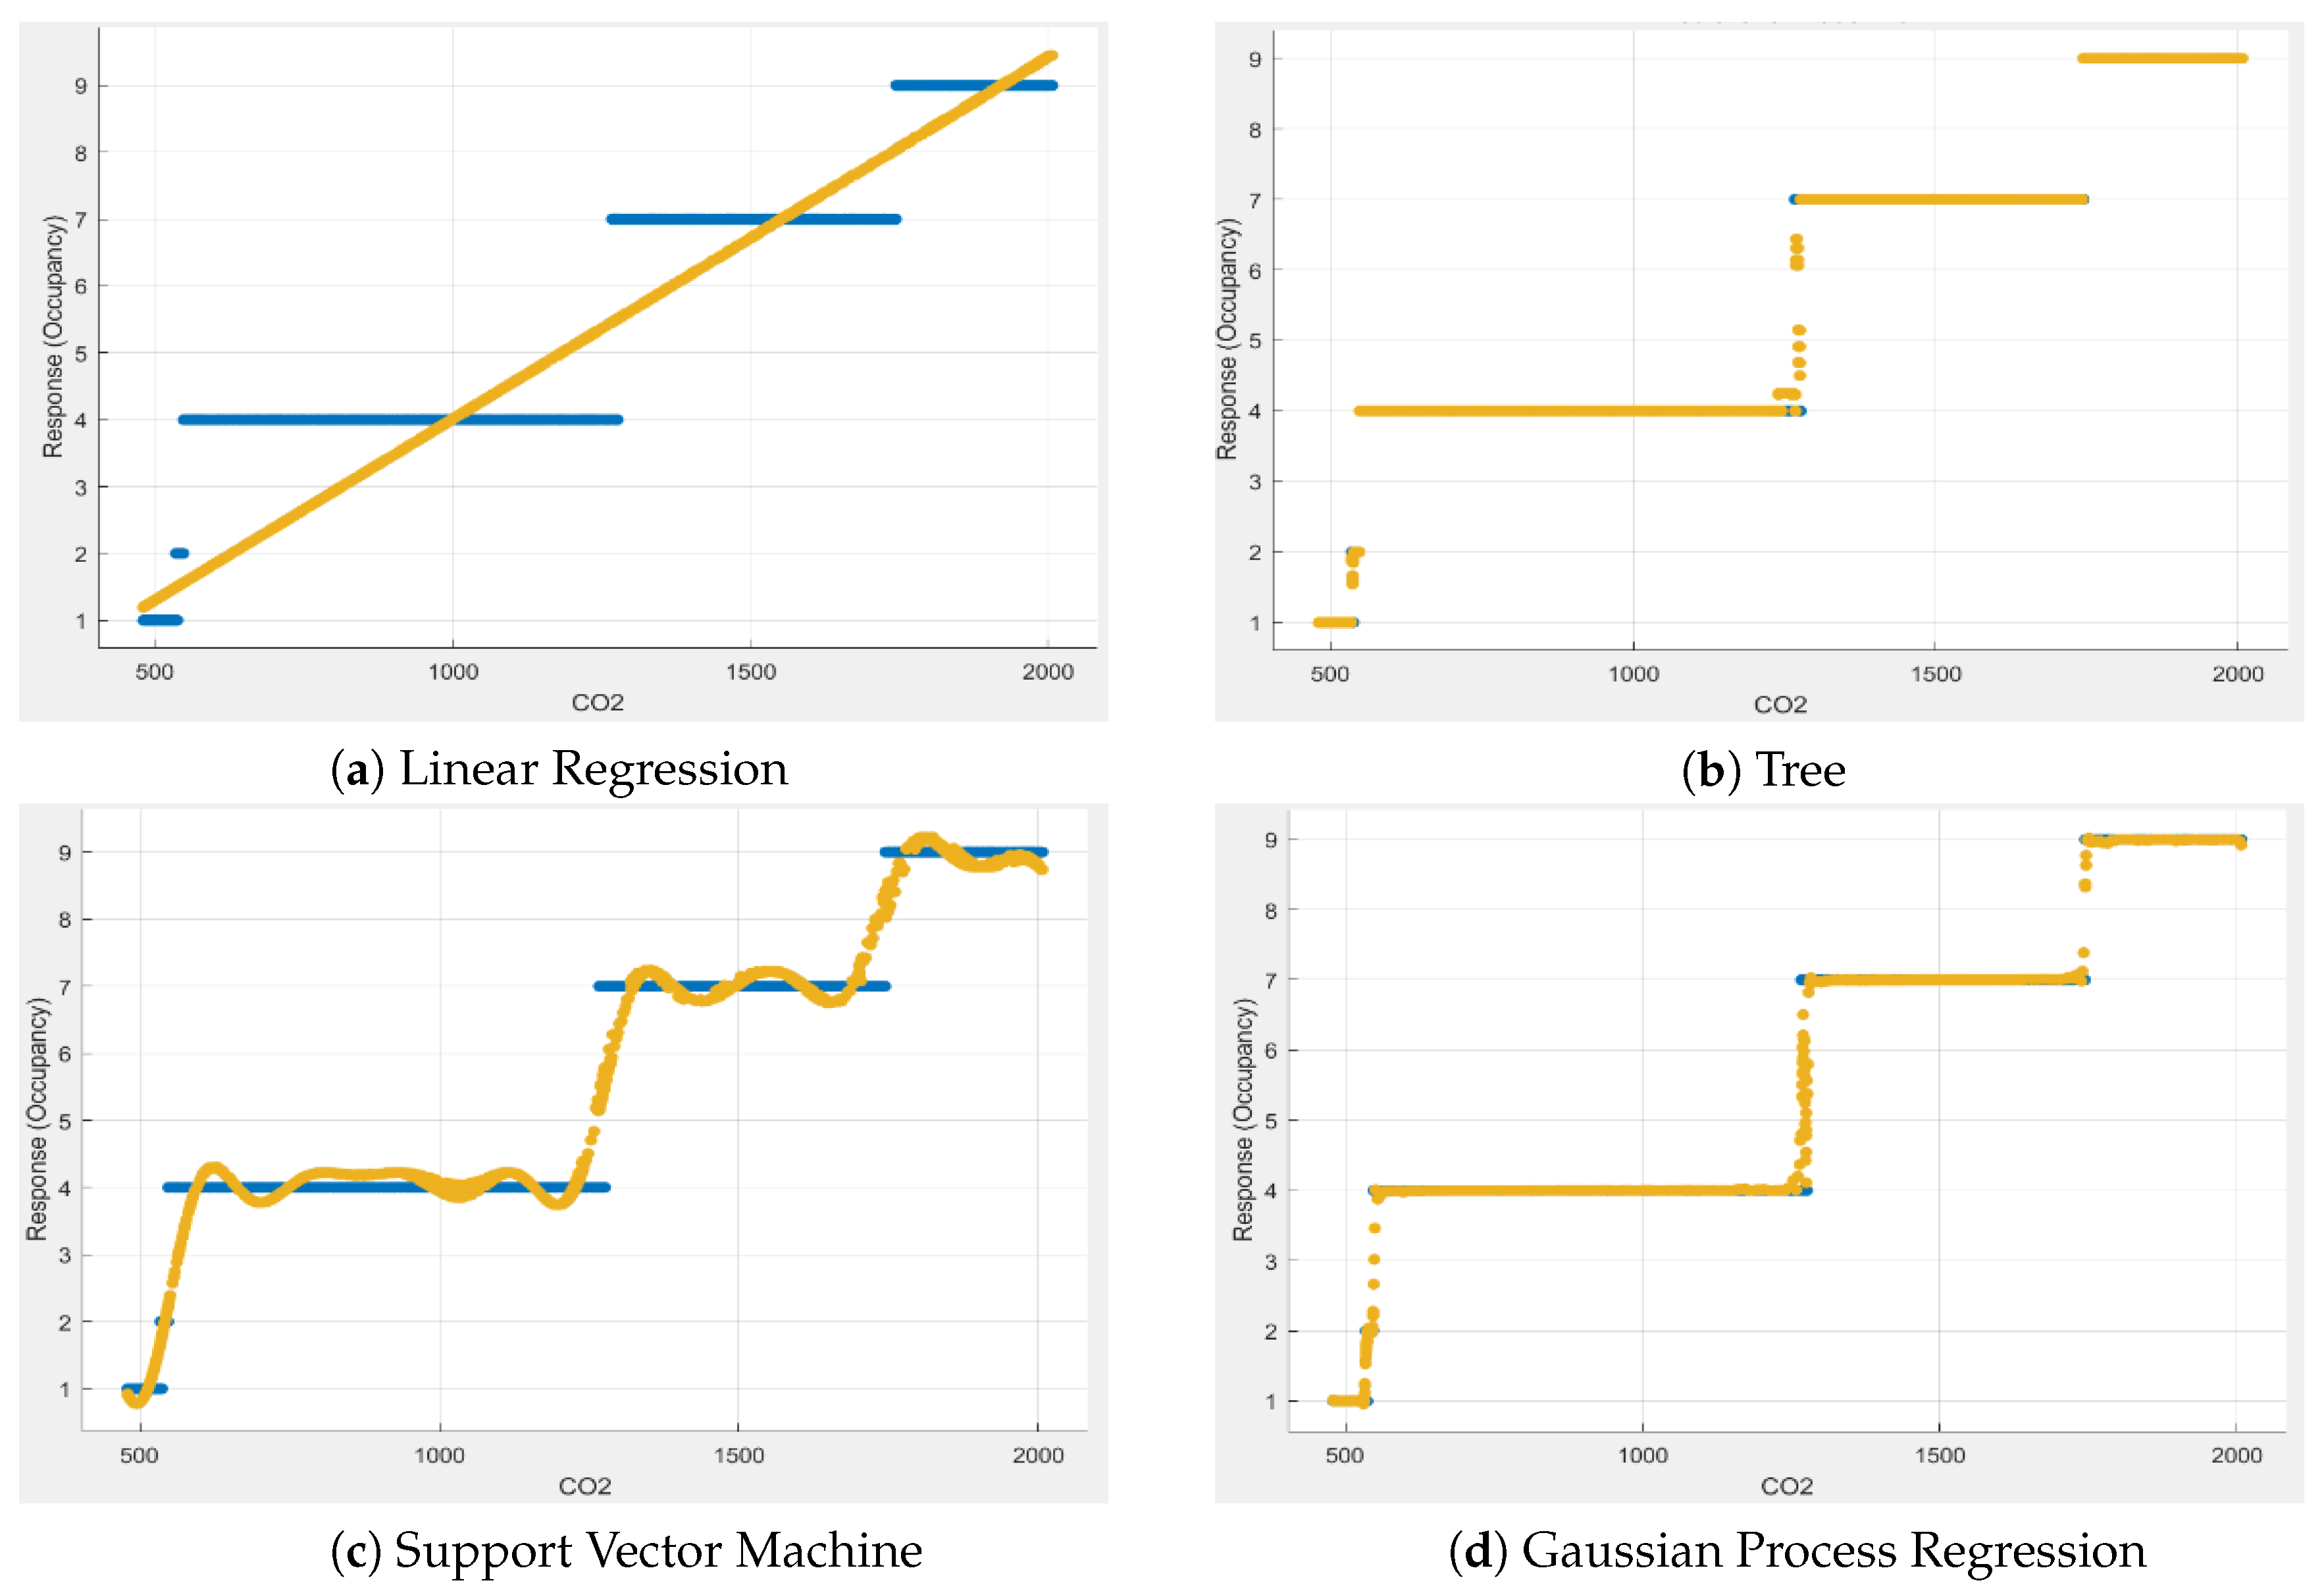
The dataset used in the training process is collected in a lab room. We turn off the air conditioner and keep the door closed unless people come in or go out. The space is relatively small, which can reduce the impact of time lag or other factors. Restricted by the experimental equipment and security rules, we do not cover special situations like fire. We try four machine learning algorithms in the training process. The aforementioned data are used in model training. As the concentration of CO are impacted by the specific room condition, which in turn affect the acquired human occupancy model, so the parameters may alter according to different datasets. In this paper, we do not focus on optimizing the parameters of the model, so we give some possible solutions. We use Matlab to have a quick comparison of models trained by 4 groups of machine learning algorithms, they are Linear Regression (LR), Tree, Support Vector Machine (SVM) and Gaussian Process Regression (GPR). Several evaluation results are presented in Table 4, including Root Mean Square Error (RMSE), Coefficient of determination (R2), Mean Square Error (MSE) and Mean Absolute Error (MAE). Figure 6 gives the response chart of the corresponding algorithms.
Take the model got by LR as an example, the correlation between CO concentration and occupants is formulated by,
where y denotes the number of persons, x is the CO concentration (in ).
Generally, the concentration of toxic gas like CO is extremely low in the air. However, when there is a fire, CO concentration will increase dramatically because of incomplete combustion. We classify the safety levels into three levels, 0 (normal), 1 (warning) and 2 (serious warning). If CO concentration is below (part per million) and CO is less than (part per billion), it is in a normal safe state. If CO concentration exceeds , potential fire may occur, the state changes to warning level 1. If CO has higher concentration, room state will be set to dangerous level 2. Details of the prediction model is shown in Algorithm 2.
| Algorithm 2 Prediction() |
| Input: CO, CO concentration |
| Output: and |
| 1: if CO <= 2000 and CO <= 50 then |
| 2: = 0 |
| 3: else |
| 4: if CO <= 2000 and CO <= 50 then |
| 5: = 1 |
| 6: end if |
| 7: else |
| 8: = 2 |
| 9: end if |
| 10: = −1.3951 + 0.0054 CO |
3. Simulation Results
In this section, we simulate the WSN application of occupancy counting and emergency control in the modified iFogSim. Firstly, we describe the application model of the specific scenario. Then simulation settings and parameters are given in detail. At last, we analyze and discuss the simulation results.
3.1. Application Model
The application consists of three modules which perform processing—Coordinator, Data Analytics and Model Training. The functions of these modules are stated as follows:
Coordinator: Coordinator module interfaces with sensors and receives raw CO and CO data. Its main function is to check the received signal values for any discrepancy and those inconsistent data will be discarded. Checked data will be sent to the Data Analytics module to get the evaluation of current state including the prediction of occupancy and safety level. After receiving the predict state, it sends the value to the actuator Display.
Data Analytics: The data analytics module is the core computing center, which is responsible for determining the state of a room from the sensed CO and CO values and calculating the number of people. This module informs the Coordinator module about the predict safety level and occupancy so that the state of a room on the display can be updated.
Model Training: At this stage, different machine learning algorithms are implemented to find models, that can be used to describe the relationship between concentration of CO and human occupancy.
The simulation is carried out in computing environment using Eclipse, Windows 10. As the iFogSim is an open source toolkit, we firstly create a Java project and import the package. Then we define and configure entities such as sensors, gateways, fog devices, cloud virtual machines and the connected links. The defined tuples are specified in Table 5. Entities described by CPU and RAM are given in Table 6. The transmit rate depicted as average inter-arrival time is set by transmitDistribution. We also model the application with AppModule, AppEdge, and Apploop. An edge denotes a link between two entities. Latencies required to connect the links are specified in Table 7, and Table 8 shows the configuration of sensors.
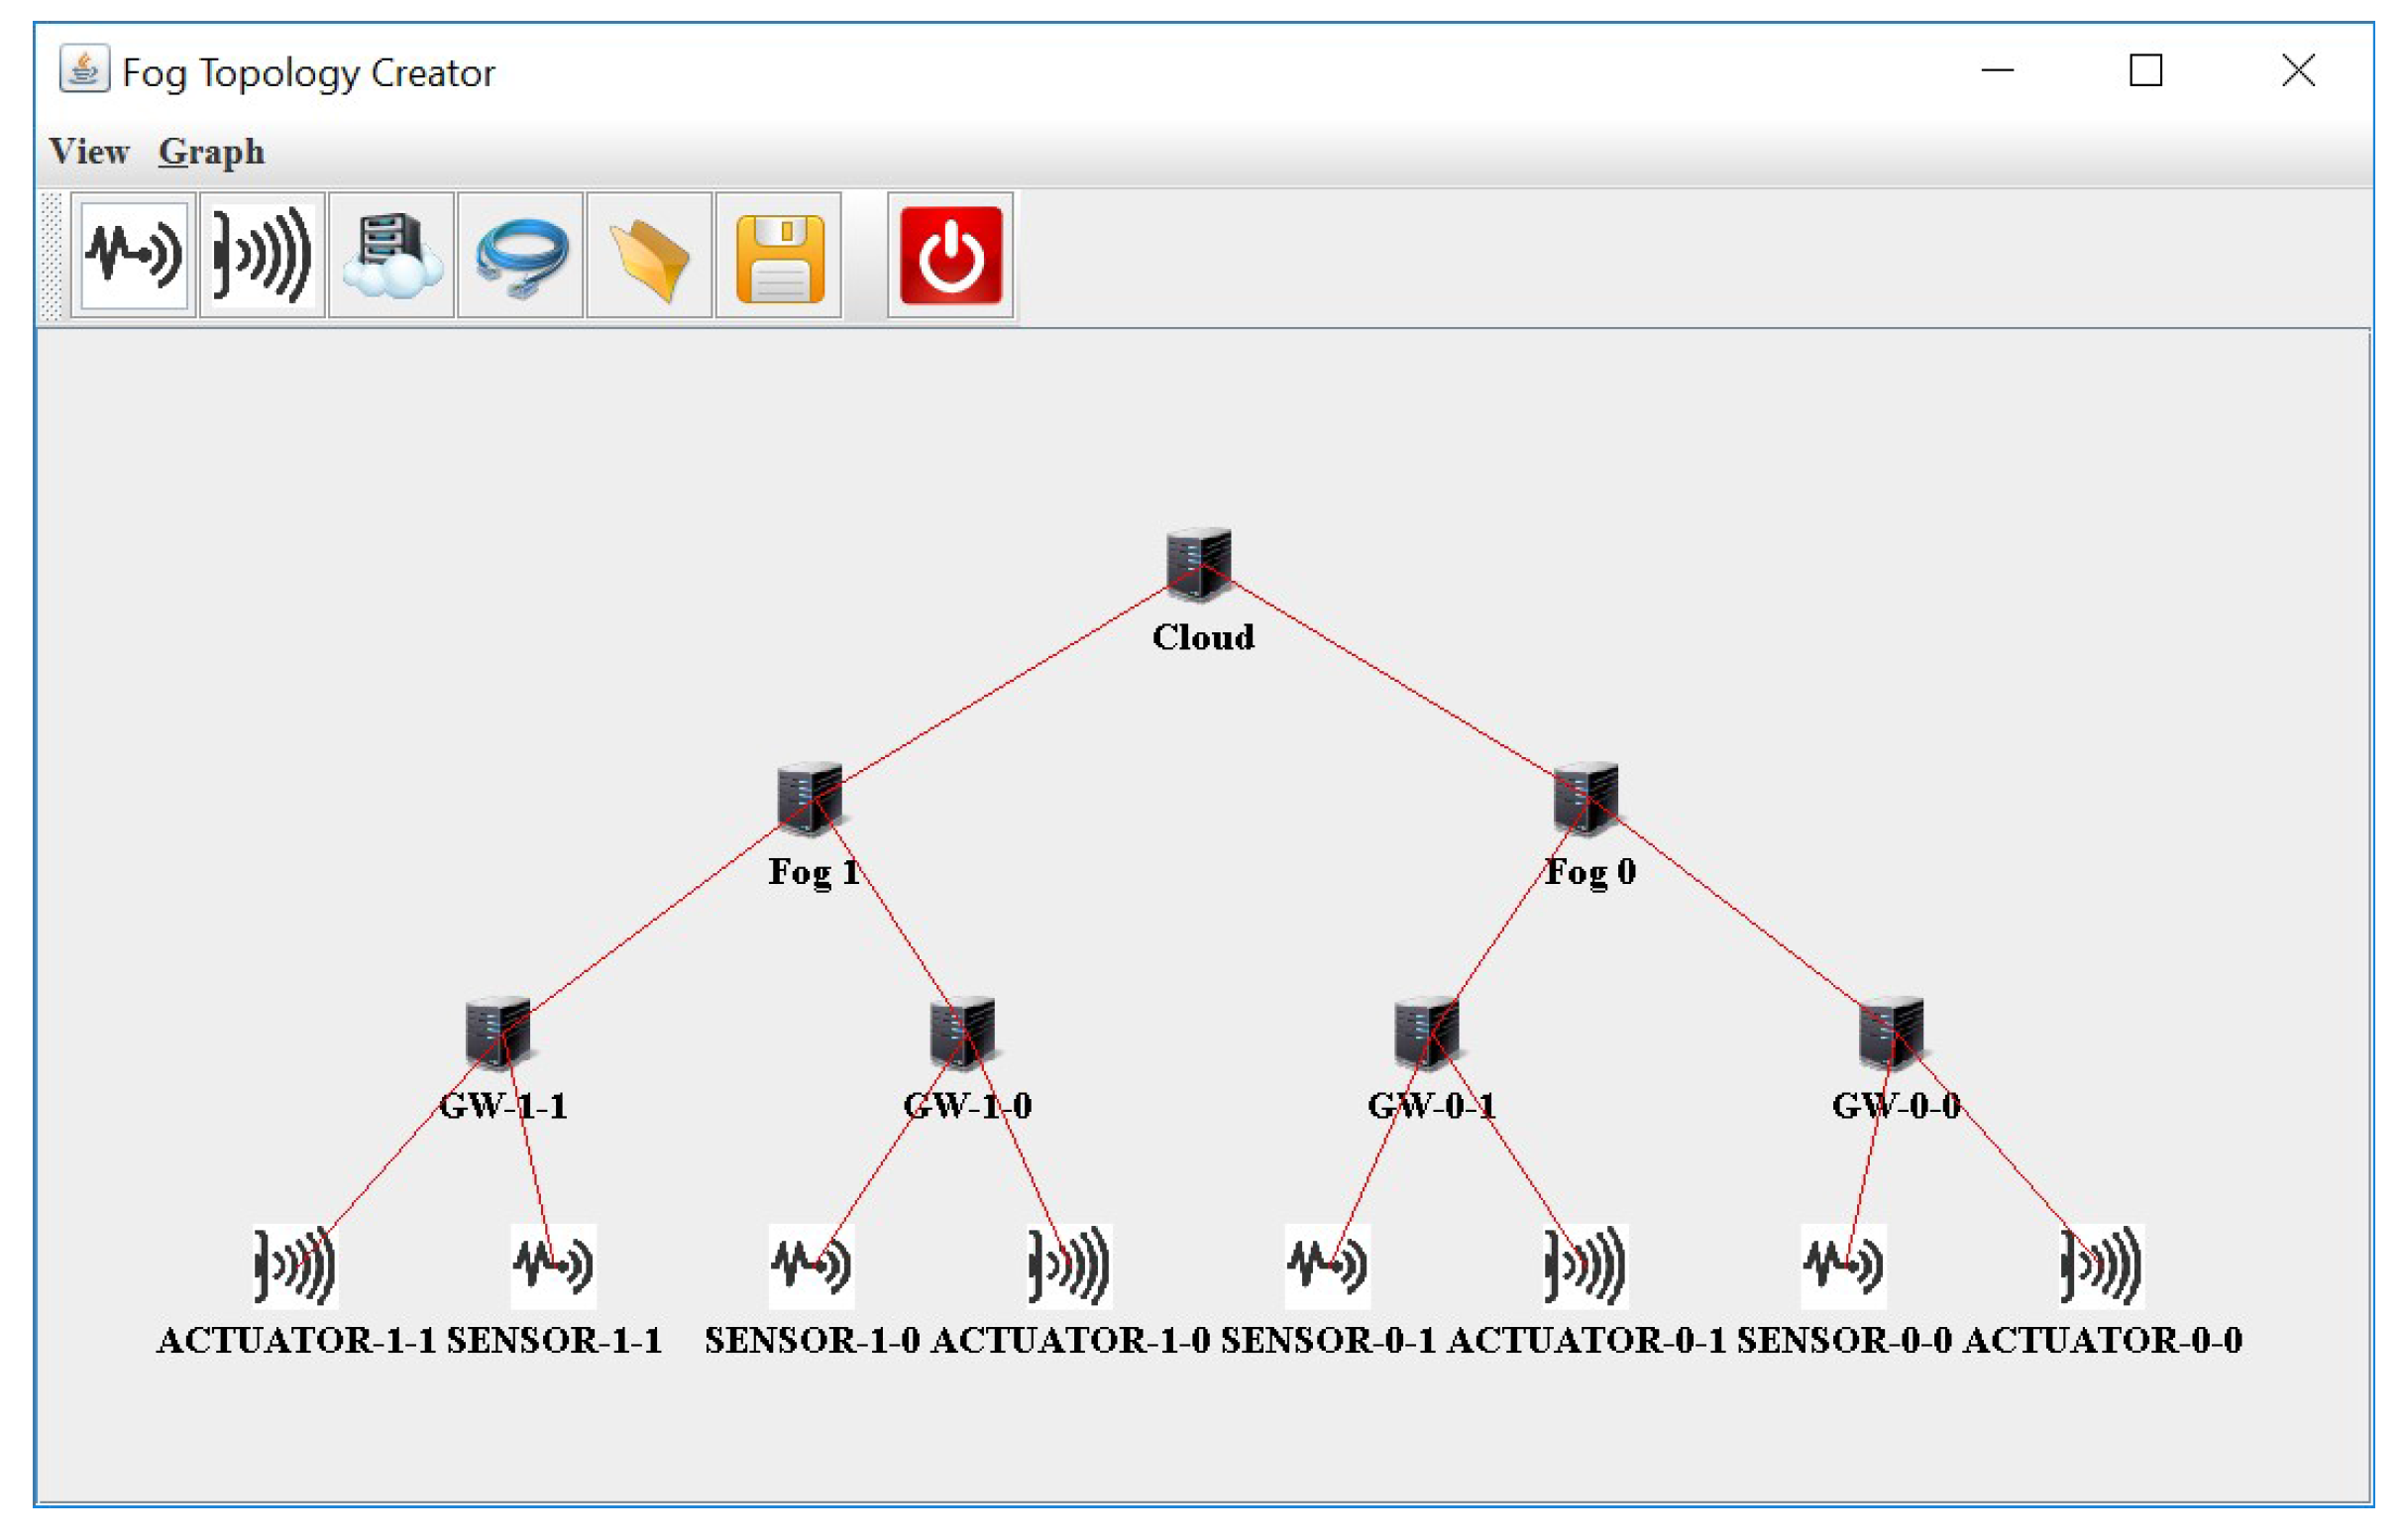
Figure 7 displays the network topology of the designed system. The tree topology has four levels. The Cloud is responsible for data storage and model training, while the Fog is used to analyse real time data and to give estimation of current states. Data from sensors and analysis results to actuator are transmitted through Gateway nodes. In this paper, real-time packet changing or packet loss during communications on the Internet are not considered.
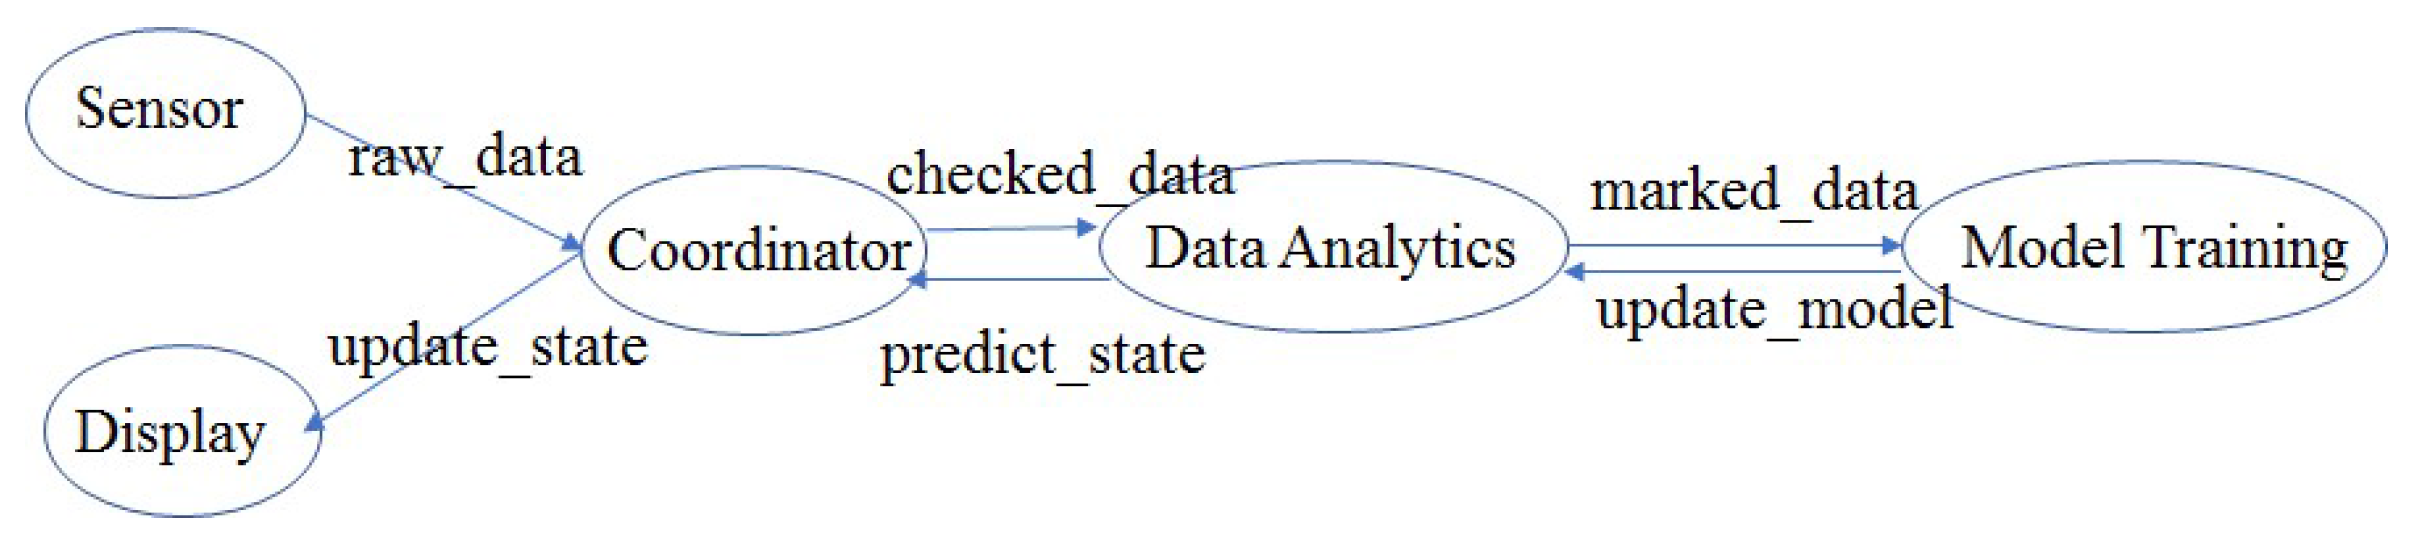
Figure 8 also represents data flows among different modules. demonstrates CO and CO concentration collected by sensors from different locations. Those raw data are firstly sent to coordinator for preprocessing and then the coordinator outputs which does not contain abnormal data value. After data analysis, on one hand, checked data will be attached with predict state as and transmitted to remote Cloud for storage or model training. On the other hand, which consists of safety level and occupancy information will be sent back to coordinator and display. carries the data analysis model which are used for prediction. But it is unnecessary to update the model too frequently as we assumed that the gas concentration of a regular room has its own pattern and may not change greatly during a few days.
3.2. Parameters Setting
Table 5 shows parameters mentioned above, including , , , , and . It is noted that we do not involve and we use a constant model currently. CPU length in Million Instructions Per Second (MIPS) of a Tuple denotes the CPU cost for processing it. Network length of a Tuple means the network cost for transmitting it. The processing time of a Tuple on a fog device is defined by,
where is the CPU capacity of fog device represents the CPU cost of Tuple j. The transmission time of a tuple from a fog device is calculated by,
where is the bandwidth of fog device represents the network cost of Tuple j.
Table 6 gives configurations of fog devices. There are three types of devices including coordinator, data analytics and Cloud. They have attributes including CPU, RAM and POWER. According to [25], the CPU, and ram of Cloud VM is given as and , respectively. The maximum and static powers are set as and , correspondingly. The fog device, data analytics, have the same configuration. Coordinator is configured with less computing capacity and power. In ifogSim, computing power is described by MIPS. The correlation between GHz and MIPS also relates to clock cycles per second. According to [28], the fog devices are allocated with at and at . The transmission speed is set to downstream and upstream. Table 7 shows the description of network links used to build the communications between source devices and destinations, where the latency time is specified. Notice that the latency of connecting with the Cloud is much larger. Table 8 shows the parameters of sensors. Inter-arrival time represents the time interval to send/collect sensor data. Two types of sensors are configured with different inter-arrival time.
3.3. Results
Figure 9 depicts the input CO and CO concentration with output estimation of occupants and state. In this case, both CO and CO are under safe threshold from to They increase steadily from to which simulate an abnormal occasion (potential fire). By using the linear model (2), the output prediction of occupancy shows a similar trend as CO concentration. However, when abnormal events occur, the CO content is extremely high which may be less meaningful to use it for occupancy calculation. The state evaluation is more likely to depend on toxic gas, thresholds affect when to start warning.
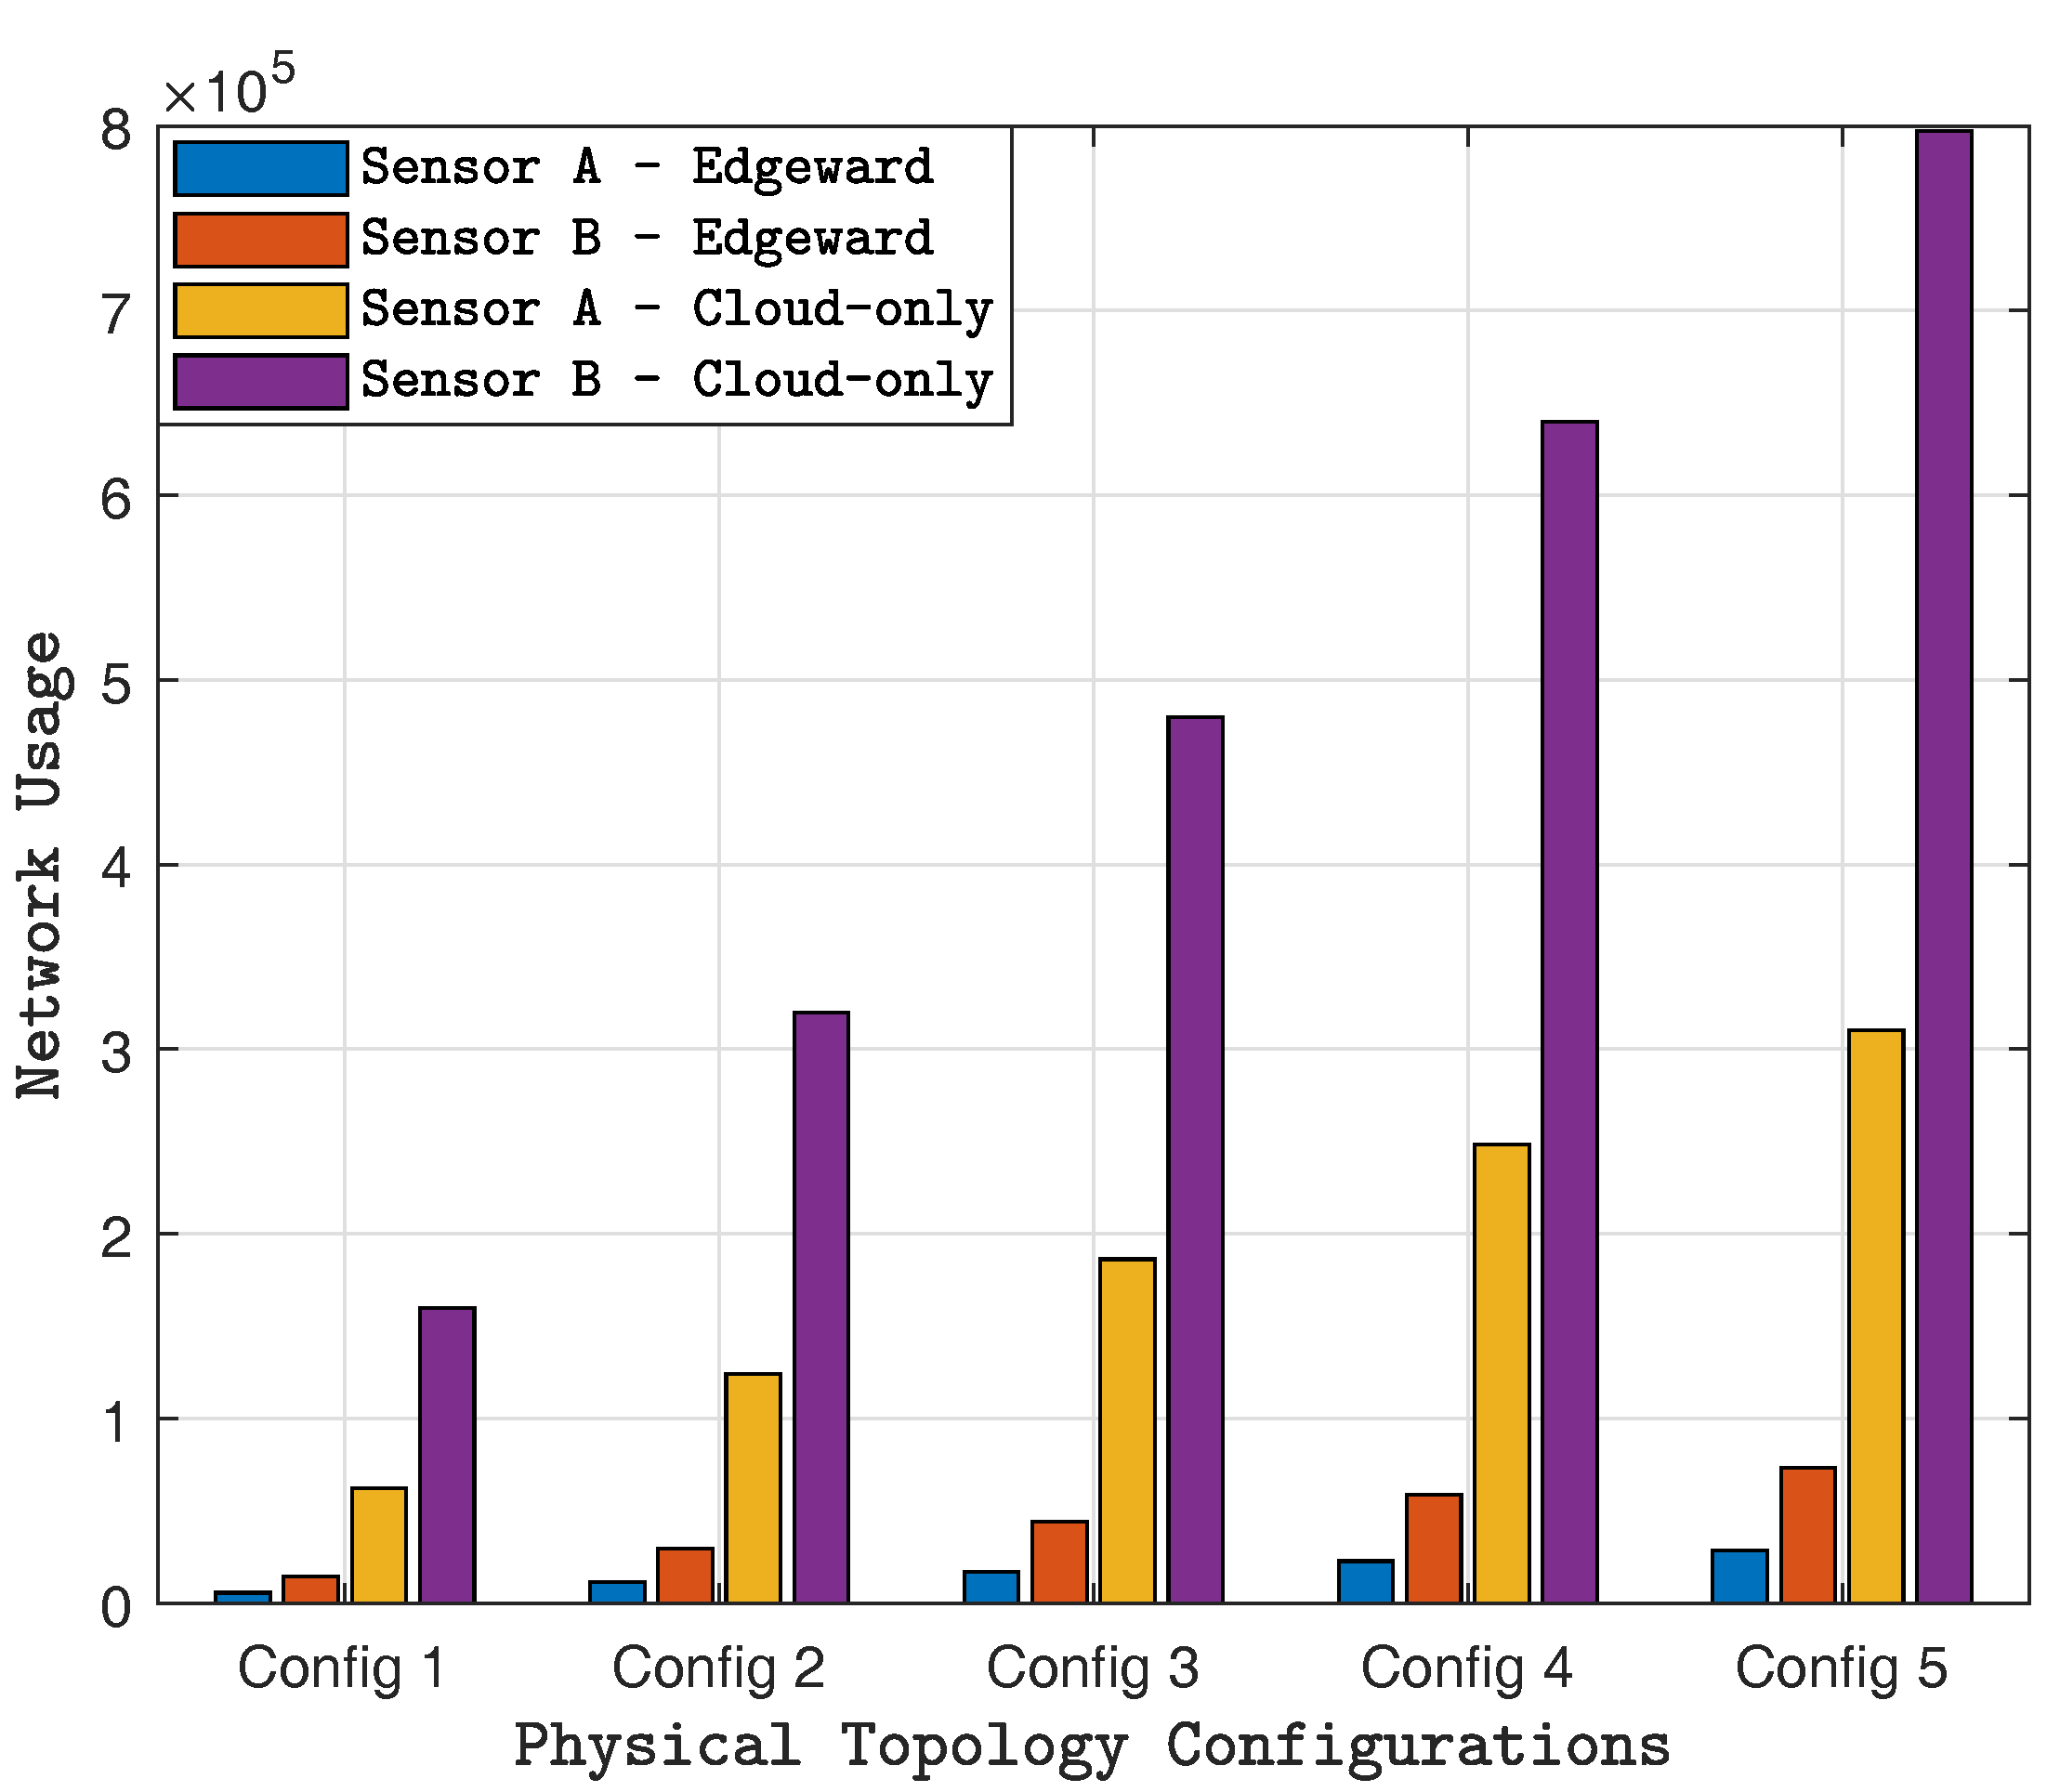
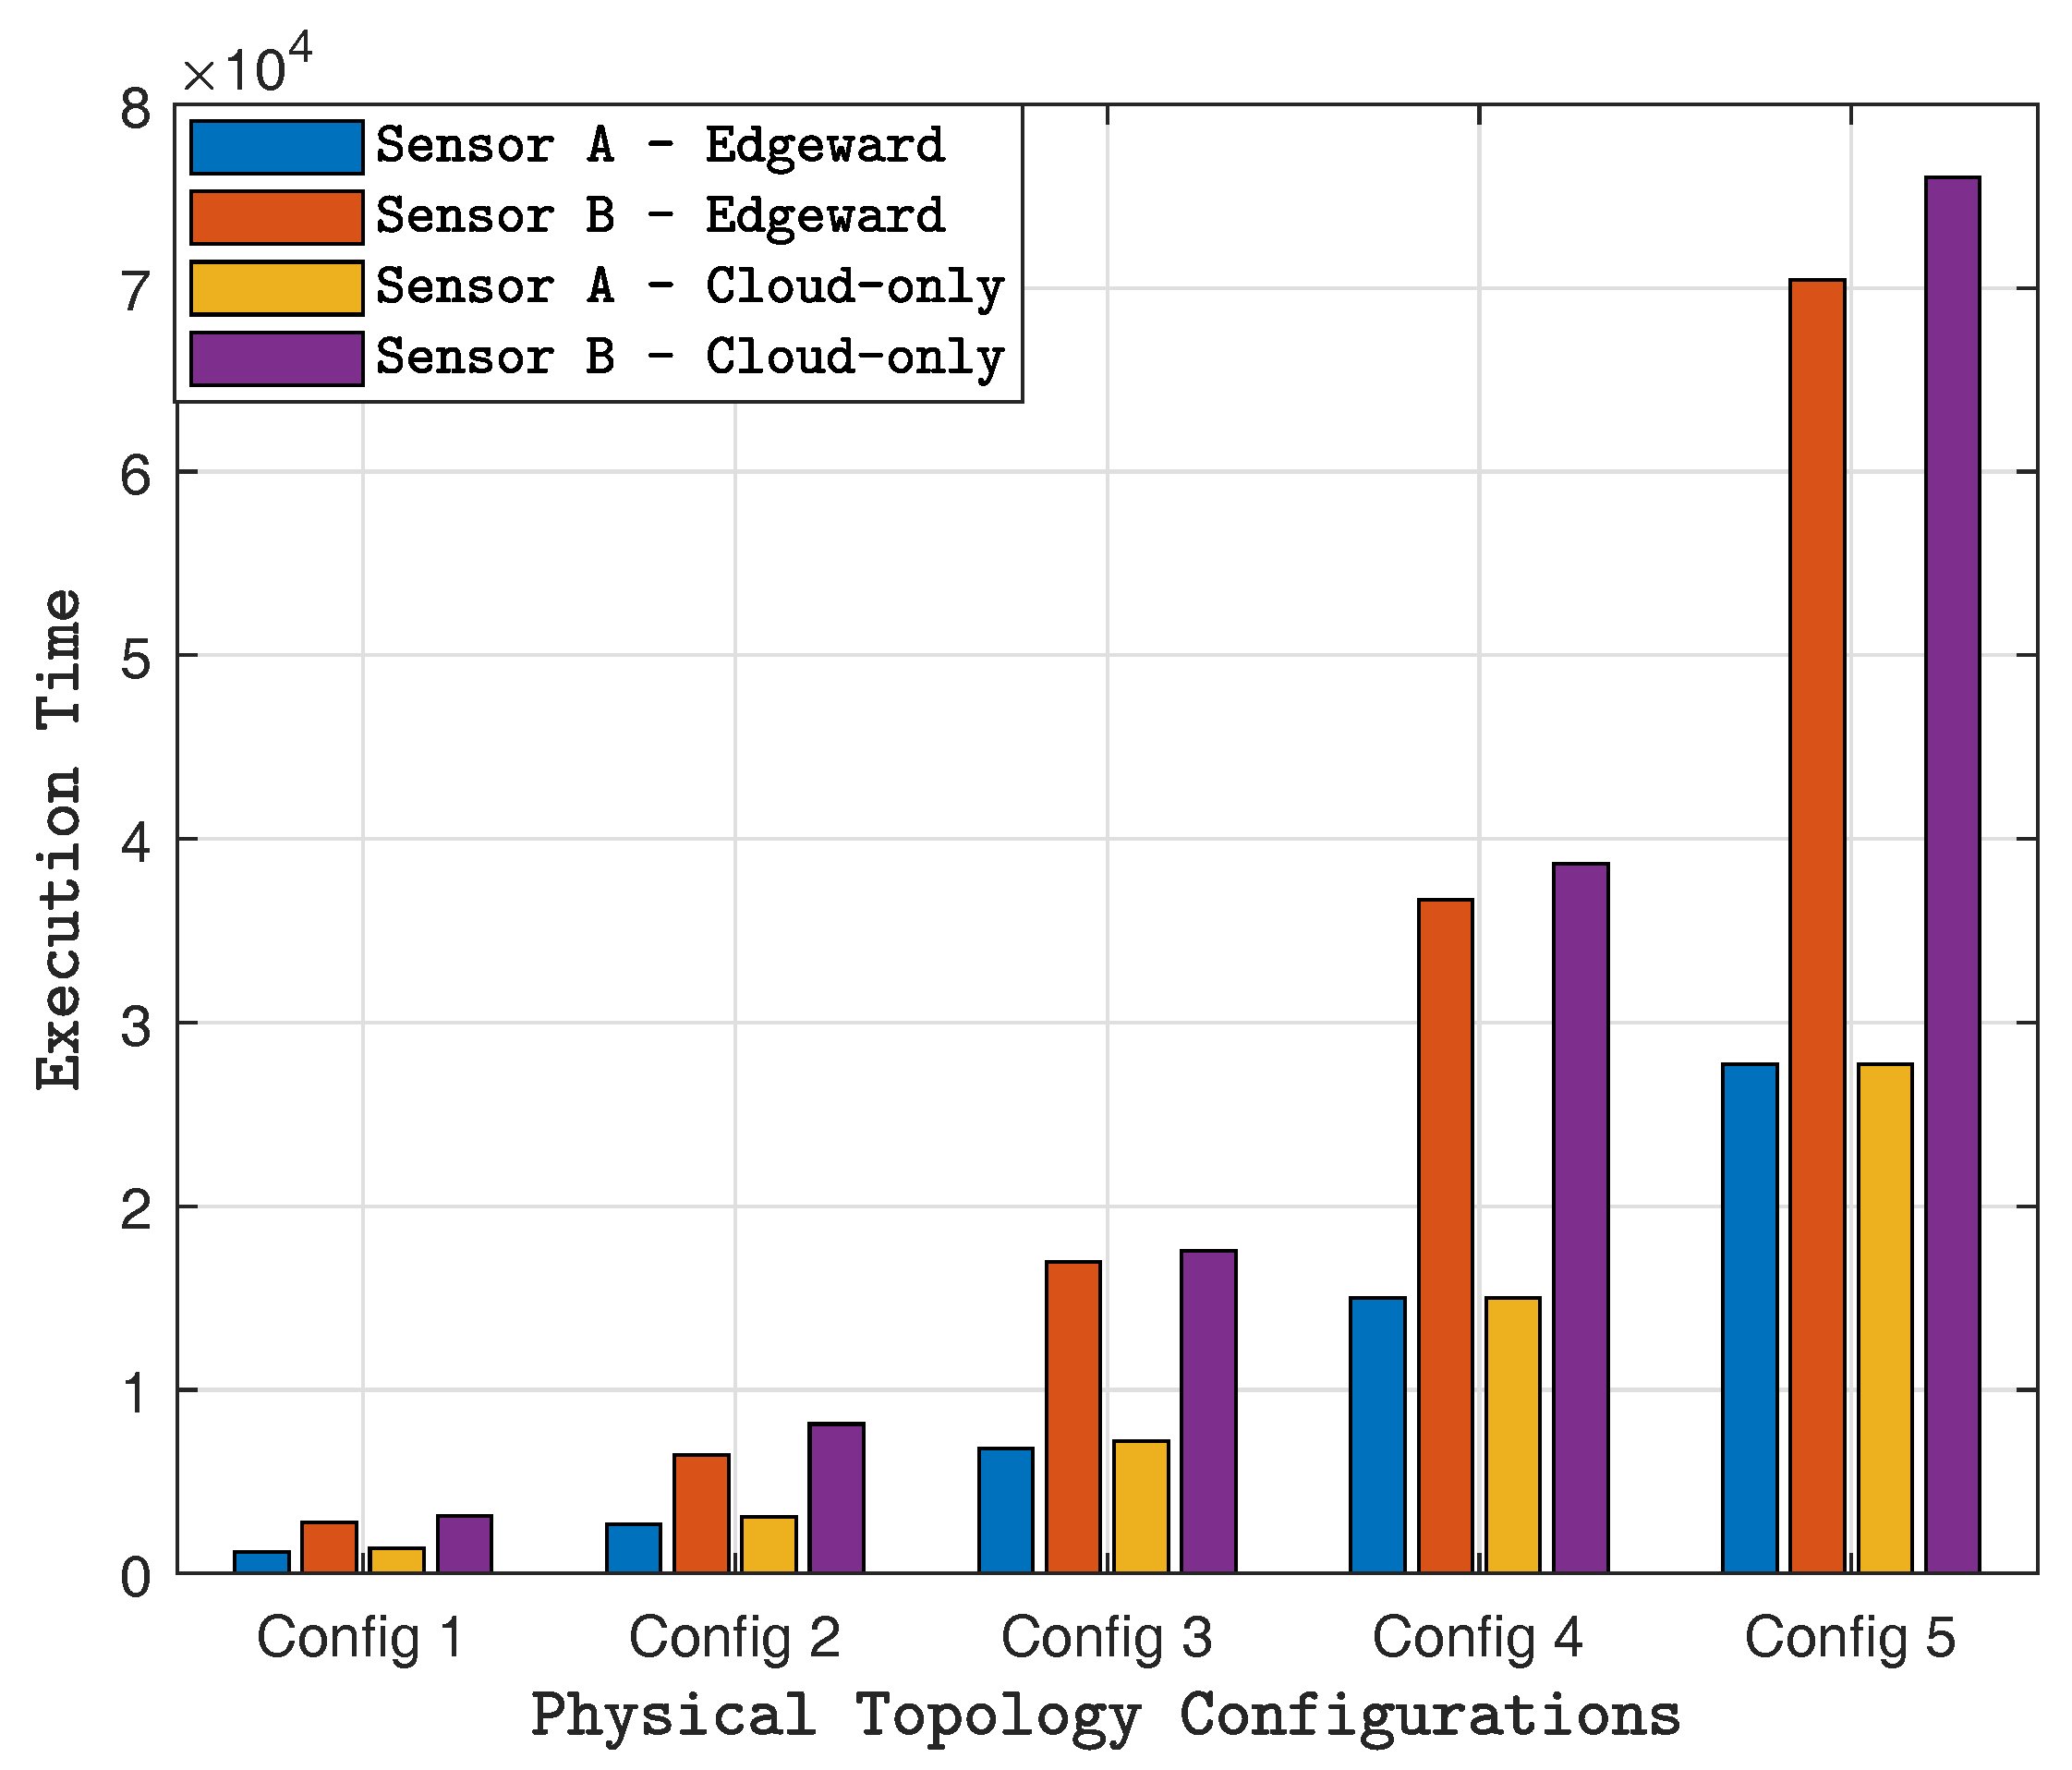
Moreover, five configurations of physical topology have been simulated - Config 1, Config 2, Config 3, Config 4, and Config 5—having 100, 200, 300, 400 and 500 sensors respectively. The transmission interval of Sensor A and B is and , respectively. The control loop is .
Figure 10 compares the average delay of different physical topology configurations. The delay measures the time spent to complete a control loop. It starts from when a Tuple is generated, and after intermediate processing, finally displaying results. Cloud-only configuration has longer delay than edge ward. This is mainly caused by network congestion and longer latency to link remote cloud.
Figure 11 shows the network usage of the five different topologies. All of them show an increase usage of network as the number of sensors increase. Cloud-only configurations requires more network because all the sensor data needs to be sent to the remote cloud which pass through more gateways. By contrast, edge ward mode can process data from nearest computing center which reduces the additional transmission. Figure 12 gives the energy consumption of Cloud, fog and coordinator devices in the application. Figure 13 presents the execution time of different topologies and input workload.
4. Conclusions
In this paper, we mainly focus on an application of WSNs, where carbon oxides gases are collected and analyzed. The concentration of CO is used to estimate human occupancy, as this is important for energy conservation. On emergency condition, the rough information about the number of humans can be useful for rescue. In addition, when potential fire occurs, the content of CO and CO changes significantly. The combined carbon oxides gases are monitored which is useful for emergency control before the fire spreads widely. We also improve iFogSim and simulate the system in the improved iFogSim. Compared with Cloud environment, application in Fog shows some merits, such as less latency, network usage and energy consumption. With respect to our future works, we will collect more data in different sizes of rooms with different numbers of people, and then try to use different methods to build a better model between the occupancy of people and CO, such as neural networks, deep learning, etc. Furthermore, other topologies will be taken into account when simulating the WSNs.
Acknowledgments
The authors are grateful for financial support from the research grants (1) ‘Nature-Inspired Computing and Metaheuristics Algorithms for Optimizing Data Mining Performance’ from the University of Macau (grant No. MYRG2016-00069-FST); (2) ’Building Sustainable Knowledge Networks through Online Communities’ from the University of Macau (grant No. MYRG2015-00024-FST); and (3) ‘A Scalable Data Stream Mining Methodology: Stream-based Holistic Analytics and Reasoning in Parallel‘, from FDCT, Macau government (grant No. FDCT/126/2014/A3).
Author Contributions
Kairong Duan and Simon Fong conceived and designed the experiments; Kairong Duan performed the experiments and wrote the paper; Yan Zhuang and Wei Song provided guidance for this paper and gave advice on system design.
Conflicts of Interest
The authors declare no conflict of interest.
References
- Gubbi, J.; Buyya, R.; Marusic, S.; Palaniswami, M. Internet of Things (IoT): A vision, architectural elements, and future directions. Future Gener. Comput. Syst. 2013, 29, 1645–1660. [Google Scholar] [CrossRef]
- Mell, P.; Grance, T. The NIST Definition of Cloud Computing. Available online: http://nvlpubs.nist.gov/nistpubs/Legacy/SP/nistspecialpublication800-145.pdf (accessed on 15 December 2017).
- Lim, J.; Yu, H.; Gil, J.M. An efficient and energy-aware cloud consolidation algorithm for multimedia big data applications. Symmetry 2017, 9, 184. [Google Scholar] [CrossRef]
- Dash, S.K.; Mohapatra, S.; Pattnaik, P.K. A survey on applications of wireless sensor network using cloud computing. Int. J. Comput. Sci. Emerg. Technol. 2010, 1, 50–55. [Google Scholar]
- Krishnappa, D.K.; Irwin, D.; Lyons, E.; Zink, M. CloudCast: Cloud computing for short-term weather forecasts. Comput. Sci. Eng. 2013, 15, 30–37. [Google Scholar] [CrossRef]
- Vemuri, S.R.; Satyanarayana, N.; Prasanna, V.L. Generic Integrated Secured WSN-Cloud Computing U-life care. Int. J. Adv. Sci. Eng. Inf. Technol. 2012, 2, 897–907. [Google Scholar]
- Chu, P.M.; Cho, S.; Fong, S.; Park, Y.W.; Cho, K. 3D Reconstruction Framework for Multiple Remote Robots on Cloud System. Symmetry 2017, 9, 55. [Google Scholar] [CrossRef]
- Kwon, D.; Park, S.; Ryu, J.T. A study on big data thinking of the internet of things-based smart-connected car in conjunction with controller area network bus and 4g-long term evolution. Symmetry 2017, 9, 152. [Google Scholar] [CrossRef]
- Bonomi, F.; Milito, R.; Zhu, J.; Addepalli, S. Fog computing and its role in the internet of things. In Proceedings of the First Edition of the MCC Workshop on Mobile cloud computing, Helsinki, Finland, 17 August 2012; pp. 13–16. [Google Scholar]
- Ruiz-Rosero, J.; Ramirez-Gonzalez, G.; Williams, J.M.; Liu, H.; Khanna, R.; Pisharody, G. Internet of Things: A Scientometric Review. Symmetry 2017, 9, 301. [Google Scholar] [CrossRef]
- Pooranian, Z.; Shojafar, M.; Naranjo, P.G.V.; Chiaraviglio, L.; Conti, M. A Novel Distributed Fog-Based Networked Architecture to Preserve Energy in Fog Data Centers. In Proceedings of the 2017 IEEE 14th International Conference on Mobile Ad Hoc and Sensor Systems (MASS), Orlando, FL, USA, 1 October 2017; pp. 22–25. [Google Scholar]
- Shojafar, M.; Cordeschi, N.; Baccarelli, E. Energy-efficient adaptive resource management for real-time vehicular cloud services. IEEE Trans.Cloud Comput. 2016. [Google Scholar] [CrossRef]
- Naranjo, P.G.V.; Pooranian, Z.; Shojafar, M.; Conti, M.; Buyya, R. FOCAN: A Fog-supported Smart City Network Architecture for Management of Applications in the Internet of Everything Environments. arXiv 2017. preprint arXiv:1710.01801. [Google Scholar]
- Rawat, P.; Singh, K.D.; Chaouchi, H.; Bonnin, J. Wireless sensor networks: A survey on recent developments and potential synergies. J. Supercomput. 2014, 68, 1–48. [Google Scholar] [CrossRef]
- Howard, J.; Hoff, W. Forecasting building occupancy using sensor network data. In Proceedings of the 2nd International Workshop on Big Data, Streams and Heterogeneous Source Mining: Algorithms, Systems, Programming Models and Applications, Chicago, IL, USA, 11 August 2013; pp. 87–94. [Google Scholar]
- Dodier, R.H.; Henze, G.P.; Tiller, D.K.; Guo, X. Building occupancy detection through sensor belief networks. Energy Build. 2006, 38, 1033–1043. [Google Scholar] [CrossRef]
- Arief-Ang, I.B.; Salim, F.D.; Hamilton, M. CD-HOC: Indoor Human Occupancy Counting using Carbon Dioxide Sensor Data. arXiv 2017. preprint arXiv:1706.05286. [Google Scholar]
- Jiang, C.; Masood, M.K.; Soh, Y.C.; Li, H. Indoor occupancy estimation from carbon dioxide concentration. Energy Build. 2016, 131, 132–141. [Google Scholar] [CrossRef]
- Ansanay-Alex, G. Estimating occupancy using indoor carbon dioxide concentrations only in an office building: A method and qualitative assessment. In Proceedings of the REHVA World Cong. Energy Efficient, Smart and Healthy Building (CLIMA), Prague, Czech Republic, 16–19 June 2013; pp. 1–8. [Google Scholar]
- Basu, C.; Koehler, C.; Das, K.; Dey, A.K. PerCCS: Person-count from carbon dioxide using sparse non-negative matrix factorization. In Proceedings of the 2015 ACM International Joint Conference on Pervasive and Ubiquitous Computing, Osaka, Japan, 7–11 September 2015; pp. 987–998. [Google Scholar]
- Hailemariam, E.; Goldstein, R.; Attar, R.; Khan, A. Real-time occupancy detection using decision trees with multiple sensor types. In Proceedings of the 2011 Symposium on Simulation for Architecture and Urban Design, Boston, MA, USA, 3–7 April 2011; pp. 141–148. [Google Scholar]
- Ang, I.B.A.; Salim, F.D.; Hamilton, M. Human occupancy recognition with multivariate ambient sensors. In Proceedings of the Pervasive Computing and Communication Workshops (PerCom Workshops), Sydney, Australia, 14–18 March 2016; pp. 1–6. [Google Scholar]
- Dedesko, S.; Stephens, B.; Gilbert, J.A.; Siegel, J.A. Methods to assess human occupancy and occupant activity in hospital patient rooms. Build. Environ. 2015, 90, 136–145. [Google Scholar] [CrossRef]
- Data Analytics and Collaborative Computing (DACC) Laboratory. Available online: http://www.cis.umac.mo/labs.php?id=dacc (accessed on 13 March 2018).
- Gupta, H.; Vahid Dastjerdi, A.; Ghosh, S.K.; Buyya, R. iFogSim: A toolkit for modeling and simulation of resource management techniques in the Internet of Things. Softw. Pract. Exp. 2017, 47, 1275–1296. [Google Scholar] [CrossRef]
- Jin, M.; Bekiaris-Liberis, N.; Weekly, K.; Spanos, C.; Bayen, A. Sensing by proxy: Occupancy detection based on indoor CO2 concentration. In Proceedings of the Ninth International Conference on Mobile Ubiquitous Computing, Systems, Services and Technologies, Nice, France, 19–24 July 2015; p. 14. [Google Scholar]
- SenseAir S8-CO2Meter Documentation Site. Available online: http://www.co2meters.com/Documentation/Datasheets/DS-S8-3.2.pdf (accessed on 15 December 2017).
- Instructions per Second. Available online: https://en.wikipedia.org/wiki/Instructions_per_second (accessed on 15 December 2017).
Figure 1.
Wireless Sensor Network.
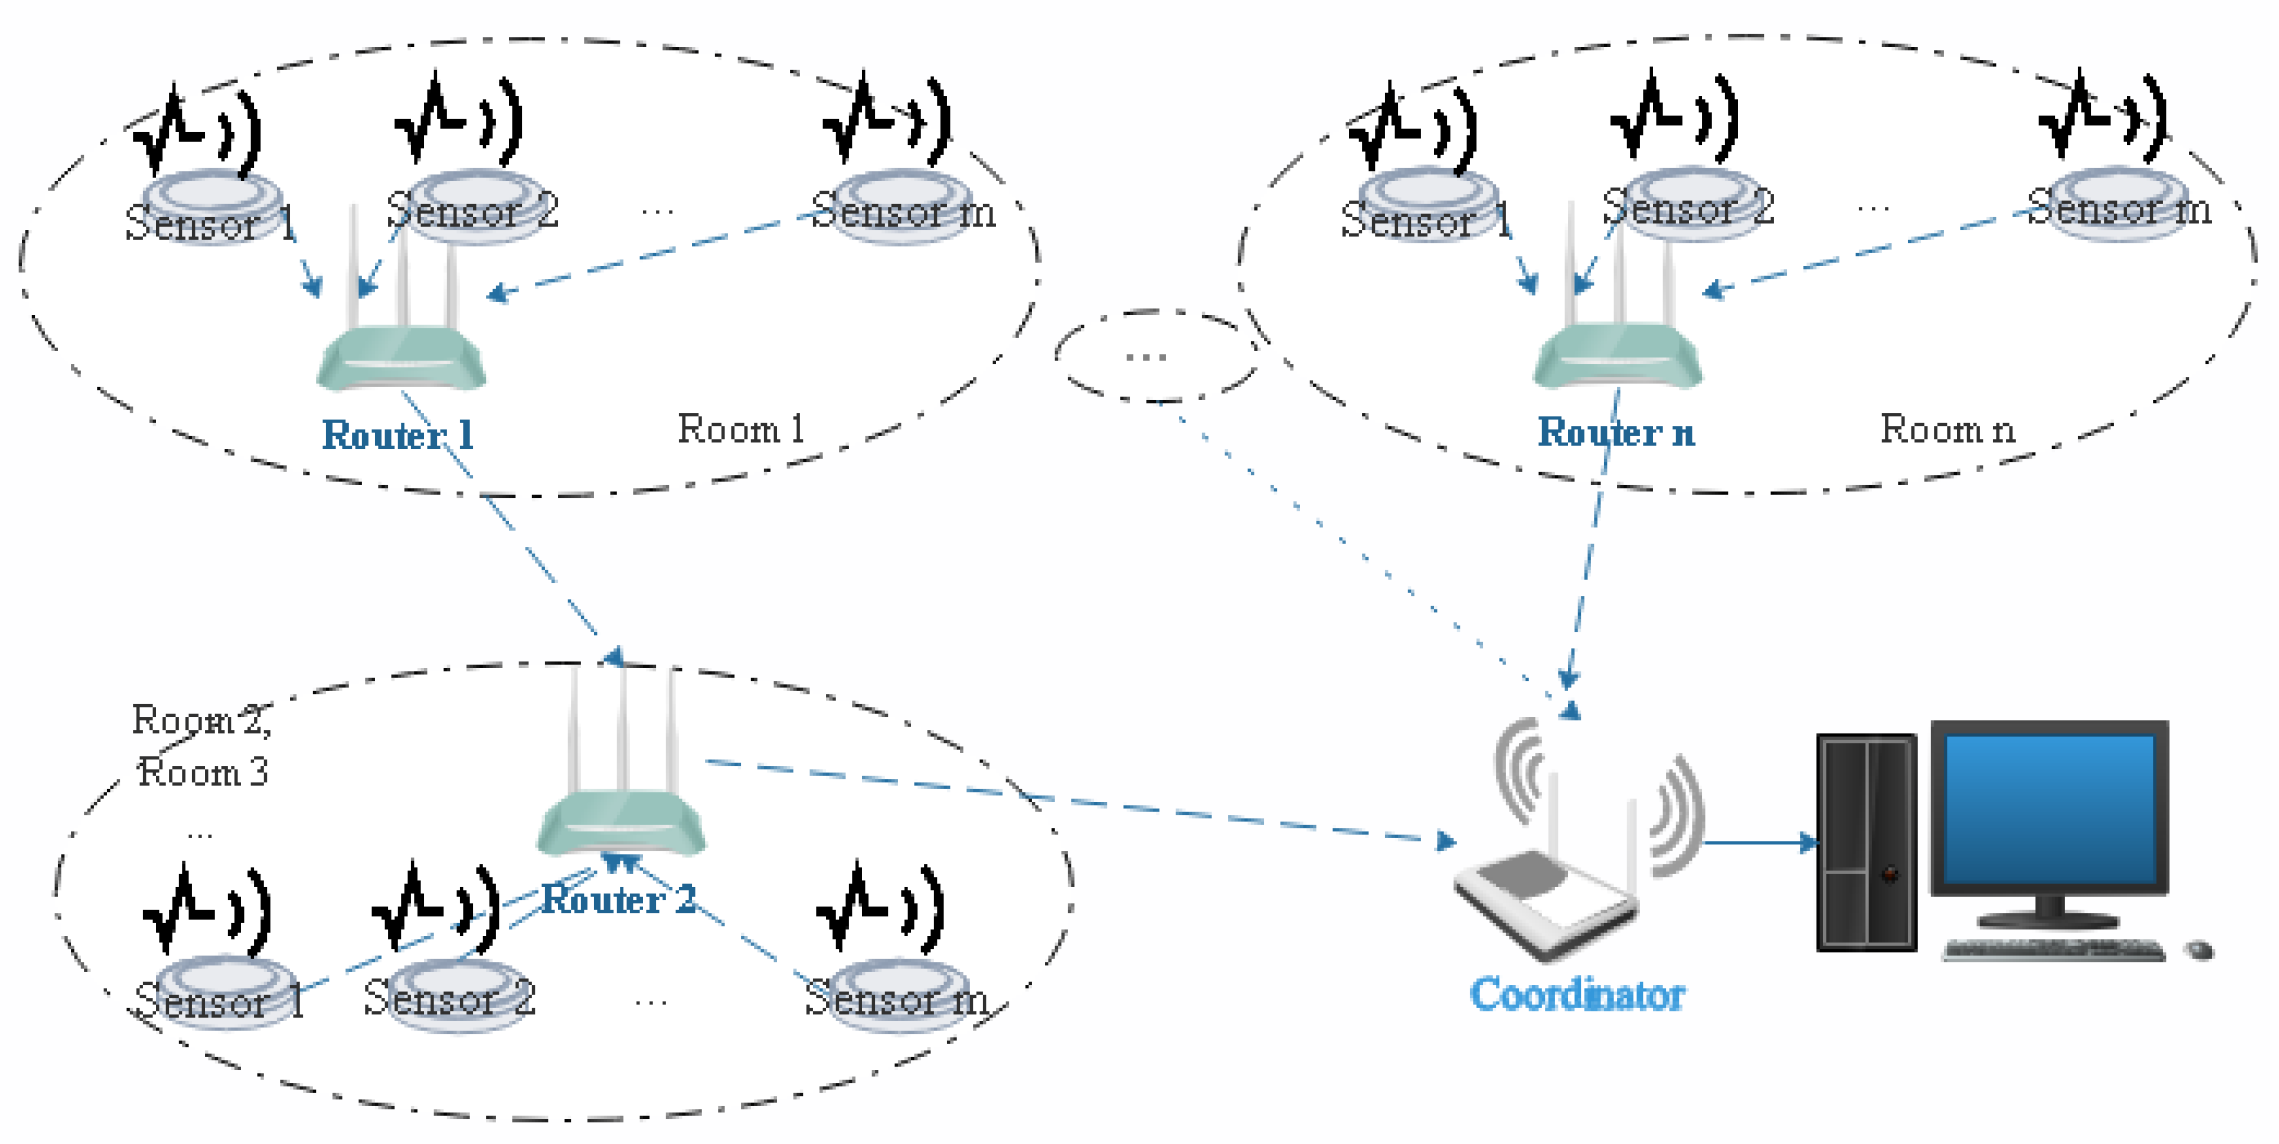
Figure 2.
A typical room equipped with sensor network devices.
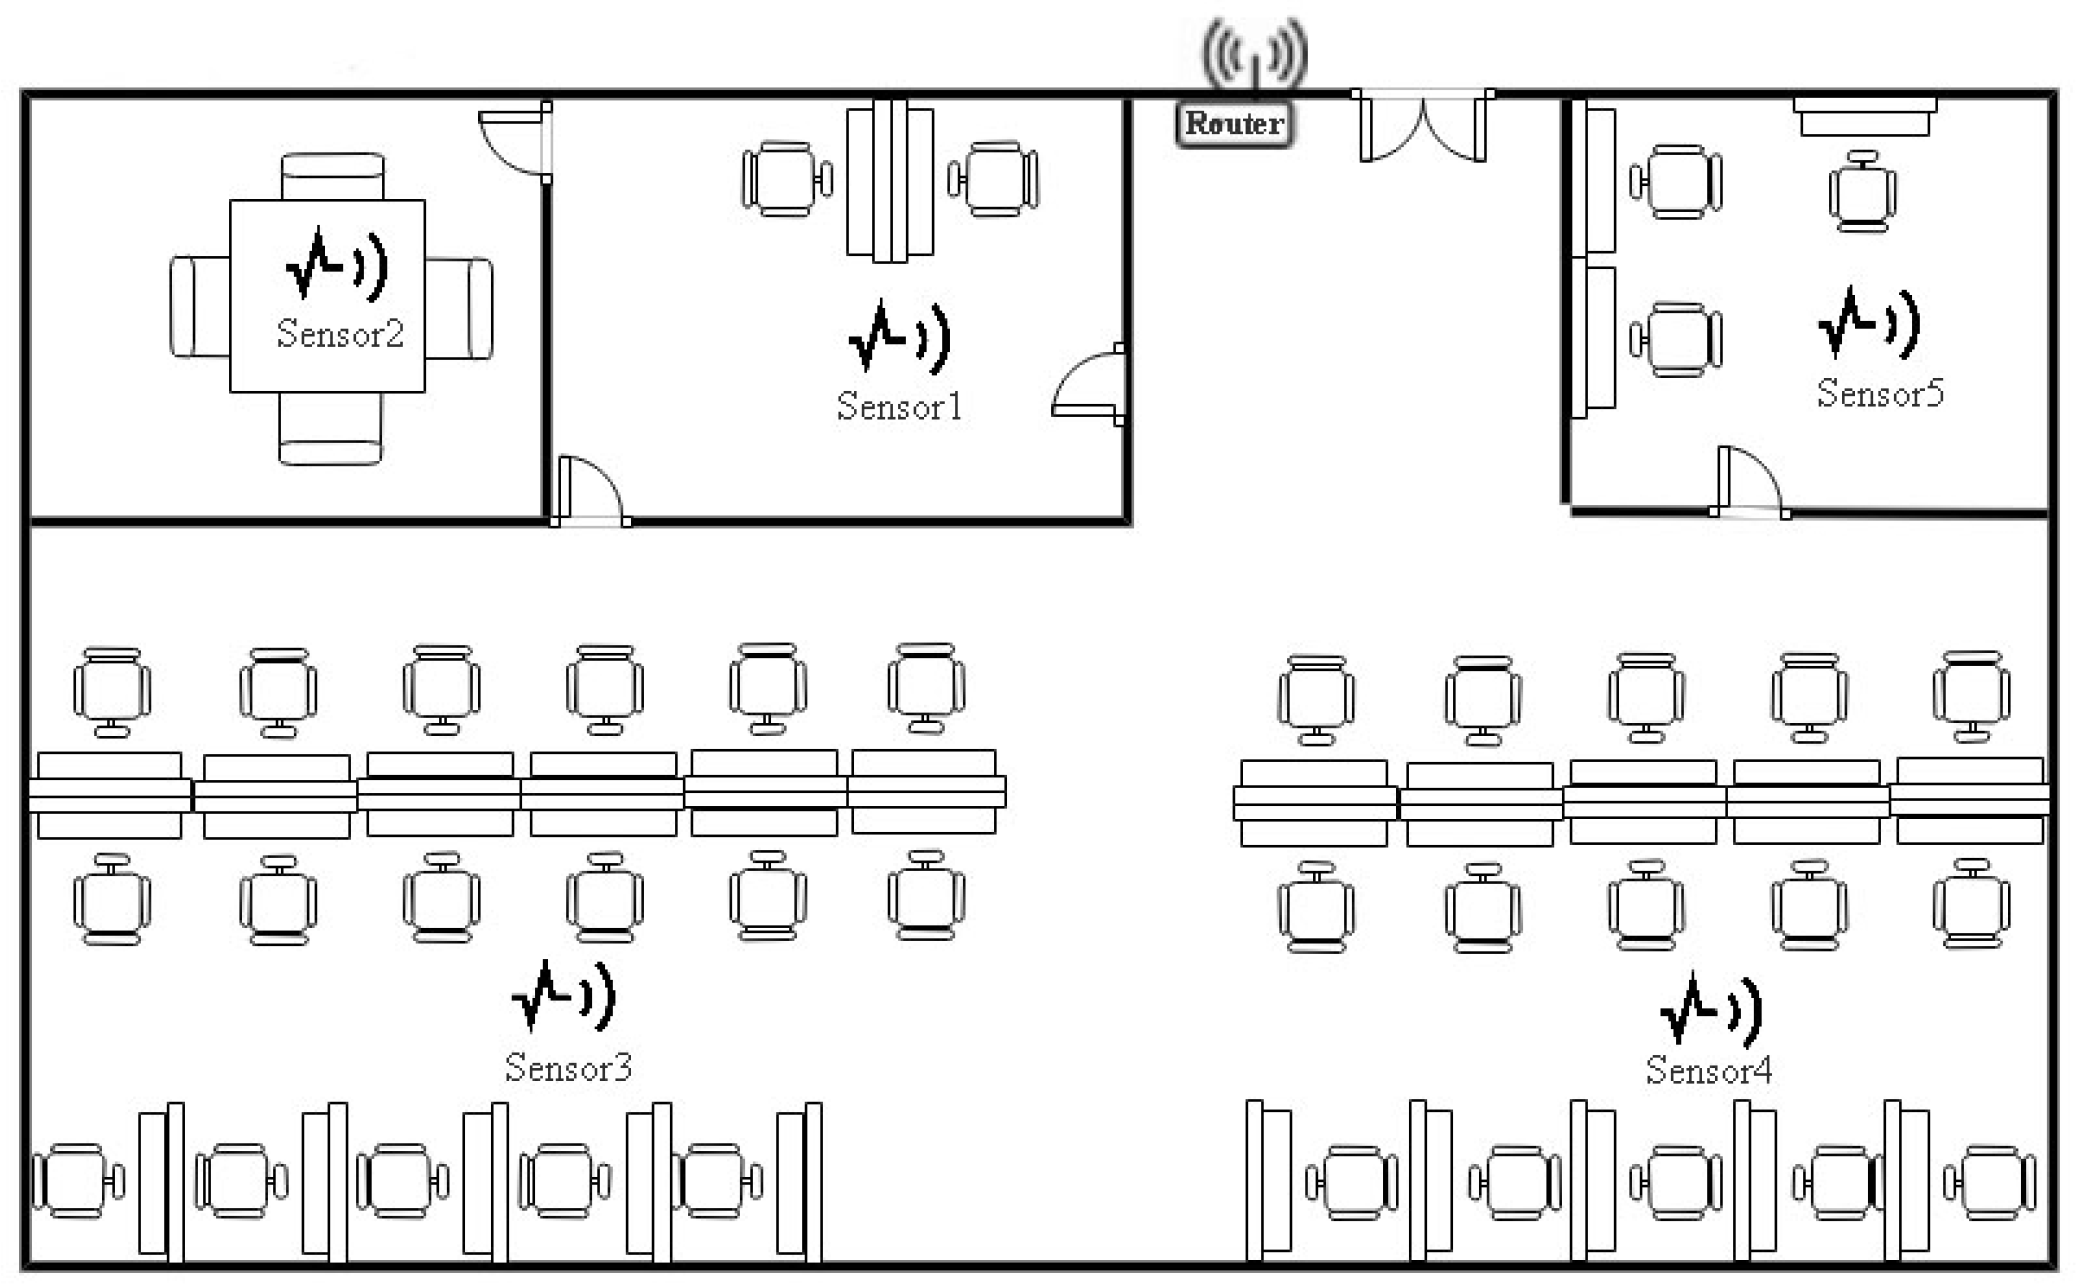
Figure 3.
Data analytics and model training.
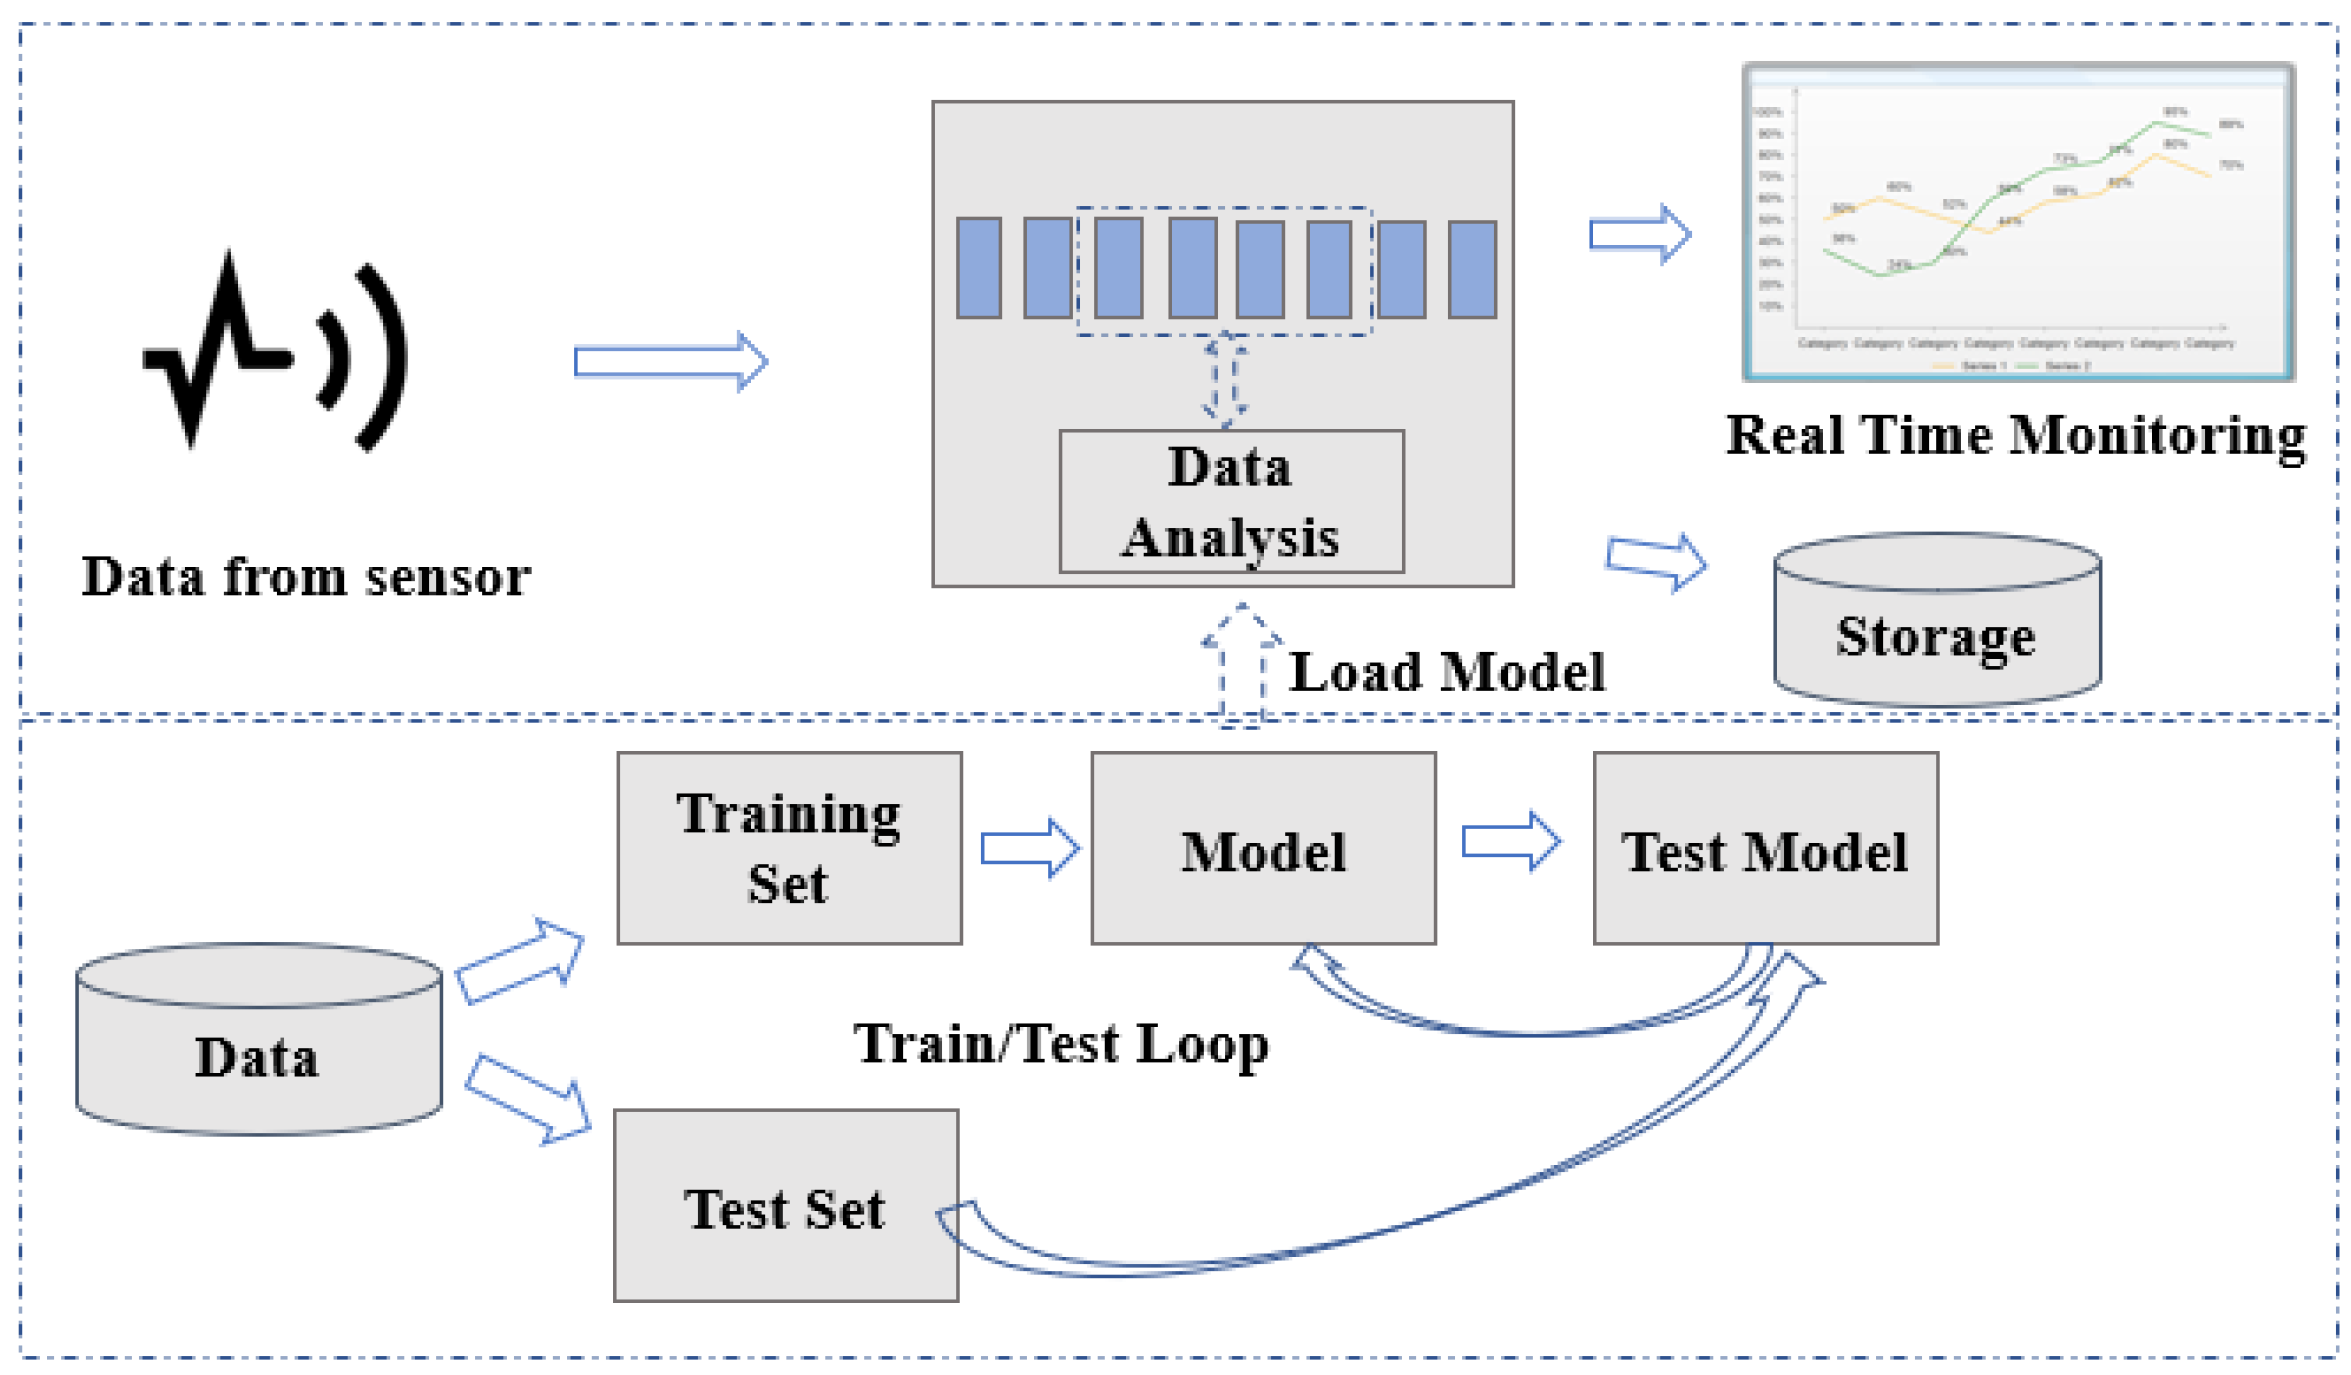
Figure 4.
CO sensor.
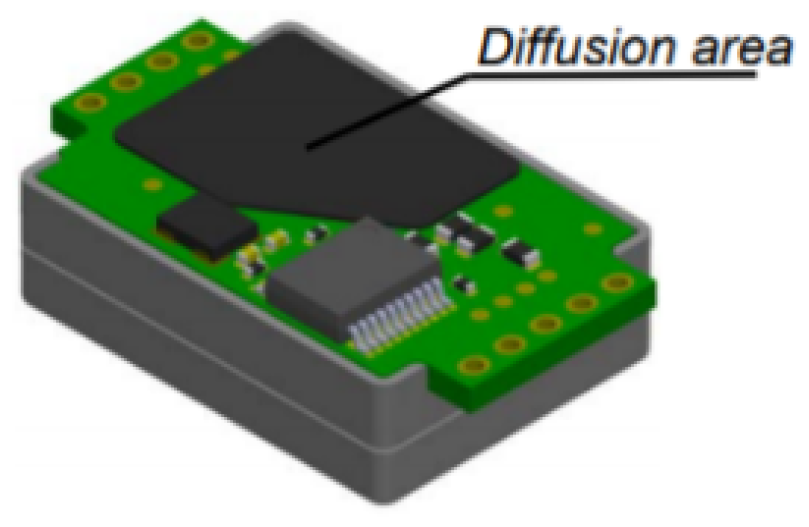
Figure 5.
CO concentration during a day.

Figure 6.
The response chart of (a) Linear Regression; (b) Tree; (c) Support Vector Machine; and (d) Gaussian Process Regression.
Figure 6.
The response chart of (a) Linear Regression; (b) Tree; (c) Support Vector Machine; and (d) Gaussian Process Regression.

Figure 7.
Network topology.

Figure 8.
Application model.

Figure 9.
Prediction of occupancy and state.
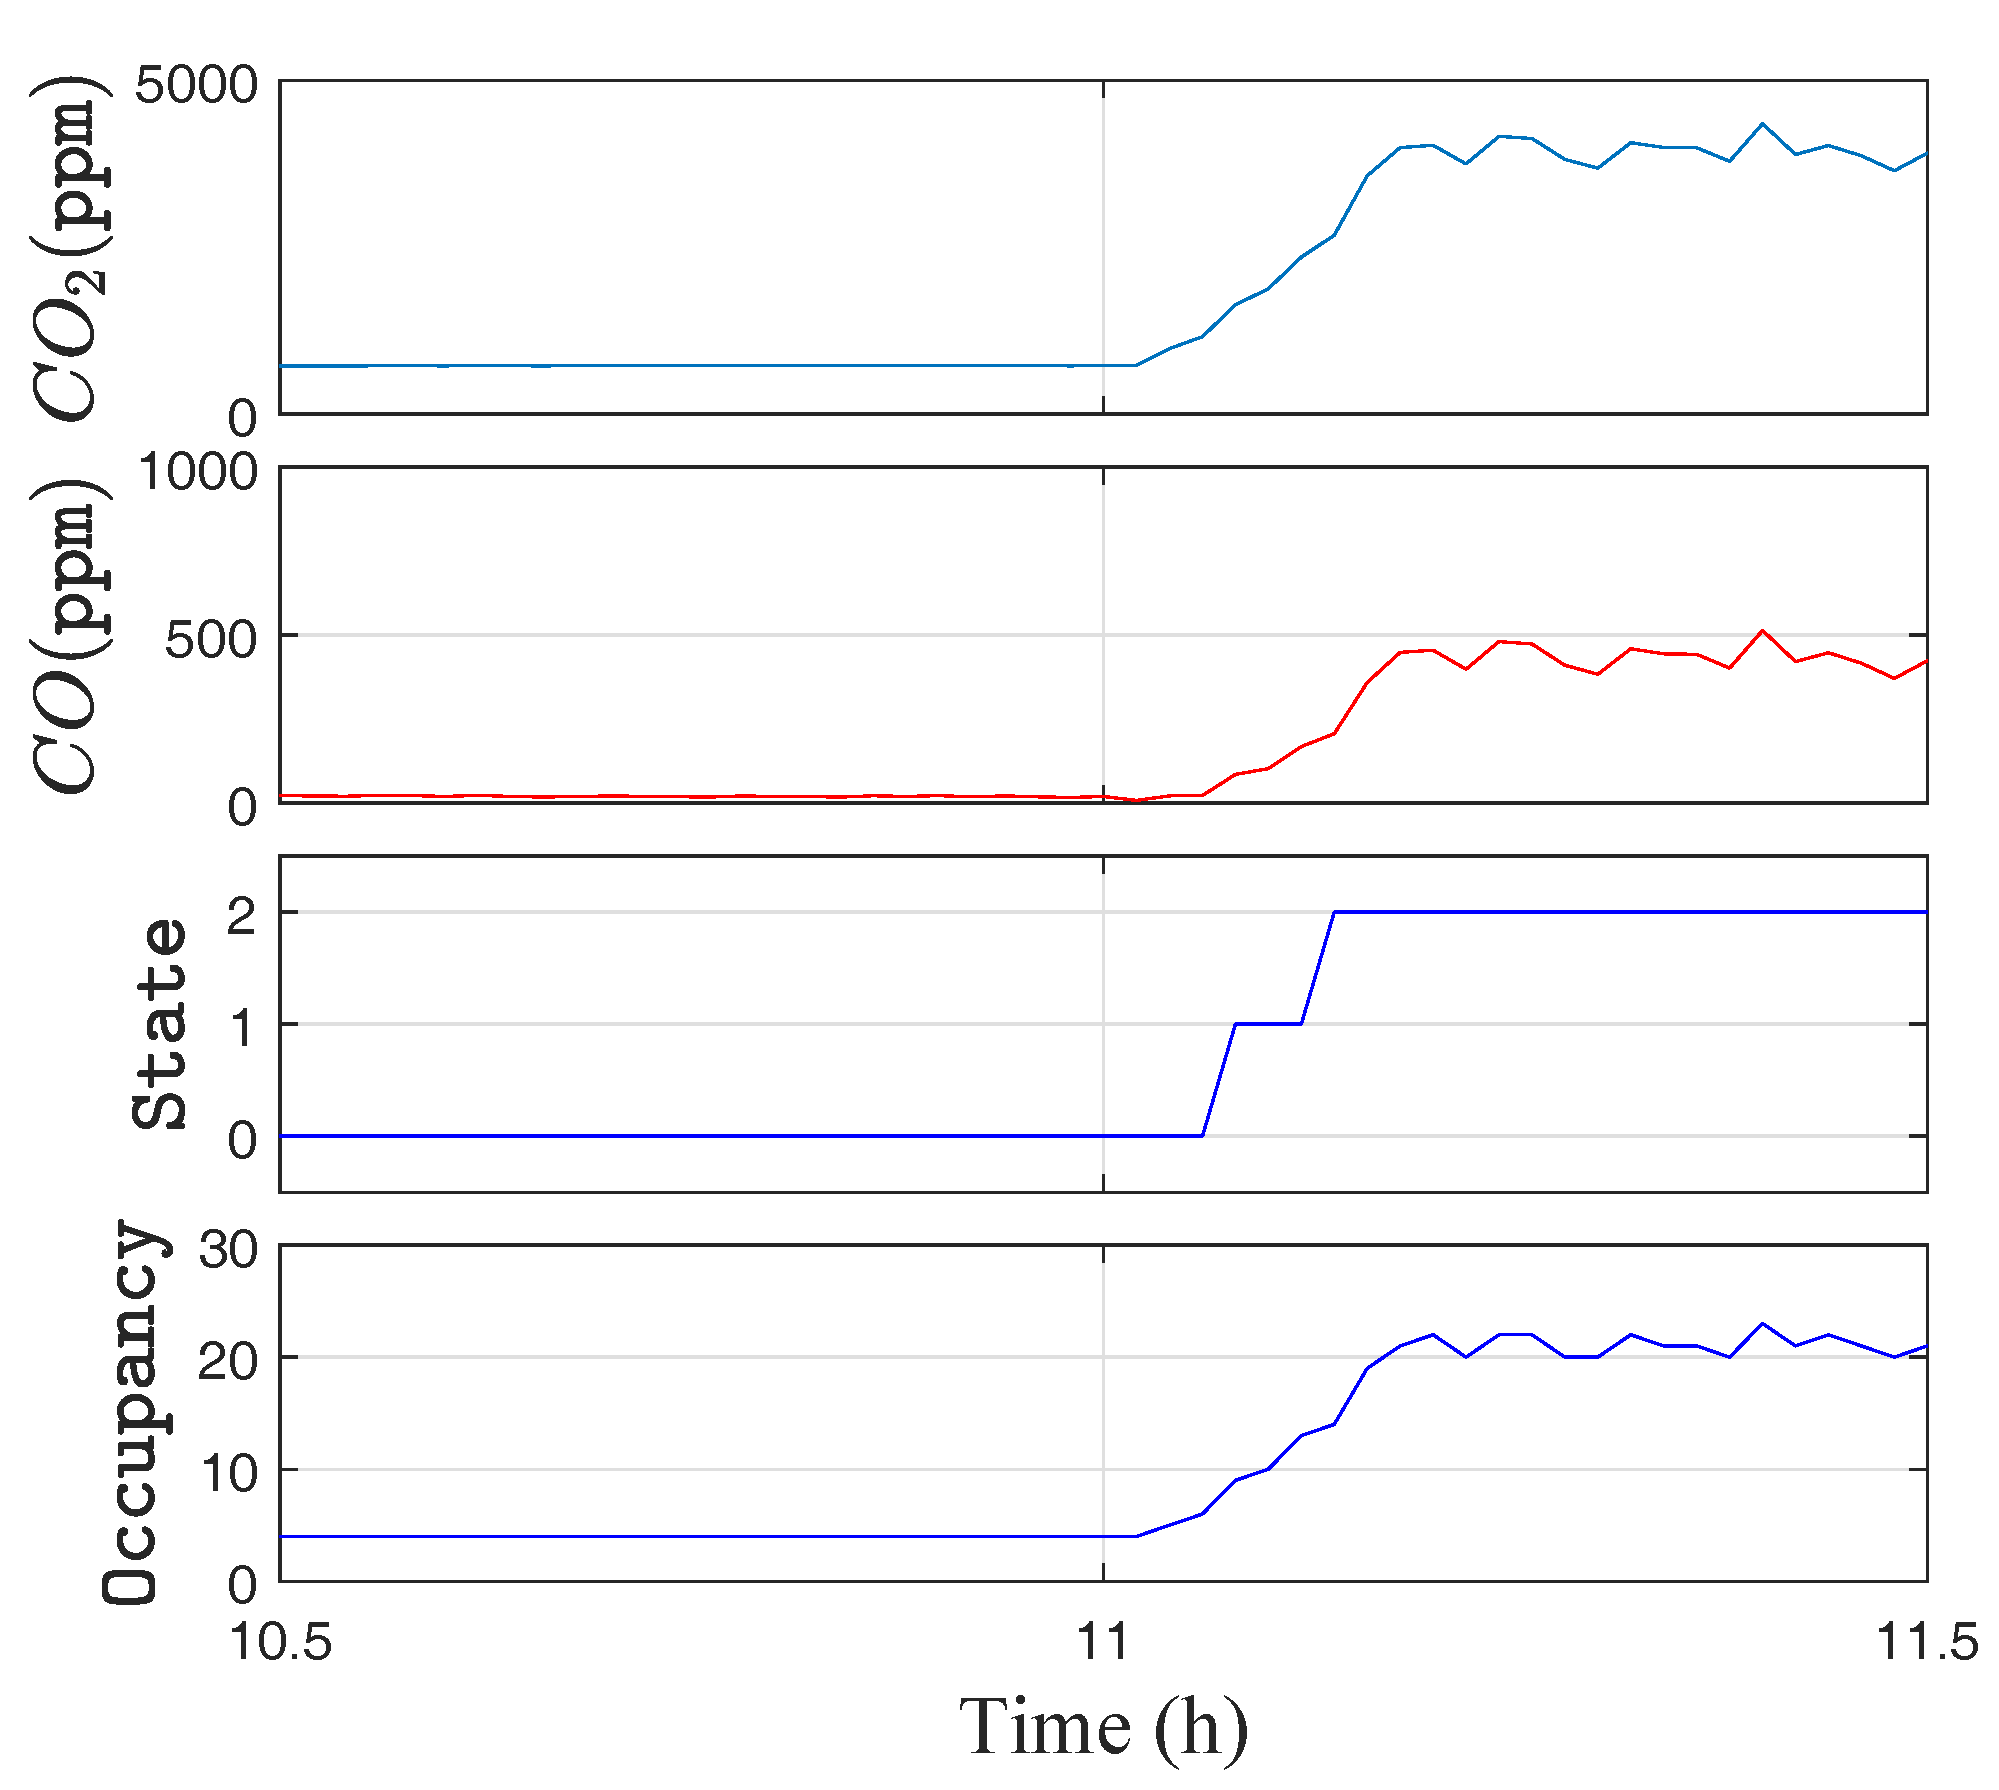
Figure 10.
Average delay of control loop.
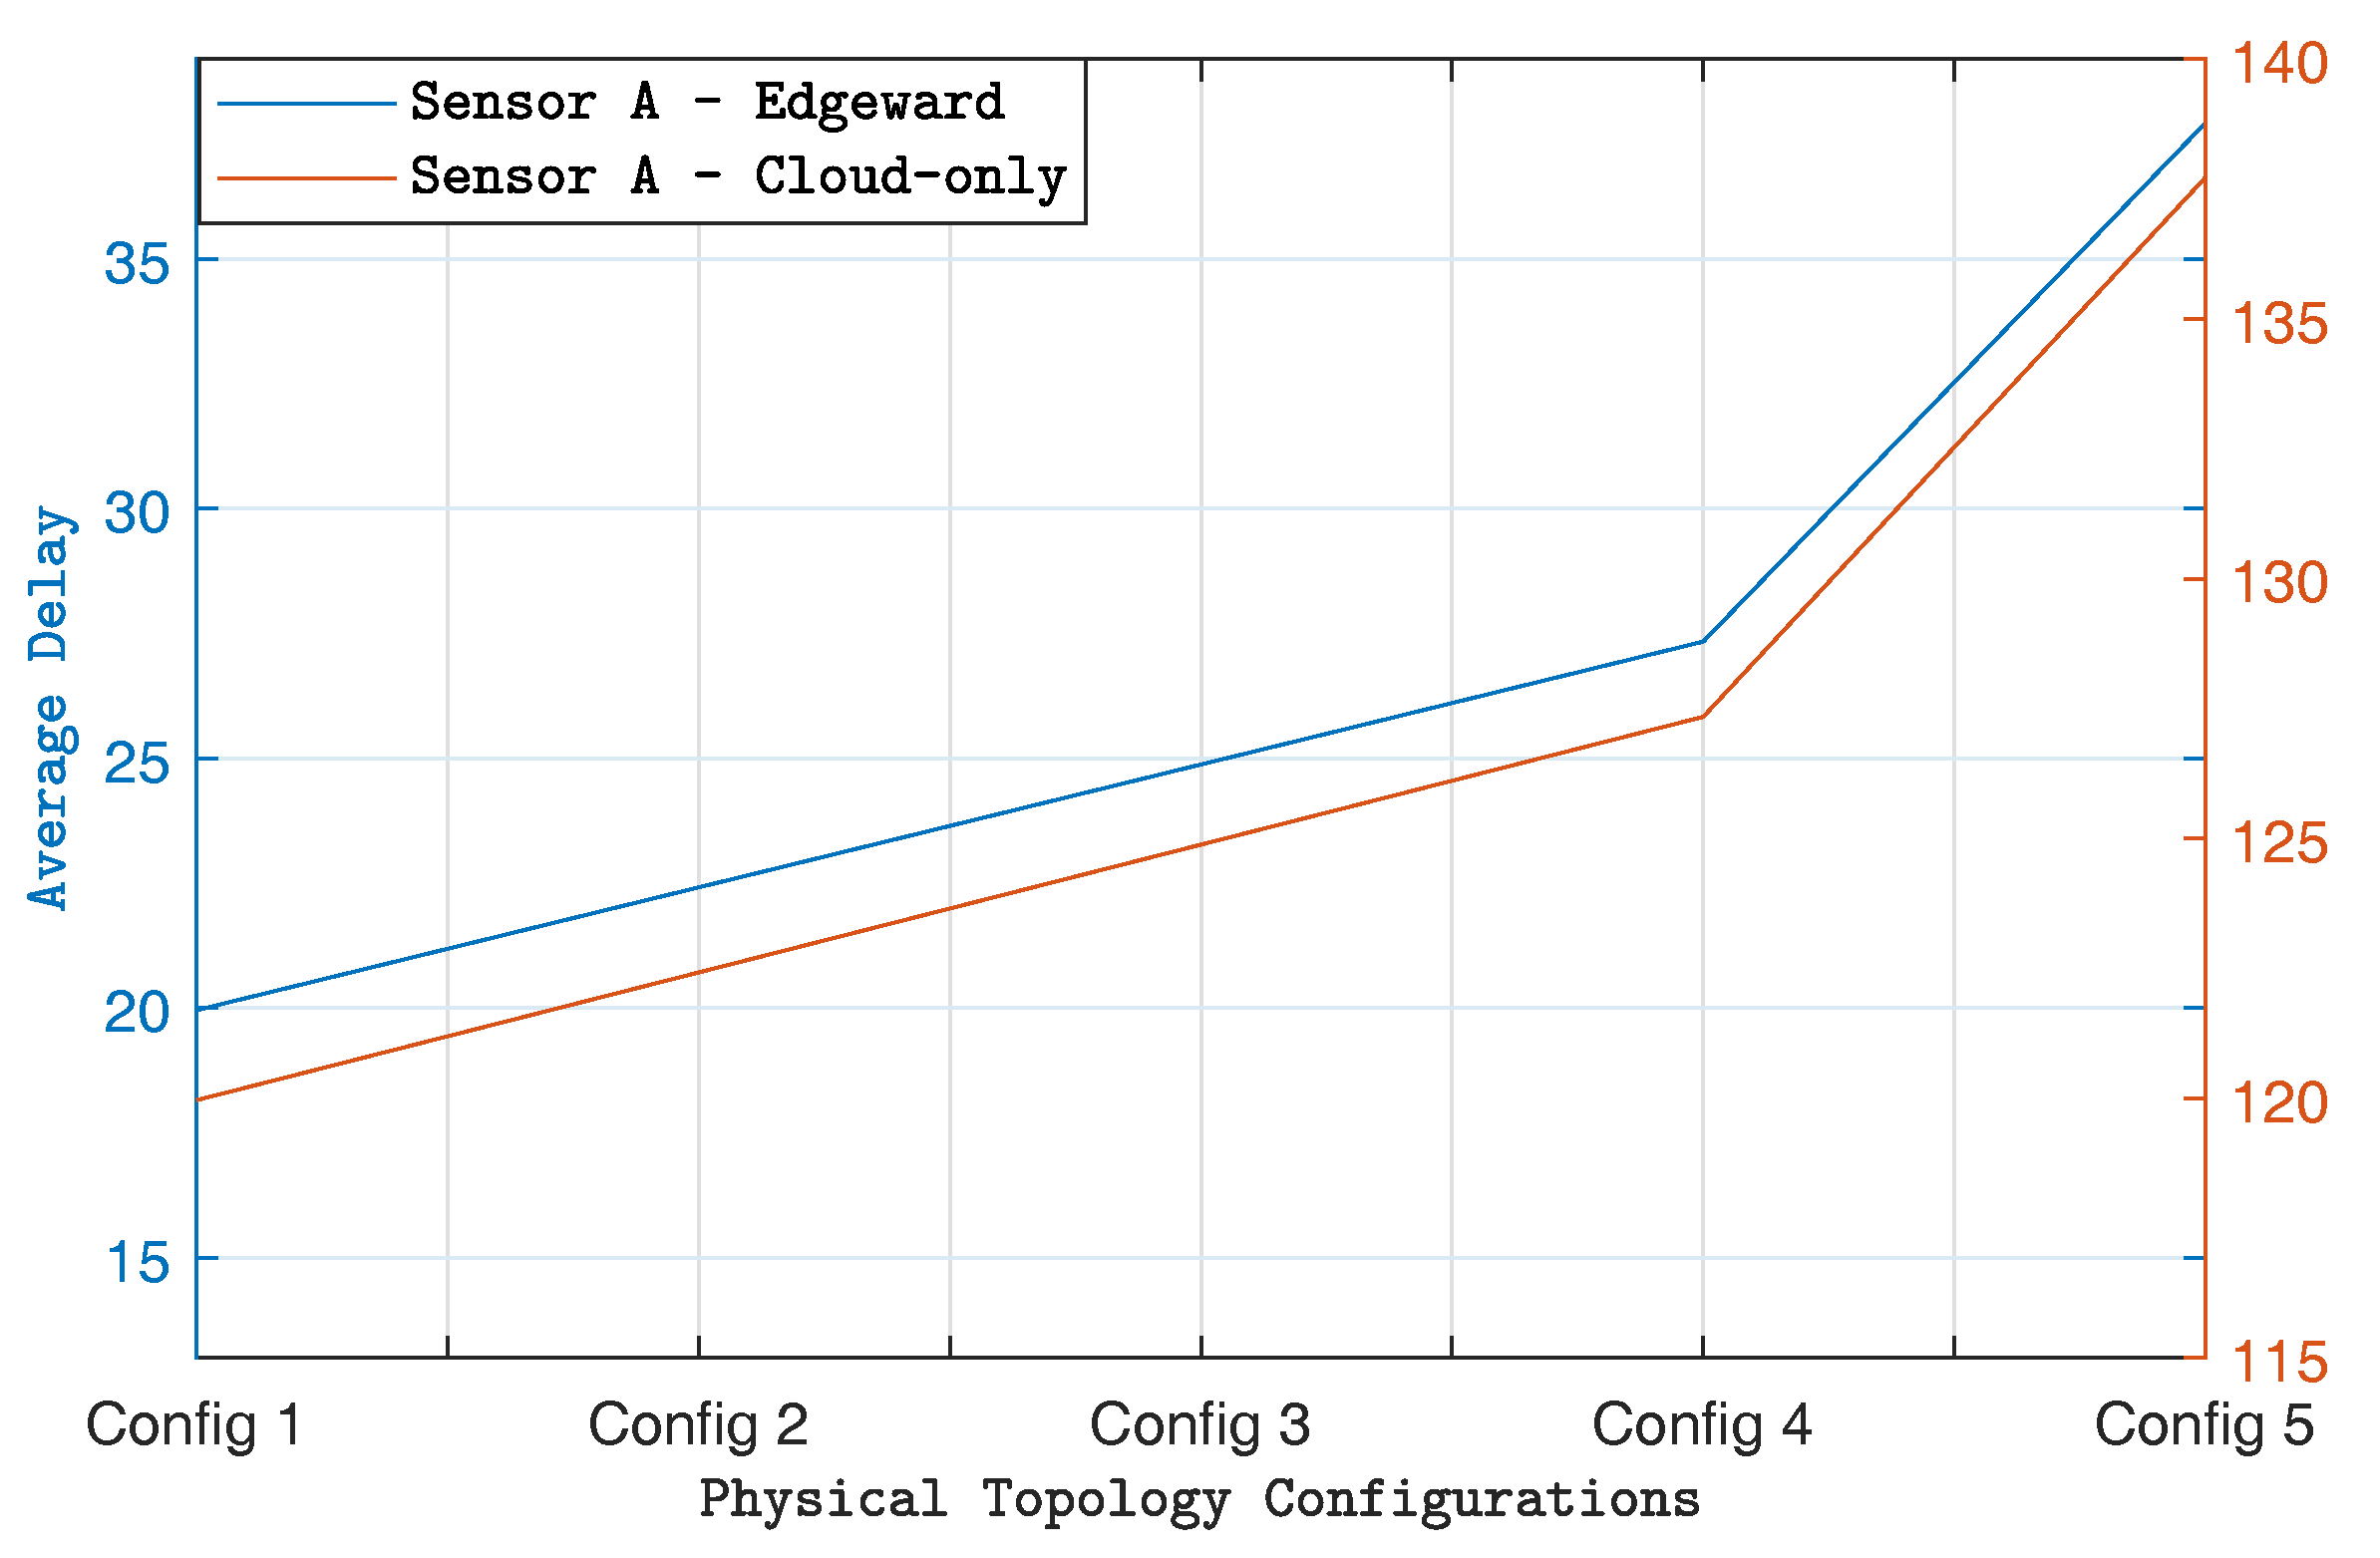
Figure 11.
Comparison of network Usage.

Figure 12.
Energy consumption of devices in Cloud and Fog execution.
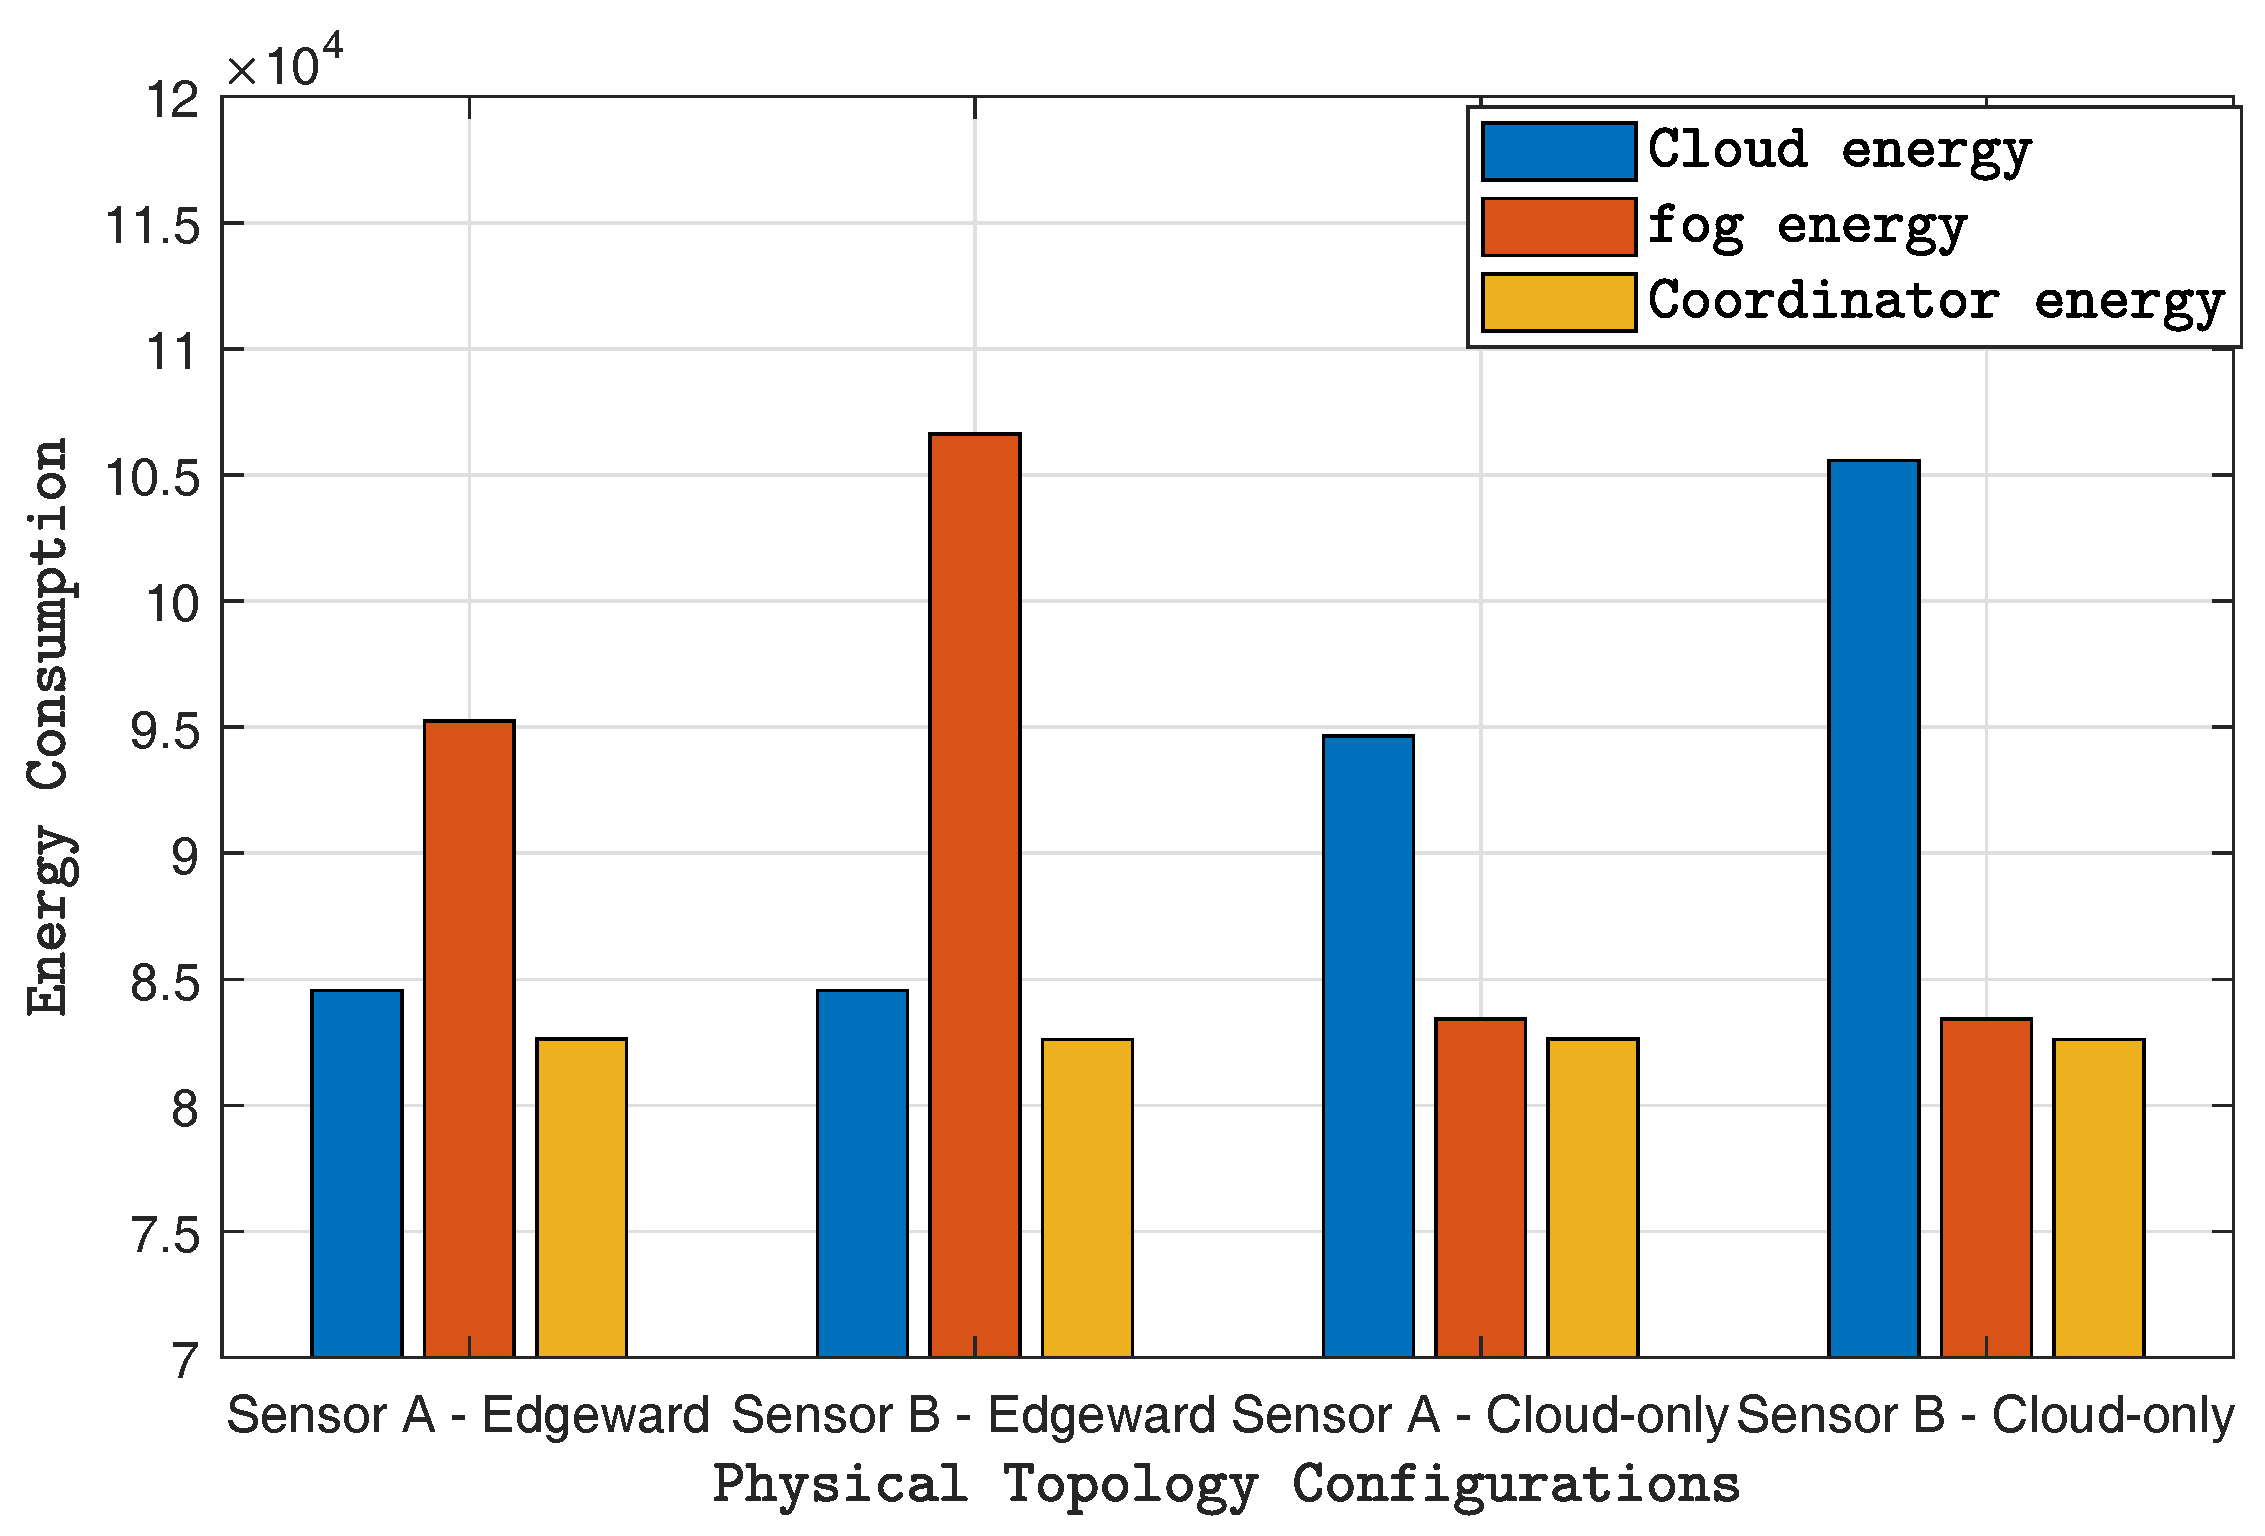
Figure 13.
Execution time of simulation for varying size of topology and input workload.


Table 1.
Added parameters in Tuple class.
| Parameter | Type | Description | |
|---|---|---|---|
| 1 | string | Created by which sensor | |
| 2 | double | Carried data (CO) | |
| 3 | double | Carried data (CO) | |
| 4 | double | Tuple creation time | |
| 5 | integer | Predicted number of person | |
| 6 | integer | Predicted current state (safety level) |
Table 2.
Added parameters in Sensor class.
| Parameter | Type | Description | |
|---|---|---|---|
| 1 | InputDataGenerator | Define input data distribution of CO | |
| 2 | InputDataGenerator | Define input data distribution of CO | |
| 3 | List<Tuple> | Record Tuples (a certain interval size) |
Table 3.
Examples of Indoor Human Occupancy Data.
| Time | CO Value (ppm) | Occupancy |
|---|---|---|
| 2017-11-23 20:00:01 | 535.00 | 1 |
| 2017-11-23 20:33:01 | 547.00 | 2 |
| 2017-11-23 21:35:00 | 1273.00 | 4 |
| 2017-11-23 22:00:12 | 1746.00 | 7 |
| 2017-11-23 22:26:49 | 2007.00 | 9 |
Table 4.
Accuracy of various machine learning models.
| Machine Learning Algorithm | RMSE | R2 | MSE | MAE |
|---|---|---|---|---|
| LR | 0.67503 | 0.94 | 0.45567 | 0.53612 |
| Tree | 0.20682 | 0.99 | 0.042775 | 0.0383 |
| SVM | 0.31875 | 0.99 | 0.1016 | 0.2197 |
| GPR | 0.21269 | 0.99 | 0.045235 | 0.045831 |
Table 5.
Description of inter-module edges.
| Tuple Type | CPU Length (MIPS) | Network Length (bits) |
|---|---|---|
| 1000 | 500 | |
| 1000 | 500 | |
| 1200 | 600 | |
| 200 | 100 | |
| 200 | 100 |
Table 6.
Configuration of Fog devices.
| Fog Device | CPU (GHz) | RAM(GB) | POWER(W) |
|---|---|---|---|
| Cloud (VM) | 3.0 | 4 | 107.339, 84.443 |
| Data Analytics | 3.0 | 4 | 107.339, 83.4333 |
| Coordinator | 1.6 | 1 | 87.53, 82.44 |
Table 7.
Description of network links.
| Source | Destination | Latency (in ms) |
|---|---|---|
| Sensor | Coordinator | 6 |
| Coordinator | Fog | 5 |
| Fog | Cloud | 50 |
Table 8.
Configuration of sensors.
| Sensor | TUPLE CPU LENGTH | Average Inter-Arrival Time |
|---|---|---|
| A | 1000 Million Instructions | 20 milliseconds |
| B | 1000 Million Instructions | 50 milliseconds |
© 2018 by the authors. Licensee MDPI, Basel, Switzerland. This article is an open access article distributed under the terms and conditions of the Creative Commons Attribution (CC BY) license (http://creativecommons.org/licenses/by/4.0/).
Share and Cite
MDPI and ACS Style
Duan, K.; Fong, S.; Zhuang, Y.; Song, W. Carbon Oxides Gases for Occupancy Counting and Emergency Control in Fog Environment. Symmetry 2018, 10, 66. https://doi.org/10.3390/sym10030066
AMA Style
Duan K, Fong S, Zhuang Y, Song W. Carbon Oxides Gases for Occupancy Counting and Emergency Control in Fog Environment. Symmetry. 2018; 10(3):66. https://doi.org/10.3390/sym10030066
Chicago/Turabian StyleDuan, Kairong, Simon Fong, Yan Zhuang, and Wei Song. 2018. "Carbon Oxides Gases for Occupancy Counting and Emergency Control in Fog Environment" Symmetry 10, no. 3: 66. https://doi.org/10.3390/sym10030066
Note that from the first issue of 2016, this journal uses article numbers instead of page numbers. See further details here.