Age Estimation Robust to Optical and Motion Blurring by Deep Residual CNN

Division of Electronics and Electrical Engineering, Dongguk University, 30 Pildong-ro, 1-gil, Jung-gu, Seoul 100-715, Korea
*
Author to whom correspondence should be addressed.
Symmetry 2018, 10(4), 108; https://doi.org/10.3390/sym10040108
Submission received: 9 March 2018
/
Revised: 9 April 2018
/
Accepted: 10 April 2018
/
Published: 13 April 2018
(This article belongs to the Special Issue Deep Learning-Based Biometric Technologies)
Abstract
:Recently, real-time human age estimation based on facial images has been applied in various areas. Underneath this phenomenon lies an awareness that age estimation plays an important role in applying big data to target marketing for age groups, product demand surveys, consumer trend analysis, etc. However, in a real-world environment, various optical and motion blurring effects can occur. Such effects usually cause a problem in fully capturing facial features such as wrinkles, which are essential to age estimation, thereby degrading accuracy. Most of the previous studies on age estimation were conducted for input images almost free from blurring effect. To overcome this limitation, we propose the use of a deep ResNet-152 convolutional neural network for age estimation, which is robust to various optical and motion blurring effects of visible light camera sensors. We performed experiments with various optical and motion blurred images created from the park aging mind laboratory (PAL) and craniofacial longitudinal morphological face database (MORPH) databases, which are publicly available. According to the results, the proposed method exhibited better age estimation performance than the previous methods.
1. Introduction
Human age estimation based on facial images is currently a hot research topic being applied in many areas, including demographic analysis, consumer analysis, visual surveillance, and aging process analysis [1,2]. To obtain an accurate age estimation, facial features containing age information need to be extracted from images captured by a camera. Typical features conveying age information in facial images are depth, length, and thickness of wrinkles. Various methods, such as the local binary pattern (LBP), the multilevel local binary pattern (MLBP), and the Gabor filter, have been used to extract such features. Recently, the convolutional neural network (CNN) method has been used to train an optimal feature extractor and classifier for age estimation. However, as shown in a previous study [3], training a nonstationary kernel for a regression problem can easily cause overfitting. Several studies are currently under way to solve this problem, and many algorithms have been developed so far. Although age estimation has been actively investigated by the existing studies, most of them have dealt with input images with little blurring effect. However, in a real-world environment, various optical and motion blurring effects can occur due to movement of the camera or its user. Such effects cause problems in identifying important facial features such as wrinkles, thereby degrading estimation accuracy. To solve this problem, this study examines an age estimation method that is robust to various optical and motion blurring effects.
To recover wrinkles from blurred face images, image restoration methods have been used, but they require an accurate estimation of the point spread function (PSF) of optical and motion blurring, which is very difficult and takes processing time [4,5]. In addition, in case both optical and motion blurring occur at the same time, the conventional image restoration method is difficult to use. Therefore, we used deep convolutional neural network (CNN), which can extract the important low-, mid-, and high-frequency features for age estimation and is robust to the various qualities of image input, such as unblurred, optical blurred, or motion blurred images. By using one deep CNN without an additional image restoration method, our method does not require estimating accurate PSF and can deal with various cases, including unblurred images or images where both optical and motion blurring occur at the same time.
2. Related Works
Facial features reflecting age, such as length, depth, and number of wrinkles and skin condition [6], need to be extracted from facial images in order to estimate a person’s age. A previous study [7] introduced algorithms and their performance that were used by higher-rank teams on an age estimation, accessory classification, and smile and gender classification contest, held at the 2016 challenge in machine learning (ChaLearn) Looking at People and Faces of the World Challenge and Workshop. The teams using the visual geometry group-16 net exhibited high performance for age estimation. Other studies [8,9] also conducted CNN-based age estimation. However, two studies [7,9] calculated errors on the basis of face-apparent age rather than ground-truth age. One study [8] calculated only classification errors of predetermined age classes, which were not age estimation errors.
Table 1 presents the feature extraction methods, database, and errors of the existing age estimation studies that calculated the mean absolute error (MAE) between estimated age and ground-truth age.
The above list of studies demonstrates that extraction techniques for human age estimation have been continuously studied. However, input images of a real-world environment often have optical and motion blurring. In this case, important facial age features such as wrinkles cannot be fully captured, and thus the accuracy of age estimation is degraded. However, the previous studies, including those in Table 1, showed little interest in the robustness of age estimation to blurring, and most of them were conducted for unblurred images without blurring. One study [21] dealt with age estimation robust to motion blurring. It applied the adaptive boosting (Adaboost) method to extract face and eye regions from input images, corrected the in-plane rotation on the basis of eye location, and then redefined the facial region of interest (ROI). After this process, LBP and Gabor filtering were used to extract age features from facial images, and the support vector regression (SVR) method, which had already been trained according to the direction and size of motion blurring, was used for age estimation. One study [22] identified the degree of optical blurring caused by the camera by focus-checking, and used the SVR method to estimate a person’s age. Two studies [21,22] assumed that motion blurring and optical blurring occur separately. However, these two types of blurring often occur simultaneously in a real-world environment, which has not been considered in related research. Besides, two studies [21,22] attempted SVR-based age estimation according to focus scores of input images. If the focus score of an input image is incorrectly measured, an incorrect SVR is selected and the age estimation error increases. To solve these problems, we propose a CNN-based age estimation method that considers both optical and motion blurring. Our research is novel in the following three ways.
- (1)
- It is the first age estimation that considers both optical and motion blurring in various environments.
- (2)
- Without preclassifying the degree and direction of blurring and without training an age estimation classifier separately according to the preclassification result, a deep ResNet-152 CNN is used for age estimation so that the incidence of erroneous estimation due to errors in the preclassification of blurring degree and direction and the system complexity are reduced.
- (3)
- Automatic training of the coefficients of an optimal feature extractor and the weights of a classifier using the deep ResNet-152 CNN removes the process of manual selection of coefficients and weights. We also open the CNN model obtained from the training in [23] so that other researchers can compare the performance easily.
Table 2 compares the advantages and disadvantages of the proposed method and previous methods.
3. Proposed Human Age Estimation Based on Deep ResNet
3.1. Overall Flowchart of the Proposed Method
Figure 1 shows the overall flowchart of the proposed method. In the first stage, a face and eyes are detected from input facial images using the Adaboost detector. In the second stage, the in-plane rotation of the face is compensated on the basis of the detected eye region [12,21,22]. Finally, in the third stage, a pretrained ResNet-152 CNN is applied to the redefined face region to estimate the age of the person in the input facial image.
3.2. Data Preprocessing
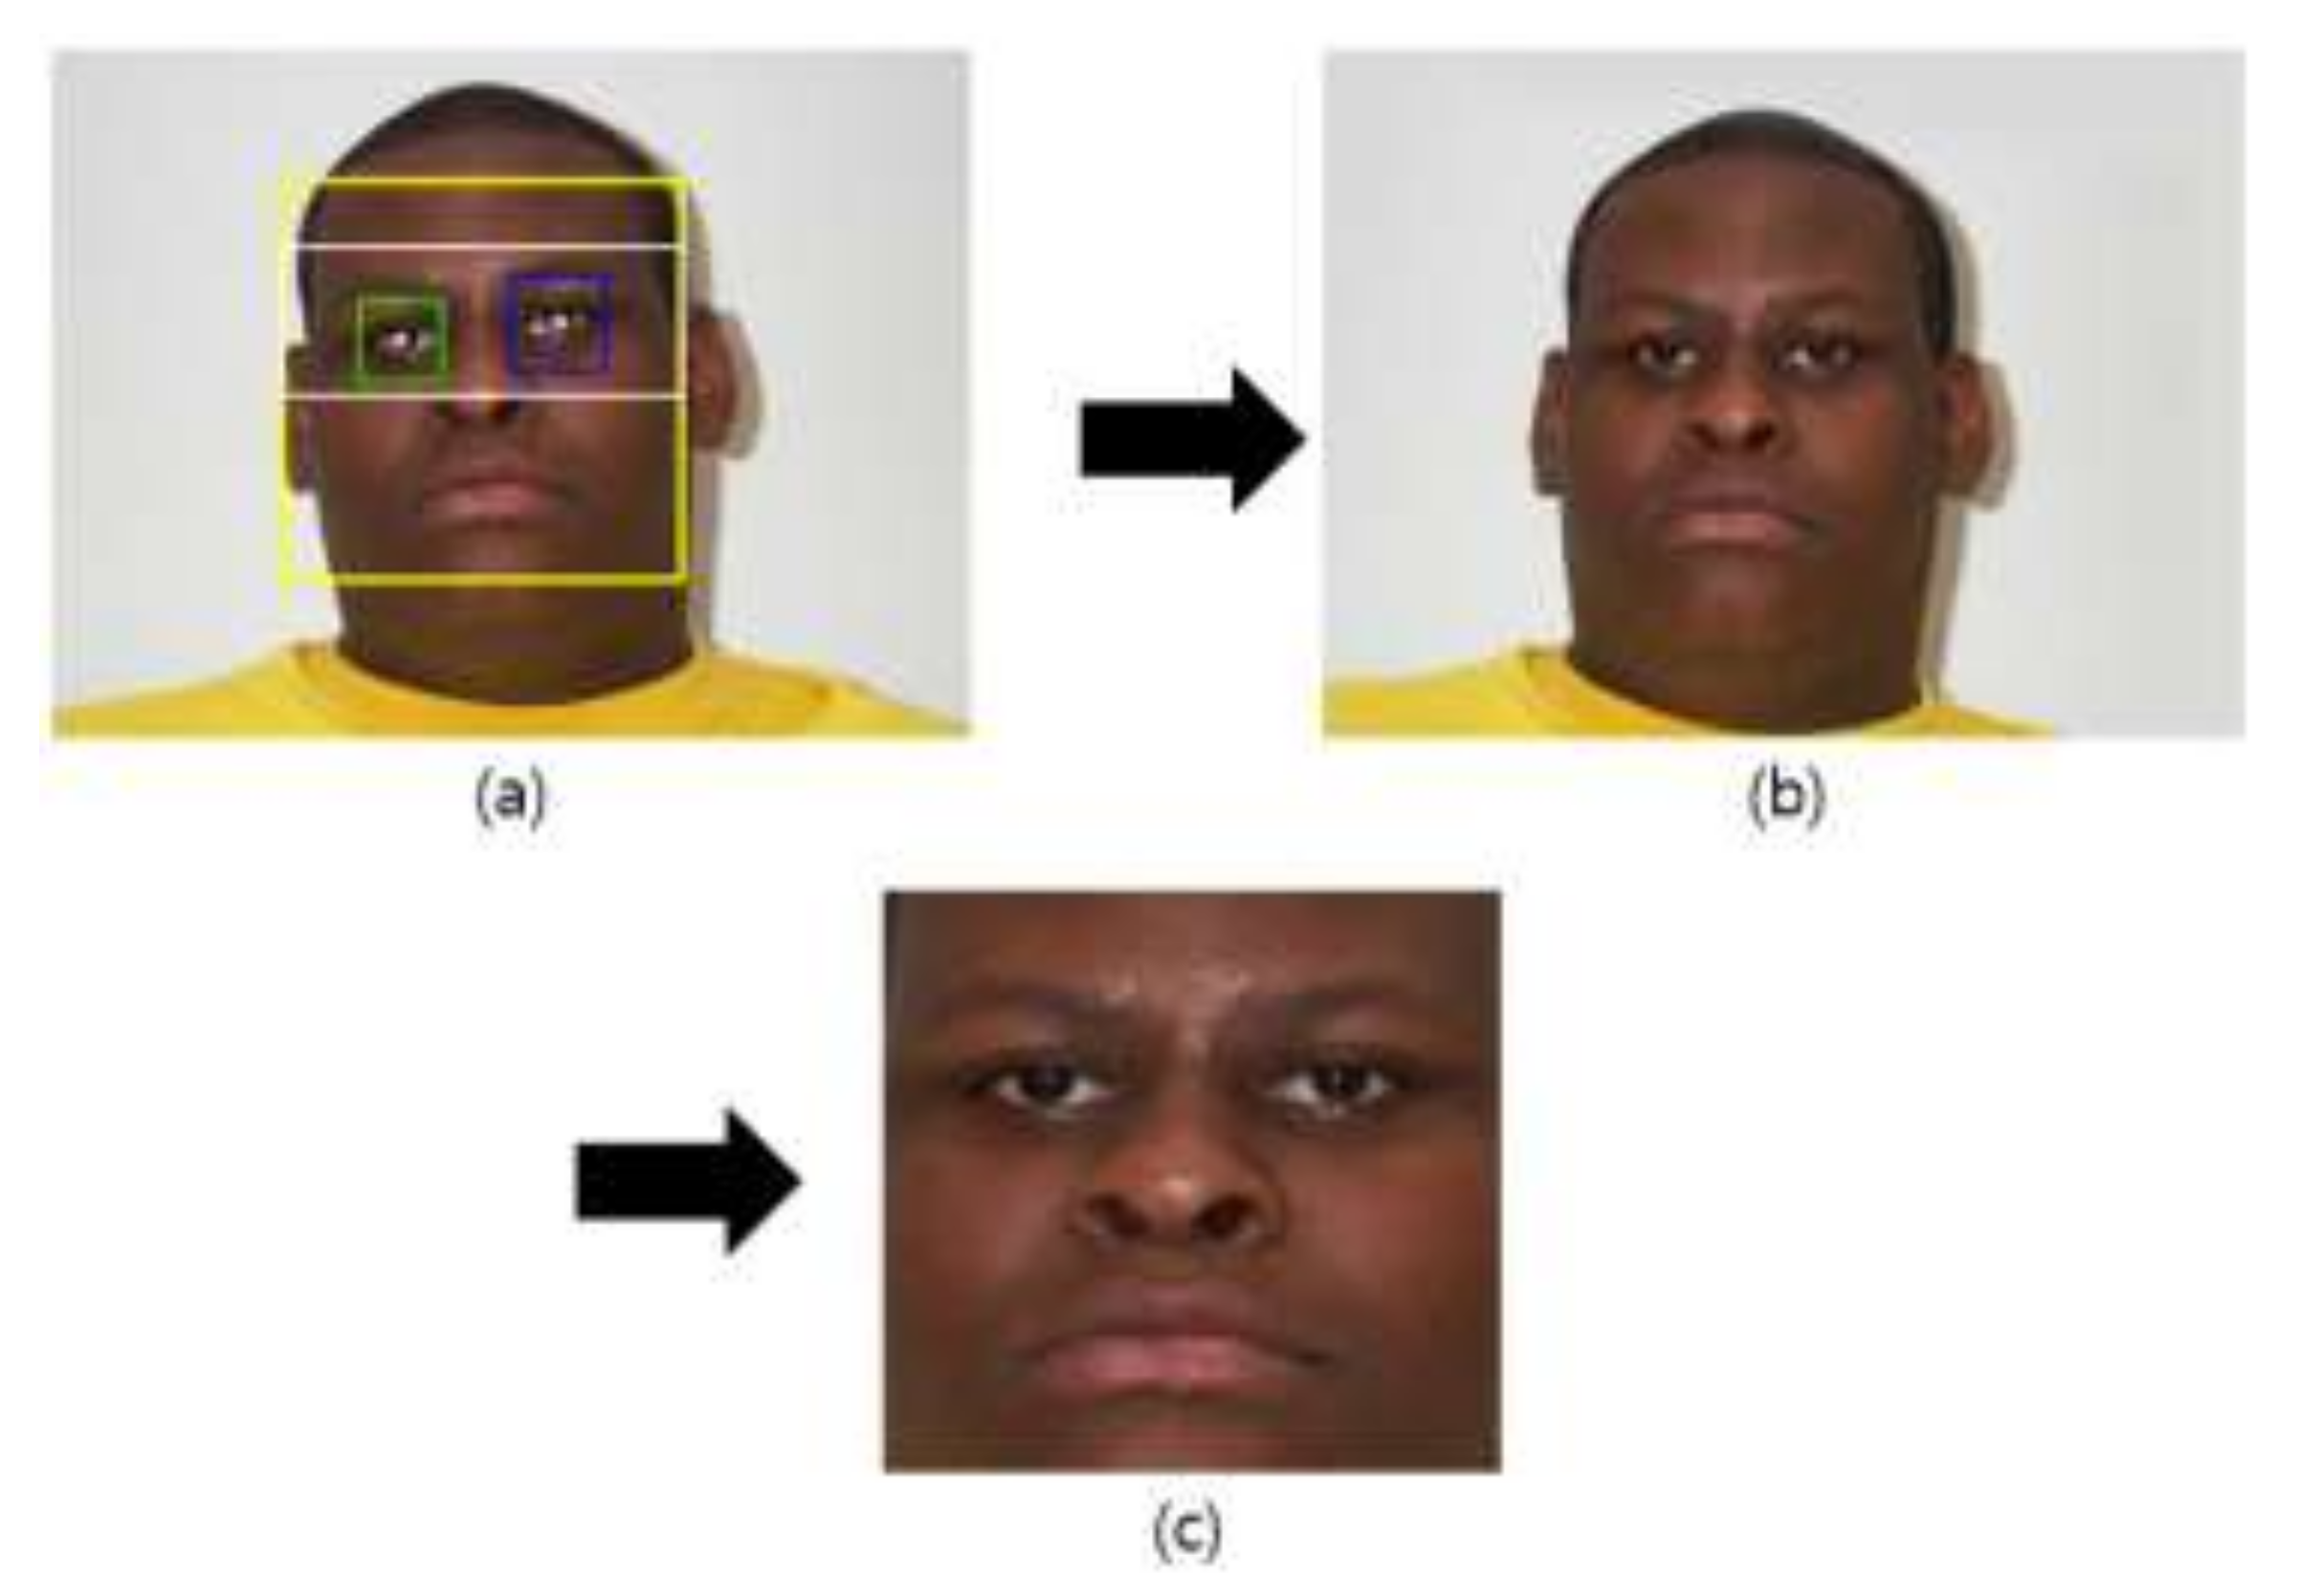
Since facial images obtained by a camera usually show a mixture of the face and the background, this study used the well-known Adaboost detector algorithm to detect a face region and eye location, as shown in Figure 2a. The detected eye location formed the criterion for compensating the in-plane rotation of the face, and thus a corrected facial image such as the one shown in Figure 2b.
Equation (1) shows in-plane rotation [12,21,22]:
where Rx and Ry are the x- and y-coordinates, respectively, of the right eye and Lx and Ly are the x- and y-coordinates of the left eye. In this corrected face region, a face ROI with reduced background is redefined based on the already detected distance between the locations of the eyes, as shown in Figure 2c. This ROI is used to train and test a CNN [12,21,22].
3.3. Age Estimation by Deep ResNet
After the data preprocessing was completed, CNN-based age estimation was conducted. We modified the number of output nodes in the final fully connected (FC) layer of the ResNet-152 CNN model [24] from 1000 to that of age classes distinguished in this study (Section 4.3), and fine-tuned by using the augmented PAL and MORPH databases. If a ResNet-152 CNN model is to be used through fine-tuning, the size of the input image should be 224 × 224 pixels. For this reason, we resized the face ROI of Figure 2c to a 224 × 224 pixel image by applying bilinear interpolation. However, because the size of face ROI such as in Figure 2c is almost similar to (or a little larger than) 224 × 224 pixels, rescaling does not introduce additional blur in the image. Table 3 presents the ResNet-152 CNN architecture used in this study.
In Table 3, the dimension (output width or height) of the feature map, which is obtained by applying a filter to each layer, is calculated by the following equation:
where is the input width (or height), is the filter width (or height), is padding, and is a stride [25]. Round_down() means the function of rounding half down. For instance, in Conv1 of Table 3, input height, filter height, padding, and stride are 224, 7, 3, and 2, respectively. Therefore, the output height becomes 112 ((224 − 7 + 2 × 3)/2 + 1). The output feature map for standard convolution is usually obtained based on stride one and padding as [26]:
Ok, l, n = ∑i, j, m (Ki, j, m, n × Ik + i − 1, l + j − 1, m)
In Equation (3), Ik + i − 1, l + j − 1, m is the input feature map of the size of M × RF × RF. M is the number of input channels (input depth), and RF is the width and height of a square input feature map. Ok, l, n is the output feature map of size N × SF × SF. N is the number of output channels (output depth), and SF is the spatial width and height of a square output feature map. Ki, j, m, n is the convolution kernel of size M × N × RK × RK, and RK is the spatial dimension of the convolution kernel. Then, standard convolutions can have the following computational cost of:
C = RK × RK × M × N × RF × RF
Based on Equation (4), we can find that the computational cost is determined based on multiplying the kernel size RK × RK, the number of input channels M, the number of output channels N, and the input feature map size RF × RF [26].
In Table 3, Conv1–Conv5 refer to convolutional layers, and Max pool and AVG pool are the pooling layers choosing the maximum value and the mean value, respectively. They are also called subsampling layers. As shown in Table 3, Conv2-1 performs the convolution operation with 64 filters of size 1 × 1 × 64, and explores in the vertical and horizontal directions while striding by a one-pixel unit. Conv2-2 performs the convolution operation with 64 filters of size 3 × 3 × 64, and explores in the vertical and horizontal directions while striding by a one-pixel unit with padding of 1 pixel.
Conv3–Conv5 include a bottleneck structure. In other words, the first convolution operation uses 1 × 1 × 256 (or 512 or 1024) filters (stride 2) to reduce the dimensions of the feature map, the second convolution operation adopts 3 × 3 × 128 (or 256 or 512) filters, and the final convolution operation uses a larger number of 1 × 1 × 128 (or 256 or 512) filters to expand the dimension of the feature map again. Consequently, the layers (Conv3-2, Conv4-2, and Conv5-2) performing the convolution operation with 3 × 3 × 128 (or 256 or 512) filters have smaller input and output [24]. The operation becomes faster compared to the case in which 3 × 3 × 128 (or 256 or 512) convolution is performed twice.
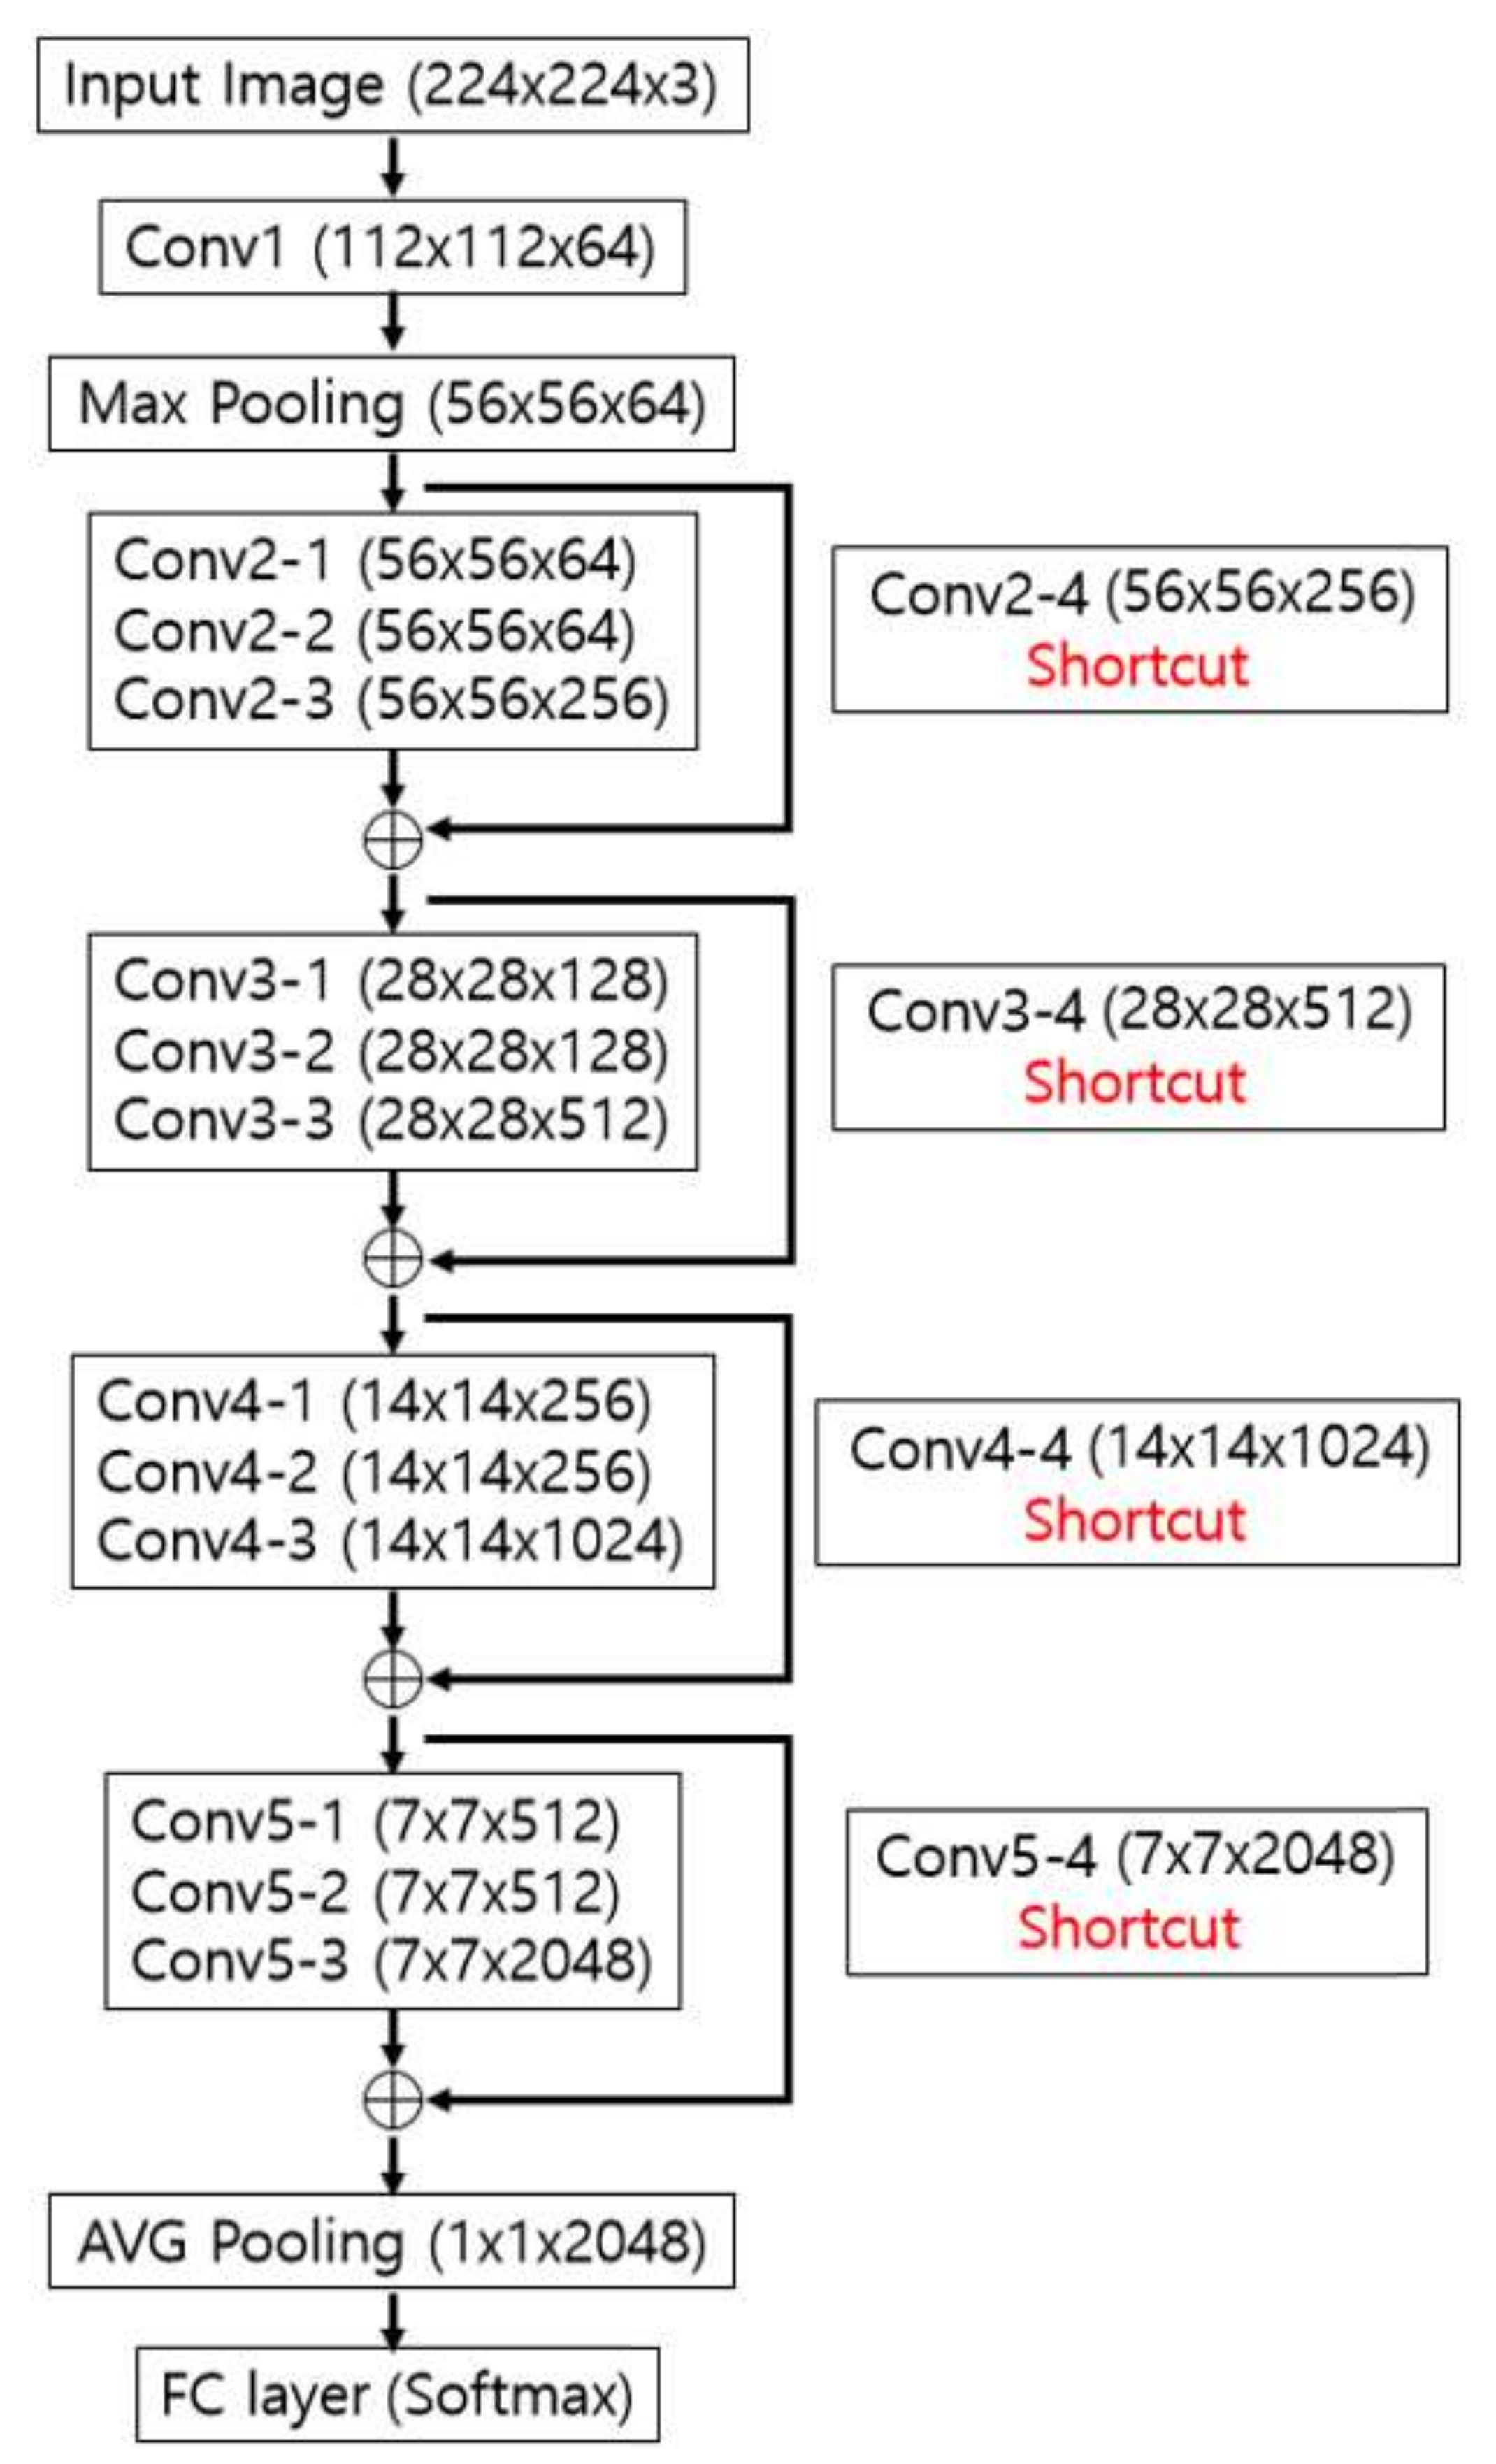
The steps of Conv2–Conv5 are repeated by the number of iterations in Table 3. In Conv2–Conv5, features are extracted in two branches, as shown in Figure 3. One is the convolutional layers operating sequentially from Conv2 to Conv5. The other is when the information in the feature map (residual information) prior to Conv2-1, Conv3-1, Conv4-1, and Conv5-1 is element-wise added through the shortcut layer to the output feature map of Conv2-3, Conv3-3, Conv4-3, and Conv5-3, as shown in Figure 3 and Table 3. By using small filters of size 1 × 1 × 256 (or 512 or 1024) or 1 × 1 × 128 (or 256 or 512), the number of filter parameters that require training is significantly reduced. The problem of information loss, which is the limitation of deep CNN, can be solved using the shortcut to maintain the residual information that has not been reduced by the convolution filter. This is the most remarkable characteristic of this ResNet [24]. There are many types of ResNets, such as ResNet-50, -101, and -152, which are most clearly distinguished by the number of iterations shown in Table 3 [24]. In this study, we compared the performance of AlexNet [27], ResNet-50, and ResNet-152 on the basis of various numbers of age classes (see details in Section 4.3).
We used the augmented PAL and MORPH databases, explained in Section 4, to fine-tune the ResNet-152 CNN model. Batch normalization was conducted according to the average and standard deviation of the data obtained after each convolution layer. A ReLU layer was also applied as an activation function after each batch normalization, as shown in Equation (5) [28,29]:
where and are the input and output of a ReLU function, respectively. As shown in Equation (5), since the output range of y can be reduced to 0 or a positive value, the ReLU function can be partially or sparsely activated, and thus can facilitate the training of the CNN model. Besides, the mathematical equation for training becomes simpler and can prevent the vanishing gradient problem [28,30]. The softmax function [31,32] can be applied to the FC layer output to detect an age class that corresponds to the input face ROI, as shown in Equation (6):
When the array of output neurons is set to s, the probability of the neurons belonging to the jth class is obtained by dividing the value of the jth element by the sum of the values of all elements.
The final class categorization in the classification layer selects the element with the highest probability among the values obtained from softmax regression [32] as the final estimated age. In this study, we significantly increased the amount of learning data to prevent overfitting, and used the data augmentation method [27] to improve learning speed (see details in Section 4.1).
4. Experimental Results
4.1. Experimental Data and Environment
We selected input facial images from the PAL database as shown in Figure 4 [33,34]. This database classifies the ages of 576 persons who are between 18 and 93 years old. In ethnicity, the database consists of 76% Caucasian, 16% African-American, and the remaining 8% as Asian, South Asian, and Hispanic backgrounds.
For the 580 PAL database images of 576 persons, the following data augmentation was used [27,35]: 17 cases underwent vertical and horizontal image translation and cropping with the previously detected face region (Figure 2c), and horizontal mirroring was applied to the images to get the augmented data of 19,720 (= 580 × 17 × 2) images. Sample images by this data augmentation can be seen in [35].
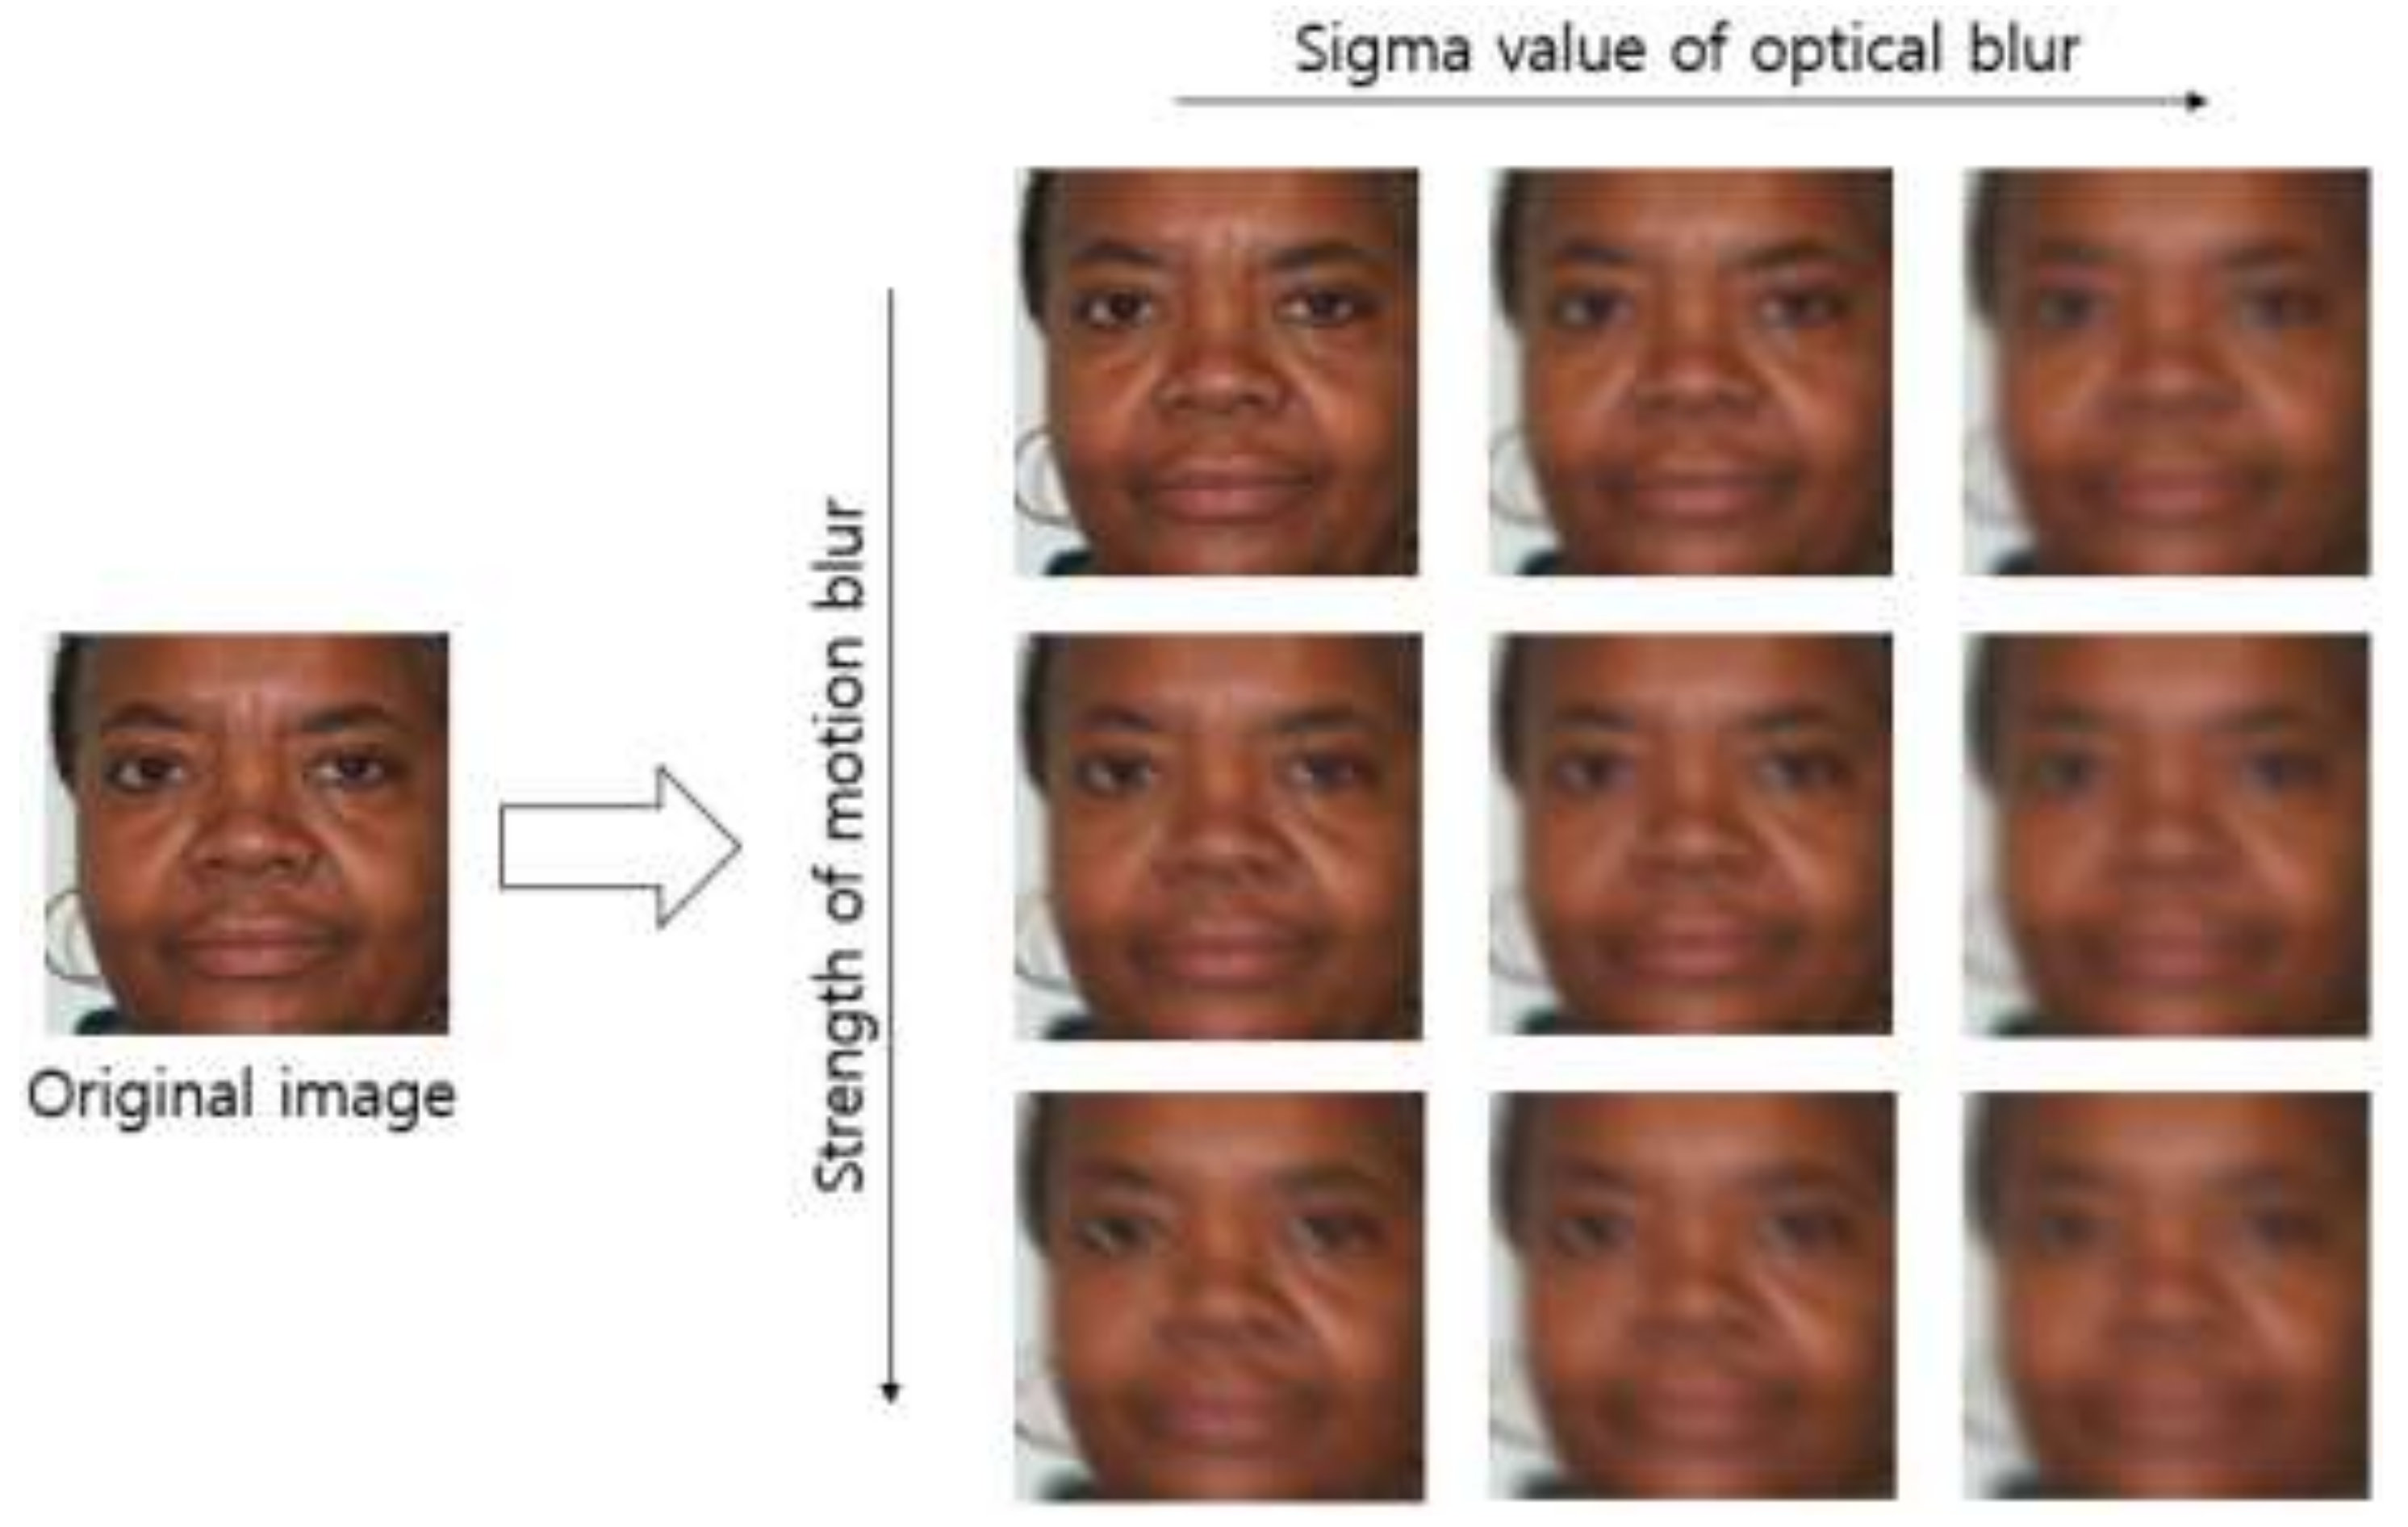
There is no open database of images obtained in a blurring environment. For this reason, we created artificially blurred images by applying five sigma values of Gaussian filtering to optical blurring, four directions of motion blur on the basis of the point spread function of motion blurring, which was introduced in study [36], and seven types of strength of motion blur. In other words, 81,200 (= 580 × 5 (sigma value) × 4 (motion direction) × 7 (strength of motion blur)) optical and motion blurred images were added. Consequently, 100,920 (= 19,720 + 81,200) pieces of data were obtained. Figure 5 shows some examples of the generated optical and motion blurred images.
For the experiment, we used a desktop computer equipped with a 3.50 GHz CPU (Intel (R) Core (TM) i7-3770K) [37] and 24 GB RAM. Windows Caffe [38] was utilized for training and testing. We used an Nvidia graphic card with 1920 compute unified device architecture (CUDA) cores and 8 GB memory (Nvidia GeForce GTX 1070) [39]. To extract the face ROI, we used the C/C++ program and OpenCV library [40] with Microsoft Visual Studio 2015 [41].
4.2. Training
This study applied fourfold cross-validation [42] to 100,920 augmented pieces of data to conduct learning in each fold. In other words, 75,690 (= 100,920 × (3/4)) pieces of data were used for learning. The testing, which is explained in Section 4.3, used the original images that were not augmented. The stochastic gradient descent (SGD) method [43], as shown in Equation (7), was used to train the CNN:
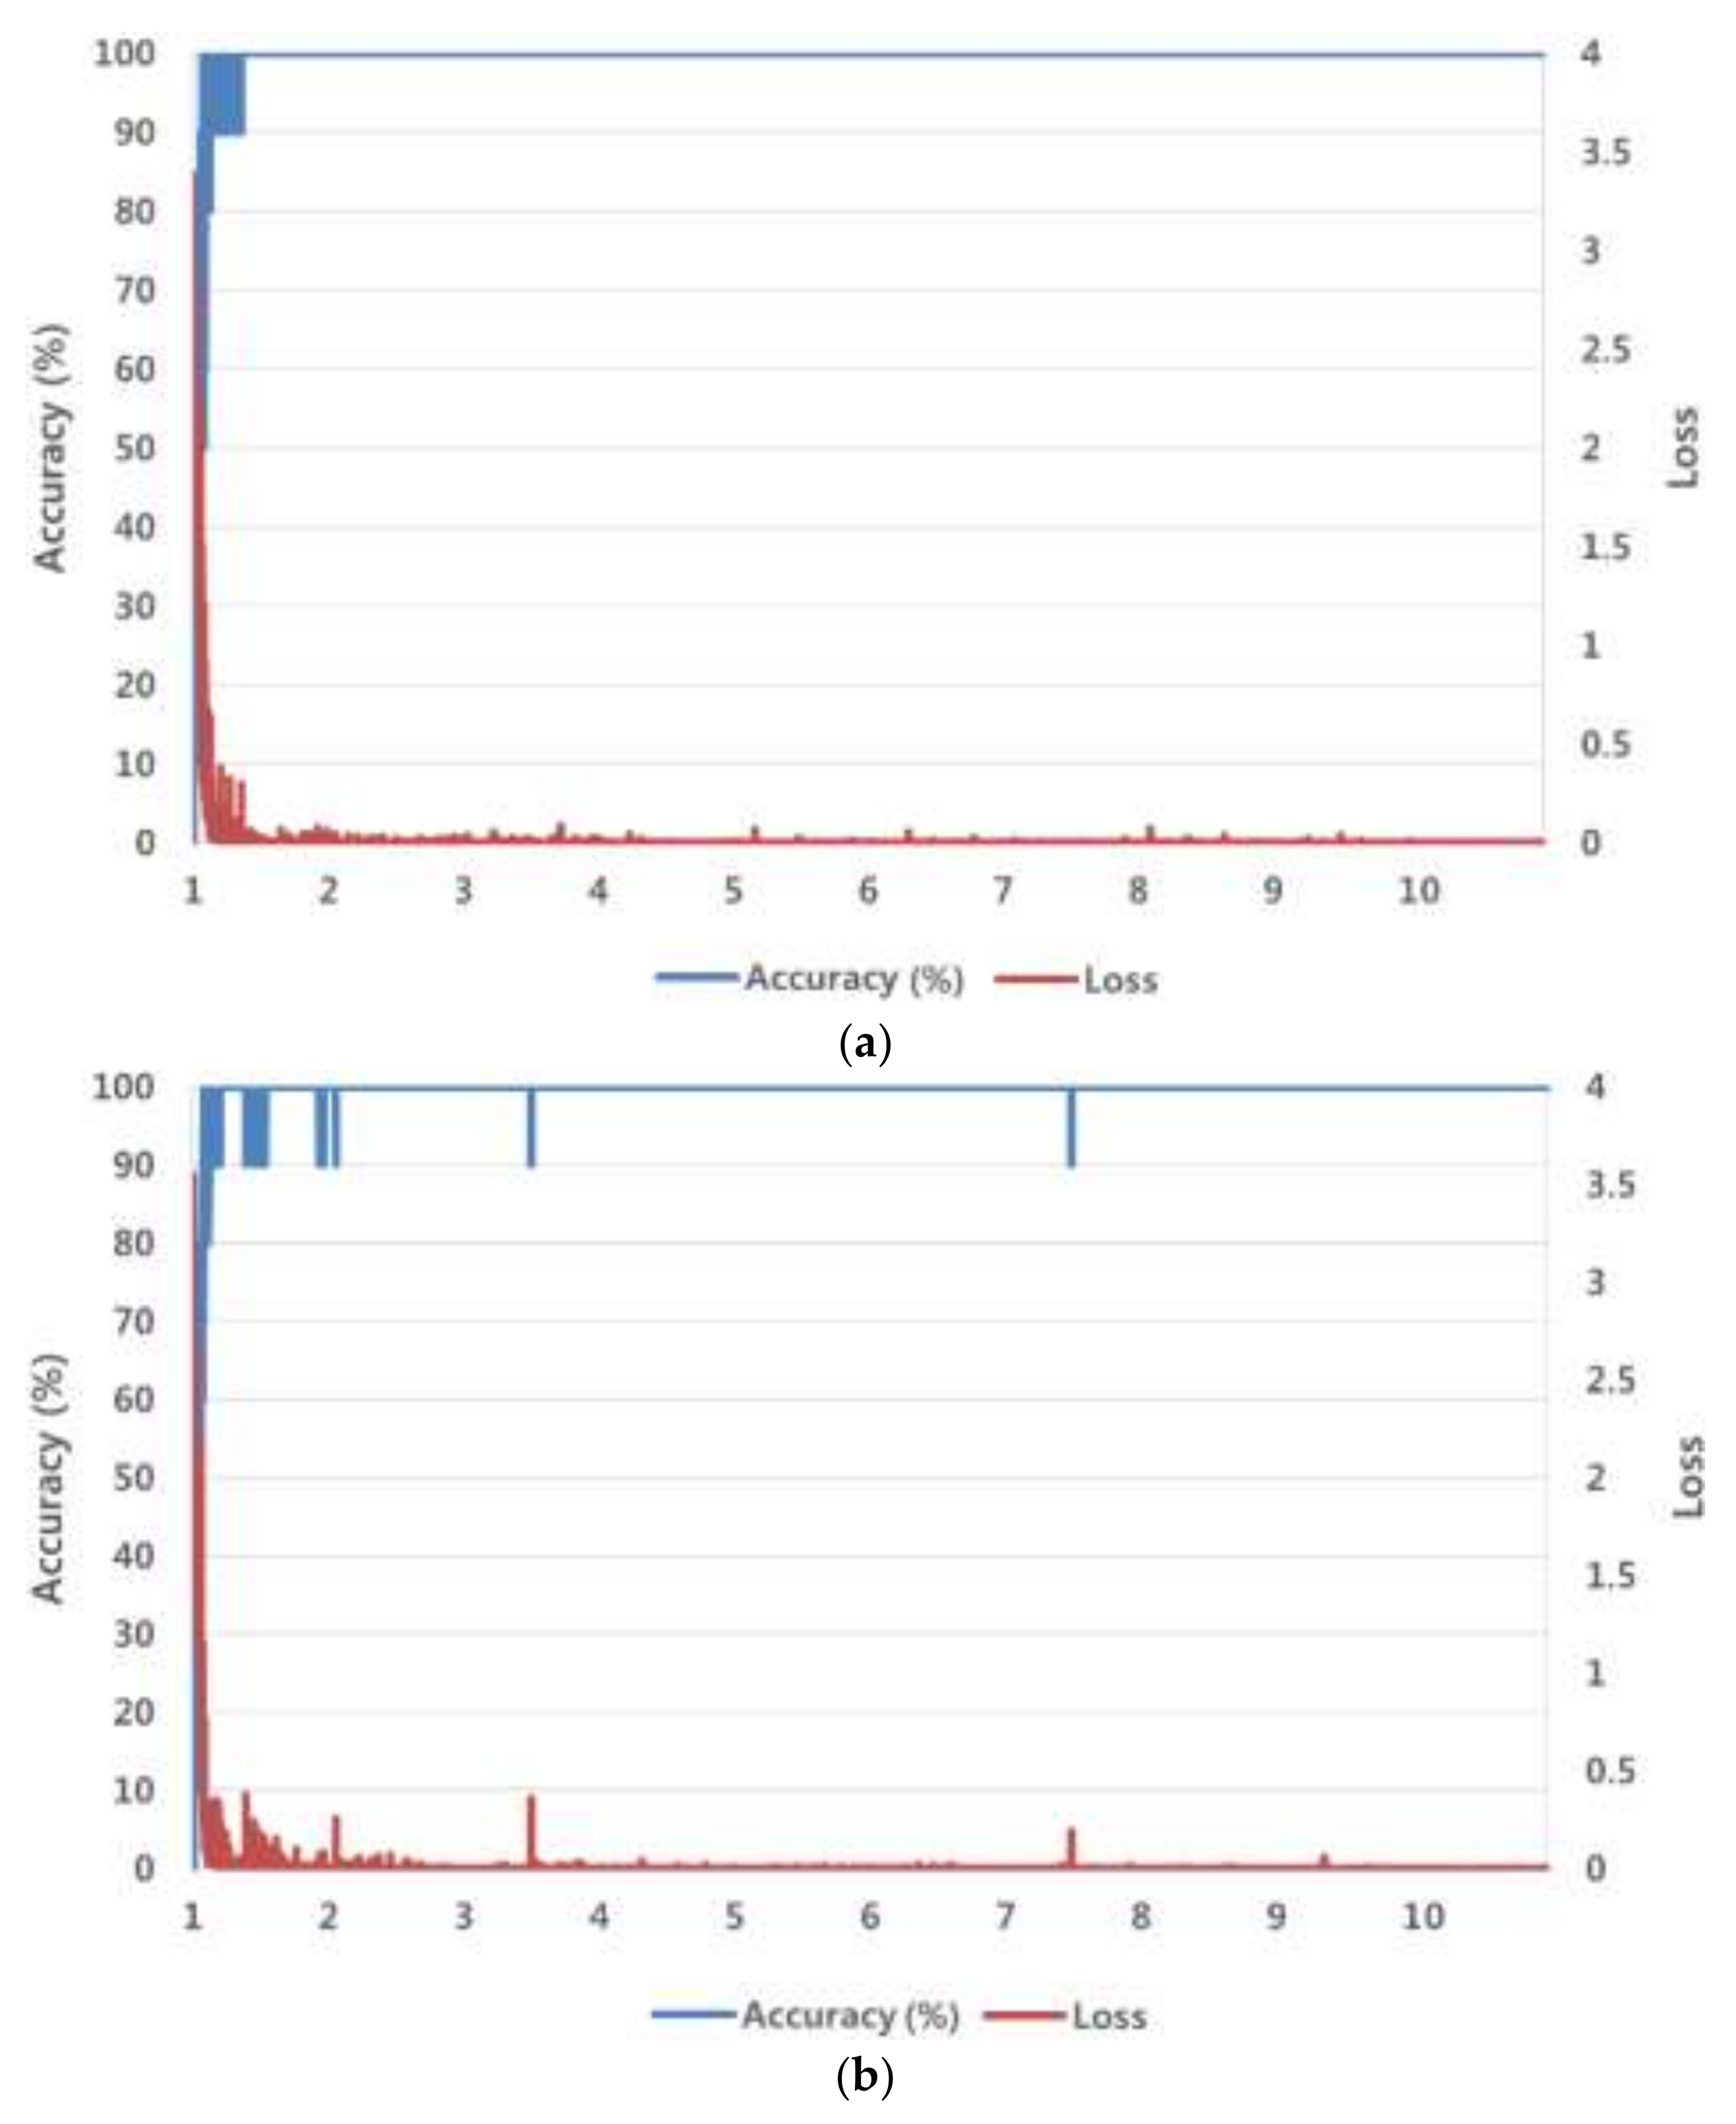
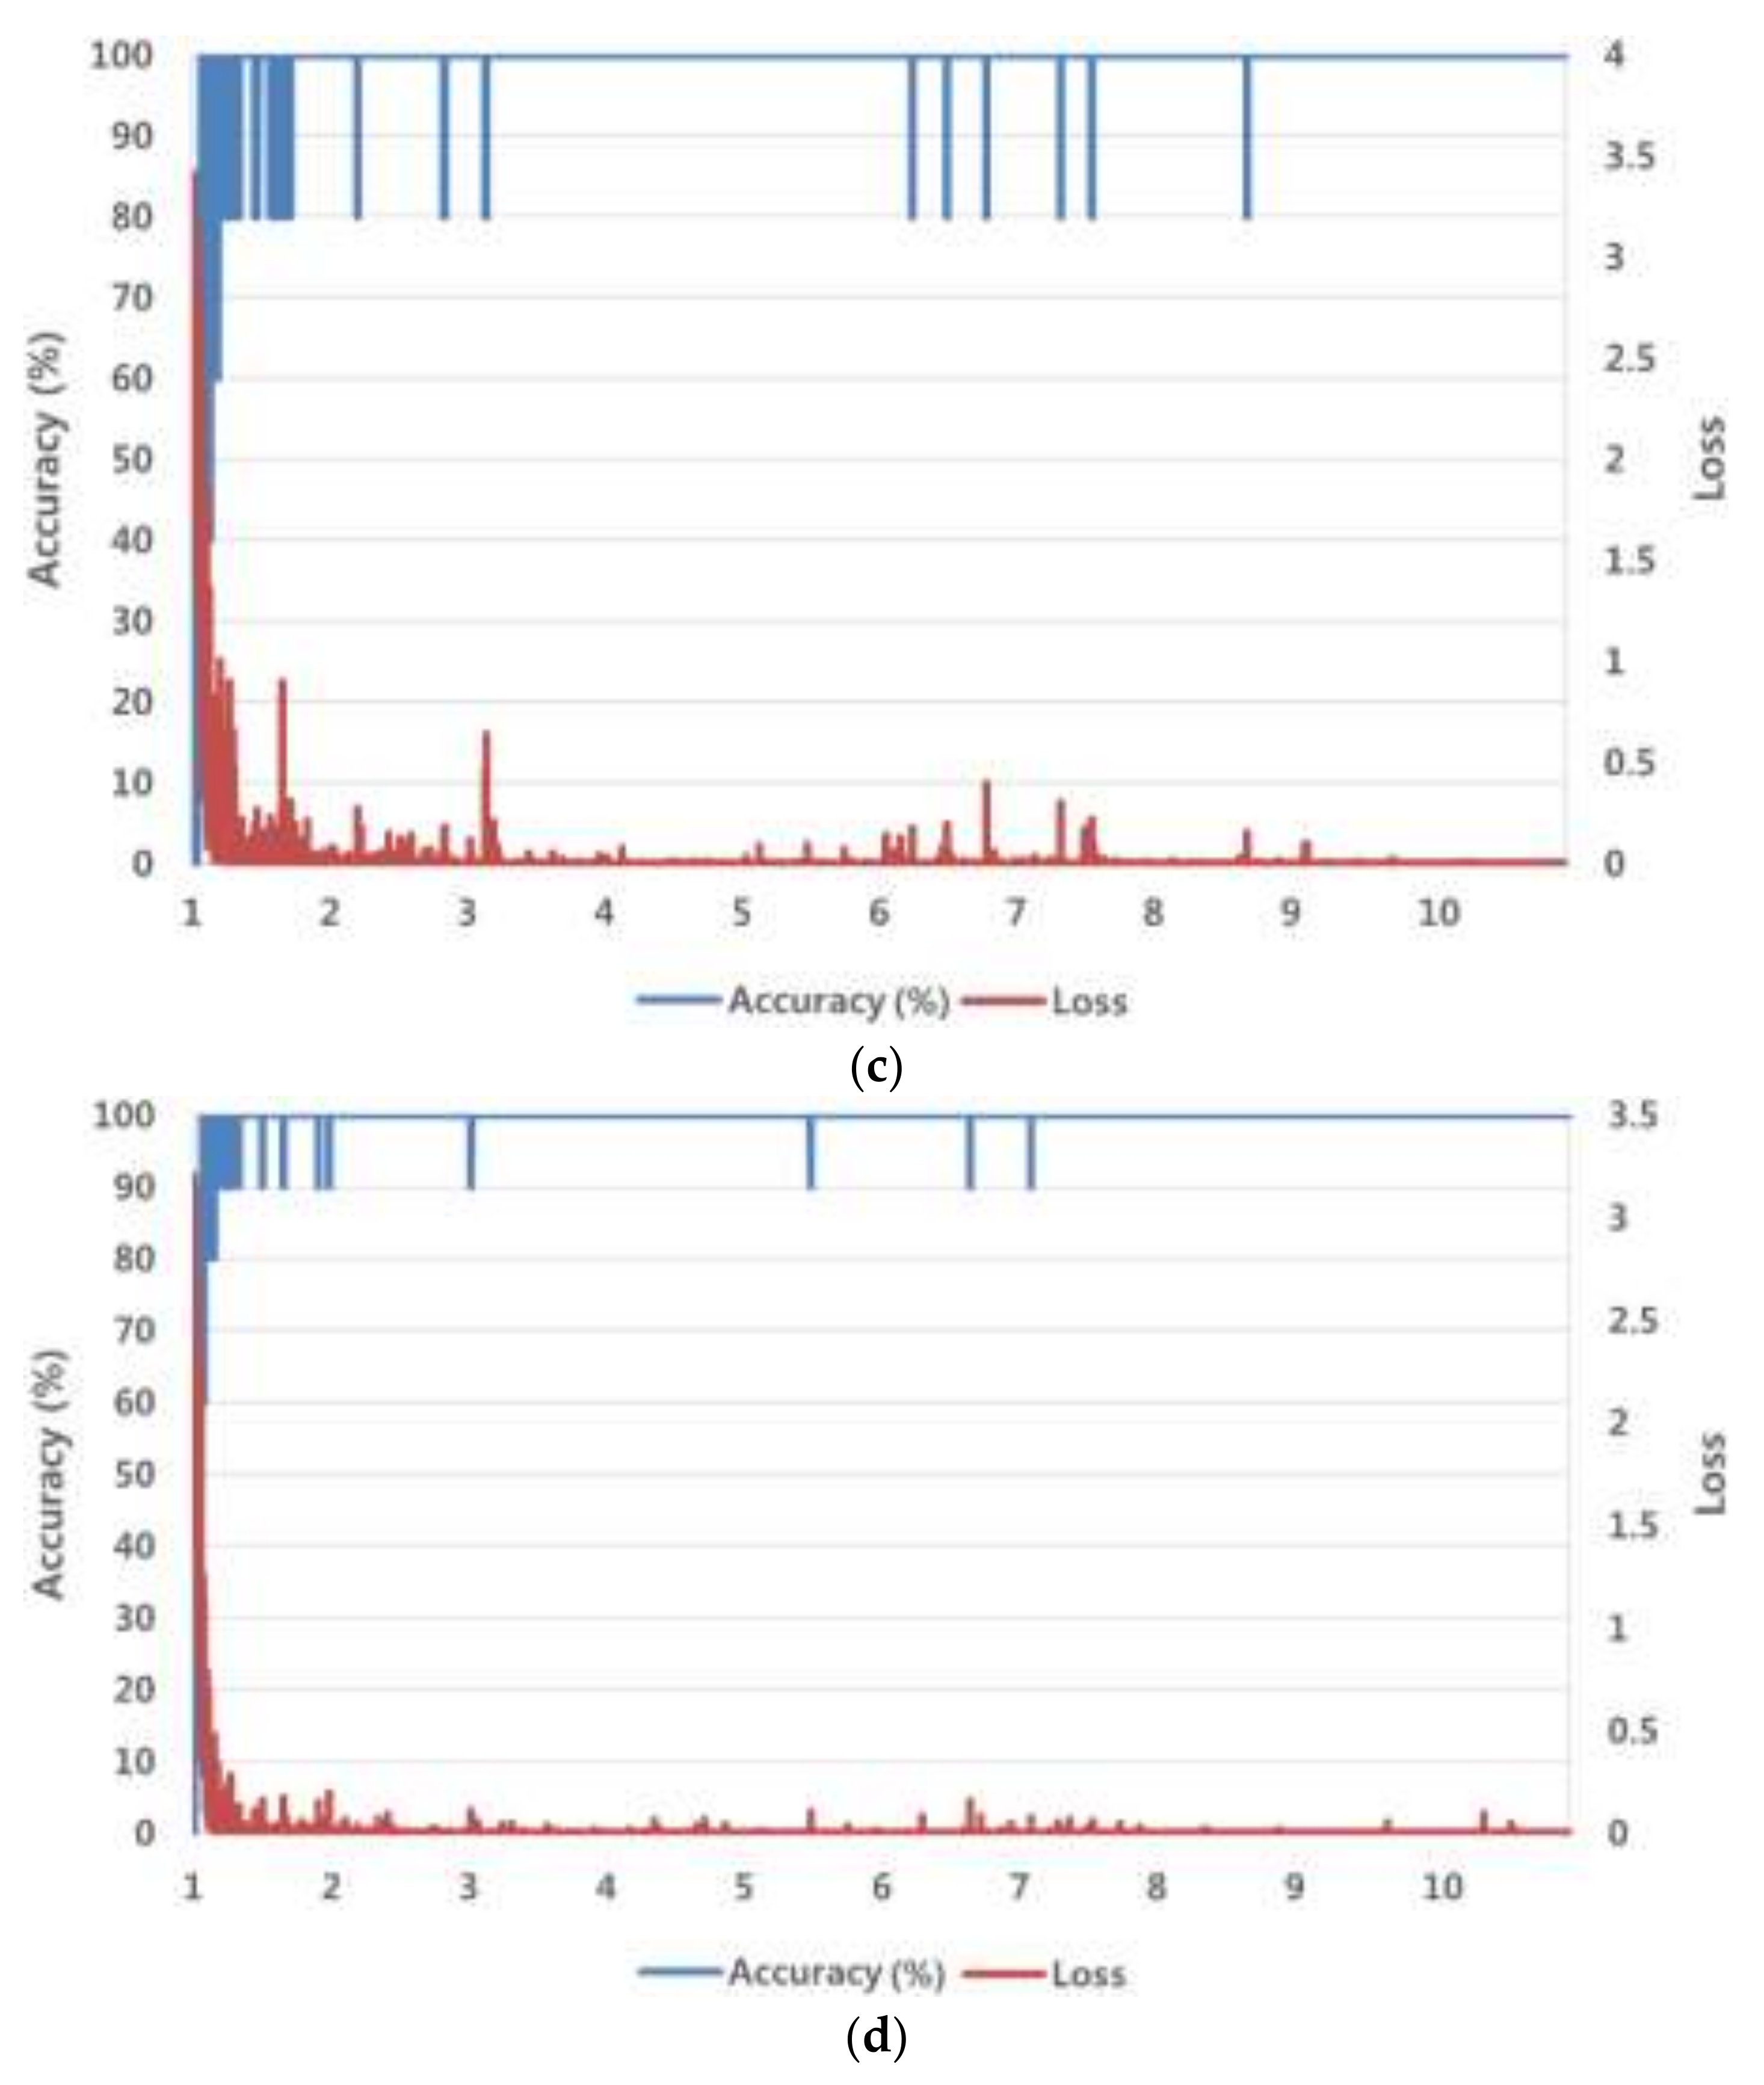
where is the weight to be trained, is the learning rate, and is the loss function. This method obtains the optimal by iterating the learning until the loss function is converged. The SGD method finds an optimal weight, which minimizes the difference between the desired and calculated outputs, as the derivative base. Unlike the existing gradient descent (GD) method, the SGD method defines the size of the training set divided by the mini-batch size as iteration. One epoch is the time in which training is completed as many times as the number of iterations. The training is conducted for the predetermined epochs. This study used the following parameters for the SGD method: mini-batch size = 5, learning rate = 0.001, learning rate drop factor = 0.1, learning rate drop period = 10, L2 regularization = 0.0001, momentum = 0.9. For the meaning of each parameter, please refer to [44]. During the training, data were shuffled and the learning rate was multiplied by the learning rate drop factor for each 10-epoch period. The weights used in the FC layer were initialized randomly using a Gaussian distribution with mean = 0 and standard deviation = 0.001, and the biases were initialized as default 0. Figure 6 shows graphs of the training loss value and training accuracy value (%), which were obtained by training the ResNet-152 with the SGD method for the number of epochs. We experimentally determined the optimal parameters for the SGD method so as to obtain the lowest loss value and the highest accuracy of training data, shown in Figure 6. As shown in the figure, the training made the loss and accuracy approach 0% and 100%, respectively, which indicates a good result.
Figure 7 shows an example of the trained filter images. These filters are used in Conv1 in Table 3, and 64 filters of 7 × 7 size are displayed, as in Table 3. The figure is an enlargement of the 7 × 7 size for visibility. That is, we trained CNN that can extract the important low-, mid-, and high-frequency features (as shown in Figure 7) for age estimation robust to the various qualities of input image, such as unblurred, optical blurred, or motion blurred images.
4.3. Testing with PAL Database
We conducted testing by using the original 81,780 (= 580 + 81,200) images, which were not augmented, as explained in Section 4.1. Here, 580 pieces were the original PAL database images obtained from 576 persons, and 81,200 pieces were the optical and motion blurred images artificially created from the 580 pieces according to motion blur direction (four directions) and strength (seven degrees), as explained in Section 4.1. As also mentioned above, since the fourfold cross-validation was applied to training and testing, testing was conducted with 20,445 (= 81,780/4) pieces for each fold.
Summarized explanations of training and testing images are as follows. From the original 580 PAL images, 19,720 (= 580 × 2 × 17) images were obtained by data augmentation, which included horizontal mirroring, and 17 cases of vertical and horizontal image translation with cropping. Then, 81,200 (= 580 × 5 (sigma value of Gaussian function) × 4 (motion direction) × 7 (strength of motion blur)) optical and motion blurred images were obtained from the original 580 PAL images. Consequently, 100,920 (= 19,720 + 81,200) images were finally obtained.
This study applied fourfold cross-validation [42]. In other words, 75,690 (= 100,920 × (3/4)) images were used for learning, and testing was conducted with 20,445 (= 81,780 (580 (original) + 81,200 (optical and motion blurred))/4) images without the augmented images for each fold.
In our experiments, images from the same person were not included in both training and testing folds. The persons in the data of the training fold were different from those in the testing fold. For example, in the PAL database, the total number of classes (persons) was 576, and data of 432 (576 × 3/4) classes (persons) were used for training, whereas data of another 144 classes (576 × 1/4) (persons) were used for testing. Because the number of classes was so large, it took too much time to leave one person out of cross-validation, because the experiment would have to be performed 576 times. Therefore, in our experiments, we performed fourfold cross-validation.
The PAL database includes various types of images, such as neutral, happy, and profile. Among them, the number of neutral and frontal images is 580 [33,34]. In previous research [11,12,16,17,18,19,21,22], they used these 580 images for experiments, and we used the same 580 images for comparison with previous methods, as shown in Table 4.
This study adopted MAE for age estimation accuracy, which has been widely used in existing studies [10,11,12,13,14,15,16,17,18,19,20,21,22]. The equation of MAE is as follows [45]:
where is the number of input images, is estimated age, and is ground-truth age. Table 4 presents the MAEs of age estimation produced by the existing methods using the original PAL database. As shown in the table, Belver et al.’s method showed the most accurate MAE of 3.79 years. However, this experimental result was based on the original unblurred images in the PAL database without optical and motion blurring. Optical and motion blurring make important facial age features, such as wrinkles and texture, vanish from the captured images, thereby increasing error in age estimation. For this reason, as mentioned above, we evaluated the age estimation performance for the original PAL database images and the optical and motion blurred images.
Comparative evaluation of performance was performed by varying the number of classes, which is the final output node of ResNet-152 in Table 3. Since the PAL database, as explained in Section 4.1, was established based on data of people in the age range 18 to 93, the total number of classes of age should be 76 (= 93 − 18 + 1). However, there is no image in the PAL database for two age classes, so the total number of classes becomes 74. Accordingly, to obtain the results of ResNet-152 for every age, we conducted training and testing by designating the number of classes, which is the final output node of ResNet-152, i.e., 74.
However, there were too many final output nodes of ResNet-152, which were reduced to decrease the complexity of the CNN structure and training. That is, if we tried to estimate age by one-year intervals, the number of output nodes in ResNet-152 should be 74. Using many output nodes increases the complexity of the CNN structure and makes its training difficult. Therefore, we reduced the number of output nodes in ResNet-152 by the following methods.
When the data were classified by age classes divided into three-year intervals, as shown in Table 5, the number of final output nodes of ResNet-152 decreased from 74 to 25. Similarly, when the data were classified by age classes divided into five-year intervals, the number of final output nodes decreased from 74 to 15. In addition, when the data were classified by age classes divided into seven-year intervals, as shown in Table 5, the number of final output nodes decreased from 74 to 11. In each case, the output age obtained by CNN was the middle age of each age range, as shown in Table 5.
Besides using ResNet-152, we also compared the age estimation performance of the various existing CNN models, such as AlexNet and ResNet-50. As is clear from Table 6, ResNet-152 with 25 classes (age classes divided into three-year intervals) had the lowest MAE, 6 years. That is, ResNet-152 including 152 layers showed higher accuracy than ResNet-50 including 50 layers and AlexNet including 8 layers. This result was lower than those in the existing research [21,22] by about 0.42–0.48 year, but unlike the current study, these studies considered either optical blur [22] or motion blur [21], not both types of blur at the same time. In addition, since the existing studies [21,22] conducted preclassification of direction or degree of blur, a long processing time was needed, a separate training of classifier for preclassification was necessary, and an age estimator needed to be separately trained according to the preclassification results. This increased system complexity. On the other hand, this research did not have a separate process of preclassification, but used a single ResNet-152 to design an age estimator that is robust to various conditions, including unblurred or optical and motion blurred. Among the existing studies, only [21,22] considered the blur of facial images, and thus we compared our study with those.
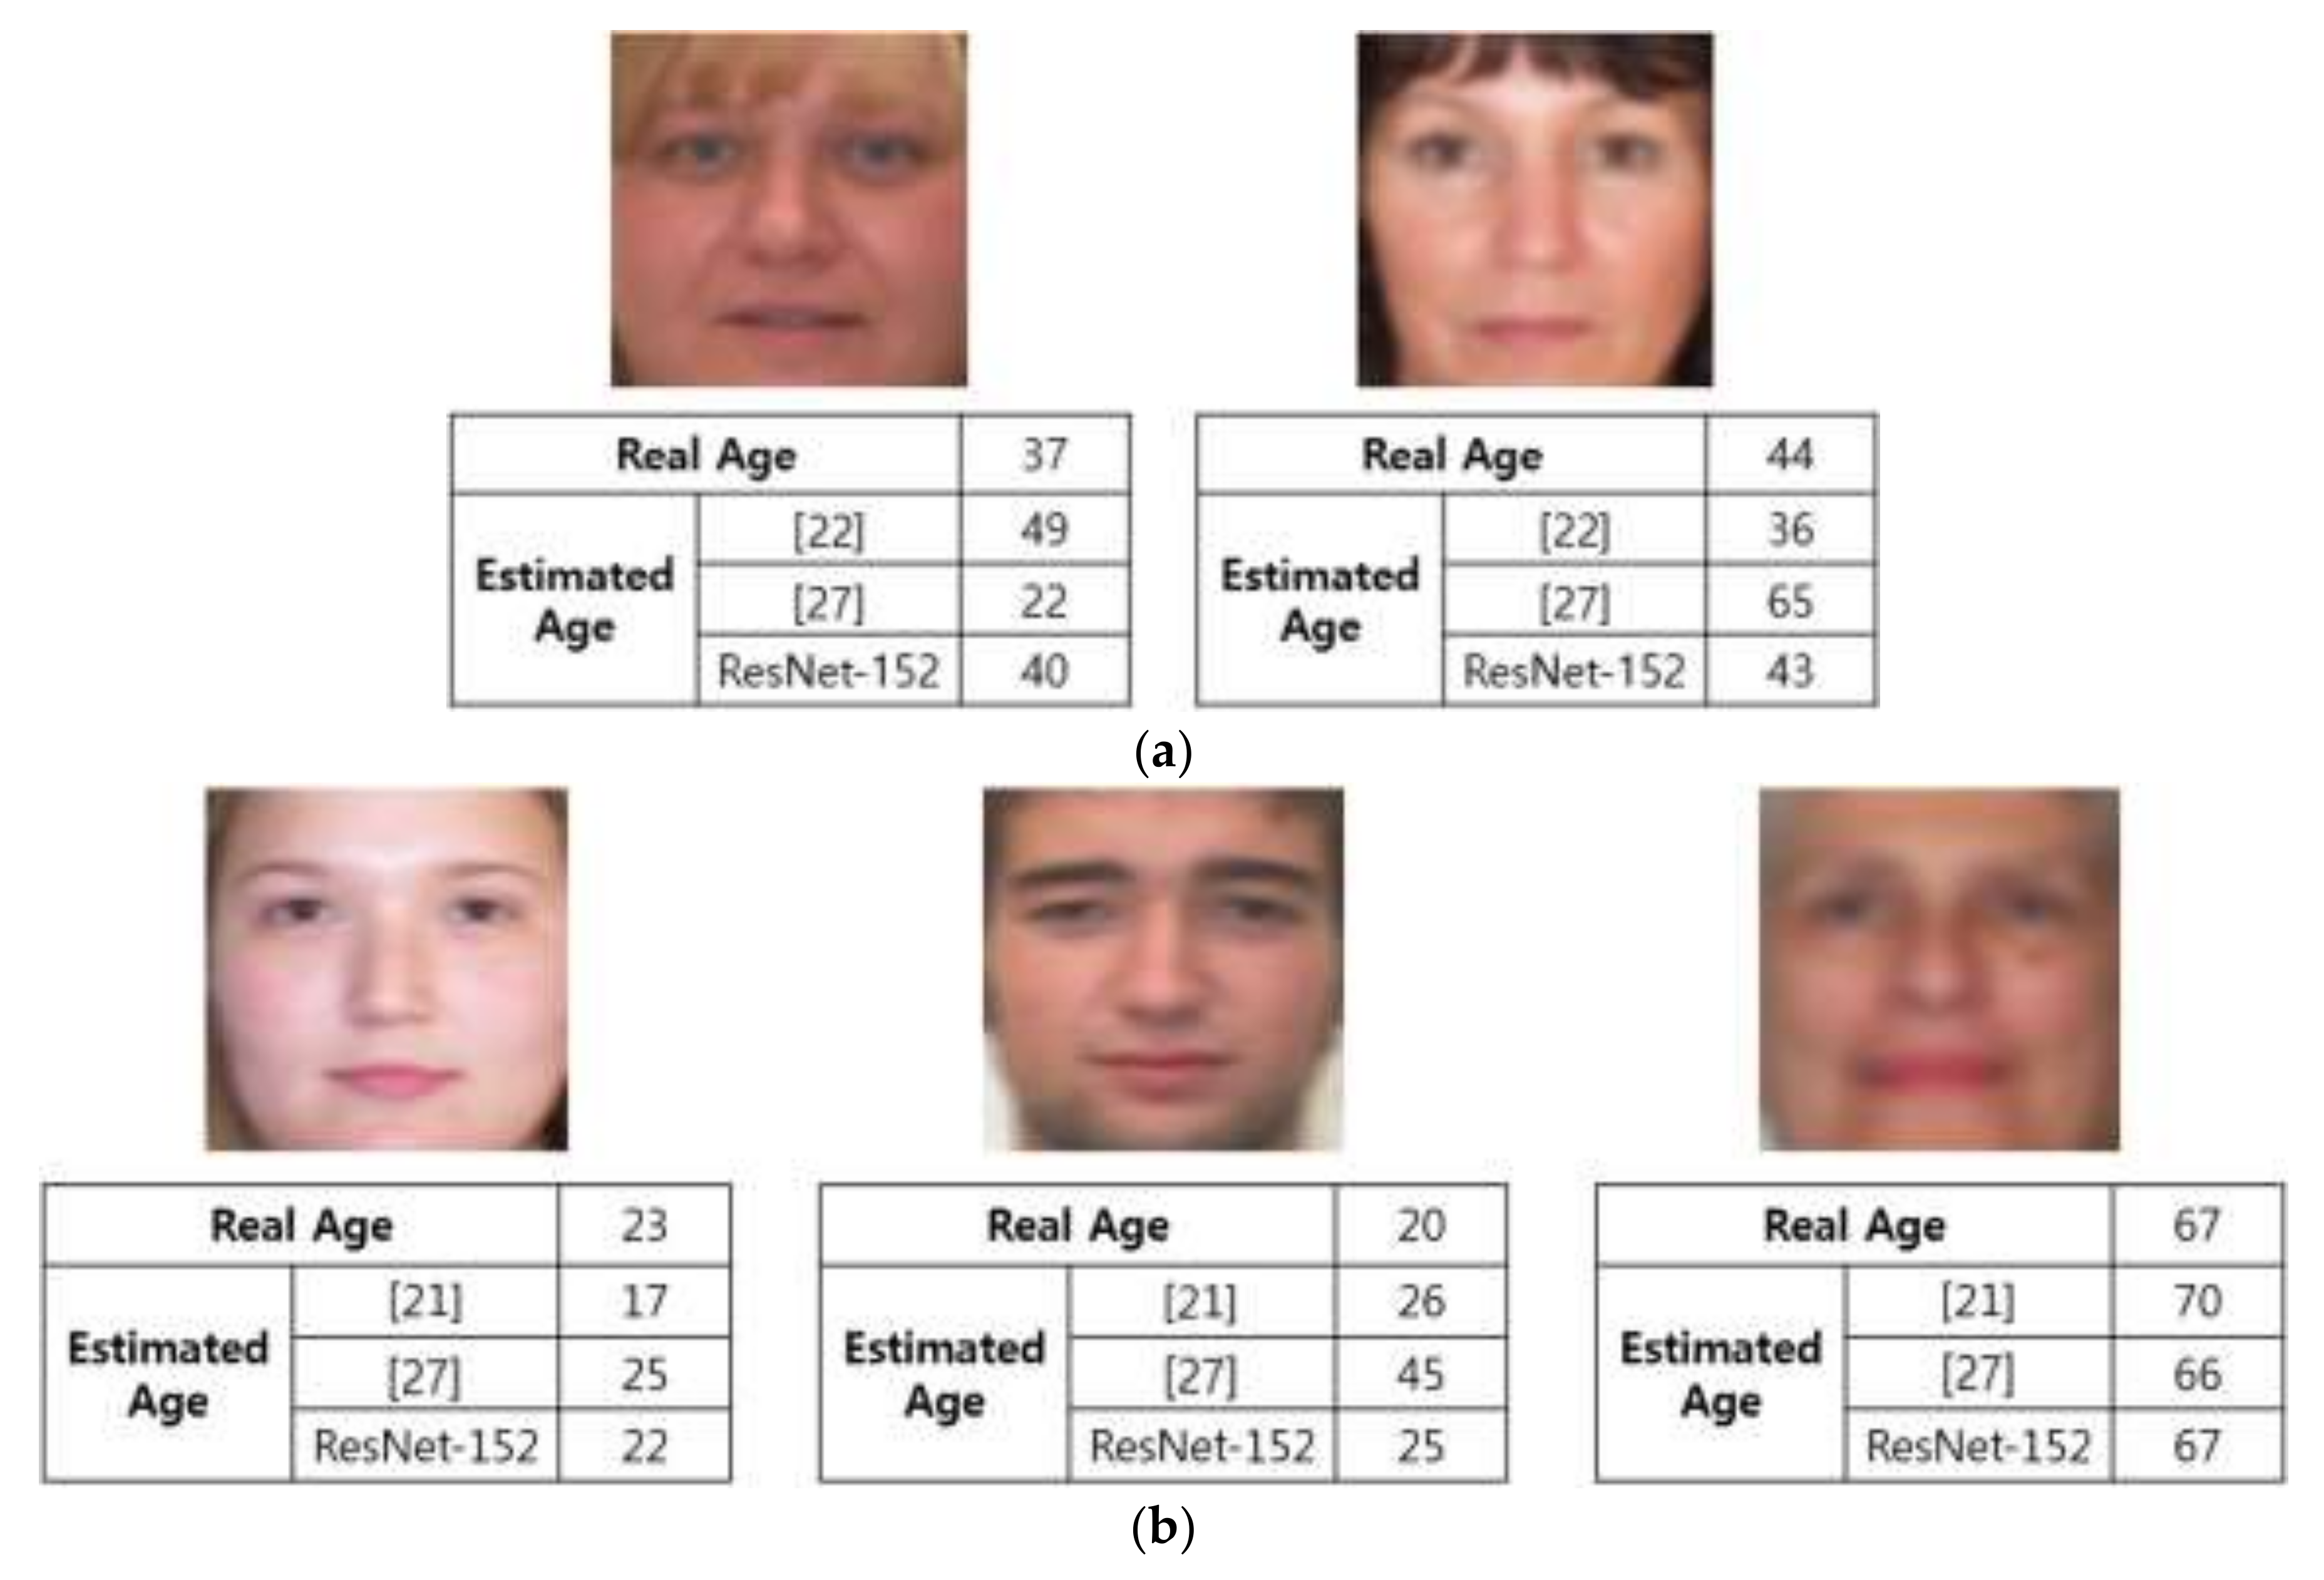
Figure 8 illustrates examples of age estimation by the proposed and existing methods. As seen in the figure, our method shows more accurate results of age estimation compared to previous methods.
4.4. Testing with MORPH Database
Our next experiment used the MORPH database, another open database. The MORPH database (album 2) contains 55,134 facial images of 13,617 individuals, with ages ranging from 16 to 77 years [46]. From this database, we randomly selected 1574 images of individuals of different genders ranging in age from 16 to 65 years for our new experiments. In detail, 31 or 32 images were randomly selected from each age class, 16 to 65 (50 age classes), to guarantee a demographic distribution of the images from the whole database.
The same methods as those described in Section 4.2 and Section 4.3 were applied to conduct data augmentation and create optical and motion blurred images, and fourfold cross-validation was used to obtain MAE, as with the PAL database. For the 1574 MORPH database images, the following data augmentation was used [27,35]: 17 cases underwent vertical and horizontal image translation and cropping with the previously detected face region (Figure 2c), and horizontal mirroring was applied to the images to get augmented data of 53,516 (= 1574 × 17 × 2) images. Sample images by this data augmentation can be seen in [35].
As with the PAL database, we created artificially blurred images by applying five sigma values of Gaussian filtering to optical blurring, four directions of motion blurring on the basis of the point spread function, which was introduced in [36], and seven types of strength of motion blur. In other words, 220,360 (= 1574 × 5 (sigma value) × 4 (motion direction) × 7 (strength of motion blur)) optical and motion blurred images were added. Consequently, 273,876 (= 53,516 + 220,360) pieces of data were obtained.
This study applied fourfold cross-validation [42] to 273,876 augmented pieces of data to conduct learning in each fold. In other words, 205,407 (= 273,876 × (3/4)) images were used for training. The testing used the original 221,934 (= 1574 + 220,360) images that were not augmented.
As shown in Table 7, Han et al. produced an age estimation MAE of 3.6 years, which was the most accurate result. However, this result is attributed to the experiment that dealt with the original unblurred MORPH database images, including no optical and motion blurred images. As mentioned above, this study evaluated age estimation performance by dealing with both the original MORPH database and optical and motion blurred images. Table 8 presents the results, comparing the proposed method and previous methods.
As with testing with the PAL database, as described in Section 4.3, comparative evaluation of performance was performed by varying the number of classes, which is the final output node of ResNet-152 in Table 8. Since the MORPH database used in our experiments included data of people in the age range 16 to 65, the total number of age classes should be 50 (= 65 − 16 + 1). Besides using ResNet-152, we also compared the age estimation performance of various existing CNN models, such as AlexNet and ResNet-50.
As is clear from Table 8, ResNet-152 with 17 classes (age classes divided into three-year intervals) had the lowest MAE, 5.78 years. That is, ResNet-152 including 152 layers shows higher accuracy than ResNet-50 including 50 layers and AlexNet including 8 layers. This result was lower than the results of the existing studies [21,22] by about 0.27–0.83 years.
The MAE with the MORPH database by our method was a little lower than that with the PAL database, as shown in Table 6 and Table 8. That is because the amount of training data in the MORPH database was larger than that of the PAL database.
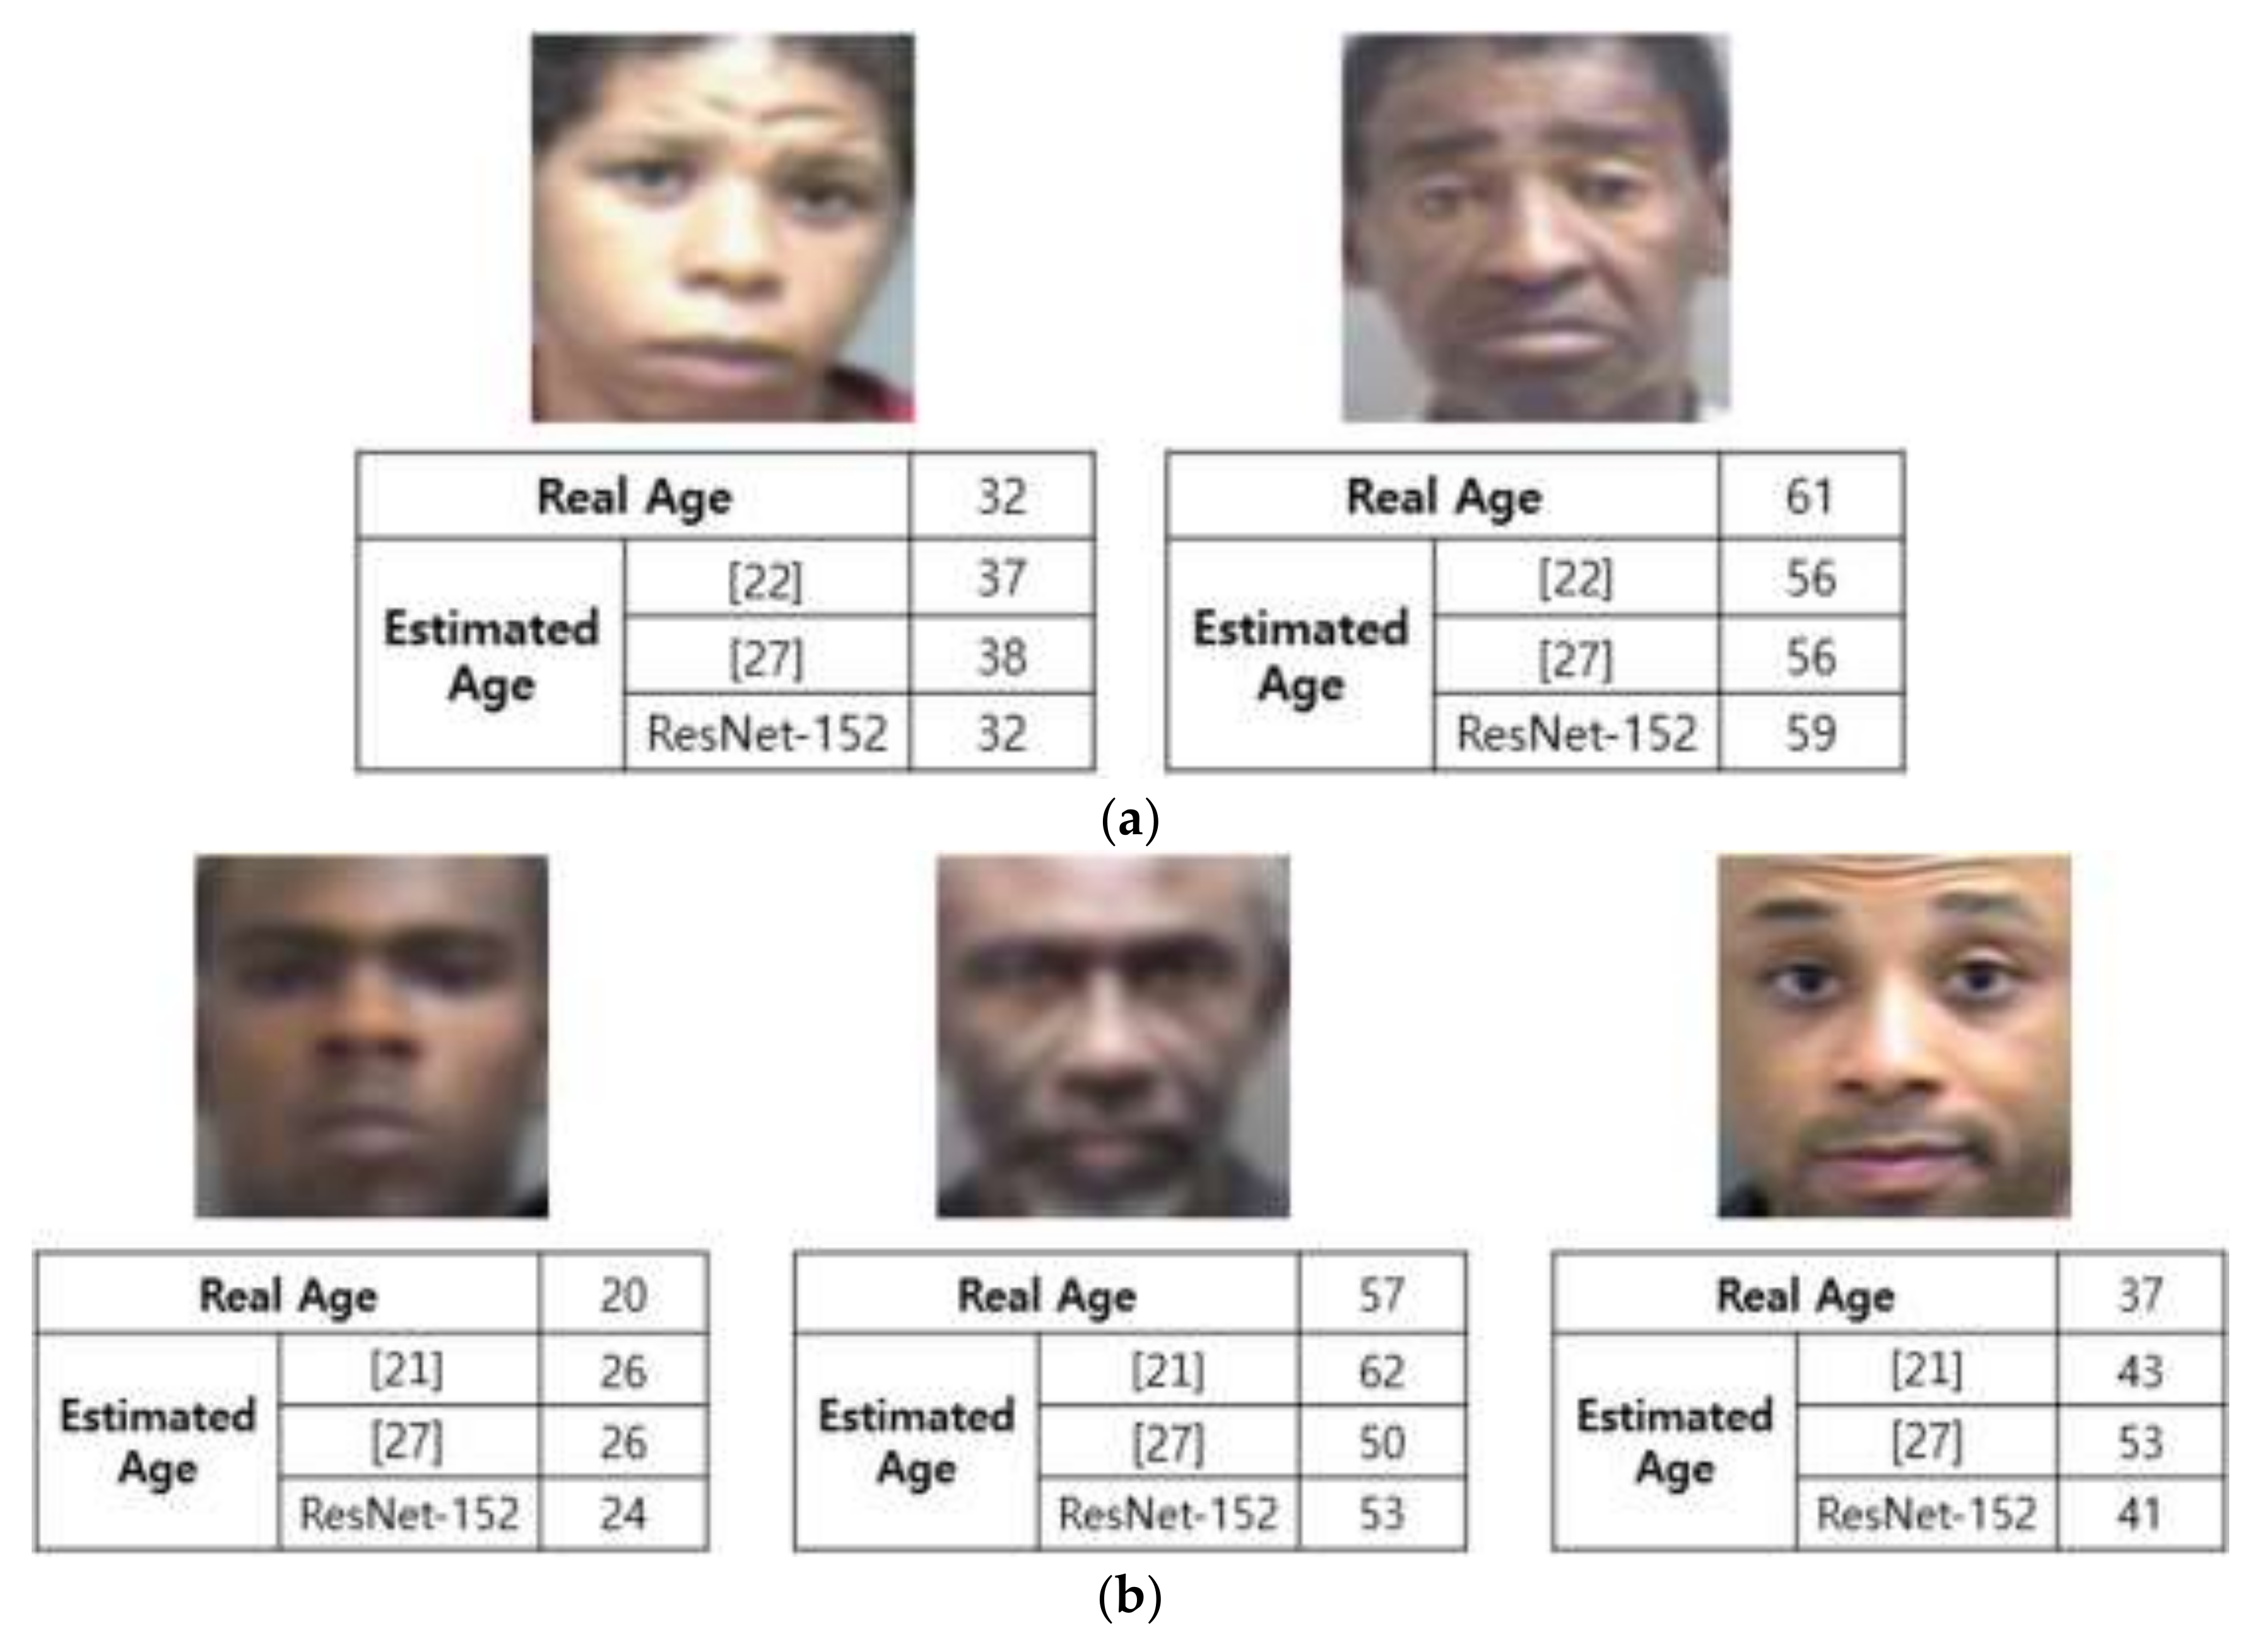
Figure 9 shows some age estimation results by the proposed method and the previous ones. As shown in this figure, our method shows more accurate results of age estimation compared to previous methods.
4.5. Comparing Accuracy by Another Age Estimation Method and Deblurring Method
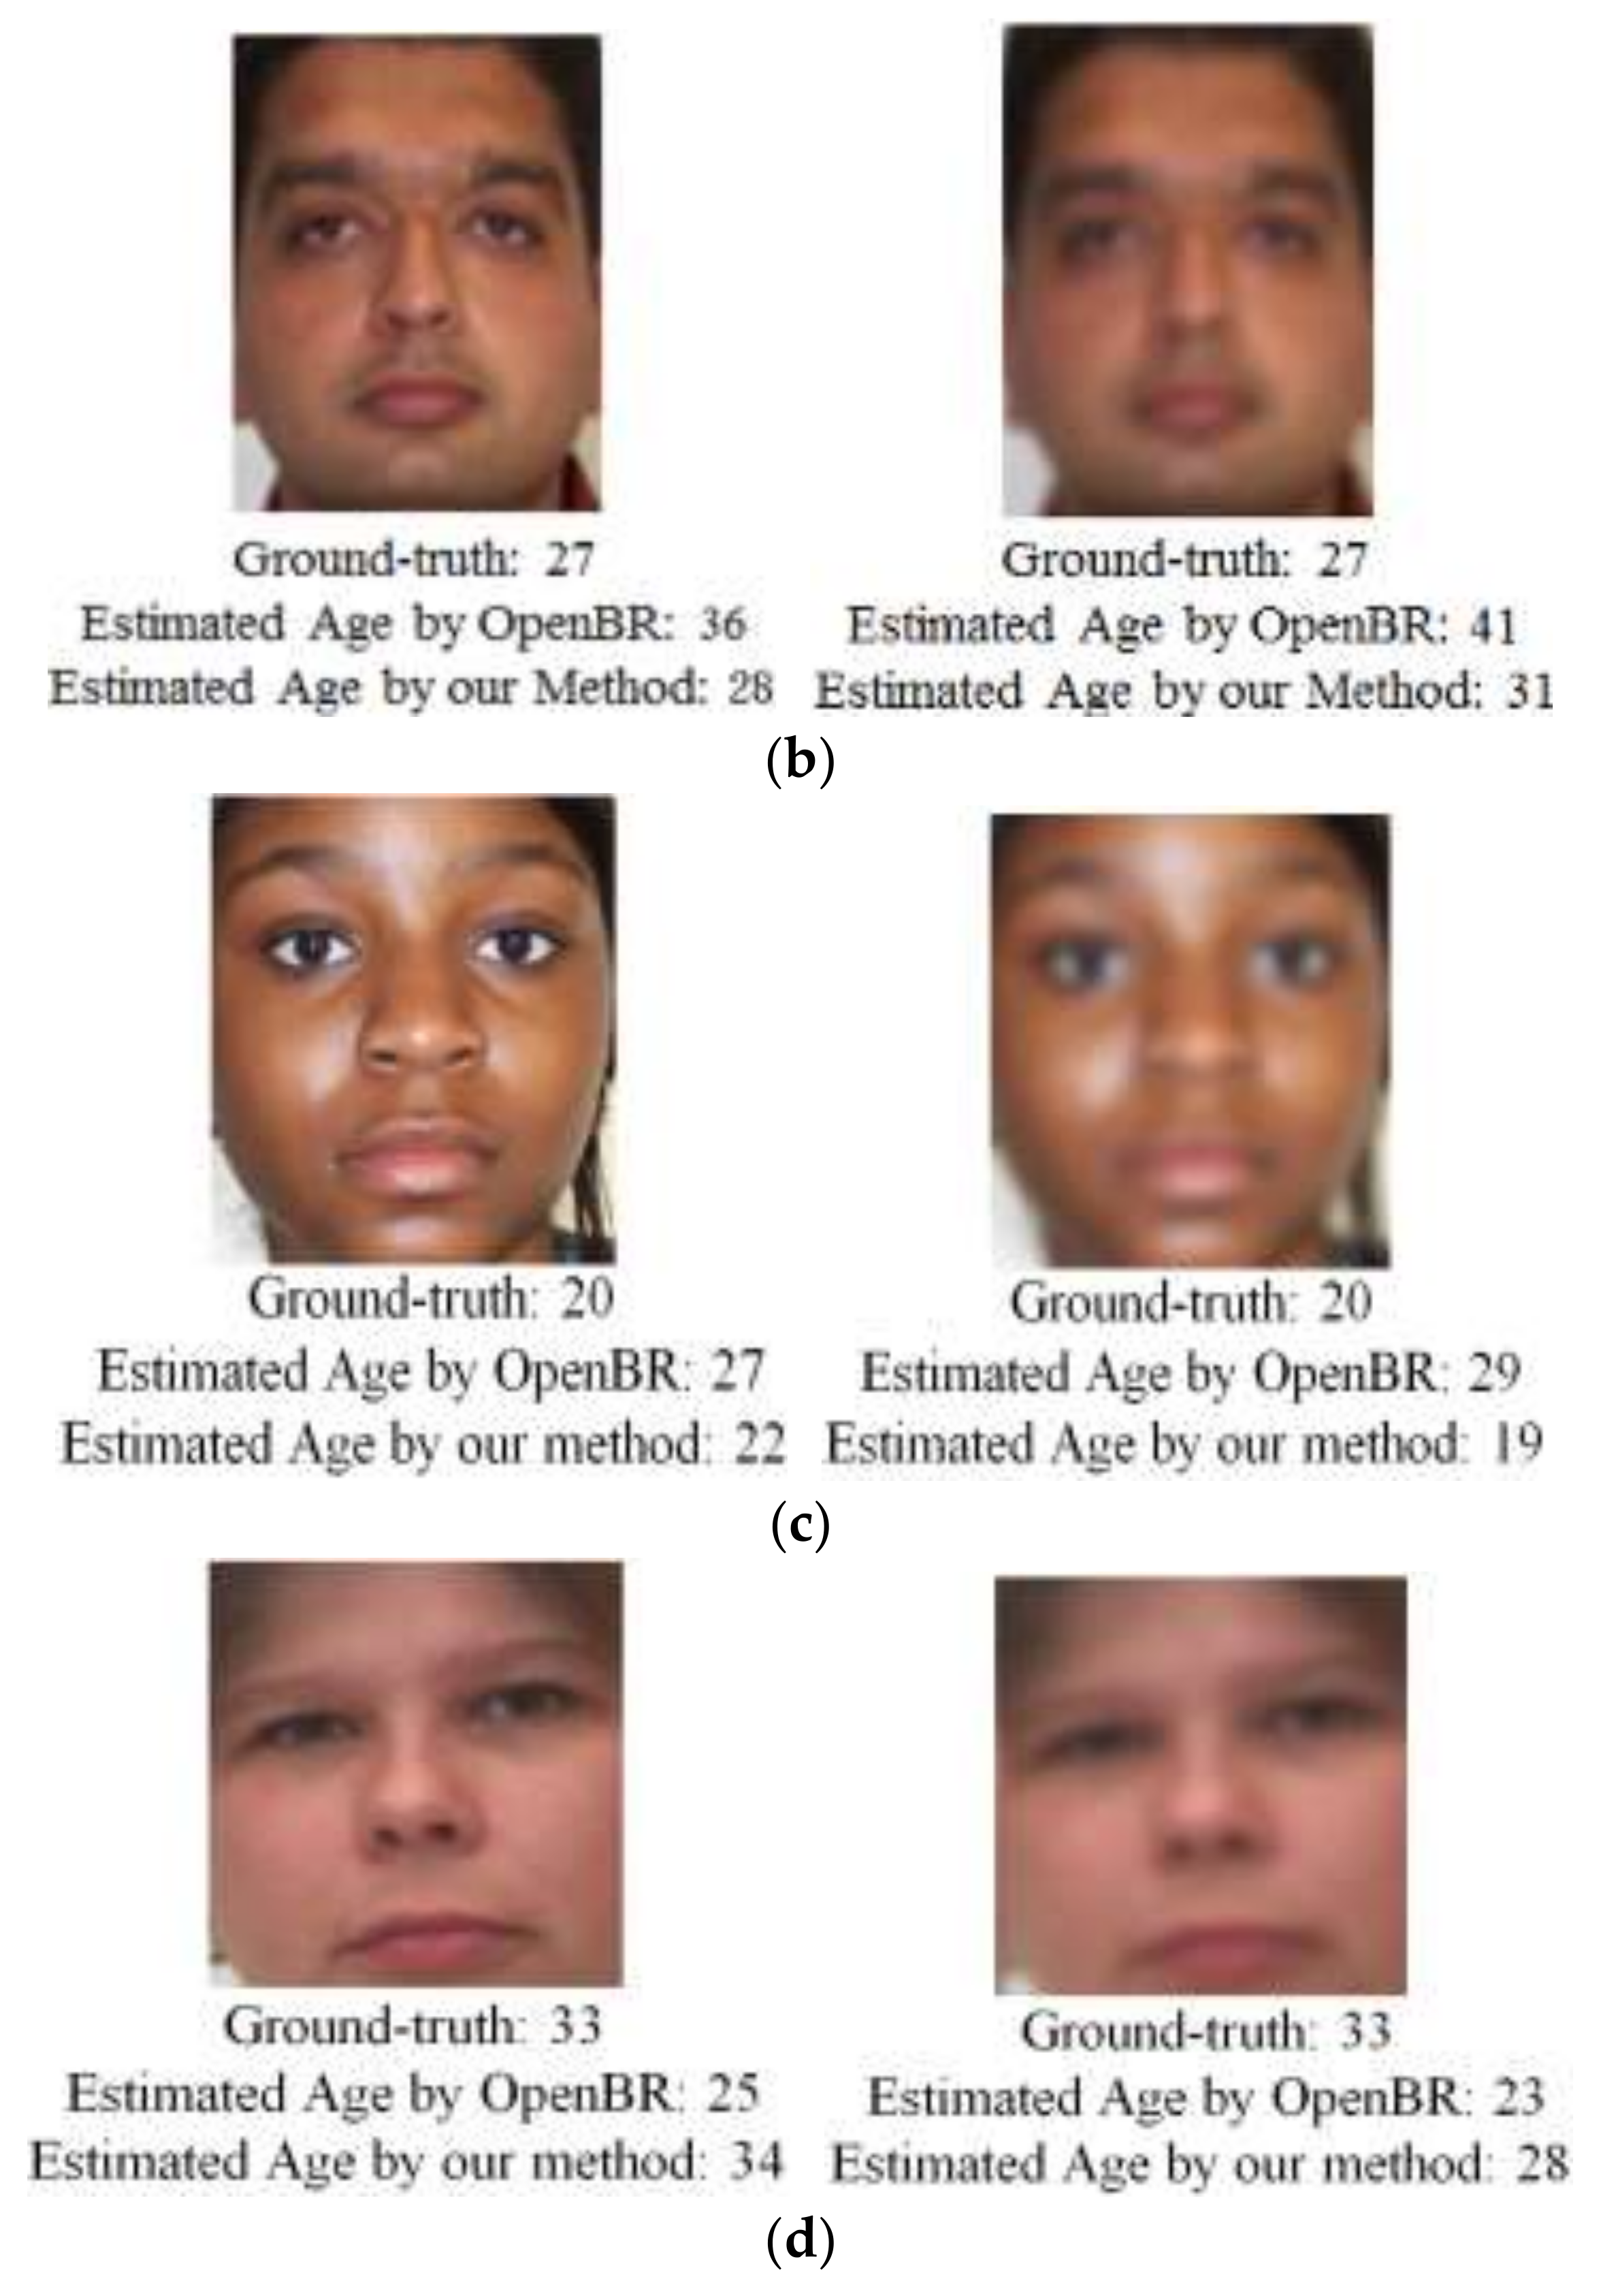
As the next experiment, we compared the accuracy of our method with that of another age estimation system, OpenBR [47]. For this purpose, we used all the original and blurred images of the PAL database, and the average MAE using the OpenBR age estimation method was about 16.72 years. Compared to our method, which produced an MAE of 6 years (Table 6), we can conclude that our method outperforms the OpenBR age estimation method. In Figure 10, we show some estimation results using our method and the OpenBR age estimation method. As shown in the figure, estimated ages by our method are closer to ground-truth ages than those by the OpenBR method irrespective of degree of blurring.
As the last experiment, we compared the performance of age estimation after the deblurring filter (Wiener filter) [48] with that of our CNN-based method on the original and blurred PAL database images as shown in Figure 11. Experimental results show that that the accuracy of age estimation by our method (MAE of 6 years, Table 6) is higher than that by age estimation after the deblurring filter (MAE of 8.12 years).
4.6. Comparing Accuracy According to Changes in Image Resolution
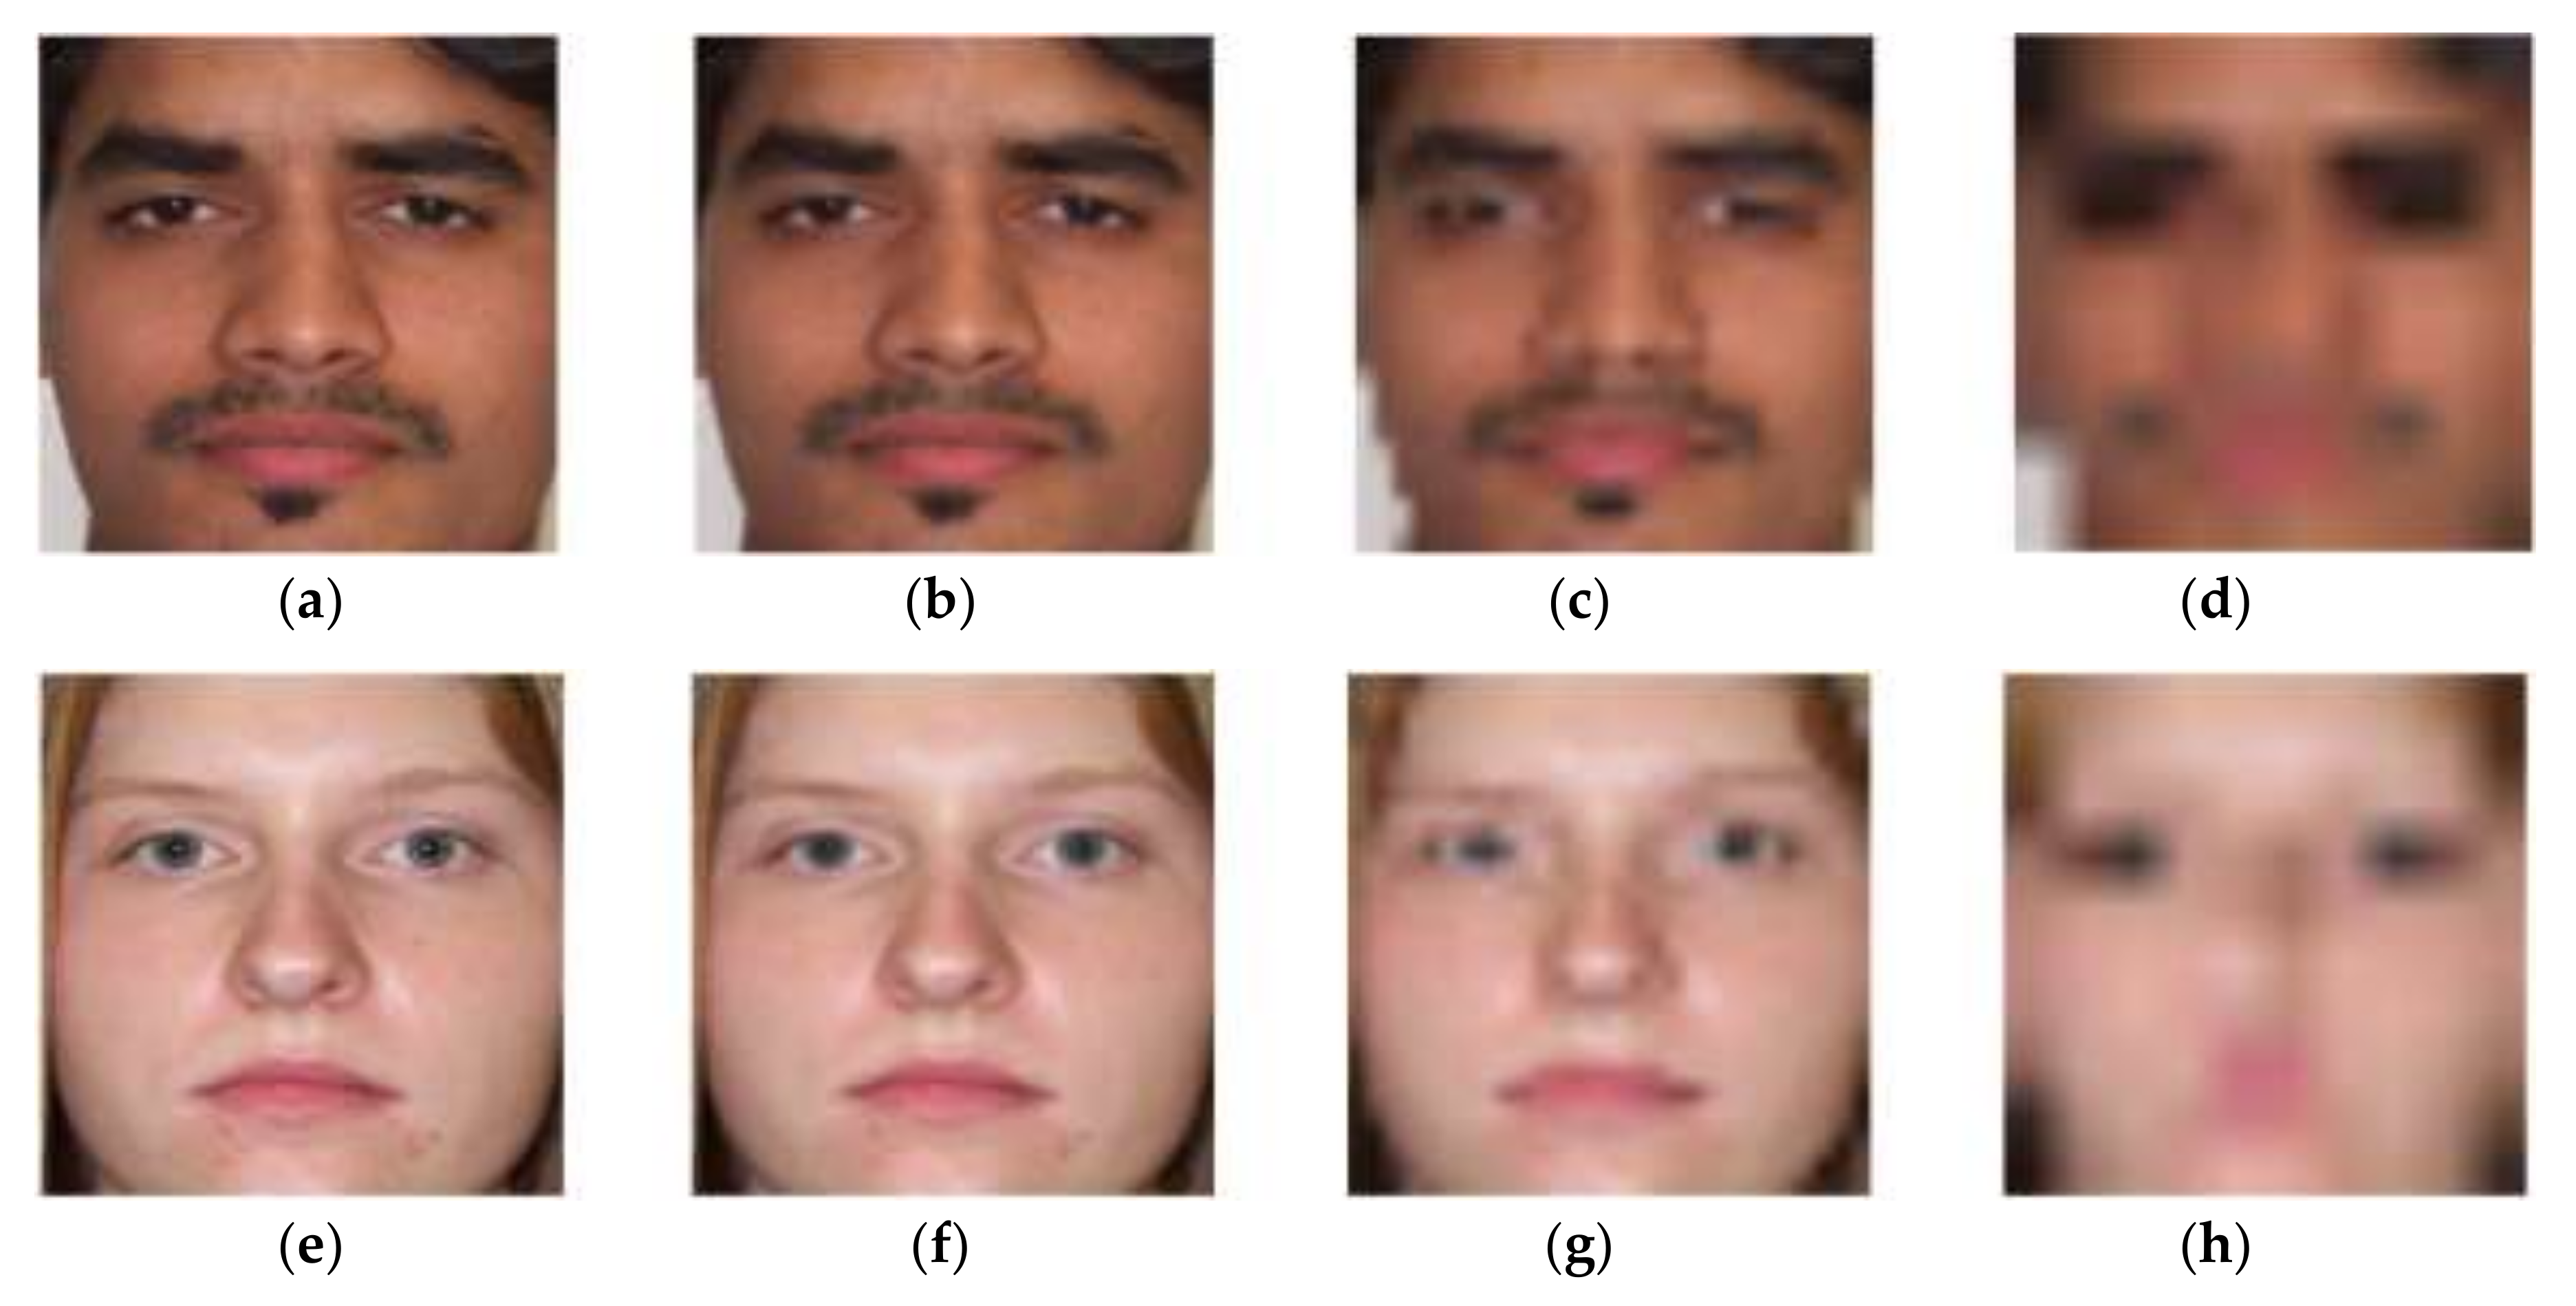
We compared the accuracy of age estimation according to reduced image size (smaller pixel sizes), as shown in Figure 12 and Table 9. Because ResNet-152 shows the highest accuracy, as shown in Table 6 and Table 8, this CNN was used for the experiments. As shown in Table 9, the MAE of age estimation with original images is 4.55, and it increased with reduced image resolution (MAE of 8.21 in a subsampled image of 1/512). In a subsampled image of 1/8, the MAE increase was not large, but in subsampled images of 1/64 and 1/512 the increase was much larger. That is because all the important information, such as wrinkles, disappears in the subsampled images.
4.7. Comparing Accuracy with Self-Collected Database
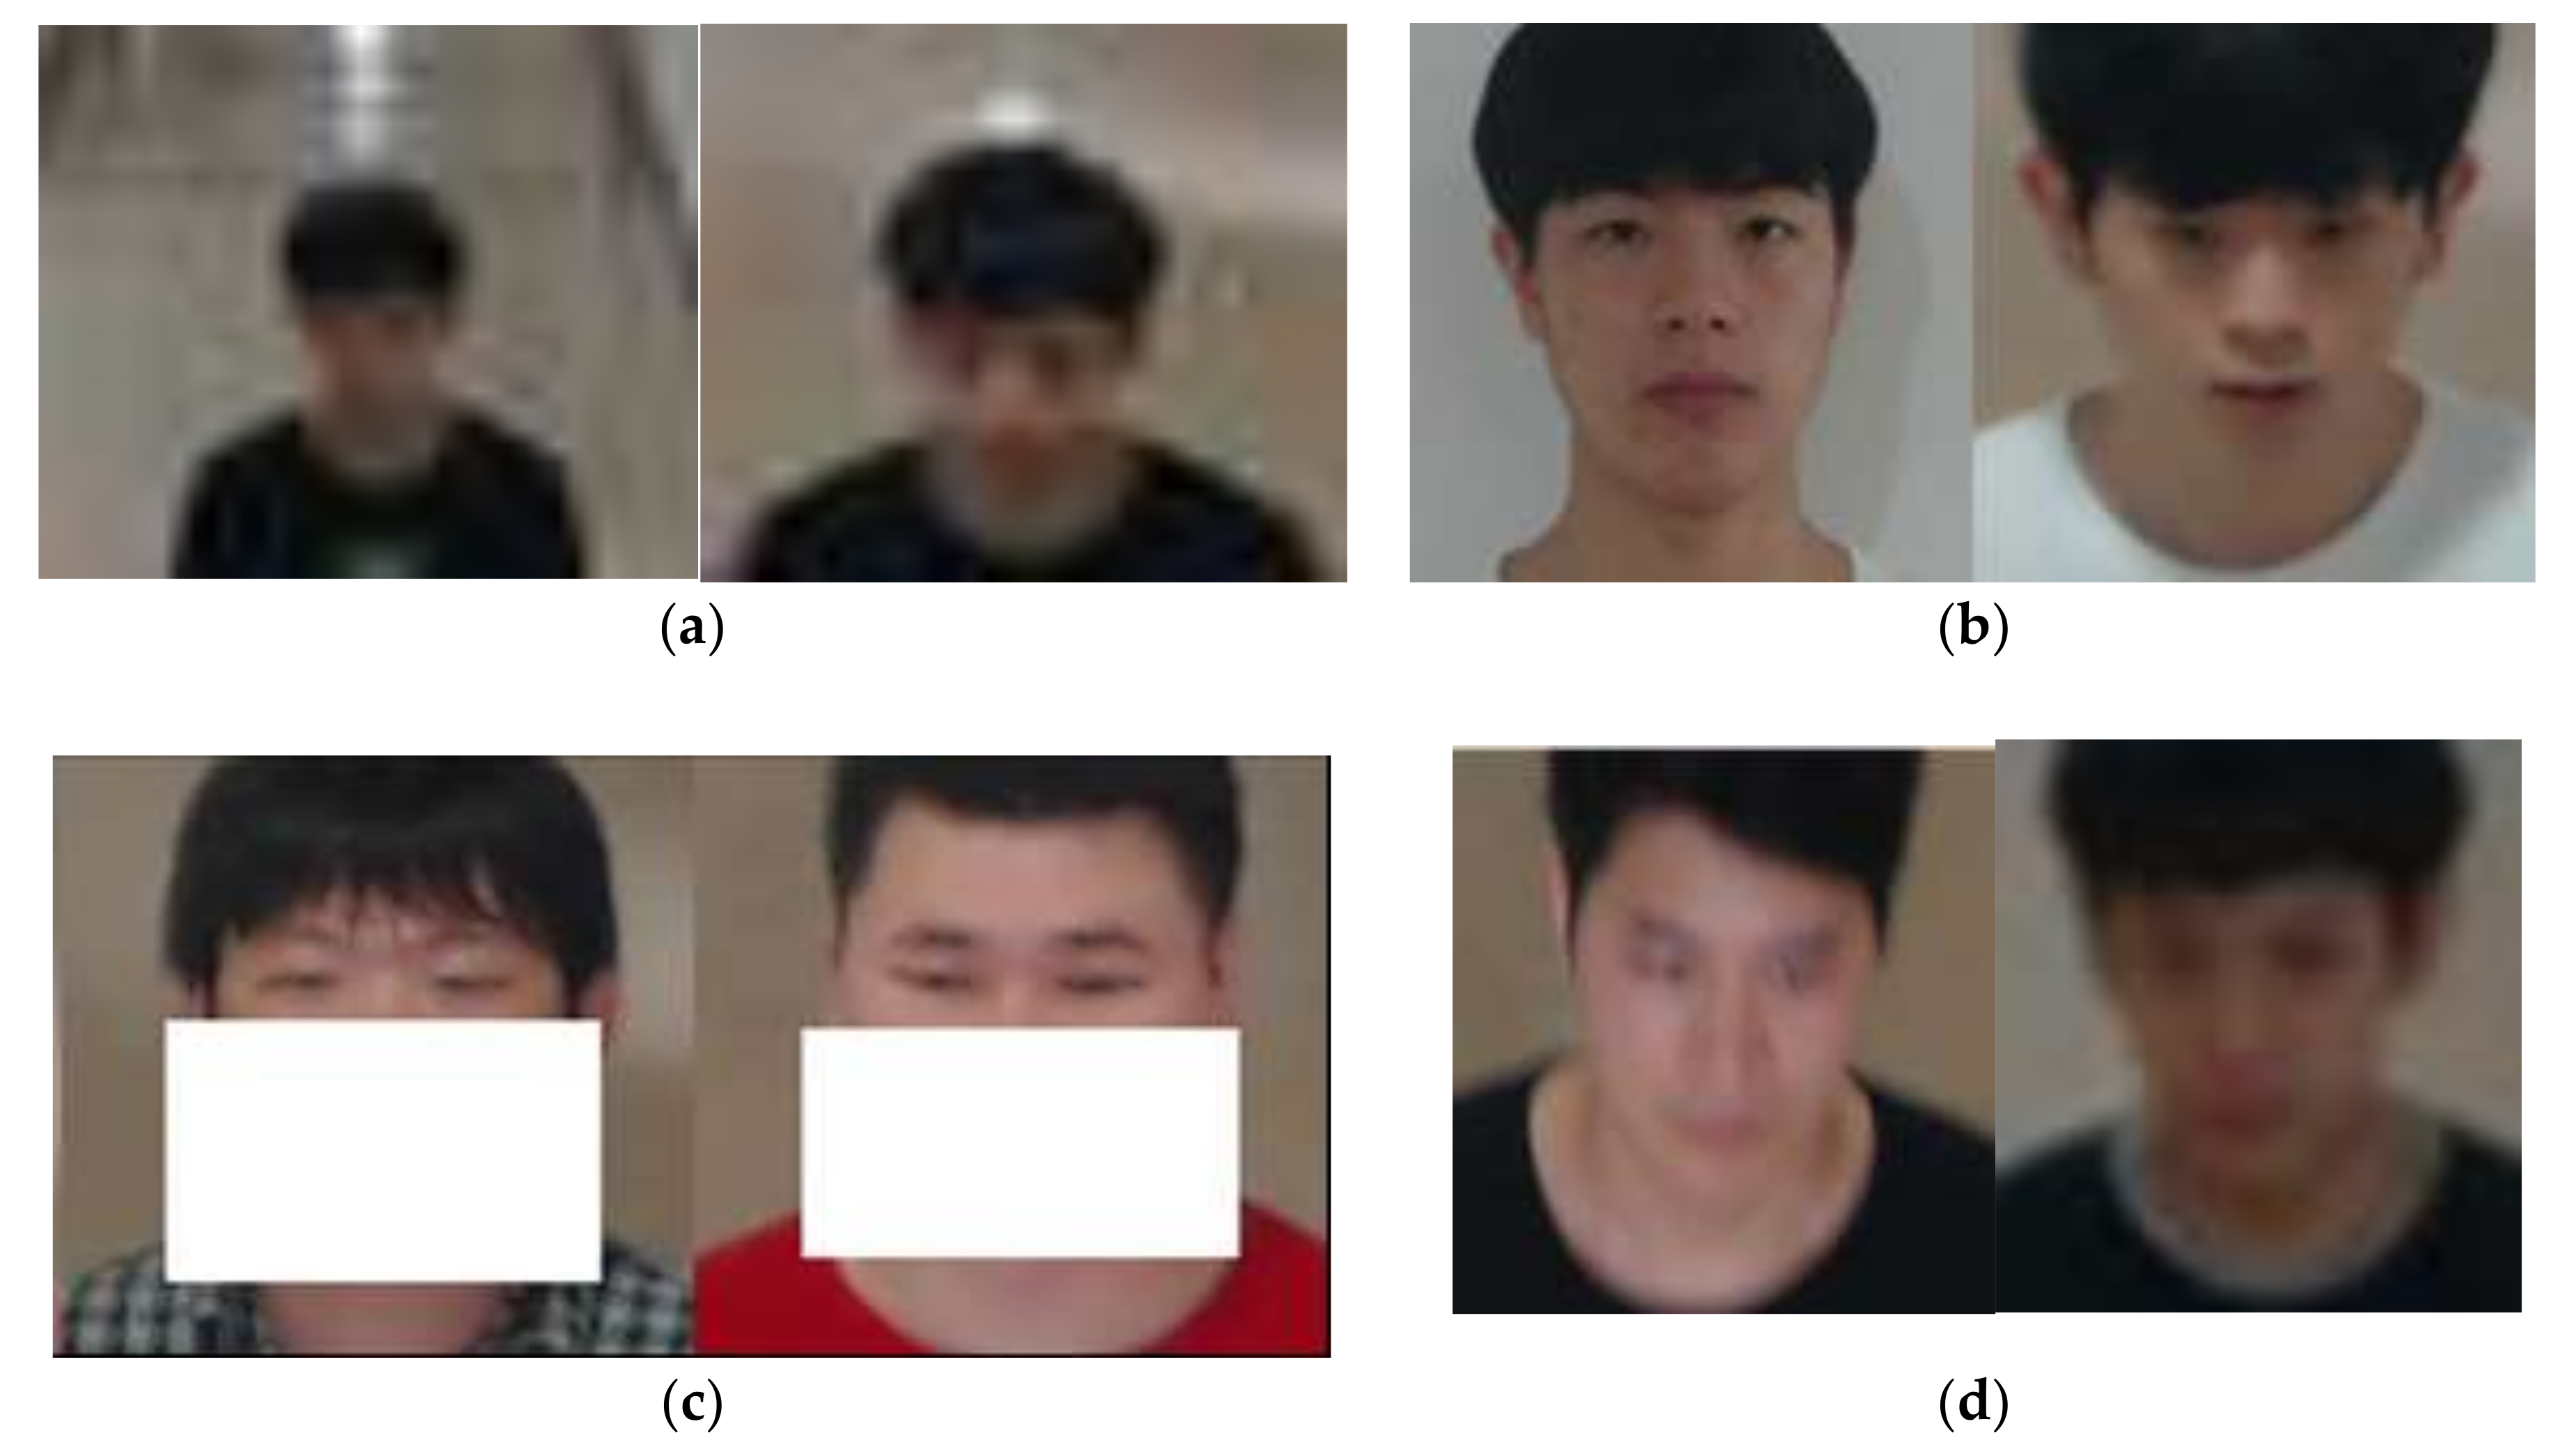
The real application of age estimation from blurry images is for people on the move in surveillance environments. In this field, even modern cameras that include the functionality of auto-focusing cannot provide sharp images due to people being in motion, as shown in Figure 13d.
In this environment, face recognition can be considered. However, face recognition requires enrollment of the user’s face, and it performs matching with features from enrolled and input face images. However, in many applications, the user does not want to enroll his or her face due to anxiety over private face information being divulged. In addition, in applications such as analysis of the ages of visitors at shopping centers for marketing, it is difficult to enroll the faces of all visitors in advance. However, our research on age estimation does not require enrollment, and the user’s age is estimated directly from the input image without any matching. Therefore, our method can be used in various fields without causing resistance by users to enrolling their face information.
Most of the images from the PAL and MORPH databases used in our experiments show frontal faces. Because these open databases have been widely used for evaluating the accuracy of age estimation [11,12,14,16,17,18,19,20,21,22], we used them for comparisons with previous methods. There is no open database (providing ground-truth age information) in which faces are captured at different angles and distances, some part of the face is obscured, and real blurred images are included. Therefore, in order to conduct experiments, we gathered a self-collected database of images of 20 participants including the factors of different angles and distances, obstruction, and real blurring, which were obtained by an auto-focusing camera set 2.4 m from the ground in an indoor surveillance environment. Figure 13 shows examples of images in this database. For fair comparison, we have made our database available to other researchers. As shown in Figure 13d, real blurred images were captured due to people moving, in spite of the auto-focusing functionality of the camera.
As shown in Table 10, the MAE of age estimation for different distances was as large as 8.03. That is because important features, such as wrinkles, disappear in low-resolution images captured at a far distance. Real blurred images and images from different angles did not have much effect on the accuracy of age estimation. However, in case of obstruction, MAE was a little increased. That is because the important features for age estimation around the nose and mouth could not be used for estimation.
4.8. Comparing Accuracy According to Kind of Database
We tested the PAL-learned CNN using the MORPH database and vice versa to prove the quality of the received age estimators. Because ResNet-152 showed the best accuracy, as shown in Table 6 and Table 7, this CNN was used for the experiments. As shown in Table 11, the increase of MAE when using different databases for training and testing was not large compared to when the same databases for training and testing were used. That is because image blurring makes the image characteristics of the PAL and MORPH databases become similar.
5. Conclusions
In this study, we aimed to solve the problem of degraded accuracy in capturing important facial age features, such as wrinkles, and proposed the use of a deep ResNet-152 CNN age estimation method that was robust to various optical and motion blurring effects. Unlike the existing methods, no preclassification of blurring degree and direction of input images was needed, and the age estimation classifier did not need to be trained according to the preclassification results. Only a single deep ResNet-152 CNN was used for age estimation, so that errors due to preclassification could be reduced and system complexity could be improved. In addition, key learning from our exercise is that one deep ResNet-152 can be used for accurate age estimation and is robust to various image qualities of unblurred, optical blurring, and motion blurring without the conventional algorithm of image restoration.
The experiments using fourfold cross-validation showed that when the PAL database and blurred dataset based on it were used, MAE was 6.0 years, and when the MORPH database and blurred dataset based on it were used, the MAE was 5.78 years, which indicated an improvement in the accuracy of age estimation. In addition, we opened the ResNet-152 CNN model in [23], which was acquired by training, so that other researchers could easily compare performance.
Recently, various deep learning–based super-resolution reconstruction methods have been studied [49,50,51,52]. In these methods, high-resolution images could be obtained from the input low-resolution images based on the power of generating missing pixel information in low-resolution images by deep CNN, which was trained with intensive data pairs of input low-resolution and output high-resolution images. In typical image processing–based super-resolution, sophisticated interpolation methods, such as bilinear, cubic spline, and Lanczos, have been used for generating missing pixel information in low-resolution images. Then, blur reconstruction based on accurate estimation of point spread function (PSF) was adopted to obtain the final high-resolution images. However, accurate estimation of PSF and the optimal filters for interpolation are very difficult to determine manually. Therefore, through deep CNN intensively trained with lots of pairs of input low-resolution and output high-resolution images, optimal PSF, filters, and parameters can be obtained automatically irrespective of the kinds of low-resolution images. Because our CNN model for age estimation has a limitation in the case of low-resolution images, as shown in Table 10, the method of combining CNN-based super-resolution reconstruction and age estimation can be researched in future work. As the first approach, we can consider the scheme that the first CNN for super-resolution reconstruction and the second CNN for age estimation are trained separately. In addition, as the second approach, the scheme combining these two CNNs for training (not trained separately) can be attempted.
In addition, in future research, we would apply our algorithm and CNN model to various conditions, such as faces in outdoor environments and low lighting. We also want to apply our algorithm and CNN model to age image synthesis.
Acknowledgments
This research was supported by the Bio & Medical Technology Development Program of the NRF funded by the Korean government, MSIT (NRF-2016M3A9E1915855), by the Basic Science Research Program through the National Research Foundation of Korea (NRF) funded by the Ministry of Education (NRF- 2017R1D1A1B03028417), and by the National Research Foundation of Korea (NRF) grant funded by the Korea government (Ministry of Science and ICT) (NRF-2017R1C1B5074062).
Author Contributions
Jeon Seong Kang and Kang Ryoung Park designed the CNN-based age estimation system and wrote the paper. Chan Sik Kim, Young Won Lee, and Se Woon Cho helped to implement the algorithm of facial feature detection and the experiments.
Conflicts of Interest
The authors declare no conflict of interest.
References
- Riaz, Q.; Vögele, A.; Krüger, B.; Weber, A. One small step for a man: Estimation of gender, age and height from recordings of one step by a single inertial sensor. Sensors 2015, 15, 31999–32019. [Google Scholar] [CrossRef] [PubMed]
- Zhao, W.; Wang, H. Strategic decision-making learning from label distributions: An approach for facial age estimation. Sensors 2016, 16, 994. [Google Scholar] [CrossRef] [PubMed]
- Niu, Z.; Zhou, M.; Wang, L.; Gao, X.; Hua, G. Ordinal regression with multiple output CNN for age estimation. In Proceedings of the IEEE Conference on Computer Vision and Pattern Recognition, Las Vegas, NV, USA, 27–30 June 2016; pp. 4920–4928. [Google Scholar]
- Kang, B.J.; Park, K.R. Restoration of motion-blurred iris image on mobile iris recognition devices. Opt. Eng. 2008, 47, 117202-1–117202-8. [Google Scholar]
- Kang, B.J.; Park, K.R. A study on restoration of iris images with motion-and-optical blur on mobile iris recognition devices. Int. J. Imaging Syst. Technol. 2009, 19, 323–331. [Google Scholar] [CrossRef]
- Fu, Y.; Guo, G.; Huang, T.S. Age synthesis and estimation via faces: A survey. IEEE Trans. Pattern Anal. Mach. Intell. 2010, 32, 1955–1976. [Google Scholar] [PubMed]
- Escalera, S.; Torres, M.T.; Martínez, B.; Baro, X.; Escalante, H.J.; Guyon, I.; Tzimiropoulos, G.; Corneanu, C.; Oliu, M.; Bagheri, M.A.; et al. ChaLearn looking at people and faces of the world: Face analysis workshop and challenge 2016. In Proceedings of the IEEE Conference on Computer Vision and Pattern Recognition Workshops, Las Vegas, NV, USA, 26 June–1 July 2016; pp. 706–713. [Google Scholar]
- Levi, G.; Hassner, T. Age and gender classification using convolutional neural networks. In Proceedings of the IEEE Conference on Computer Vision and Pattern Recognition Workshops, Boston, MA, USA, 7–12 June 2015; pp. 34–42. [Google Scholar]
- Rothe, R.; Timofte, R.; Gool, L.V. Dex: Deep EXpectation of apparent age from a single image. In Proceedings of the IEEE International Conference on Computer Vision Workshops, Santiago, Chile, 7–13 December 2015; pp. 252–257. [Google Scholar]
- Lanitis, A.; Draganova, C.; Christodoulou, C. Comparing different classifiers for automatic age estimation. IEEE Trans. Syst. Man Cybern. 2004, 34, 621–628. [Google Scholar] [CrossRef]
- Choi, S.E.; Lee, Y.J.; Lee, S.J.; Park, K.R.; Kim, J. A comparative study of local feature extraction for age estimation. In Proceedings of the 11th IEEE International Conference on Control Automation Robotics and Vision, Singapore, 7–10 December 2010; pp. 1280–1284. [Google Scholar]
- Nguyen, D.T.; Cho, S.R.; Shin, K.Y.; Bang, J.W.; Park, K.R. Comparative study of human age estimation with or without preclassification of gender and facial expression. Sci. World J. 2014, 2014, 1–15. [Google Scholar] [CrossRef] [PubMed]
- Li, C.; Liu, Q.; Liu, J.; Lu, H. Learning ordinal discriminative features for age estimation. In Proceedings of the IEEE Conference on Computer Vision and Pattern Recognition, Providence, RI, USA, 16–21 June 2012; pp. 2570–2577. [Google Scholar]
- Geng, X.; Zhou, Z.-H.; Smith-Miles, K. Automatic age estimation based on facial aging patterns. IEEE Trans. Pattern Anal. Mach. Intell. 2007, 29, 2234–2240. [Google Scholar] [CrossRef] [PubMed]
- Guo, G.; Mu, G.; Fu, Y.; Huang, T.S. Human age estimation using bio-inspired features. In Proceedings of the IEEE Conference on Computer Vision and Pattern Recognition, Miami, FL, USA, 20–25 June 2009; pp. 112–119. [Google Scholar]
- Luu, K.; Seshadri, K.; Savvides, M.; Bui, T.D.; Suen, C.Y. Contourlet appearance model for facial age estimation. In Proceedings of the IEEE International Joint Conference on Biometrics, Washington, DC, USA, 11–13 October 2011; pp. 1–8. [Google Scholar]
- Günay, A.; Nabiyev, V.V. Age Estimation Based on Hybrid Features of Facial Images. In Information Sciences and Systems; Springer International Publishing: Cham, Switzerland, 2015; pp. 295–304. [Google Scholar]
- Bekhouche, S.E.; Ouafi, A.; Taleb-Ahmed, A.; Hadid, A.; Benlamoudi, A. Facial age estimation using BSIF and LBP. In Proceedings of the 1st International Conference on Electrical Engineering, Biskra, Algeria, 7–8 December 2014; pp. 1–5. [Google Scholar]
- Belver, C.; Arganda-Carreras, I.; Dornaika, F. Comparative Study of Human Age Estimation Based on Hand-Crafted and Deep Face Features; Video Analytics, Face and Facial Expression Recognition and Audience Measurement. Lect. Notes Comput. Sci. 2016, 10165, 98–112. [Google Scholar]
- Han, H.; Otto, C.; Liu, X.; Jain, A.K. Demographic estimation from face images: Human vs. machine performance. IEEE Trans. Pattern Anal. Mach. Intell. 2015, 37, 1148–1161. [Google Scholar] [CrossRef] [PubMed]
- Nguyen, D.T.; Cho, S.R.; Pham, T.D.; Park, K.R. Human age estimation method robust to camera sensor and/or face movement. Sensors 2015, 15, 21898–21930. [Google Scholar] [CrossRef] [PubMed]
- Nguyen, D.T.; Cho, S.R.; Park, K.R. Age estimation-based soft biometrics considering optical blurring based on symmetrical sub-blocks for MLBP. Symmetry 2015, 7, 1882–1913. [Google Scholar] [CrossRef]
- Dongguk Age Estimation CNN Model (DAE-CNN). Available online: http://dm.dgu.edu/link.html (accessed on 17 May 2017).
- He, K.; Zhang, X.; Ren, S.; Sun, J. Deep residual learning for image recognition. In Proceedings of the IEEE Conference on Computer Vision and Pattern Recognition, Las Vegas, NV, USA, 27–30 June 2016; pp. 770–778. [Google Scholar]
- CS231n Convolutional Neural Networks for Visual Recognition. Available online: http://cs231n.github.io/convolutional-networks/#overview (accessed on 19 September 2017).
- Howard, A.G.; Zhu, M.; Chen, B.; Kalenichenko, D.; Wang, W.; Weyand, T.; Andreetto, M.; Adam, H. MobileNets: Efficient convolutional neural networks for mobile vision applications. arXiv, 2017; arXiv:1704.04861v1. [Google Scholar]
- Krizhevsky, A.; Sutskever, I.; Hinton, G.E. Imagenet classification with deep convolutional neural networks. In Advances in Neural Information Processing Systems 25; Curran Associates, Inc.: New York, NY, USA, 2012; pp. 1097–1105. [Google Scholar]
- Glorot, X.; Bordes, A.; Bengio, Y. Deep sparse rectifier neural networks. In Proceedings of the 14th International Conference on Artificial Intelligence and Statistics, Fort Lauderdale, FL, USA, 11–13 April 2011; pp. 315–323. [Google Scholar]
- Rectifier (Neural Networks). Available online: https://en.wikipedia.org/wiki/Rectifier_(neural_networks) (accessed on 3 July 2017).
- Multilayer Perceptron. Available online: http://deeplearning.net/tutorial/mlp.html (accessed on 19 September 2017).
- Heaton, J. Artificial Intelligence for Humans; Deep Learning and Neural Networks; Heaton Research, Inc.: St. Louis, MO, USA, 2015; Volume 3. [Google Scholar]
- Softmax Function. Available online: https://en.wikipedia.org/wiki/Softmax_function (accessed on 17 May 2017).
- Minear, M.; Park, D.C. A lifespan database of adult facial stimuli. Behav. Res. Methods Instrum. Comput. 2004, 36, 630–633. [Google Scholar] [CrossRef] [PubMed]
- PAL Database. Available online: http://agingmind.utdallas.edu/download-stimuli/face-database/ (accessed on 17 May 2017).
- Kim, K.W.; Hong, H.G.; Nam, G.P.; Park, K.R. A study of deep CNN-based classification of open and closed eyes using a visible light camera sensor. Sensors 2017, 17, 1534. [Google Scholar] [CrossRef] [PubMed]
- Tiwari, S.; Shukla, V.P.; Singh, A.K.; Biradar, S.R. Review of motion blur estimation techniques. J. Image Graph. 2013, 1, 176–184. [Google Scholar] [CrossRef]
- Intel® Core™ i7-3770K Processor. Available online: http://ark.intel.com/products/65523/Intel-Core-i7-3770K-Processor-8M-Cache-up-to-3_90-GHz (accessed on 24 July 2017).
- Caffe. Available online: http://caffe.berkeleyvision.org/ (accessed on 24 July 2017).
- NVIDIA GeForce GTX 1070. Available online: https://www.nvidia.com/en-us/geforce/products/10series/geforce-gtx-1070/ (accessed on 24 August 2017).
- OpenCV Library. Available online: http://opencv.org/ (accessed on 24 July 2017).
- Microsoft Visual Studio. Available online: https://www.visualstudio.com/ (accessed on 24 July 2017).
- Cross-Validation (Statistics). Available online: https://en.wikipedia.org/wiki/Cross-validation_(statistics) (accessed on 3 July 2017).
- Stochastic Gradient Descent. Available online: https://en.wikipedia.org/wiki/Stochastic_gradient_descent (accessed on 3 July 2017).
- TrainingOptions. Available online: http://kr.mathworks.com/help/nnet/ref/trainingoptions.html (accessed on 17 May 2017).
- Mean Absolute Error. Available online: https://en.wikipedia.org/wiki/Mean_absolute_error (accessed on 3 July 2017).
- MORPH Database. Available online: https://ebill.uncw.edu/C20231_ustores/web/store_main.jsp?STOREID=4 (accessed on 17 May 2017).
- OpenBR. Available online: http://openbiometrics.org/ (accessed on 14 December 2017).
- Gonzalez, R.C.; Woods, R.E. Digital Image Processing, 3rd ed.; Pearson Education Inc.: Upper Saddle River, NJ, USA, 2010. [Google Scholar]
- Kim, J.; Lee, J.K.; Lee, K.M. Accurate image super-resolution using very deep convolutional networks. In Proceedings of the IEEE Conference on Computer Vision and Pattern Recognition, Las Vegas, NV, USA, 27–30 June 2016; pp. 1646–1654. [Google Scholar]
- Dahl, R.; Norouzi, M.; Shlens, J. Pixel recursive super resolution. In Proceedings of the IEEE International Conference on Computer Vision, Venice, Italy, 22–29 October 2017; pp. 5449–5458. [Google Scholar]
- Yamanaka, J.; Kuwashima, S.; Kurita, T. Fast and accurate image super resolution by deep CNN with skip connection and network in network. In Proceedings of the International Conference on Neural Information Processing, Guangzhou, China, 14–18 November 2017; pp. 1–9. [Google Scholar]
- Precision and Recall. Available online: https://en.wikipedia.org/wiki/Precision_and_recall (accessed on 3 July 2017).
Figure 1.
Overall flowchart of proposed method. ROI, region of interest.

Figure 2.
Procedure of data preprocessing of face region. (a) Before in-plane rotation compensation; (b) After in-plane rotation compensation; (c) Face ROI redefinition.
Figure 2.
Procedure of data preprocessing of face region. (a) Before in-plane rotation compensation; (b) After in-plane rotation compensation; (c) Face ROI redefinition.

Figure 3.
CNN architecture used in our research. For simplicity, we show the CNN structure assuming that all iteration numbers in Table 3 are 1.
Figure 3.
CNN architecture used in our research. For simplicity, we show the CNN structure assuming that all iteration numbers in Table 3 are 1.

Figure 4.
Images from PAL database.
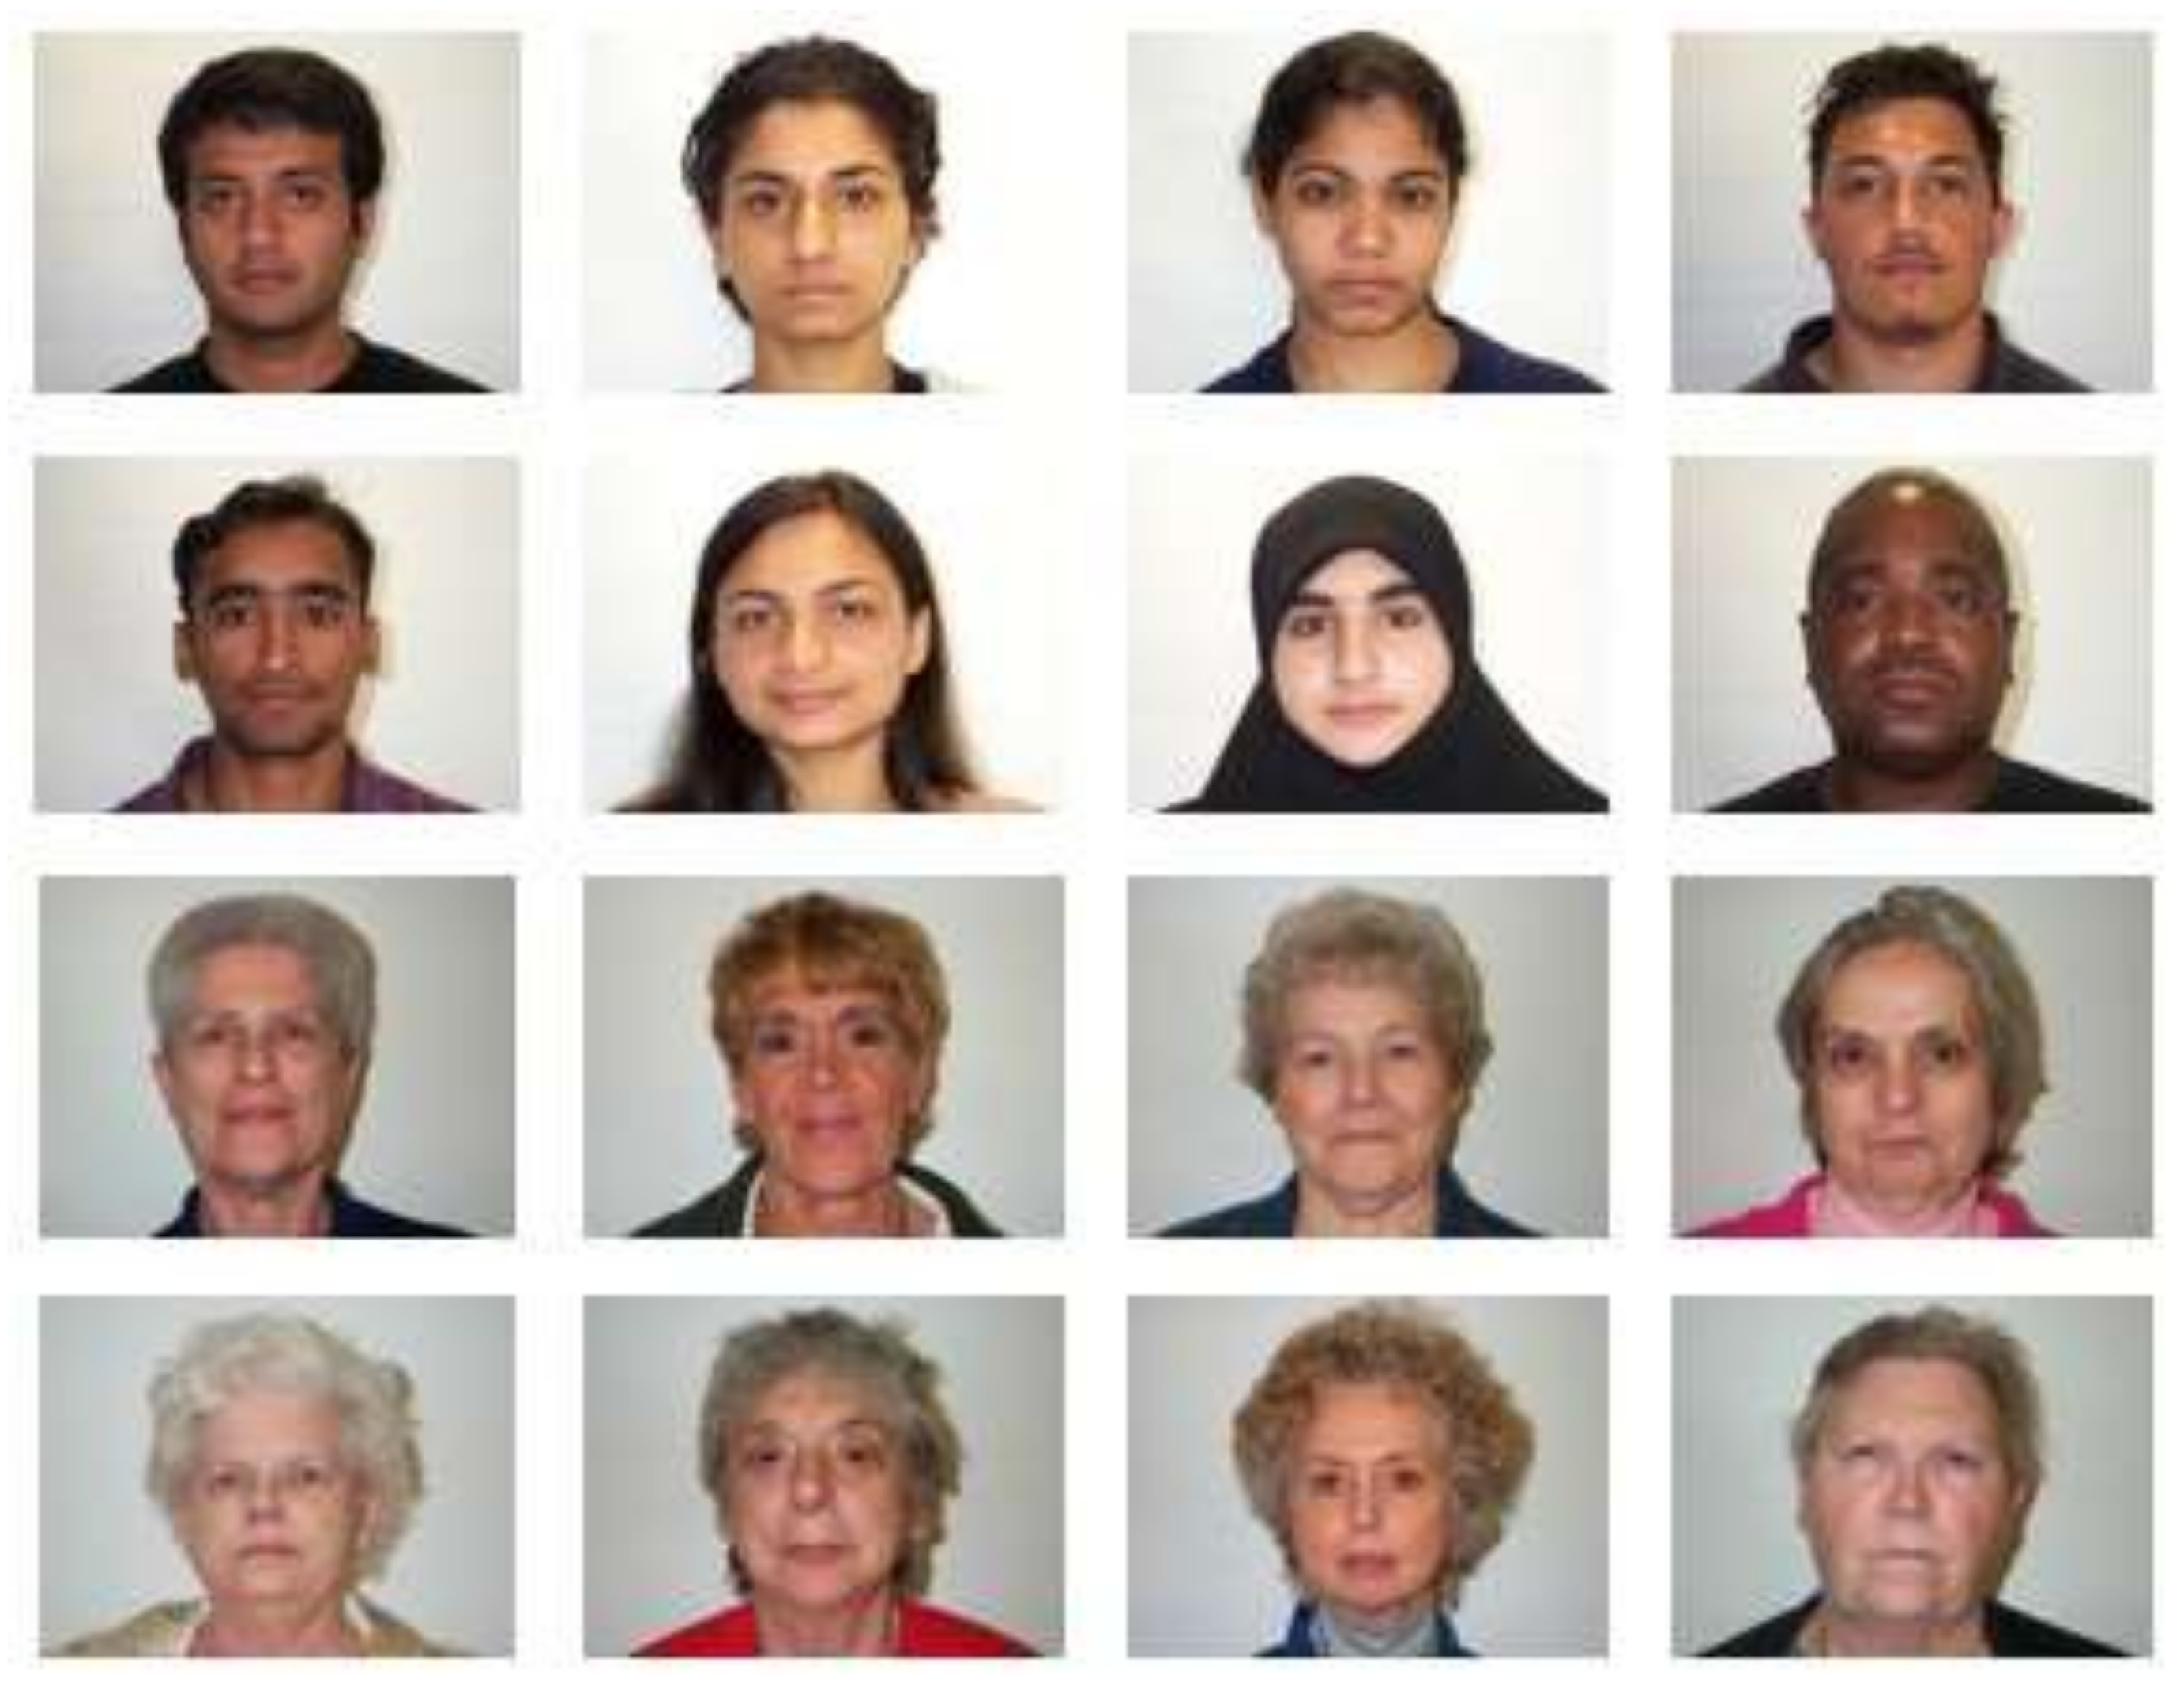
Figure 5.
Examples of generated optical and motion blurred images.

Figure 6.
Loss and accuracy curves with training data of fourfold cross validation: (a) first fold; (b) second fold; (c) third fold; (d) fourth fold cross-validation (in a–d, the horizontal axis shows the number of epochs).
Figure 6.
Loss and accuracy curves with training data of fourfold cross validation: (a) first fold; (b) second fold; (c) third fold; (d) fourth fold cross-validation (in a–d, the horizontal axis shows the number of epochs).


Figure 7.
Example of trained filter image.
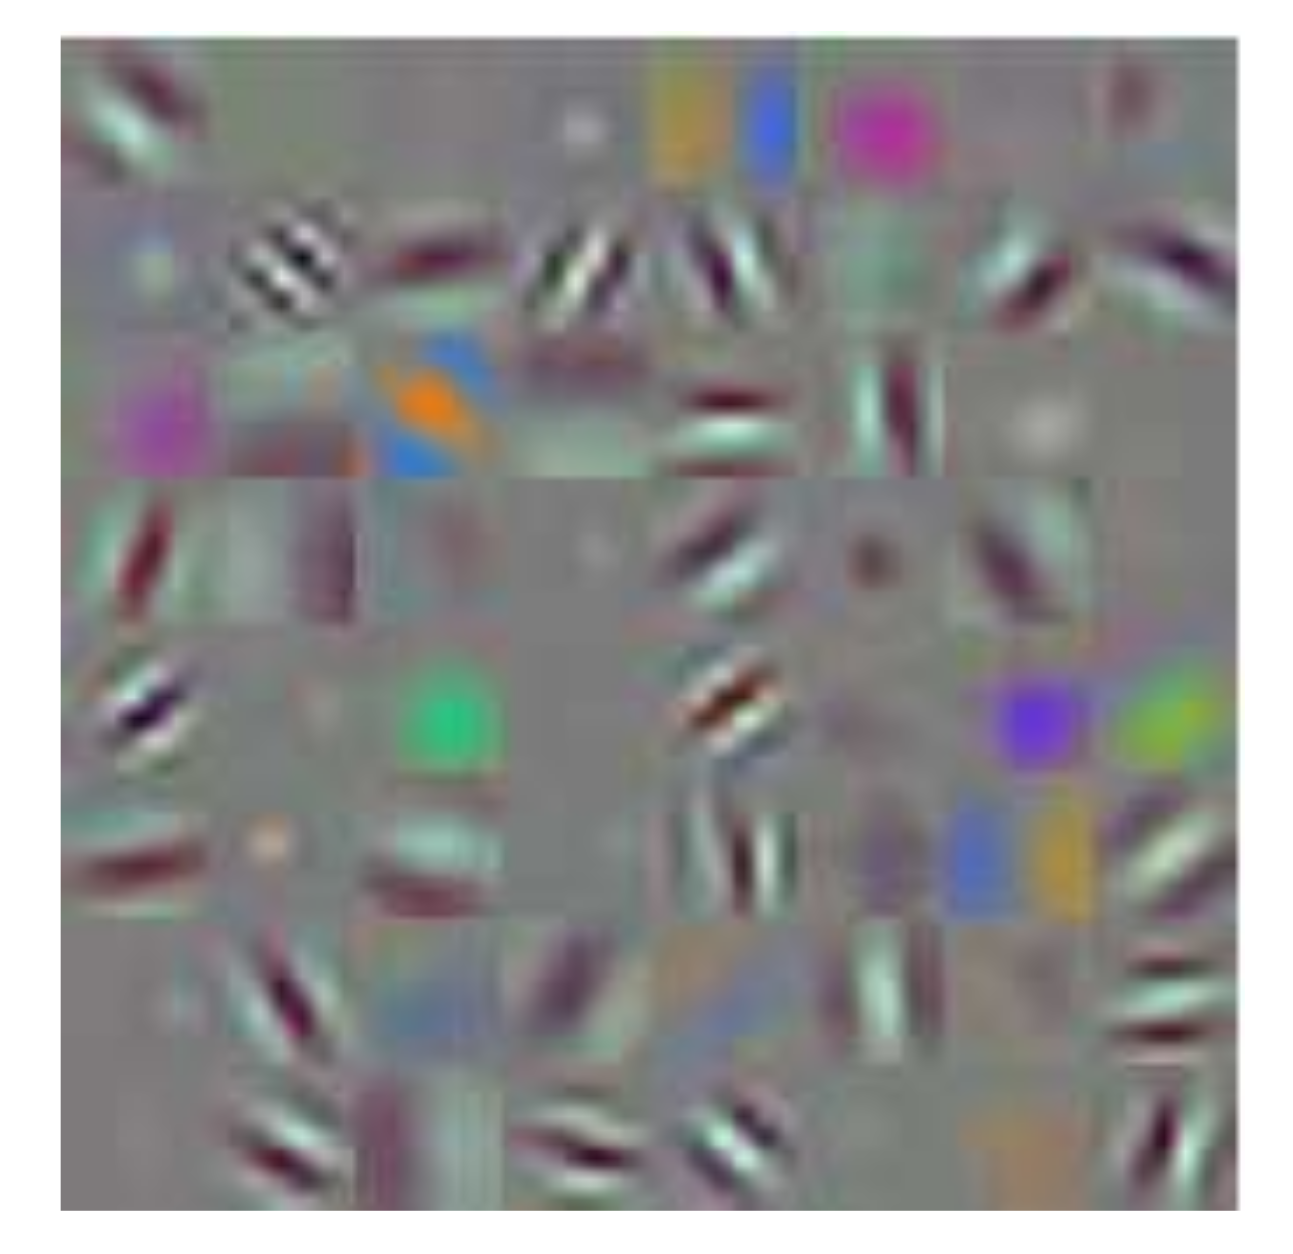
Figure 8.
Comparative examples of age estimation by proposed and previous methods: (a) optical blurring; (b) motion blurring.
Figure 8.
Comparative examples of age estimation by proposed and previous methods: (a) optical blurring; (b) motion blurring.

Figure 9.
Comparative examples of age estimation by the proposed and previous methods: (a) optical blurring; (b) motion blurring.
Figure 9.
Comparative examples of age estimation by the proposed and previous methods: (a) optical blurring; (b) motion blurring.

Figure 10.
Comparison of estimation results using the OpenBR age estimation method and our method. The images are of people ages (a) 64; (b) 27; (c) 20; and (d) 33 with different degrees of optical and motion blurring.
Figure 10.
Comparison of estimation results using the OpenBR age estimation method and our method. The images are of people ages (a) 64; (b) 27; (c) 20; and (d) 33 with different degrees of optical and motion blurring.
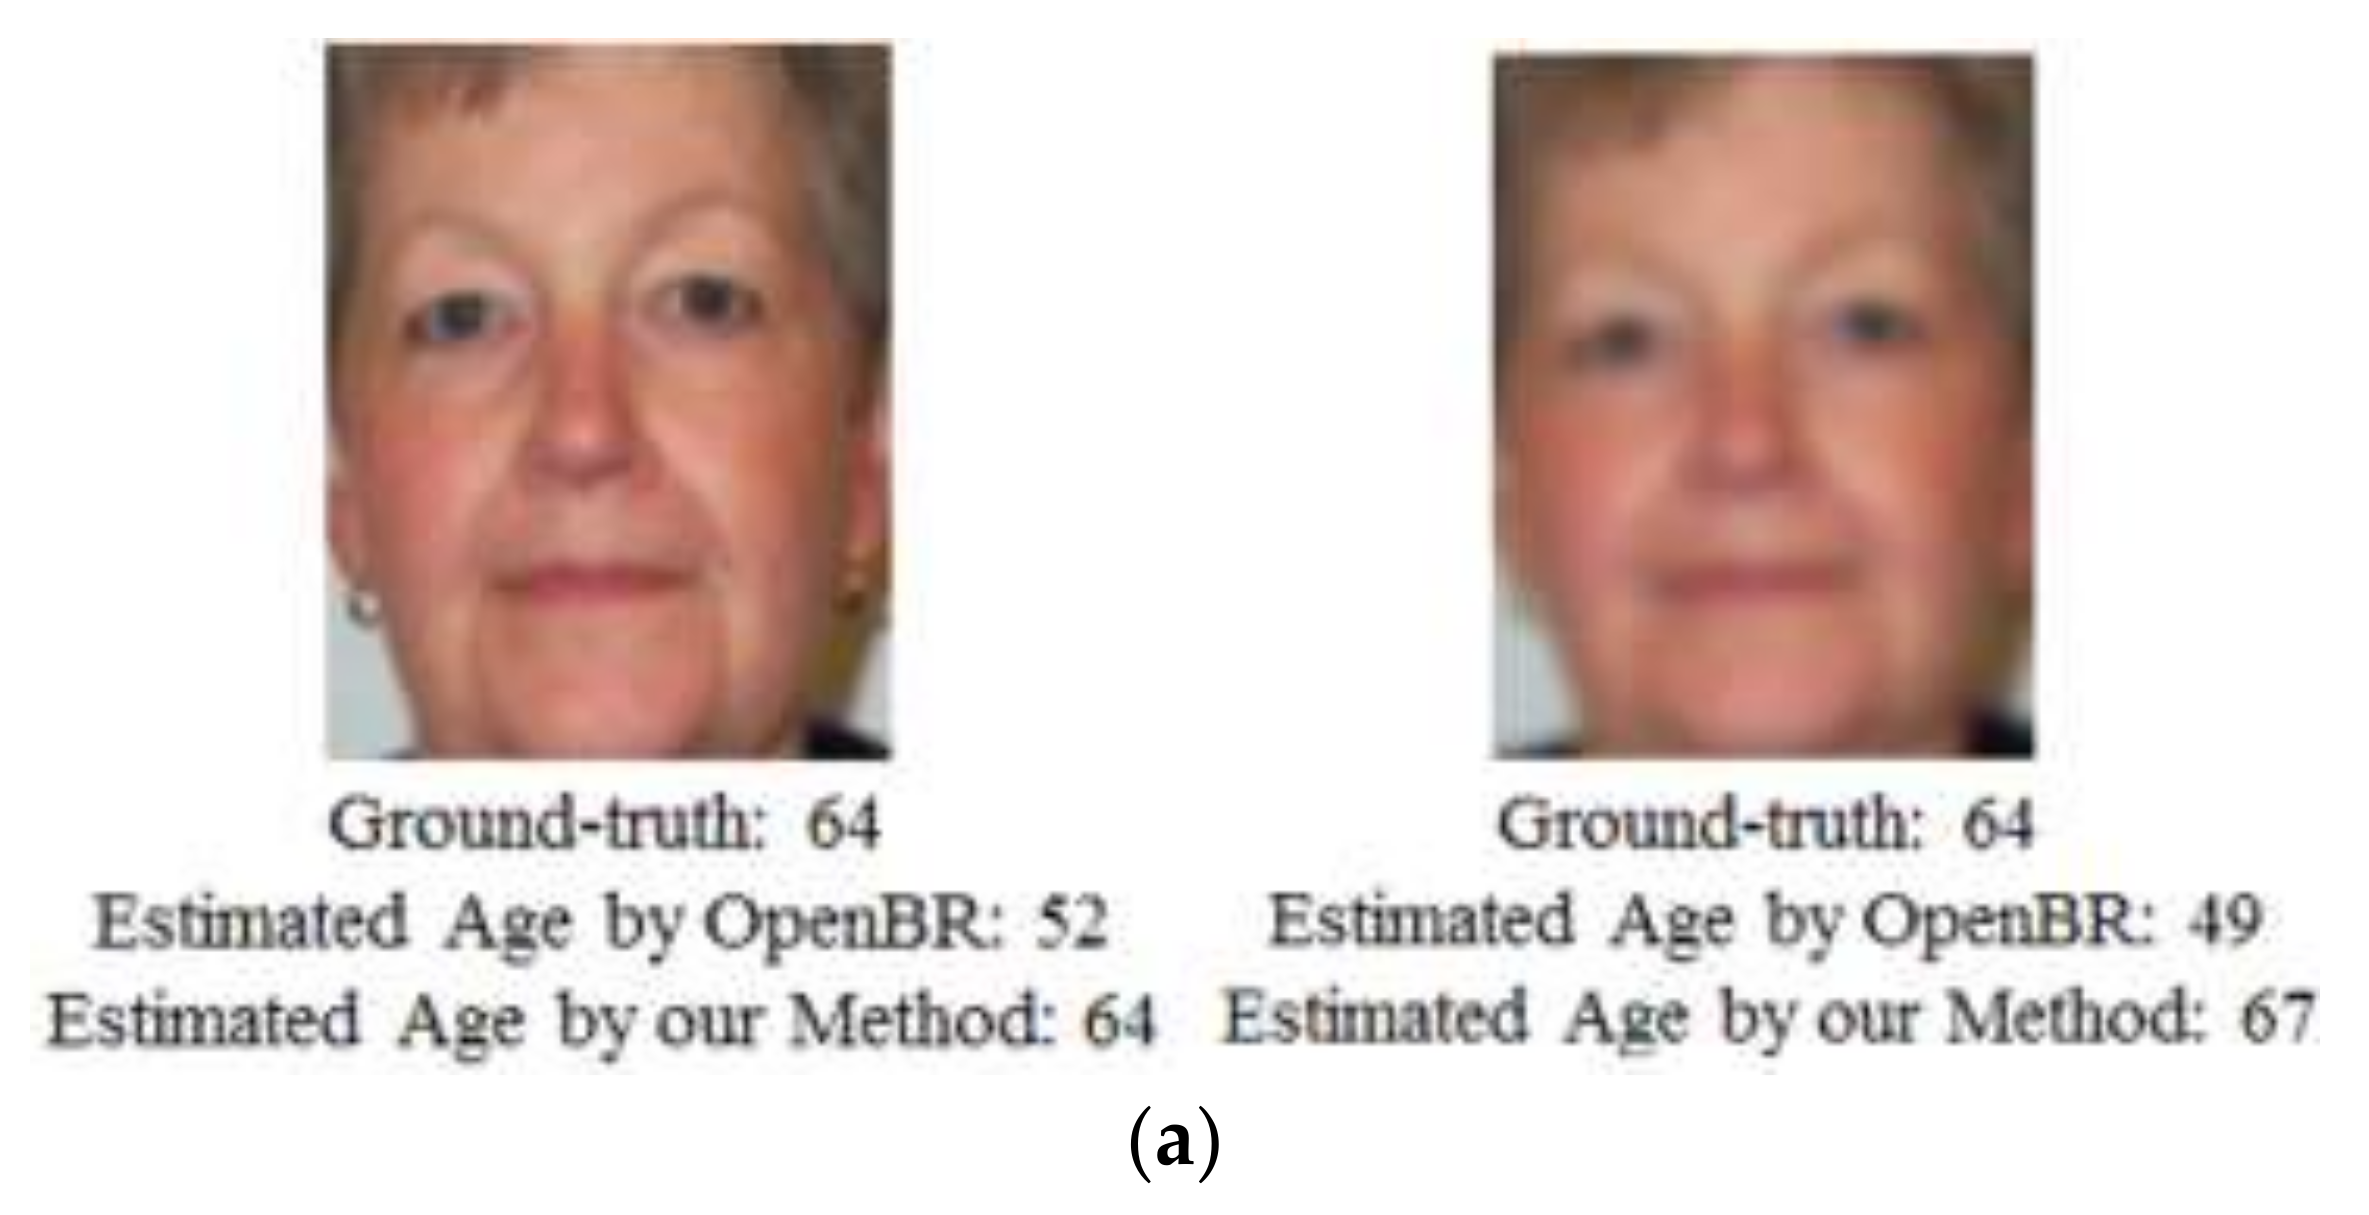

Figure 11.
Examples of age estimation results by our method and the deblurring filter method: left images show results of our method and right images show results of the deblurring filter method.
Figure 11.
Examples of age estimation results by our method and the deblurring filter method: left images show results of our method and right images show results of the deblurring filter method.
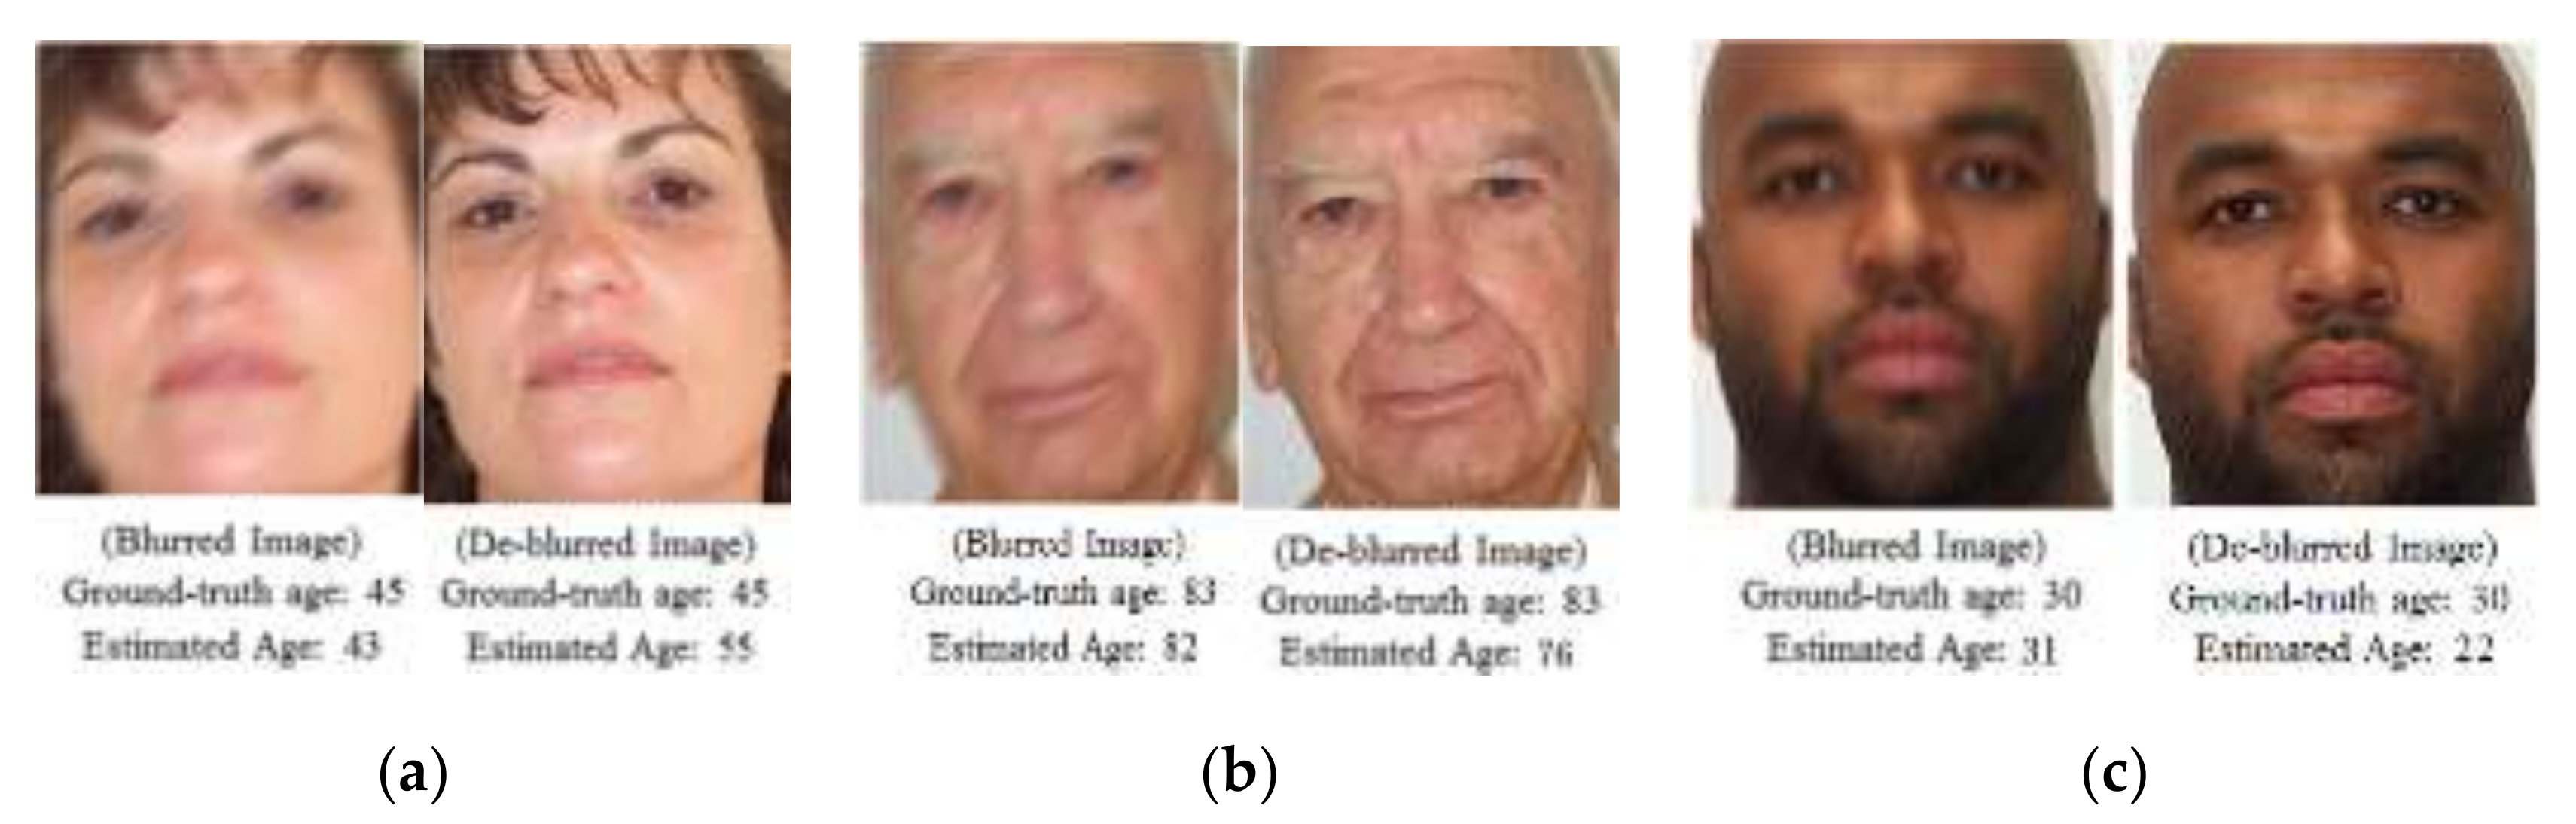
Figure 12.
Examples of original and low-resolution images from the PAL database: (a,e) original images; (b,f) subsampled images of 1/8 compared to original images; (c,g) subsampled images of 1/64 compared to original images; (d,h) subsampled images of 1/512 compared to original images.
Figure 12.
Examples of original and low-resolution images from the PAL database: (a,e) original images; (b,f) subsampled images of 1/8 compared to original images; (c,g) subsampled images of 1/64 compared to original images; (d,h) subsampled images of 1/512 compared to original images.

Figure 13.
Examples of images from self-collected database: (a,b) images from different distances; (b) images from different angles; (c) images including obstruction; (d) real blurred images.
Figure 13.
Examples of images from self-collected database: (a,b) images from different distances; (b) images from different angles; (c) images including obstruction; (d) real blurred images.


Table 1.
Comparison of age estimation performance among the existing studies.
| Methods | Database | Age Features | Mean Absolute Error (MAE) (Years) |
|---|---|---|---|
| Lanitis et al. [10] | 400 images from 40 individuals | Active appearance model (AAM) feature | 3.82 |
| Choi et al. [11] | Biometrics engineering research center (BERC) | Gaussian high-pass filter feature (GHPF) | 6.85 |
| Park aging mind laboratory (PAL) | GHPF | 8.44 | |
| Nguyen et al. [12] | PAL | Multilevel local binary pattern (MLBP) and Gabor filter features | 6.52 |
| Li et al. [13] | Face and gesture recognition network (FG-NET) | Gabor filter with feature selection method (preserving locality and ordinal (PLO) feature) | 4.82 |
| Geng et al. [14] | MORPH | Aging pattern subspace (AGES) | 8.83 |
| AGES (with linear discriminant analysis (LDA)) | 8.07 | ||
| FG-NET | AGES | 6.77 | |
| AGES (with LDA) | 6.22 | ||
| Guo et al. [15] | FG-NET | Bio-inspired features (BIF) | 4.77 |
| Luu et al. [16] | PAL | Contourlet appearance model (CAM) and nonsubsampled contourlet transform (NSCT) features | 6.0 |
| FG-NET | 4.12 | ||
| Günay et al. [17] | PAL | AAM, Gabor, and local binary pattern (LBP) features | 5.38 |
| FG-NET | 4.87 | ||
| Bekhouche et al. [18] | PAL | Binarized statistical features (BSIF) and LBP features | 6.25 |
| FG-NET | 6.34 | ||
| Belver et al. [19] | PAL | Deep expectation (DEX)-ChaLearn | 3.79 |
| MORPH | 3.67 | ||
| Han et al. [20] | MORPH | Demographic informative features (DIF) | 3.6 |
| FG-NET | 3.8 | ||
| Pinellas county sheriff’s office (PCSO) | 4.1 | ||
| Nguyen et al. [21] | PAL with motion blurred images of PAL | MLBP and Gabor filtering features with principal component analysis (PCA) | 6.48 |
| MORPH with motion blurred images of MORPH | 6.05 | ||
| Nguyen et al. [22] | PAL with optical blurred images of PAL | MLBP and Gabor filtering features with PCA | 6.845 |
| MORPH with optical blurred images of MORPH | 6.607 |
Table 2.
Summary of previous and proposed studies on age estimation.
| Category | Method | Kind of Blurring | Advantages | Weakness |
|---|---|---|---|---|
| Age estimation not considering blurring effect | AAM feature [10], GHPF [11], MLBP and Gabor [12], PLO feature [13], AGES [14], BIF [15], CAM and NSCT features [16], BSIF and LBP [18], DEX-CHALEARN [19], DIF [20], convolutional neural network (CNN) [8,9] | None | Processing speed is faster than the method considering blurring effect | In case of image blurring, the accuracy of age estimation degrades |
| Age estimation considering blurring effect | MLBP, Gabor filter, PCA, and support vector regression (SVR) [21] | Motion blurring | Age estimation robust to motion blurring effect |
|
| MLBP, Gabor filter, PCA, and SVR [22] | Optical blurring | Age estimation robust to optical blurring effect |
| |
| CNN-based age estimation (proposed method) | Optical blurring and motion blurring | Age estimation robust to both optical and motion blurring effects | Training of CNN is necessary |
Table 3.
Our deep residual CNN structure (3* represents that 3 pixels are included as padding in, respectively, left, right, up, and down positions of an input image of 224 × 224 × 3 pixels, whereas 1* means that 1 pixel is included as padding in the left, right, up, and down positions of the feature map; 2/1** means 2 at the first iteration and 1 from the second iteration).
| Layer Name | Number of Filters | Size of Feature Map (Height × Width × Channels) | Size of Filters | Number of Strides | Amount of Padding | Number of Iterations | |
|---|---|---|---|---|---|---|---|
| Image input layer | 224 × 224 × 3 | ||||||
| Conv1 | 64 | 112 × 112 × 64 | 7 × 7 × 3 | 2 | 3* | 1 | |
| Max pool | 1 | 56 × 56 × 64 | 3 × 3 | 2 | 0 | 1 | |
| Conv2 | Conv2-1 | 64 | 56 × 56 × 64 | 1 × 1 × 64 | 1 | 0 | 3 |
| Conv2-2 | 64 | 56 × 56 × 64 | 3 × 3 × 64 | 1 | 1* | ||
| Conv2-3 | 256 | 56 × 56 × 256 | 1 × 1 × 64 | 1 | 0 | ||
| Conv2-4 (Shortcut) | 256 | 56 × 56 × 256 | 1 × 1 × 64 | 1 | 0 | ||
| Conv3 | Conv3-1 | 128 | 28 × 28 × 128 | 1 × 1 × 256 | 2/1** | 0 | 8 |
| Conv3-2 (Bottleneck) | 128 | 28 × 28 × 128 | 3 × 3 × 128 | 1 | 1* | ||
| Conv3-3 | 512 | 28 × 28 × 512 | 1 × 1 × 128 | 1 | 0 | ||
| Conv3-4 (Shortcut) | 512 | 28 × 28 × 512 | 1 × 1 × 256 | 2 | 0 | ||
| Conv4 | Conv4-1 | 256 | 14 × 14 × 256 | 1 × 1 × 512 | 2/1** | 0 | 36 |
| Conv4-2 (Bottleneck) | 256 | 14 × 14 × 256 | 3 × 3 × 256 | 1 | 1* | ||
| Conv4-3 | 1024 | 14 × 14 × 1024 | 1 × 1 × 256 | 1 | 0 | ||
| Conv4-4 (Shortcut) | 1024 | 14 × 14 × 1024 | 1 × 1 × 512 | 2 | 0 | ||
| Conv5 | Conv5-1 | 512 | 7 × 7 × 512 | 1 × 1 × 1024 | 2/1** | 0 | 3 |
| Conv5-2 (Bottleneck) | 512 | 7 × 7 × 512 | 3 × 3 × 512 | 1 | 1* | ||
| Conv5-3 | 2048 | 7 × 7 × 2048 | 1 × 1 × 512 | 1 | 0 | ||
| Conv5-4 (Shortcut) | 2048 | 7 × 7 × 2048 | 1 × 1 × 1024 | 2 | 0 | ||
| AVG pool | 1 | 1 × 1 × 2048 | 7 × 7 | 1 | 0 | 1 | |
| FC layer | Number of classes | 1 | |||||
| Softmax | Number of classes | 1 | |||||
Table 4.
Accuracy of age estimation in previous research with the original PAL database without blurred images.
Table 4.
Accuracy of age estimation in previous research with the original PAL database without blurred images.
| Methods | MAE (Years) | |
|---|---|---|
| Choi et al. [11] | GHPF and SVR | 8.44 |
| Nguyen et al. [12] | MLBP, Gabor filter, and SVR | 6.52 |
| Bekhouche et al. [18] | BSIF, LBP, and SVR | 6.25 |
| Luu et al. [16] | CAM, NSCT, and SVR | 6.0 |
| Günay et al. [17] | AAM, Gabor filter, and LBP | 5.38 |
| Belver et al. [19] | DEX-CHALEARN | 3.79 |
Table 5.
Descriptions of age classes according to age intervals.
| Interval | Age Ranges | Class Label | Output Age Obtained by CNN |
|---|---|---|---|
| Three years | 18–20 | Class 1 | 19 |
| 21–23 | Class 2 | 22 | |
| 24–26 | Class 3 | 25 | |
| … | … | … | |
| Five years | 18–22 | Class 1 | 20 |
| 23–27 | Class 2 | 25 | |
| 28–32 | Class 3 | 30 | |
| … | … | … | |
| Seven years | 18–24 | Class 1 | 21 |
| 25–31 | Class 2 | 28 | |
| 32–38 | Class 3 | 35 | |
| … | … | … |
Table 6.
Comparison of accuracy of age estimation by previous and proposed methods with original and blurred PAL databases.
Table 6.
Comparison of accuracy of age estimation by previous and proposed methods with original and blurred PAL databases.
| Approach | Blurring Effect | The Number of Classes | MAE (Years) | ||
|---|---|---|---|---|---|
| Nguyen et al. [22] | Preclassification of optical blur, MLBP, Gabor filter, PCA, and SVR | Optical blur | 74 | 6.42 | |
| Nguyen et al. [21] | Preclassification of motion blur, MLBP, Gabor filter, PCA, and SVR | Motion blur | 74 | 6.48 | |
| Our method | CNN without preclassification of optical and motion blur | AlexNet [27] | Optical and motion blur | 74 | 10.65 |
| 25 | 8.40 | ||||
| 15 | 7.98 | ||||
| 11 | 6.38 | ||||
| ResNet-50 [24] | 74 | 8.07 | |||
| 25 | 6.65 | ||||
| ResNet-152 | 25 | 6.0 | |||
Table 7.
Accuracy of age estimation by previous studies with the original MORPH database without blurred images.
Table 7.
Accuracy of age estimation by previous studies with the original MORPH database without blurred images.
| Methods | MAE (Years) | |
|---|---|---|
| Geng et al. [14] | AGES with LDA | 8.07 |
| Belver et al. [19] | DEX-CHALEARN | 3.67 |
| Han et al. [20] | DIF | 3.6 |
Table 8.
Comparison of accuracy of age estimation by previous and proposed methods with original and blurred MORPH database images.
Table 8.
Comparison of accuracy of age estimation by previous and proposed methods with original and blurred MORPH database images.
| Approach | Blurring Effect | The Number of Classes | MAE (Years) | ||
|---|---|---|---|---|---|
| Nguyen et al. [22] | Preclassification of optical blur, MLBP, Gabor filter, PCA, and SVR | Optical blur | 50 | 6.607 | |
| Nguyen et al. [21] | Preclassification of motion blur, MLBP, Gabor filter, PCA, and SVR | Motion blur | 50 | 6.05 | |
| Our method | CNN without preclassification of optical and motion blur | AlexNet [27] | Optical and motion blur | 50 | 10.72 |
| 17 | 9.11 | ||||
| ResNet-50 [24] | 50 | 6.89 | |||
| 17 | 6.23 | ||||
| ResNet-152 | 17 | 5.78 | |||
Table 9.
Comparison of accuracy of age estimation according to change in image resolution.
| Image Resolution | MAE (Years) |
|---|---|
| Original images | 4.55 |
| Subsampled images of 1/8 | 4.93 |
| Subsampled images of 1/64 | 7.02 |
| Subsampled images of 1/512 | 8.21 |
Table 10.
Comparison of accuracy of age estimation with self-collected database.
| Cases | MAE (Years) |
|---|---|
| Real blurred images | 4.56 |
| Images from different angles | 4.62 |
| Images including obstruction | 5.45 |
| Images from different distances | 8.03 |
Table 11.
Comparison of accuracy of age estimation when using the same databases for training and testing vs. using different databases for training and testing.
Table 11.
Comparison of accuracy of age estimation when using the same databases for training and testing vs. using different databases for training and testing.
| Methods | MAE (Years) | |
|---|---|---|
| Training | Testing | |
| PAL database | PAL database | 6.0 |
| MORPH database | MORPH database | 5.78 |
| PAL database | MORPH database | 6.08 |
| MORPH database | PAL database | 5.84 |
© 2018 by the authors. Licensee MDPI, Basel, Switzerland. This article is an open access article distributed under the terms and conditions of the Creative Commons Attribution (CC BY) license (http://creativecommons.org/licenses/by/4.0/).
Share and Cite
MDPI and ACS Style
Kang, J.S.; Kim, C.S.; Lee, Y.W.; Cho, S.W.; Park, K.R. Age Estimation Robust to Optical and Motion Blurring by Deep Residual CNN. Symmetry 2018, 10, 108. https://doi.org/10.3390/sym10040108
AMA Style
Kang JS, Kim CS, Lee YW, Cho SW, Park KR. Age Estimation Robust to Optical and Motion Blurring by Deep Residual CNN. Symmetry. 2018; 10(4):108. https://doi.org/10.3390/sym10040108
Chicago/Turabian StyleKang, Jeon Seong, Chan Sik Kim, Young Won Lee, Se Woon Cho, and Kang Ryoung Park. 2018. "Age Estimation Robust to Optical and Motion Blurring by Deep Residual CNN" Symmetry 10, no. 4: 108. https://doi.org/10.3390/sym10040108
Note that from the first issue of 2016, this journal uses article numbers instead of page numbers. See further details here.