An Extension of Neutrosophic AHP–SWOT Analysis for Strategic Planning and Decision-Making


1
Department of Operations Research, Faculty of Computers and Informatics, Zagazig University, Markaz El-Zakazik 44519, Egypt
2
Math & Science Department, University of New Mexico, Gallup, NM 87301, USA
*
Author to whom correspondence should be addressed.
Symmetry 2018, 10(4), 116; https://doi.org/10.3390/sym10040116
Submission received: 2 March 2018
/
Revised: 10 April 2018
/
Accepted: 12 April 2018
/
Published: 17 April 2018
(This article belongs to the Special Issue Algebraic Structures of Neutrosophic Triplets, Neutrosophic Duplets, or Neutrosophic Multisets)
Abstract
:Every organization seeks to set strategies for its development and growth and to do this, it must take into account the factors that affect its success or failure. The most widely used technique in strategic planning is SWOT analysis. SWOT examines strengths (S), weaknesses (W), opportunities (O) and threats (T), to select and implement the best strategy to achieve organizational goals. The chosen strategy should harness the advantages of strengths and opportunities, handle weaknesses, and avoid or mitigate threats. SWOT analysis does not quantify factors (i.e., strengths, weaknesses, opportunities and threats) and it fails to rank available alternatives. To overcome this drawback, we integrated it with the analytic hierarchy process (AHP). The AHP is able to determine both quantitative and the qualitative elements by weighting and ranking them via comparison matrices. Due to the vague and inconsistent information that exists in the real world, we applied the proposed model in a neutrosophic environment. A real case study of Starbucks Company was presented to validate our model.
1. Introduction
To achieve an organization’s goals, the strategic factors affecting its performance should be considered. These strategic factors are classified as internal factors, that are under its control, and external factors, that are not under its control.
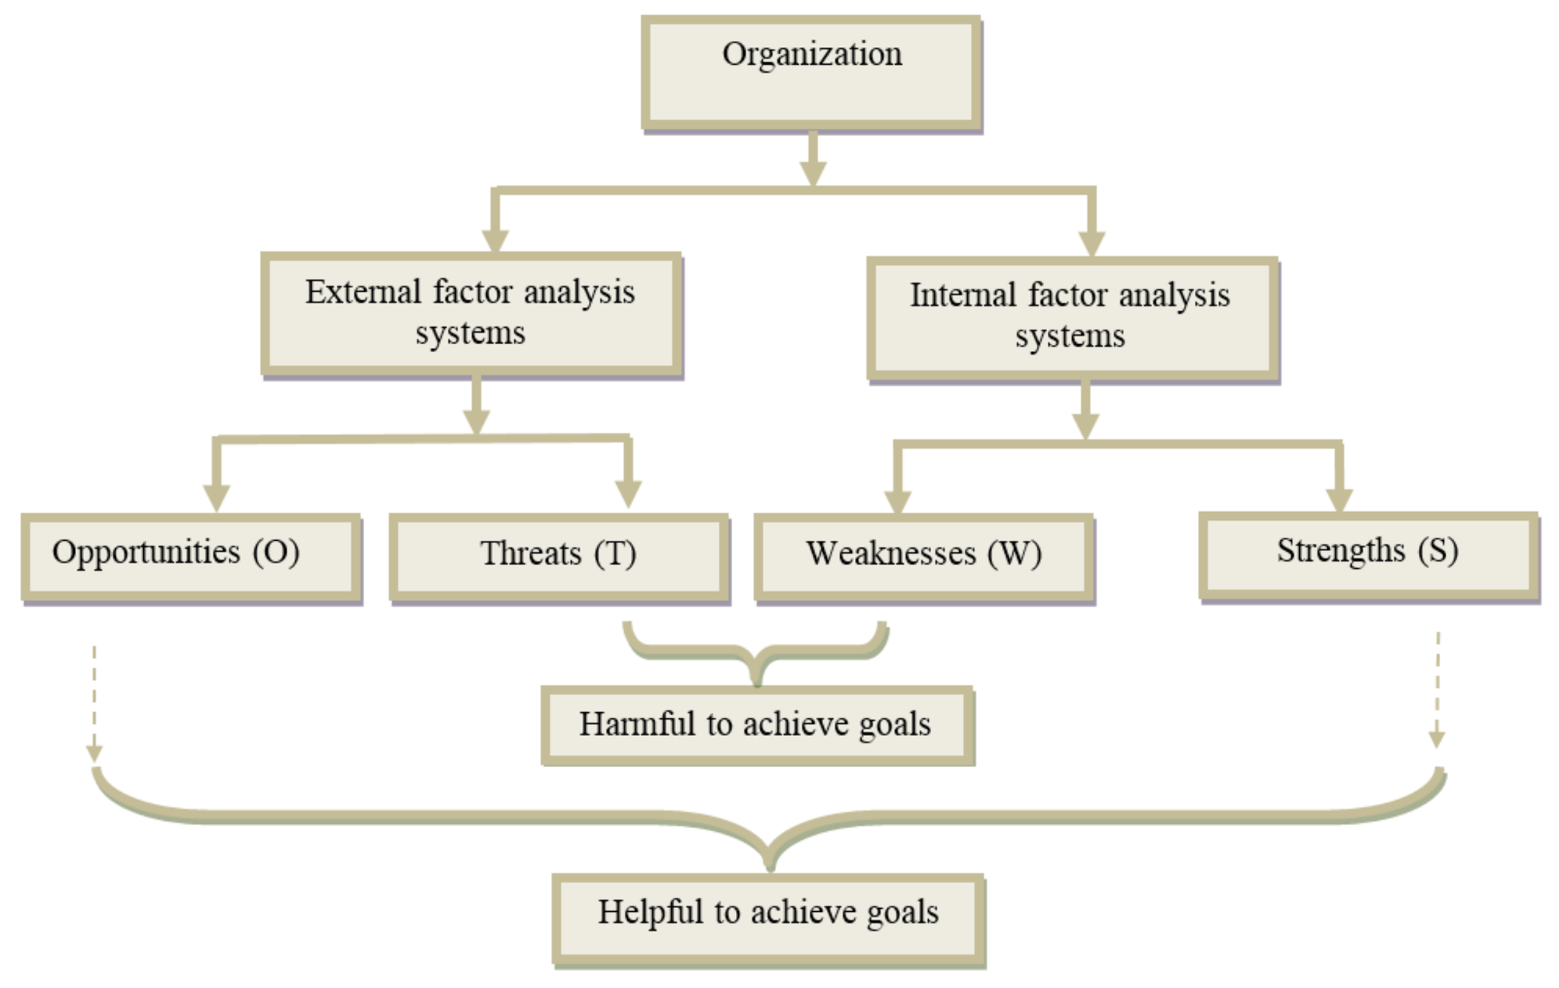
The most popular technique for analyzing strategic cases is SWOT analysis. SWOT is considered a decision-making tool. The SWOT acronym stands for Strengths, Weaknesses, Opportunities and Threats [1]. Strengths and weaknesses are internal factors, while opportunities and threats are external factors. The successful strategic plan of an organization should focus on strengths and opportunities, try to handle weaknesses, and avoid or mitigate threats.
By using SWOT analysis, an organization can choose one of four strategic plans as follows:
- SO: The good use of opportunities through existing strengths.
- ST: The good use of strengths to eliminate or reduce the impact of threats.
- WO: Taking into account weaknesses to obtain the benefits of opportunities.
- WT: Seeking to reduce the impact of threats by considering weaknesses.
SWOT analysis can be used to build successful company strategies, but it fails to provide evaluations and measures. Therefore, in the present research, we integrated it with the neutrosophic analytic hierarchy process (AHP).
The analytic hierarchy process (AHP) is a multi-criterion decision-making technique (MCDM) used for solving and analyzing complex problems. MCDM is an important branch in operations research, when seeking to construct mathematical and programming tools to select the superior alternative between various choices, according to particular criteria.
The AHP consists of several steps. The first step is structuring the hierarchy of the problem to understand it more clearly. The hierarchy of the AHP consists of a goal (objective), decision criteria, sub-criteria, and, finally, all available alternatives.
After structuring the AHP hierarchy, pair-wise comparison matrices are constructed by decision makers to weight criteria using Saaty’s scale [2].
Finally, the final weight of alternatives are determined and ranked.
Then, the AHP is able to estimate both qualitative and the quantitative elements. For this reason, it is one of the most practical multi-criteria decision-making techniques [3].
In real life applications, decision criteria are often vague, complex and inconsistent in nature. In addition, using crisp values in a comparison matrix is not always accurate due to uncertainty and the indeterminate information available to decision makers. Many researchers have begun to use fuzzy set theory [4]. However, fuzzy set theory considers only a truth-membership degree. Atanassov introduced intuitionistic fuzzy set theory [5], which considers both truth and falsity degrees, but it fails to consider indeterminacy. To deal with the previous drawbacks of fuzzy and intuitionistic fuzzy sets, Smarandache introduced neutrosophic sets [6], which consider truth, indeterminacy and falsity degrees altogether to represent uncertain and inconsistent information. Therefore, neutrosophic sets are a better representation of reality. For this reason, in our research, we employed the AHP under a neutrosophic environment.
This research represents the first attempt at combining SWOT analysis with a neutrosophic analytic hierarchy process.
The structure of this paper is as follows: a literature review of SWOT analysis and the AHP is presented in Section 2; the basic definitions of neutrosophic sets are introduced in Section 3; the proposed model is discussed in Section 4; a real case study illustrates the applicability of the model proposed in Section 5; and, finally, Section 6 concludes the paper, envisaging future work.
2. Literature Review
In this section, we present an overview of the AHP technique and SWOT analysis, which are used across various domains.
SWOT analysis [7] is a practical methodology pursued by managers to construct successful strategies by analyzing strengths, weaknesses, opportunities and threats. SWOT analysis is a powerful methodology for making accurate decisions [8]. Organization’s construct strategies to enhance their strengths, remove weaknesses, seize opportunities, and avoid threats.
Kotler et al. used SWOT analysis to attain an orderly approach to decision-making [9,10,11]. Many researchers in different fields [4] apply SWOT analysis. An overview of the applications of SWOT analysis is given by Helms and Nixon [8]. SWOT analysis has been applied in the education domain by Dyson [12]. It has also been applied to healthcare, government and not-for-profit organizations, to handle country-level issues [13] and for sustainable investment-related decisions [14]. It has been recommended for use when studying the relationships among countries [15]. SWOT analysis is mainly qualitative. This is the main disadvantage of SWOT, because it cannot assign strategic factor weights to alternatives. In order to overcome this drawback, many researchers have integrated it with the analytic hierarchy process (AHP).
Since the AHP is convenient and easy to understand, some managers find it a very useful decision-making technique. Vaidya and Kumar reviewed 150 publications, published in international journals between 1983 and 2003, and concluded that the AHP technique was useful for solving, selecting, evaluating and making decisions [16]. Achieving a consensus decision despite the large number of decision makers is another advantage of the AHP [17].
Several researchers have combined SWOT analysis methodology with the analytic hierarchy process (AHP). Leskinen et al. integrated SWOT with the AHP in an environmental domain [18,19,20], Kajanus used SWOT–AHP in tourism [21], and Setwart used SWOT–AHP in project management [22]. Competitive strength, environment and company strategy, were integrated by Chan and Heide [23]. Because the classical version of the AHP fails to handle uncertainty, many researchers have integrated SWOT analysis with the fuzzy AHP (FAHP). Demirtas et al. used SWOT with the fuzzy AHP for project management methodology selection [24]. Lumaksono used SWOT-FAHP to define the best strategy of expansion for a traditional shipyard [25]. Tavana et al. integrated SWOT analysis with intuitionistic fuzzy AHP to outsource reverse logistics [26].
Fuzzy sets focus only on the membership function (truth degree) and do not take into account the non-membership (falsity degree) and the indeterminacy degrees, so fail to represent uncertainty and indeterminacy. To overcome these drawbacks of the fuzzy set, we integrated SWOT analysis with the analytic hierarchy process in a neutrosophic environment.
A neutrosophic set is an extension of a classical set, fuzzy set, and intuitionistic fuzzy set, and it effectively represents real world problems by considering all facets of a decision situation, (i.e., truthiness, indeterminacy and falsity) [27,28,29,30,31,32,33,34,35,36,37,38,39,40,41,42,43,44,45,46,47,48]. This research attempted, for the first time, to present the mathematical representation of SWOT analysis with an AHP in a neutrosophic environment. The neutrosophic set acted as a symmetric tool in the proposed method, since membership was the symmetric equivalent of non-membership, with respect to indeterminacy.
3. Definition of a Neutrosophic Set
In this section, some important definitions of neutrosophic sets are introduced.
Definition 1.
[33,34] The neutrosophic set is characterized by three membership functions, which are the truth-membership function , indeterminacy-membership function and falsity-membership function , where x ∈ X and X are a space of points. Also, :X→[−0, 1+], :X→[−0, 1+] and :X→[−0, 1+]. There is no restriction on the sum of (), and , so 0− ≤ sup + sup + sup ≤ 3+.
Definition 2.
Definition 3.
Definition 4.
[34,36] Let = and = be two single-valued triangular neutrosophic numbers and γ ≠ 0 be any real number. Then:
- Addition of two triangular neutrosophic numbers
- Subtraction of two triangular neutrosophic numbers
- Inverse of a triangular neutrosophic number
- Multiplication of a triangular neutrosophic number by a constant value
- Division of a triangular neutrosophic number by a constant value
- Division of two triangular neutrosophic numbers
- Multiplication of two triangular neutrosophic numbers
4. Neutrosophic AHP (N-AHP) in SWOT Analysis
This section describes the proposed model of integrating SWOT analysis with the neutrosophic AHP. A step-by-step procedure for the model described is provided in this section.
- Step 1
- Select a group of experts at performing SWOT analysis.
In this step, experts identify the internal and the external factors of the SWOT analysis by employing questionnaires/interviews.
Figure 1 presents the SWOT analysis diagram:
To transform a complex problem to a simple and easy to understand problem, the following step is applied:
- Step 2
- Structure the hierarchy of the problem.
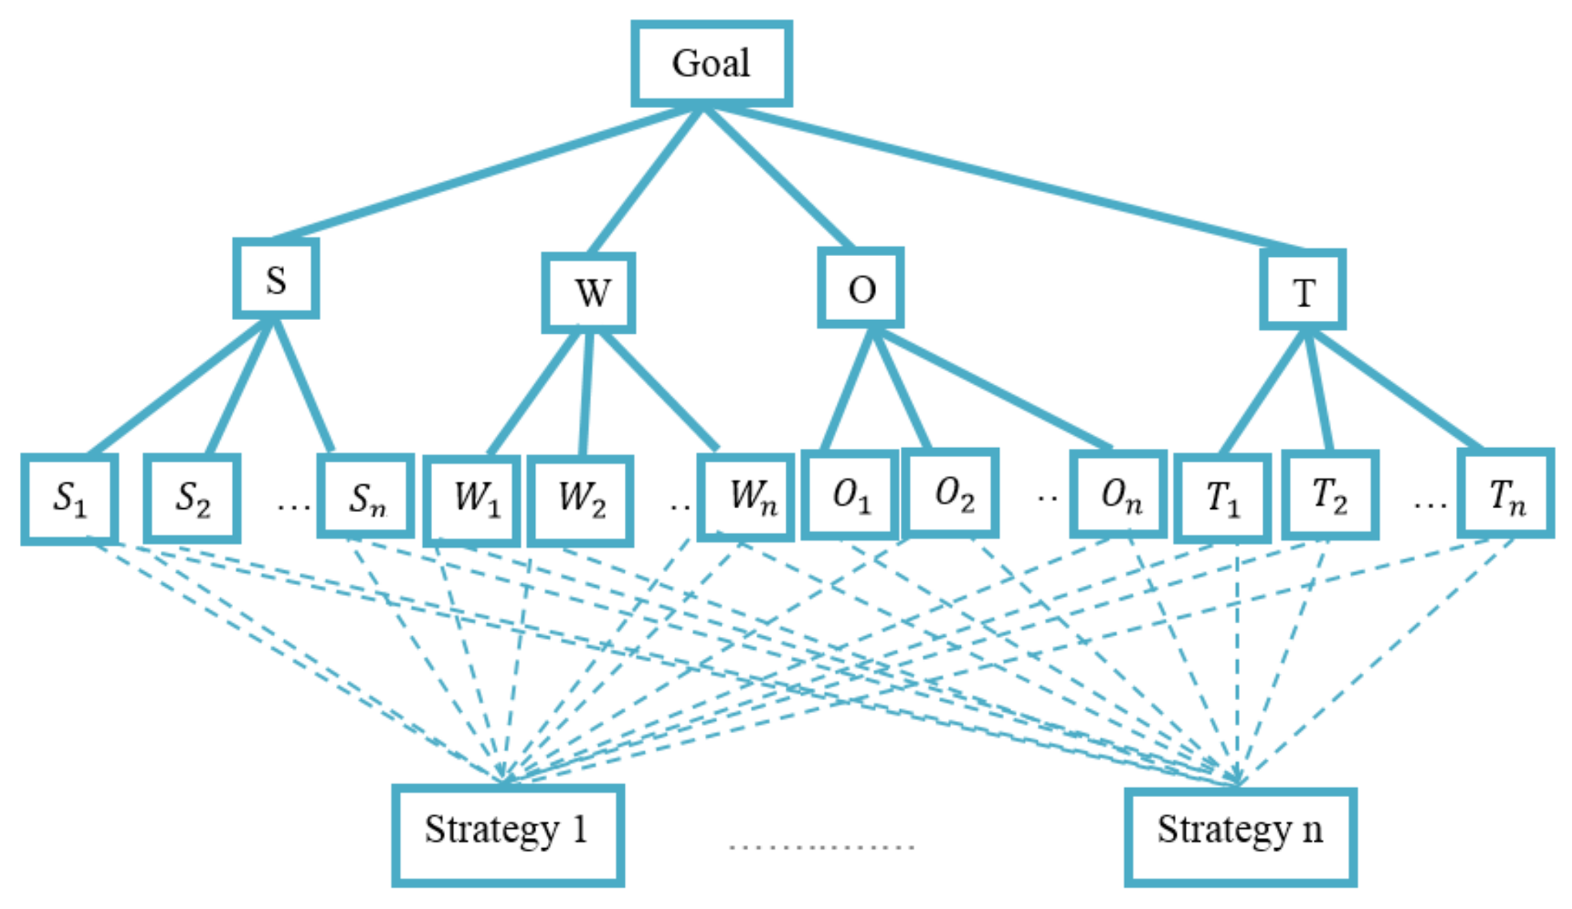
The hierarchy of the problem has four levels:
- The first level is the goal the organization wants to achieve.
- The second level consists of the four strategic criteria that are defined by the SWOT analysis (i.e., criteria).
- The third level are the factors that are included in each strategic factor of the previous level (i.e., sub-criteria).
- The final level includes the strategies that should be evaluated and compared.
The general hierarchy is presented in Figure 2.
The next step is applied for weighting factors (criteria), sub-factors (sub-criteria) and strategies (alternatives), according to experts’ opinions.
- Step 3
- Structure the neutrosophic pair-wise comparison matrix of factors, sub-factors and strategies, through the linguistic terms which are shown in Table 1.
The neutrosophic scale is attained according to expert opinion.
The neutrosophic pair-wise comparison matrix of factors, sub-factors and strategies are as follows:
where , and is the triangular neutrosophic number that measures the decision makers vagueness.
- Step 4
- Check the consistency of experts’ judgments.
If the pair-wise comparison matrix has a transitive relation, i.e., for all and , then the comparison matrix is consistent [38], focusing only on the lower, median and upper values of the triangular neutrosophic number of the comparison matrix.
- Step 5
- Calculate the weight of the factors (S, W, O, T), sub-factors and strategies/alternatives (Alt1,…,Altn) from the neutrosophic pair-wise comparison matrix, by transforming it to a deterministic matrix using the following equations.
Let be a single valued triangular neutrosophic number; then,
and
which are the score and accuracy degrees of respectively.
To get the score and the accuracy degree of , we use the following equations:
With compensation by score value of each triangular neutrosophic number in the neutrosophic pair-wise comparison matrix, we derive the following deterministic matrix:
Determine the ranking of priorities, namely the Eigen Vector X, from the previous matrix as follows:
- Normalize the column entries by dividing each entry by the sum of the column.
- Take the total of the row averages.
- Step 6
- Calculate the total priority of each strategy (alternative) for the final ranking of all strategies using Equation (10).
The total weight value of the alternative j can be written as follows:
where ) and are the weights of Strengths, Weaknesses, Opportunities and Threats; () are the sub-factor weights; and is the weight of the alternative j, corresponding to its sub-factor.
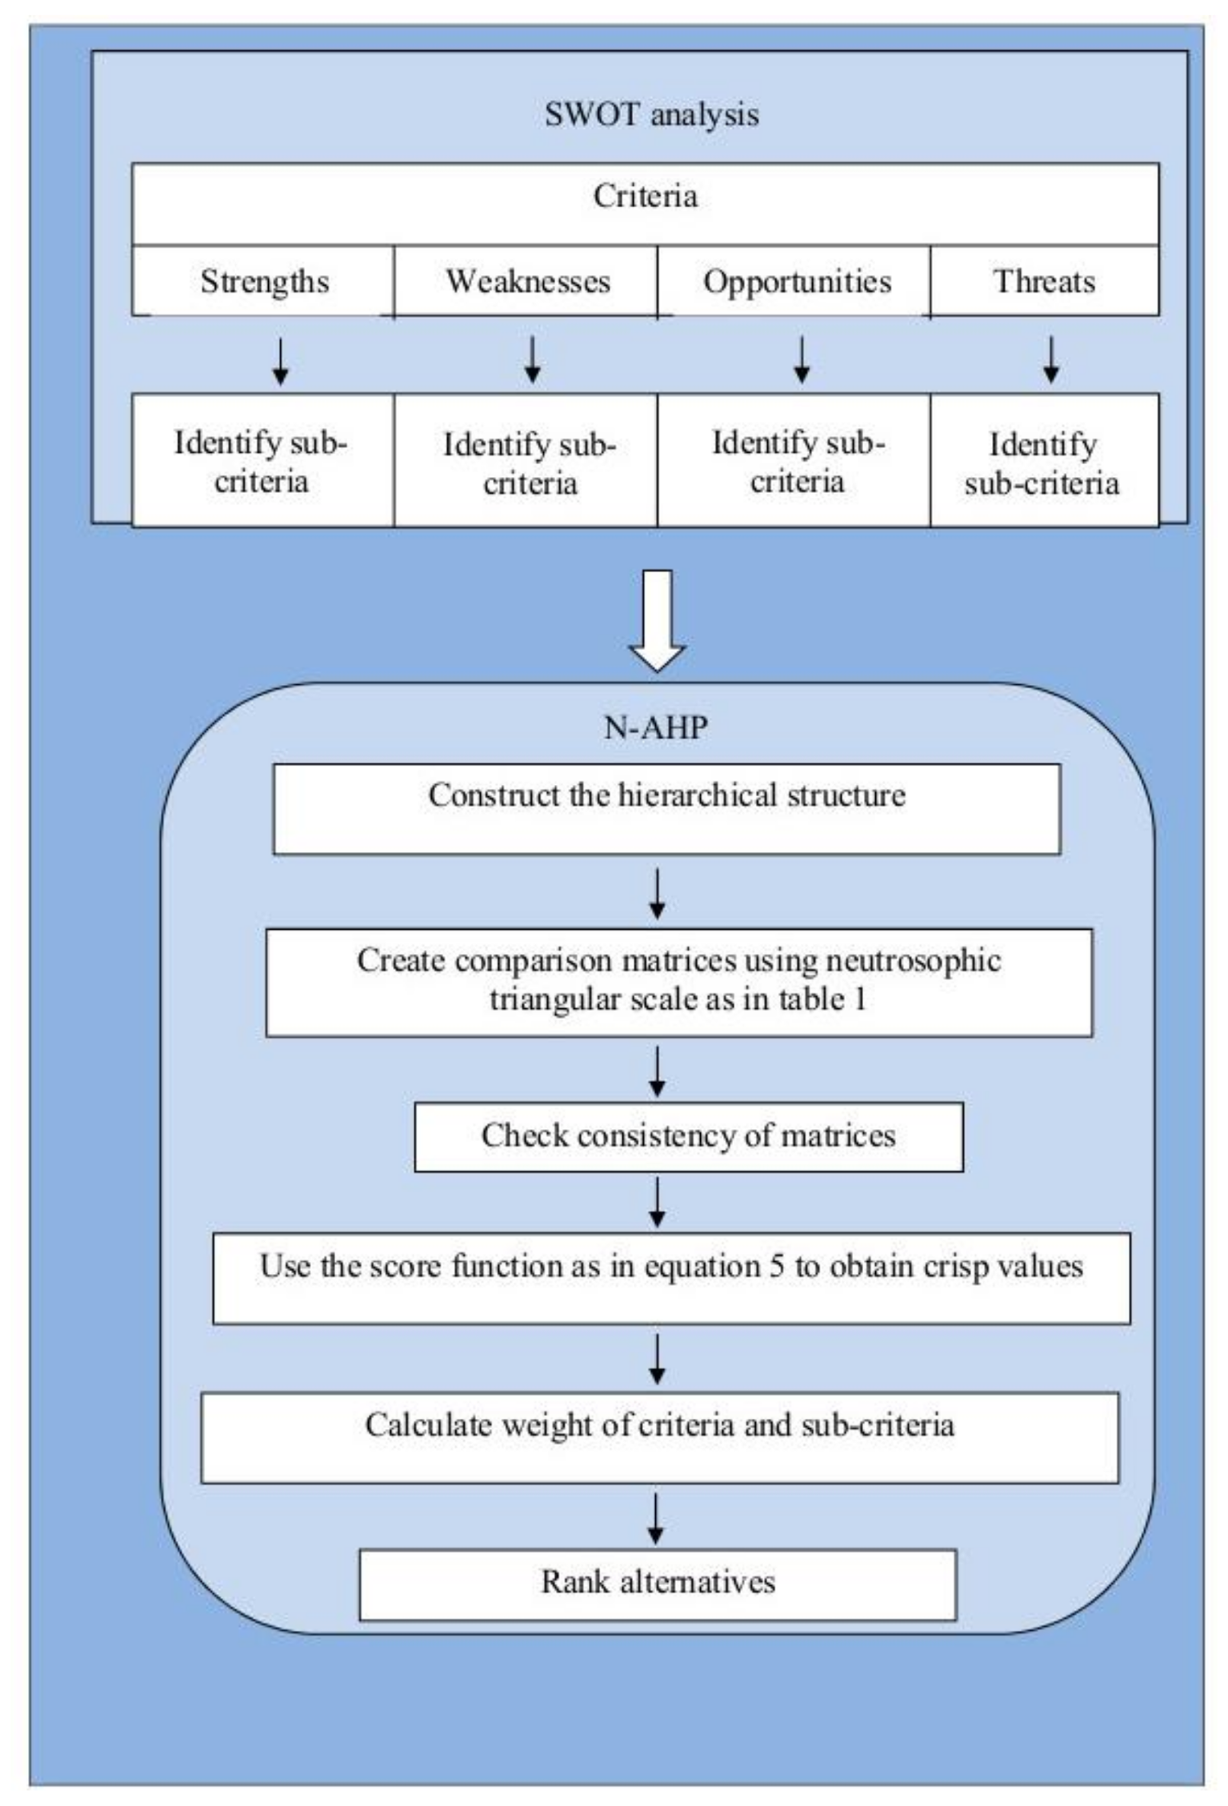
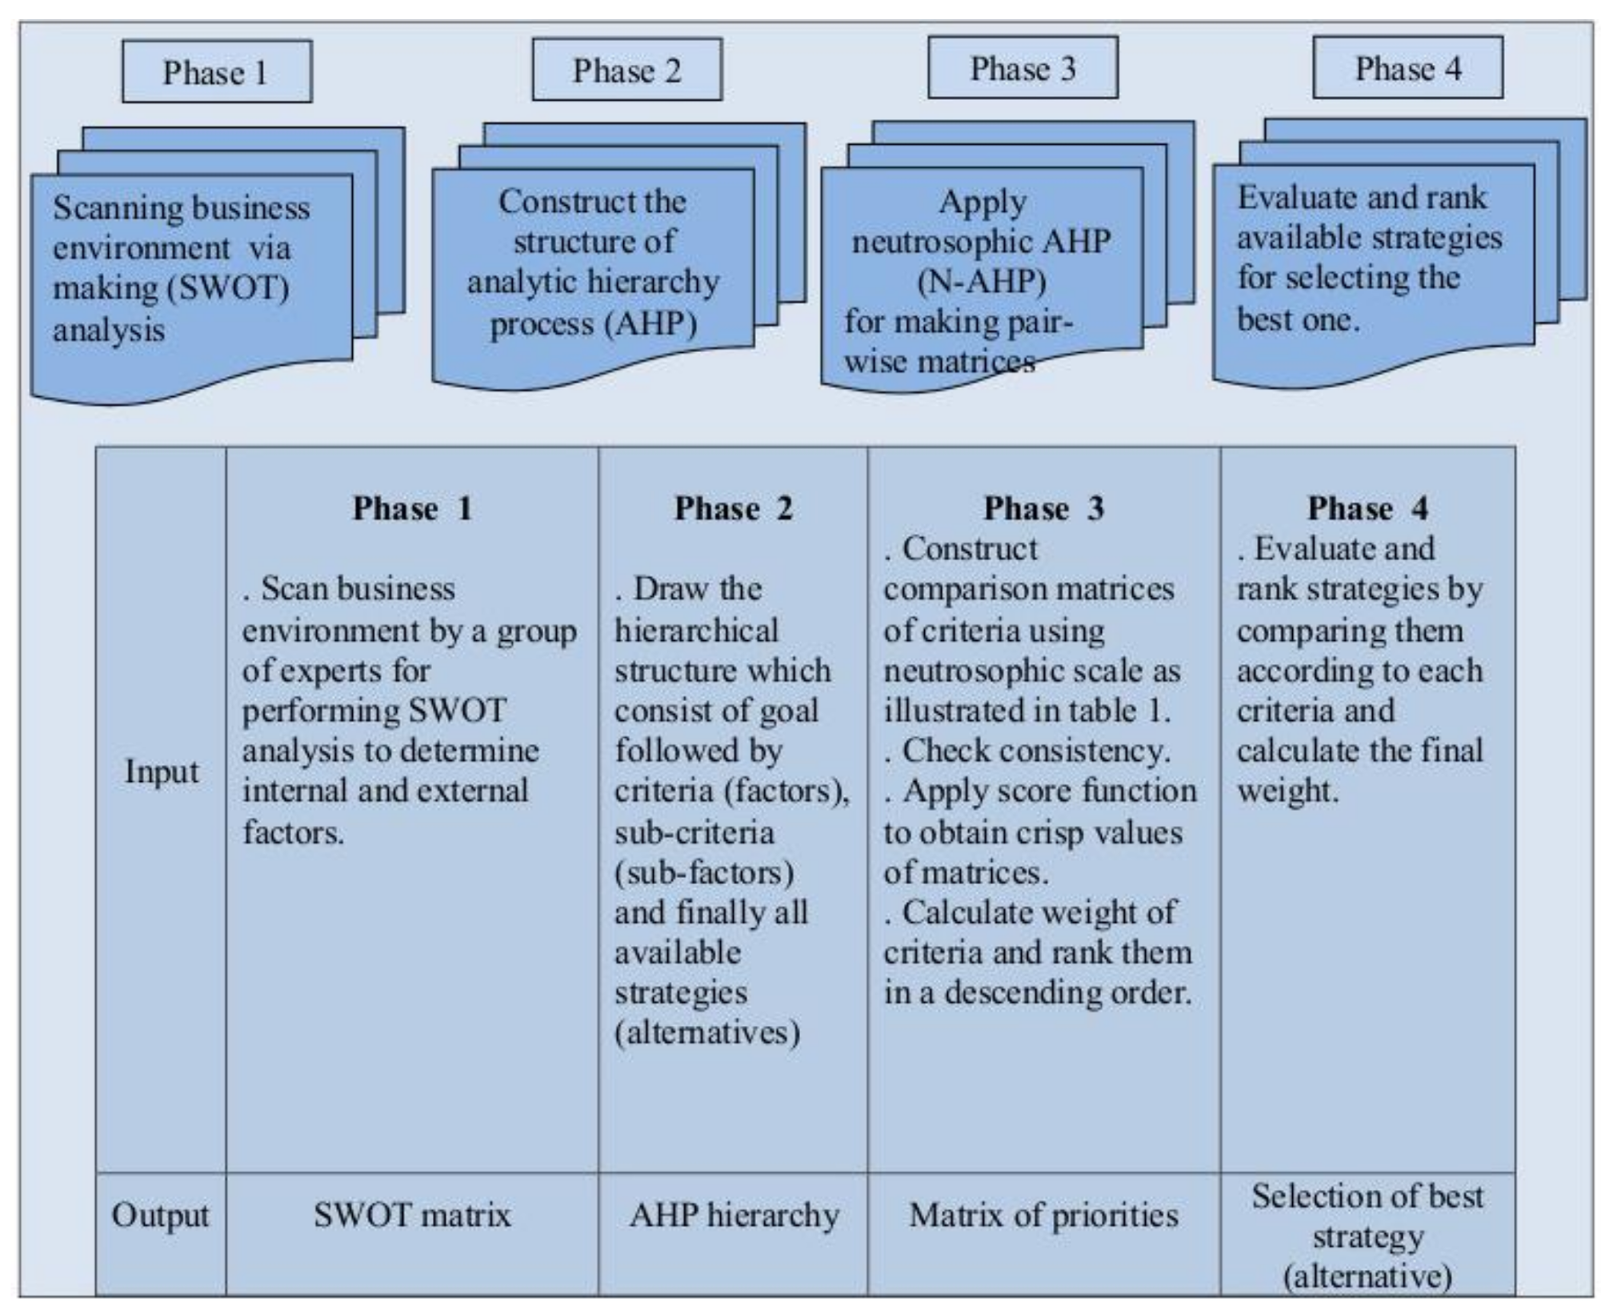
From previous steps, we obtain the phases of integrating SWOT analysis with neutrosophic analytic hierarchy processes, as shown in Figure 3.
5. Illustrative Example
The model proposed in Section 3 is used to solve a real case study in this section.
Every company should analyze and dissect itself from time to time, in order to face competition. This is important especially when a company wants to launch a new product, or open a new market, in order to measure its presumptive success. A company can appraise itself honestly and effectively by performing SWOT analysis, which will help it examine its performance by analyzing internal and external factors. Once SWOT analysis is complete, a company will gain more information about its capabilities. For the evaluation process, a multi-criteria decision-making technique should be used. In this research, we used a neutrosophic AHP. A case study is offered in this section to illustrate this process in detail.
The phases for implementing a N-AHP in SWOT analysis are shown in Figure 4.
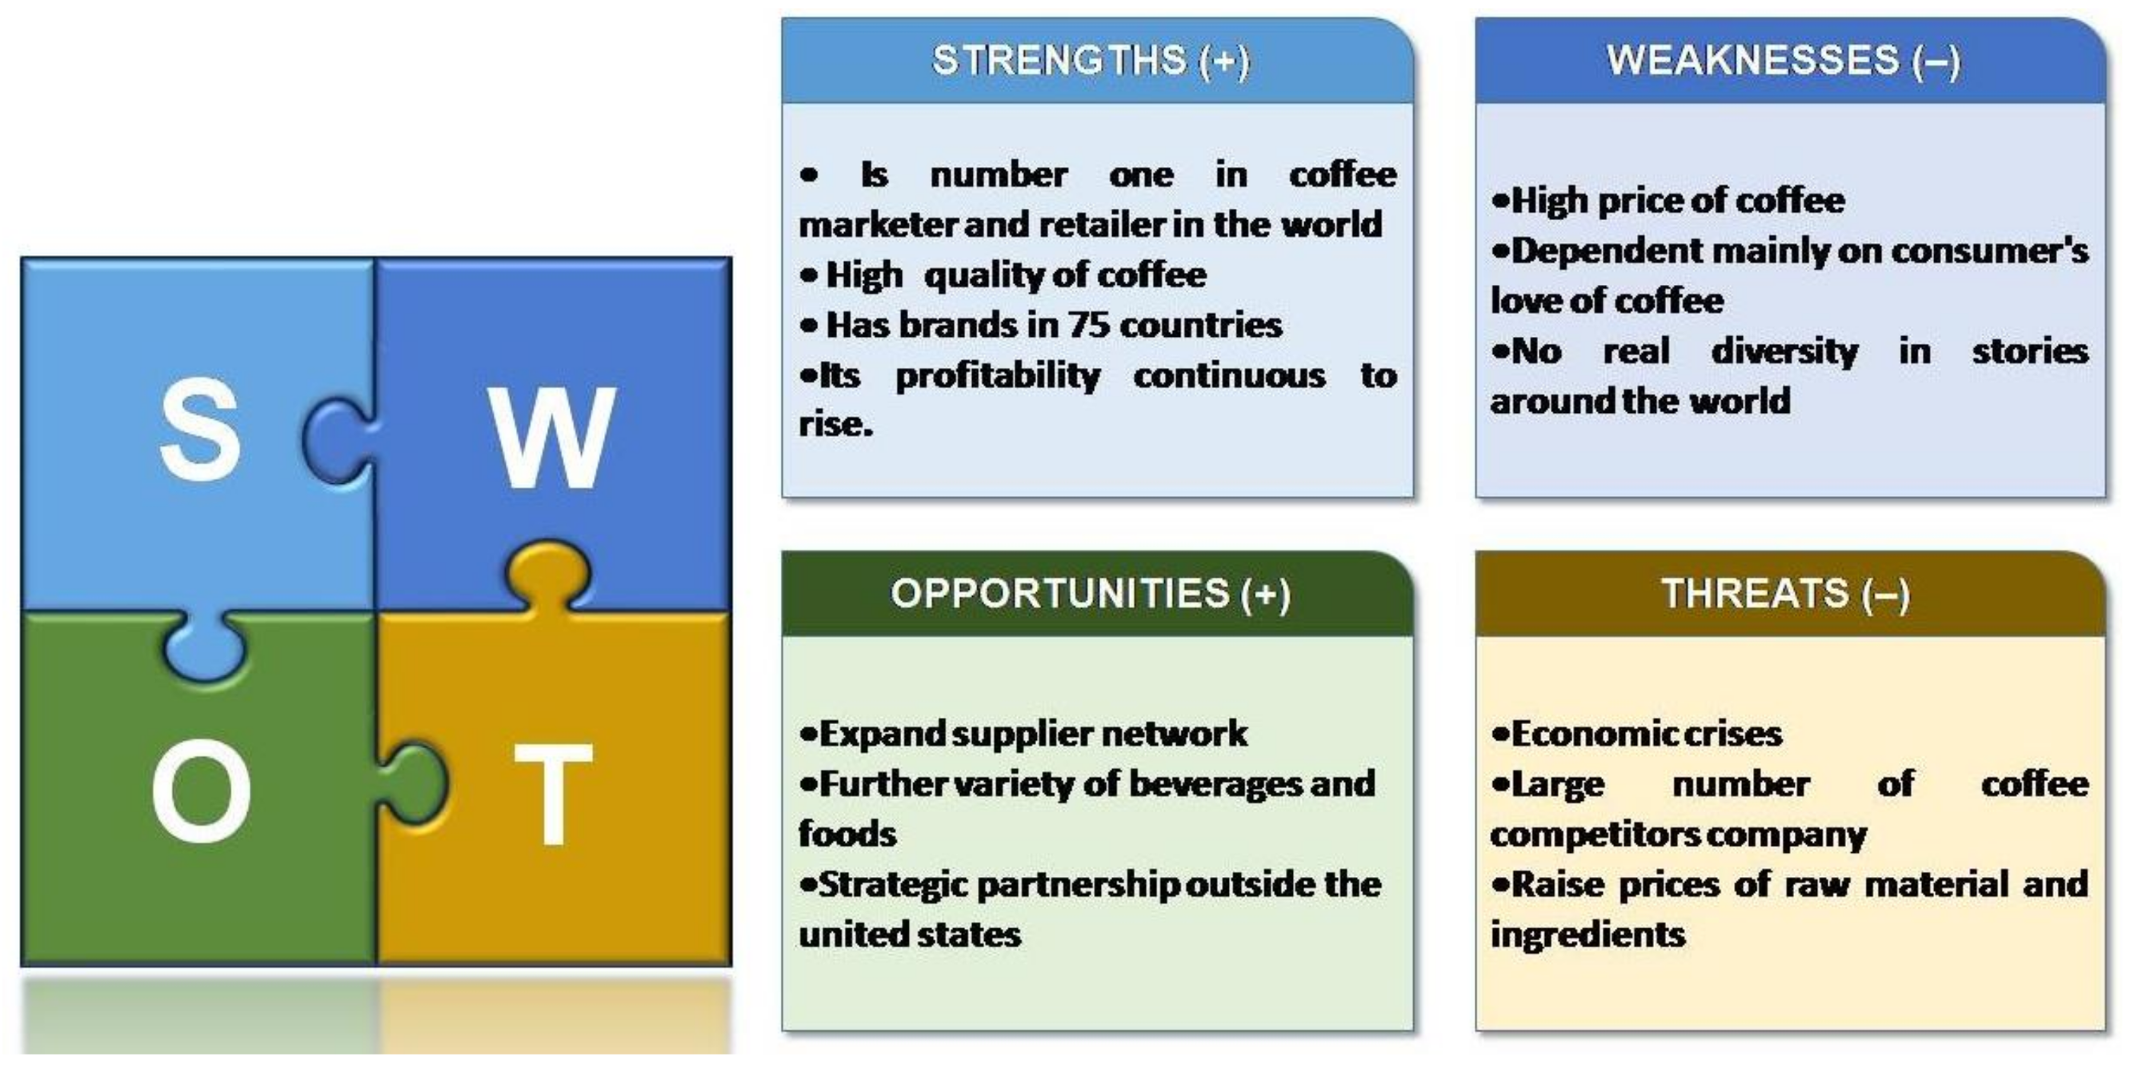
Starbucks Company is the most widely prolific marketer and retailer of coffee in the world. The company has branches in 75 countries, with more than 254,000 employees. The company also sells different types of coffee and tea products and has a licensed trademark. The company offers food, in addition to coffee, and this makes it an attractive spot for snacks and breakfast. The company has different competitors, such as Caribou Coffee Company, Costa Coffee, Green Mountain Coffee Roasters and many others. To face competition, a group of experts perform Starbucks SWOT analysis, as shown in Figure 5. Depending on the SWOT factors and sub-factors, a set of alternatives strategies is developed. Our aim was to prioritize the strategies suggested by company indicators.
These strategies were:
- ❖
- SO strategies
- Amplifying global stores
- Seeking higher growth markets
- ❖
- WO strategies
- Adding different forms, new categories and diverse channels of products
- Trying to minimize the coffee price
- ❖
- ST strategies
- Taking precautions to mitigate economic crises and maintain profitability
- ❖
- WT strategies
- Competing with other companies by offering different coffee and creating brand loyalty
- Diversifying stores around the world and minimizing raw materials prices
By applying our proposed model to Starbucks Company, the evaluation process and the selection of different strategies was anticipated to become simpler and more valuable.
- Step 1
- Perform SWOT analysis.
Four experts were selected to perform Starbucks Company SWOT analysis, as they had experience in the coffee industry.
To implement the SWOT analysis, we prepared a questionnaire (see Appendix A) and sent it out online to experts. After obtaining the answers, the internal (Strengths and Weaknesses) and external (Opportunities and Threats) factors were identified, as shown in Figure 5.
- Step 2
- Structure the hierarchy of the problem.
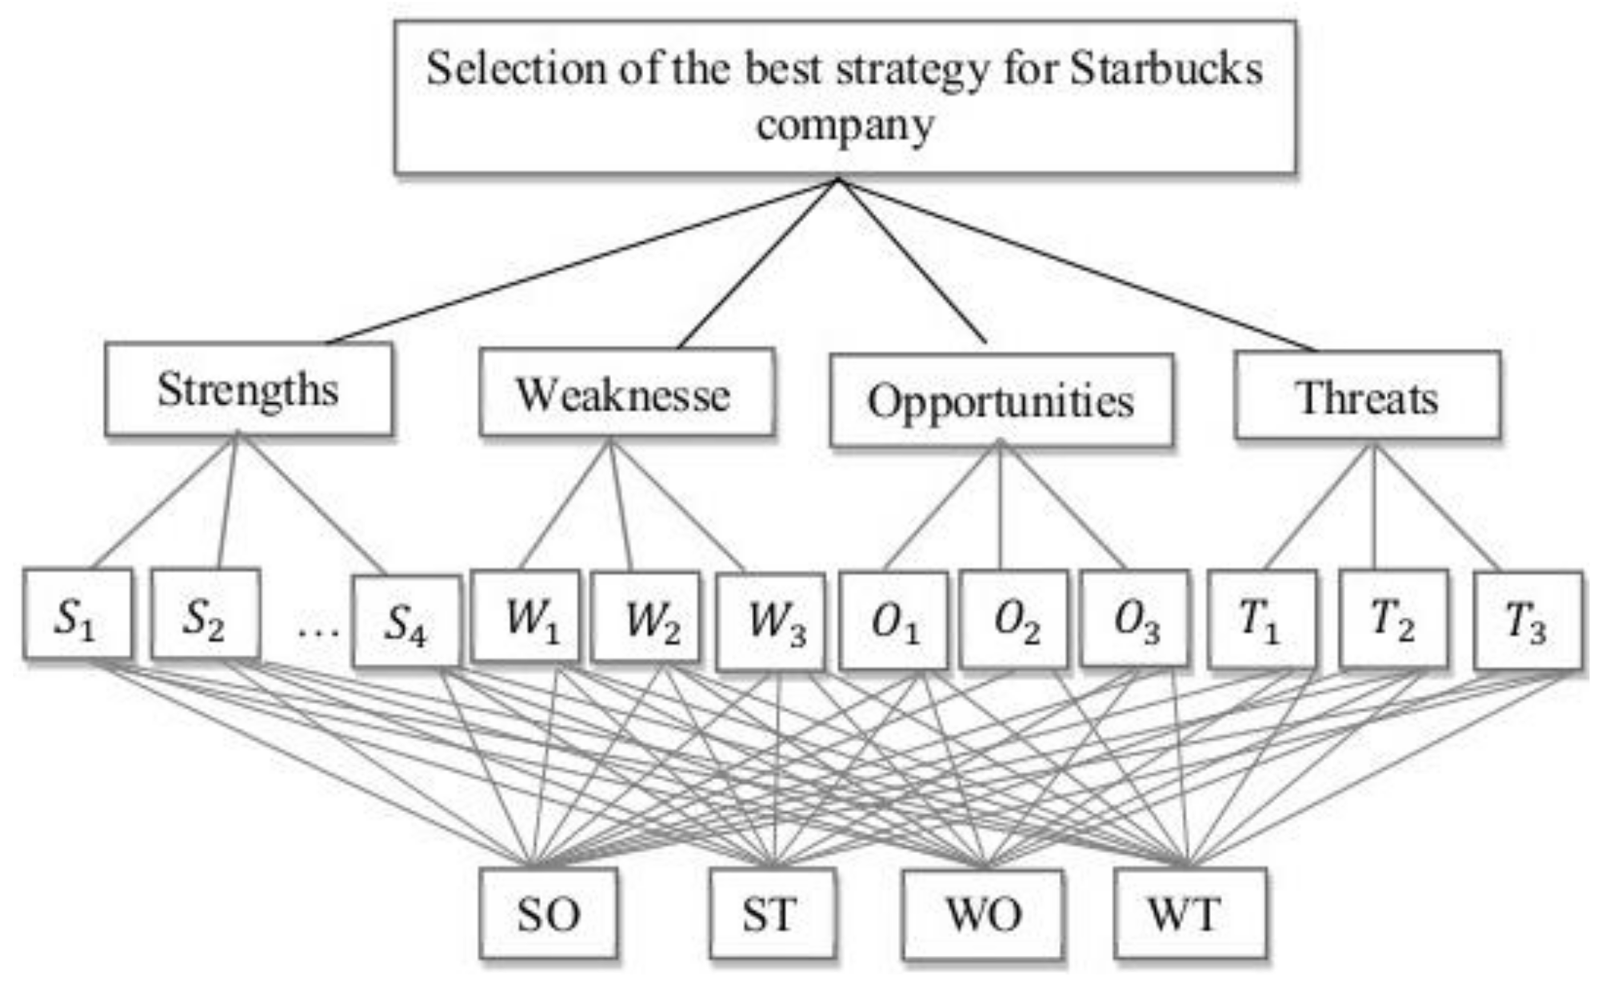
The hierarchical structure of Starbucks Company, according to the proposed methodology, is presented in Figure 6.
In Figure 6, ,…, were the strengths sub-factors, as listed in the SWOT analysis. Also, ,…, ,,…, and ,…, were the weaknesses, opportunities and threats sub-factors of the SWOT analysis, as shown in Figure 5.
- Step 3
The pair-wise comparison matrix of SWOT factors is presented in Table 2.
- Step 4
- Check the consistency of experts’ judgments.
The previous comparison matrix was consistent when applying the method proposed in [38].
- Step 5
- Calculate the weight of the factors, sub-factors and strategies.
To calculate weight, we first transformed the neutrosophic comparison matrix to its crisp form by using Equation (5). The crisp matrix is presented in Table 3.
Then, we determined the ranking of the factors, namely the Eigen Vector X, from the previous matrix, as illustrated previously in the detailed steps of the proposed model.
The normalized comparison matrix of factors is presented in Table 4.
By taking the total of the row averages:
The neutrosophic comparison matrix of strengths is presented in Table 5.
The crisp pair-wise comparison matrix of strengths is presented in Table 6 and the normalized comparison matrix of strengths is presented in Table 7.
By taking the total of the row averages:
The neutrosophic comparison matrix of weaknesses is presented in Table 8.
The crisp comparison matrix of weaknesses is presented in Table 9.
The normalized comparison matrix of weaknesses is presented in Table 10.
By taking the total of the row averages:
The neutrosophic comparison matrix of opportunities is presented in Table 11.
The crisp comparison matrix of opportunities is presented in Table 12.
The normalized comparison matrix of opportunities is presented in Table 13.
By taking the total of the row averages:
The neutrosophic comparison matrix of threats is presented in Table 14.
The crisp comparison matrix of threats is presented in Table 15.
The normalized comparison matrix of threats is presented in Table 16.
By taking the total of the row averages:
Similar to the factors and sub-factors calculation methodology, the weights of alternatives (strategies), with respect to sub-factors, were as follows:
The Eigen Vector X of strategies with respect to S1 =
The Eigen Vector X of strategies with respect to S2 =
The Eigen Vector X of strategies with respect to S3 =
The Eigen Vector X of strategies with respect to S4 =
The Eigen Vector X of strategies with respect to W1 =
The Eigen Vector X of strategies with respect to W2 =
The Eigen Vector X of strategies with respect to W3 =
The Eigen Vector X of strategies with respect to O1 =
The Eigen Vector X of strategies with respect to O2 =
The Eigen Vector X of strategies with respect to O3 =
The Eigen Vector X of strategies with respect to T1 =
The Eigen Vector X of strategies with respect to T2 =
The Eigen Vector X of strategies with respect to T3 =
- Step 6
- Determine the total priority of each strategy (alternative) and define the final ranking of all strategies using Equation (10).
The weights of SWOT factors, sub-factors and alternative strategies are presented in Table 17.
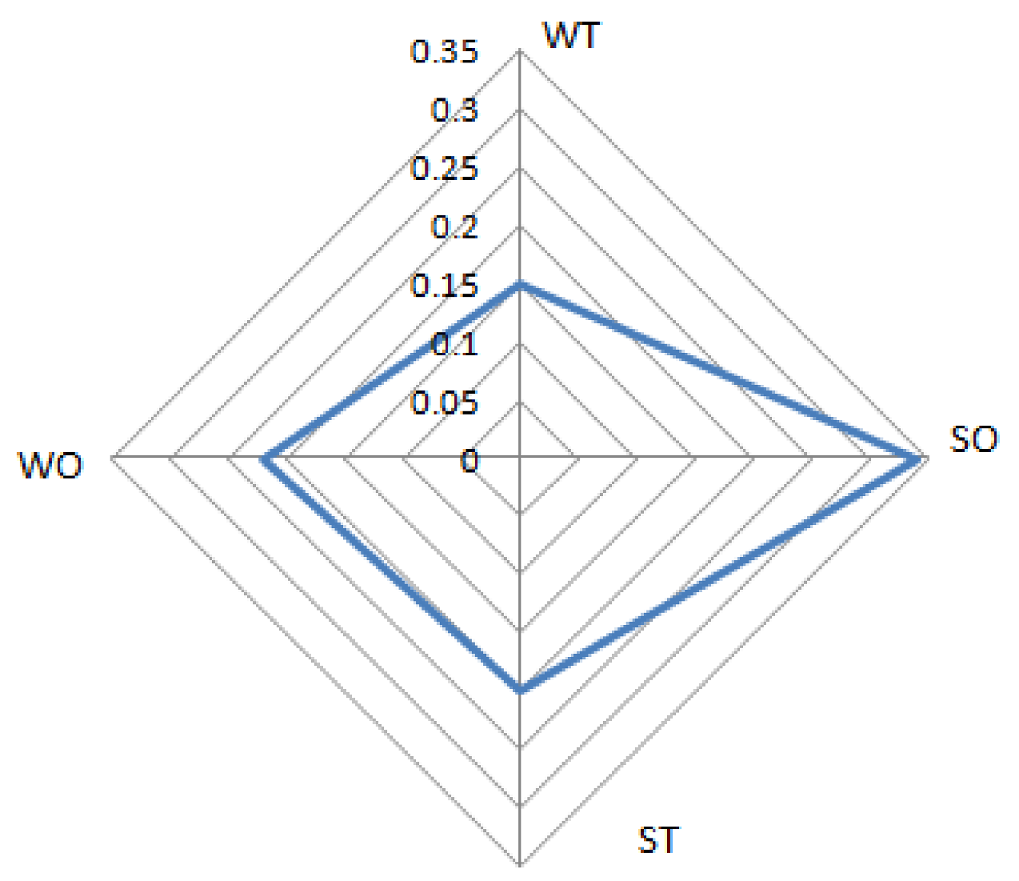
According to our analysis of Starbucks Company using SWOT–N-AHP, the strategies were ranked as follows: SO, WO, ST and WT, as presented in detail in Table 17 and in Figure 7. In conclusion, SO was the best strategy for achieving Starbuck’s goals since it had the greatest weight value.
To evaluate the quality of the proposed model, we compared it with other existing methods:
- The authors in [18,19,20,21] combined the AHP with SWOT analysis to solve the drawbacks of SWOT analysis, as illustrated in the introduction section, but in the comparison matrices of the AHP they used crisp values, which were not accurate due to the vague and uncertain information of decision makers.
- In order to solve the drawbacks of classical AHP, several researchers combined SWOT analysis with the fuzzy AHP [24,25,26]. Since fuzzy sets consider only the truth degree and fail to deal with the indeterminacy and falsity degrees, it also does not offer the best representation of vague and uncertain information.
- Since neutrosophic sets consider truth, indeterminacy and falsity degrees altogether, it is the best representation for the vague and uncertain information that exists in the real world. We were the first to integrate the neutrosophic AHP with SWOT analysis. In addition, our model considered all aspects of vague and uncertain information by creating a triangular neutrosophic scale for comparing factors and strategies. Due to its versatility, this method can be applied to various problems across different fields.
6. Conclusions and Future Works
SWOT analysis is an important tool for successful planning, but it has some drawbacks because it fails to provide measurements and evaluations of factors (criteria) and strategies (alternatives). In order to deal with SWOT analysis drawbacks, this research integrated the neutrosophic AHP (N-AHP) approach. Using the N-AHP in SWOT analysis produced both quantitative and qualitative measurements of factors. The reasons for applying an AHP in a neutrosophic environment are as follows: due to vague, uncertain and inconsistent information, which usually exists in real world applications, the crisp values in the classical AHP are not accurate; in the fuzzy AHP, only the truth degree is considered, which makes it incompatible with real world applications; and the intuitionistic AHP holds only truth and falsity degrees, therefore failing to deal with indeterminacy. The neutrosophic AHP is useful to interpret vague, inconsistent and incomplete information by deeming the truth, indeterminacy and falsity degrees altogether. Therefore, by integrating the N-AHP with SWOT analysis we were able to effectively and efficiently deal with vague information better than fuzzy and intuitionistic fuzzy set theories. The parameters of the N-AHP comparison matrices were triangular neutrosophic numbers and a score function was used to transform the neutrosophic AHP parameters to deterministic values. By applying our proposed model to Starbucks Company, the evaluation process of its performance was effective, and the selection between the different strategies became simpler and more valuable.
In the future, this research should be extended by employing different multi-criteria decision-making (MCDM) techniques and studying their effect on SWOT analysis. In particular, it would be useful to integrate SWOT analysis with the neutrosophic network process (ANP) to effectively deal with interdependencies between decision criteria and handle the vague, uncertain and inconsistent information that exists in real world applications.
Acknowledgments
The authors would like to thank the anonymous referees, Chief-Editor, and support Editors for their constructive suspensions and propositions that have helped to improve the quality of this research.
Author Contributions
All authors contributed equally to this paper. The individual responsibilities and contributions of each author is described as follows: the idea of the paper was put forward by Mohamed Abdel-Basset; Florentin Smarandache completed the preparatory work of the paper; Mai Mohamed analyzed the existing work; and the revision and submission of the paper was completed by Mohamed Abdel-Basset.
Conflicts of Interest
The authors declare no conflict of interest.
Appendix A
Four experts were selected to perform the SWOT analysis to determine the four strategic factors of Starbucks Company. The experts were specialized in manufacturing, sales and quality. To implement the SWOT analysis, we prepared the following questionnaire and sent it out online to the experts:
- What is your specialty?
- How many years of experience in coffee industry you have?
- What are in your opinion the strengths of the Starbucks Company?
- What are in your opinion the weaknesses of the Starbucks Company?
- What are in your opinion the opportunities of the Starbucks Company?
- What are in your opinion the threats of the Starbucks Company?
- Please use the triangular neutrosophic scale introduced in Table 1 to compare all factors and present your answers in a table format.
- Please use the triangular neutrosophic scale introduced in Table 1 to compare all strategies and present your answers in a table format.
- In your opinion, which strategy from below will achieve the Starbucks goals:
- ⚪
- SO, A strategic plan involving a good use of opportunities through existing strengths.
- ⚪
- ST, A good use of strengths to remove or reduce the impact of threats.
- ⚪
- WO, Taking into accounts weaknesses to gain benefit from opportunities.
- ⚪
- WT, Reducing threats by becoming aware of weaknesses.
References
- Killen, C.P.; Walker, M.; Hunt, R.A. Strategic planning using QFD. Int. J. Qual. Reliab. Manag. 2005, 22, 17–29. [Google Scholar] [CrossRef]
- Saaty, T.L. What is the analytic hierarchy process? In Mathematical Models for Decision Supported; Springer: Berlin, Germany, 1988; pp. 109–121. [Google Scholar]
- Saaty, T.L. Theory and Applications of the Analytic Network Process: Decision Making with Benefits, Opportunities, Costs, and Risks; RWS: Chalfont St Peter, UK, 2005. [Google Scholar]
- Taghavifard, M.T.; Amoozad Mahdiraji, H.; Alibakhshi, A.M.; Zavadskas, E.K.; Bausys, R. An Extension of Fuzzy SWOT Analysis: An Application to Information Technology. Information 2018, 9, 46. [Google Scholar] [CrossRef]
- Atanassov, K.T. Intuitionistic fuzzy sets. Fuzzy Sets Syst. 1986, 20, 87–96. [Google Scholar] [CrossRef]
- Abdel-Basset, M.; Mohamed, M.; Chang, V. NMCDA: A framework for evaluating cloud computing services. Future Gener. Comput. Syst. 2018, 86, 12–29. [Google Scholar] [CrossRef]
- Arslan, O.; Er, I.D. SWOT analysis for safer carriage of bulk liquid chemicals in tankers. J. Hazard. Mater. 2008, 154, 901–913. [Google Scholar] [CrossRef] [PubMed]
- Helms, M.M.; Nixon, J. Exploring SWOT analysis—Where are we now? A review of academic research from the last decade. J. Strategy Manag. 2010, 3, 215–251. [Google Scholar] [CrossRef]
- Kotler, P. Marketing Management, Analysis, Planning, Implementation, and Control, Philip Kotler; Prentice-Hall International: London, UK, 1994. [Google Scholar]
- Wheelen, T.L.; Hunger, J.D. Strategic Management and Business Policy; Addison-Wesley: Boston, MA, USA, 1986. [Google Scholar]
- Kajanus, M.; Leskinen, P.; Kurttila, M.; Kangas, J. Making use of MCDS methods in SWOT analysis—Lessons learnt in strategic natural resources management. For. Policy Econ. 2012, 20, 1–9. [Google Scholar] [CrossRef]
- Dyson, R.G. Strategic development and SWOT analysis at the University of Warwick. Eur. J. Oper. Res. 2004, 152, 631–640. [Google Scholar] [CrossRef]
- Chang, L.; Lin, C. The exploratory study of competitive advantage of Hsin-Chu city government by using diamond theory. Bus. Rev. 2005, 3, 180–185. [Google Scholar]
- Khatri, J.K.; Metri, B. SWOT-AHP approach for sustainable manufacturing strategy selection: A case of Indian SME. Glob. Bus. Rev. 2016, 17, 1211–1226. [Google Scholar] [CrossRef]
- Mehta, A.; Armenakis, A.; Mehta, N.; Irani, F. Challenges and opportunities of business process outsourcing in India. J. Lab. Res. 2006, 27, 323–338. [Google Scholar] [CrossRef]
- Vaidya, O.S.; Kumar, S. Analytic hierarchy process: An overview of applications. Eur. J. Oper. Res. 2006, 169, 1–29. [Google Scholar] [CrossRef]
- Akyuz, E.; Celik, M. A hybrid decision-making approach to measure effectiveness of safety management system implementations on-board ships. Saf. Sci. 2014, 68, 169–179. [Google Scholar] [CrossRef]
- Leskinen, L.A.; Leskinen, P.; Kurttila, M.; Kangas, J.; Kajanus, M. Adapting modern strategic decision support tools in the participatory strategy process—A case study of a forest research station. For. Policy Econ. 2006, 8, 267–278. [Google Scholar] [CrossRef]
- Pesonen, M.; Kurttila, M.; Kangas, J.; Kajanus, M.; Heinonen, P. Assessing the priorities using A’WOT among resource management strategies at the Finnish Forest and Park Service. For. Sci. 2001, 47, 534–541. [Google Scholar]
- Masozera, M.K.; Alavalapati, J.R.; Jacobson, S.K.; Shrestha, R.K. Assessing the suitability of community-based management for the Nyungwe Forest Reserve, Rwanda. For. Policy Econ. 2006, 8, 206–216. [Google Scholar] [CrossRef]
- Shrestha, R.K.; Alavalapati, J.R.; Kalmbacher, R.S. Exploring the potential for silvopasture adoption in south-central Florida: An application of SWOT–AHP method. Agric. Syst. 2004, 81, 185–199. [Google Scholar] [CrossRef]
- Stewart, R.A.; Mohamed, S.; Daet, R. Strategic implementation of IT/IS projects in construction: A case study. Autom. Constr. 2002, 11, 681–694. [Google Scholar] [CrossRef]
- Chan, P.S.; Heide, D. Information technology and the new environment: Developing and sustaining competitive advantage. SAM Adv. Manag. J. 1992, 57, 4. [Google Scholar]
- Demirtas, N.; Tuzkaya, U.R.; Seker, S. Project Management Methodology Selection Using SWOT-Fuzzy AHP. In Proceedings of the World Congress on Engineering, London, UK, 2–4 July 2014. [Google Scholar]
- Lumaksono, H. Implementation of SWOT-FAHP method to determine the best strategy on development of traditional shipyard in Sumenep. Acad. Res. Int. 2014, 5, 56. [Google Scholar]
- Tavana, M.; Zareinejad, M.; Di Caprio, D.; Kaviani, M.A. An integrated intuitionistic fuzzy AHP and SWOT method for outsourcing reverse logistics. Appl. Soft Comput. 2016, 40, 544–557. [Google Scholar] [CrossRef]
- Zhang, C.; Li, D.; Sangaiah, A.K.; Broumi, S. Merger and Acquisition Target Selection Based on Interval NeutrosophicMulti-granulation Rough Sets over Two Universes. Symmetry 2017, 9, 126. [Google Scholar] [CrossRef]
- Goyal, R.K.; Kaushal, S.; Sangaiah, A.K. The utility based non-linear fuzzy AHP optimization model for network selection in heterogeneous wireless networks. Appl. Soft Comput. 2017. [Google Scholar] [CrossRef]
- Abdel-Basset, M.; Mohamed, M.; Hussien, A.N.; Sangaiah, A.K. A novel group decision-making model based on triangular neutrosophic numbers. Soft Comput. 2017, 1–15. [Google Scholar] [CrossRef]
- Wang, L.; Wang, Y.; Sangaiah, A.K.; Liao, B. Intuitionistic linguistic group decision-making methods based on generalized compensative weighted averaging aggregation operators. Soft Comput. 2017, 1–13. [Google Scholar] [CrossRef]
- Abdel-Basset, M.; Mohamed, M.; Sangaiah, A.K. Neutrosophic AHP-Delphi Group decision-making model based on trapezoidal neutrosophic numbers. J. Ambient Intell. Humaniz. Comput. 2017, 1–17. [Google Scholar] [CrossRef]
- Chan, F.T.; Chan, H.K.; Lau, H.C.; Ip, R.W. An AHP approach in benchmarking logistics performance of the postal industry. Benchmarking 2006, 13, 636–661. [Google Scholar] [CrossRef]
- Gallego Lupiáñez, F. Interval neutrosophic sets and topology. Kybernetes 2009, 38, 621–624. [Google Scholar] [CrossRef]
- Abdel-Basset, M.; Mohamed, M. The role of single valued neutrosophic sets and rough sets in smart city: imperfect and incomplete information systems. Measurement 2018, 124, 47–55. [Google Scholar] [CrossRef]
- El-Hefenawy, N.; Metwally, M.A.; Ahmed, Z.M.; El-Henawy, I.M. A review on the applications of neutrosophic sets. J. Comput. Theor. Nanosci. 2016, 13, 936–944. [Google Scholar] [CrossRef]
- Deli, I.; Subas, Y. Single valued neutrosophic numbers and their applications to multicriteria decision making problem. Neutrosophic Sets Syst. 2014, 2, 1–3. [Google Scholar]
- Abdel-Baset, M.; Hezam, I.M.; Smarandache, F. Neutrosophic goal programming. Neutrosophic Sets Syst. 2016, 11, 112–118. [Google Scholar]
- Buckley, J.J. Fuzzy hierarchical analysis. Fuzzy Sets Syst. 1985, 17, 233–247. [Google Scholar] [CrossRef]
- Li, X.; Zhang, X.; Choonkil, P. Generalized Interval Neutrosophic Choquet Aggregation Operators and Their Applications. Symmetry 2018, 10, 85. [Google Scholar] [CrossRef]
- Li, X.; Zhang, X. Single-Valued Neutrosophic Hesitant Fuzzy Choquet Aggregation Operators for Multi-Attribute Decision Making. Symmetry 2018, 10, 50. [Google Scholar] [CrossRef]
- Zhang, X.; Florentin, S.; Liang, X. Neutrosophic Duplet Semi-Group and Cancellable Neutrosophic Triplet Groups. Symmetry 2017, 9, 275. [Google Scholar] [CrossRef]
- Guan, H.; Guan, S.; Zhao, A. Forecasting model based on neutrosophic logical relationship and Jaccard similarity. Symmetry 2017, 9, 191. [Google Scholar] [CrossRef]
- Chen, J.; Ye, J.; Du, S. Vector similarity measures between refined simplified neutrosophic sets and their multiple attribute decision-making method. Symmetry 2017, 9, 153. [Google Scholar] [CrossRef]
- Liang, W.; Zhao, G.; Wu, H. Evaluating investment risks of metallic mines using an extended TOPSIS method with linguistic neutrosophic numbers. Symmetry 2017, 9, 149. [Google Scholar] [CrossRef]
- Jiang, W.; Shou, Y. A Novel Single-Valued Neutrosophic Set Similarity Measure and Its Application in Multicriteria Decision-Making. Symmetry 2017, 9, 127. [Google Scholar] [CrossRef]
- Fang, Z.; Ye, J. Multiple attribute group decision-making method based on linguistic neutrosophic numbers. Symmetry 2017, 9, 111. [Google Scholar] [CrossRef]
- Ye, J. Multiple attribute decision-making method using correlation coefficients of normal neutrosophic sets. Symmetry 2017, 9, 80. [Google Scholar] [CrossRef]
- Guo, Z.-L.; Liu, Y.-L.; Yang, H.-L. A Novel Rough Set Model in Generalized Single Valued Neutrosophic Approximation Spaces and Its Application. Symmetry 2017, 9, 119. [Google Scholar] [CrossRef]
Figure 1.
Strengths, Weaknesses, Opportunities and Threats (SWOT) analysis diagram.

Figure 2.
The hierarchy of a problem.

Figure 3.
SWOT-neutrosophic analytic hierarchy process (N-AHP) diagram.

Figure 4.
The phases for implementing a N-AHP in SWOT analysis.

Figure 5.
Starbucks SWOT analysis.

Figure 6.
The hierarchical structure of the problem.

Figure 7.
The final ranking of strategies.

Table 1.
Linguistic terms and the identical triangular neutrosophic numbers.
| Saaty Scale | Explanation | Neutrosophic Triangular Scale |
|---|---|---|
| 1 | Equally influential | |
| 3 | Slightly influential | |
| 5 | Strongly influential | |
| 7 | Very strongly influential | |
| 9 | Absolutely influential | |
| 2 | Sporadic values between two close scales | |
| 4 | ||
| 6 | ||
| 8 |
Table 2.
The neutrosophic comparison matrix of factors.
| Factors | Strengths | Weaknesses | Opportunities | Threats |
|---|---|---|---|---|
| Strengths | ||||
| Weaknesses | ||||
| Opportunities | ||||
| Threats |
Table 3.
The crisp comparison matrix of factors.
| Factors | Strengths | Weaknesses | Opportunities | Threats |
|---|---|---|---|---|
| Strengths | 1 | |||
| Weaknesses | 1 | |||
| Opportunities | ||||
| Threats |
Table 4.
The normalized comparison matrix of factors.
| Factors | Strengths | Weaknesses | Opportunities | Threats |
|---|---|---|---|---|
| Strengths | 0.4 | 0.4 | 0.44 | |
| Weaknesses | 0.4 | 0.4 | 0.44 | |
| Opportunities | 0.1 | 0.1 | 0.1 | 0.06 |
| Threats | 0.06 | 0.06 | 0.1 | 0.06 |
Table 5.
The neutrosophic comparison matrix of strengths.
| Strengths | S1 | S2 | S3 | S4 |
|---|---|---|---|---|
| S1 | ||||
| S2 | ||||
| S3 | ||||
| S4 |
Table 6.
The crisp comparison matrix of strengths.
| Strengths | S1 | S2 | S3 | S4 |
|---|---|---|---|---|
| S1 | 1 | |||
| S2 | ||||
| S3 | ||||
| S4 |
Table 7.
The normalized comparison matrix of strengths.
| Strengths | S1 | S2 | S3 | S4 |
|---|---|---|---|---|
| S1 | 0.3 | 0.3 | 0.3 | |
| S2 | ||||
| S3 | 0.3 | 0.3 | ||
| S4 | 0.3 | 0.3 |
Table 8.
The neutrosophic comparison matrix of weaknesses.
| Weaknesses | W1 | W2 | W3 |
|---|---|---|---|
| W1 | |||
| W2 | |||
| W3 |
Table 9.
The crisp comparison matrix of weaknesses.
| Weaknesses | W1 | W2 | W3 |
|---|---|---|---|
| W1 | |||
| W2 | |||
| W3 |
Table 10.
The normalized comparison matrix of weaknesses.
| Weaknesses | W1 | W2 | W3 |
|---|---|---|---|
| W1 | |||
| W2 | |||
| W3 |
Table 11.
The neutrosophic comparison matrix of opportunities.
| Opportunities | O1 | O2 | O3 |
|---|---|---|---|
| O1 | |||
| O2 | |||
| O3 |
Table 12.
The crisp comparison matrix of opportunities.
| Opportunities | O1 | O2 | O3 |
|---|---|---|---|
| O1 | 1 | ||
| O2 | |||
| O3 |
Table 13.
The normalized comparison matrix of opportunities.
| Opportunities | O1 | O2 | O3 |
|---|---|---|---|
| O1 | |||
| O2 | |||
| O3 |
Table 14.
The neutrosophic comparison matrix of threats.
| Threats | T1 | T2 | T3 |
|---|---|---|---|
| T1 | |||
| T2 | |||
| T3 |
Table 15.
The crisp comparison matrix of threats.
| Threats | T1 | T2 | T3 |
|---|---|---|---|
| T1 | 1 | ||
| T2 | |||
| T3 |
Table 16.
The normalized comparison matrix of threats.
| Opportunities | T1 | T2 | T3 |
|---|---|---|---|
| T1 | |||
| T2 | |||
| T3 |
Table 17.
The weights of SWOT factors, sub-factors, alternatives strategies and their ranking.
| Factors/Sub-Factors | Weight | Alternatives (Strategies) | |||
|---|---|---|---|---|---|
| SO | ST | WO | WT | ||
| Strengths | 0.41 | ||||
| S1 | 0.29 | 0.4 | 0.1 | 0.3 | 0.2 |
| S2 | 0.14 | 0.4 | 0.3 | 0.2 | 0.1 |
| S3 | 0.31 | 0.5 | 0.3 | 0.1 | 0.1 |
| S4 | 0.24 | 0.3 | 0.2 | 0.4 | 0.1 |
| Weaknesses | 0.41 | ||||
| W1 | 0.2 | 0.2 | 0.2 | 0.3 | 0.3 |
| W2 | 0.35 | 0.4 | 0.1 | 0.3 | 0.2 |
| W3 | 0.2 | 0.6 | 0.1 | 0.2 | 0.1 |
| Opportunities | 0.1 | ||||
| O1 | 0.2 | 0.1 | 0.4 | 0.2 | 0.3 |
| O2 | 0.3 | 0.1 | 0.4 | 0.2 | 0.3 |
| O3 | 0.5 | 0.3 | 0.2 | 0.3 | 0.2 |
| Threats | 0.1 | ||||
| T1 | 0.4 | 0.1 | 0.4 | 0.2 | 0.3 |
| T2 | 0.2 | 0.6 | 0.2 | 0.1 | 0.1 |
| T3 | 0.4 | 0.5 | 0.1 | 0.2 | 0.2 |
| Total | 0.34 | 0.2 | 0.22 | 0.15 | |
| Rank of strategies | 1 | 3 | 2 | 4 | |
© 2018 by the authors. Licensee MDPI, Basel, Switzerland. This article is an open access article distributed under the terms and conditions of the Creative Commons Attribution (CC BY) license (http://creativecommons.org/licenses/by/4.0/).
Share and Cite
MDPI and ACS Style
Abdel-Basset, M.; Mohamed, M.; Smarandache, F. An Extension of Neutrosophic AHP–SWOT Analysis for Strategic Planning and Decision-Making. Symmetry 2018, 10, 116. https://doi.org/10.3390/sym10040116
AMA Style
Abdel-Basset M, Mohamed M, Smarandache F. An Extension of Neutrosophic AHP–SWOT Analysis for Strategic Planning and Decision-Making. Symmetry. 2018; 10(4):116. https://doi.org/10.3390/sym10040116
Chicago/Turabian StyleAbdel-Basset, Mohamed, Mai Mohamed, and Florentin Smarandache. 2018. "An Extension of Neutrosophic AHP–SWOT Analysis for Strategic Planning and Decision-Making" Symmetry 10, no. 4: 116. https://doi.org/10.3390/sym10040116
Note that from the first issue of 2016, this journal uses article numbers instead of page numbers. See further details here.