Oversampling Techniques for Bankruptcy Prediction: Novel Features from a Transaction Dataset


Digital Contents Research Institute, Sejong University, Seoul 143-747, Korea
*
Author to whom correspondence should be addressed.
Symmetry 2018, 10(4), 79; https://doi.org/10.3390/sym10040079
Submission received: 27 February 2018
/
Revised: 20 March 2018
/
Accepted: 21 March 2018
/
Published: 22 March 2018
(This article belongs to the Special Issue Novel Machine Learning Approaches for Intelligent Big Data)
Abstract
:In recent years, weakened by the fall of economic growth, many enterprises fell into the crisis caused by financial difficulties. Bankruptcy prediction, a machine learning model, is a great utility for financial institutions, fund managers, lenders, governments, and economic stakeholders. Due to the number of bankrupt companies compared to that of non-bankrupt companies, bankruptcy prediction faces the problem of imbalanced data. This study first presents the bankruptcy prediction framework. Then, five oversampling techniques are used to deal with imbalance problems on the experimental dataset which were collected from Korean companies in two years from 2016 to 2017. Experimental results show that using oversampling techniques to balance the dataset in the training stage can enhance the performance of the bankruptcy prediction. The best overall Area Under the Curve (AUC) of this framework can reach 84.2%. Next, the study extracts more features by combining the financial dataset with transaction dataset to increase the performance for bankruptcy prediction and achieves 84.4% AUC.
1. Introduction
Nowadays, when a very large amount of data is being generated every day, data mining to create knowledge to use in intelligent systems becomes dramatically important. Data mining includes several common tasks, such as association rule learning [1,2,3,4,5,6], classification [7], and clustering [8,9,10]. Classification [11,12,13,14,15,16] has received significant attention from the research and development community. In machine learning, classification, a supervised learning, is the problem of identifying the class that a new observation belongs to, based on a training set of data containing observations. Classification has attracted a great deal of research attention with many practical applications in various domains.
In real-world datasets, class distribution is commonly imbalanced. For instance, in binary classification, the minority class contains a small number of data samples, and the majority class contains a very large number of data samples. Consider a dataset where 95% of the data samples belong to the majority class, and only 5% belongs to the minority class: a classifier may achieve the accuracy up to 95% just by predicting that all data samples belonging to the majority class. In this case, it is a not good classification model. The class imbalance problem has been encountered in various domains, such as chemical and biomedical engineering, business management, information technology, energy management, etc. In chemical and biomedical engineering, protein detection [17], and disease diagnoses [18] are the most common topics related to imbalanced data. In business management, bankruptcy prediction [19,20,21,22] and fraud detection [11,23] are two very attractive topics. Bankruptcy prediction is a model to forecast the fate of firms and has a great utility for all economic stakeholders. Fraud detection includes several sub-problems, such as e-payment fraud, credit and plastic card fraud [23], and loan default prediction [11]. For details, Abeysinghe et al. [11] in 2016 presented the dataset which contains 30,000 loan records collected from an online P2P system. Each record has 225 features about the lender’s personal information, network behavior information, and social network information. In this dataset, 27,802 cases repay money on time while 2198 cases cannot. In information technology, software defect detection [24] and network intrusion detection [25] are implemented under imbalanced scenarios. In [25], the author introduced the ISCX IDS dataset collected from the Information Security Centre of Excellence of the University of New Brunswick. To obtain this dataset, the authors captured seven days of network traffic. Most of the flows are normal traffic, while small malicious activities were found. In energy management, several problems, such as planning [26], and the operation of energy production and energy consumption units are related to imbalanced data.
In machine learning, bankruptcy prediction [20,27] is considered as a binary classification model, in which the numbers of bankrupt firms are usually much smaller than those of non-bankrupt firms. For imbalanced data, most learning algorithms are not able to induce meaningful classifiers. One of the reason is that learning algorithms tend to focus on majority classes to maximize classification accuracy and ignore the minority classes. Therefore, many approaches have been proposed to overcome the problem of class imbalance [12] in which the most commonly used technique is sampling methods [11,28,29,30,31], which are utilized to achieve a balanced class distribution from imbalanced datasets. Sampling methods can be divided into two groups: undersampling and oversampling techniques. The undersampling techniques remove several data points in the majority class, while the oversampling methods generate the synthetic data points belonging to the minority class for obtaining a desirable balancing ratio. Several undersampling, followed by oversampling, approaches [28] are also introduced to achieve better performance.
This study utilizes several oversampling techniques to forecast bankruptcy for a Korean case study. The main contributions of this study are as follows: (i) the bankruptcy prediction framework to predict the company bankruptcy; (ii) the Korean dataset in the last two years was collected for use in the bankruptcy prediction framework; (iii) the first experiment was conducted to compare the performance of oversampling techniques to forecast bankruptcy on the Korean dataset; and (iv) to enhance the performance, we combined the financial dataset and transaction dataset in the second experiment. Experimental results show that the best overall AUC of this framework can reach 84.2%. Additionally, combining the financial dataset and transaction dataset can help to increase the performance of bankruptcy prediction.
The remainder of the paper is organized as follows: Section 2 presents several related works on bankruptcy prediction; then, the preliminaries, including the problem of imbalanced data, oversampling techniques, and performance measures in imbalanced data, were summarized in Section 3; in Section 4, we present the research design of two experiments; experimental results are presented in Section 5; and, finally, Section 6 gives the conclusion as well as offers some future research issues.
2. Related Works
In 2015, Kim et al. [20] proposed a geometric mean (GM)-based boosting algorithm, named GMBoost, to solve the problem of imbalanced data and bankruptcy prediction. GMBoost uses the GM of both classes in error rate and accurate calculations to enable learning with consideration of both majority and minority classes. This method was verified by a dataset collected from a Korean commercial bank. This dataset includes 500 bankrupt companies during the year 2002 to the year 2005 and 2500 non-bankrupt companies during 2002–2005 with 30 financial ratios, including debt coverage, leverage, profitability, capital structure, activity, liquidity, size, etc.
Later, Kim et al. [27] proposed the cluster-based evolutionary undersampling (CBEUS) method to address the problem of imbalanced data as well as bankruptcy prediction. The first step of CBEUS is to cluster the non-bankruptcy companies into several clusters using k-means clustering. Next, the Euclidean distance between an instance and its centroid was computed. The thresholds that represent the distance from the centroid of each cluster using Genetic Algorithms (GA) were determined in the second step. This approach was successfully applied to a dataset for bankruptcy prediction which has 106 financial indicators of 22,500 externally non-audited small- and medium-sized Korean manufacturing firms from 2002 to 2007. In which, 1350 firms filed for bankruptcy and the 21,150 firms filed for non-bankruptcy.
In 2016, a novel approach for bankruptcy prediction that mainly applies eXtreme Gradient Boosting (XGB) for learning an ensemble of decision trees was proposed in [32]. XGB is the boosting method which is modified to optimize a Taylor expansion of the loss functions to archive a good performance for all kinds of data. In addition, the authors introduced a new concept, named synthetic features, which are generated by random selection of two existing features and random selection of the arithmetical operation. This approach was evaluated by the financial condition of Polish companies from 2007 to 2013 (bankruptcy companies) and from 2000 to 2012 for (still-operating companies) with 64 financial indicators.
Next, Zelenkov et al. [22] proposed a two-step classification method for bankruptcy prediction. In the first stage, training of individual classifiers and the selection of an adequate feature set is made for each of classifier. In the second stage, the voting ensemble with a majority voting rule is implemented from the set of the trained classifiers in the first stage. This method was the demonstration on a balanced dataset which consists of 912 observations (456 bankrupts and 456 successful companies) of Russian firms. Each firm has 55 features on liquidity, financial stability, turnover, and profitability.
Then, Wang et al. [21] proposed a new kernel extreme learning machine (KELM) model that uses a novel swarm intelligence algorithm, namely grey wolf optimization (GWO), GWO-KELM model, for tuning parameters. The authors used two balanced datasets, the Wieslaw dataset [33] and Japanese dataset (JPNBDS), to evaluate the effectiveness of GWO-KELM for bankruptcy forecasting. The Wieslaw dataset has 240 real companies including 112 bankrupt companies and 128 non-bankrupt companies with 30 financial ratios. JPNBDS collected from 1995 to 2009 has 76 non-bankrupt and 76 bankrupt firms with only 10 financial ratios for each company.
Next, a KELM (kernel extreme learning machine)-based bankruptcy prediction model was introduced by Zhao et al. in [34]. In this method, a two-step grid search strategy that combines the coarse search with the fine search has been implemented to optimize the parameters of the proposed model. The Wieslaw dataset [33] was utilized in the experiments of this study to evaluate the proposed model, as well as five existing models, including Support Vector Machine (SVM), Extreme Learning Machine, Random Forest, Particle Swarm Optimization Enhanced Fuzzy k-Nearest Neighbor (PSOFKNN), and Logit models.
Latest, as an overview article, Barboza et al. [19] implemented and tested several classification models, including SVM with linear and radial basis function (RBF) kernels, artificial neural networks (ANN), logistic regression, boosting, Random Forest, as well as bagging, to predict bankruptcy. The author used a balanced data for training which has 449 bankruptcy firms and 449 non-bankruptcy firms covering 1985 to 2005. The validation is an imbalanced dataset covering 2006 to 2013 which have 133 bankruptcy firms and 13,300 non-bankruptcy firms. However, in most of studies, the authors only use the dataset in the same period for training and validation stages. It would be meaningless if we used the data for training and validation stages in the same period. In reality, data from previous and current years will be used to train and predict bankruptcy in following years. Additionally, it would be impractical when several studies use balanced datasets to predict bankruptcy.
3. Preliminaries
In this section, we first present the notation and imbalanced data problem in binary classification. Then, we summary several common oversampling techniques for handling the imbalanced data including the synthetic minority oversampling technique (SMOTE) [29], borderline-SMOTE [30], Adaptive Synthetic Sampling (ADASYN) [31], the integrations of SMOTE with the Edited Nearest Neighbor (SMOTE + ENN) [28] and the integrations of SMOTE with Tomek links (SMOTE + Tomek) [28]. Finally, the most popular measure for the imbalanced domain, ROC curve, will be summarized.
3.1. Imbalanced Data Problem in Binary Classification
Let χ be an imbalanced dataset in the binary classification. The dataset contains the minority and majority class denoted by and respectively. The balancing ratio () of χ is determined as:
where denotes the number element of a set.
To clearly understand this problem, Kang and Cho [35] created six datasets, which had different balancing ratios (1:1, 1:3, 1:5, 1:10, 1:30, and 1:50), to show the effects of balancing ratios on classification performance of the SVM algorithm. The experimental results in this paper showed that the accuracy of the minority class decreased rapidly when the balancing ratios decreased. The main reason was the effect of the performance of the majority class on simple accuracy was much greater than the minority class when the balancing ratios was low.
For handling the imbalanced data problem, the most commonly used technique is sampling techniques which is to resample the dataset χ into new dataset such that . Sampling techniques will be summarized in Section 3.2. To evaluate models in imbalanced data, the receiver operating characteristic (ROC) curve was proposed to overcome the above problems of accuracy, which will be surveyed in Section 3.3.
3.2. Oversampling Techniques
3.2.1. Synthetic Minority Oversampling Technique
The SMOTE algorithm generates synthetic data points based on the feature space similarities between the real minority examples. SMOTE will consider k-nearest neighbors (denoted by ) based on the Euclidian distance for each example xi ∈ where k is the given input. Figure 1A shows the four nearest neighbors of xi. To create a synthetic sample for xi, this algorithm randomly selects an element i in and i in (Figure 1A). The feature vector of the new data point is the sum of the feature vectors of xi and the value, which can be obtained by multiplying the vector difference between xi and i with a random number δ (∈[0, 1]), as following formula:
where i is an element in : i∈ . According to Equation (2), the synthetic sample is a point along the line segment joining xi and the randomly-selected i ∈ . Figure 1B shows an example of the SMOTE. The new sample xnew is in the line between xi and i.
3.2.2. Adaptive Synthetic Sampling
SMOTE generates the same number of synthetic data instances for each ∈ . It leads to the classification model cannot archive the good performance. To overcome this limitation, ADASYN, which uses a systematic method to adaptively create different amounts of synthetic data based on their distributions, was proposed. ADASYN firstly determines the number of generated synthetic data examples for whole dataset by the following formula:
where β ∈ [0, 1] is a given parameter indicate the balance level after balance data by ADASYN, || is the number of data instances belonging to the majority class and || is the number of data samples of the minority class. Next, ADASYN finds k-nearest neighbors (in the same way with SMOTE algorithm) and calculates the ratio denoted by for each example ∈ :
where is the number of samples in that belong to . To ensure the total value of all element is 1, the normalize according to is determined as:
so that = 1. Then, the number of generated synthetic data samples for each ∈ was determined as:
Finally, ADASYN generates synthetic data samples for each ∈ using Equation (2). The main idea of ADASYN is to use a density distribution to determine the number of generated synthetic samples for each minority example . In other words, ADASYN will generate much synthetic data for the data points near the border and a small amount of synthetic data for the rest.
3.2.3. Borderline-SMOTE
Borderline-SMOTE is another method to overcome the limitation of SMOTE. This algorithm also found k-nearest neighbors for each example ∈ . Then it selects that has satisfies:
where is the number of samples in that belong to . This set of satisfying this condition is called by DANGER which is then passed to the SMOTE to generate synthetic data instances by using Equation (2). The main difference between SMOTE and Borderline-SMOTE is that SMOTE generates synthetic data samples for all examples ∈ while Borderline-SMOTE only generates synthetic data samples for those examples in DANGER (the examples near the border of two classes).
3.2.4. Oversampling Followed by Data Cleaning Techniques
Given a pair (xi, xj) where xi ∈ and xj ∈ . Let d(., .) be the Euclidean distance between two data points. The pair (xi, xj) is called a Tomek link [28] if and only if there is no sample xk such that d(xi, xk) < d(xi, xj) or d(xj, xk) < d(xi, xj). If two samples xi and xj are in a Tomek link, either one of these samples is noise or both samples are near a border. Using the Tomek link definition to clean unwanted overlapping between classes after the oversampling step, it can provide the well-defined classification rules for improving classification performance. The integration of SMOTE with Tomek links (SMOTE + Tomek) [28] uses SMOTE for the oversampling step to balance the dataset then uses Tomek links to remove overlapping samples to enhance the performance of classification.
Another approach to clean unwanted overlapping between classes is he neighborhood cleaning rule [12] based on the edited nearest neighbor (ENN), which removes samples that differ from two samples in the three nearest neighbors. Like SMOTE + Tomek, SMOTE + ENN [28] also uses SMOTE for the oversampling step, then uses ENN to remove the overlapping examples.
3.3. ROC Curve
Considering a binary classification, a representation of classification performance can be shown by a confusion matrix (see Figure 2). Two evaluation metrics, true positives rate (TPR) and false positives rate (FPR), are defined as:
where TP, FN, FP, and TN are true positives, false negatives, false positives, and true negatives, respectively. The ROC curve [36] is created by plotting TPR over FPR at various threshold settings, and any point in the ROC curve corresponds to the performance of a single classifier on a given distribution (see Figure 3).
4. Research Design
4.1. Dataset
The experimental dataset was collected from a Korean financial company for the last two years. The Korean dataset contains 19 financial features for each company. This dataset consists of 307 bankrupted companies and 120,048 normal companies with a balancing ratio of 0.0026. This ratio is quite small for the normal classifier to predict bankruptcy correctly. From the financial statements, each company has 19 financial features (ratios) which have frequently been applied in the previous corporate bankruptcy prediction studies, such as assets, liabilities, capital, profit, etc. These ratios are shown and described in Table 1. For consistency purposes with these ratios, we standardized these ratios by removing the mean and scaling to unit variance to create new vectors x’ by Equation (9) for the whole dataset and we use this dataset to perform the experiment:
where x is the original feature vector, is the mean of that feature vector, and is its standard deviation.
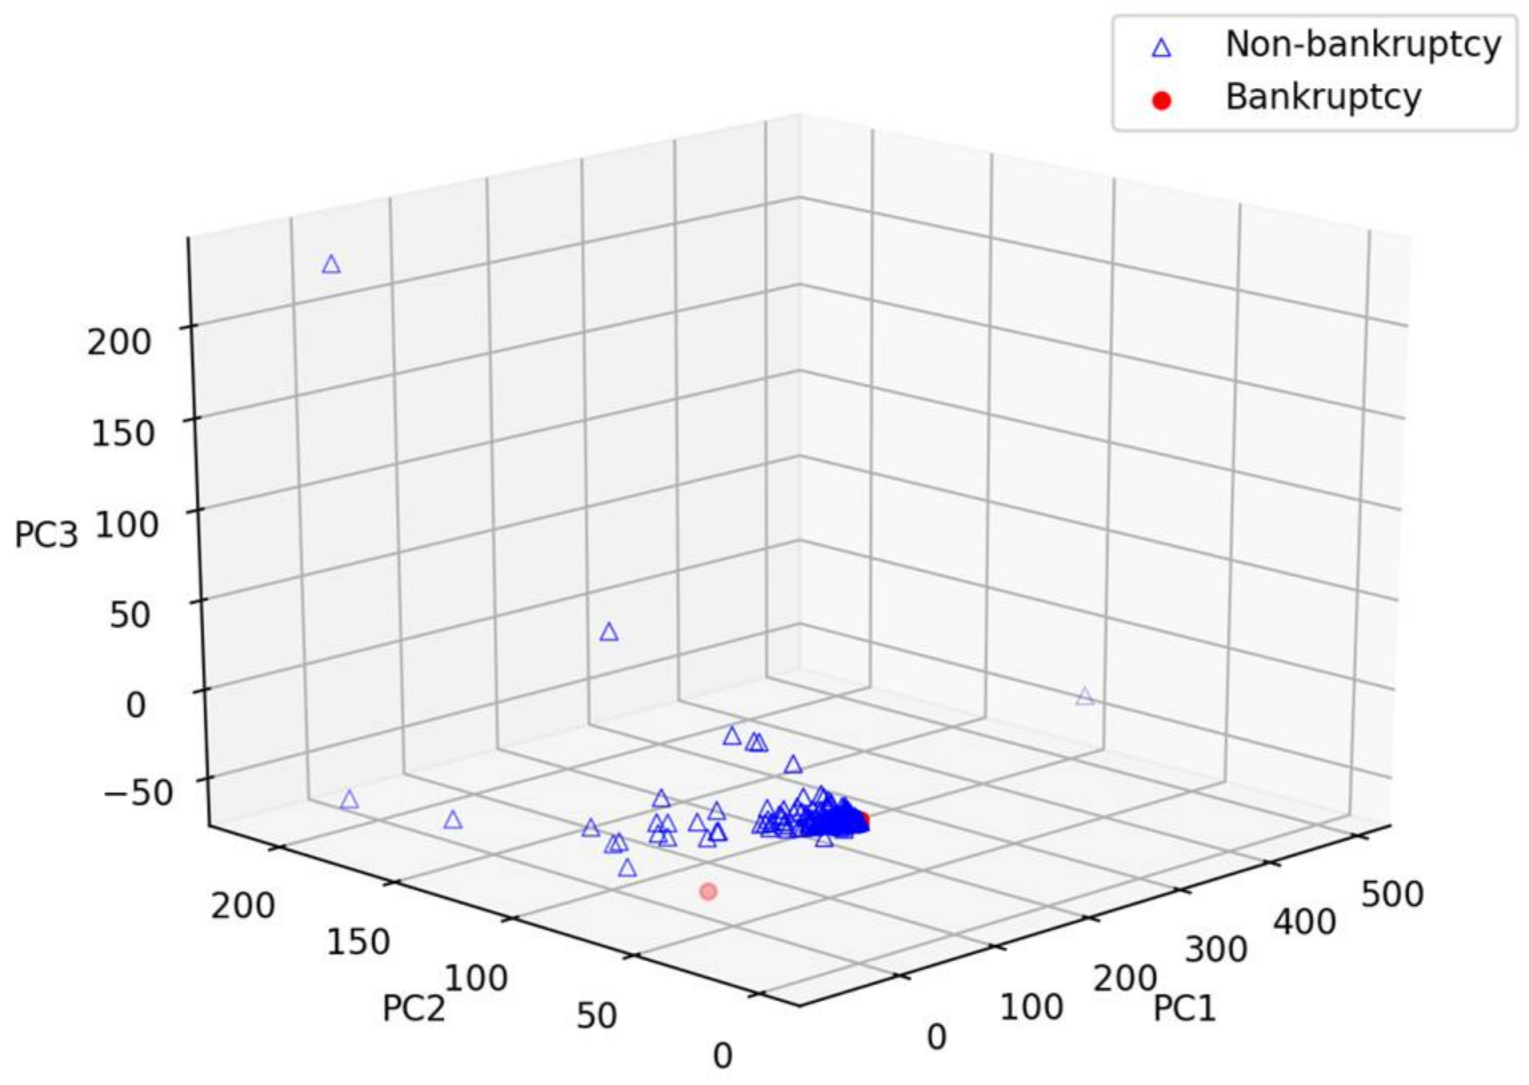
To understand datasets, we apply the principal component analysis (PCA) to visualize these datasets in three-dimensional space. Figure 4 show the three-dimensional space of the Korean dataset using PCA to reduce 19 features to three components, including PC1, PC2, and PC3 in Figure 4. We easily recognize that bankrupt companies were rushed to a spot with red color on these charts. Therefore, it may be easy to classify, as well as predict bankrupt and non-bankrupt companies.
4.2. Experiment Setup
4.2.1. The Bankruptcy Prediction Framework
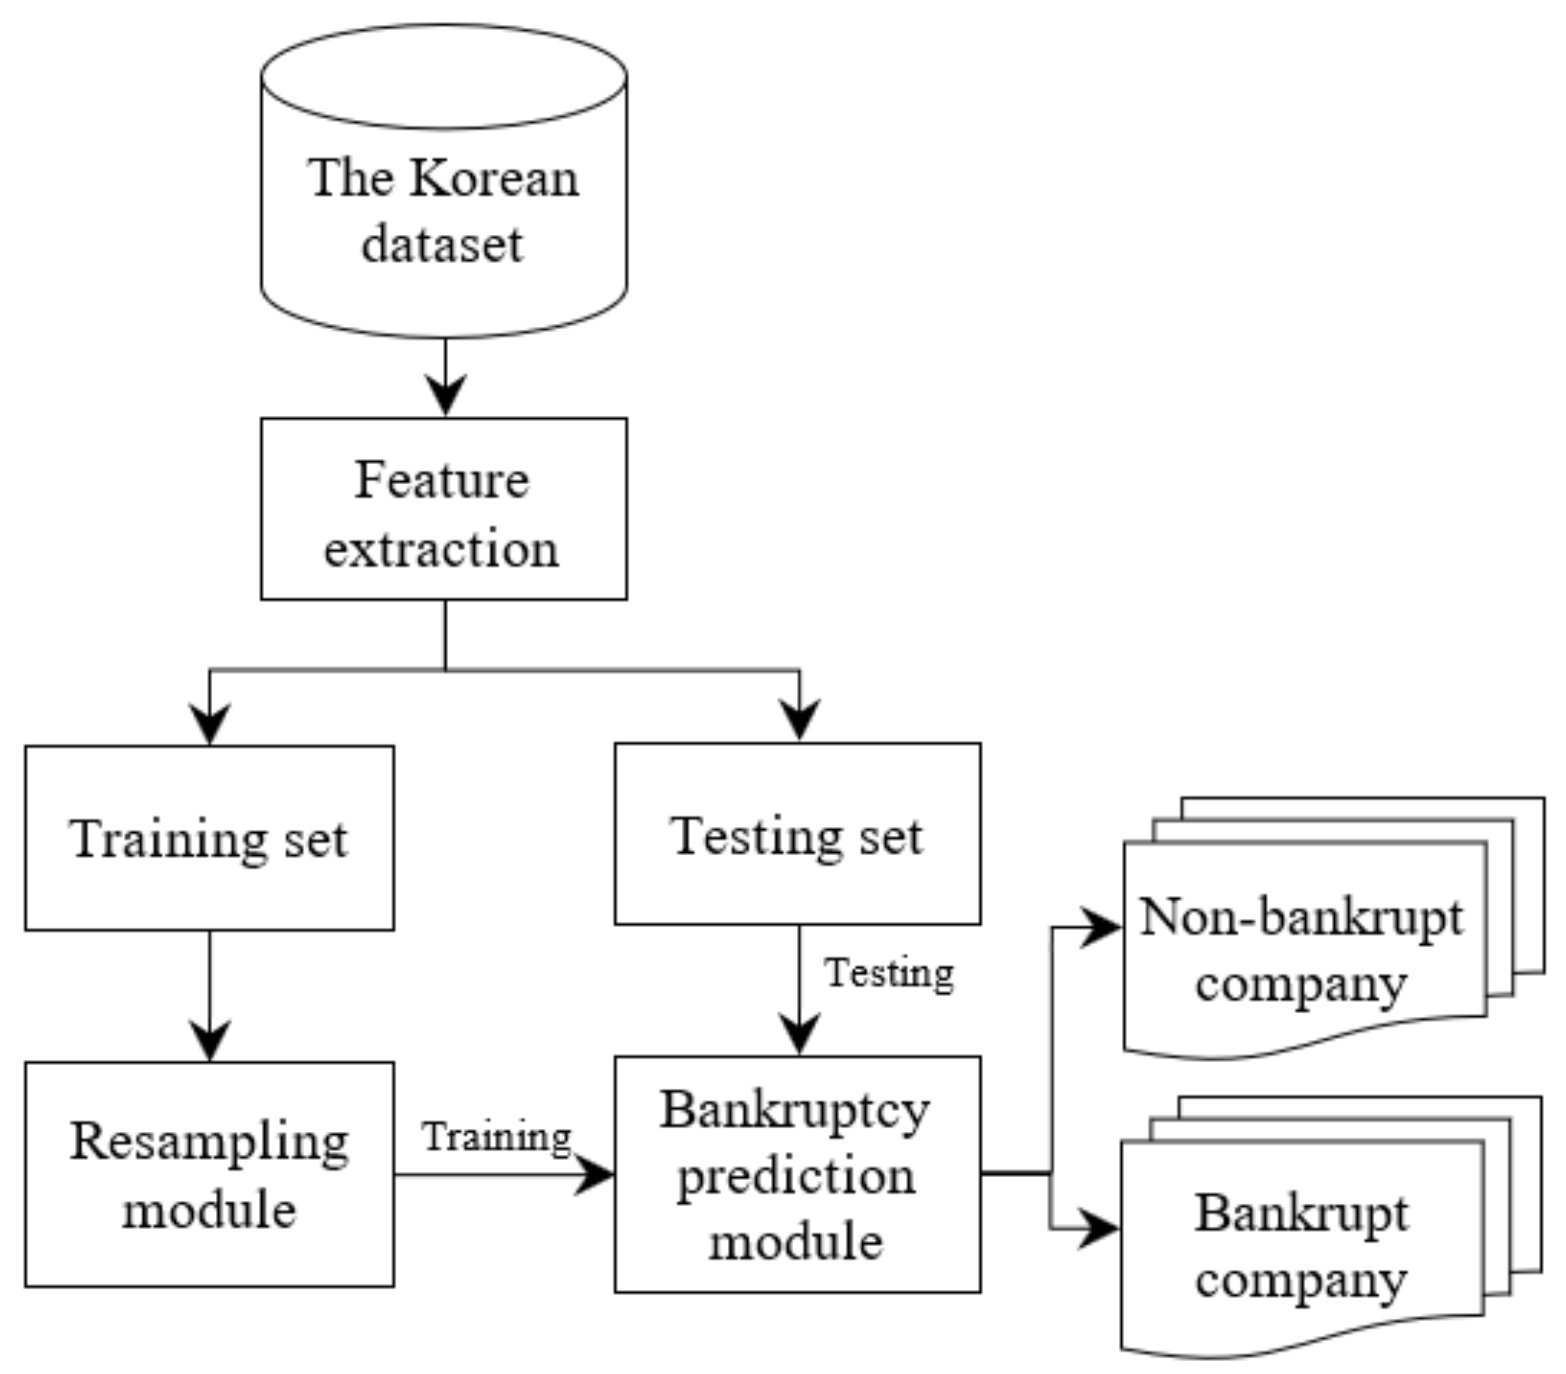
In this first experiment, we present the bankruptcy prediction framework (Figure 5). We use the five-fold cross-validation methodology to split the training and testing set. In the first case, we pass the original training dataset to the bankruptcy prediction module directly. In other words, the system does not use any oversampling technique to balance the datasets. In the second case, five oversampling techniques, including SMOTE, Borderline-SMOTE, ADASYN, SMOTE + Tomek, and SMOTE + ENN summarized in the previous section were used in the resampling module alternately. In the bankruptcy prediction module, we use four classification models including Random Forest, Decision Tree, Multi-Layer Perceptron, and SVM to predict bankruptcy. The purpose of this experiment is to show the effectiveness of oversampling for the bankruptcy prediction task.
4.2.2. Novel Features from Transaction Dataset
To increase the performance of bankruptcy prediction for Korean case study, we have collected the transaction dataset which consists of all outcome transactions of each company in the original dataset in the same period with the financial statements. From the transaction dataset, we first identify the largest partner (P) for each company (C) in the original Korean dataset which has the largest amount of money in transaction with company C. Then, 19 features from company P will be merged with 19 original features of company C to create the 38 features which will be used as features of company C. The 38 features dataset will be denoted as the Korean mixed dataset. The above steps are shown in Algorithm 1.
| Algorithm 1. A novel algorithm for feature extraction. |
 |
For example, company A has transactions with companies B, C, and D in the transaction dataset. In the same period of the financial dataset, companies B, C, and D have transactions with A for a total of 100, 500, and 800 USD, respectively, which were determined by Line 3 in Algorithm 1. Then, only company D was selected in Line 4. Finally, features of company D will be appended to the features of company A at Line 5 of Algorithm 1.
In this experiment, only the best oversampling technique and classifier model for bankruptcy prediction in the first experiment (SMOTE + ENN and Random Forest classifier) was selected to use in the bankruptcy prediction framework. The five-fold cross-validation methodology was used to report the AUC values for both Korean and Korean mixed datasets.
5. Experimental Results
The framework was implemented in Python 2.7 and performed on a standard PC (8 GB DDR3L RAM, 40 GB of flash storage, 3.40 GHz × 2 cores Intel Core i7-2600 processor, and Ubuntu 16.04 LTS as an operating system).
To achieve the best performance for each classifier, we perform the framework in several times to choose the best parameter for each one. In the oversampling module, all the techniques, including SMOTE, Borderline-SMOTE, ADASYN, SMOTE + Tomek, as well as SMOTE + ENN are in the imbalanced-learn python package [37]. All of the above sampling techniques have k_neighbors = 7 and ratio = ‘auto’. In the bankruptcy prediction module, we used the rectified linear unit (ReLU) as the activation function, learning_rate = 0.01, and other parameters are default parameters for the Multi-Layer Perceptron classifier. For the SVM classifier, we use the Support Vector classification (SVC) with probability = True and other default parameters. For the Decision Tree classifier, we set max_depth to 4. Finally, we set max_depth to 4, and n_estimators to 20 for the Random Forest classifier.
5.1. Results of Bankruptcy Prediction
This section shows the performance of the bankruptcy prediction framework with various oversampling techniques and classifiers in Table 2. Note that for each value of the AUC, this model was run in five-fold cross-validation and report average value six times with standard deviation. From these results shown in Table 2, multi-layer perceptron and SVM does not have a good performance (most of AUCs are not over 70%) whether in combination with any oversampling technique. Meanwhile, without oversampling techniques, Random Forest is the best classifier for bankruptcy prediction with 82.4% in AUC while Decision Tree is only 76.2% AUC. Using various oversampling techniques, the performance of this framework will be increased with different values. For example, SMOTE can help Random Forest increase 1.7% to reach 84.1% AUC. Similarly, Borderline-SMOTE, ADASYN, SMOTE + Tomek, and SMOTE + ENN help the Random Forest increase 0.7%, 0.7%, 1.7%, and 1.8% AUC respectively. Therefore, SMOTE + ENN and Random Forest is the best oversampling technique and classifier model for the bankruptcy prediction framework, which yields at 84.2% AUC for the original Korean dataset.
5.2. Result of Bankruptcy Prediction with Mixed Dataset
This section shows the performance of the bankruptcy prediction with SMOTE + ENN for the resampling module and Random Forest for the bankruptcy prediction module for both the Korean dataset and the Korean mixed dataset in five-fold validation, six times (see Table 3). The average AUC of this model for the Korean dataset is 84.2% while that of this model for the Korean mixed dataset is 84.4%. Therefore, using the financial dataset with transaction dataset helps the bankruptcy prediction framework archives the better performance than using the original financial dataset.
In order to verify the effectiveness of the bankruptcy prediction framework for the Korean mixed dataset compared with those for the Korean dataset, the paired t-test was used to compare the two population means two lists’ of performances. We ran this framework for the Korean dataset and the Korean mixed dataset in 30 batches (each batch was run six times and the average AUC value was obtained) and achieved a p-value = 0.0062 for two sets of performance. Assuming the significance level usually equal 0.05, we can reject all stated null median difference hypotheses. Therefore, using the Korean mixed dataset for the above bankruptcy prediction framework is better than using the Korean dataset for this framework. In other words, features from transaction dataset can improve the performance of the bankruptcy prediction framework.
Due to the number of features of the Korean mixed dataset larger than that of the Korean dataset, the training time of the bankruptcy prediction framework for the Korean mixed dataset (Case A) is larger than that of the bankruptcy prediction framework for the Korean mixed dataset (Case B). Details, Case A requires 47.9 s while Case B requires 46.5 s in average for both oversampling and training steps of each fold. The time gap between Case A and Case B is negligible. In addition, we can save the trained model to a file and then load the trained model to predict many times.
6. Conclusions
This study utilizes several oversampling techniques to deal with imbalance problems on the financial dataset collected from Korean companies from 2016 to 2017. Experimental results show that oversampling techniques can improve the performance of the bankruptcy prediction framework, in which SMOTE + ENN for the resampling module and Random Forest for the bankruptcy prediction module achieved the best AUC, which yields 84.2% in AUC for this framework. Next, the study combines the financial dataset with transaction dataset in the same period to extract more features from largest partner. These features will be added to original dataset to improve the performance of bankruptcy prediction. The best overall AUC of this framework can reach 84.4% AUC for the Korean mixed dataset.
For future works, several following related issues will be studied. We first study to improve performance for this task by using other techniques for imbalanced data problem. Second, an online classifier will be studied to reuse of previous results.
Acknowledgments
This work was supported by Institute for Information and Communications Technology Promotion (IITP) grant funded by the Korea government (MSIP) (No. 2017-0-00506, Building improved classifier on imbalanced financial/business transaction data to predict company bankruptcy).
Author Contributions
Sung Wook Baik proposed the topic and corrected the design; Tuong Le and Jun Ryeol Park implemented the framework; and Tuong Le wrote the paper. Mi Young Lee and Sung Wook Baik improved the quality of the manuscript.
Conflicts of Interest
The authors declare no conflicts of interest.
References
- Kieu, T.; Vo, B.; Le, T.; Deng, Z.H.; Le, B. Mining top-k co-occurrence items with sequential pattern. Expert Syst. Appl. 2017, 85, 123–133. [Google Scholar] [CrossRef]
- Le, T.; Vo, B.; Baik, S.W. Efficient algorithms for mining top-rank-k erasable patterns using pruning strategies and the subsume concept. Eng. Appl. Artif. Intell. 2018, 68, 1–9. [Google Scholar] [CrossRef]
- Le, T.; Vo, B. The lattice-based approaches for mining association rules: A review. WIREs Data Min. Knowl. Discov. 2016, 6, 140–151. [Google Scholar] [CrossRef]
- Vo, B.; Le, T.; Nguyen, G.; Hong, T.P. Efficient algorithms for mining erasable closed patterns from product datasets. IEEE Access 2017, 5, 3111–3120. [Google Scholar] [CrossRef]
- Vo, B.; Le, T.; Pedrycz, W.; Nguyen, G.; Baik, S.W. Mining erasable itemsets with subset and superset itemset constraints. Expert Syst. Appl. 2017, 69, 50–61. [Google Scholar] [CrossRef]
- Vo, B.; Pham, S.; Le, T.; Deng, Z.H. A novel approach for mining maximal frequent patterns. Expert Syst. Appl. 2017, 73, 178–186. [Google Scholar] [CrossRef]
- Pham, H.P.; Le, H.S. Linguistic Vector Similarity Measures and Applications to Linguistic Information Classification. Int. J. Intell. Syst. 2017, 32, 67–81. [Google Scholar]
- Nguyen, D.T.; Ali, M.; Le, H.S. A Novel Clustering Algorithm in a Neutrosophic Recommender System for Medical Diagnosis. Cogn. Comput. 2017, 9, 526–544. [Google Scholar]
- Le, H.S.; Pham, H.T. Some novel hybrid forecast methods based on picture fuzzy clustering for weather nowcasting from satellite image sequences. Appl. Intell. 2017, 46, 1–15. [Google Scholar]
- Dang, T.H.; Le, H.S.; Le, V.T. Novel fuzzy clustering scheme for 3D wireless sensor networks. Appl. Soft Comput. 2017, 54, 141–149. [Google Scholar]
- Abeysinghe, C.; Li, J.; He, J. A Classifier Hub for Imbalanced Financial Data. In Proceedings of the Australasian Database Conference, Sydney, Australia, 28–29 September 2016; pp. 476–479. [Google Scholar]
- Laurikkala, J. Improving Identification of Difficult Small Classes by Balancing Class Distribution. In Proceedings of the Conference on AI in Medicine in Europe: Artificial Intelligence Medicine, Cascais, Portugal, 1–4 July 2001; pp. 63–66. [Google Scholar]
- Li, Y.; Zhang, S.; Yin, Y.; Xiao, W.; Zhang, J. A Novel Online Sequential Extreme Learning Machine for Gas Utilization Ratio Prediction in Blast Furnaces. Sensors 2017, 17, 1847. [Google Scholar] [CrossRef] [PubMed]
- Pedregosa, F.; Varoquaux, G.; Gramfort, A.; Michel, V.; Thirion, B.; Grisel, O.; Blondel, M.; Prettenhofer, P.; Weiss, R.; Dubourg, V.; et al. Scikit-learn: Machine Learning in Python. J. Mach. Learn. Res. 2011, 12, 2825–2830. [Google Scholar]
- Siegel, J.; Bhattacharyya, R.; Kumar, S.; Sarma, S.E. Air filter particulate loading detection using smartphone audio and optimized ensemble classification. Eng. Appl. Artif. Intell. 2017, 66, 104–112. [Google Scholar] [CrossRef]
- Wei, L.; Xiong, X.; Zhang, W.; He, X.Z.; Zhang, Y. The effect of genetic algorithm learning with a classifier system in limit order markets. Eng. Appl. Artif. Intell. 2017, 65, 436–448. [Google Scholar] [CrossRef]
- Bao, F.; Deng, Y.; Dai, Q. ACID: Association correction for imbalanced data in GWAS. IEEE/ACM Trans. Comput. Biol. Bioinform. 2018, 15, 316–322. [Google Scholar] [CrossRef] [PubMed]
- Wilk, S.; Stefanowski, J.; Wojciechowski, S.; Farion, K.J.; Michalowski, W. Application of Preprocessing Methods to Imbalanced Clinical Data: An Experimental Study. Inf. Technol. Med. 2016, 471, 503–515. [Google Scholar]
- Barboza, F.; Kimura, H.; Altman, E. Machine learning models and bankruptcy prediction. Expert Syst. Appl. 2017, 83, 405–417. [Google Scholar] [CrossRef]
- Kim, M.J.; Kang, D.K.; Kim, H.B. Geometric mean based boosting algorithm with over-sampling to resolve data imbalance problem for bankruptcy prediction. Expert Syst. Appl. 2015, 42, 1074–1082. [Google Scholar] [CrossRef]
- Wang, M.; Chen, H.; Li, H.; Cai, Z.N.; Zhao, X.; Tong, C.; Li, J.; Xu, X. Grey wolf optimization evolving kernel extreme learning machine: Application to bankruptcy prediction. Eng. Appl. Artif. Intell. 2017, 63, 54–68. [Google Scholar] [CrossRef]
- Zelenkov, Y.; Fedorova, E.; Chekrizov, D. Two-step classification method based on genetic algorithm for bankruptcy forecasting. Expert Syst. Appl. 2017, 88, 393–401. [Google Scholar] [CrossRef]
- Zakaryazad, A.; Duman, E. A profit-driven Artificial Neural Network (ANN) with applications to fraud detection and direct marketing. Neurocomputing 2016, 175, 121–131. [Google Scholar] [CrossRef]
- Tan, M.; Tan, L.; Dara, S.; Mayeux, C. Online defect prediction for imbalanced data. In Proceedings of the 2015 IEEE/ACM 37th IEEE International Conference on Software Engineering (ICSE), Florence, Italy, 16–24 May 2015; pp. 99–108. [Google Scholar]
- Folino, G.; Pisani, F.S.; Sabatino, P. An Incremental Ensemble Evolved by using Genetic Programming to Efficiently Detect Drifts in Cyber Security Datasets. In Proceedings of the GECCO (Companion), Denver, CO, USA, 20–24 July 2016; pp. 1103–1110. [Google Scholar]
- Li, Y.; Guo, H.; Liu, X.; Li, Y.; Li, J. Adapted ensemble classification algorithm based on multiple classifier system and feature selection for classifying multi-class imbalanced data. Knowl.-Based Syst. 2016, 94, 88–104. [Google Scholar] [CrossRef]
- Kim, H.J.; Jo, N.O.; Shin, K.S. Optimization of cluster-based evolutionary undersampling for the artificial neural networks in corporate bankruptcy prediction. Expert Syst. Appl. 2016, 59, 226–234. [Google Scholar] [CrossRef]
- Batista, G.; Prati, R.C.; Monard, M.C. A Study of the Behavior of Several Methods for Balancing Machine Learning Training Data. ACM SIGKDD Explor. Newsl. 2004, 6, 20–29. [Google Scholar] [CrossRef]
- Chawla, N.V.; Bowyer, K.W.; Hall, L.O.; Kegelmeyer, W.P. SMOTE: Synthetic Minority Over-Sampling Technique. J. Artif. Intell. Res. 2002, 16, 321–357. [Google Scholar]
- Han, H.; Wang, W.Y.; Mao, B.H. Borderline-SMOTE: A New Over-Sampling Method in Imbalanced Data Sets Learning. In Proceedings of the International Conference on Intelligent Computing, Hefei, China, 23–26 August 2005; pp. 878–887. [Google Scholar]
- He, H.; Bai, Y.; Garcia, E.A.; Li, S. ADASYN: Adaptive Synthetic Sampling Approach for Imbalanced Learning. In Proceedings of the IEEE International Joint Conference on Neural Networks (IJCNN 2008), Hong Kong, China, 1–8 June 2008; pp. 1322–1328. [Google Scholar]
- Zieba, M.; Tomczak, S.K.; Tomczak, J.M. Ensemble boosted trees with synthetic features generation in application to bankruptcy prediction. Expert Syst. Appl. 2016, 58, 93–101. [Google Scholar] [CrossRef]
- Pietruszkiewicz, W. Dynamical systems and nonlinear Kalman filtering applied in classification. In Proceedings of the 7th IEEE International Conference on Cybernetic Intelligent Systems (CIS 2008), London, UK, 9–10 September 2008. [Google Scholar]
- Zhao, D.; Huang, C.; Wei, Y.; Yu, F.; Wang, M.; Chen, H. An Effective Computational Model for Bankruptcy Prediction Using Kernel Extreme Learning Machine Approach. Comput. Econ. 2017, 49, 325–341. [Google Scholar] [CrossRef]
- Kang, P.; Cho, S. EUS SVMs: Ensemble of Under-Sampled SVMs for Data Imbalance Problems. In Proceedings of the International Conference on Neural Information Processing (ICONIP 2006), Hong Kong, China, 3–6 October 2006; pp. 837–846. [Google Scholar]
- Fawcett, T. An Introduction to ROC Analysis. Pattern Recognit. Lett. 2006, 27, 861–874. [Google Scholar] [CrossRef]
- Lemaitre, G.; Nogueira, F.; Aridas, C.K. Imbalanced-learn: A Python Toolbox to Tackle the Curse of Imbalanced Datasets in Machine Learning. J. Mach. Learn. Res. 2017, 18, 17. [Google Scholar]
Figure 1.
(A) Example of the four-nearest neighbors for the ; and (B) by SMOTE based on the Euclidean distance.
Figure 1.
(A) Example of the four-nearest neighbors for the ; and (B) by SMOTE based on the Euclidean distance.
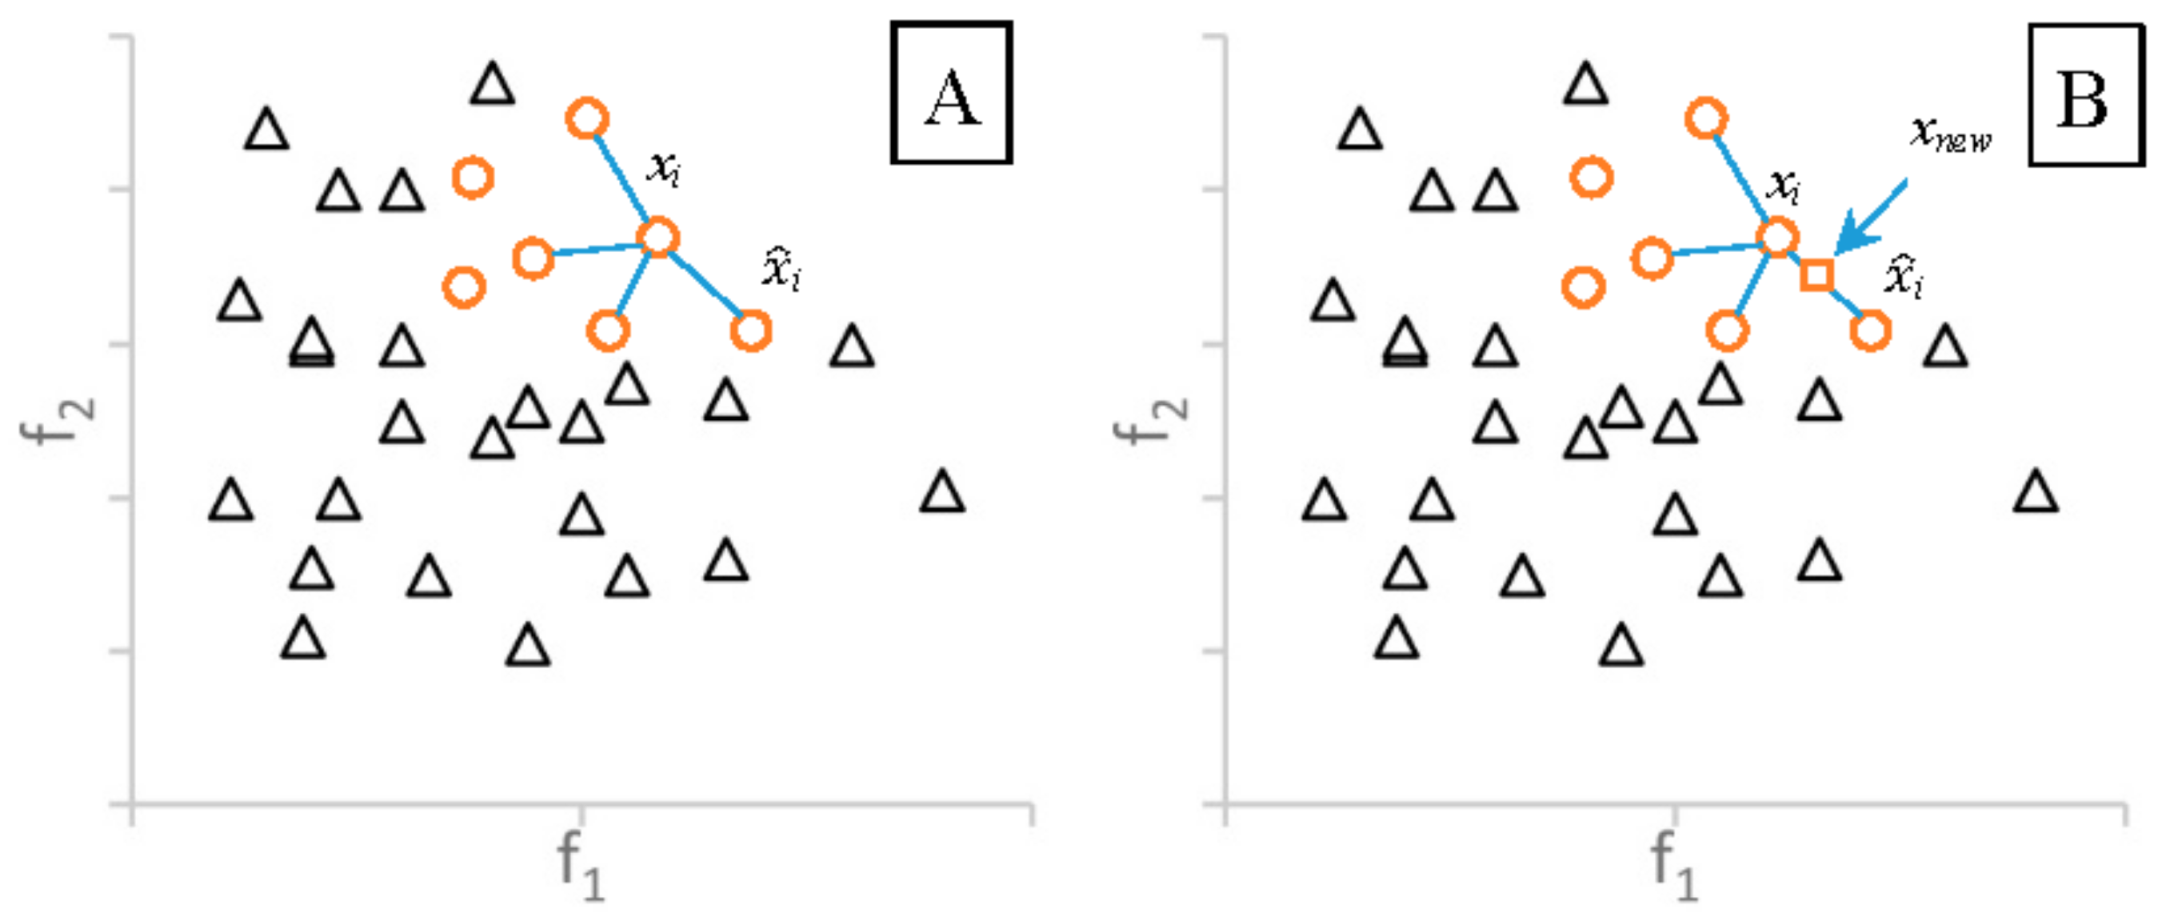
Figure 2.
Confusion matrix for performance evaluation.
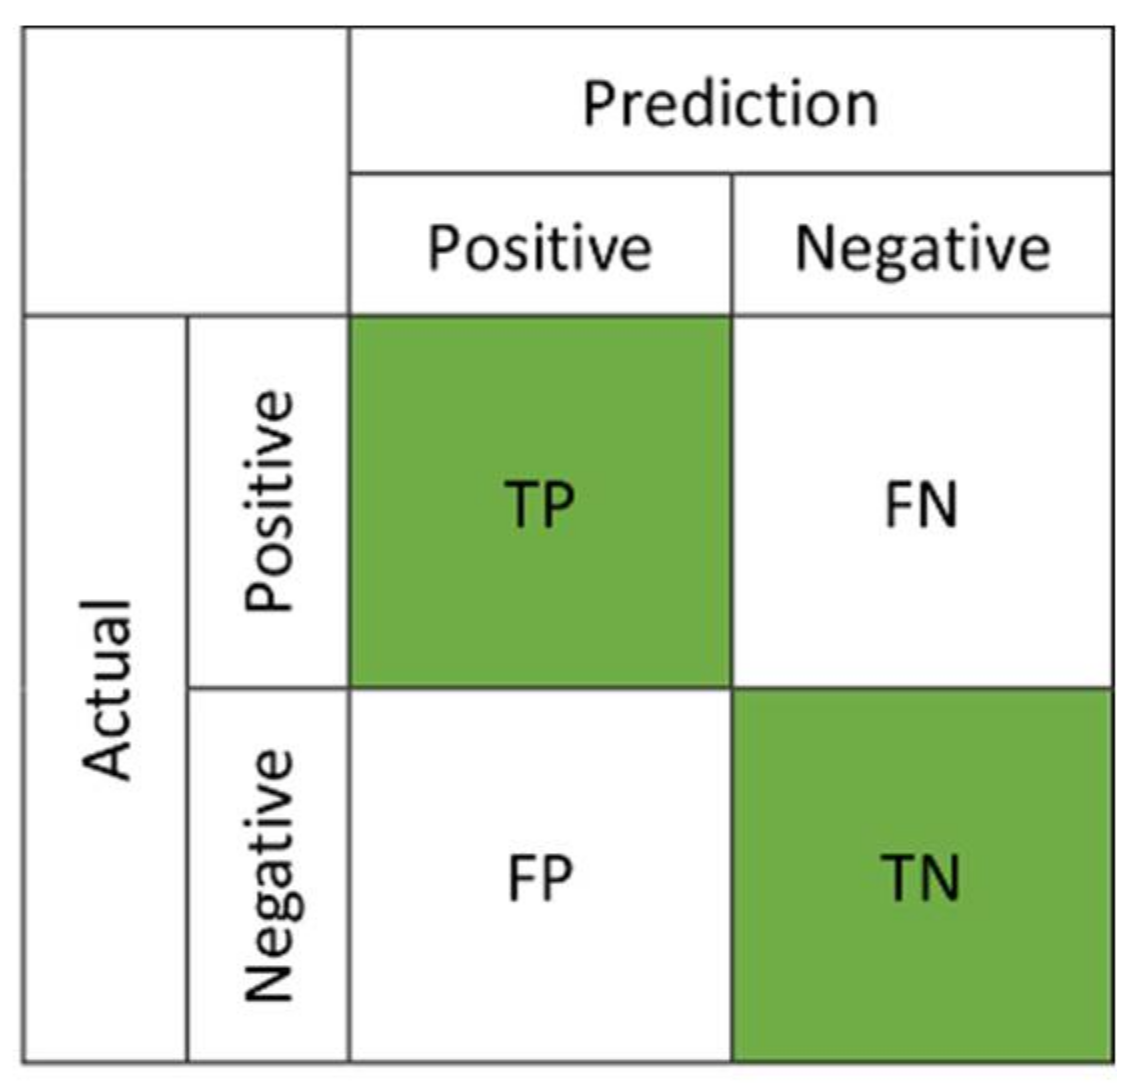
Figure 3.
ROC curve representation.
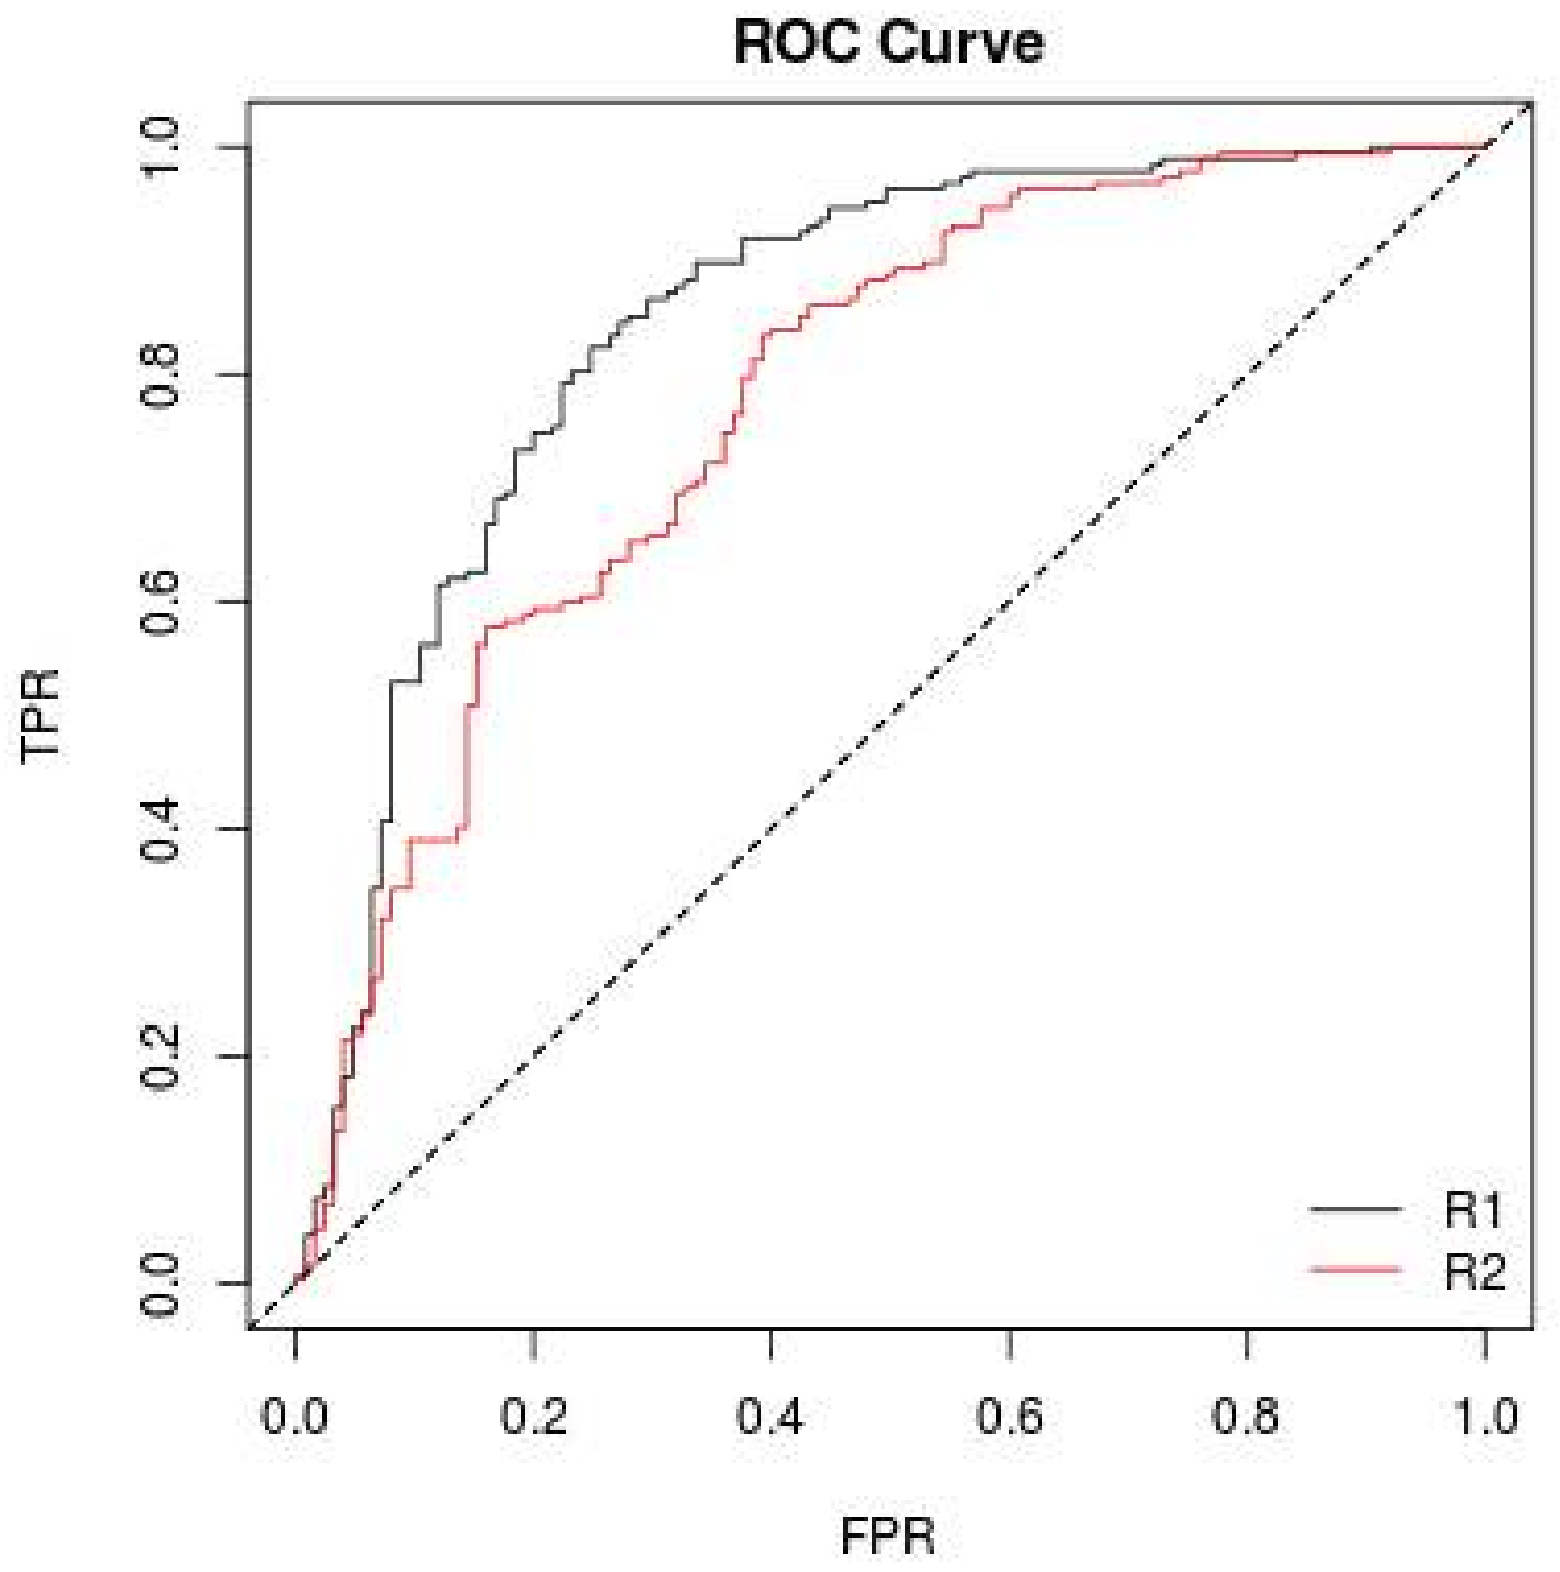
Figure 4.
Three-dimensional visualization of the Korean dataset using PCA.

Figure 5.
The bankruptcy prediction framework.

Table 1.
The set of features extracted from financial statements.
| ID | Description |
|---|---|
| F1 | Current assets |
| F2 | Non-current assets, fixed assets, or fixed capital property |
| F3 | Total assets |
| F4 | Current liabilities within one year |
| F5 | Non-current liabilities that are over one-year terms. |
| F6 | Total liabilities |
| F7 | Capital |
| F8 | Earned surplus |
| F9 | Total capital |
| F10 | Total capital after liabilities |
| F11 | Sales revenue |
| F12 | Cost of sales |
| F13 | Gross profit |
| F14 | Sales and administrative expenses |
| F15 | Operating profit that refers to the profits earned through business operations |
| F16 | Non-operating income |
| F17 | Non-operating expenses |
| F18 | Income and loss before income taxes |
| F19 | Net income |
Table 2.
Results of the bankruptcy prediction framework for Korean dataset.
| Oversampling Techniques | Bankruptcy Prediction Model | AUC (%) |
|---|---|---|
| None | Random Forest | 82.4 ± 0.5 |
| Decision Tree | 76.2 ± 0.6 | |
| Multi-Layer Perceptron | 51.8 ± 0.2 | |
| SVM | 52.4 ± 1.7 | |
| SMOTE | Random Forest | 84.1 ± 0.4 |
| Decision Tree | 81.9 ± 0.5 | |
| Multi-Layer Perceptron | 71.4 ± 0.8 | |
| SVM | 53.1 ± 1.5 | |
| Borderline-SMOTE | Random Forest | 83.1 ± 0.5 |
| Decision Tree | 75.6 ± 0.6 | |
| Multi-Layer Perceptron | 67.7 ± 0.6 | |
| SVM | 52.1 ± 2.5 | |
| ADASYN | Random Forest | 83.1 ± 0.4 |
| Decision Tree | 80.3 ± 0.5 | |
| Multi-Layer Perceptron | 68.9 ± 0.5 | |
| SVM | 51.2 ± 2.1 | |
| SMOTE + Tomek | Random Forest | 84.1 ± 0.4 |
| Decision Tree | 81.9 ± 0.5 | |
| Multi-Layer Perceptron | 69.8 ± 0.4 | |
| SVM | 53.5 ± 1.2 | |
| SMOTE + ENN | Random Forest | 84.2 ± 0.5 |
| Decision Tree | 81.2 ± 0.5 | |
| Multi-Layer Perceptron | 72.7 ± 0.5 | |
| SVM | 54.2 ± 1.4 |
Table 3.
Results of bankruptcy prediction for the Korean dataset and the Korean mixed dataset in five-fold validation, six times.
Table 3.
Results of bankruptcy prediction for the Korean dataset and the Korean mixed dataset in five-fold validation, six times.
| Times | AUC (%) | AUC (%) for Mixed Dataset |
|---|---|---|
| 1 | 83.9 | 84.3 |
| 2 | 84.4 | 84.3 |
| 3 | 84.2 | 84.4 |
| 4 | 84.2 | 84.9 |
| 5 | 84.3 | 84.3 |
| 6 | 84.5 | 84.1 |
| Average AUC | 84.2 | 84.4 |
© 2018 by the authors. Licensee MDPI, Basel, Switzerland. This article is an open access article distributed under the terms and conditions of the Creative Commons Attribution (CC BY) license (http://creativecommons.org/licenses/by/4.0/).
Share and Cite
MDPI and ACS Style
Le, T.; Lee, M.Y.; Park, J.R.; Baik, S.W. Oversampling Techniques for Bankruptcy Prediction: Novel Features from a Transaction Dataset. Symmetry 2018, 10, 79. https://doi.org/10.3390/sym10040079
AMA Style
Le T, Lee MY, Park JR, Baik SW. Oversampling Techniques for Bankruptcy Prediction: Novel Features from a Transaction Dataset. Symmetry. 2018; 10(4):79. https://doi.org/10.3390/sym10040079
Chicago/Turabian StyleLe, Tuong, Mi Young Lee, Jun Ryeol Park, and Sung Wook Baik. 2018. "Oversampling Techniques for Bankruptcy Prediction: Novel Features from a Transaction Dataset" Symmetry 10, no. 4: 79. https://doi.org/10.3390/sym10040079
Note that from the first issue of 2016, this journal uses article numbers instead of page numbers. See further details here.