How to Address the Data Quality Issues in Regression Models: A Guided Process for Data Cleaning


1
Grupo de Ingeniería Telemática, Universidad del Cauca, Campus Tulcán, 190002 Popayán, Colombia
2
Departamento de Ciencias de la Computación e Ingeniería, Universidad Carlos III de Madrid, Avenida de la Universidad, 30, 28911 Leganés, Spain
3
Grupo de Ingeniería Telemática, Universidad del Cauca, Campus Tulcán, 190002 Popayán, Colombia
*
Author to whom correspondence should be addressed.
†
These authors contributed equally to this work.
Symmetry 2018, 10(4), 99; https://doi.org/10.3390/sym10040099
Submission received: 9 March 2018
/
Revised: 28 March 2018
/
Accepted: 30 March 2018
/
Published: 6 April 2018
Abstract
:Today, data availability has gone from scarce to superabundant. Technologies like IoT, trends in social media and the capabilities of smart-phones are producing and digitizing lots of data that was previously unavailable. This massive increase of data creates opportunities to gain new business models, but also demands new techniques and methods of data quality in knowledge discovery, especially when the data comes from different sources (e.g., sensors, social networks, cameras, etc.). The data quality process of the data set proposes conclusions about the information they contain. This is increasingly done with the aid of data cleaning approaches. Therefore, guaranteeing a high data quality is considered as the primary goal of the data scientist. In this paper, we propose a process for data cleaning in regression models (DC-RM). The proposed data cleaning process is evaluated through a real datasets coming from the UCI Repository of Machine Learning Databases. With the aim of assessing the data cleaning process, the dataset that is cleaned by DC-RM was used to train the same regression models proposed by the authors of UCI datasets. The results achieved by the trained models with the dataset produced by DC-RM are better than or equal to that presented by the datasets’ authors.
1. Introduction
The creation and consumption of data continue to grow by leaps and bounds. Due to advances in Information Technologies (IT), today the data explosion in the digital universe is a new trend [1,2]. The vast amount of data comes from different sources such as social networks, messenger applications for smart-phones, IoT, etc. The Forbes magazine reports an increase of data every second for every person in the world to 1.7 Megabytes from 2020 [3].
Thus, knowledge discovery and data mining gain importance due the abundance of data [4]. A successful process of knowledge discovery is necessary to undertake data treatment. For example, a preliminary step in the knowledge discovery tasks is the data preprocessing, where the main goal is the cleaning of raw data [5]. From data mining, recognized methodologies have been proposed: Knowledge Discovery in Databases (KDD) [6], Cross Industry Standard Process for Data Mining (CRISP-DM) [7], Sample, Explore, Modify, Model and Assess (SEMMA) [8]. Each of these describes a phase for data preprocessing. However, these methodologies do not explain how to address in detail the main issues in data cleaning, leaving out relevant analyses that may lead to problems related to poor data quality in data mining, machine learning, and data science projects [9].
To achieve a solution, the problems mentioned above, we propose a guided process for data cleaning in regression models (DC-RM). The procedure for building the process of data cleaning in regression models consist of identity, understand, organize and filter the data quality issues according to their meaning. After, for each data quality issues found in the datasets, a data cleaning task is suggested. Finally, we validate our approach applying the data cleaning process (DC-RM) to real datasets coming from UCI Repository of Machine Learning Databases [10], training the same algorithms used by the datasets authors with the dataset obtained by DC-RM, and comparing the precision achieved by these. The remainder of this paper is organized as follows: Section 2 discusses definitions of regression models, data quality and the related works. The process for data cleaning is explained in Section 3; Section 4 presents the results and Section 5 presents the conclusions and future works.
2. Materials and Methods
2.1. Background
This section exposes the concepts for building the process for data cleaning in regression models (DC-RM).
2.1.1. Regression Models
In knowledge discovery, regression models seek relations among a dependent variable (numeric) and a set of independent variables (numeric or nominal) through a learning proccess from a curated samples [11]. The main goal of the regression models is to obtain accurate predictions similarly to the values of the independent variable for new samples [12]. The Regression algorithms commonly used in the literature include multilayer perceptron [13], radial basis function network [14] and regression trees [15].
2.1.2. Data Quality
Data is affected by several processes, most of which affect its quality to a certain degree [16]. The authors in [17] define data quality as “the degree of fulfilment of all those requirements defined for data, which is needed for a specific purpose”. On the other hand, according to the authors of [18], the data errors may affect the predictive accuracy of linear regression models in two ways. First, the training data used to build the model may contain errors. Second, even if the training data are free of errors, once a linear regression model is used for forecasting a user may input test data containing errors to the model. This study demonstrates that the outputs of one linear regression model are sensitive to data errors. From the two assumptions above, this research is focused on the first one, taking GIGO: “Garbage In Garbage Out” as principle.
2.2. Related Works
Several researchers have built mechanisms to address data quality issues. Table 1 presents a summary of the related works and the data quality issues addressed.
In Table 1, we observe a large diversity of approaches for addressing data quality issues designed for relational data bases, data warehouses, health systems, and other domain applications (wind energy, seismic waves, electricity consumption); however, the related works are not focused on regression tasks of knowledge discovery. Although the following works [19,20] are oriented for big data pre-processing, they lack a user-oriented process to address orderly many data quality issues (e.g., missing values, outliers, duplicate instances, high dimensionality).
3. Process for Data Cleaning in Regression Models
This section presents the process to address poor quality data in regression tasks. The methodology “Building a Conceptual Framework: Philosophy, Definitions, and Procedure” [42] was adapted to build the proposed process. This offers an organized procedure of theorization for building conceptual process. The advantages of using this methodology proposed by [42] are the flexibility for make modifications, and the easy understanding. The procedure for building the process of data cleaning in regression models consists of the following phases:
3.1. Mapping the Selected Data Sources
The first phase identifies the data quality issues to regression tasks. Data sources as research papers and methodologies were reviewed:
- From data mining and machine learning four relevant methodologies, we found: Knowledge Discovery in Databases (KDD) [6], Cross Industry Standard Process for Data Mining (CRISP-DM) [7], Sample, Explore, Modify, Model and Assess (SEMMA) [8] and The Data Science Process [43]. These methodologies mention data quality issues such as: missing values, outliers, duplicate instances and high dimensionality.
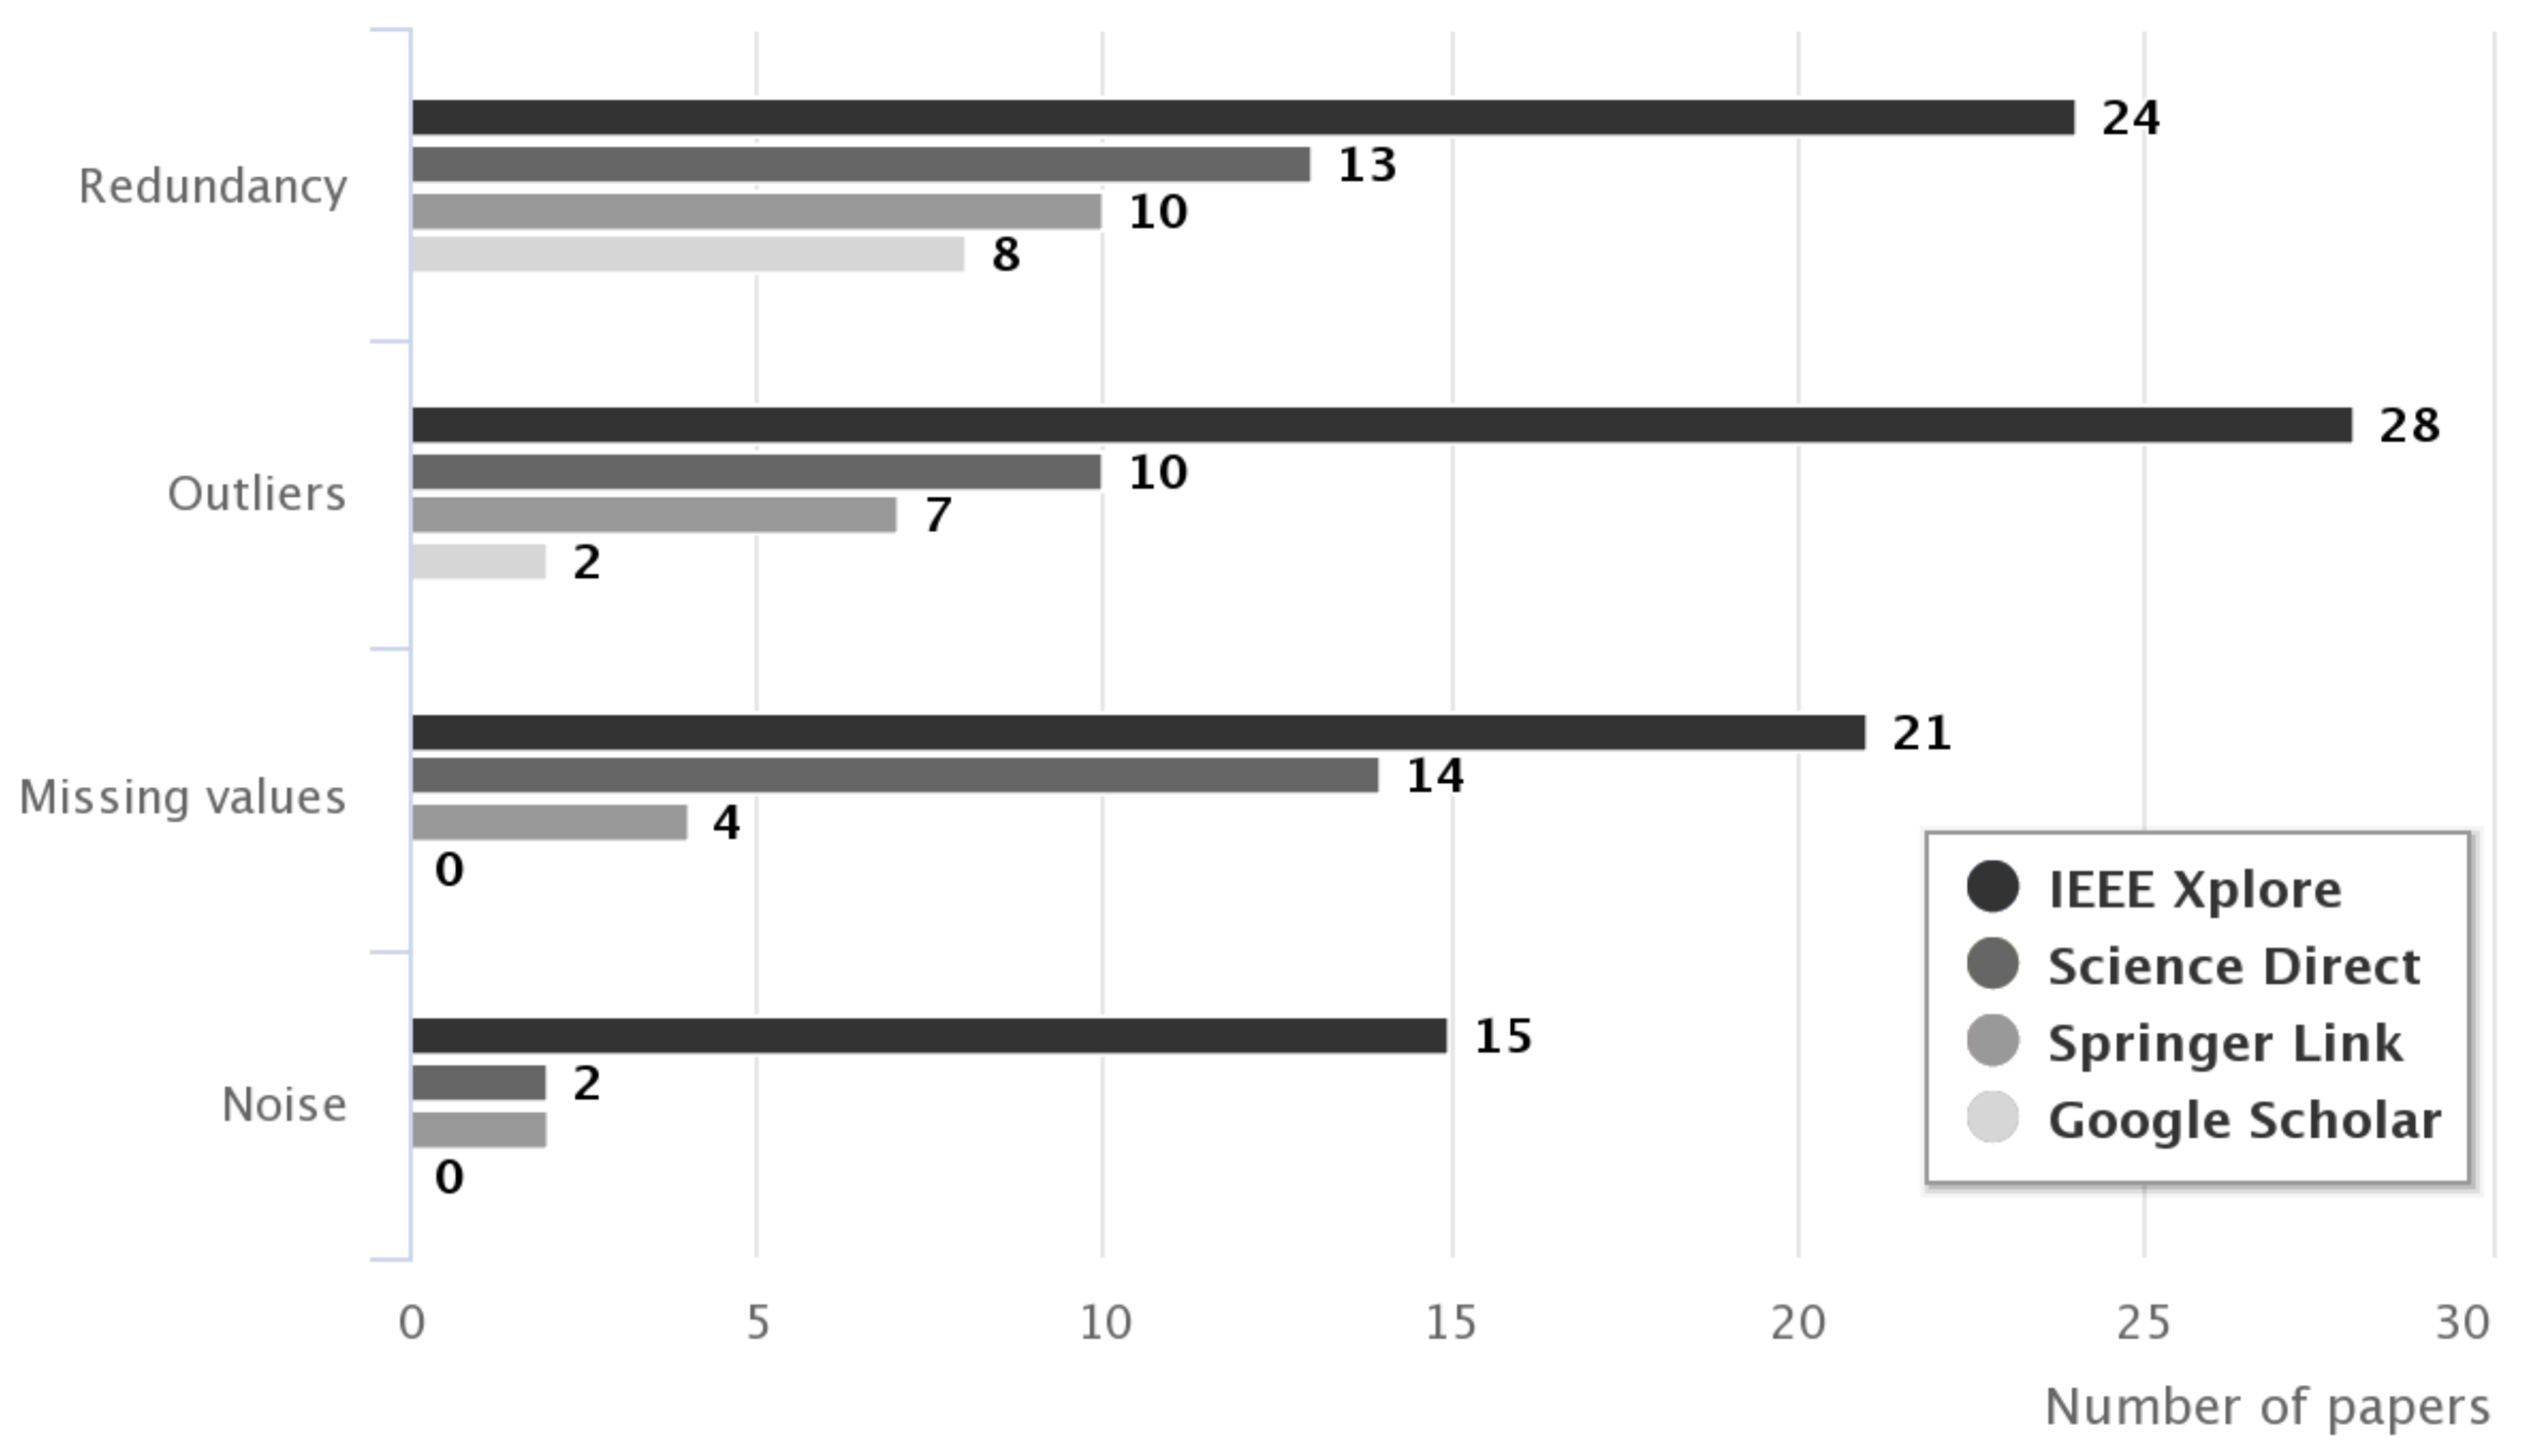
- In [44] we present a literature review for data quality issues in knowledge discovery tasks. We reviewed research papers from IEEE Xplore, Science Direct, Springer Link, and Google Scholar. Based on the literature analysis, it can be stated that three quality issues were found: missing values, outliers, and redundancy (refers to duplicate instances). Also, the noise was identified as a data quality issue (see Figure 1).
Data quality issues such as missing values, outliers and redundancy have received greater attention from research community (papers found: 39, 47 and 55 respectively). Meanwhile noise (17 papers) has been paid less attention because it is defined as general consequence of the data measurement errors.
3.2. Understanding the Selected Data
The aim in this phase is understand the data quality issues from regression task. Next a description of each data quality issue is presented:
- Missing values: refers when one variable or attribute does not contain any value. The missing values occur when the source of data has a problem, e.g., sensor faults, faulty measurements, data transfer problems or incomplete surveys [45].
- Redundancy: represents duplicate instances in data sets which might detrimentally affect the performance of classifiers [51].
3.3. Identifying and Filtering Components
The aim in this phase is organize and filter the data quality issues according to their meaning. The following changes have been made:
- Redundancy were renamed as Duplicate instances to represent better the data quality issues in regression models.
- Noise is considered a general issue according it definition: “irrelevant or meaningless data”. Thus Missing values, Outliers, High dimensionality and Duplicate instances are considered as a kind of Noise.
3.4. Integrating Components
In this phase, first, we define the data cleaning tasks. Subsequently, we propose a cleaning task as a solution for each noise issue (see Table 2).
- Imputation: replaces missing data with substituted values. In the literature we found four relevant approaches to imputing missing values:
- –
- Deletion: excludes instances if any value is missing [54].
- –
- Hot deck: missing items are replaced by using values from the same dataset [55].
- –
- Imputation based on missing attribute: assigns a representative value to a missing one based on measures of central tendency (e.g., mean, median, mode, trimmed mean) [56].
- –
- Imputation based on non-missing attributes: missing attributes are treated as dependent variables, and a regression or classification model is performed to impute missing values [57].
- Dimensionality reduction: reduces the number of attributes finding useful features to represent the dataset [61]. A subset of features is selected for the learning process of the regression model [49]. The best subset of relevant features is the one with least number of dimensions that most contribute to learning accuracy [62]. Dimensionality reduction can take on four approaches:
- –
- Filter: selects features based on discriminating criteria that are relatively independent of the regression (e.g., correlation coefficients) [62].
- –
- Wrapper: based on the performance of regression models (e.g., error measures) are maintained or discarded features in each iteration [63].
- –
- Embedded: the features are selected when the regression model is trained. The embedded methods try to reduce the computation time of the wrapper methods [64].
- –
- Projection: looks for a projection of the original space to space with orthogonal dimensions (e.g., principal component analysis) [65].
- Remove duplicate instances: identifies and removes duplicate instances [66].
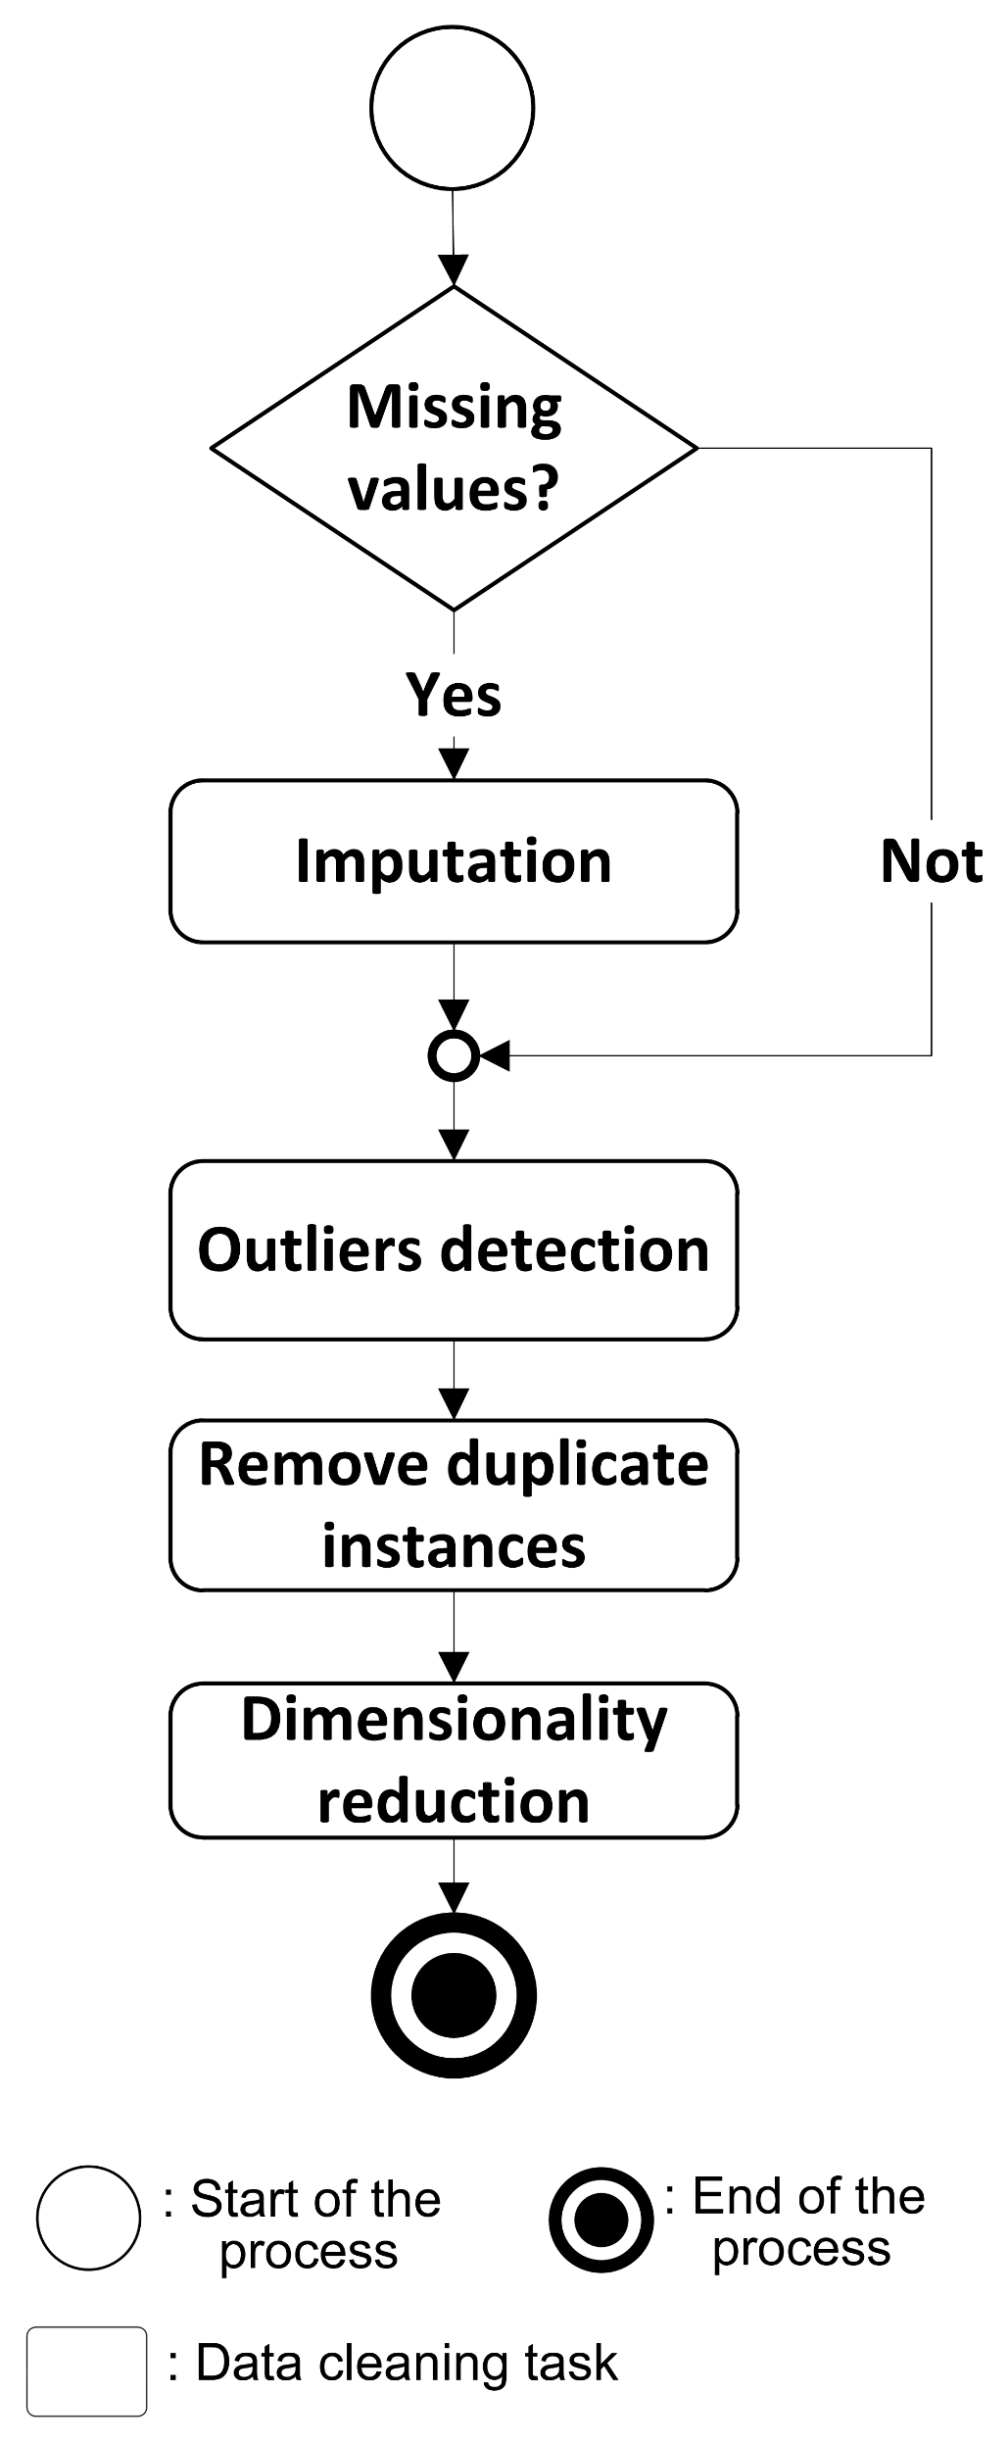
Several data cleaning tasks were identified for regression models. The integration of the data cleaning tasks is depicted in Figure 2:
Below, we explain the step-step execution of data cleaning flow for the regression models.
- Verify if dataset contains missing values: usually missing data are represented by special characters such as ?, *, blank spaces, specials words as NaN, null, etc. The first step is convert the missing values to format of the data cleaning algorithm.
- Apply imputation algorithms: once the format of missing values is prepared, an imputation algorithm is used. The added values must be verified because the imputation algorithm often creates outliers.
- Apply outliers detection algorithm: the outlier detection algorithm searches candidate outliers in the raw dataset or erroneous values generated by Imputation techniques.
- Apply algorithms to remove duplicate instances: these algorithms search for duplicate instances in both the raw dataset or those generated by imputation algorithms.
- Apply algorithm for dimensionality reduction: this kind of algorithms reduce the high dimensional in data sets by selecting a subset of most relevant features [67]. Different authors [68,69] assert that the feature selection methods have several advantages, such as: (i) improving the performance of the classifiers; (ii) better visualization and data understanding; and (iii) reducing time and computational cost
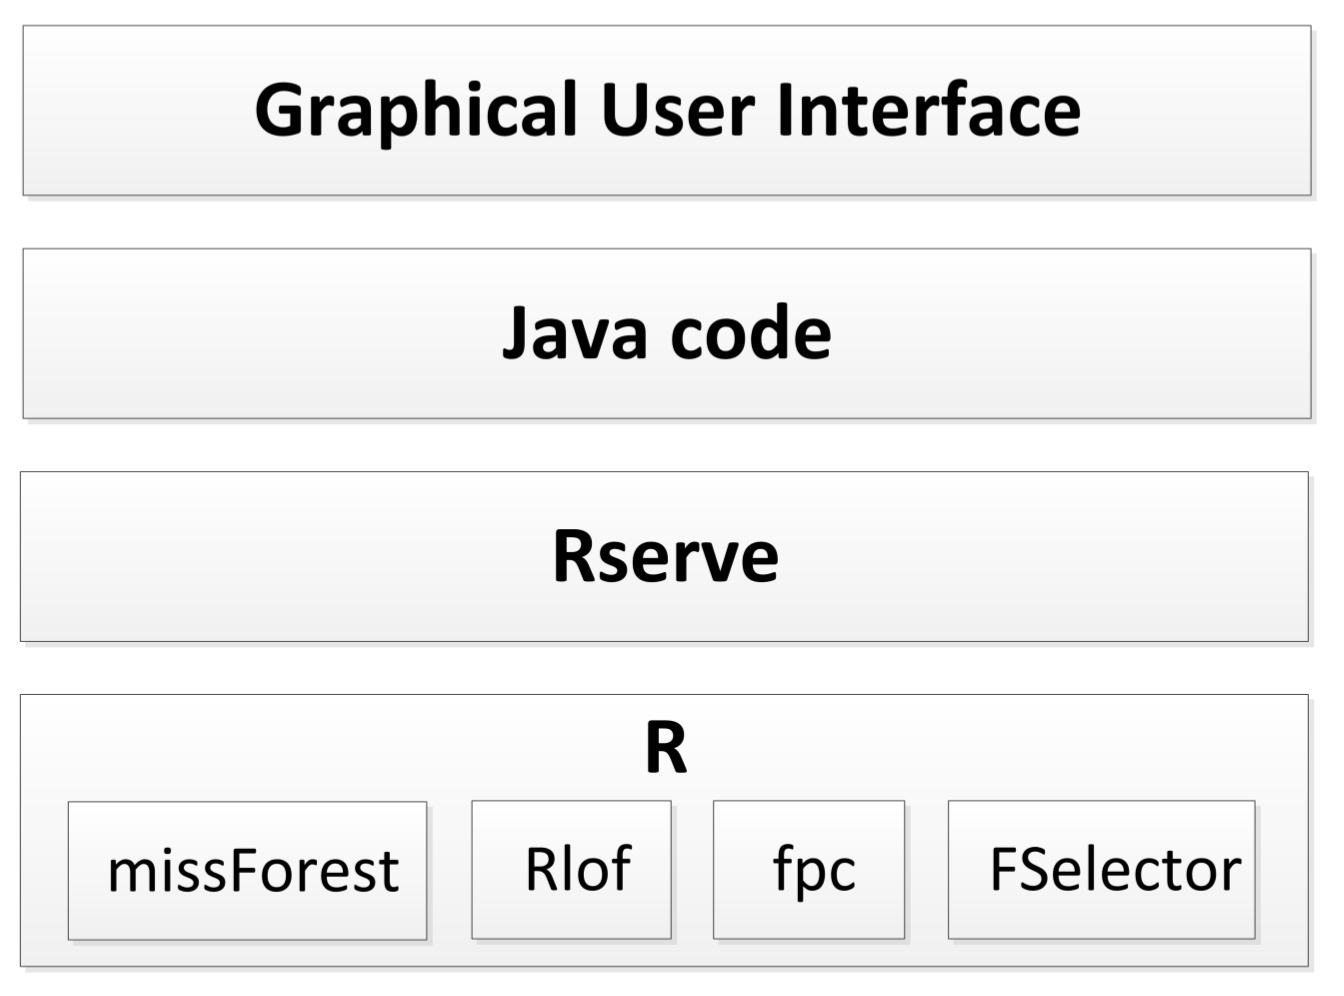
Once the phase of components integration is finished, we develop a software prototype of the guided process for data cleaning in regression models. Figure 3 presents the layer view of DC-RM.
DC-RM is composed by four layers:
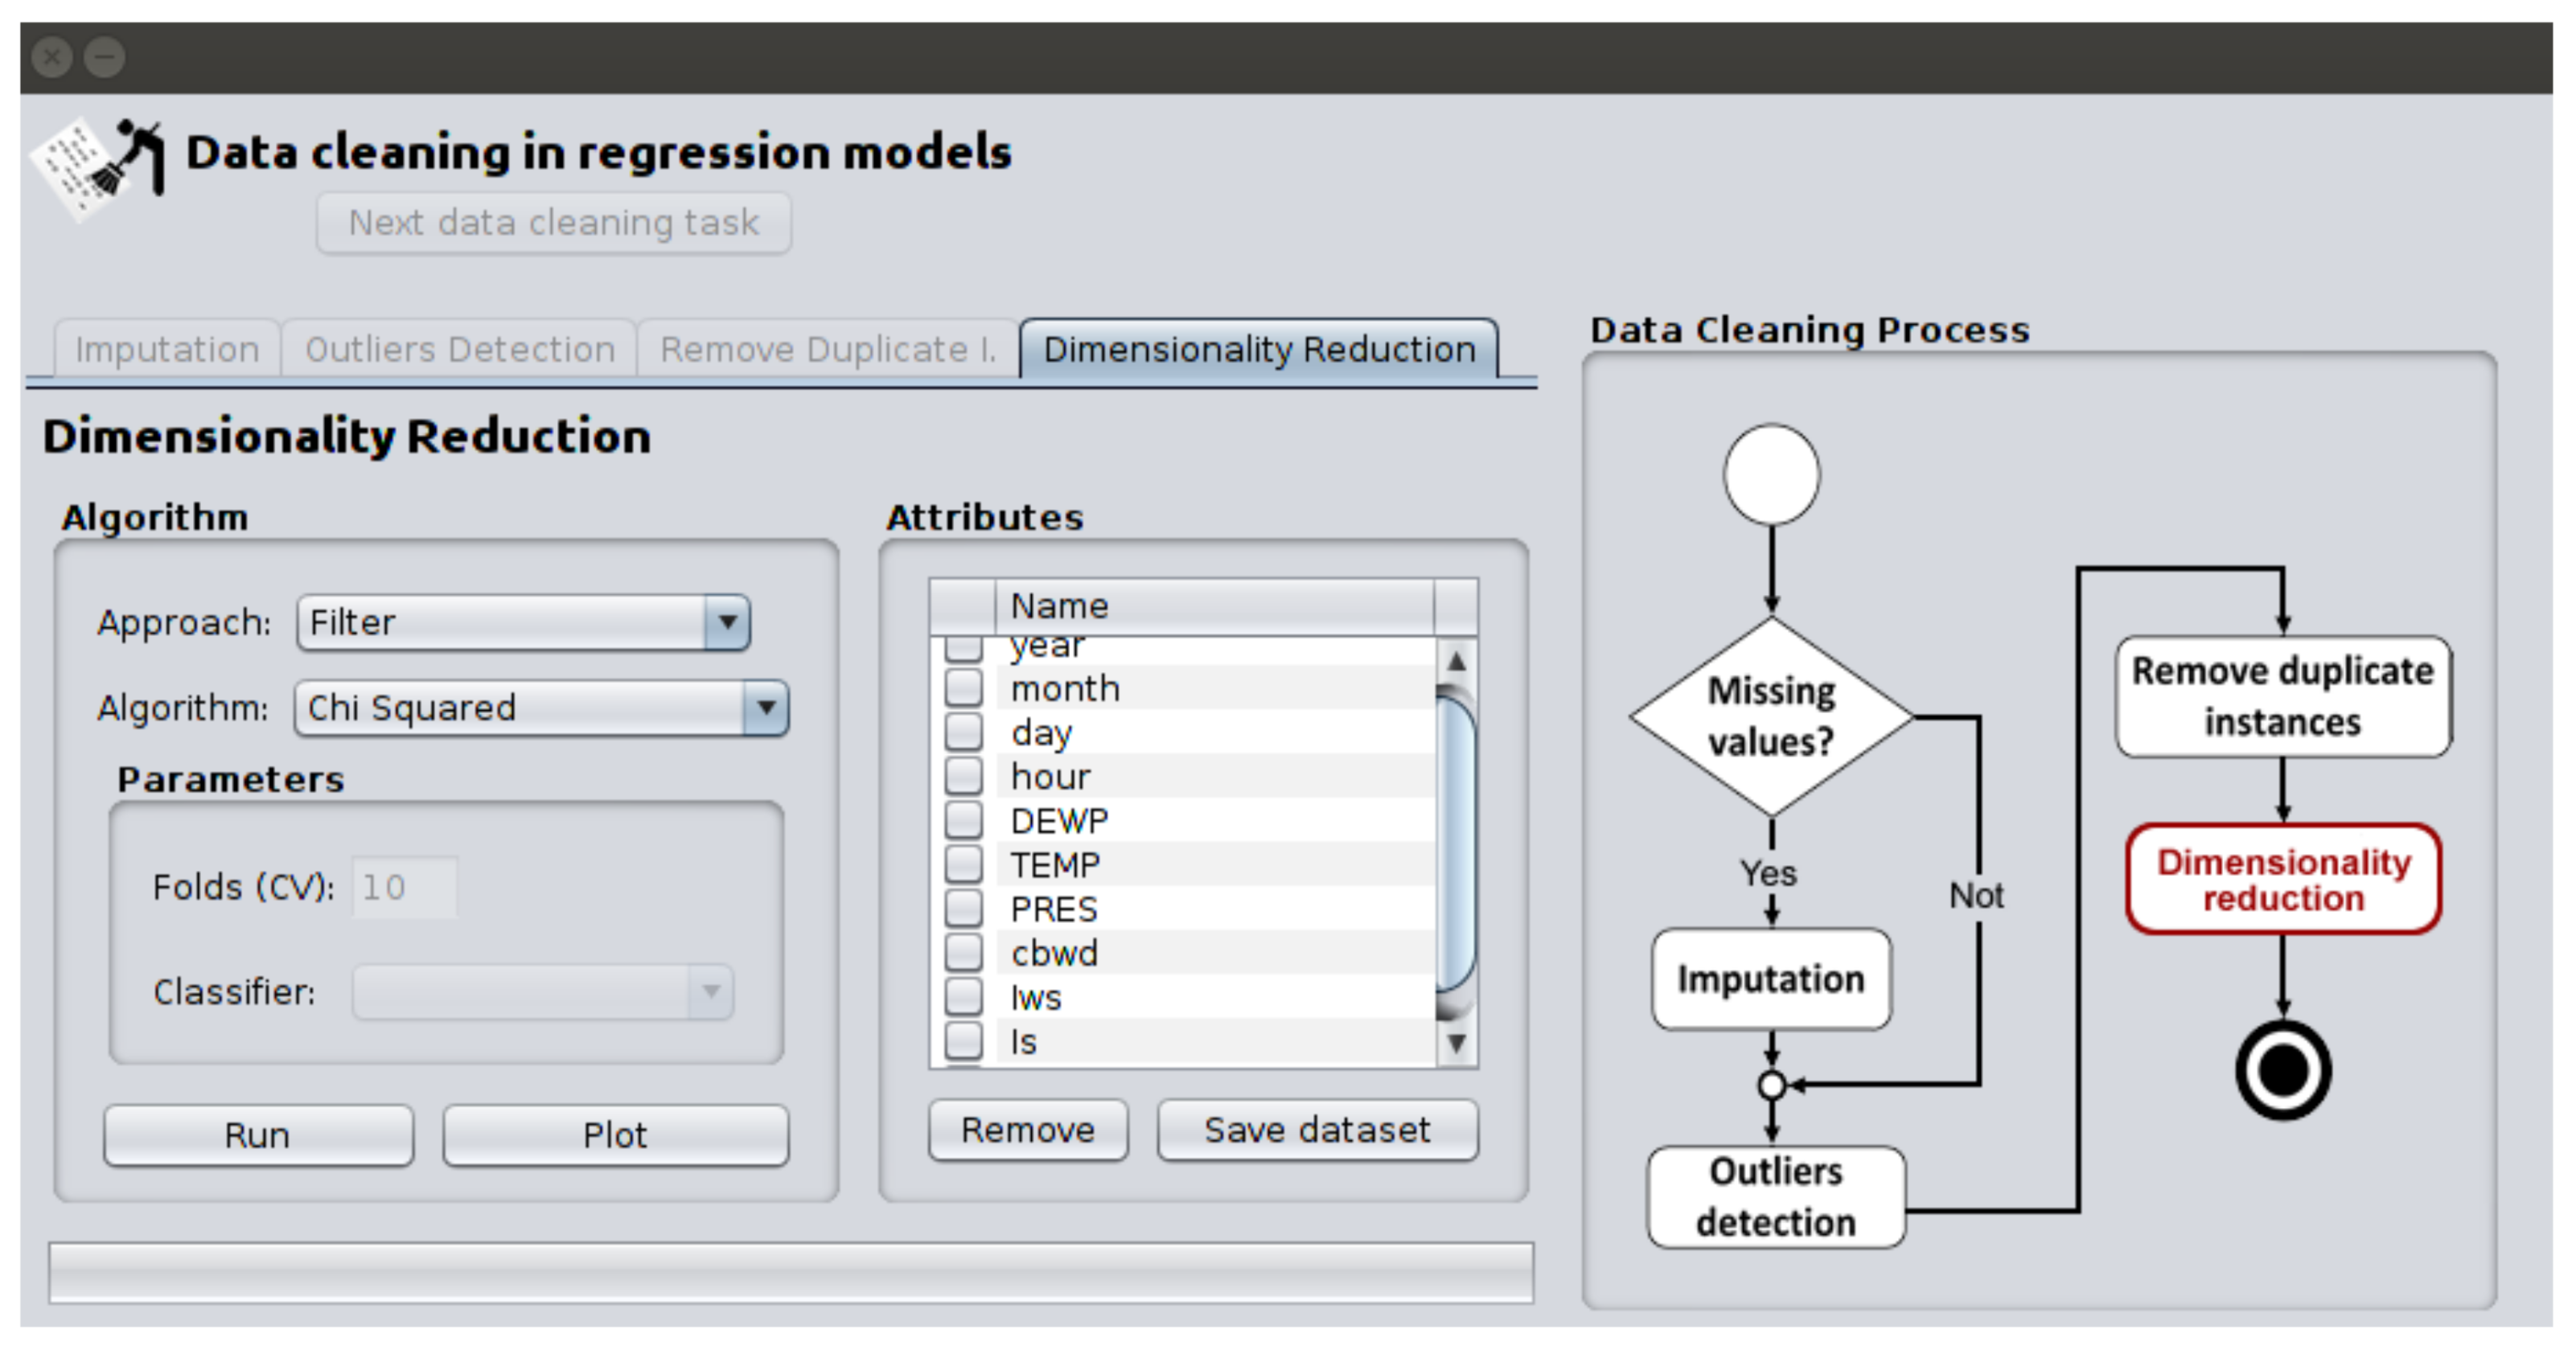
- Graphical User Interface (GUI) enables an user of DC-RM interact with the algorithms of data cleaning through graphical elements, such as text, windows, icons, buttons, text fields, etc. We developed two main forms in NetBeans IDE 8.2. The first form presents statistic information related with the dataset (number of attributes and instances,percentage of missing values and duplicate instances) and its attributes (mean, median, skewness, kurtosis, etc.) as show Figure 4. The second form (it appears when the button “Start cleaning” of the first form is pressed) presents the algorithms for each data cleaning task and the DC-RM process. In Figure 5 is depicted the second form when the chi–squared algorithm is applied in the dimensionality reduction phase.
- Java code establish a connection with R through Rserver, subsequently it invokes the data cleaning algorithms of the R packages, and finally, it sends the results of data cleaning algorithms to Graphical User Interface.
- Rserve acts as a socket server (TCP/IP or local sockets) which responds to requests from Java code. It listens for any incoming connections and processes incoming requests [70]. In other words, Rserve allows to embed R code within Java code.
- R is a system for statistical computation and graphics. It provides a programming language as dialect of S which was designed in the 1980s and has been in widespread use in the statistical community since [71]. R methods are based on packages, they are collections of functions and data sets developed by the community. We used R version 3.4.2 with missForest package [72] for imputation task, Rlof [73] and fpc [74] packages for outliers detection task, and Fselector [75] package for dimensionality reduction tasks. In case of remove duplicate instances, we used R function .
3.5. Validation
We evaluate the process for data cleaning in regression models (DC-RM) through real datasets coming from UCI Repository of Machine Learning Databases [10]. Section 4.2 explains in detail the validation of the proposed process for dataset: prediction of comments in Facebook post (cFp) [76].
4. Experimental Results
The DC-RM process was applied to real datasets of the UCI Repository of Machine Learning Databases [10]. Subsequently, the cleaned datasets by DC-RM are used to train the same algorithms proposed by authors of UCI datasets. Finally, we compare the Mean Absolute Errors (MAE) of the models trained with the datasets produced by the authors versus the models trained with the datasets processed by DC-RM.
The Mean Absolute Error (MAE) is defined by the next Equation:
where is the actual measurement (comments in Facebook posts), is the predicted value and n is the number of measurements.
We expose as case study the dataset for prediction of comments in Facebook posts (cFp) [76]. Thus, in Section 4.1 we presented the description of cFp dataset; in Section 4.2, we described the processing of the cFp dataset using DC-RM; Section 4.3 exposes the MAE achieved by the regression models (the trained by original cFp dataset versus the trained by DC-RM), finally Section 4.4 shows additional results of DC-RM with other datasets of UCI Repository [10].
4.1. Dataset Description
The dataset proposed in [76] is oriented towards the comments prediction in a Facebook post. The dataset is composed by a data test with 10.120 instances and five training sets as shown Table 3.
The dataset contains 53 attributes: 4 page features (page likes, page category, etc.), 30 essential features (comment count in last 24 and 48 h, etc.), 14 Weekday features (binary variables related with the date of Facebook post), and 5 other basic features (length of document, post share count, etc.).
4.2. Evaluation Process
4.2.1. Imputation
After executing the first step in the execution flow, we conclude that the original dataset does not contain missing values. With the goal of testing the imputation step, we remove values randomly from the original dataset using R statistical software [71]. As a result of this operation, the dataset presents missing values in three attributes. Therefore, we test two imputation approaches.
- Global imputation based on non-missing attributes: the main idea is fill the missing values by regression models. Missing attributes are treated as dependent variables, and a regression is performed to impute missing values [57]. The random forest algorithm [77] was used to fill the missing values. This method builds a model for each variable. Then it uses the model to predict missing values in the variable with help of observed values.
Table 4 presents the Mean Absolute Error of the imputation methods.
Random Forest reaches low MAEs in the imputations (MAE lowest: 0 in attribute 22 Variant 3, and MAE highest: 1.214 in attribute 31 of Variant 3 ). In contrast with Mean Imputation, the attributes 6, 15, 13, 29 shown in Table 4 have a MAE greater than 54.445. This happens because the imputation values were added on the center of the sample, diminishing the importance of values on the tails. Thus Random Forest was the algorithm used for impute the missing values. Figure 6 presents the imputed (red line) and original values (black line) for attribute 6 (comments average in last 24 h of the data training—variant 1).
In Figure 6, we observed the imputed values are around 2.225–2.305, while the original values are 2.273. Thus the imputation obtained by random forest reaches a mean absolute error 0.01. Other imputation for the attribute 31: comments in last 24 h of the data training—variant 2 is shown in Figure 7.
In this case the imputation method obtain a mean absolute error 1.21.
4.2.2. Outliers Detection
After obtaining the imputed values, according to the execution flow presented in Figure 2, we applied the outliers detection task with the aim to find abnormal behavioral in the instances or erroneous imputations. In this case, we propose the use of outliers detection based on distance (Local Outlier Factor) and clustering (Density-Based Spatial Clustering of Applications with Noise) approaches.
- Local Outlier Factor (LOF): is an algorithm for identifying distance-based local outliers [58]. With LOF, the local density of a certain point is compared with its neighbors. If the former is significantly lower than the latter (with an LOF value greater than 1), the point can be in a sparser region than its neighbors, which suggests it be an outlier [79].
- Density-Based Spatial Clustering of Applications with Noise (DBSCAN): searches clusters with regions of high and low density [80]. DBSCAN chooses an arbitrary unassigned object p from the dataset. If p is a core object, DBSCAN finds all the connected objects and these objects are assigned to a new cluster. If p is not a core object, then p is considered outlier object and DBSCAN moves onto the next unassigned object. Once every object is assigned, the algorithm stops [81].
Table 5 shows the candidate outliers detected by LOF and DBSCAN.
The clusters of outliers created by DBSCAN reach among 97 and 219 instances (Table 5); however, 97.35% of the instances considered outliers are false positives. In case of Local Outlier Factor, the instances with LOF scores greater than 4.134 were analyzed (among 2 and 13 instances depending of dataset as shown Table 5), obtaining that 100% of the candidate outliers are true positives.
From the foregoing LOF was the algorithm used for outliers detection. To verify the candidate outliers obtained by LOF, the first two principal components for each training sets were plotted. Figure 8 presents principal components PC1 and PC2 for data training—variant 5; 99.99% of the information contained in the data training are retained by the first two components. The outliers are labeled with “+” in red.
The candidate outliers detected by Local Outlier Factor (Table 5) were removed which can be erroneous observations generated in the imputation task.
4.2.3. Remove Duplicate Instances
We use the Standard Duplicate Elimination algorithm to detect duplicate instances [66]. They are removed by performing an external merge-sort and then scanning the sorted dataset. Similarly, we cluster and remove identical instances in a sequential scan of the sorted dataset [82]. Table 6 shows the number of duplicate instances for each data training set (remove 312 duplicate instances).
4.2.4. Dimensionality Reduction
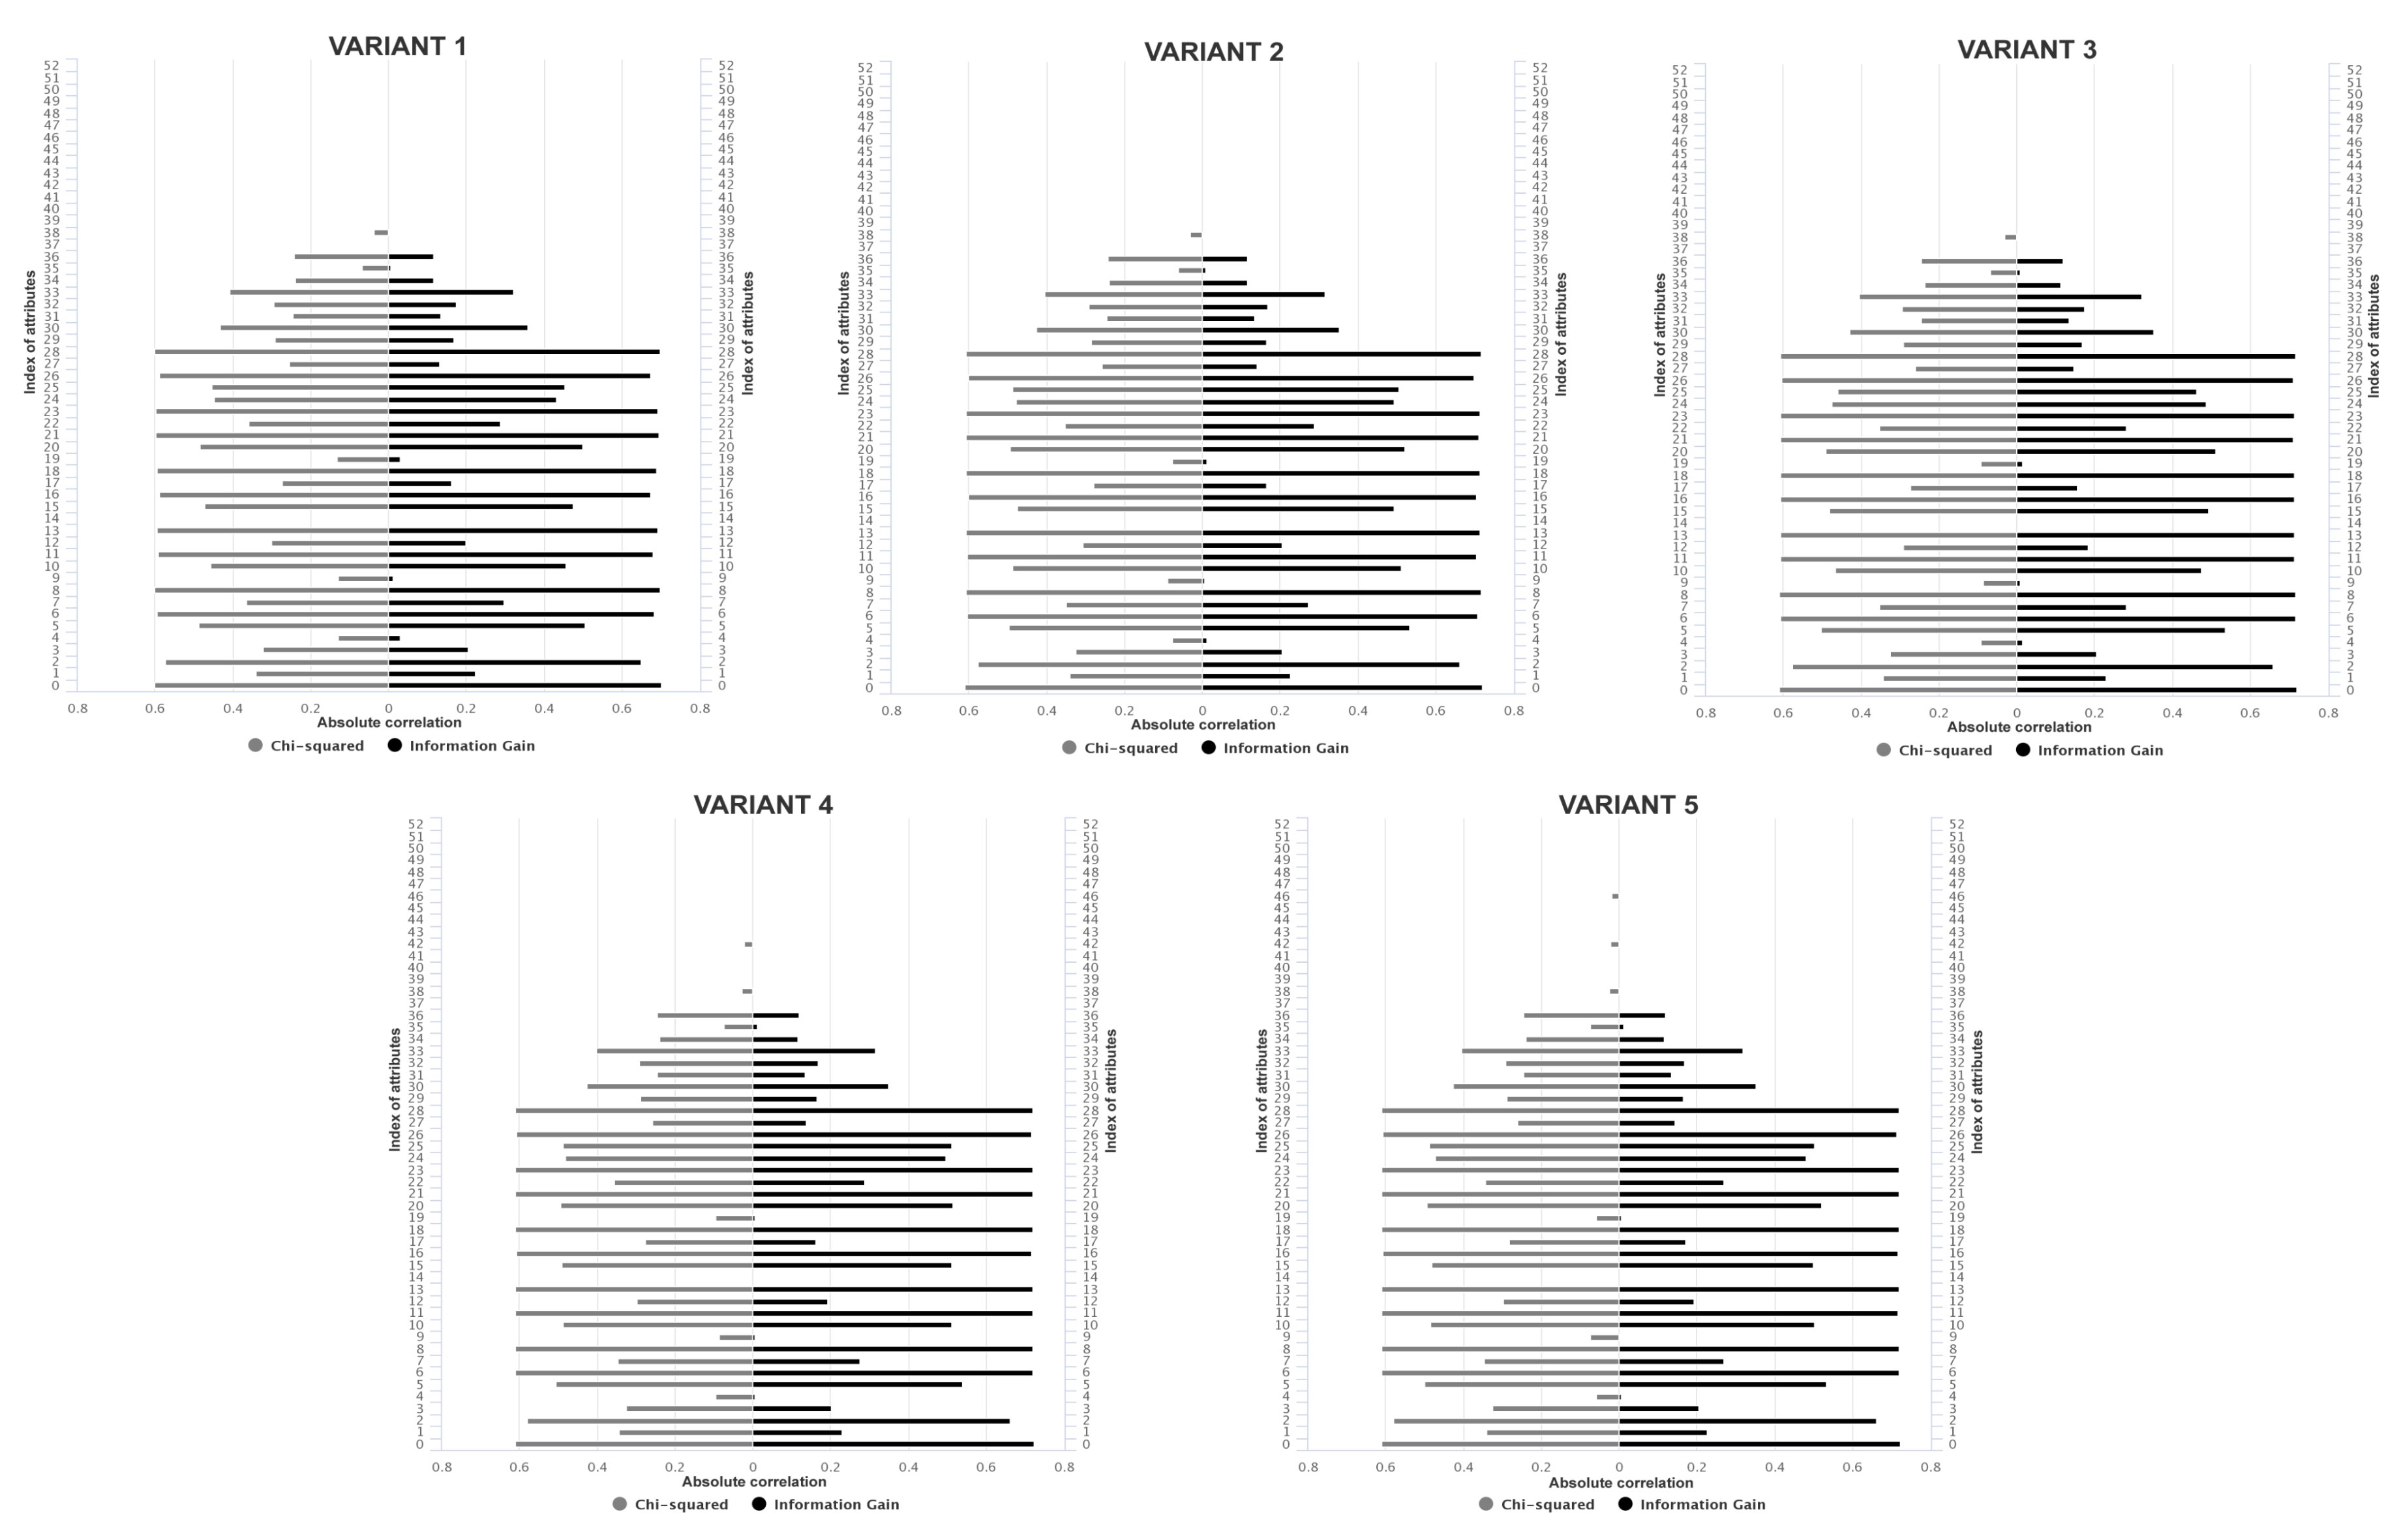
Considering that the datasets are large with respect to low computational resources, we recommend using two methods of filter approach based on the absolute correlation. This methods are considered faster and they have low computational cost [83]. The absolute values of pair-wise correlations are considered. If two attributes have a high correlation, the filter algorithm looks at the mean absolute correlation of each attribute and removes the variable with the largest mean absolute correlation [84]. Chi-squared and Information Gain were the methods used:
- Chi-Squared: is defined as sum of the squares of the differences of the independent and dependent variable divided by the dependent variable for every value [85]:where I is the independent variable, D is the dependent variable and i is the ith value of the dataset.
- Information Gain: measures the expected reduction in entropy (uncertainty associated with a random feature) [86,87]. Given the set of training examples, the vector of ith variables in this set, the fraction of examples of the ith variable having value v [88]:with entropy:is the probability of a training example in the set S to be close to the value of the class.
Figure 9 shows the absolute correlation for each attribute reached by Chi-squared and Information gain. The filter methods obtained a similar absolute correlation for the attributes of all datasets. The attributes with an absolute correlation of 0.2 or lower were removed (index of attributes removed: 4, 9, 14, 19, 35, 37–52).
4.3. Results
With the aim of assessing the data cleaning process, we use the dataset cleaned by DC-RM for training the same regression models proposed by the authors of cFp dataset [76]. Then, we compare the results of MAE obtained by the two approaches. The authors of [76] used four regression algorithms of the Weka toolkit:
- Multi Layer Perceptron (MLP): this neural network was designed with two hidden layers; the first hidden layer contains 20 neurons while the second hidden layer 4 neurons. The learning rate is adjusted to 0.1 and momentum to 0.01.
- Radial Basis Function Network (RBF): the number of clusters was modified to 90.
- In the models REP and M5P Tree were used the default parameters.
The regression models were evaluated with a data test set of 10.120 instances. Table 7 shows the mean absolute errors (MAE) of the models generated by dataset cleaned with DC-RM and the models proposed by the authors of cFp dataset [76]; the underlined values represent the best MAE overall achieved by the models using DC-RM and the authors proposal [76].
REP Tree was the model with the lowest MAE for DC-RM, as the authors proposed [76]. In contrast, the M5P tree of [76] (training with Variant 5) was the model with the highest MAE.
Overall, the training sets Variant 2, 3, 4, 5 cleaning by DC-RM achieve the best MAE in its models. In case of Variant 1, the authors’ proposal [76] reaches a best measure with a difference of MAE overall 0.92 respect to DC-RM.
4.4. Comparative Study
In order to demonstrate the performance of guided process for data cleaning in regression models, DC-RM also was validated with datasets coming from UCI Repository of Machine Learning Databases [10]. The models used were Support Vector Regression (SVR), Linear Regression (LR), Random Forest (RF), M5P Decision Tree, and Multi Layer Perceptron (MLP). Table 8 shows the MAE of models produced by the authors of UCI datasets compared with the same models trained with the datasets processed by DC-RM. The values underlined in Table 8 correspond to the MAE’s lowest.
Once the UCI datasets are cleaned by DC-RM, 81.81% of the models reach a lower Mean Absolute Error than models proposed by the dataset’s authors. For the remaining 8.19% of the models, the authors proposal of the datasets: “Turbine decay” and “Energy uses of appliances” achieve lowest MAE. However, the MAE’s difference of the models generated by the authors with respect to models built with datasets processed by DC-RM is slight. In the case of “Turbine decay” dataset, the MAE’s difference of SVR models is 0.002 and 0.06 for the “Energy uses of appliances” dataset, using the RF models.
Compared with effort in data preparation and previous domain knowledge by dataset authors, DC-RM offers a general data cleaning solution for any application domain. DC-RM reaches or overcomes the results proposed by the dataset’s authors.
5. Conclusions and Future Works
In this work, a process to address the data quality issues in regression models is proposed. From DC-RM, we conclude:
- DC-RM provides support to methodologies from data mining and machine learning. For instance, in Knowledge Discovery in Databases, DC-RM can support the Preprocessing and Data Cleaning, Data Reduction, and Projecton phases. In Cross Industry Standard Process for Data Mining, DC-RM gives support to Verify Data Quality and Clean Data steps. (especially: Sample, Explore, Modify, Model and Assess in Modify phase); and, in Data Science Process into the Clean Data phase. Finally, we would like to emphasize that none of the methodologies discussed above explain in detail how to address the data quality issues in regression models.
- The DC-RM approach reduces the time and effort invested by the user in pre-processing phase, since it detects the data quality issues and advises about the suitable approach and the execution order for data cleaning tasks.
- The dimensionality reduction is an important task that must be applied in large feature space. Considering the high data dimensionality of the dataset proposed by [76], the filter methods were used in DC-RM (due their fast and low computational cost). However, several authors declare that other methods with high computational cost such as wrapper and embedded methods can obtain better results [49,64,95,96,97].
As future works, we propose:
- Building other processes for data cleaning in knowledge discovery tasks as classification and clustering.
- Including ontologies of specific domains to support some data quality issues; e.g, selection of relevant attributes based on expert knowledge. In the cancer domain, the ontology developed by [98] can be used for selecting the relevant attributes and avoid the use of algorithms with high computational complexity in dimensionality reduction tasks.
- Creating a case based reasoning (CBR) system for supporting the data cleaning process. The CBR will automatically recommend the suitable data cleaning algorithm (e.g., in outliers detection, the CBR suggests the local outlier factor algorithm to the user).
Acknowledgments
The authors are grateful to the research groups: Control Learning Systems Optimization Group (CAOS) of the Carlos III University of Madrid and Telematics Engineering Group (GIT) of the University of Cauca for the technical support. In addition, the authors are grateful to COLCIENCIAS for PhD scholarship granted to MsC. David Camilo Corrales. This work has been also supported by the Spanish Ministry of Economy, Industry and Competitiveness (Projects TRA2015-63708-R and TRA2016-78886-C3-1-R).
Author Contributions
This paper is the result of PhD thesis of David Camilo Corrales with the support of his supervisors Juan Carlos Corrales and Agapito Ledezma.
Conflicts of Interest
The authors declare no conflict of interest.
Abbreviations
The following abbreviations are used in this manuscript:
| DC-RM | Data Cleaning in Regression Models |
References
- Gantz, J.; Reinsel, D. The Digital Universe in 2020: Big Data, Bigger Digital Shadows, and Biggest Growth in the Far East; IDC: Framingham, MA, USA, 2012; pp. 1–16. [Google Scholar]
- Hu, H.; Wen, Y.; Chua, T.S.; Li, X. Toward Scalable Systems for Big Data Analytics: A Technology Tutorial. IEEE Access 2014, 2, 652–687. [Google Scholar]
- Marr, B. Big Data: 20 Mind-Boggling Facts Everyone Must Read. 2015. Available online: https://www.forbes.com/sites/bernardmarr/2015/09/30/big-data-20-mindbogglingfacts-everyone-must-read/ (accessed on 30 September 2015).
- Maimon, O.; Rokach, L. Introduction to Knowledge Discovery in Databases. In Data Mining and Knowledge Discovery Handbook; Maimon, O., Rokach, L., Eds.; Springer: Boston, MA, USA, 2005; pp. 1–17. [Google Scholar]
- Eyob, E. Social Implications of Data Mining and Information Privacy: Interdisciplinary Frameworks and Solutions: Interdisciplinary Frameworks and Solutions; Information Science Reference: Hershey, PA, USA, 2009. [Google Scholar]
- Piateski, G.; Frawley, W. Knowledge Discovery in Databases; MIT Press: Cambridge, MA, USA, 1991. [Google Scholar]
- Chapman, P. CRISP-DM 1.0: Step-by-Step Data Mining Guide; SPSS: Chicago, IL, USA, 2000. [Google Scholar]
- Olson, D.L.; Delen, D. Advanced Data Mining Techniques; Springer Science & Business Media: Berlin/Heidelberg, Germany, 2008. [Google Scholar]
- Corrales, D.C.; Ledezma, A.; Corrales, J.C. A Conceptual Framework for Data Quality in Knowledge Discovery Tasks (FDQ-KDT): A Proposal. J. Comput. 2015, 10, 396–405. [Google Scholar] [CrossRef]
- Asuncion, A.; Newman, D. UCI Machine Learning Repository; University of California, School of Information and Computer Science: Irvine, CA, USA, 2007; Available online: http://www.ics.uci.edu/~{}mlearn/MLRepository.html (accessed on 1 March 2018).
- Sen, A.; Srivastava, M. Regression Analysis: Theory, Methods, and Applications; Springer Science & Business Media: New York, NY, USA, 2012. [Google Scholar]
- Yang, L.; Liu, S.; Tsoka, S.; Papageorgiou, L.G. A regression tree approach using mathematical programming. Expert Syst. Appl. 2017, 78, 347–357. [Google Scholar] [CrossRef]
- Hill, T.; Marquez, L.; O’Connor, M.; Remus, W. Artificial neural network models for forecasting and decision making. Int. J. Forecast. 1994, 10, 5–15. [Google Scholar] [CrossRef]
- Chen, S.; Cowan, C.F.N.; Grant, P.M. Orthogonal least squares learning algorithm for radial basis function networks. IEEE Trans. Neural Netw. 1991, 2, 302–309. [Google Scholar] [CrossRef] [PubMed]
- Quinlan, J.R. Learning With Continuous Classes; World Scientific: Singapore, 1992; pp. 343–348. [Google Scholar]
- Maydanchik, A. Data Quality Assessment; Technics Publications LLC: Madison, WI, USA, 2007. [Google Scholar]
- Morbey, G. Data Quality for Decision Makers: A Dialog between a Board Member and a DQ Expert; Bücher, Springer Fachmedien: Wiesbaden, Germany, 2013. [Google Scholar]
- Klein, B.D.; Rossin, D.F. Data Quality in Linear Regression Models: Effect of Errors in Test Data and Errors in Training Data on Predictive Accuracy. Inf. Sci. 1999, 2, 33–43. [Google Scholar] [CrossRef]
- Taleb, I.; Dssouli, R.; Serhani, M.A. Big Data Pre-processing: A Quality Framework. In Proceedings of the 2015 IEEE International Congress on Big Data, New York, NY, USA, 27 June–2 July 2015; pp. 191–198. [Google Scholar]
- Merino, J.; Caballero, I.; Rivas, B.; Serrano, M.; Piattini, M. A Data Quality in Use model for Big Data. Future Gener. Comput. Syst. 2016, 63, 123–130. [Google Scholar] [CrossRef]
- Chiang, F.; Sitaramachandran, S. A Data Quality Framework for Customer Relationship Analytics. In Proceedings of the 2015 16th International Conference on Web Information Systems Engineering (WISE), Miami, FL, USA, 1–3 November 2015; Wang, J., Cellary, W., Wang, D., Wang, H., Chen, S.C., Li, T., Zhang, Y., Eds.; Part II. Springer International Publishing: Cham, Switzerland, 2015; pp. 366–378. [Google Scholar]
- Berti-Équille, L. Measuring and Modelling Data Quality for Quality-Awareness in Data Mining. In Quality Measures in Data Mining; Guillet, F.J., Hamilton, H.J., Eds.; Springer: Berlin/Heidelberg, Germany, 2007; pp. 101–126. [Google Scholar]
- Galhard, H.; Florescu, D.; Shasha, D.; Simon, E. An extensible Framework for Data Cleaning. In Proceedings of the 2000 16th International Conference on Data Engineering, Washington, DC, USA, 28 February–3 March 2000; p. 312. [Google Scholar]
- De F. Mendes Sampaio, S.; Dong, C.; Sampaio, P. DQ2S? A framework for data quality-aware information management. Expert Syst. Appl. 2015, 42, 8304–8326. [Google Scholar] [CrossRef]
- Li, W.; Lei, L. An Object-Oriented Framework for Data Quality Management of Enterprise Data Warehouse. In Proceedings of the PRICAI 2006 Trends in Artificial Intelligence 9th Pacific Rim International Conference on Artificial Intelligence, Guilin, China, 7–11 August 2006; Yang, Q., Webb, G., Eds.; Springer: Berlin/Heidelberg, Germany, 2006; pp. 1125–1129. [Google Scholar]
- Sebastian-Coleman, L. Measuring Data Quality for Ongoing Improvement: A Data Quality Assessment Framework; Newnes: Waltham, MA, USA, 2012. [Google Scholar]
- Myrseth, P.; Stang, J.; Dalberg, V. A data quality framework applied to e-government metadata: A prerequsite to establish governance of interoperable e-services. In Proceedings of the 2011 International Conference on E-Business and E-Government (ICEE), Shanghai, China, 6–8 May 2011; pp. 1–4. [Google Scholar]
- Vetro, A.; Canova, L.; Torchiano, M.; Minotas, C.O.; Iemma, R.; Morando, F. Open data quality measurement framework: Definition and application to Open Government Data. Gov. Inf. Q. 2016, 33, 325–337. [Google Scholar] [CrossRef]
- Panahy, P.H.S.; Sidi, F.; Affendey, L.S.; Jabar, M.A.; Ibrahim, H.; Mustapha, A. A Framework to Construct Data Quality Dimensions Relationships. Indian J. Sci. Technol. 2013, 6, 4421–4431. [Google Scholar]
- Wang, R.Y.; Storey, V.C.; Firth, C.P. A framework for analysis of data quality research. IEEE Trans. Knowl. Data Eng. 1995, 7, 623–640. [Google Scholar] [CrossRef]
- Weiskopf, N.G.; Weng, C. Methods and dimensions of electronic health record data quality assessment: enabling reuse for clinical research. J. Am. Med. Inform. Assoc. 2013, 20, 144–151. [Google Scholar] [CrossRef] [PubMed]
- Reimer, A.P.; Milinovich, A.; Madigan, E.A. Data quality assessment framework to assess electronic medical record data for use in research. Int. J. Med. Inform. 2016, 90, 40–47. [Google Scholar] [CrossRef] [PubMed]
- Almutiry, O.; Wills, G.; Alwabel, A. Toward a framework for data quality in cloud-based health information system. In Proceedings of the 2013 International Conference on Information Society (i-Society), Toronto, ON, Canada, 24–26 June 2013; pp. 153–157. [Google Scholar]
- Arts, D.G.; De Keizer, N.F.; Scheffer, G.J. Defining and improving data quality in medical registries: A literature review, case study, and generic framework. J. Am. Med. Inform. Assoc. 2002, 9, 600–611. [Google Scholar] [CrossRef] [PubMed]
- Taggart, J.; Liaw, S.T.; Yu, H. Structured data quality reports to improve EHR data quality. Int. J. Med. Inform. 2015, 84, 1094–1098. [Google Scholar] [CrossRef] [PubMed]
- Botsis, T.; Hartvigsen, G.; Chen, F.; Weng, C. Secondary use of EHR: Data quality issues and informatics opportunities. Summit Transl. Bioinform. 2010, 2010, 1–5. [Google Scholar]
- Kahn, M.G.; Raebel, M.A.; Glanz, J.M.; Riedlinger, K.; Steiner, J.F. A pragmatic framework for single-site and multisite data quality assessment in electronic health record-based clinical research. Med. Care 2012, 50, S21–S29. [Google Scholar] [CrossRef] [PubMed]
- Ryzhov, A.; Bray, F.; Ferlay, J.; Fedorenko, Z.; Goulak, L.; Gorokh, Y.; Soumkina, O.; Znaor, A. Evaluation of data quality at the National Cancer Registry of Ukraine. Cancer Epidemiol. 2018, 53, 156–165. [Google Scholar] [CrossRef] [PubMed]
- Rasta, K.; Nguyen, T.H.; Prinz, A. A framework for data quality handling in enterprise service bus. In Proceedings of the 2013 Third International Conference on Innovative Computing Technology (INTECH), London, UK, 29–31 August 2013; pp. 491–497. [Google Scholar]
- Ringler, A.; Hagerty, M.; Holland, J.; Gonzales, A.; Gee, L.; Edwards, J.; Wilson, D.; Baker, A. The data quality analyzer: A quality control program for seismic data. Comput. Geosci. 2015, 76, 96–111. [Google Scholar] [CrossRef]
- Chen, W.; Zhou, K.; Yang, S.; Wu, C. Data quality of electricity consumption data in a smart grid environment. Renew. Sustain. Energy Rev. 2017, 75, 98–105. [Google Scholar] [CrossRef]
- Jabareen, Y. Building a conceptual framework: philosophy, definitions, and procedure. Int. J. Qual. Methods 2009, 8, 49–62. [Google Scholar] [CrossRef]
- Schutt, R.; O’Neil, C. Doing Data Science: Straight Talk from the Frontline; O’Reilly Media, Inc.: Sevan Fort, CA, USA, 2013. [Google Scholar]
- Corrales, D.; Ledezma, A.; Corrales, J. A Systematic Review of Data Quality Issues in Knowledge Discovery Tasks; Revista Ingenierias Universidad de Medellin: Medellin, Colombia, 2016; Volume 15. [Google Scholar]
- Aydilek, I.B.; Arslan, A. A hybrid method for imputation of missing values using optimized fuzzy c-means with support vector regression and a genetic algorithm. Inf. Sci. 2013, 233, 25–35. [Google Scholar] [CrossRef]
- Hawkins, D.M. Identification of Outliers; Springer: London, UK, 1980; Volume 11. [Google Scholar]
- Barnett, V.; Lewis, T. Outliers in Statistical Data; Wiley: New York, NY, USA, 1994; Volume 3. [Google Scholar]
- Johnson, R.A.; Wichern, D.W. Applied Multivariate Statistical Analysis; Prentice-Hall: Upper Saddle River, NJ, USA, 2014; Volume 4. [Google Scholar]
- Khalid, S.; Khalil, T.; Nasreen, S. A survey of feature selection and feature extraction techniques in machine learning. In Proceedings of the Science and Information Conference (SAI), London, UK, 27–29 August 2014; pp. 372–378. [Google Scholar]
- Tang, J.; Alelyani, S.; Liu, H. Feature selection for classification: A review. In Data Classification: Algorithms and Applications; CRC Press: Boca Raton, FL, USA, 2014; p. 37. [Google Scholar]
- Bosu, M.F.; MacDonell, S.G. A Taxonomy of Data Quality Challenges in Empirical Software Engineering. In Proceedings of the 2013 22nd Australian Software Engineering Conference, Melbourne, Australia, 4–7 June 2013; pp. 97–106. [Google Scholar]
- Xiong, H.; Pandey, G.; Steinbach, M.; Kumar, V. Enhancing data analysis with noise removal. IEEE Trans. Knowl. Data Eng. 2006, 18, 304–319. [Google Scholar] [CrossRef]
- Chandola, V.; Banerjee, A.; Kumar, V. Anomaly Detection: A Survey. ACM Comput. Surv. 2009, 41, 15:1–15:58. [Google Scholar] [CrossRef]
- Aljuaid, T.; Sasi, S. Proper imputation techniques for missing values in data sets. In Proceedings of the 2016 International Conference on Data Science and Engineering (ICDSE), Cochin, India, 23–25 August 2016; pp. 1–5. [Google Scholar]
- Strike, K.; Emam, K.E.; Madhavji, N. Software cost estimation with incomplete data. IEEE Trans. Softw. Eng. 2001, 27, 890–908. [Google Scholar] [CrossRef]
- Grzymala-Busse, J.W.; Hu, M. A Comparison of Several Approaches to Missing Attribute Values in Data Mining; Ziarko, W., Yao, Y., Eds.; Rough Sets and Current Trends in Computing; Springer: Berlin/Heidelberg, Germany, 2001; pp. 378–385. [Google Scholar]
- Magnani, M. Techniques for Dealing With Missing Data in Knowledge Discovery Tasks. Available online: https://www.researchgate.net/profile/Matteo_Magnani/publication/228748415_Techniques_for_dealing_with_missing_data_in_knowledge_discovery_tasks/links/00b49521f12e9afa98000000.pdf (accessed on 1 March 2018).
- Breunig, M.M.; Kriegel, H.P.; Ng, R.T.; Sander, J. LOF: Identifying density-based local outliers. In Proceedings of the ACM Sigmod Record, Dallas, TX, USA, 15–18 May 2000; Volume 29, pp. 93–104. [Google Scholar]
- Ester, M.; Kriegel, H.P.; Sander, J.; Xu, X. A density-based algorithm for discovering clusters in large spatial databases with noise. In KDD-96 Proceedings; AAAI Press: Menlo Park, CA, USA, 1996; pp. 226–231. [Google Scholar]
- Kriegel, H.P.; Zimek, A.; Hubert, M.S. Angle-based outlier detection in high-dimensional data. In Proceedings of the 14th ACM SIGKDD International Conference On Knowledge Discovery and Data Mining, Las Vegas, NV, USA, 24–27 August 2008; pp. 444–452. [Google Scholar]
- Fayyad, U.M.; Piatetsky-Shapiro, G.; Smyth, P. Advances in Knowledge Discovery and Data Mining; Chapter from Data Mining to Knowledge Discovery: An Overview; American Association for Artificial Intelligence: Menlo Park, CA, USA, 1996; pp. 1–34. [Google Scholar]
- Ladha, L.; Deepa, T. Feature Selection Methods And Algorithms. Int. J. Comput. Sci. Eng. 2011, 3, 1787–1797. [Google Scholar]
- Chandrashekar, G.; Sahin, F. A survey on feature selection methods. Comput. Electr. Eng. 2014, 40, 16–28. [Google Scholar] [CrossRef]
- Blum, A.L.; Langley, P. Selection of relevant features and examples in machine learning. Artif. Intell. 1997, 97, 245–271. [Google Scholar] [CrossRef]
- Jolliffe, I. Principal Component Analysis; Wiley Online Library: New York, NY, USA, 2002. [Google Scholar]
- Huang, L.; Jin, H.; Yuan, P.; Chu, F. Duplicate Records Cleansing with Length Filtering and Dynamic Weighting. In Proceedings of the 2008 Fourth International Conference on Semantics, Knowledge and Grid, Beijing, China, 3–5 December 2008; pp. 95–102. [Google Scholar]
- John, G.H.; Kohavi, R.; Pfleger, K. Irrelevant Features and the Subset Selection Problem. In Proceedings of the Eleventh International Machine Learning, Morgan Kaufmann, New Brunswick, NJ, USA, 10–13 July 1994; pp. 121–129. [Google Scholar]
- Guyon, I.; Gunn, S.; Nikravesh, M.; Zadeh, L.A. Feature Extraction: Foundations and Applications (Studies in Fuzziness and Soft Computing); Springer: New York, NY, USA, 2008. [Google Scholar]
- Sánchez-Maroño, N.; Alonso-Betanzos, A.; Tombilla-Sanromán, M. Filter Methods for Feature Selection—A Comparative Study. In Intelligent Data Engineering and Automated Learning—IDEAL 2007 8th International Conference, Birmingham, UK, 16–19 December 2007; Yin, H., Tino, P., Corchado, E., Byrne, W., Yao, X., Eds.; Springer: Berlin/Heidelberg, Germany, 2007; pp. 178–187. [Google Scholar]
- Urbanek, S. Package ‘Rserve’ Manual. 2012. Available online: https://cran.r-project.org/web/packages/Rserve/Rserve.pdf (accessed on 1 March 2018).
- Team, R.C. R: A Language and Environment for Statistical Computing. Available online: http://citeseerx.ist.psu.edu/viewdoc/download?doi=10.1.1.470.5851&rep=rep1&type=pdf (accessed on 1 March 2018).
- Stekhoven, D. Package ‘missForest’ Manual. 2016. Available online: https://cran.r-project.org/web/packages/missForest/missForest.pdf (accessed on 1 March 2018).
- Hu, Y.; Murray, W.; Shan, Y. Package ‘Rlof’ Manual. 2015. Available online: https://cran.r-project.org/web/packages/Rlof/Rlof.pdf (accessed on 1 March 2018).
- Hennig, C. Package ‘fpc’ Manual. 2018. Available online: https://cran.r-project.org/web/packages/fpc/fpc.pdf (accessed on 1 March 2018).
- Romanski, P.; Kotthoff, L. Package ‘FSelector’ Manual. 2016. Available online: https://cran.r-project.org/web/packages/FSelector/FSelector.pdf (accessed on 1 March 2018).
- Singh, K.; Kaur, R.; Kumar, D. Comment Volume Prediction Using Neural Networks and Decision Trees. In Proceedings of the 2015 17th UKSIM’15 UKSIM-AMSS International Conference on Modelling and Simulation, IEEE Computer Society, Washington, DC, USA, 25–27 March 2015; pp. 15–20. [Google Scholar]
- Ho, T.K. Random decision forests. In Proceedings of the IEEE Third International Conference on Document Analysis and Recognition, Montreal, QC, Canada, 14–16 August 1995; Volume 1, pp. 278–282. [Google Scholar]
- Faubel, F.; McDonough, J.; Klakow, D. Bounded conditional mean imputation with Gaussian mixture models: A reconstruction approach to partly occluded features. In Proceedings of the ICASSP 2009 IEEE International Conference on Acoustics, Speech and Signal Processing, Taipei, Taiwan, 19–24 April 2009; pp. 3869–3872. [Google Scholar]
- Zhao, Y. R and Data Mining: Examples and Case Studies; Academic Press: San Diego, CA, USA, 2012. [Google Scholar]
- Castillo, E.F.; Gonzales, W.F.; Corrales, D.C.; Lopez, I.D.; Hoyos, M.G.; Figueroa, A.; Corrales, J.C. Water quality warnings based on cluster analysis in Colombian river basins. Sist. Telemat. 2015, 13, 9–26. [Google Scholar] [CrossRef]
- Erman, J.; Arlitt, M.; Mahanti, A. Traffic Classification Using Clustering Algorithms. In Proceedings of the 2006 MineNet’06 SIGCOMM Workshop on Mining Network Data, Pisa, Italy, 11–15 September 2006; ACM: New York, NY, USA, 2006; pp. 281–286. [Google Scholar]
- Bitton, D.; DeWitt, D.J. Duplicate Record Elimination in Large Data Files. ACM Trans. Database Syst. 1983, 8, 255–265. [Google Scholar] [CrossRef]
- Corrales, D.C.; Lasso, E.; Ledezma, A.; Corrales, J.C. Feature selection for classification tasks: Expert knowledge or traditional methods? J. Intell. Fuzzy Syst. 2018. [Google Scholar]
- Kuhn, M. Caret package. J. Stat. Softw. 2008, 28, 1–26. [Google Scholar]
- Plackett, R.L. Karl Pearson and the chi-squared test. Int. Stat. Rev./Rev. Int. Stat. 1983, 51, 59–72. [Google Scholar] [CrossRef]
- Kent, J.T. Information gain and a general measure of correlation. Biometrika 1983, 70, 163–173. [Google Scholar] [CrossRef]
- Mitchell, T.M. Machine Learning; McGraw Hill: Burr Ridge, IL, USA, 1997; Volume 45, pp. 870–877. [Google Scholar]
- Roobaert, D.; Karakoulas, G.; Chawla, N.V. Information gain, correlation and support vector machines. Stud. Fuzziness Soft Comput. 2006, 207, 463–470. [Google Scholar]
- Coraddu, A.; Oneto, L.; Ghio, A.; Savio, S.; Anguita, D.; Figari, M. Machine learning approaches for improving condition-based maintenance of naval propulsion plants. Proc. Inst. Mech. Eng. Part M 2016, 230, 136–153. [Google Scholar] [CrossRef]
- Fanaee-T, H.; Gama, J. Event labeling combining ensemble detectors and background knowledge. Prog. Artif. Intell. 2014, 2, 113–127. [Google Scholar] [CrossRef]
- Candanedo, L.M.; Feldheim, V.; Deramaix, D. Data driven prediction models of energy use of appliances in a low-energy house. Energy Build. 2017, 140, 81–97. [Google Scholar] [CrossRef]
- Moro, S.; Rita, P.; Vala, B. Predicting social media performance metrics and evaluation of the impact on brand building: A data mining approach. J. Bus. Res. 2016, 69, 3341–3351. [Google Scholar] [CrossRef]
- Buza, K. Feedback Prediction for Blogs. In Data Analysis, Machine Learning and Knowledge Discovery; Spiliopoulou, M., Schmidt-Thieme, L., Janning, R., Eds.; Springer International Publishing: Cham, Switzerland, 2014; pp. 145–152. [Google Scholar]
- Zamora-Martinez, F.; Romeu, P.; Botella-Rocamora, P.; Pardo, J. On-line learning of indoor temperature forecasting models towards energy efficiency. Energy Build. 2014, 83, 162–172. [Google Scholar] [CrossRef]
- Langley, P.; Blum, A.L. Selection of relevant features in machine learning. Proc. AAAI Fall Symp. Relev. 1994, 184, 245–271. [Google Scholar]
- Guyon, I.; Elisseeff, A. An introduction to variable and feature selection. Introd. Var. Feature Sel. 2003, 3, 1157–1182. [Google Scholar]
- Saeys, Y.; Inza, I.; Larrañaga, P. A review of feature selection techniques in bioinformatics. Bioinformatics 2007, 23, 2507–2517. [Google Scholar] [CrossRef] [PubMed]
- Da Silva Jacinto, A.; da Silva Santos, R.; de Oliveira, J.M.P. Automatic and semantic pre-Selection of features using ontology for data mining on data sets related to cancer. In Proceedings of the International Conference on Information Society (i-Society 2014), London, UK, 10–12 November 2014; pp. 282–287. [Google Scholar]
Figure 1.
Number of papers found for each data quality issue [44].
Figure 1.
Number of papers found for each data quality issue [44].

Figure 2.
Process for data cleaning in regression models (DC-RM).

Figure 3.
Layer view of DC-RM.

Figure 4.
Form of the statistical information of the dataset.
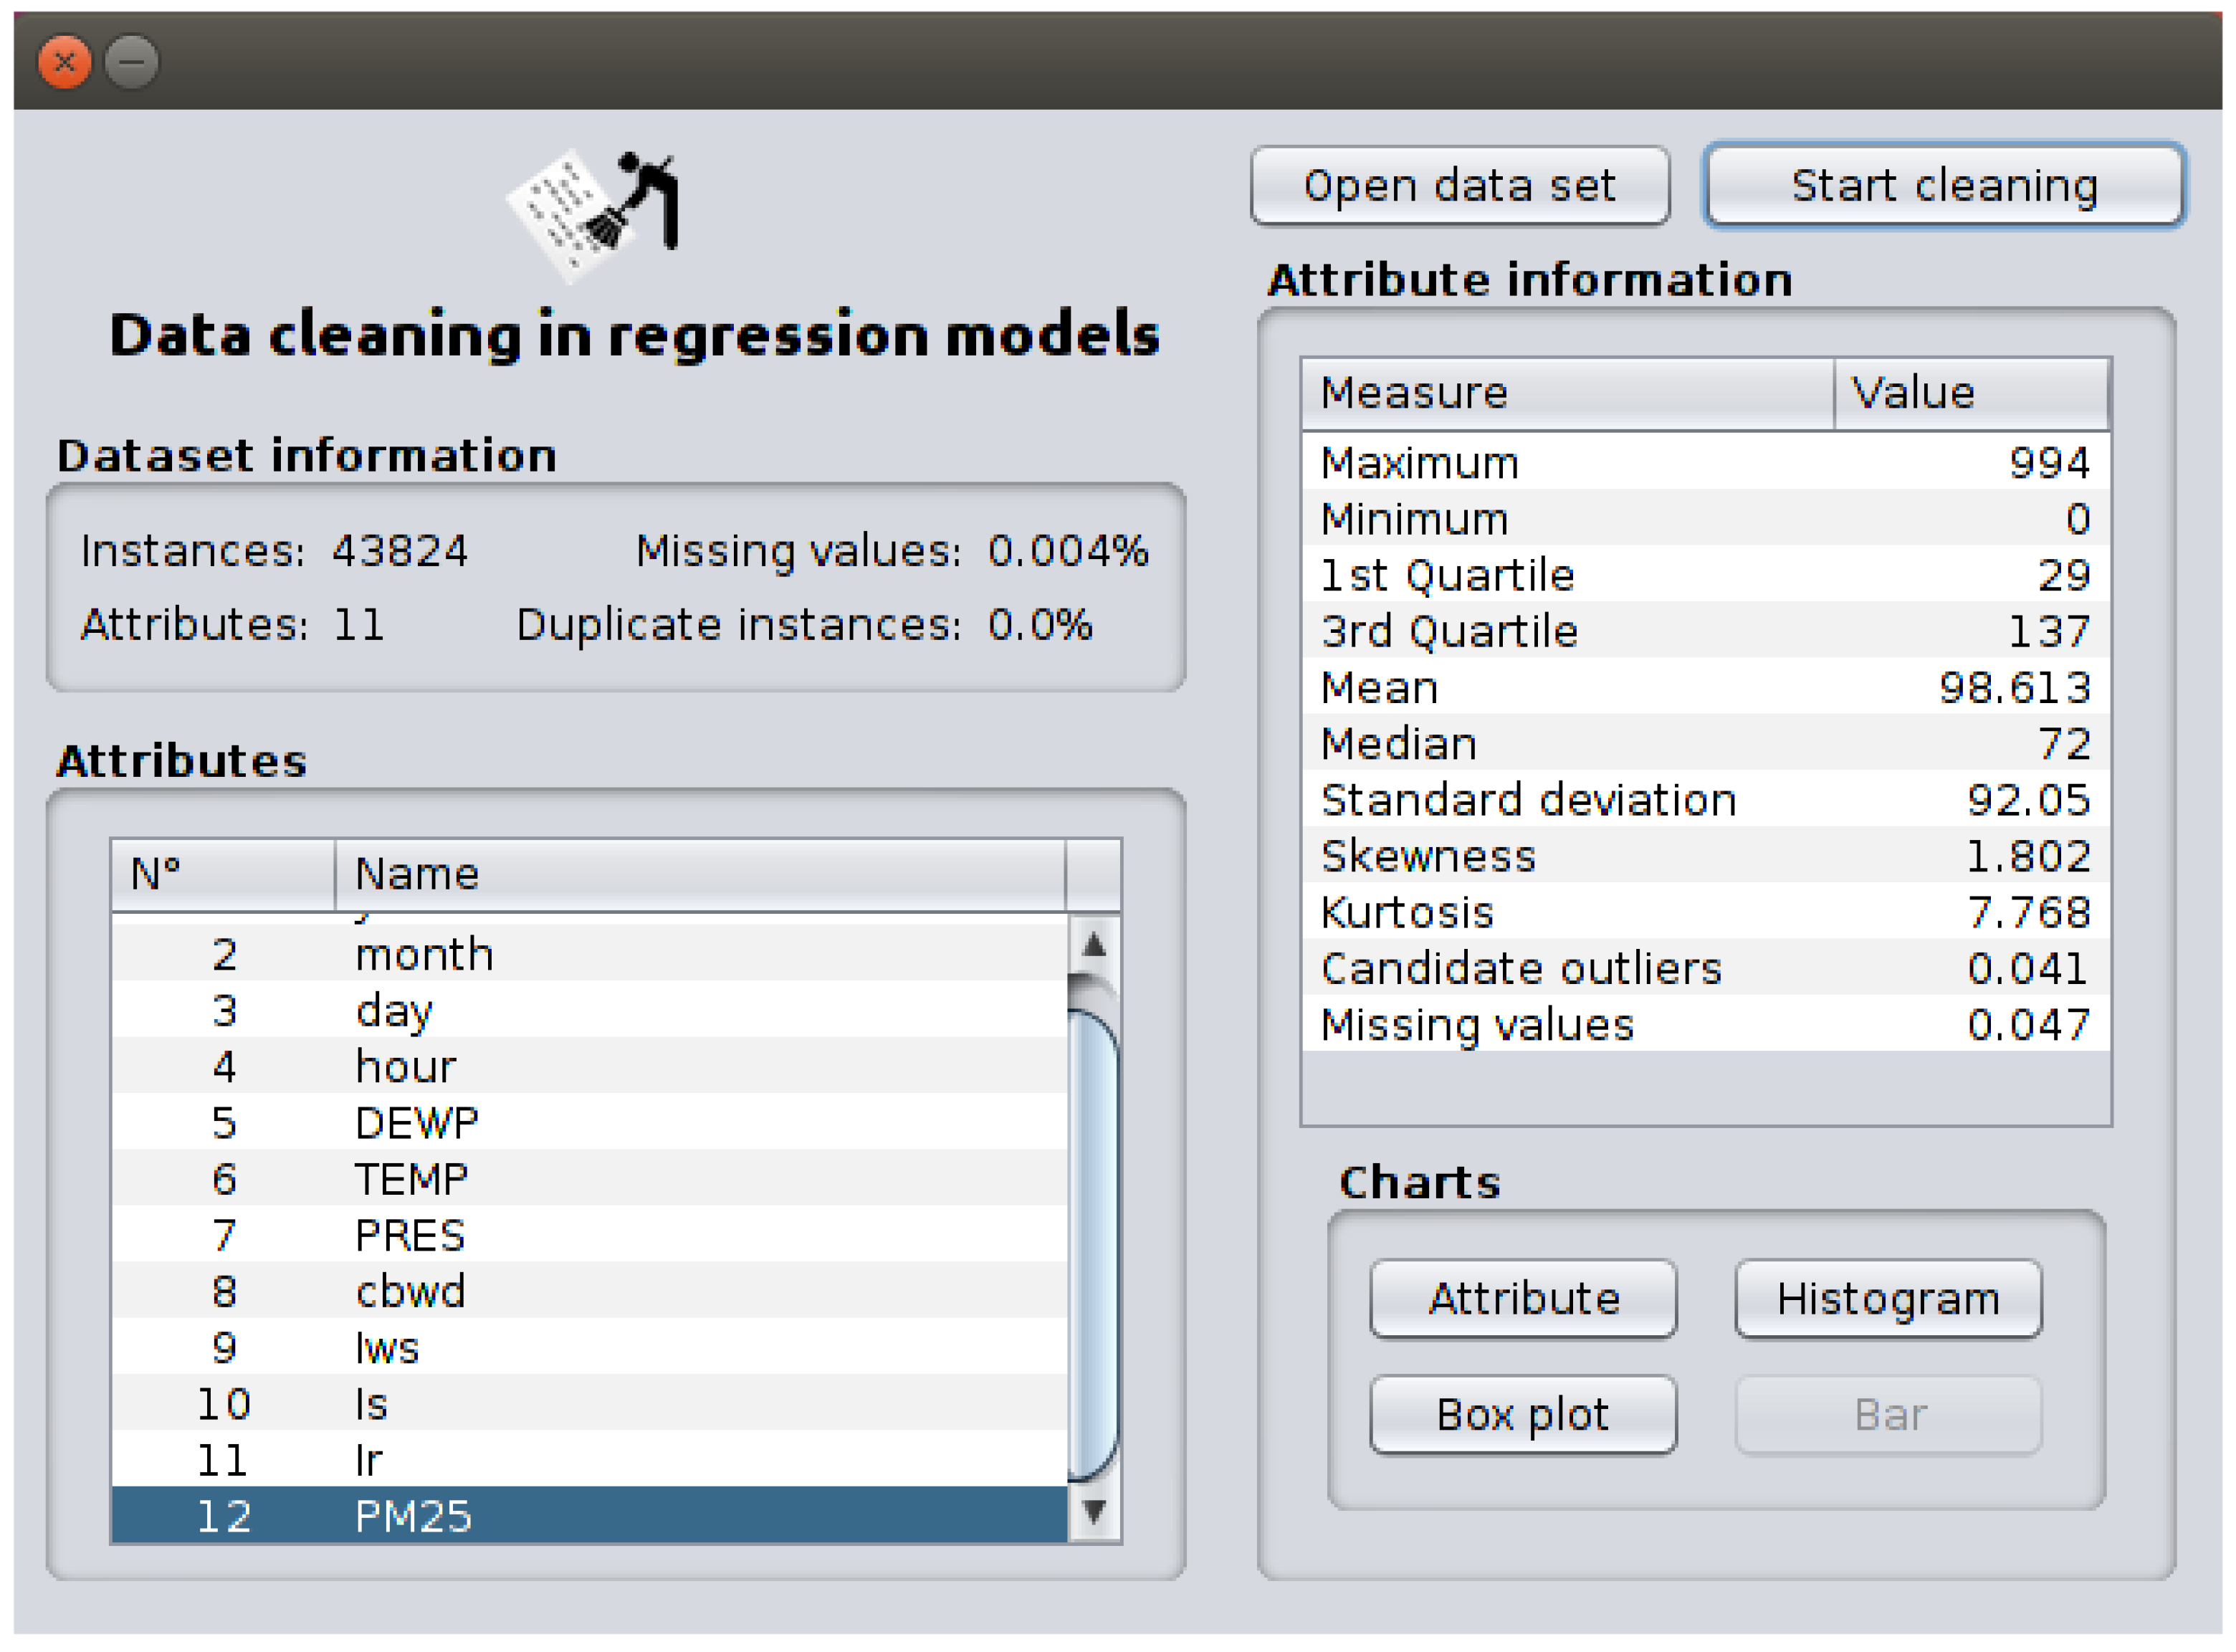
Figure 5.
Form of the DC-RM process.

Figure 6.
Data training—variant 1: imputed values for attribute 6.
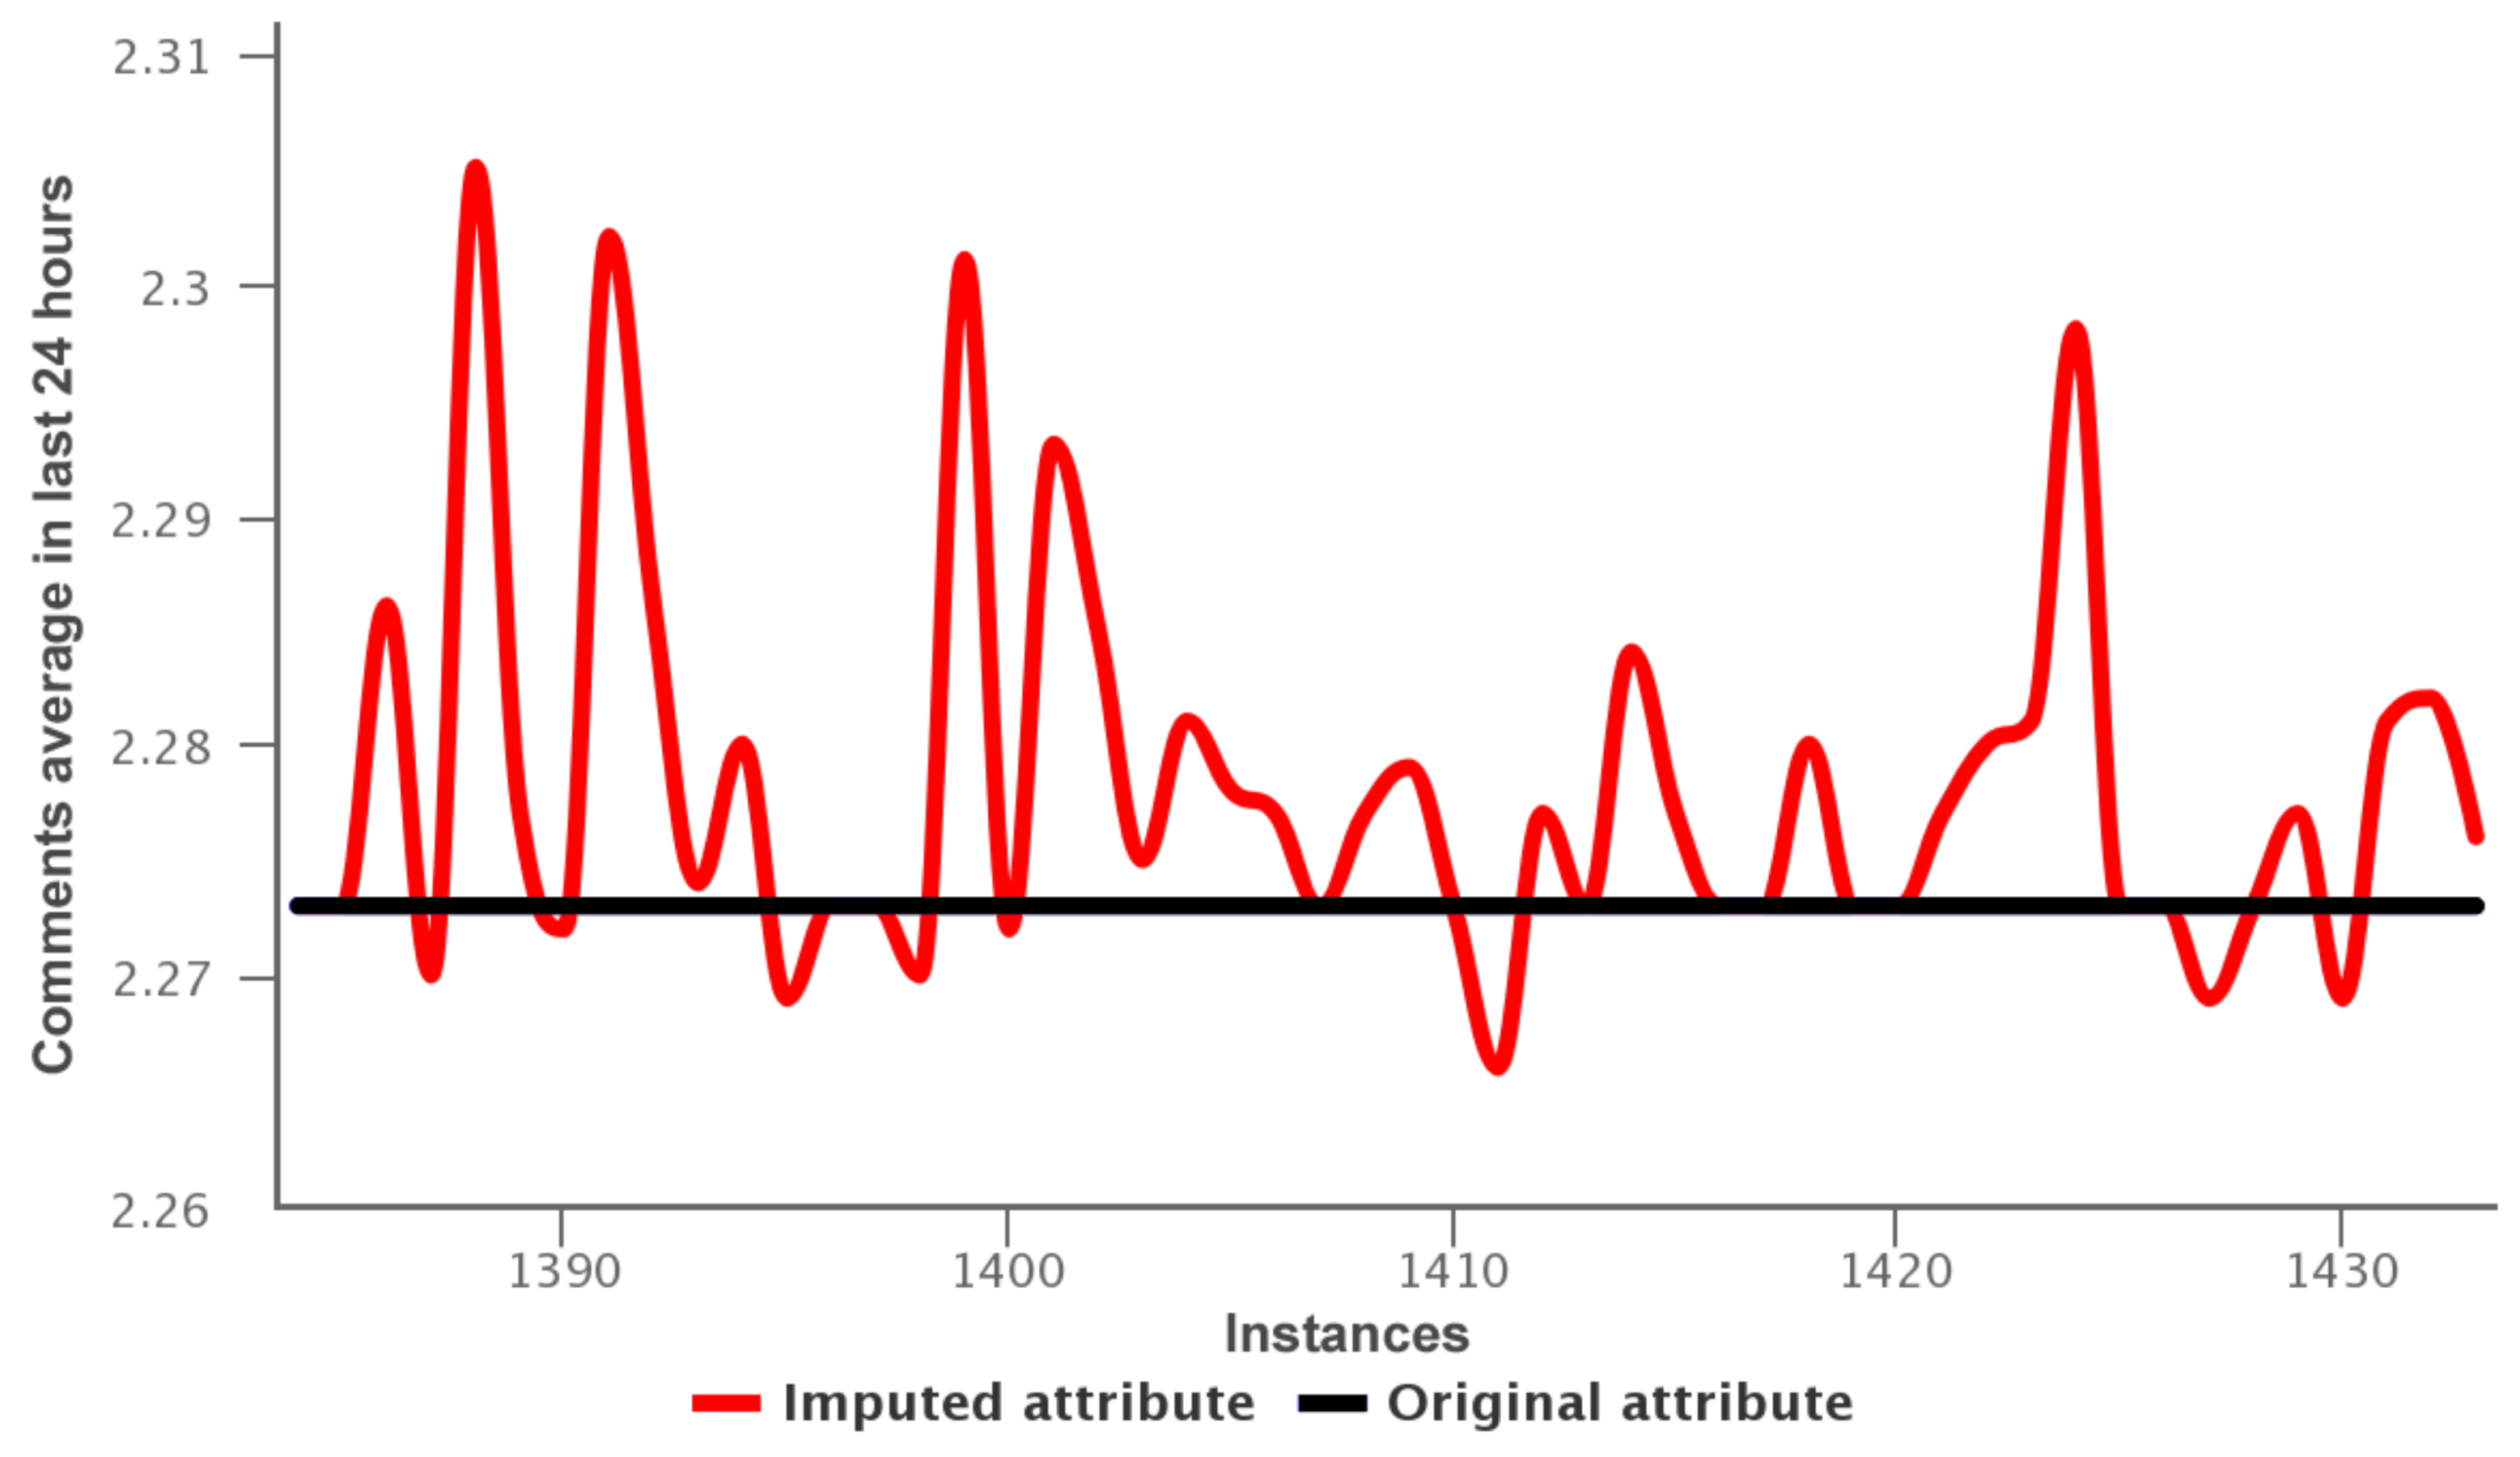
Figure 7.
Data training—variant 2: imputed values for attribute 31.
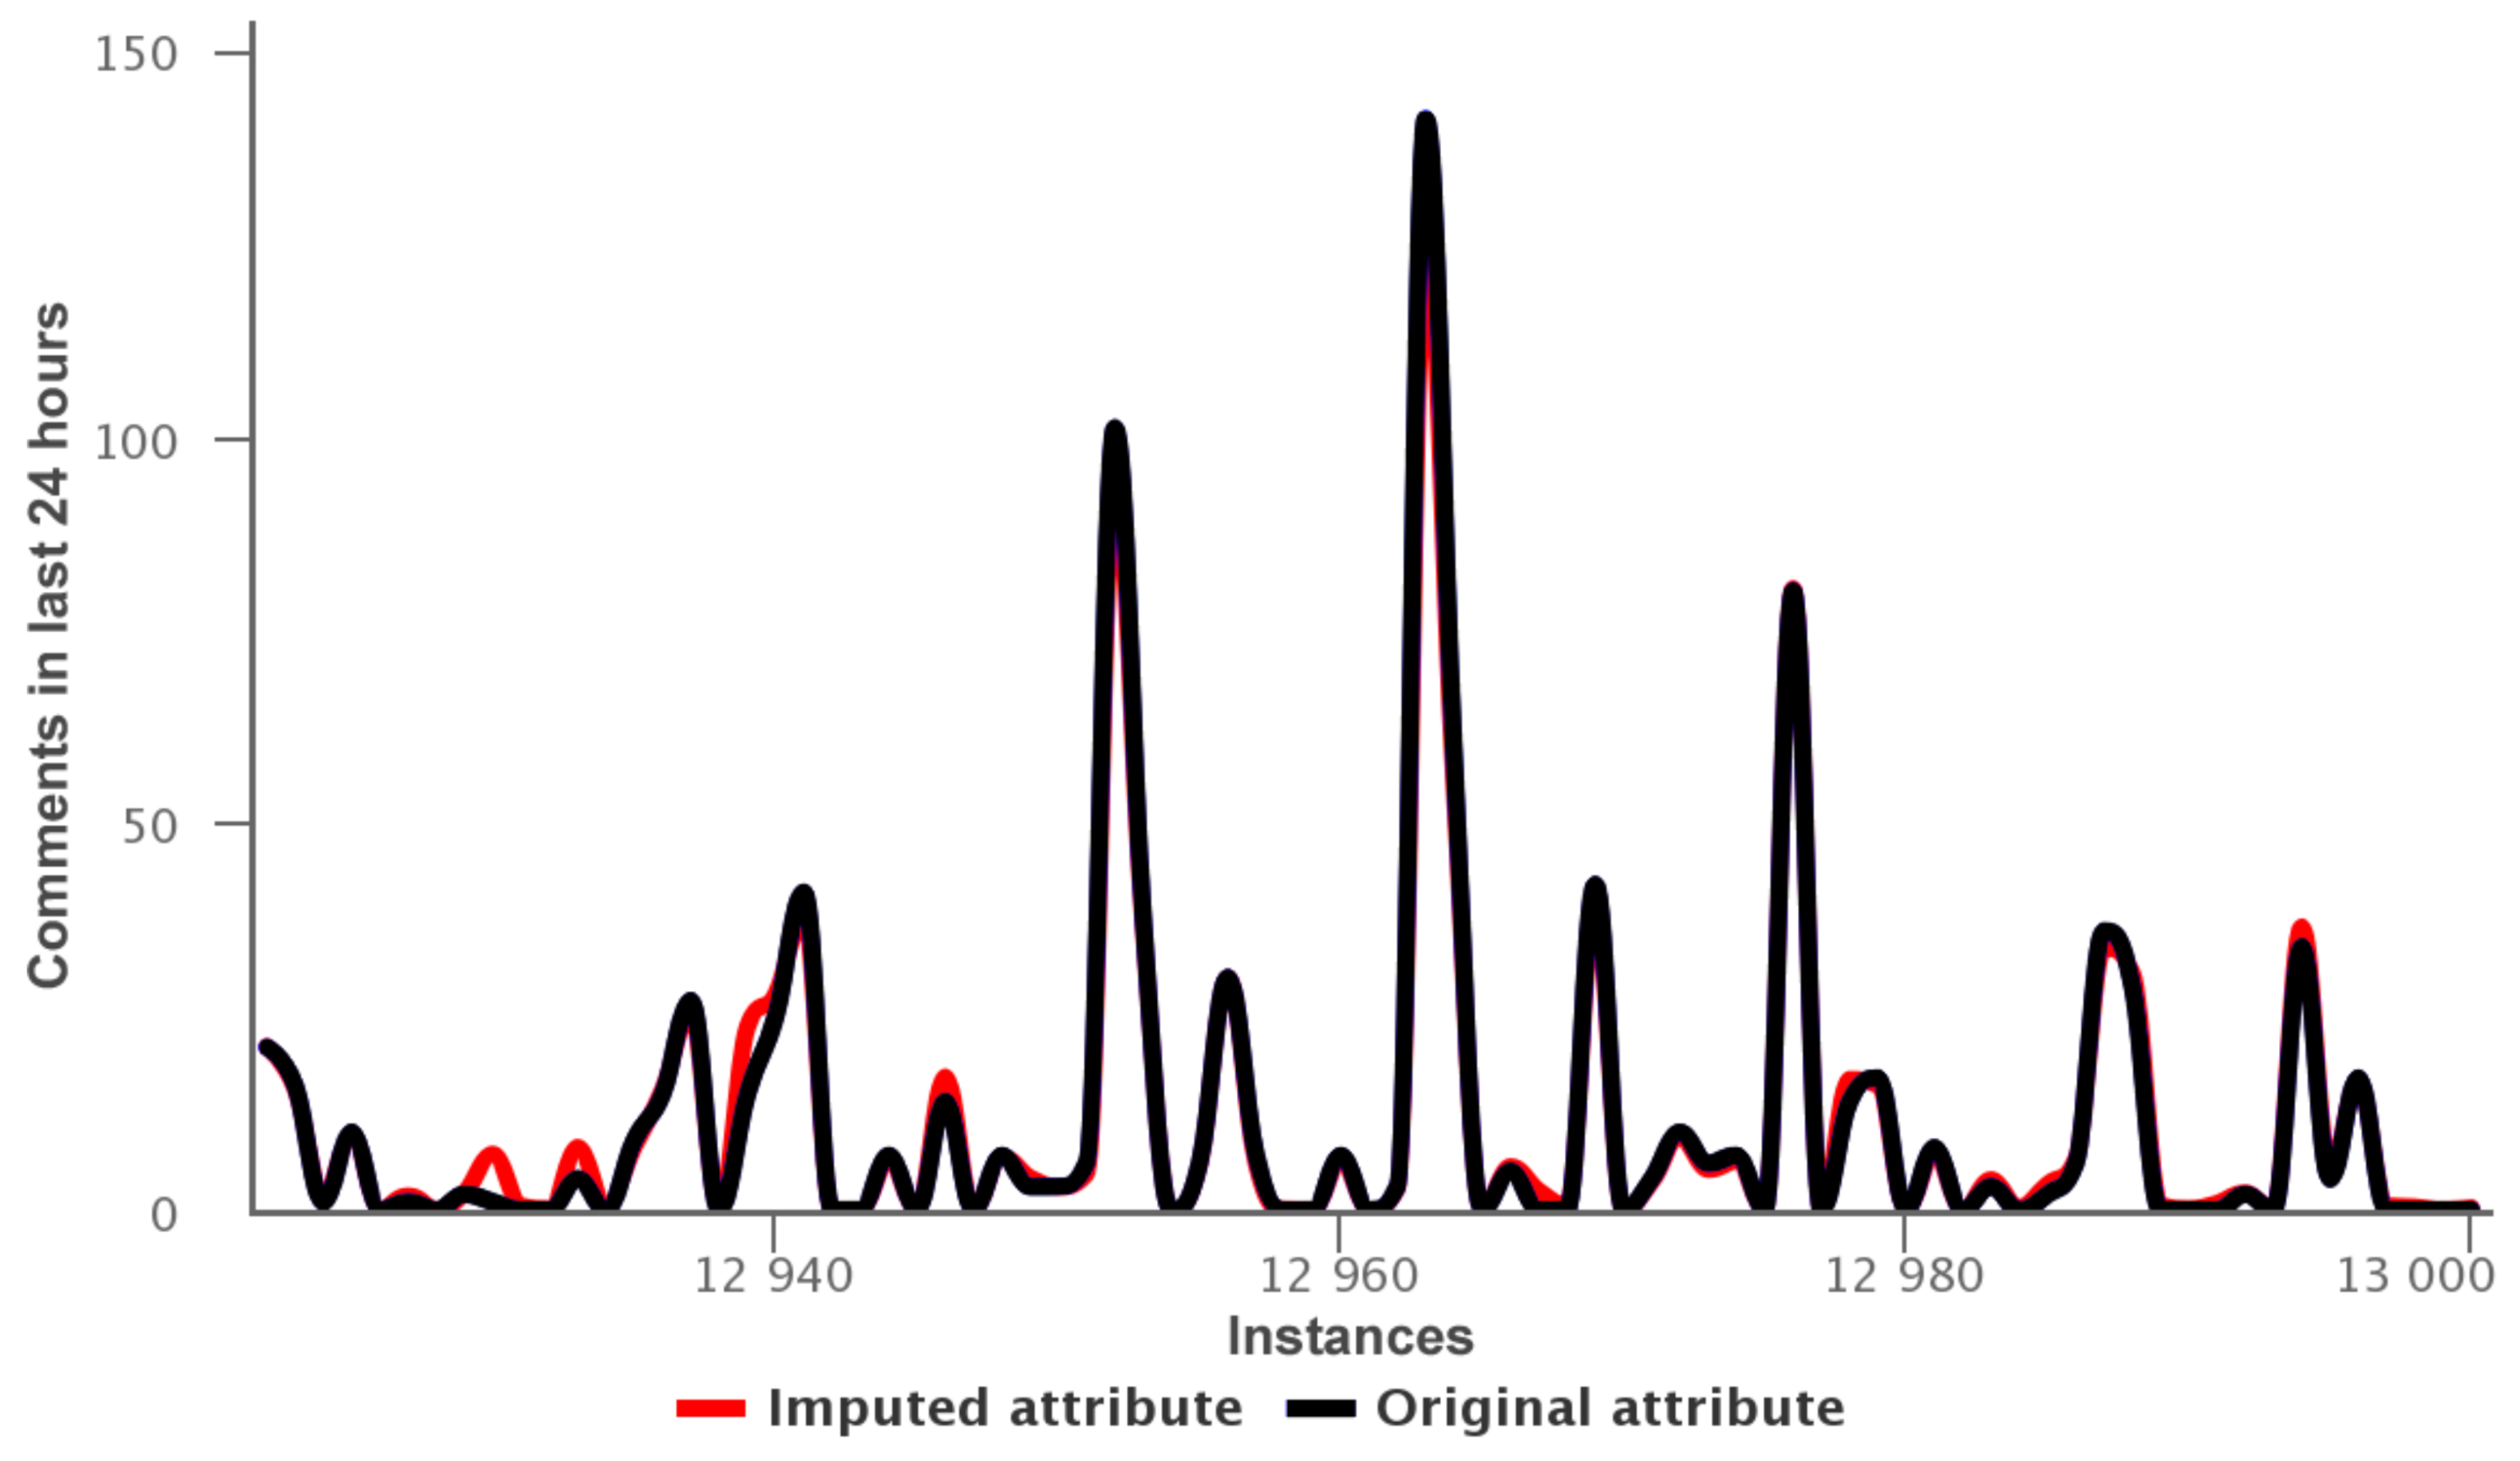
Figure 8.
Outliers for data training—variant 5.
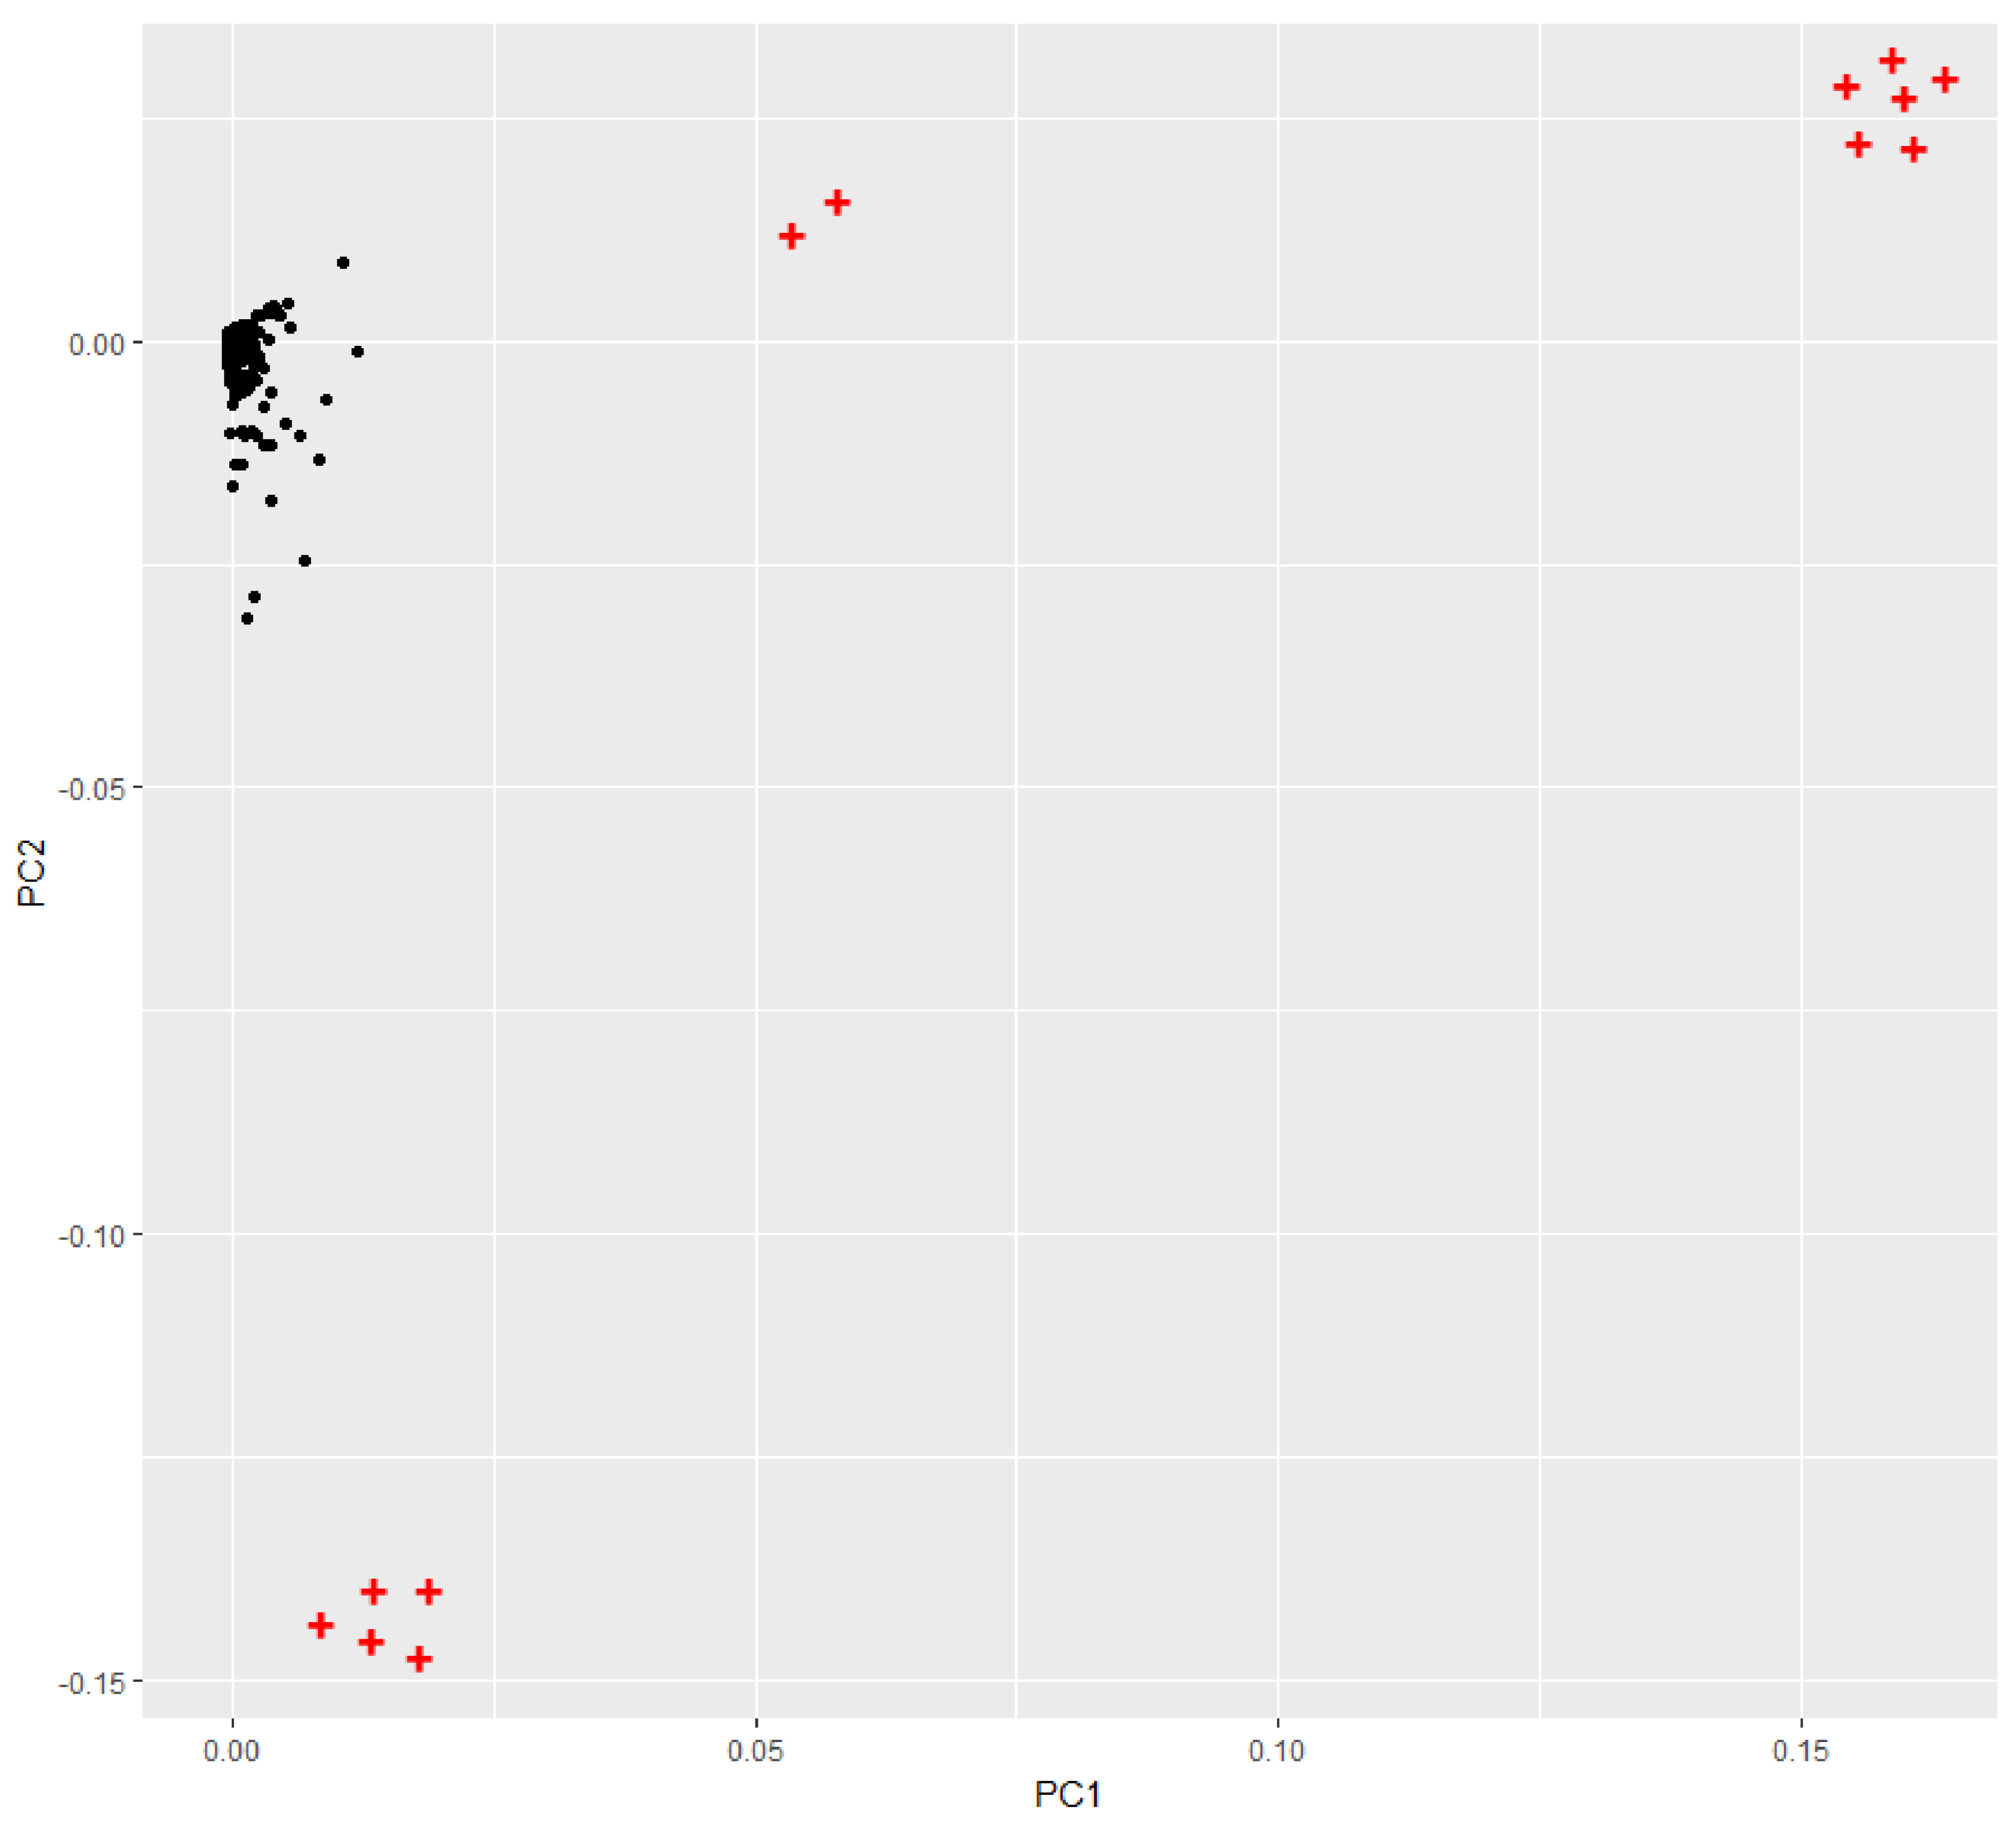
Figure 9.
Absolute correlation obtained by Chi-squared and Information gain for datasets: Variant 1, 2, 3, 4 and 5.
Figure 9.
Absolute correlation obtained by Chi-squared and Information gain for datasets: Variant 1, 2, 3, 4 and 5.

Table 1.
Related works.
| Works | Domain | Data Quality Issues |
|---|---|---|
| [16,21,22,23,24,25,26] | Databases | Integrity constraints, validation of overloaded table, duplicate records, inconsistencies, missing values, data freshness. |
| [9,27,28,29,30] | Conceptual | Incomplete data, out-of-date data, lack of meta-data, high time to understand data |
| [31,32,33,34,35,36,37,38] | Health systems | Data heterogeneity, illegible handwriting, missing values, duplication of patient records, inconsistency, unsuitable data format, timeliness, inaccuracy. |
| [39,40,41] | Wind energy, seismic waves, electricity consumption | Data heterogeneity, missing values, out-of-date data, noise, outliers, inconsistency |
| [19,20] | Big data | Missing values, timeliness, contextual adequacy, operational adequacy, temporal adequacy |
Table 2.
Data cleaning tasks in regression models.
| Noise Issue | Data Cleaning Task |
|---|---|
| Missing values | Imputation |
| Outliers | Outlier detection |
| High dimensionality | Dimensionality reduction |
| Duplicate instances | Remove duplicate instances |
Table 3.
Instances of dataset for prediction of comments in Facebook posts.
| Data Training | Instances |
|---|---|
| Variant 1 | 40.949 |
| Variant 2 | 81.312 |
| Variant 3 | 121.098 |
| Variant 4 | 160.424 |
| Variant 5 | 199.030 |
Table 4.
Mean absolute error for imputation methods.
| Dataset | Attribute Index | Random Forest | Mean Imputation |
|---|---|---|---|
| Variant 1 | 6 | 0.011 | 97.749 |
| 26 | 0.001 | 1.752 | |
| 44 | 0.017 | 0.237 | |
| Variant 2 | 15 | 0.009 | 287.652 |
| 31 | 1.214 | 18.624 | |
| 8 | 5.86 × 10 | 35.803 | |
| Variant 3 | 22 | 0 | 26.665 |
| 48 | 0.004 | 0.203 | |
| 3 | 0.003 | 6.546 | |
| Variant 4 | 13 | 3.6 × 10 | 126.782 |
| 49 | 0.010 | 0.233 | |
| 17 | 2.47 × 10 | 4.896 | |
| Variant 5 | 12 | 3.09 × 10 | 7.172 |
| 29 | 0.135 | 54.445 | |
| 52 | 0.006 | 0.223 |
Table 5.
Outliers detected by LOF and DBSCAN.
| Data Training | LOF | DBSCAN |
|---|---|---|
| Variant 1 | 7 | 134 |
| Variant 2 | 2 | 113 |
| Variant 3 | 6 | 97 |
| Variant 4 | 11 | 179 |
| Variant 5 | 13 | 219 |
Table 6.
Duplicate instances for each data training set.
| Data Training | Duplicate Instances |
|---|---|
| Variant 1 | 8 |
| Variant 2 | 21 |
| Variant 3 | 59 |
| Variant 4 | 88 |
| Variant 5 | 136 |
Table 7.
Mean absolute error obtained by: DC-RM and [76].
Table 7.
Mean absolute error obtained by: DC-RM and [76].
| Approach | Model | Var 1 | Var 2 | Var 3 | Var 4 | Var 5 |
|---|---|---|---|---|---|---|
| DC-RM | MLP | 34.55 | 31.31 | 35.19 | 38.59 | 55.17 |
| RBF | 31.09 | 31.85 | 30.12 | 29.81 | 29.69 | |
| REP | 29.28 | 30.22 | 28.41 | 27.89 | 29.33 | |
| M5P | 35.53 | 30.32 | 32.68 | 50.77 | 32.59 | |
| Overall | 32.61 | 30.92 | 31.60 | 36.76 | 34.19 | |
| [76] | MLP | 38.24 | 40.72 | 36.40 | 51.49 | 44.93 |
| RBF | 31.38 | 30.08 | 30.22 | 32.67 | 31.37 | |
| REP | 27 | 28.67 | 27.92 | 27.47 | 27.72 | |
| M5P | 30.15 | 36.90 | 32.33 | 35.69 | 116.98 | |
| Overall | 31.69 | 34.09 | 31.71 | 41.33 | 55.25 |
Table 8.
Mean absolute errors of the models processed by DC-RM and datasets authors of UCI repository.
Table 8.
Mean absolute errors of the models processed by DC-RM and datasets authors of UCI repository.
| Dataset | Ref. | Approach | Model | MAE |
|---|---|---|---|---|
| Compressor decay | [89] | DC-RM | SVR | 0.005 |
| Authors | SVR | 0.17 | ||
| Turbine decay | [89] | DC-RM | SVR | 0.003 |
| Authors | SVR | 0.001 | ||
| Rental Bikes Hourly | [90] | DC-RM | LR | 1 × 10 |
| Authors | LR | 0.017 | ||
| Rental Bikes Daily | [90] | DC-RM | LR | 5 × 10 |
| Authors | LR | 0.031 | ||
| Energy use of appliances | [91] | DC-RM | RF | 12.03 |
| Authors | RF | 11.97 | ||
| Posts in Facebook pages | [92] | DC-RM | SVR | 25.26 |
| Authors | SVR | 26.9 | ||
| Feedback Blogs Prediction | [93] | DC-RM | M5P | 5.70 |
| Authors | M5P | 6.06 | ||
| I-Room temperature | [94] | DC-RM | MLP | 0.47 |
| Authors | MLP | 1.13 | ||
| II-Room temperature | [94] | DC-RM | MLP | 0.34 |
| Authors | MLP | 0.88 | ||
| I-Dinning room temperature | [94] | DC-RM | MLP | 0.43 |
| Authors | MLP | 0.89 | ||
| II-Dinning room temperature | [94] | DC-RM | MLP | 0.32 |
| Authors | MLP | 0.78 |
© 2018 by the authors. Licensee MDPI, Basel, Switzerland. This article is an open access article distributed under the terms and conditions of the Creative Commons Attribution (CC BY) license (http://creativecommons.org/licenses/by/4.0/).
Share and Cite
MDPI and ACS Style
Corrales, D.C.; Corrales, J.C.; Ledezma, A. How to Address the Data Quality Issues in Regression Models: A Guided Process for Data Cleaning. Symmetry 2018, 10, 99. https://doi.org/10.3390/sym10040099
AMA Style
Corrales DC, Corrales JC, Ledezma A. How to Address the Data Quality Issues in Regression Models: A Guided Process for Data Cleaning. Symmetry. 2018; 10(4):99. https://doi.org/10.3390/sym10040099
Chicago/Turabian StyleCorrales, David Camilo, Juan Carlos Corrales, and Agapito Ledezma. 2018. "How to Address the Data Quality Issues in Regression Models: A Guided Process for Data Cleaning" Symmetry 10, no. 4: 99. https://doi.org/10.3390/sym10040099
Note that from the first issue of 2016, this journal uses article numbers instead of page numbers. See further details here.