Data Decision and Drug Therapy Based on Non-Small Cell Lung Cancer in a Big Data Medical System in Developing Countries


1
School of Information Science and Engineering, Central South University; Changsha 410083, China
2
“Mobile Health” Ministry of Education-China Mobile Joint Laboratory, Changsha 410083, China
3
School of Software, Central South University; Changsha 410083, China
4
PET-CT Center, the Second Xiangya Hospital of Central South University, Changsha 410083, China
*
Authors to whom correspondence should be addressed.
Symmetry 2018, 10(5), 152; https://doi.org/10.3390/sym10050152
Submission received: 25 February 2018
/
Revised: 23 April 2018
/
Accepted: 9 May 2018
/
Published: 10 May 2018
(This article belongs to the Special Issue Novel Machine Learning Approaches for Intelligent Big Data)
Abstract
:In many developing or underdeveloped countries, limited medical resources and large populations may affect the survival of mankind. The research for the medical information system and recommendation of effective treatment methods may improve diagnosis and drug therapy for patients in developing or underdeveloped countries. In this study, we built a system model for the drug therapy, relevance parameter analysis, and data decision making in non-small cell lung cancer. Based on the probability analysis and status decision, the optimized therapeutic schedule can be calculated and selected, and then effective drug therapy methods can be determined to improve relevance parameters. Statistical analysis of clinical data proves that the model of the probability analysis and decision making can provide fast and accurate clinical data.
1. Introduction
Life, in developing countries, cannot be protected by medicine, because the medical technology is underdeveloped, and the population is large. One of the results is that patients with a light illness may get serious and even disastrous infections. Finally, developing countries have to expend a great amount of personnel and finances to solve the problem. In 2003, the Severe Acute Respiratory Syndromes (SARS) virus affected Asia and caused serious consequences [1]. Over thousands of people were affected, and many of them died of this epidemic disease. The same situation happens in many Africa countries. The Ebola virus [2] broke out in 2015 because the first few patients did not obtain timely treatment. In those countries, underdeveloped medical technology and few doctors accelerated virus diffusion.
China is a developing country in Asia, and it has the highest population in the world. According to statistical data from China’s Ministry of Health in 2015, a country with a population of more than 1.4 billion, over an average of 5800 people may share only one doctor. For a doctor in the big city, he or she may treat over 57 patients per day. At the end of 2015, a hospital treats over 1 million patients on average, especially in super cities, such as Beijing and Shanghai, an advanced hospital treats over 3.8 million patients a year. The same situation happens in many developing or underdeveloped countries.
Besides large population, limited medical resources and underdeveloped medical technology can also affect high death rate in many developing countries, especially related to the cancer research field. In China, lung cancer has become the first leading cause of death in these years, which has experienced a dramatic increase in the cigarette smoking rate during the past two decades [3]. Non-small cell lung cancer (NSCLC) accounts for 85% of lung cancer and the five-year survival rate is only 15%. Approximately 70% of patients with lung cancer commonly present with locally advanced or distant metastasis at the time of diagnosis, which was a difficult condition to manage, due to the lack of effective treatments [4]. However, if a patient can be diagnosed in the early stage, the 5-year survival rate can be raised to 80% [5,6]. Therefore, the early diagnosis of lung cancer has important significance for the prognosis of this tumor.
Moreover, many effective therapeutic methods cannot be popularized. On the one hand, limited medical technology with some doctors in underdeveloped area or hospitals cannot judge complicated cancer tumor. On the other hand, even if they know how to make a correct conclusion, underdeveloped medical technology and cannot burden advanced medical technology.
When we face some complex environments, such as large population, medical resources, and malignant disease, developing countries should improve those problems by information science technology.
How to design decision-making and auxiliary system serving for developing or underdeveloped counties is very big challenging problem, because over 3 billon people live in developing or underdeveloped counties.
The development of medical information systems in developing and underdeveloped countries can generate good results. With effective medical resources and through a medical information system, the doctor can perform decision analysis. The probability of getting sick assists doctors in disease diagnosis and decision making, thereby shortening treatment time and preventing misdiagnosis. According to decision analysis in medical systems, this feature may be applied in mobile heath when hospitals, doctors, patients, and their relationships combine a communication system in wireless networks. Doctors, patients, and their relationships only carry their mobile devices, they can transmit health information to any roles in this system and share effective messages anywhere, even without a signal. Medical systems may diagnose diseases and electronic records after they have received effective messages. A medical information system does not only quickly and effectively provide medical information to the patient and family, but also reduces the pressure of obtaining resources, such as hospital choice.
In this research, we build a system model on drug therapy, relevance parameters analysis, data decision making on non-small cell lung cancer (NSCLC), which will be used to calculate the transition probability of the disease in four different stages, and acquire the optimized therapeutic schedule. The main objectives of this paper are
- (1)
- to establish a kind of condition based on the evolution stages of NSCLC, to divide NSCLC disease diagnosis parameters evolution process;
- (2)
- to use effective parameter selection method on big data for mining the maximum effects of three kinds of related parameters in each of the evolutionary processes;
- (3)
- to effectively reduce the probability of malignant disease development through effective combination of drug therapy methods; and
- (4)
- to prove, by clinical data statistical analysis, that the model of the probability analysis and decision making can provide fast and accurate clinical data for decision-making advice.
2. Related Works
Many research methods with computer science are widely applied in the medical field.
Pujol et al. [7] designed eXiTCDSS medical decision support system. This system uses a case-based reasoning engine to retrieve similar cases. In eXiTCDSS, cases are stored in a comma-separated value (CSV) format. A case consists of multiple attributes; each property is represented by a column in the CSV. The property type includes the Boolean, text type, and type. The weight of each type is per-allocated to case similarity calculation. In this system, the cases in every attribute are associated with the elements in the clinical diagnosis and treatment process; therefore, eXiTCDSS is mainly used in medical decisions to support workflow.
Susana et al. [8] compares the cases based on the inductive and deductive reasoning characteristics, and put forward a combination of advantages from both systems to support the diagnosis and treatment process. To increase the basis for case reasoning method, Pfister et al. [9] recommended treatment availability and used the explanation, in text form, of the relationship between the patient and the explained recommended precedent. Literature [10] found that based on case reasoning and other methods, such as BP (brief introduction of back propagation) neural network, the combination of models has a better performance in liver disease diagnosis.
Tan et al. [11] introduced the time series data of breathing patterns based on case reasoning to improve diagnosis decision making. By integrating, first, the system in HIS of knowledge, the discovered model defines a series of breathing patterns related to the diagnosis, and calculates the new breathing pattern of the patient and the similarity system classification model, in advance, to obtain the final diagnosis.
Chen et al. [12] proposed a method based on text similarity and on the use of Word Net. This paper proposes a method based on the dictionary similarity calculation method of similarities between entities in different ontologies. In addition, a kind of algorithm [13], which is based on the rules of ontology matching algorithm, is the core idea that uses the association rules of discovery algorithm, and finds hidden relevance in ontology. In literature [14], the inclusion relation existing in the real world was concluded to be far greater than equivalence relation; thus, the discovery of the hierarchical relationships between things is important. Therefore, it puts forward a hybrid, extensible, and asymmetric matching algorithm. Through association rule mining, this algorithm can determine the level of the relationship between entities. In the literature [15], the author discussed the difference between open and closed world; this paper further proposed a horn rule mining method based on the open world assumption, which was used to realize the heterogeneous knowledgebase identity matching. However, this method of gaining confidence in association rules is often inaccurate, which leads to the emergence of a large number of false connections; thus, its practical application was not given attention [16,17,18].
In the literature [19] assumes that cases, such as production function and similar case retrieval methods, are successful, based on case reasoning method integrated into the key to hospital information system (HIS). In that study, case data structures are defined and modified by the doctor. Case data were extracted from the patient’s electronic medical records, in order to realize the reuse of medical experience. When a new patient is enrolled into the system, the system uses the weighted K-nearest neighbor algorithm to retrieve the most similar cases. Cases benefit from the production function, which enhances the flexibility of knowledge extraction; however, the workload of doctors in the maintenance of the case library is certainly increased [20,21,22,23].
The present study will analyze, based on disease stage, effective selection, and associated data tracking, and effective treatment decision-making model of three aspects of medical information system design.
3. Model Design
In the study of modern medicine, an intelligent diagnosis assists the doctor in condition analysis and judgment, which can effectively shorten diagnosis time and reduce the probability of misdiagnosis. The model proposed an intelligent diagnosis scheme. Meanwhile, the doctors also obtain a secondary judgment based on this model; they not only establish a comprehensive analysis of patients, but also provide a secondary diagnosis to provide precise medical treatment.
3.1. The Process of Drug Therapy and Decision-Making
In NSCLC, conventional clinical staging is most often performed with computed tomography (CT) of the thorax and upper abdomen. Nevertheless, CT imaging has limited sensitivity for distal metastatic disease, and is frequently unable to discriminate between malignant and benign lymph nodes. As a noninvasive and useful inspection method, 18F-FDG PET/CT is commonly referred for evaluation of primary neoplastic lesions and exploration of any possible metastasis. It has greater sensitivity for the detection of metabolically active malignant disease, and can lead to changes in initial staging and treatment plans for NSCLC.
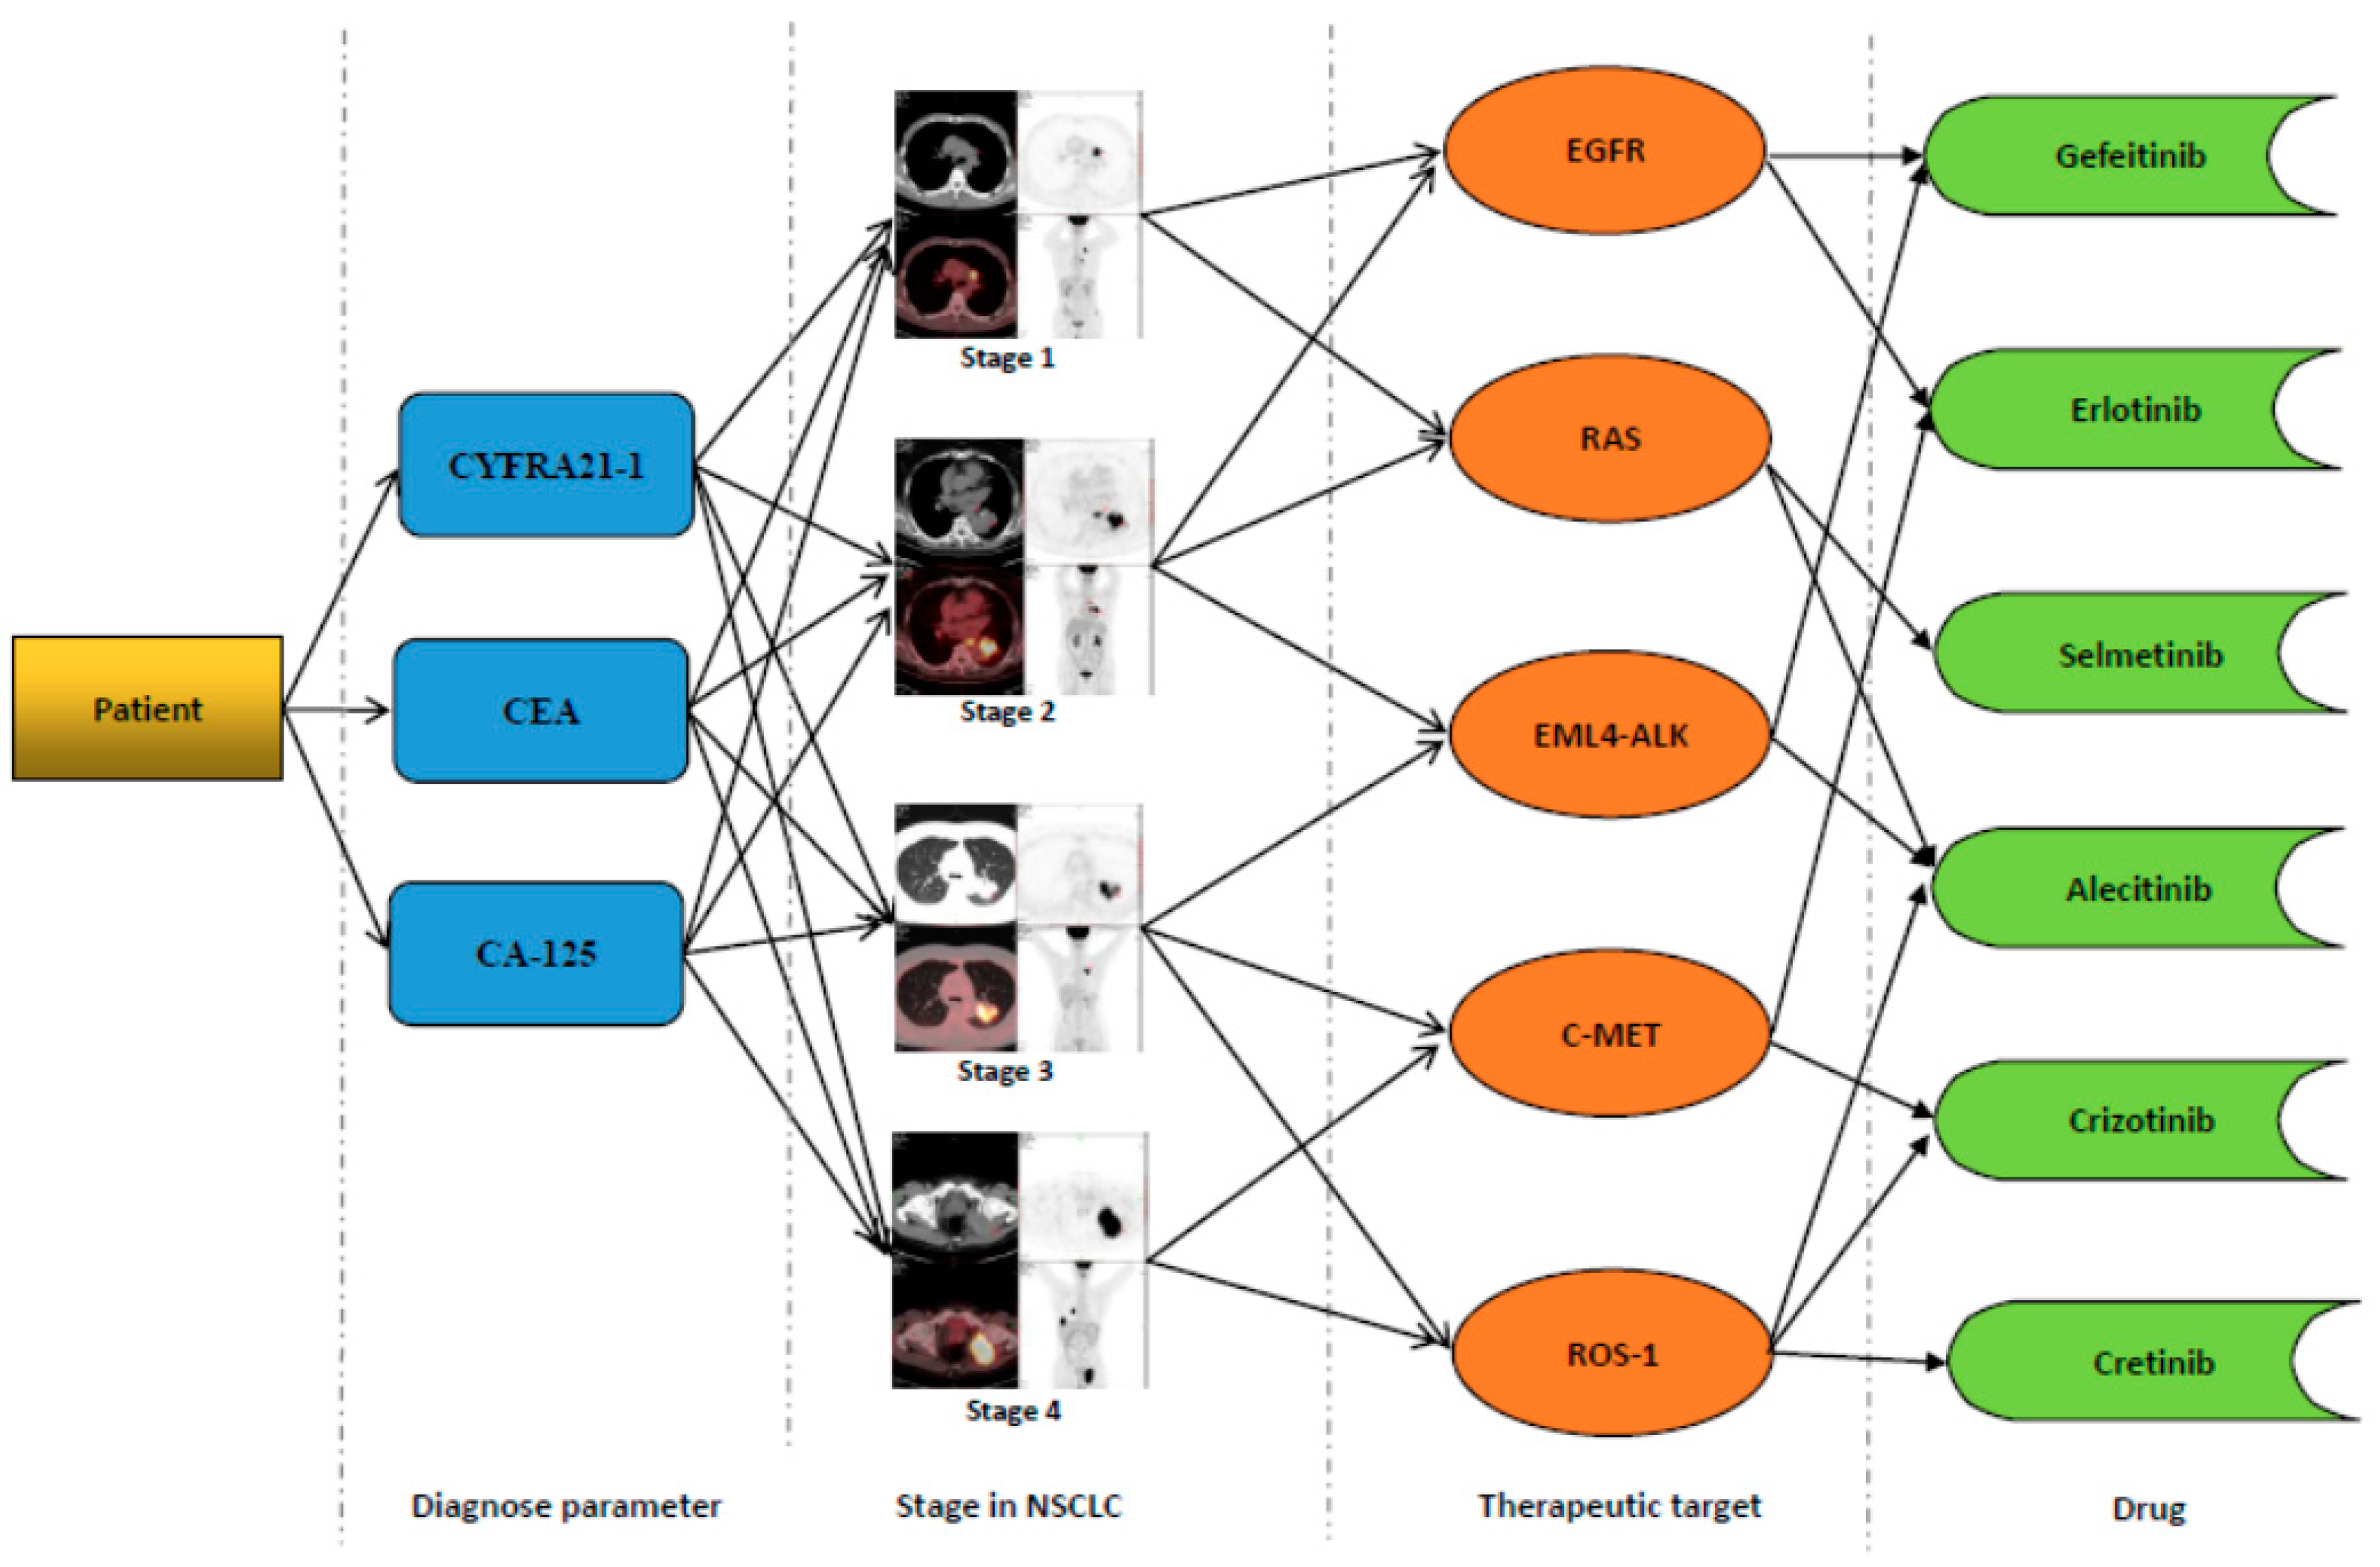
Figure 1 shows the process of drug therapy and decision-making. It can be divided into some steps.
- (1)
- Diagnosis parameter decision-making. In NSCLC, the serum tumor markers are mainly produced by the tumor cells and in healthy people, and the detailed values are always in the normal range. However, in patients with malignant tumor, especially for the advanced cancer patients, the levels of tumor markers have a negative correlation with the survival time. The main tumor markers related to relevance parameter and decision data with NSCLC include soluble fragment of cytokeratin (CYFRA21-1), carcinoembryonic antigen (CEA), cancer antigen (CA)-125, which are always considered as the prognostic indicators, especially in the advanced stage of NSCLC.
Given that the three parameters for more than 95% of NSCLCs have an apparent correlation, the three parameters are calculated for the preliminary evaluation of NSCLC patients at stage one to select an effective treatment for the next step.
NSCLC stage division usually adopts various machine scanning parameter values to determine how sick and which stage the patient is in. We set a stage decision value , which represents the diagnosis parameters and decision data in t time diagnosis value of the calculation results.
The diagnosis parameter value includes three parts, namely, cytokeratin (CYFRA21-1) value of , carcinoembryonic antigen (CEA) value of , and cancer antigen (CA)-125 . Thus, diagnosis parameter value can be represented as
Among them, , , and are influential factors, . , , and are in a certain area for the past five years. Moreover, cytokeratin (CYFRA21-1), carcinoembryonic antigen (CEA), and cancer antigen (CA)-125 values, age averaged, and the range of normal parameter values of the region, were determined.
- (2)
- Stage in NSCLC. Combination of detection in tumor markers and PET screening in NSCLC patients can provide the accuracy of early diagnosis and staging of lung cancer. Most patients with stage I to II NSCLC benefit from surgical resection, whereas patients with more advanced disease (stage III to IV) are candidates for nonsurgical treatment. Chemotherapy is beneficial for palliation in patients with locally advanced and metastatic disease.
In the judgment of NSCLC, can generally be divided into four different critical regions. Figure 1 shows the four different critical regions. The range of can measure the patient’s current time t, which is the stage of illness. In NSCLC, we can define is value at the threshold, . For , . It shows which stage is patient may sicken.
- (3)
- Therapeutic target. This part provides patients with data through the machine regarding the changes in the diseases associated with NSCLC. For each stage of NSCLC, the therapeutic target contains the following:
- Stage 1: the epidermal growth factor receptor (EGFR) mutations comprised 40% of NSCLC patients.
- RAS mutations in lung adenocarcinoma accounted for approximately 30% of NSCLC
- Stage 2: the EGFR mutations constituted 15% of NSCLC patients.
- RAS mutations in lung adenocarcinoma constituted approximately 38% of NSCLC
- EML4—ALK fusion gene accounted for 25% of NSCLC patients.
- Stage 3: EML4—ALK fusion gene, 43% of patients with NSCLC.
- C—MET amplification comprised 41% of NSCLC
- gene fusion accounted for 12% of NSCLC
- Stage 4: C—MET amplification accounted for 28% of NSCLC
- ROS1 gene fusion accounted for 56% of NSCLC
During the process of determining NSCLC, the targets for determining the probability of each possible, all had a relationship with patients in the stage of the disease. Simultaneously, all kinds of illness, with each stage of the three kinds of NSCLC diagnosis parameters, had a connection. Hence, for targets to evaluate the probability of , it can be diagnosed using the stages of disease and the main parameters for the probabilistic decision weights of the joint. Therefore, we can obtain the target through judgment.
where are the types of targets, i is the stage of NSCLC, and are the markers of various diagnostic parameters. We can calculate each stage of NSCLC with the possible target through the joint probability method.
- (4)
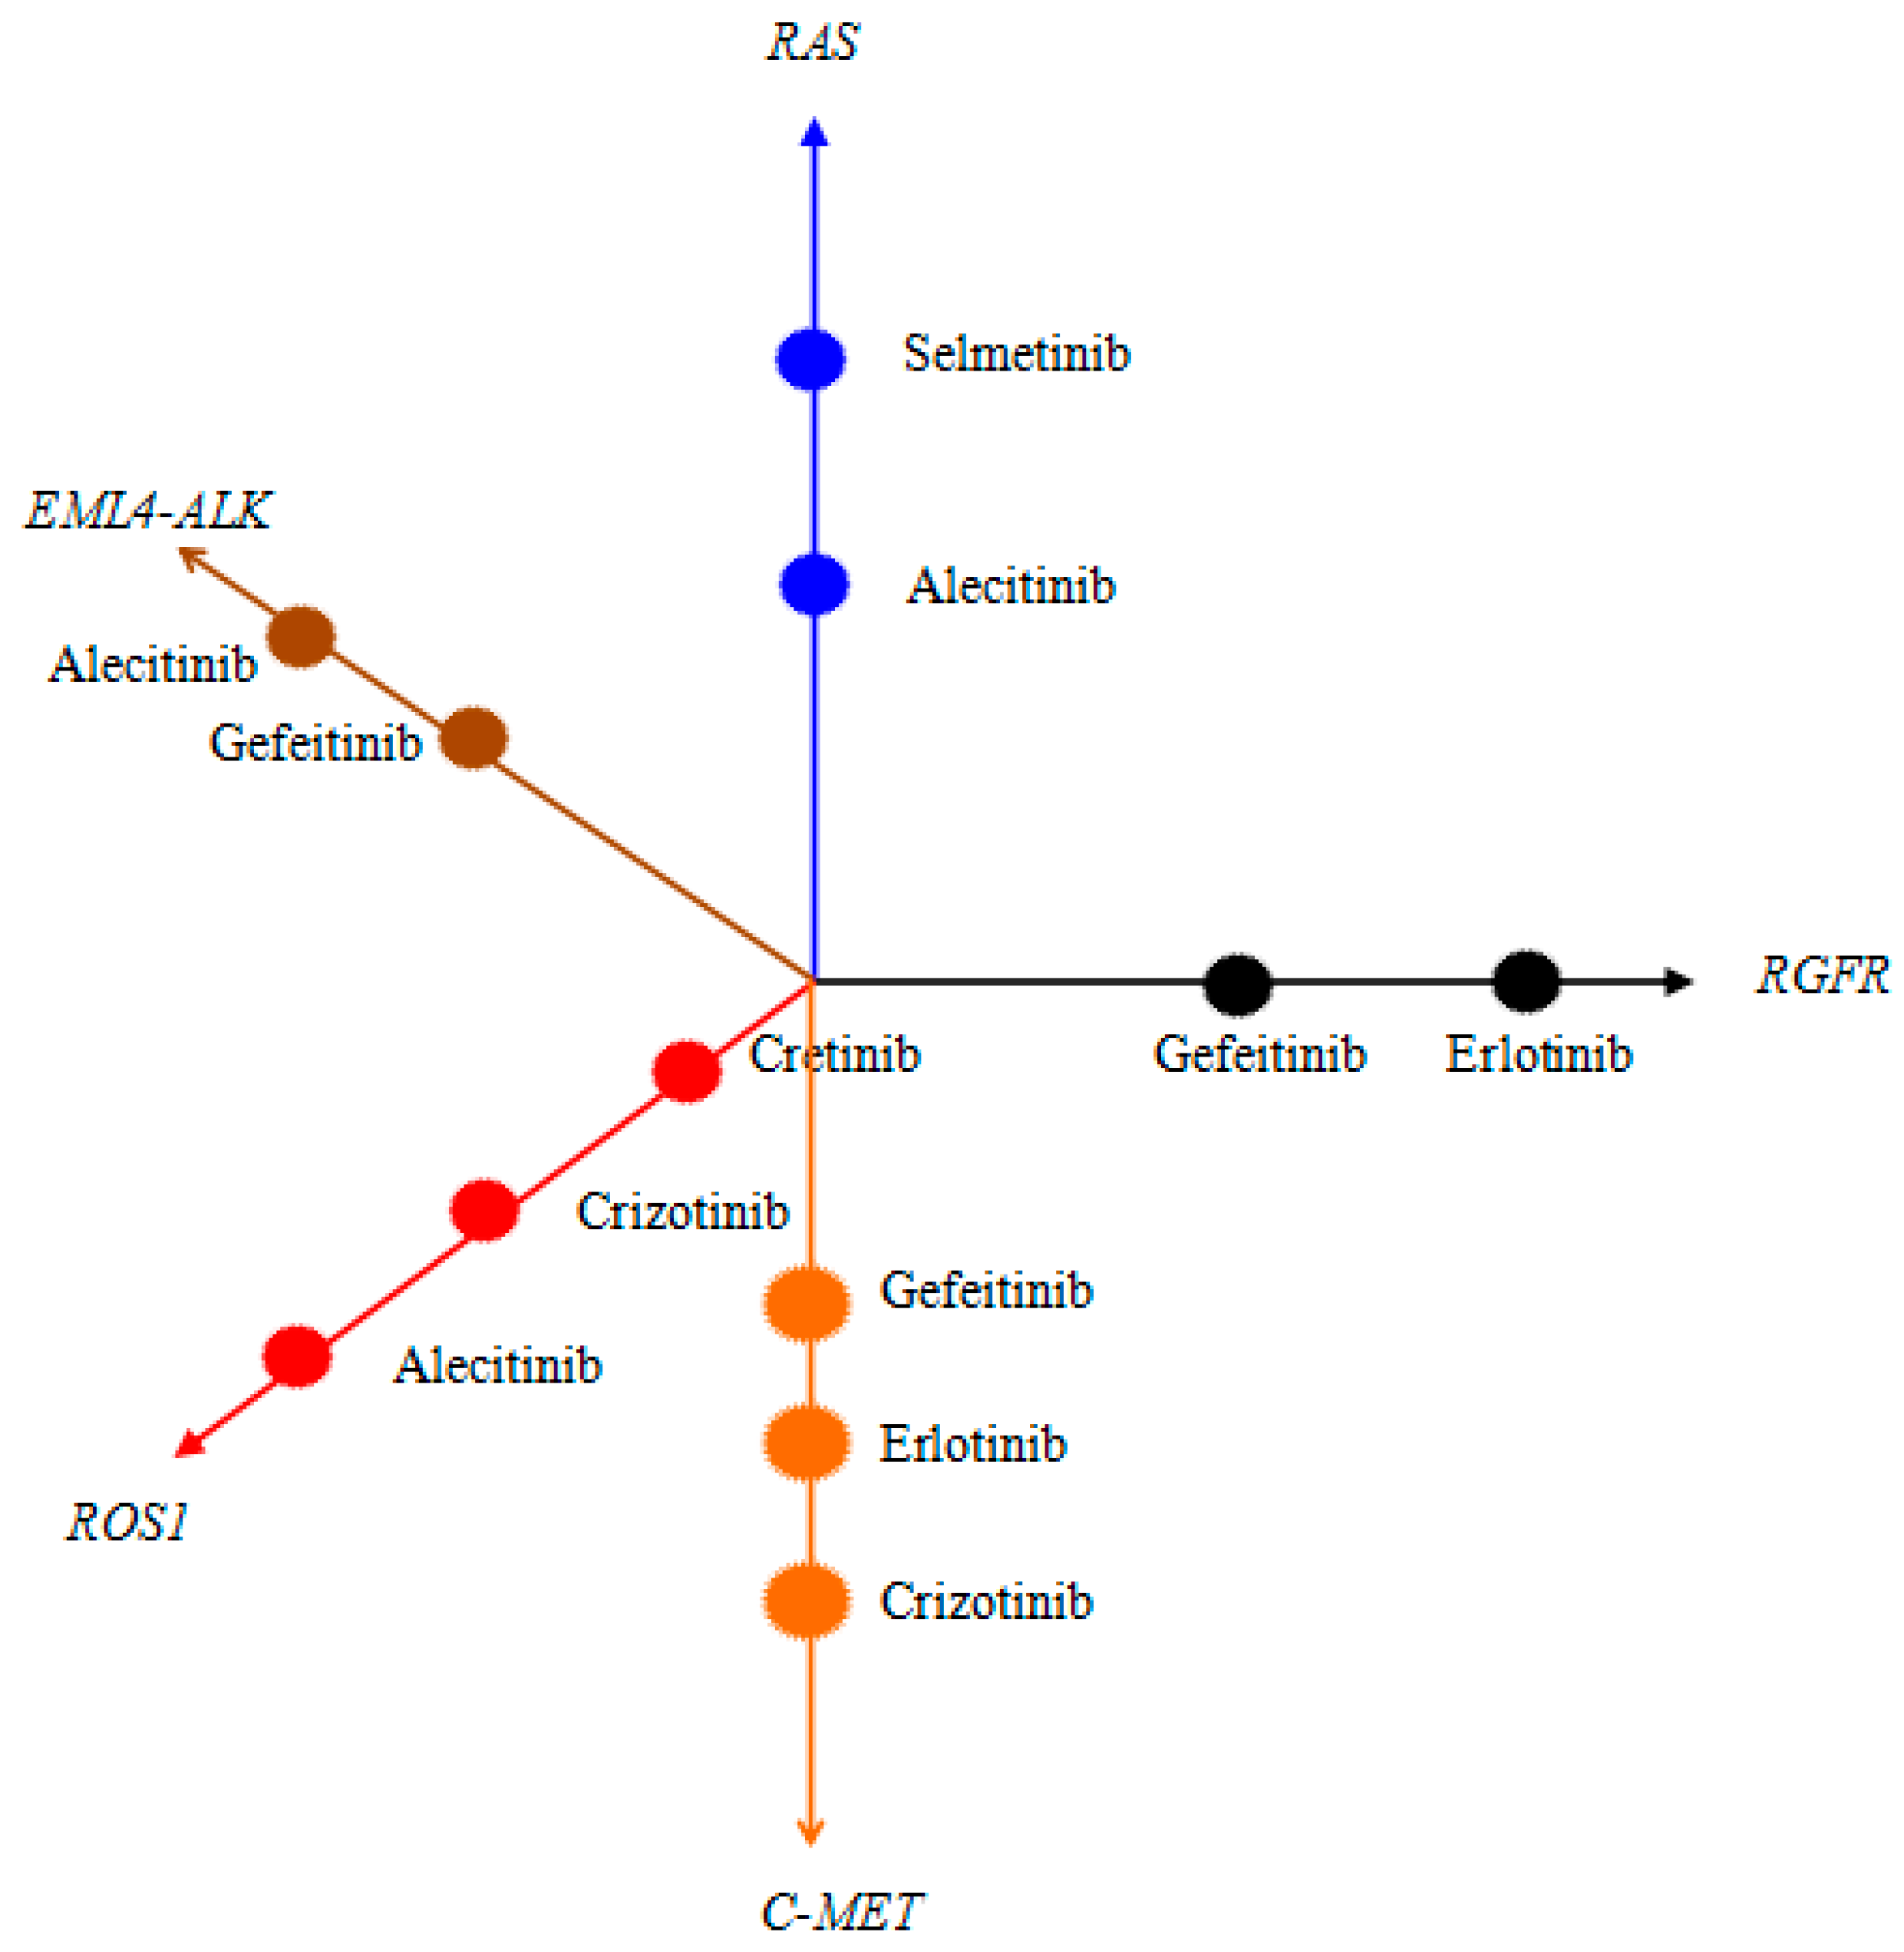
- Drug choice. Through probabilistic decision, we can calculate the different stages of NSCLC, in which several targets may exist. These targets can be used to select the method for drug treatment. Thus, we can design a decision-making method for the main chart of medication and the drug use set of data collection.
Figure 2 illustrates a set of drug treatment decisions. In decision making, the category of each target is recorded to select which method to use. In Figure 2, we can build a collection of the decisions. The decision set includes all kinds of medical records and storage type of the targets, such as their form of expression of the system stored as a drug (chair). The representation of a dataset is as follows:
- Data assembly 1: RGFR { gefeitinib(chair), erlotinib(chair) }
- Data assembly 2:RAS { selmetinib (chair), alecitinib (chair) }
- Data assembly 3: MELA4-ALK { alecitinib (chair), gefeitinib(chair) }
- Data assembly 4: ROS1 { alecitinib (chair), crizotinib (chair), cretinib (chair) }
- Data assembly 5: C-MET { gefeitinib(chair), erlotinib(chair), crizotinib (chair) }
The collection system of all kinds of drugs for the patients of possible secondary and medical treatment options improves the efficiency of drug use.
3.2. Role of Data Decision Making in Drug Treatment
In Section 3.1, an intelligent diagnosis on the patient enables the doctors to prescribe a regimen after a period of treatment; the primary diagnosis parameters of the patient, namely, cytokeratin (CYFRA21-1), carcinoembryonic antigen (CEA), and cancer antigen (CA)—125, may change because of the influence of drugs.
We set the using the parameters of the first k kinds of drug decision probability. can be expressed by
is obtained after drug use k, the main parameter of the weights. According to Equations (1)–(3) we can obtain the parameter decision probability of the first k drugs:
- If , then, after k, the main parameters of the weight does not decrease k because the NSCLC drug treatment has no effect or does not deteriorate;
- If , then, after drug use k, the parameters of the main weight drops; k is the effect for the treatment of NSCLC, the parameter of the normal weight;
- If , then, after the k, the drug treatment effect, which is the main parameter of the weight of normal, is obvious, and thus does not require taking medicine.
In many developing counties, patients must take many kinds of drugs which contain antibiotics, vitamins, and so on. For patients, pesticide effects from those drugs are independent and necessary. Thus, in the process of treating NSCLC, multiple drug combinations are used to improve the main diagnostic parameters of NSCLC; therefore, we can calculate the joint probability distribution of a variety of drug conditions:
We can evaluate the different drug combinations through the joint probability method to improve the effects of the NSCLC main parameters on the patient.
3.3. Drug Selection of Iterative Optimization
In Section 3.2, we can calculate the effect of drug combination on the diagnosis parameters. Using the information in the process of data collection, such as , , …, drugs set, we can design D, which is the training set. We set three kinds of diagnostic parameters in time t of the optimal probability.
We set the treatment of choice after the drug combination probability, and
In each time t, the patients for a medical scheme of statistics, by computing the weights, may change the three diagnoses in the medical. That is
The next time t + 1, for optimization use probability
If at any time t, existed, and the combination of drugs in time t is better than t + 1 time effect, then the system is recommended for the drug.
If existed, following an N time record of the drug combination, treating the NSCLC effect is optimal at the current stage at time t of the drug combination.
4. Experimental Design
In this paper, all data comes from the mobile health information of the Ministry of Education–China Mobile Joint Laboratory. Table 1 shows medical systems used by the three hospitals in Central South University to collect data. Medical data of these hospitals are transmitted and exchanged through the medical data center. The medical data center collects data, such as patient diagnosis, disease, surgery, nursing plan, and drug selection, from different departments for data classification to provide comprehensive information to medical doctors, nurses, and patients.
It shows recorded data for all patients from the three hospitals in 2002–2015. These data are used to identify and classify statistical information, which will form the medical data center.
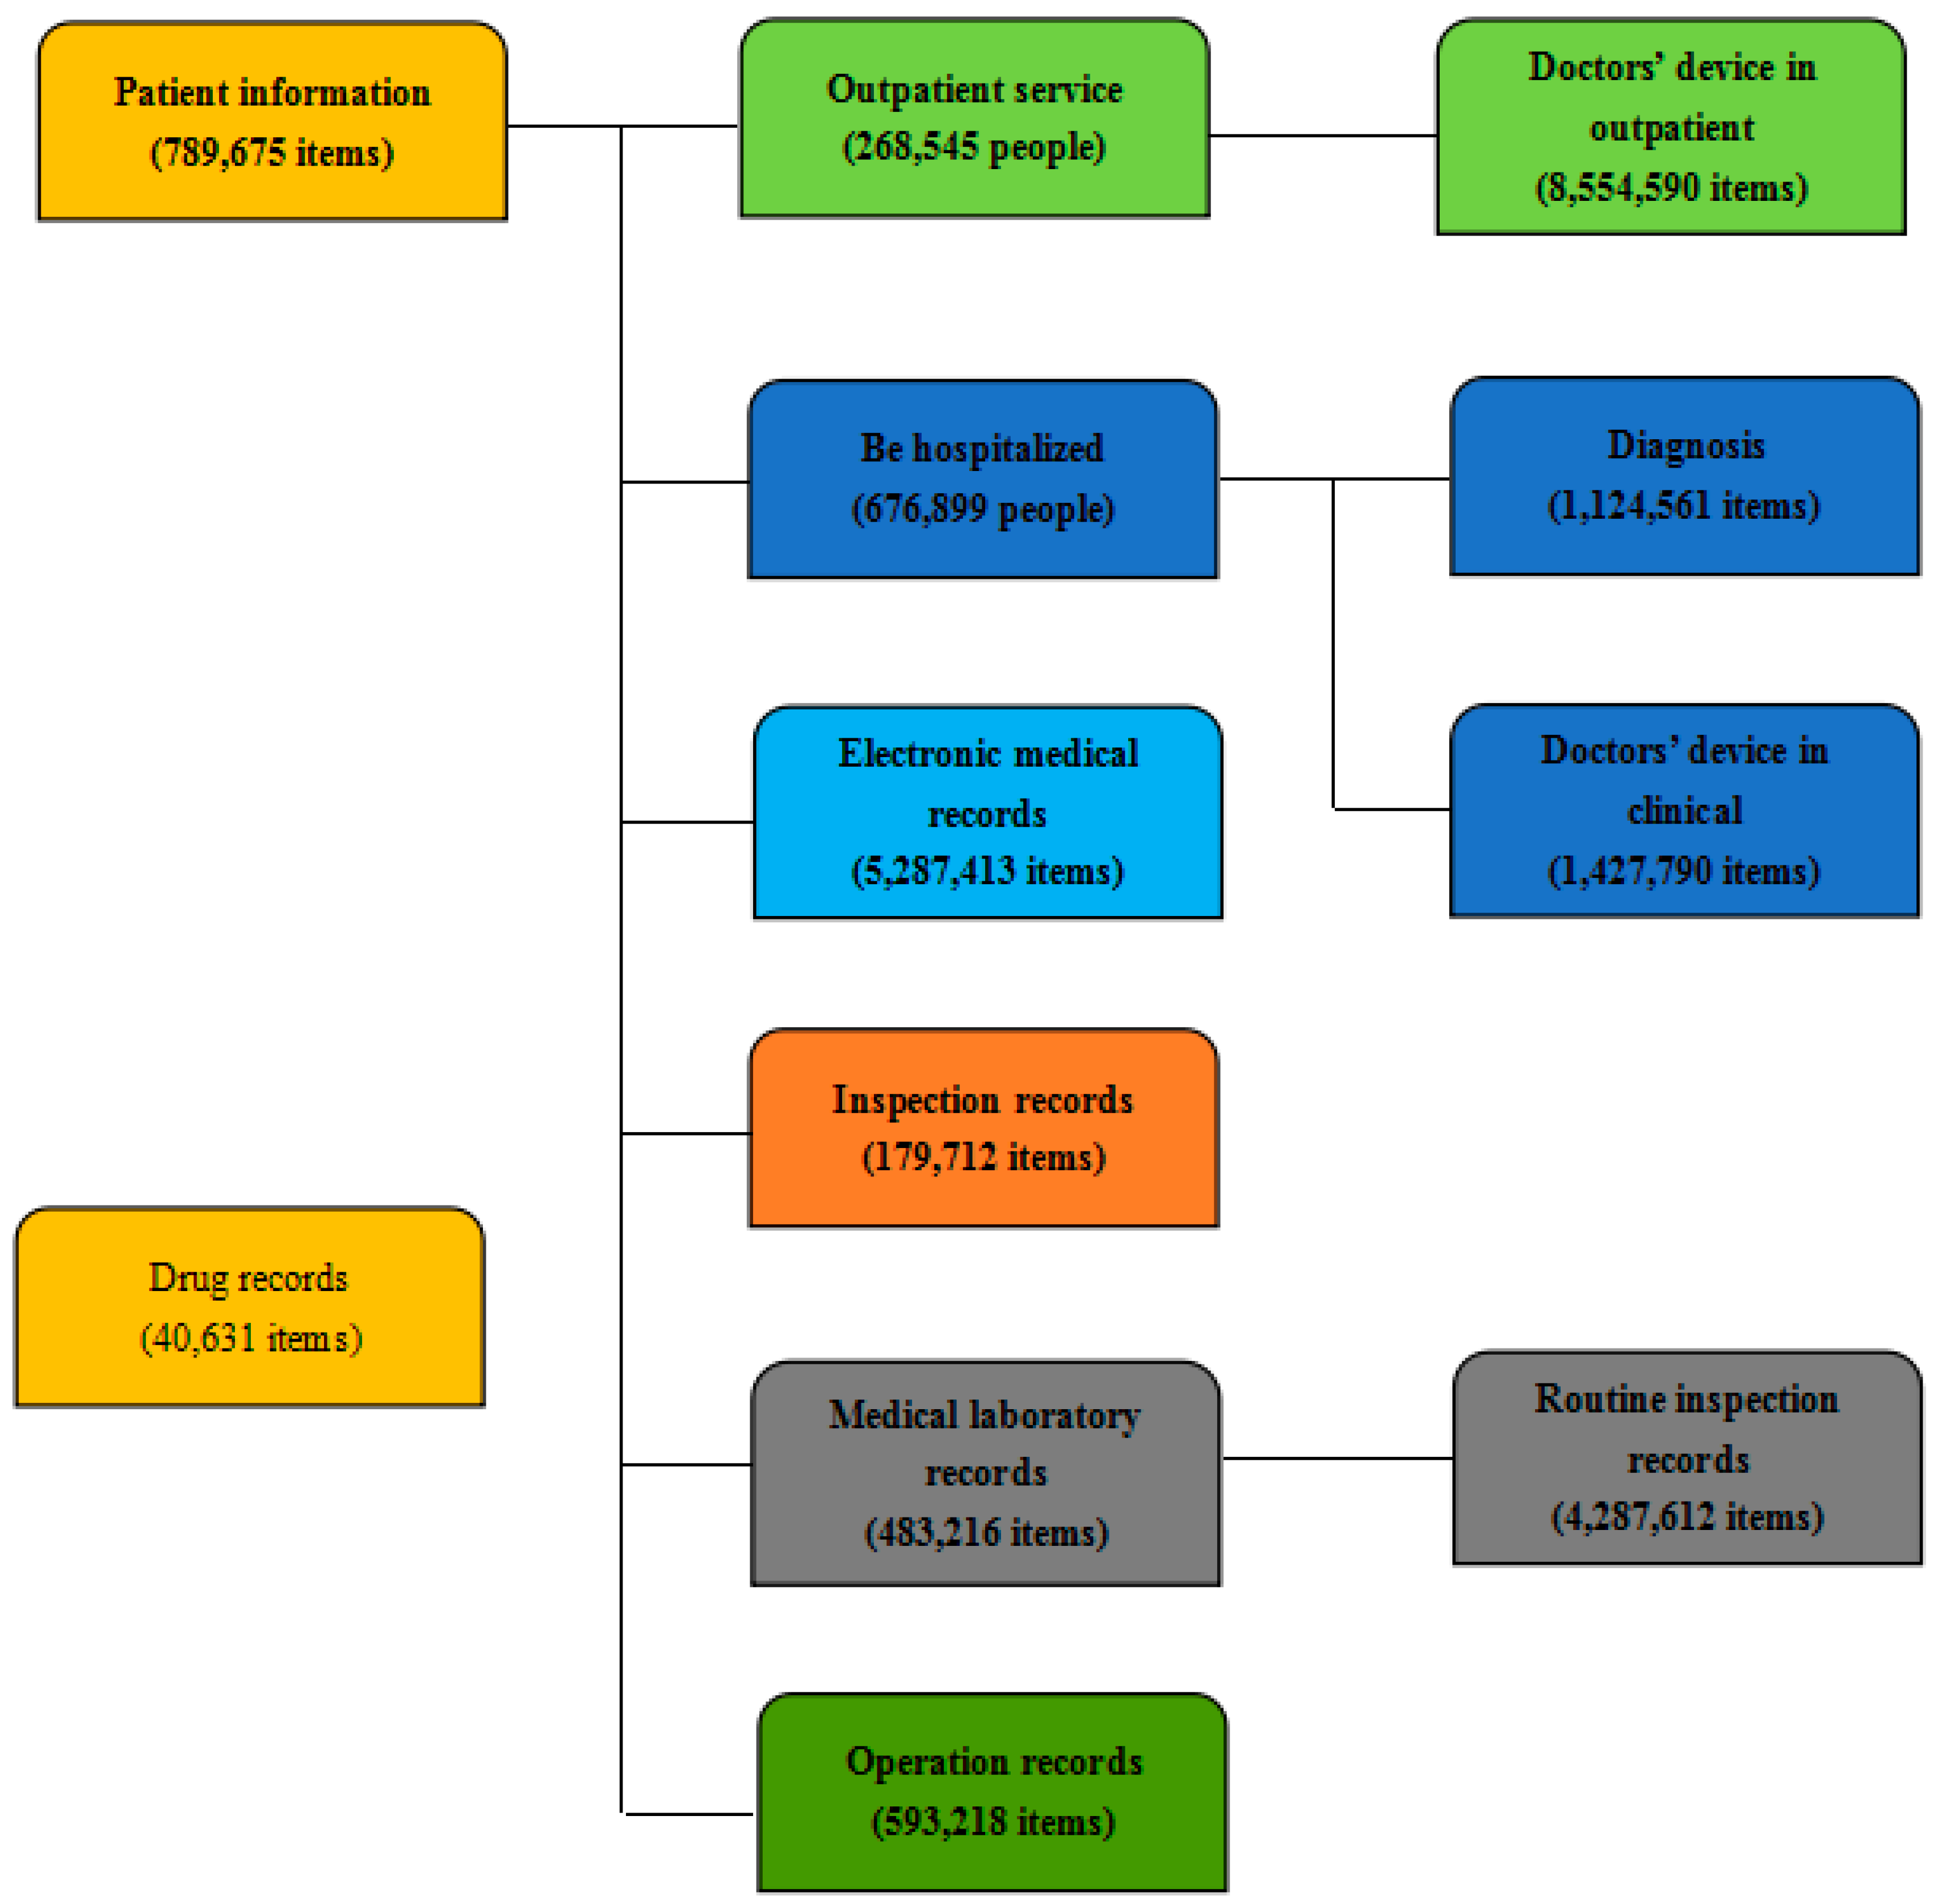
Figure 3 shows data collection in three hospitals. In 15 years, 789,675 patients were admitted to the three hospitals, and their data formed 5,287,413 valid electronic medical records. The three hospitals transmitted 1,124,561 diagnosis reports and 1,427,790 clinical diagnoses of doctors.
In the medical system, HIS is hospital information system; EMR is electronic medical record; LIS is laboratory information system; RIS is radiology information system; and PACS is picture archiving and communication system. These data records can assist doctors in clinical analysis and research on typical disease cases, in decision making for big data medical information system, and in probability analysis as a foundation for research.
Through analysis of big data with NSCLC, 39,483,216, data information was stored in a medical library of medicine, scientific research, and teaching. A total of 93,218 articles record different operations performed by different departments and different categories of surgical treatments to improve the success rate of surgery. A total of 40,631 articles record pharmaceutical information and properties of drugs selected by doctors to ensure convenient use of hospital drug management data environment.
At the center of big data medical environment, medical-data decision algorithms can be established based on depth of machine learning and through data analysis and decision-making. These algorithms store big data as training set, which is used as carrier of intelligent diagnosis results obtained through probability analysis during data transmission in a wireless network in 4G/5G environment to patients and doctors, to provide them with probabilistic decision methods for optimization of diagnosis and treatment.
A large dataset can be created using more than 15 years of data to analyze the development of NSCLC, data acquisition, and decision-making process, and to provide quick reference opinions for doctors, improve the promptness of diagnosis, and reduce diagnostic errors.
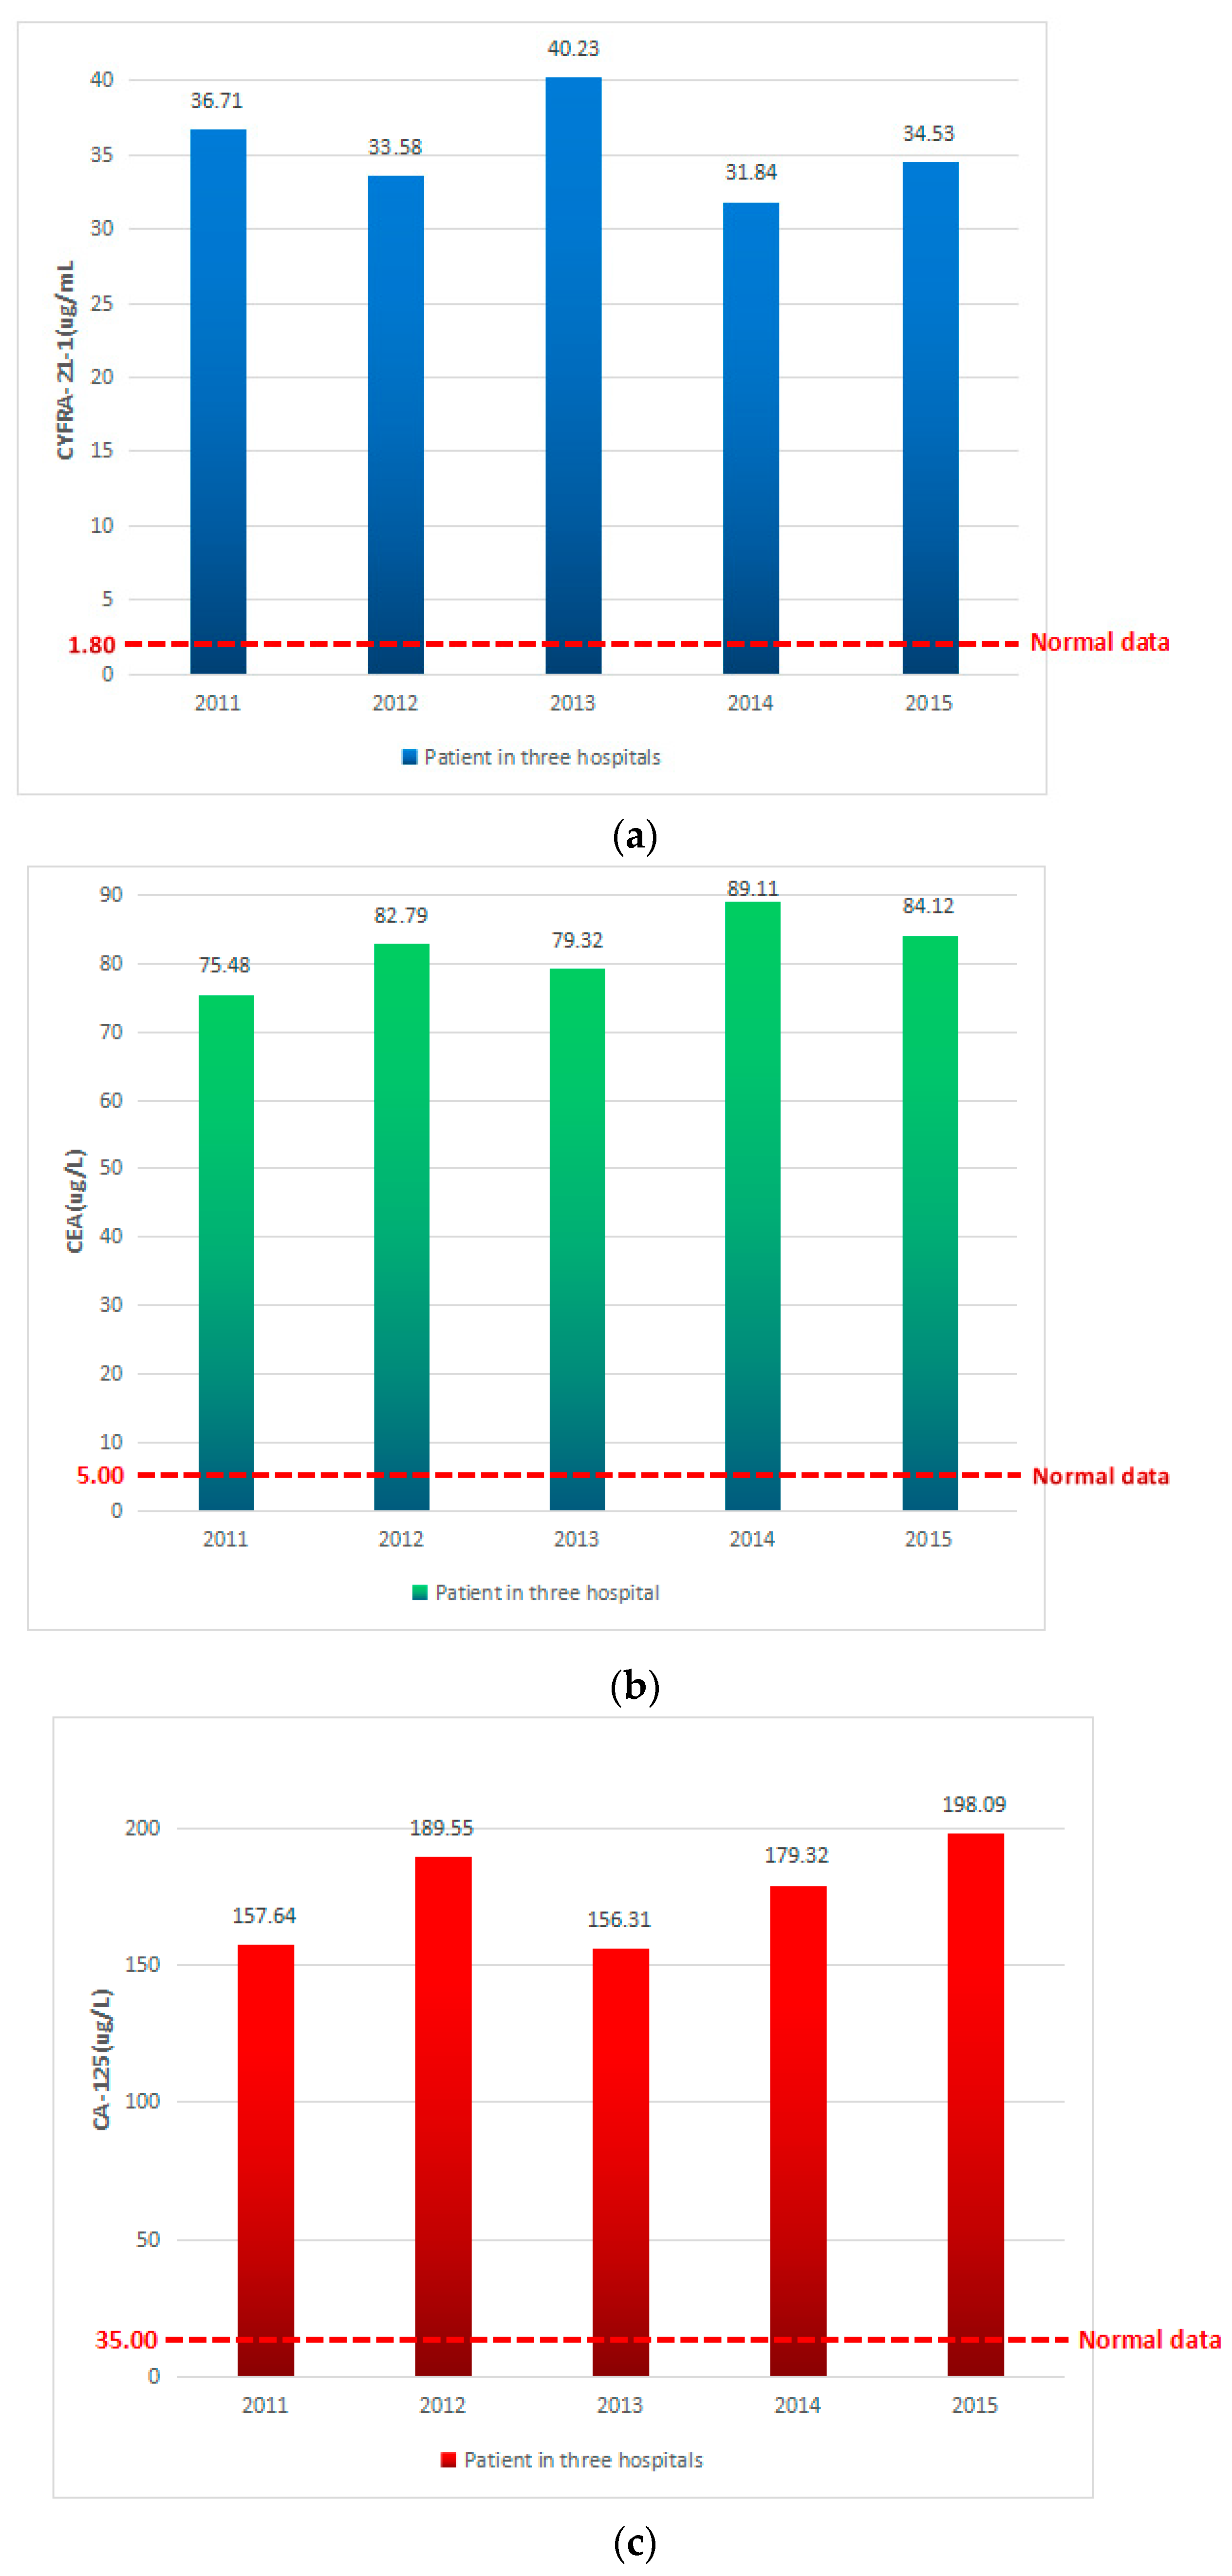
Table 2 displays the diagnosis parameter and decision data with the normal data in NSCLC. Table 3 shows the stage partition by diagnose parameters and decision data in NSCLC. The statistics and analysis of the parameters of the decision-making process are shown as follows.
Figure 4a shows patients in the analysis of CYFRA-21-1 average performance in three hospitals in recent five years. We can see that the normal range of CYFRA-21-1 is between 0 and 1.8. Patients with NSCLC showed five sampling results average performance that are larger than normal, with an average of more than 35. CYFRA-21-1 indicated that the patients were in the abnormal state in recent five years with NSCLC.
Figure 4b shows patients in the analysis of CEA average performance in three hospitals in the recent five years. We can see that the normal range of CEA is between 0 and 5.0. Patients with NSCLC showed, 16 times, sampling results average performance that are larger than normal, with an average of more than 80. CEA indicated that the patients were in the abnormal state in recent five years with NSCLC.
Figure 4c shows patients in the analysis of CA-125 average performance in three hospitals in the recent five years. We can see that the normal range of CA-125 is between 0 and 35.0. Patients with NSCLC showed, 5 times, sampling results average performance that are larger than normal, with an average of more than CA-125. CEA indicated that the patients were in the abnormal state in recent five years with NSCLC.
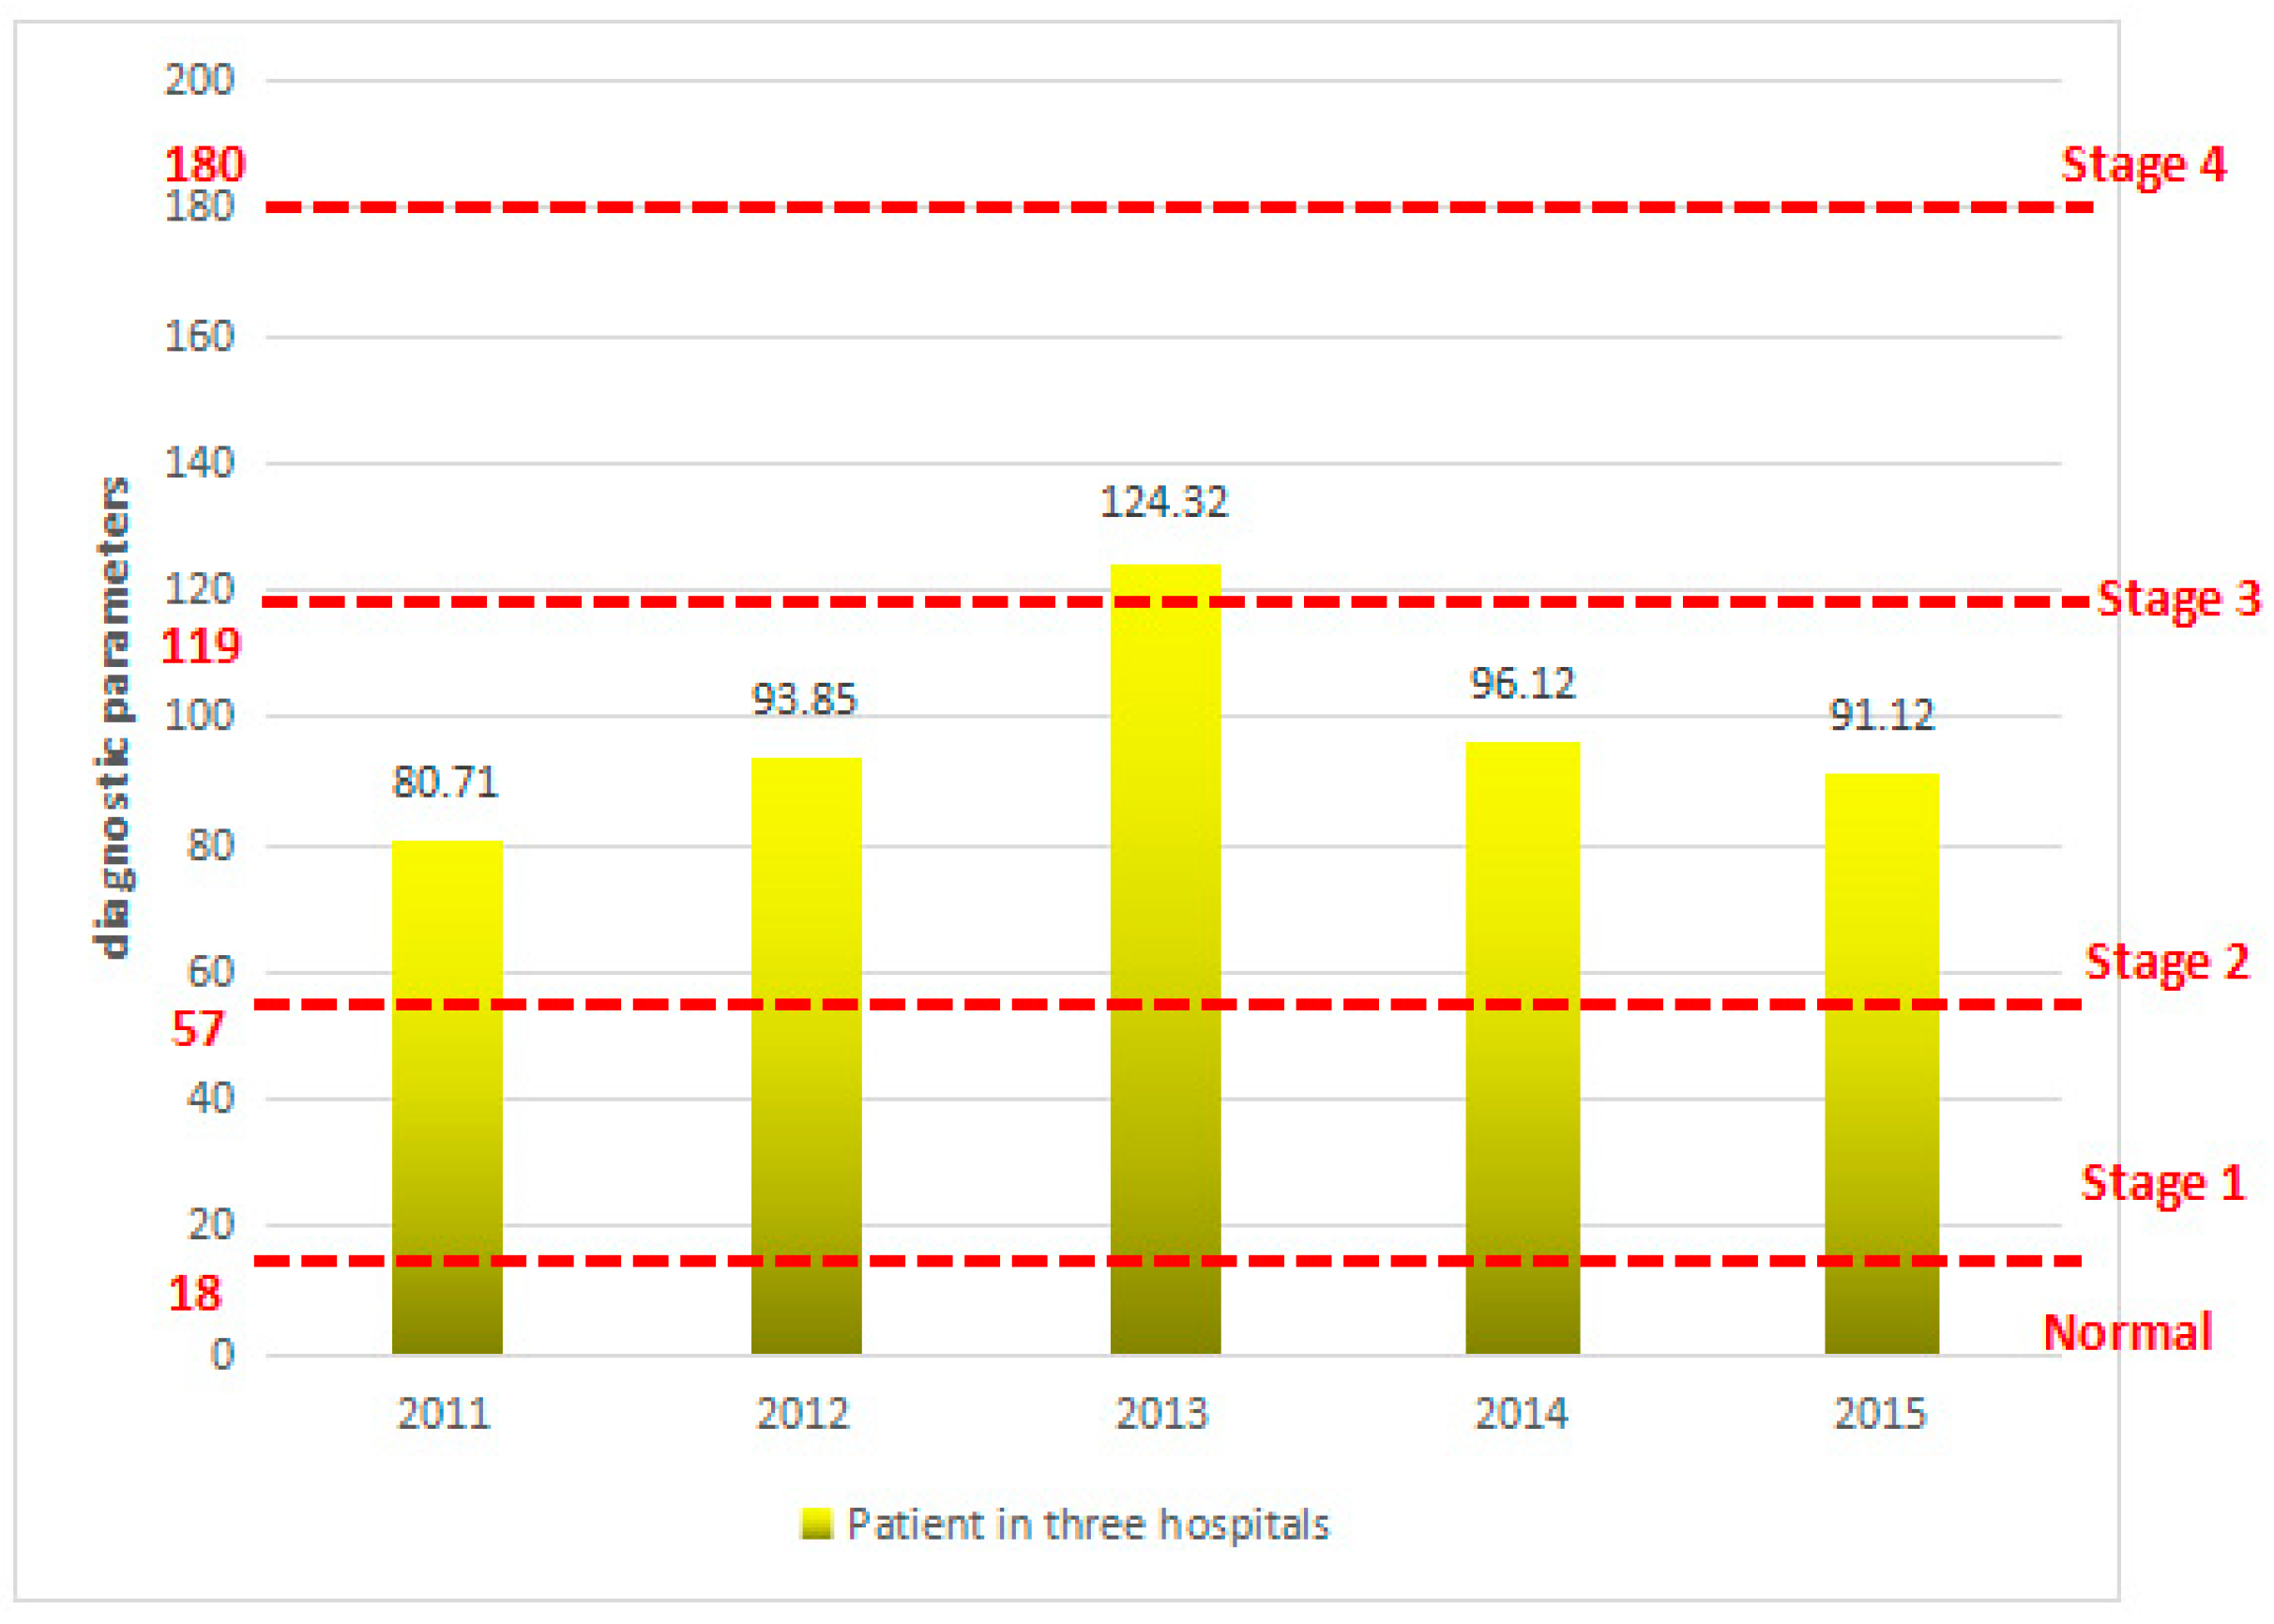
According to the analysis of the patients’ diagnostic parameters, and through Equation (2), we can calculate their decision value . Assuming diagnostic parameters of correlation parameters of patients with the same weight, that is, the three parameters in judging NSCLC stage are divided into the same weight, and the patient has high correlation parameter decision values shown in Figure 5.
According to Equation (2) calculation, we can obtain diagnosis decision-making analyses in the recent five years. In the whole process, we set three diagnostic parameters with similar weighting factors, namely . Thus, we can calculate the different decision parameters data decision values of diagnosis for patients in three hospitals.
In Figure 5, in the last five years, among the NSCLC patients between 2201 and 2015, 2,011,201 of the statistical data includes cases diagnosed using the decision of the second period; among these, 2011 has 80.71. The average of the decision-making parameters increased to 93.85 in 2012, indicating a growth of 13.68%. In 2013, the three hospitals of NSCLC patients demonstrated an average decision-making parameter of 124.32; moreover, the growth ratio increased by 32.6% in 2012 during the three periods of NSCLC. Then, in 2014 and 2015, the average decision parameters for patients with NSCLC decreased to 96.12 and 91.12, respectively.
In Figure 5, for nearly five years of the study, the NSCLC cases were mostly in the second stage. According to the analysis of large decision-making data, hospitals and doctors have prepared beforehand for the medication and therapy of patients, especially for NSCLC, regarding second disease drug storage, and have provided a good reference.
Table 4 lists the 30 patients in the hospital after the diagnosis and decision parameters of the process in the sample set. The sensitivity of the system involves the effective adjustment, improvement, and multiple patient data sampling of mixed modes, which are advantageous for the mechanism in the decision-making process, to cover a wide range and for rapid analysis; moreover, these were conducted on the threshold. Simultaneously, in Equations (4)–(10), we analyzed each treatment point judgment, and automatically recommend drugs, as presented in Table 4.
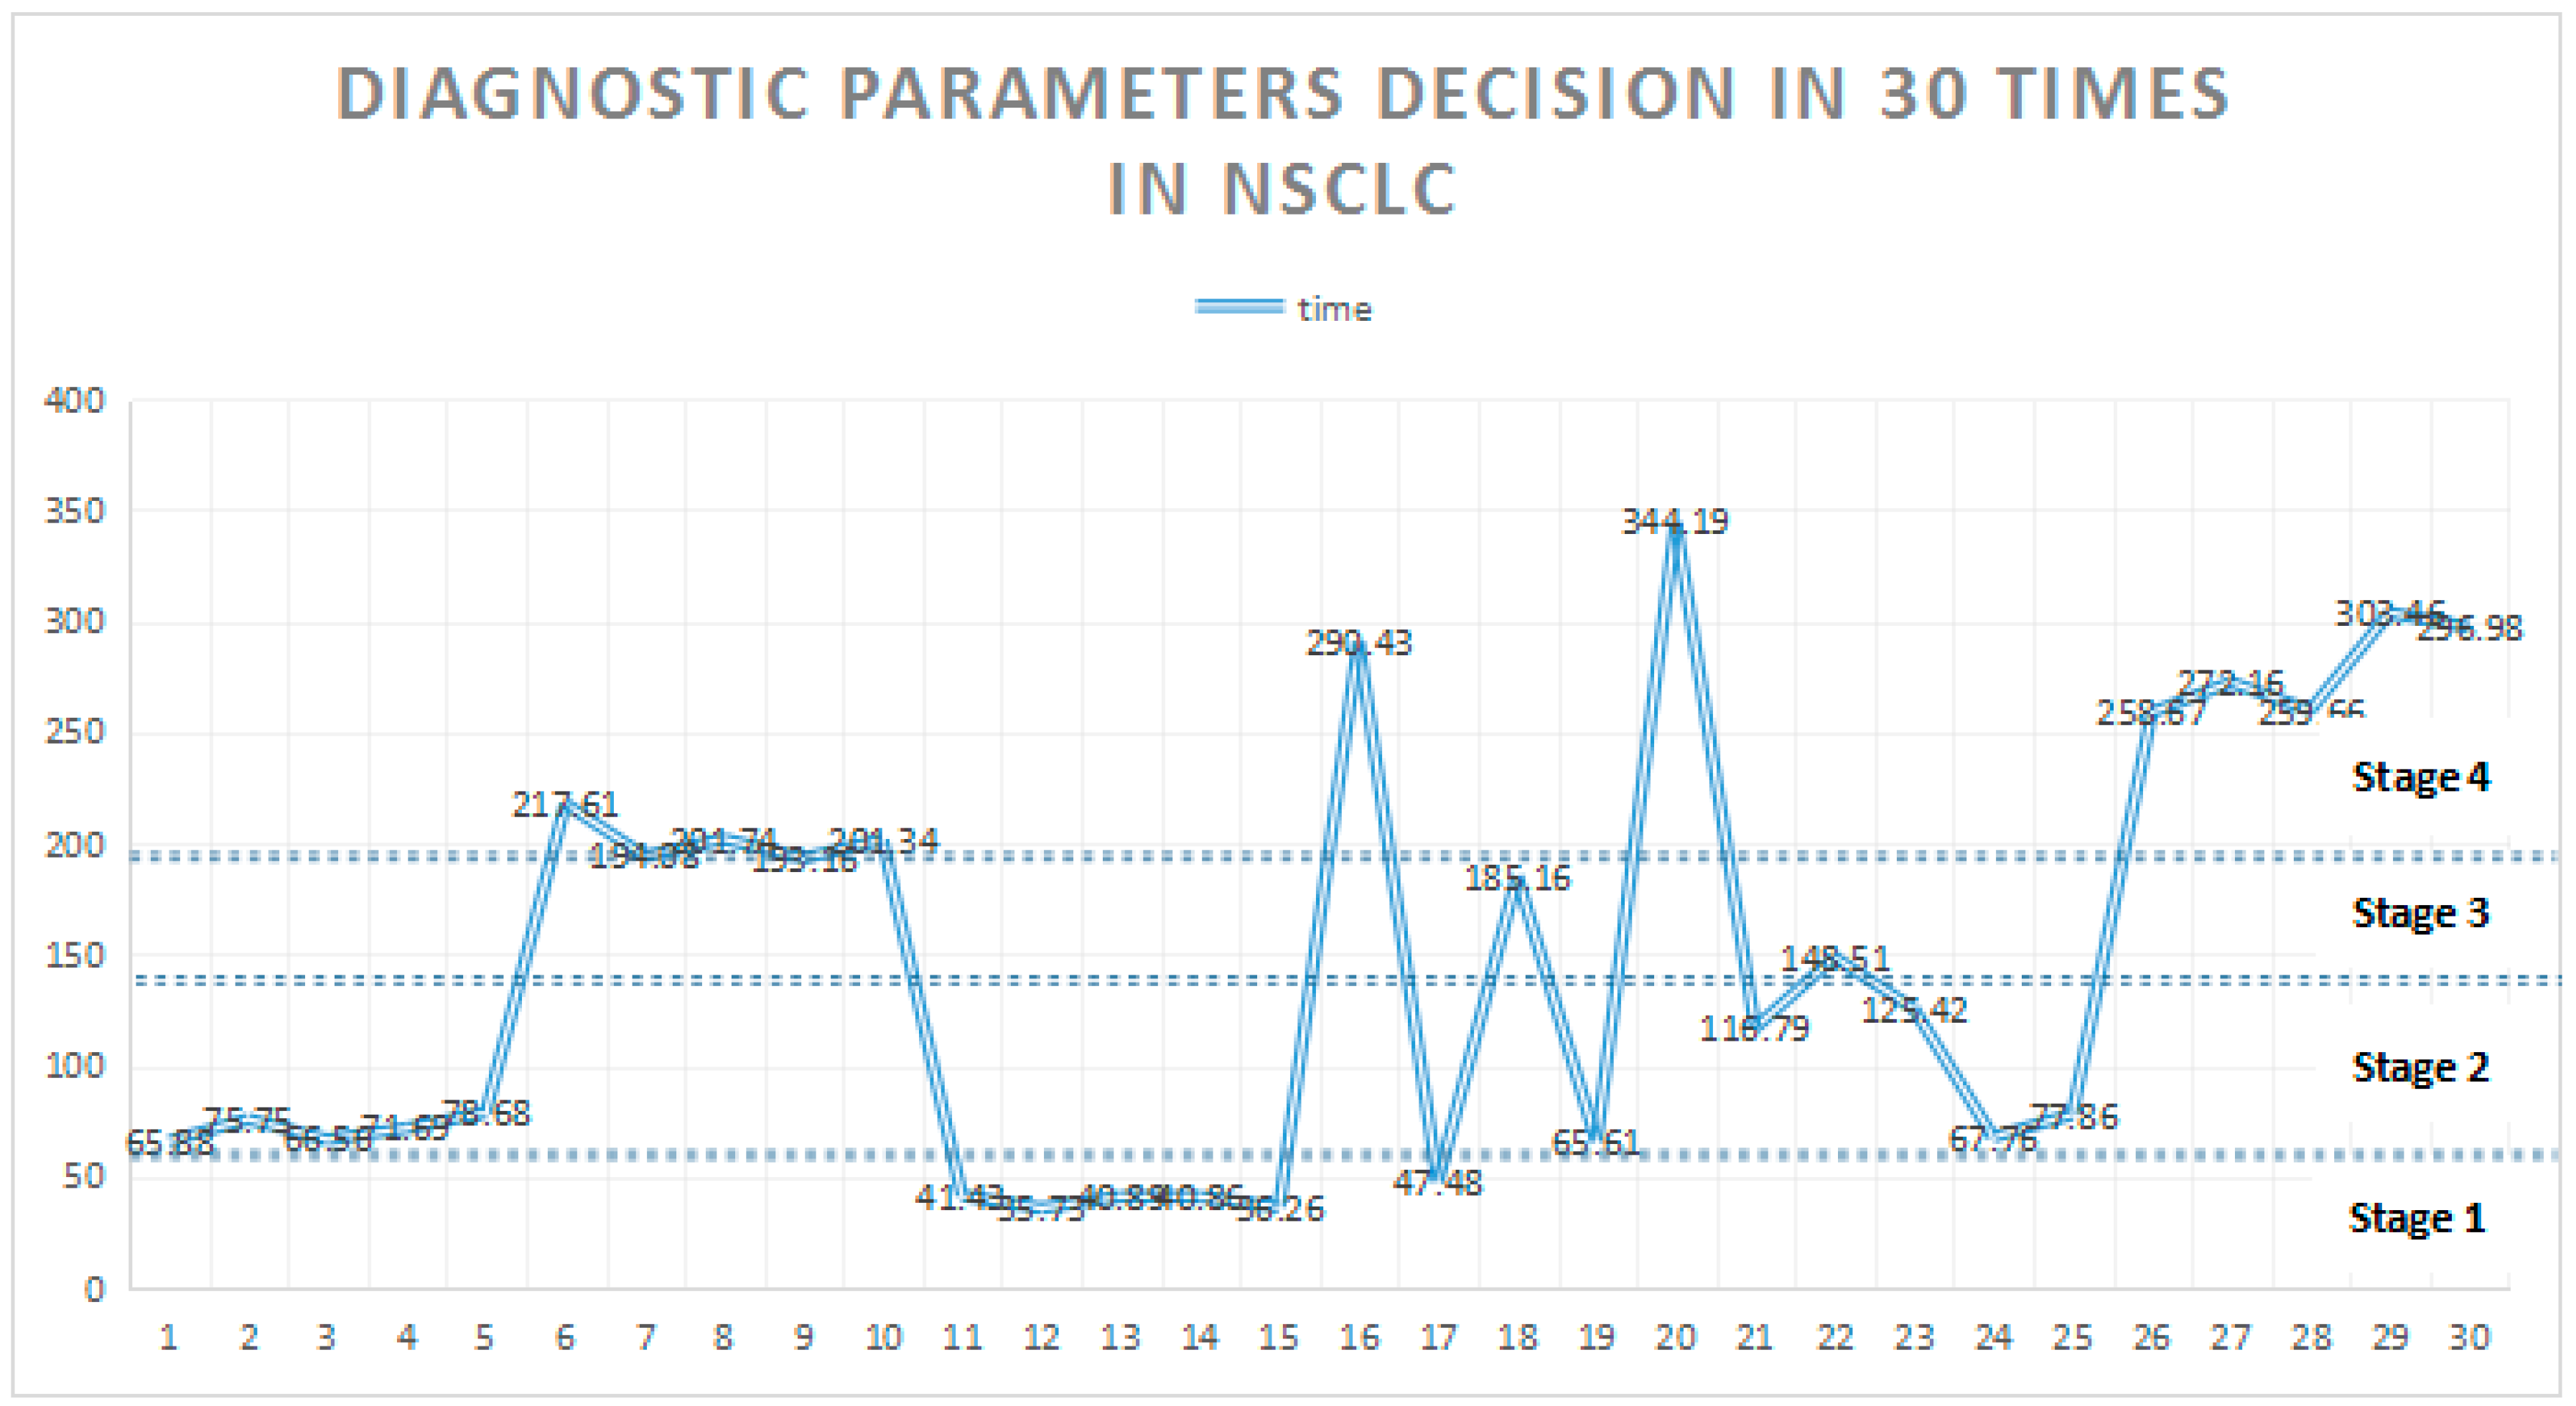
Figure 6 reflects the mechanism for nearly 30 patients for the NSCLC records and decision. The use of datasets imported from the system can quickly analyze the patient decision data for each sampling point, thereby rapidly distributing the patients in terms of NSCLC stage.
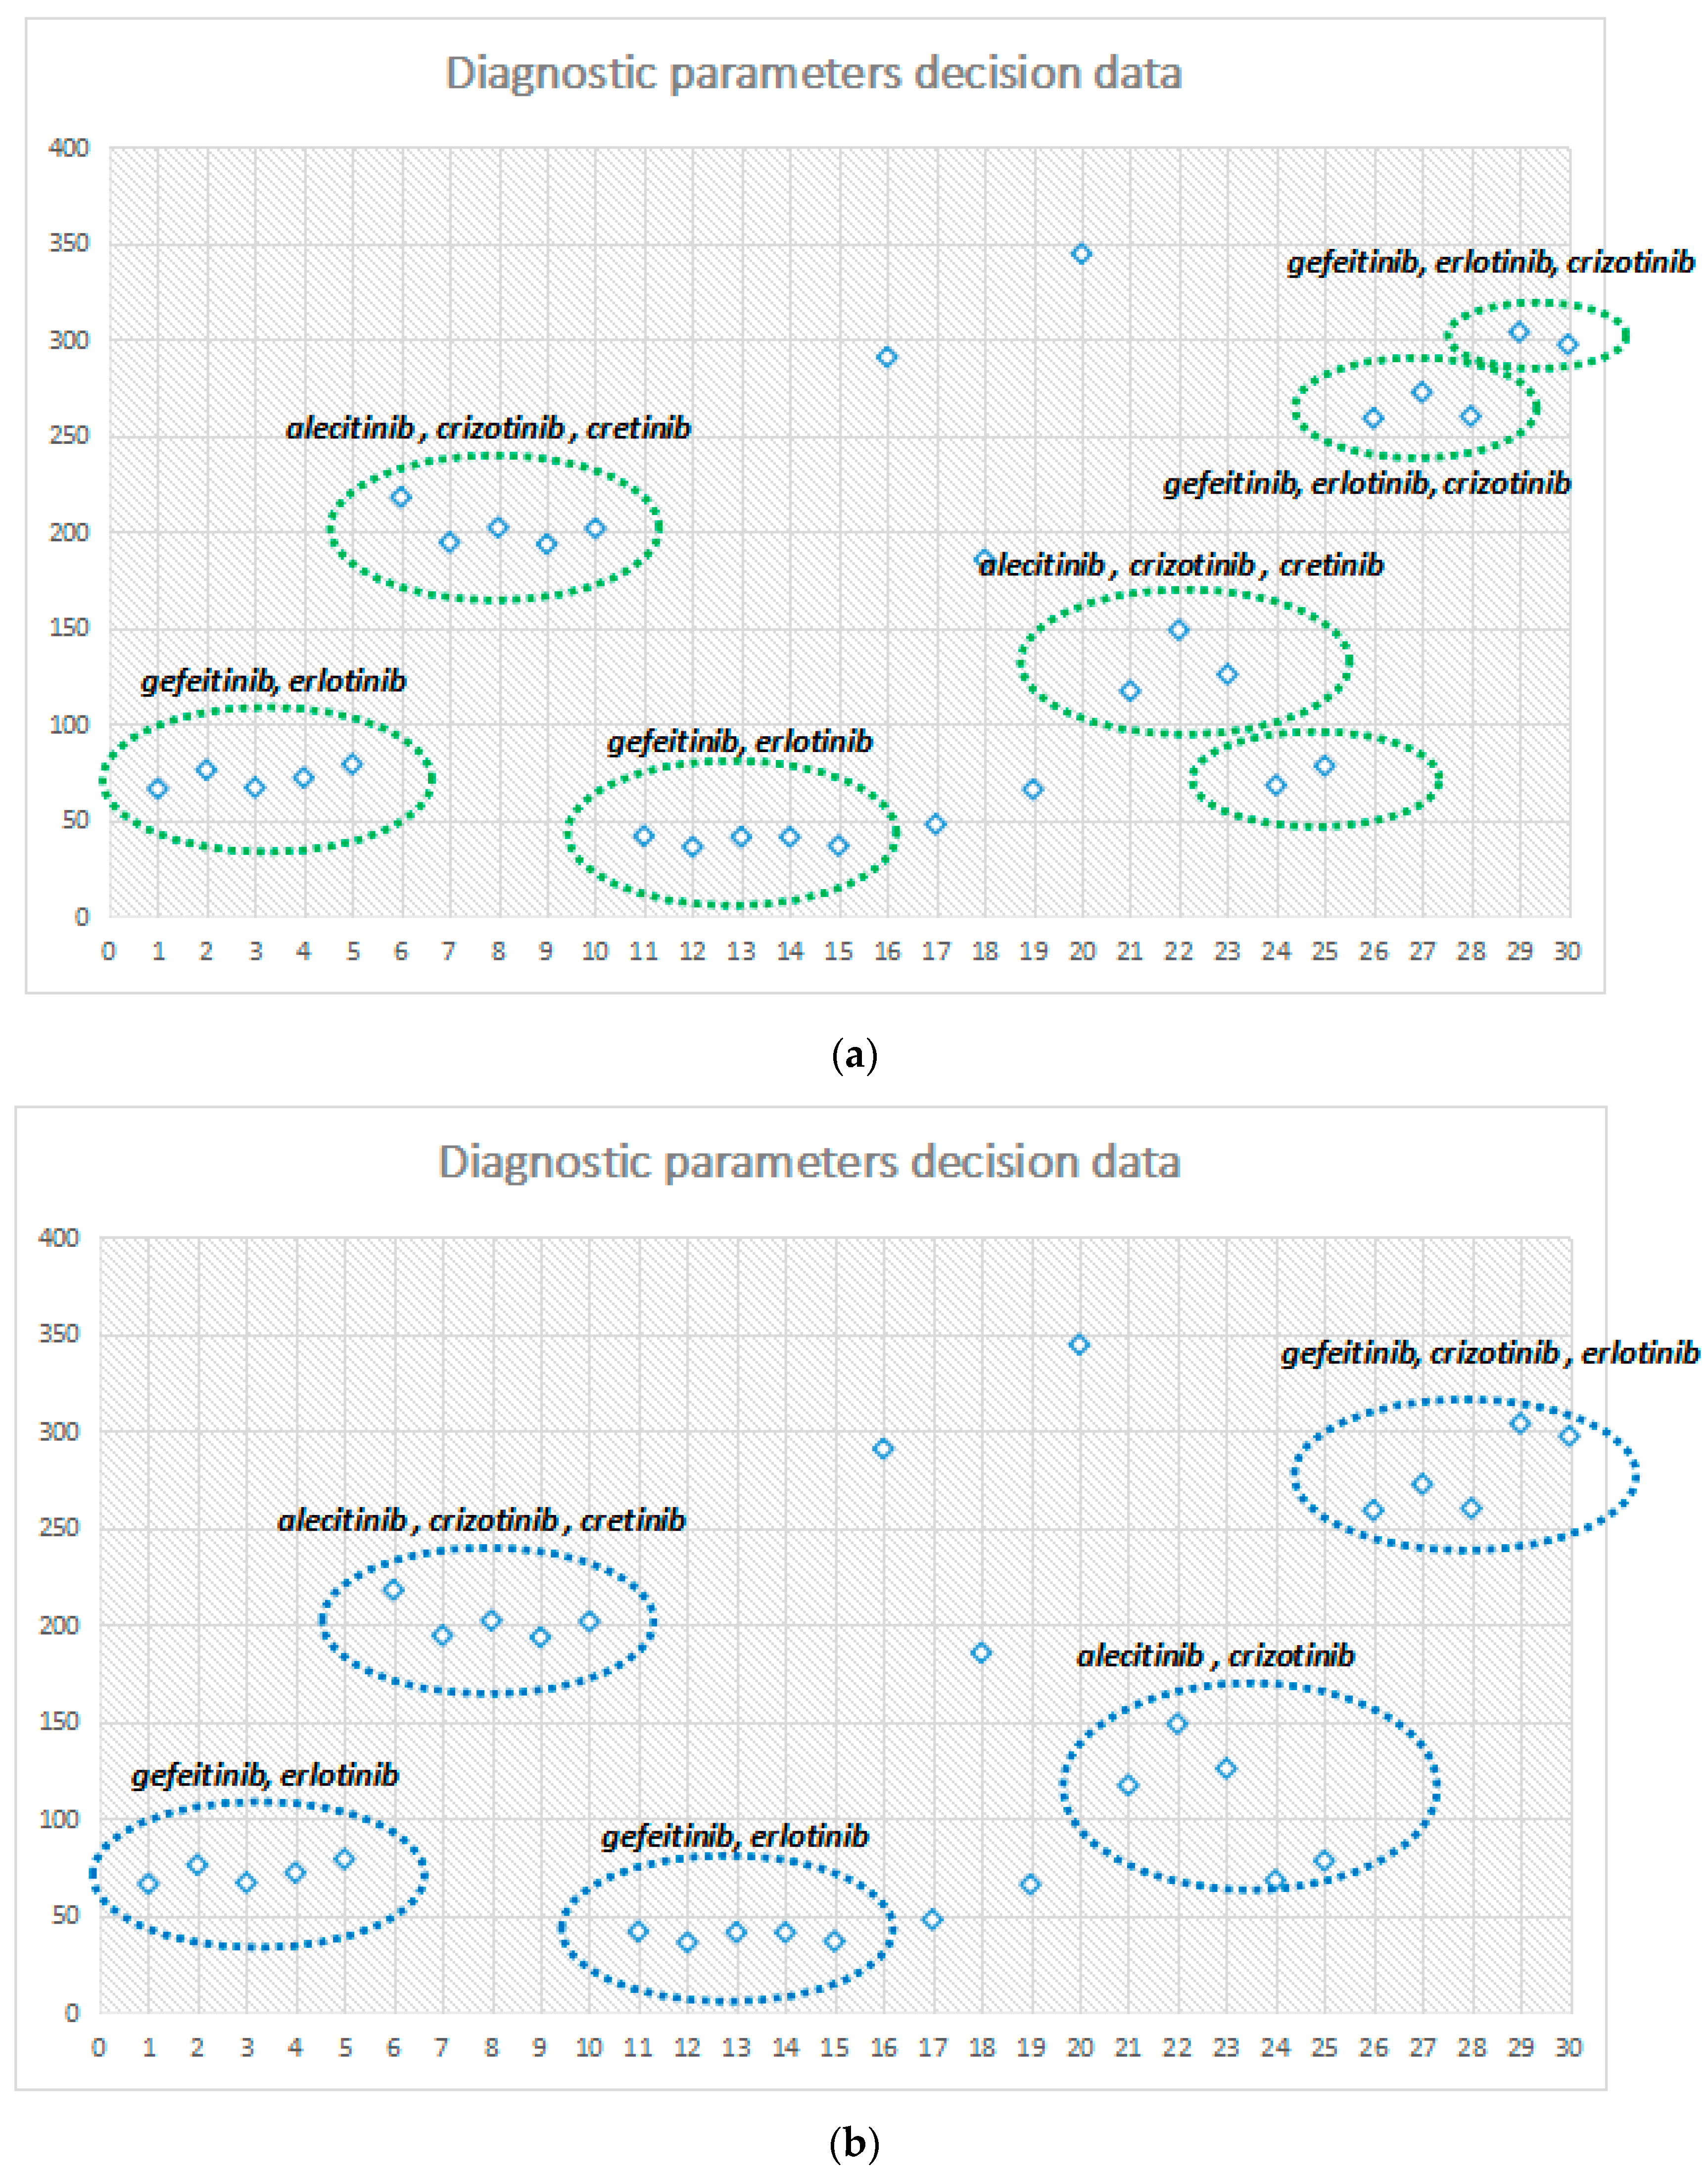
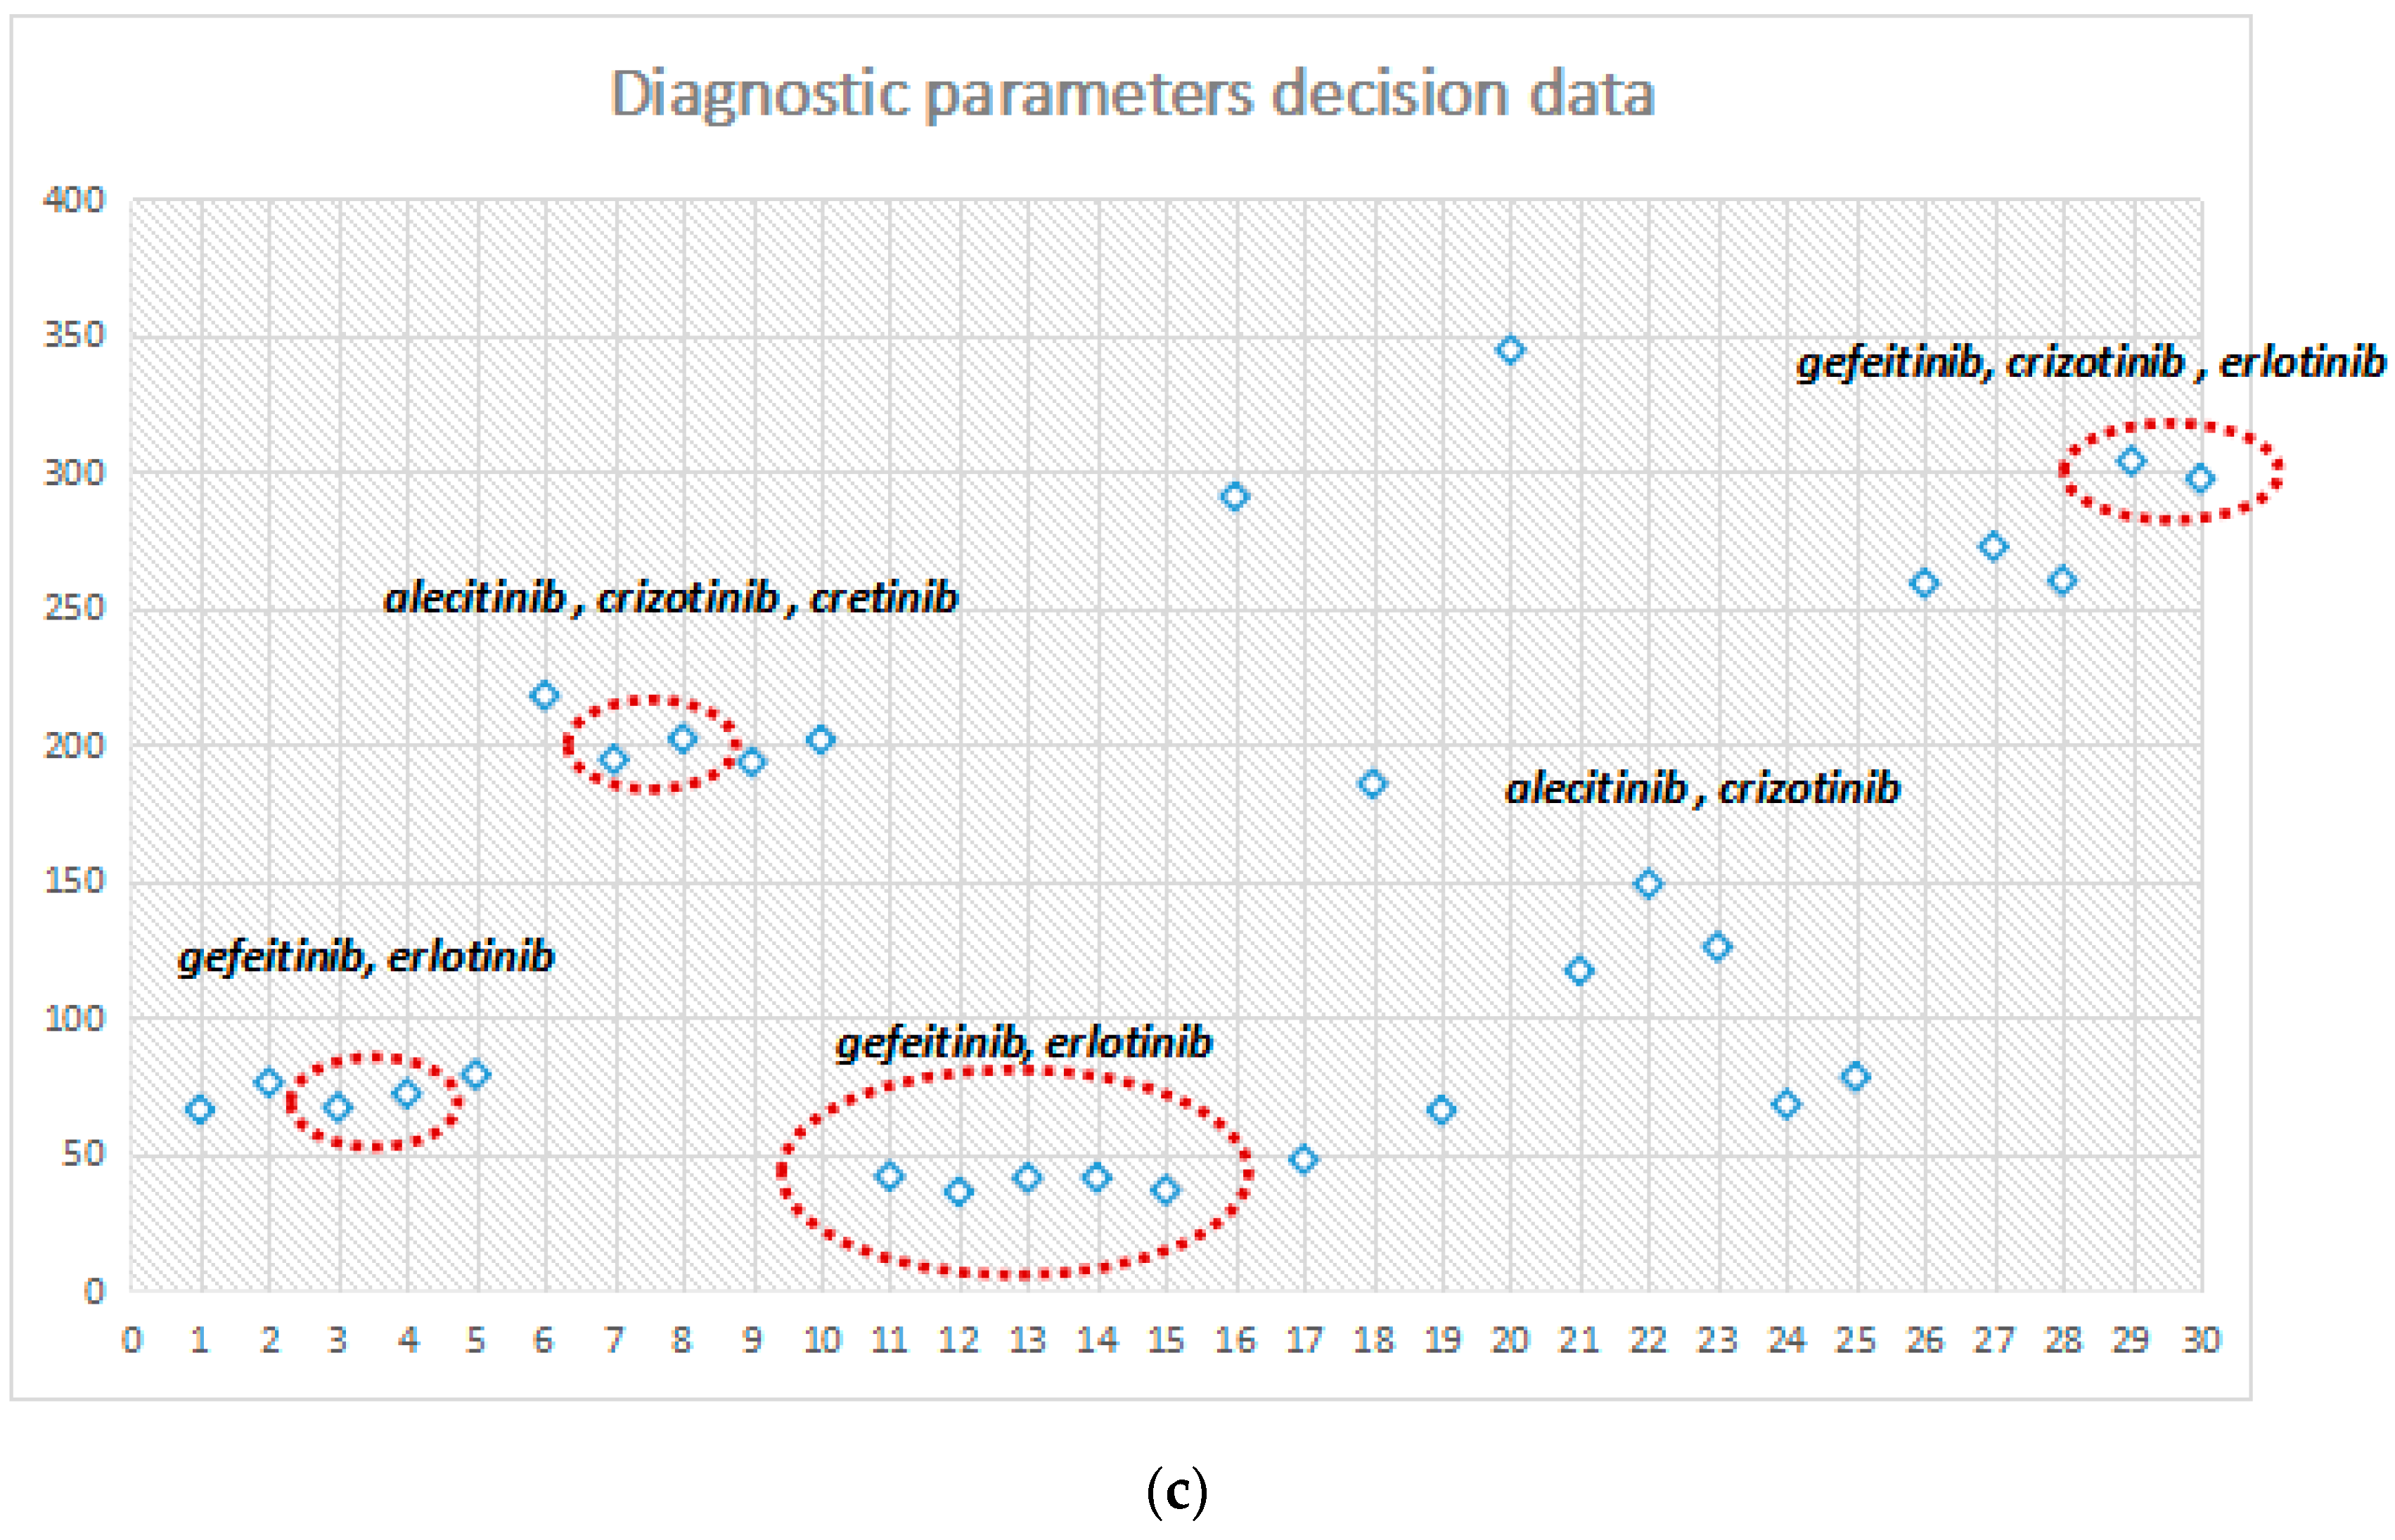
Figure 7a–c illustrate the performance under different probability parameter controls and continuous drug selection. In these figures, when , the decision node is a set of seven continuous administrations; among them, 1–5, 6–9, and 11–15 form three stages. Moreover, long continuous clinical stage of the same drug model shows the drugs that improve the stability of NSCLC. When , the decision node has five sets of drugs; then, with , the sensitivity of the system decreases with the selective reduction of decision making. When , only four drug control node sets are in a state of long-term stability between 11–15. After the adjustment for probability control parameters, the sensitivity of the system reflects the efficiency for drug decision making.
The control and adjustment of the system state probability parameter may be effective for different regions, people of different ages and probability diagnoses, and medication recommended analysis, to promote the early diagnosis of NSCLC. Each phase of the system-recommended medicine has a good improvement effect.
Figure 8 shows the accuracy of the diagnostic auxiliary system. From the data history, we want to know whether a patient has NSCLC or not. From this figure, the decisions by doctors are very accurately. With small samples (100–500), the accuracy reaches 97%. In big data samples (over 1000), the accuracy also reaches 88%.
Diagnostic auxiliary system in small samples display inaccuracy. The accuracy rate is only 43–59%. If there are not enough training data stored in the database, the result is not assisted by doctors. In big data samples, training data are also increased. The accuracy has improved to over 80% when the diagnosis data reaches5000.
However, diagnostic system is only an auxiliary system, it does not replace doctors in making accurate decisions about NSCLC, even if we want to system to merely judge “have” or “not”. However, we can adopt a diagnostic auxiliary system to assist doctors, decreasing the workload while training the ever-increasing data, and allowing the accuracy to improve continually.
5. Conclusions
This research provides the foundation for building a model based on probability analysis and decision-making. It can be used to calculate the four different stages of transition probability of NSCLC. In each of the evolutionary processes, an effective parameter selection method from large data is used for mining the maximum effect of three kinds of correlation parameters. According to probability analysis and status decision, the optimized therapeutic schedule can be calculated and selected, and then we can choose effective drug therapy methods to improve relevance parameters. Statistical analysis of clinical data proves that the model of probability analysis and decision making can provide fast and accurate clinical data.
In the future, through a large collection of various treatment methods and diagnoses, the patient’s diagnosis can be used for deep learning and data mining, improving the effect of calculation in the process of diagnosis and providing doctors with accurate rapid diagnostic methods.
Author Contributions
J.W., Y.T., Z.C. and M.Z. designed the project and drafted the manuscript, collected the data, wrote the code and performed the analysis. All participated in finalizing and approved the manuscript.
Funding
This work was supported in part by Major Program of National Natural Science Foundation of China (71633006); The National Natural Science Foundation of China (81401842, 61672540, 61379057).
Conflicts of Interest
All authors declare that they have no conflicts of interest.
References
- Chen, W.Q.; Zhang, S.W.; Zou, X.N. Evaluation on the incidence, mortality and tendency of lung cancer in China. Thorac. Cancer 2010, 1, 35–40. [Google Scholar] [CrossRef] [PubMed]
- Molina, J.R.; Yang, P.; Cassivi, S.D.; Schild, S.E.; Adjei, A.A. Non-small cell lung cancer: Epidemiology, risk factors, treatment, and survivership. Mayo Clin. Proc. 2008, 83, 584–594. [Google Scholar] [CrossRef]
- Mulshine, J.L.; Sullivan, D.C. Clinical practice: Lung cancer screening. N. Engl. J. Med. 2005, 353, 2194–2195. [Google Scholar]
- Greene, F.L. American Joint Committee on Cancer, American Cancer Society, AJCC Cancer Staging Manual, 6th ed.; Springer: New York, NY, USA, 2002. [Google Scholar]
- Moro, D.; Villemain, D.; Vuillez, J.P.; Delord, C.A.; Brambilla, C. CEA, CYFRA 21-1 and SCC in non-small cell lung cancer. Lung Cancer 1995, 13, 169–176. [Google Scholar] [CrossRef]
- Reinmuth, N.; Brandt, B.; Semik, M.; Kunze, W.P.; Achatzy, R.; Scheld, H.H.; Broermann, P.; Berdel, W.E.; Macha, H.N.; Thomas, M. Prognostic impact of CYFRA 21-1 and other serum markers in completely resected non-small cell lung cancer. Lung Cancer 2002, 36, 265–270. [Google Scholar] [CrossRef]
- Pujol, J.L.; Boher, J.M.; Grenier, J.; Quantin, X. CYFRA 21-1, neuron specific enolase and prognosis of non-small cell lung cancer: Prospective study in 621 patients. Lung Cancer 2001, 31, 221–231. [Google Scholar] [CrossRef]
- Cedrés, S.; Nuñez, I.; Longo, M.; Martinez, P.; Checa, E.; Torrejón, D.; Felip, E. Serum Tumor Markers CEA, CYFRA21-1, and CA-125 Are Associated with Worse Prognosis in Advanced Non–Small-Cell Lung Cancer (NSCLC). Clin. Lung Cancer 2011, 12, 172–179. [Google Scholar] [CrossRef] [PubMed]
- Pfister, D.G.; Johnson, D.H.; Azzoli, C.G.; Sause, W.; Smith, T.J.; Baker, S.; Olak, J.; Stover, D.; Strawn, J.R.; Turrisi, A.T.; et al. American Society of Clinical Oncology treatment of unresectable non-small-cell lung cancer guideline: Updated 2003. J. Clin. Oncol. 2004, 22, 330–353. [Google Scholar] [CrossRef] [PubMed]
- Tan, Y.; Montgomery, S.R.; Aghdasi, B.G.; Inoue, H.; Kaner, T.; Tian, H.; Terrell, R.; Zhang, X.; Wang, J.C.; Daubs, M.D. The Effect of Corticosteroid Administration on Soft Tissue Inflammation Associated with rhBMP-2 use in a Rodent Model of Inflammation. Spine 2012, 38, 806–813. [Google Scholar] [CrossRef] [PubMed]
- Tan, Y.; Aghdasi, B.G.; Montgomery, S.R.; Inoue, H.; Lu, C.; Wang, J.C. Kinetic magnetic resonance imaging analysis of lumbar segmental mobility in patients without significant spondylosis. Eur. Spine J. 2012, 21, 2673–2679. [Google Scholar] [CrossRef] [PubMed]
- Wu, J.; Chen, Z. Data Decision and Transmission Based on Mobile Data Health Records on Sensor Devices in Wireless Networks. Wirel. Pers. Commun. 2016, 90, 2073–2087. [Google Scholar] [CrossRef]
- Jia, W.U.; Chen, Z.; Zhao, M. Effective information transmission based on socialization nodes in opportunistic networks. Comput. Netw. 2017, 129, 297–305. [Google Scholar] [CrossRef]
- Wu, J.; Chen, Z. Sensor communication area and node extend routing algorithm in opportunistic networks. Peer-to-Peer Netw. Appl. 2018, 11, 90–100. [Google Scholar] [CrossRef]
- Cheong, M.; Lee, V.C. A microblogging-based approach to terrorism informatics: Exploration and chronicling civilian sentiment and response to terrorism events via Twitter. Inf. Syst. Front. 2011, 13, 45–59. [Google Scholar] [CrossRef]
- Han, S.; Ng, W.K.; Wan, L.; Lee, V.C. Privacy-Preserving Gradient-Descent Methods. IEEE Trans. Knowl. Data Eng. 2010, 22, 884–899. [Google Scholar] [CrossRef]
- Phua, C.; Smith-Miles, K.; Lee, V.; Gayler, R. Resilient Identity Crime Detection. IEEE Trans. Knowl. Data Eng. 2010, 24, 533–546. [Google Scholar] [CrossRef]
- Chan, L.W.; Chan, T.P.; Cheung, B.T.; Mo, K.; Fung, K.K. Simulation, visualization and dosimetricvalidation of scatter radiation distribution under fluoroscopy settings. J. Biomed. Eng. Inform. 2015, 1, 93–102. [Google Scholar] [CrossRef]
- Chan, L.W.; Lin, X.; Yung, G.; Lui, T.; Chiu, Y.M.; Wang, F.; Tsui, N.B.; Cho, W.C.; Yip, S.P.; Siu, P.M.; et al. Novelstructural co-expression analysis linking the NPM1-associated ribosomal biogenesis network to chronic myelogenous leukemia. Sci. Rep. 2015, 5, 10973. [Google Scholar] [CrossRef] [PubMed]
- Wu, J.; Chen, Z.; Zhao, M. Information cache management and data transmission algorithm in opportunistic social networks. Wirel. Netw. 2018. [Google Scholar] [CrossRef]
- Ren, J.; Zhang, Y.; Zhang, K.; Liu, A.; Chen, J.; Shen, X.S. Lifetime and Energy Hole Evolution Analysis in Data-Gathering Wireless Sensor Networks. IEEE Trans. Ind. Inform. 2016, 12, 788–800. [Google Scholar] [CrossRef]
- Ren, J.; Zhang, Y.; Zhang, N.; Zhang, D.; Shen, X. Dynamic Channel Access to Improve Energy Efficiency in Cognitive Radio Sensor Networks. IEEE Trans. Wirel. Commun. 2016, 15, 3143–3156. [Google Scholar] [CrossRef]
- Ren, J.; Zhang, Y.; Zhang, K.; Shen, X. Adaptive and Channel-Aware Detection of Selective Forwarding Attacks in Wireless Sensor Networks. IEEE Trans. Wirel. Commun. 2016, 15, 3718–3731. [Google Scholar] [CrossRef]
Figure 1.
The process of drug therapy and decision-making.

Figure 2.
Drug treatment decision assumable.

Figure 3.
Data collection in three hospitals.

Figure 4.
(a) Patients CYFRA-21-1 average performance in three hospitals in recent five years. (b) Patients CEA average performance in three hospitals in recent five years. (c) Patients CA-125 average performance in three hospitals in recent five years.
Figure 4.
(a) Patients CYFRA-21-1 average performance in three hospitals in recent five years. (b) Patients CEA average performance in three hospitals in recent five years. (c) Patients CA-125 average performance in three hospitals in recent five years.

Figure 5.
Diagnostic parameters decision in three hospitals in recent five years.

Figure 6.
Diagnostic parameters decision in 30 time points in NSCLC.

Figure 7.
(a) Continuous administration selection analysis (). (b) Continuous administration selection analysis (). (c) Continuous administration selection analysis ().
Figure 7.
(a) Continuous administration selection analysis (). (b) Continuous administration selection analysis (). (c) Continuous administration selection analysis ().


Figure 8.
The accuracy of the diagnostic auxiliary system.


Table 1.
Three hospitals with different medical systems for data acquisition, with beginning and ending times.
Table 1.
Three hospitals with different medical systems for data acquisition, with beginning and ending times.
| Hospital Name | System | Start Time in Collection | Finish Time in Collection |
|---|---|---|---|
| Xiang’ya hospital | HIS | 01-01-2011 | 07-07-2015 |
| EMR | 01-12-2008 | 11-01-2015 | |
| The 2rd Xiang’ya hospital | HIS | 01-09-2009 | 11-05-2015 |
| EMR | 25-09-2009 | 05-27-2015 | |
| EMR document file | 01-01-2011 | 05-10-2015 | |
| LIS | 01-01-2002 | 05-31-2014 | |
| RIS | 01-01-2013 | 12-17-2015 | |
| PACS | 01-01-2012 | 12-18-2015 | |
| The 3th Xiang’ya hospital | HIS | 01-04-2002 | 12-05-2015 |
| EMR | 01-04-2002 | 12-05-2015 | |
| EMR document base | 01-05-2014 | 12-09-2015 |
Table 2.
Diagnose parameter and decision data with normal data in NSCLC.
| CYFRA-21-1 (μg/mL) | 0–1.80 |
| CEA (μg/L) | 0–5.00 |
| CA-125 (KU/L) | 0–35.00 |
Table 3.
Stage partition by diagnose parameter and decision data in NSCLC.
| Stage 1 | 18–57 |
| Stage 2 | 58–119 |
| Stage 3 | 119–180 |
| Stage 4 | >180 |
Table 4.
Data collection in the recent 30 time records.
| CYFRA-21-1 (μg/mL) | CEA (μg/L) | CA-125 (KU/L) | CYFRA-21-1 (μg/mL) | CEA (μg/L) | CA-125 (KU/L) | |||
|---|---|---|---|---|---|---|---|---|
| Sampling set | 1 | 36.71 | 3.29 | 157.64 | 16 | 21.66 | 31.55 | 818.1 |
| 2 | 33.58 | 4.12 | 189.55 | 17 | 16.21 | 24.44 | 101.8 | |
| 3 | 40.23 | 3.15 | 156.31 | 18 | 27.28 | 32.71 | 495.5 | |
| 4 | 31.84 | 3.92 | 179.32 | 19 | 22.98 | 28.27 | 145.6 | |
| 5 | 34.53 | 3.44 | 198.09 | 20 | 19.28 | 31.61 | 981.7 | |
| 6 | 1.20 | 75.48 | 576.12 | 21 | 33.18 | 91.41 | 225.8 | |
| 7 | 1.15 | 82.79 | 498.32 | 22 | 37.95 | 58.88 | 348.7 | |
| 8 | 0.91 | 79.32 | 524.89 | 23 | 22.60 | 64.81 | 288.8 | |
| 9 | 1.01 | 89.11 | 489.36 | 24 | 24.57 | 78.91 | 99.8 | |
| 10 | 1.03 | 84.12 | 518.88 | 25 | 27.61 | 48.17 | 157.8 | |
| 11 | 1.22 | 6.77 | 116.32 | 26 | 31.72 | 21.28 | 722.8 | |
| 12 | 1.41 | 8.24 | 97.54 | 27 | 36.67 | 26.91 | 752.9 | |
| 13 | 1.32 | 16.78 | 104.58 | 28 | 35.11 | 29.18 | 714.7 | |
| 14 | 1.20 | 22.12 | 99.28 | 29 | 28.61 | 24.99 | 856.8 | |
| 15 | 1.19 | 17.95 | 89.65 | 30 | 21.11 | 22.14 | 847.7 | |
© 2018 by the authors. Licensee MDPI, Basel, Switzerland. This article is an open access article distributed under the terms and conditions of the Creative Commons Attribution (CC BY) license (http://creativecommons.org/licenses/by/4.0/).
Share and Cite
MDPI and ACS Style
Wu, J.; Tan, Y.; Chen, Z.; Zhao, M. Data Decision and Drug Therapy Based on Non-Small Cell Lung Cancer in a Big Data Medical System in Developing Countries. Symmetry 2018, 10, 152. https://doi.org/10.3390/sym10050152
AMA Style
Wu J, Tan Y, Chen Z, Zhao M. Data Decision and Drug Therapy Based on Non-Small Cell Lung Cancer in a Big Data Medical System in Developing Countries. Symmetry. 2018; 10(5):152. https://doi.org/10.3390/sym10050152
Chicago/Turabian StyleWu, Jia, Yanlin Tan, Zhigang Chen, and Ming Zhao. 2018. "Data Decision and Drug Therapy Based on Non-Small Cell Lung Cancer in a Big Data Medical System in Developing Countries" Symmetry 10, no. 5: 152. https://doi.org/10.3390/sym10050152
Note that from the first issue of 2016, this journal uses article numbers instead of page numbers. See further details here.