Selecting Products Considering the Regret Behavior of Consumer: A Decision Support Model Based on Online Ratings


School of Management Science and Engineering, Shandong University of Finance and Economics, Jinan 250014, China
*
Authors to whom correspondence should be addressed.
Symmetry 2018, 10(5), 178; https://doi.org/10.3390/sym10050178
Submission received: 16 April 2018
/
Revised: 13 May 2018
/
Accepted: 17 May 2018
/
Published: 21 May 2018
Abstract
:With the remarkable promotion of e-commerce platforms, consumers increasingly prefer to purchase products online. Online ratings facilitate consumers to choose among products. Thus, to help consumers effectively select products, it is necessary to provide decision support methods for consumers to trade online. Considering the decision makers are bounded rational, this paper proposes a novel decision support model for product selection based on online ratings, in which the regret aversion behavior of consumers is formulated. Massive online ratings provided by experienced consumers for alternative products associated with several evaluation attributes are obtained by software finders. Then, the evaluations of alternative products in format of stochastic variables are conducted. To select a desirable alternative product, a novel method is introduced to calculate gain and loss degrees of each alternative over others. Considering the regret behavior of consumers in the product selection process, the regret and rejoice values of alternative products for consumer are computed to obtain the perceived utility values of alternative products. According to the prior order of the evaluation attributes provided by the consumer, the prior weights of attributes are determined based on the perceived utility values of alternative products. Furthermore, the overall perceived utility values of alternative products are obtained to generate a ranking result. Finally, a practical example from Zol.com.cn for tablet computer selection is used to demonstrate the feasibility and practically of the proposed model.
1. Introduction
With the advent of the era of big data, trading on e-commerce platforms develops rapidly [1,2]. Consumers can effectively access product information and make purchase transactions on an e-commerce platform without the restriction of time [3,4,5]. For most consumers, the choice of purchasing product is related to the joy of product experience. With the help of the e-commerce platform, consumers can identify products based on their specific demands and then seek desirable ones. Nowadays, many e-commerce websites, e.g., Amazon (https://www.amazon.cn/), Zol.com.cn (http://www.zol.com.cn/), JD.com (https://www.jd.com/) and Taobao.com (https://www.taobao.com/) have provided platforms for consumers to select their products and share their online ratings or reviews on product experience. For instance, if a consumer wants to purchase a tablet computer due to occupational demand, before purchasing, he/she can browse an overall recommendation of tablet computers via Zol.com.cn which is an IT and business portal. Furthermore, e-commerce sites, such as Zol.com.cn, allow consumers who have already purchased tablet computers to post their personal evaluations publicly online, so that other consumers can get helpful references from these websites. Figure 1 shows a list of tablet computers from Zol.com.cn (http://detail.zol.com.cn/tablepc/good_pic.html). Therefore, it is of great significant to explore the product selection problem oriented on online ratings and reviews in e-commerce platform.
Currently, the evaluation or selection of products oriented to online ratings or reviews has been paid attention by many scholars globally. To support consumer’s selection and purchase decision, Fan et al. designed a novel method based on stochastic dominance and PROMETHEE-II method to rank the alternative products by using online ratings [6]. Yang et al. proposed a method to synthesize rich and heterogeneous information and further used it to rank products with Electronic Word of Mouth (eWOM) score [7]. Chen et al. visualized the market structure from different perspectives and formulated a Technique for Order Preference by Similarity to an Ideal Solution (TOPSIS)-based product selection model [8]. Najmi et al. presented a product ranking system that facilitates the online shopping experience according to online evaluations and description on the products [9]. Wu et al. developed a two-stage consumer decision model from the risk perspective to understand the role of online reviews in the consumers’ Willingness-To-Pay (WTP) [10]. In the field of automobile product selection, Liu et al. proposed an approach on ranking products with online reviews [11]. The approach integrated the sentiment analysis technique and the intuitionistic fuzzy set theory. Using the mobile phone as research object, Peng et al. presented a fuzzy PROMETHEE method to rank alternative products based on online product reviews provided by consumers [12]. To effectively analyze consumer reviews for the purpose of monitoring consumer satisfaction with mobile phones, Kang and Park proposed a sentiment analysis and Vlsekriterijumska Optimizacija I Kompromisno Resenje (VIKOR) method to select the desirable mobile application [13]. A social appraisal mechanism (SAM) was proposed by Li et al. [14] Such mechanism combines social network analysis (SNA), intuitionistic fuzzy sets (IFSs), and the TOPSIS method to achieve social decision support for online users. Li et al. investigated the determinants of consumer satisfaction in hospitality venues by analyzing online reviews [15]. Li et al. introduced a fuzzy decision support technique based on Choquet Integral (CI), which is an aggregation function, into the multiple criteria decision making (MCDM) problem of hotel selection [16]. With respect to restaurant selection, Zhang et al. [17] established a decision support model to help independent tourists utilize social information on TripAdvisor.com.
Although existing literature has made significant contributions to product evaluation or selection problems based on online ratings or reviews, they mainly considered that the consumer is entirely rational. Actually, when the consumer realizes that selecting other products might have better results, he/she would feel regret selecting the current one. Otherwise, the decision maker may feel rejoice. Additionally, the methods to process online ratings or reviews are still rough. Since the scale of the online evaluations is massive, how to design an effective quantification method for the product selection problem is complicated and challenging. Therefore, it is essential to establish a reasonable model to address this problem with massive online evaluations.
Compared with traditional uncertainty problems, the evaluation or selection problem oriented on e-commerce sites with online evaluation data is more complex, because of the complexity of massive data processing. Therefore, this study aimed at proposing a decision support model to select the desirable product(s). To accomplish the overall objective for ranking and selecting products, there are two main tasks to be completed. First, the online evaluation data need to be crawled and normalized. Then, a reasonable model considering the regret behavior of consumers was built to support the product selection and purchase. Finally, a practical selection problem for the method was tested to demonstrate the feasibility of the proposed decision support model.
The remainder of this paper is organized as follows. In Section 2, several basic preliminaries of stochastic variable and regret theory are introduced. In Section 3, the problem formulation and the resolution process for selecting product are established based on online ratings. In Section 4, a novel decision support model is proposed. According to online ratings of products associated with each evaluation attribute, the evaluations of products in format of stochastic variables are constructed. Then, the gain and loss degrees of each alternative over others are calculated. Considering the regret aversion behavior of the consumer, the perceived utility values of alternatives associated with each attribute can be computed. Based on the prior order of evaluation attributes and the perceived utility values, the prior weights of evaluation attributes are determined. Thus, we proposed an aggregating method to derive the ranking of the products. A practical example of selecting products, taking Zol.com.cn as the carrier, is presented to illustrate the practicability of the proposed method in Section 5. Concluding remarks are given in Section 6.
2. Preliminaries
In this section, some basic preliminaries of stochastic variable and regret theory are introduced, which are used throughout this paper.
2.1. Stochastic Variables
To begin with, for notational convenience, let , a stochastic variable, be the consequence of an action. The definitions of stochastic variable and its expected value are introduced firstly [18,19,20].
Definition 1.
Suppose is the domain with . A variable may take all the possible values . Assume is the probability that equals to , with for any , and , then is a discrete stochastic variable in . The cumulative distribution function of is .
Definition 2.
Suppose is the domain with . A variable may take all the possible values in . Assume is the probability that equals to , with and , then is a continuous stochastic variable in . The cumulative distribution function of is .
Definition 3.
Let be a discrete stochastic variable in with , and be the probability that stochastic variable is equal to , with for any , and . The expected value of is defined as
Definition 4.
Let be a continuous stochastic variable, and be the probability density function of stochastic variable . The expected value of is defined as
2.2. Regret Theory
Regret theory, which was developed independently by economists Bell [21] and Loomes and Sugden [22], is a classical behavioral theory for decision making. The basic proposition of regret theory is that individuals are not only concerned about the utility consequence of alternatives, but also concerned about the comparison of the utility consequence with other alternatives. If the utility consequence of an alternative falls short of the other alternative, individuals will experience regret; if it is better than the other alternative, they will experience rejoice [21,22]. Further, individuals are usually more sensitive to regret than to rejoice. Thus, disappointment is a psychological reaction to an outcome whether prior to or after the other outcome. The greater is the negative deviation to other alternative, the greater is the degree of regret, and vice versa.
Later on, based on regret theory, some tools for measuring regret or rejoice degrees are proposed subsequently [23,24,25]. Regret–rejoice function is a key point in regret theory. Assume and are two choices whose utility consequence are and . If we take as a reference point associated with , then the regret–rejoice function is represented as follows [24,25]:
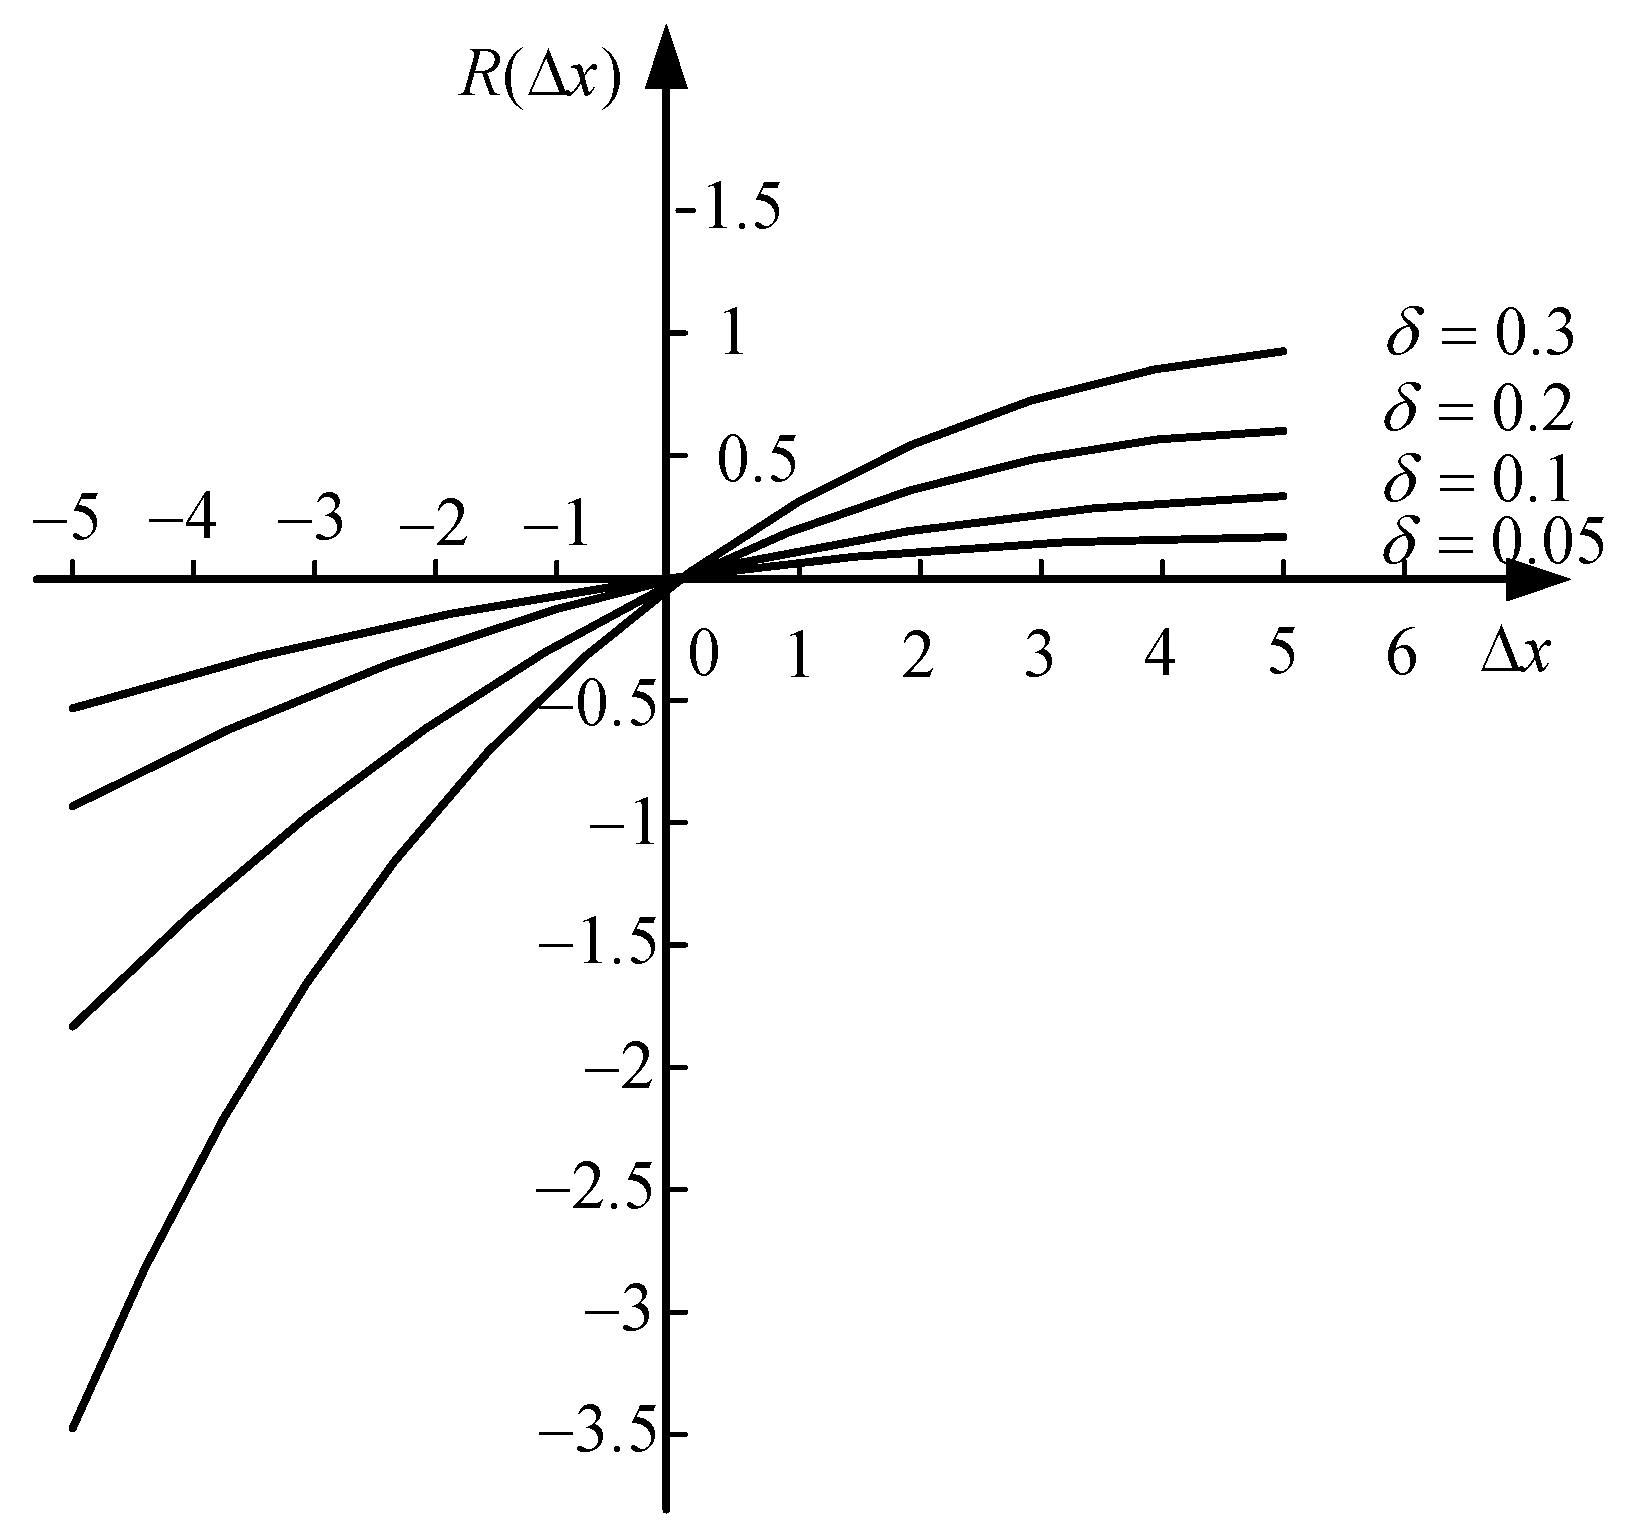
where is the deviation of consequence between and , is the regret aversion parameter, and the larger is, the greater regret aversion degree of the decision maker is. is the regret–rejoice value under the situation for choosing instead of . The regret–rejoice function with different regret aversion parameter is shown as Figure 2.
From regret–rejoice function above, some interesting characteristics are summarized as follows:
Property 1.
The regret–rejoice function is a monotonically increasing concave function, with and .
Property 2.
If , then the decision maker feels regret, , and is the regret degree. On the contrary, if , then the decision maker feels rejoice, , and is the rejoice degree. If , then neither regret nor rejoice can be felt by the decision maker, and .
Property 3.
Suppose , and are three utility consequences, and is the reference utility point. For , if , and , then we have . That is, the decision maker is usually more sensitive to negative deviation than to the same degree of positive deviation, i.e., regret aversion.
3. Problem Formulation and Resolution Procedure
3.1. Formulation of the Problem
Considering a problem that is selecting the most desirable product(s) in e-commerce website. By an advance screening, several acceptable products are determined, which are regarded as the alternatives set. However, different products have different advantages and disadvantages on different attributes. Thus, the consumer hesitates among the several alternative products. Besides, the consumer may have regret aversion behavior in the decision process. To select a desirable product, several evaluation attributes are considered, which are determined according to the consumer’s personal online ratings. To support the consumer’s selection and purchase, many online ratings of the alternative products concerning the attributes are crawled from the related e-commerce platform. The problem considered in this paper is how to rank the products based on the online ratings.
For convenience, throughout this paper, the following notations are used in the problem. Suppose , and are three sets of subscripts. Suppose with is a set of alternative products, where expresses the th alternative product, . Usually, the alternatives set can be predetermined by the consumer. with is a finite set of evaluation attribute, where denotes the th evaluation attribute, . Usually, the set can be determined by two sources. One is provided by consumer indirectly and the other is derived from online evaluations. Assume is a vector of attribute weights, where is the weight assigned to attribute with for , and . However, sometimes the weight vector of evaluation attribute is unknown. The prior order of evaluation attributes is provided by the consumer. In addition, suppose is the rating scales set used by an electronic platform, where is the th rating scale, . is the total number of online ratings for product associated with attribute . is a number that scale used as the online rating for product associated with attribute . In fact, and should be derived in this study.
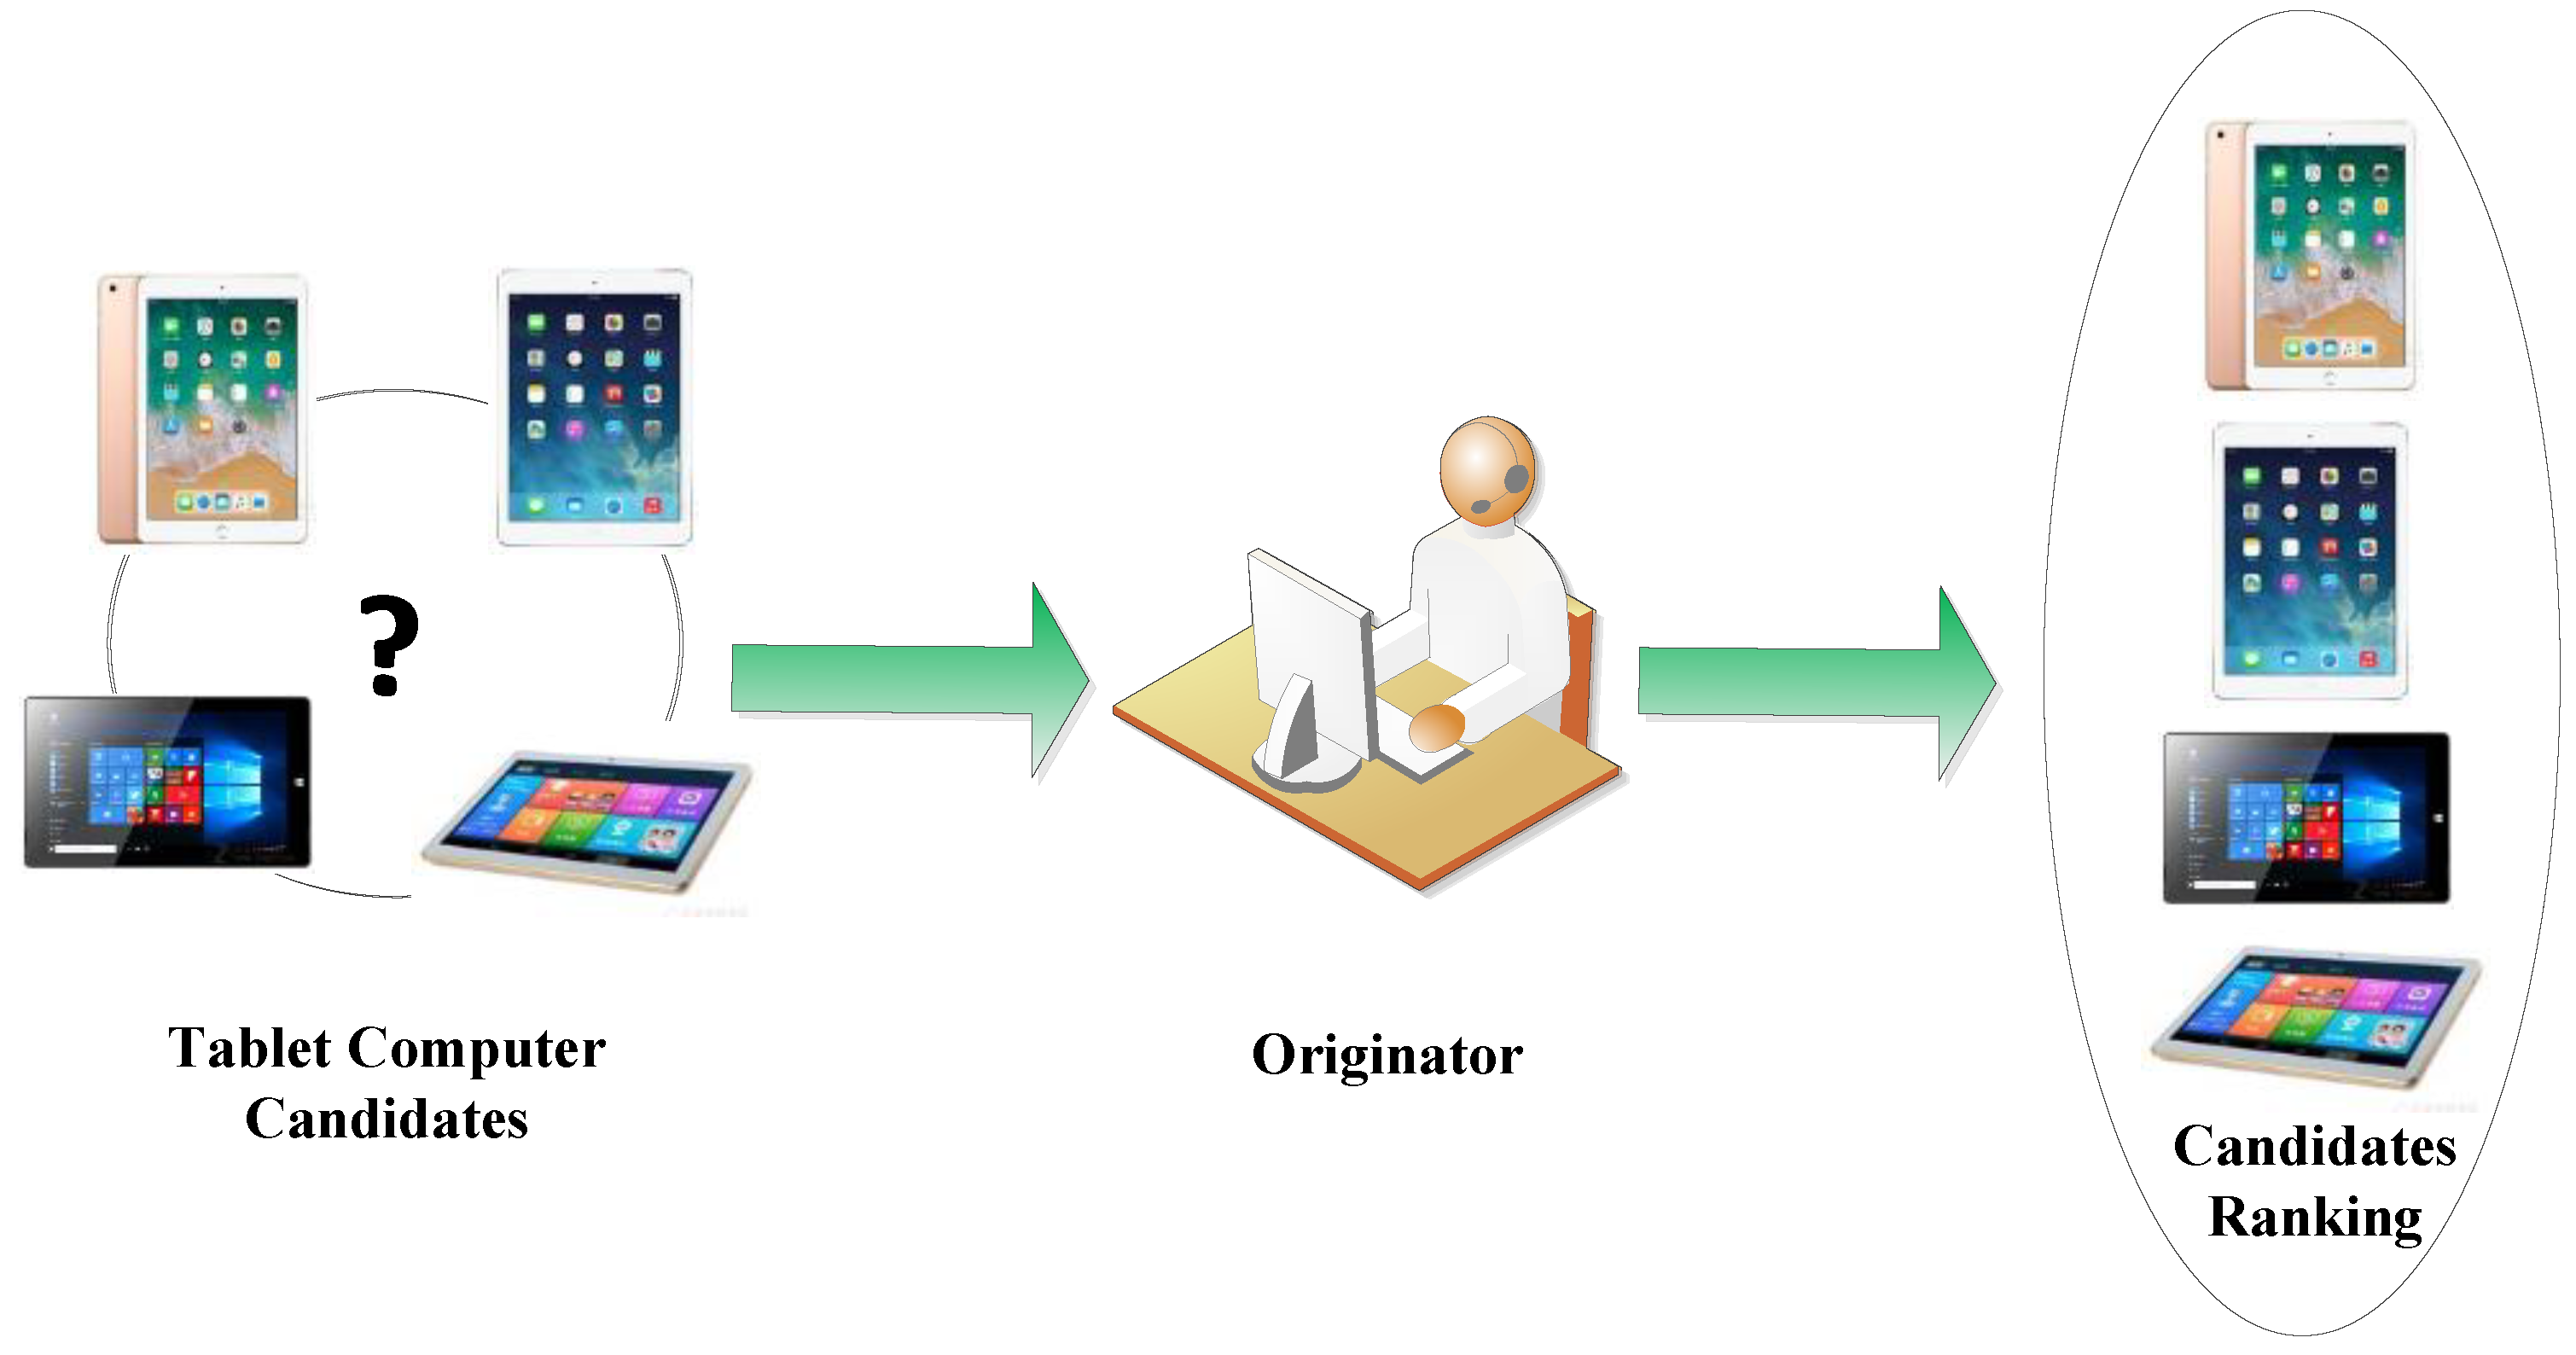
The problem addressed in this study is how to select the most desirable alternative product(s) from the finite alternative set based on the online ratings and evaluation attributes with prior order, consider the regret aversion behavior of the consumer. In Figure 3, taking the selection of tablet computers as an example, the formulation of ranking and selection of tablet computers through online ratings is described concretely.
3.2. Framework and Processing for the Problem
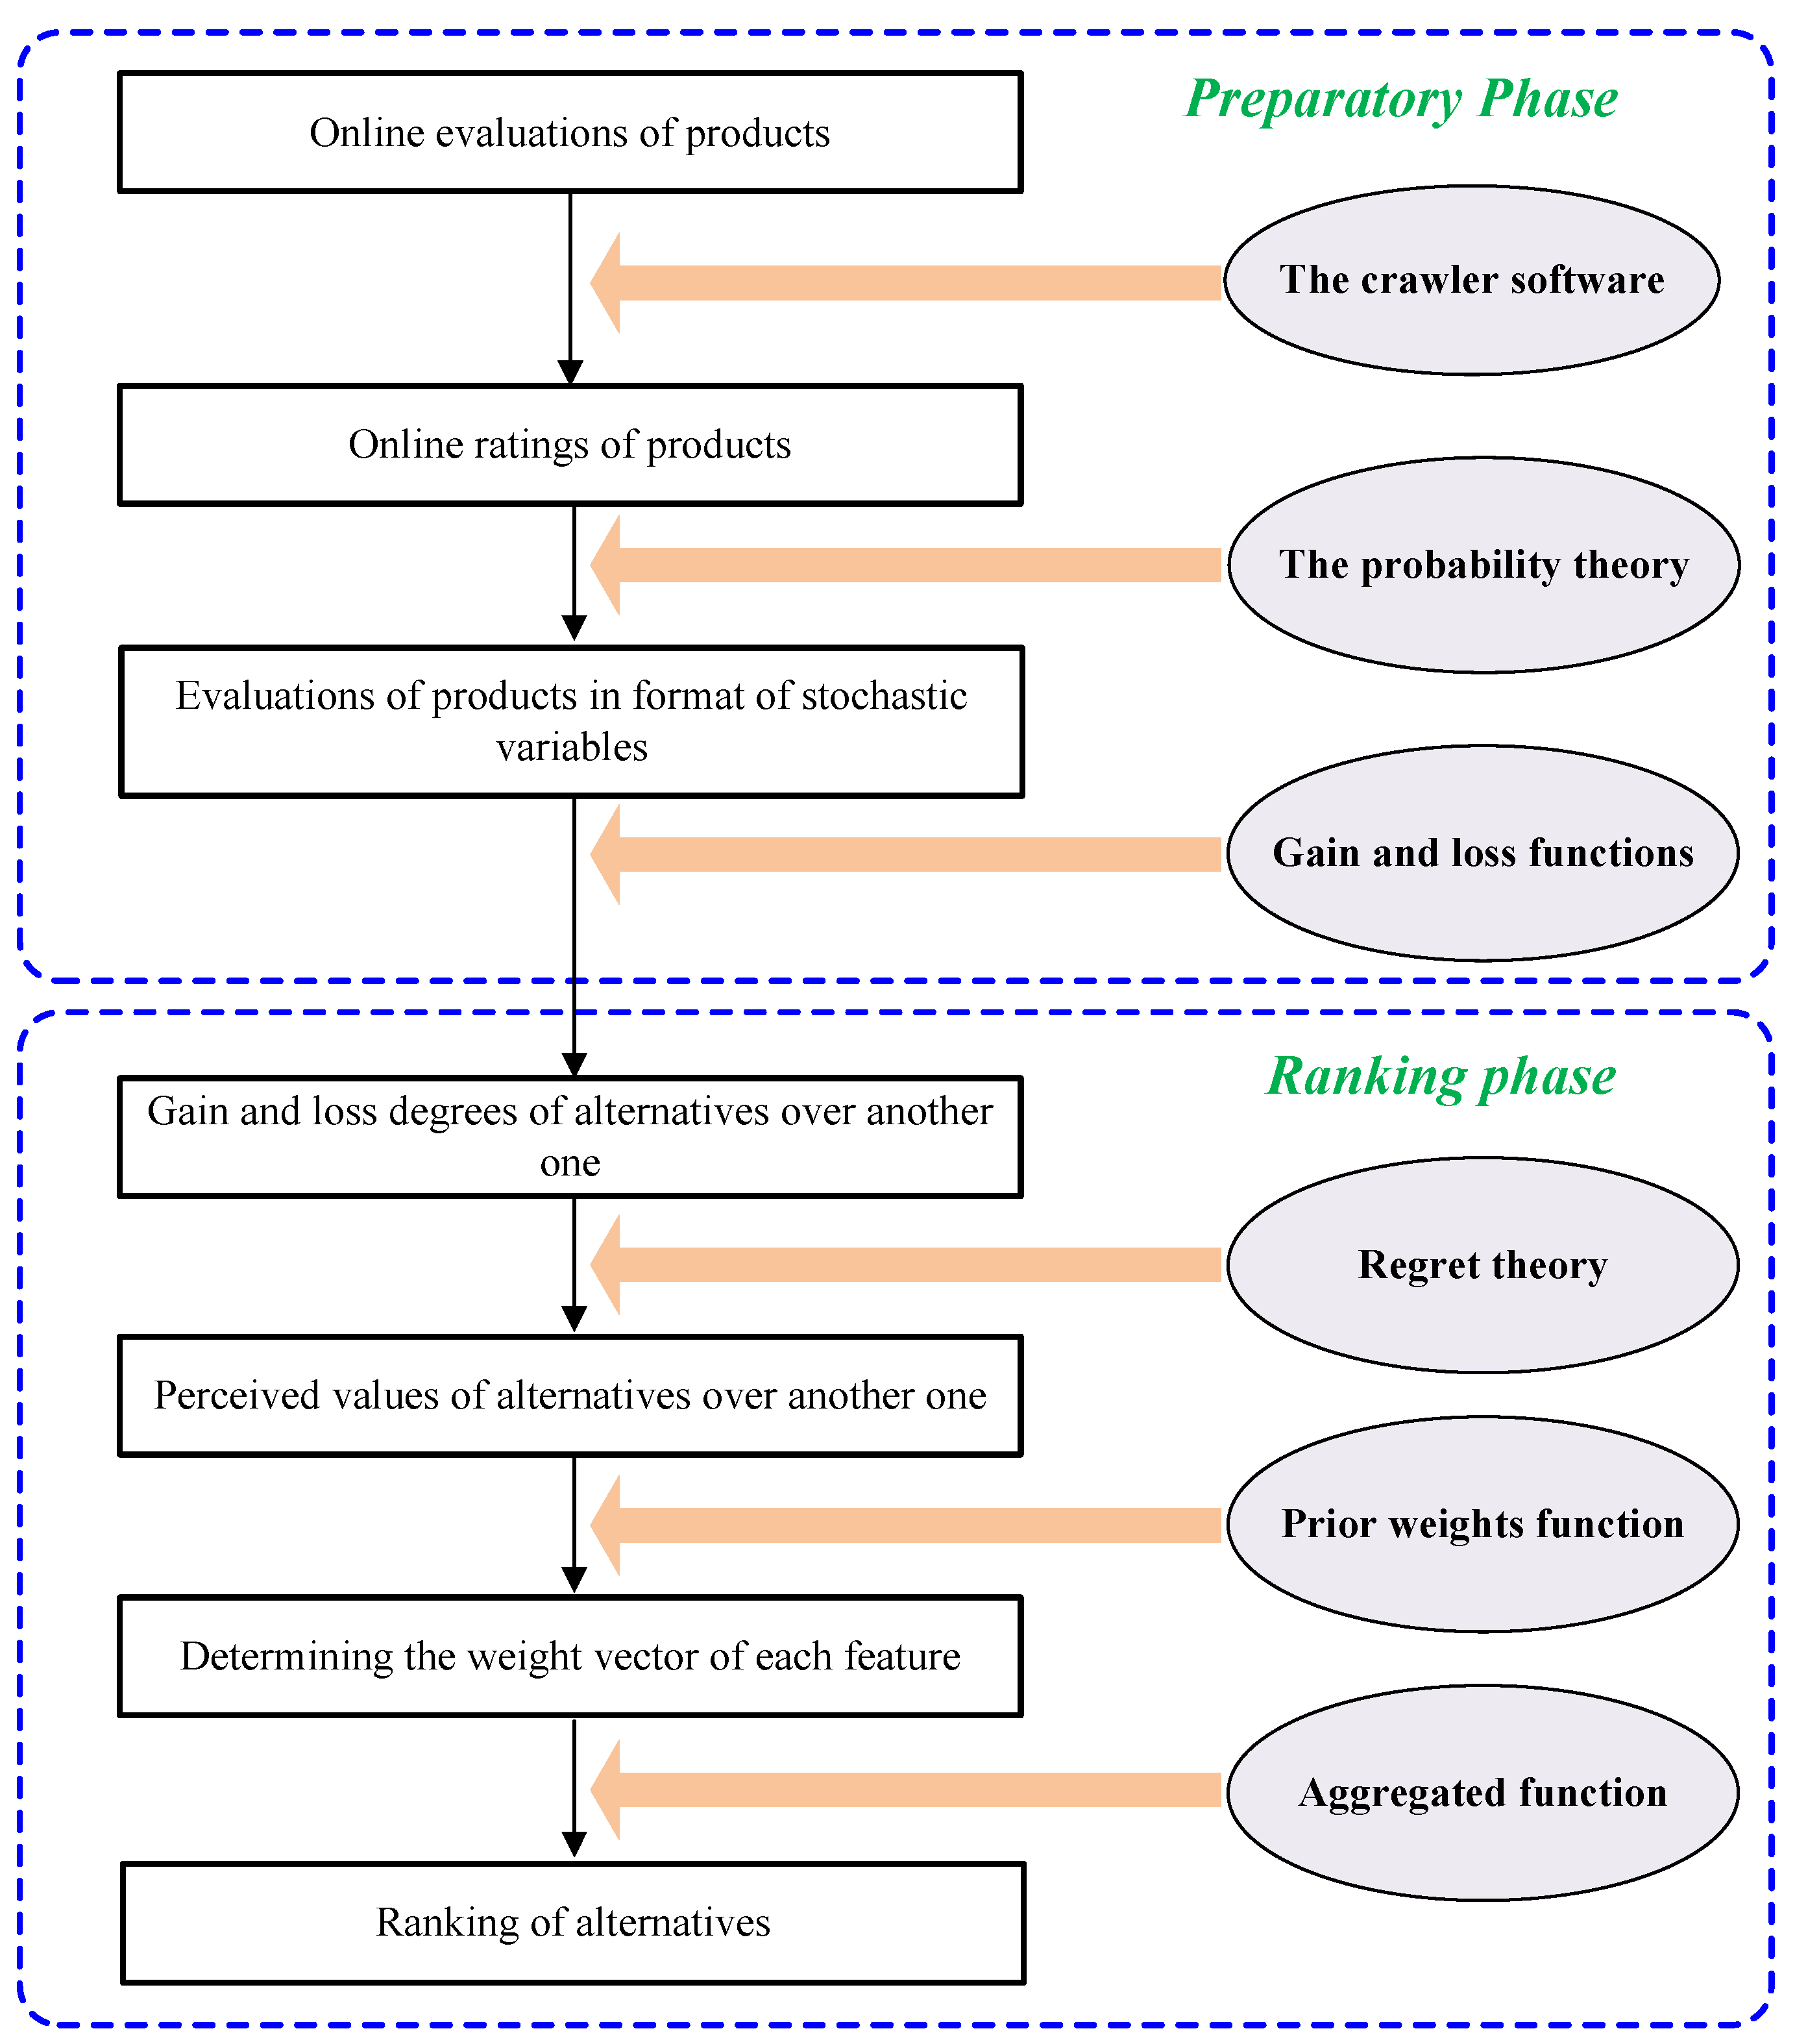
To solve the above decision-making problem, a resolution process of selecting products is proposed as shown in Figure 4. In Figure 4, the resolution process can be divided into two parts: (1) preparatory phase, i.e. crawling the related online ratings data and constructing the stochastic evaluations of products; and (2) ranking phase, i.e. considering the behavior of the consumer, a ranking method for products is proposed. A brief illustration of each part is given below.
Preparatory Phase. Based on the alternative products and the evaluation attributes considered by the consumer, the online ratings of the alternative products concerning all attributes are crawled from the related website using web crawler software and are preprocessed using the probability theory. Further, based on the probabilistic theory method and online ratings of products, the evaluations of products in format of stochastic variables are constructed.
Ranking Phase. According to online ratings of products associated with each evaluation attribute, the evaluations of products in format of stochastic variables are constructed. Then, the gain and loss degrees of each alternative over others is calculated. Considering the regret aversion behavior of the decision maker, based on the regret–rejoice function, the perceived utility values of alternatives associated with each attribute is computed. Based on the prior order of evaluation attributes and the perceived utility values of the products, the prior weights of evaluation attributes are determined. Thus, the aggregating method obtains the ranking of the products.
4. The Proposed Stochastic Decision Model Considering Consumer’s Regret Behavior
Based on the resolution process shown in Figure 4, a description of the proposed method for ranking and selecting products through online ratings is given in this section, where the description for determining the stochastic evaluations information is in Section 4.1. Then, the method for calculating gain and loss degrees of alternative over others is established in Section 4.2. The regret and rejoice perceived values of alternatives is proposed in Section 4.3. Based on the stochastic evaluations and attribute prior order provided by consumer, the prior weight vector of attribute is determined in Section 4.4. Finally, in Section 4.5, the method for obtaining the ranking result of products is presented.
4.1. Determining the Stochastic Evaluation Information
In this paper, to provide a decision support model to select desirable(s) product, the online ratings for the products concerning all evaluation attributes should be considered. Thus, the preparatory phase can be further divided into two parts: (1) crawling online ratings for the alternative with respect to all attributes; and (2) preprocessing online ratings to alternatives’ assessments in format of stochastic variables. Thee detailed description of each part is given below.
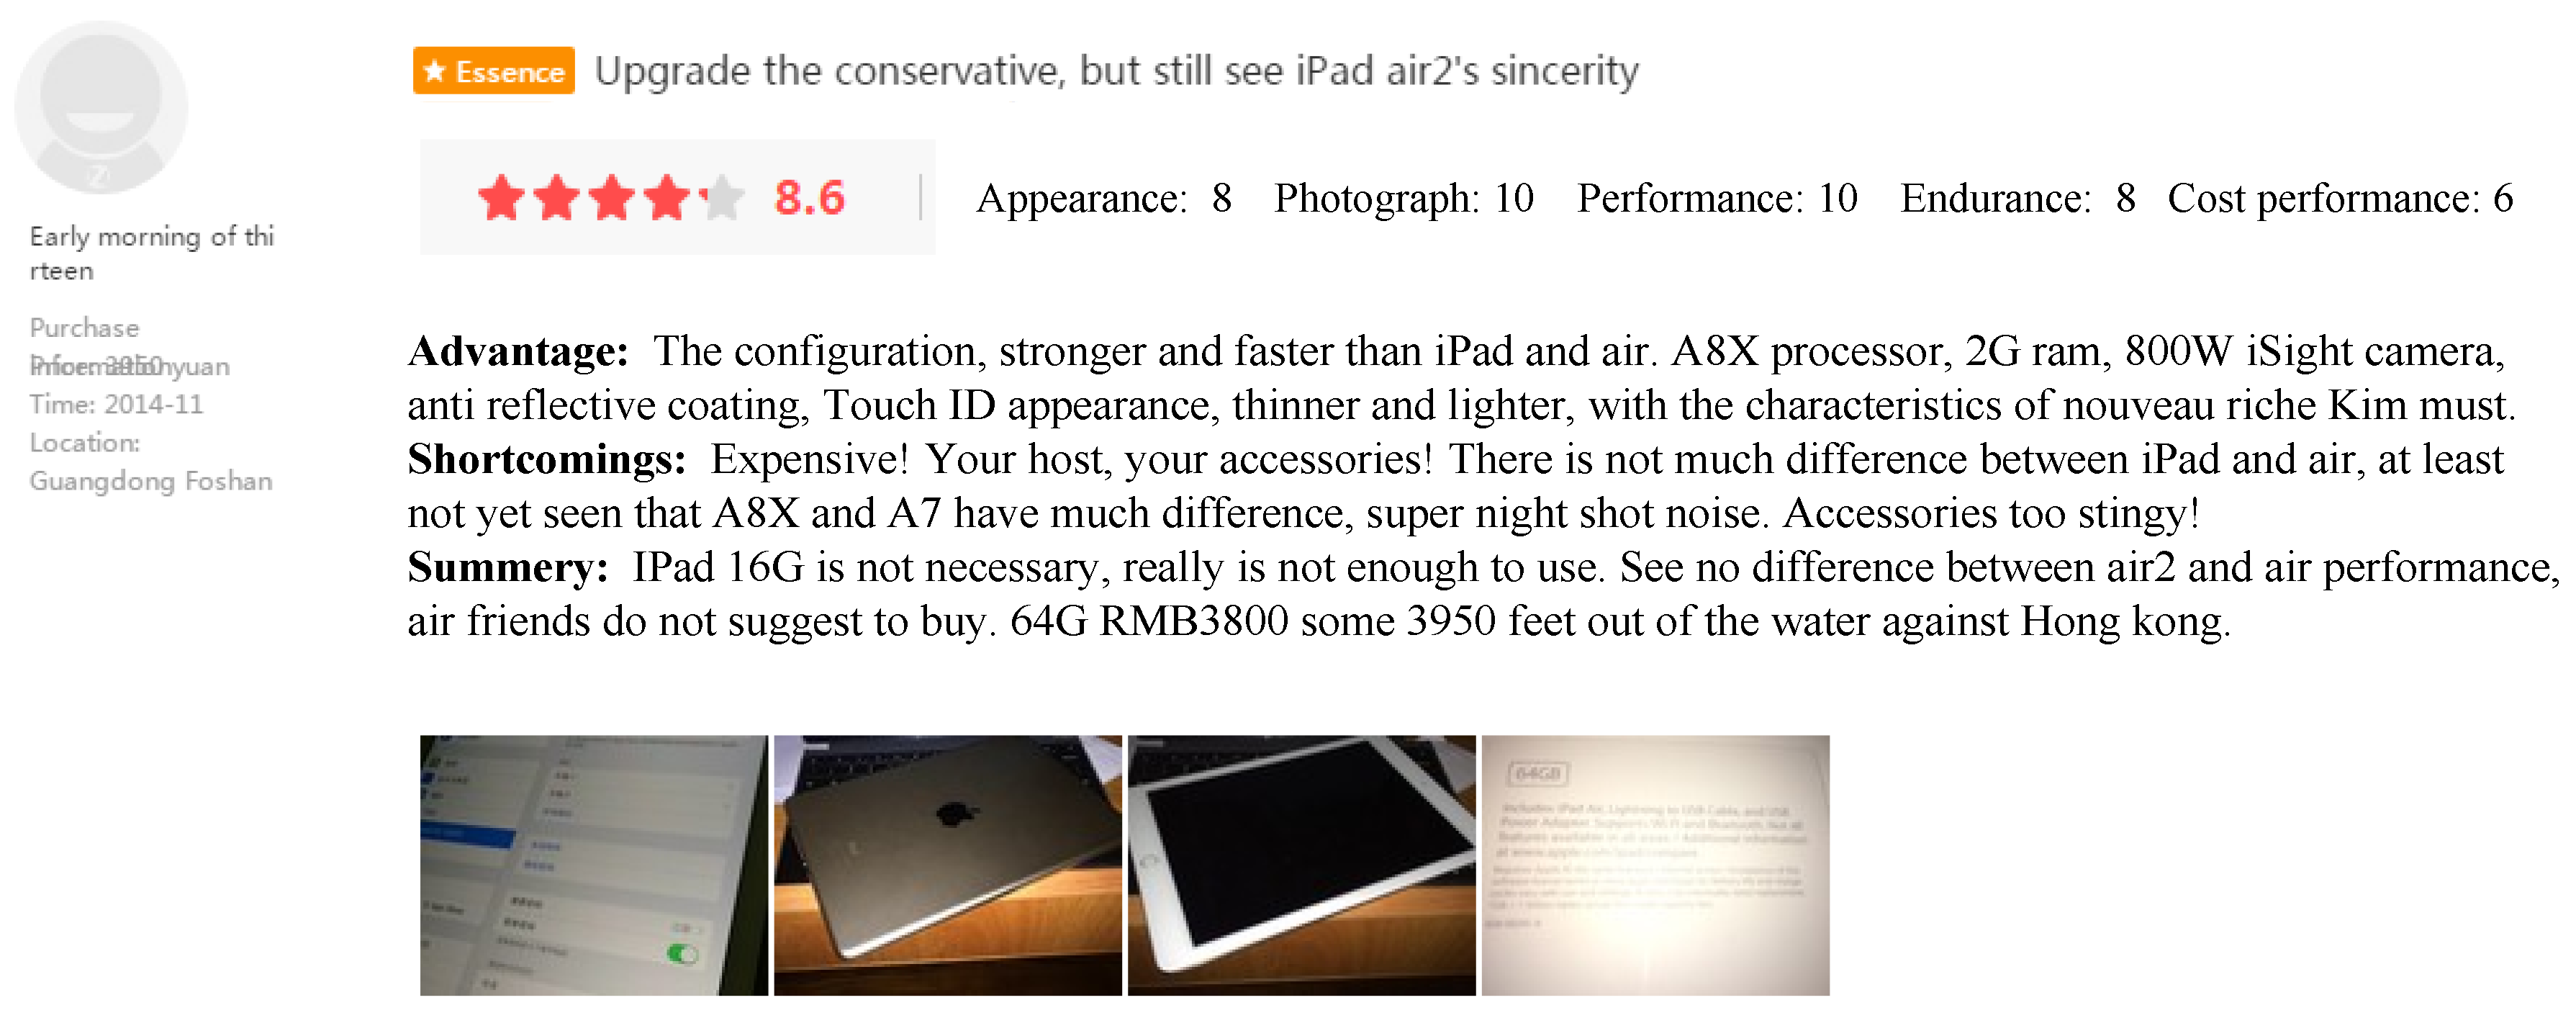
Nowadays, some web crawlers have been presented, which can be used to derive the online evaluations. Currently, some websites encourage consumers to post their evaluations according to a pre-established framework of evaluation attributes. For example, Zol.com.cn constructs a framework on the attributes of products, and encourages the consumers to post their ratings and reviews according to the framework. In this paper, the crawler software named Octopus collector is used to obtain online ratings. According to the alternative products set, i.e., , the online ratings with respect to alternative products can be crawled and collected from the related website. Besides, a situation where ratings are posted according to the pre-established framework of attributes set , for example, an online rating and review for Apple iPad Air 2 from Zol.com.cn, is shown in Figure 5 (http://detail.zol.com.cn/372/371503/review.shtml). In this figure, we can obtain the five attributes for selecting tablet computers, i.e., appearance, photograph, performance, endurance and cost performance. With respect to five attributes, the online ratings of tablet computers are provided by every consumer.
We suppose is a rating scales set used by an electronic platform. To accurately describe the differences, in this paper, the evaluations of alternative products are represented as evaluations in format of stochastic variables. After crawling the online ratings, based on Excel, the statistical data aare summarized. Suppose is the total number of online ratings for products associated with attribute . is the number scale used as the online ratings for products associated with attribute .
Let , , in format of stochastic variable, be the evaluation value for product associated with attribute . The probability that the alternative product on attribute is expressed as is defined as , ; ; .
where , , , .
4.2. Calculation of the Gain and Loss Degrees
In the process of decision making, the consumer will compare alternative products to other products, If he/she selects an alternative product instead of a better one, he/she may feel regret for this selection. On the contrary, the consumer may feel rejoice. Thus, to measure the perceived utility values of alternatives to select the desirable alternative, the gain and loss degrees of alternatives with respect to others should be calculated. We suppose and are gain degree and loss degree of alternative with respect to on attribute .
For gain degree and loss degree , the following properties are provided.
Property 4.
(Complementarity) For and , we obtain and .
Property 5.
(Compensatory) Let and be expectations of stochastic variables and . For , we obtain . For , we obtain .
Proof.
For , based on Equations (5) and (6), we can obtain that
The expectations and of stochastic variables and are given as
Since stochastic variables and are independent [18], we obtain . Thus, it can be observed that . ☐
Property 6.
(Middle Boundary) For , we have if and only if . For , we obtain if and only if .
Proof.
For , if , we obtain according to Property 4. According to Property 5, we obtain , i.e., . In contrast, if , we obtain , i.e., .
Similar to the above proof, we can prove if and only if . ☐
Property 7.
(Transitivity) For and , if and , then .
Proof.
For , if , i.e., , we obtain according to Property 6. If , i.e., , we obtain by Property 6; thus, . According to Property 6, it can be observed that , i.e., . ☐
Example 1.
Let and be two interval stochastic variables whose probability distributions are shown as in Table 1.
By using Equations (5) and (6), we could obtain the gain and loss degrees of over , respectively.
4.3. Determining the Stochastic Evaluation Information
In addition to comparing the selected alternative with other options, the consumer has a behavior characteristic of regret aversion. That is, the consumer is more sensitive with loss degree to the same magnitude of gain degree. To calculate the perceived values of alternatives, let and be the rejoice value and regret value of alternative relative to on attribute . Based on the function of regret–rejoice [24,25], and can be obtained by
where is the regret aversion parameter, which measures the level of regret aversion of the decision maker.
According to Equations (10) and (11), several interesting properties are summarized as follows:
Property 8.
and .
Property 9.
and increase monotonically as the gain degree and loss degree increase, respectively.
Furthermore, the perceived utility matrix on attribute can be established. In the matrix , the element , which combines rejoice degree and regret degree , denotes the perceived utility value of alternative over alternative for attribute which combines rejoice degree and regret degree . It is given by
Based on Equations (10)–(12), the following characteristics can be obtained.
Property 10.
If , then alternative net superior to for attribute . If , then alternative net superior to for attribute .
After obtaining the perceived utility value of alternative over on attribute , the overall perceived utility value of alternative on attribute can be integrated by
4.4. Determination of Evaluation Attributes’ Weights
In this study, for evaluation attributes set , we suppose the prior order of evaluation attributes is provided by consumer. Without loss of generality, we suppose . To aggregated the perceived utility values into overall perceived utility value , the prior weight vector should be determined. In the following, we determine the prior weight of evaluation attribute based on the perceived utility value of alternative on evaluation attribute .
Taking the alternative as an example, first, let the weight of highest evaluation attribute be . Then, the others relative prior weight of evaluation attribute is defined as
Here, we use a sigmoid non-linear transformation function to transform the perceived utility value into :
where is the parameter of transformation function.
Then, we normalize the relative prior weight of prior evaluation attribute into prior weight :
According to Equations (14)–(16), interesting properties are summarized in the following.
Property 11.
For , , we have , and , i.e., increase monotonically as the perceived utility value .
Proof.
Since , and , we have , that is , , increase monotonically as the perceived utility value . ☐
Property 12.
For , , if , , we have . That is, the evaluation attribute weight of high prior is not less than the evaluation attribute weight of the lower prior.
Proof.
Since and , if for , then we have based on Equation (14), and based on based on Equation (15). Thus, . Based on Equation (16), we have . That is the evaluation attribute weight of high prior is not less than the evaluation attribute weight of the lower prior. ☐
4.5. Ranking Alternatives
After determining the prior weights of evaluation attributes as well as the perceived utility values of alternatives on all attributes, the overall perceived utility value of alternative can be computed as
According to perceived utility value , the ranking list of alternatives can be derived. A larger value of indicates that is a better alternative.
Based on the above analysis, the decision procedures of the proposed method and flowchart (Figure 6) for handling the selection problem with online ratings can be summarized as follows:
- Step 1.
- Crawl the online ratings and construct evaluation in format of stochastic variable .
- Step 2.
- Construct gain matrix and loss matrix on attribute according to Equations (5) and (6).
- Step 3.
- Obtain perceived utility matrix on attribute according to Equations (10)–(12).
- Step 4.
- Determine the prior weight vector associated with according to Equations (13)–(16).
- Step 5.
- Calculate overall perceived utility value of alternative according to Equation (17).
- Step 6.
- Determine the alternatives ranking result.
5. A Case Study
We used the case of selecting a desirable tablet computer through online ratings in ZOL website to explain the practicality of the proposed decision support model.
A consumer wants to buy a tablet computer because of the occupational requirement. However, since the consumer has limited knowledge on electronic products, it is difficult to select an optimal or satisfying alternative tablet computer in time. Thus, it is necessary to decide using an e-commerce platform. ZOL website (http://www.zol.com.cn/) is one of the leading e-commerce platforms in China, which locates in the sales promotion of IT interactive portal. ZOL website collects product data for information technology on professional online video interactive marketing as one of the complex media. It is also the CBS interactive group interactive media company’s flagship media in China. It provides many kinds of online ratings and reviews about electronic products.
By limiting the brand, basic function and price of tablet computers, five alternative tablet computers were initially screened by the consumer on ZOL website. The consumer needs to select a desirable tablet computer from the following five alternative tablet computers.
- : Apple iPad mini 2
- : GALAXY Tab S T800
- : MI Pad
- : ASUS ZenPad 3S 10
- : Apple iPad Air 2
Based on the information of the e-commerce services platform, the following five attributes associated with alternative tablet computers are considered: appearance (), photograph (), performance (), endurance () and cost performance (). The prior order of the attributes is . The consumer provides the prior order of evaluation attributes as a weight vector of the five evaluation attributes, which are denoted as . The proposed method in Section 4 is applied to rank these five alternative tablet computers. The calculation processes and discussion are expressed below.
5.1. Methodology and Results
Because the original data obtained from e-commerce websites are complex and massive, we must further convert the original data into structural data. First, we used crawl software to extract the online ratings of five tablet computers on evaluation attributes from the website of ZOL.COM.CN. The total numbers of the online ratings for tablet computers are 471, 144, 138, 102 and 429, respectively. On this website, the scales set of ratings is . Then, the total number of each scale for each tablet computer on each evaluation attribute can be counted. Thus, the stochastic evaluations of alternative tablet computer concerning attribute are formatted as distributed information using Equation (4). Thus, we form the distribution linguistic decision matrix of five alternative tablet computers with respect to five attributes as shown in Table 2, Table 3, Table 4, Table 5 and Table 6.
Then, according to Equations (5) and (6), based on the evaluations of alternatives in format of stochastic variables, the gain matrix and loss matrix on attribute are constructed. Considering the regret behavior of consumer, the perceived utility matrix can be calculated according to Equations (10)–(12). Here, we suppose the parameter . Given space limitations in this paper, we only give the perceived utility matrices in the following:
Then, the perceived utility value of alternative on attribute can be calculated by Equation (13). The perceived utility matrix is shown as follows:
Based on prior order of evaluation attributes and Equations (14)–(16), the prior weights vectors of evaluation attributes associated with product are , , , , and . By aggregating the perceived utility values of alternatives on different attributes using Equation (17), the overall perceived utility values are:
According to the descending order of the values of , the ranking result of these five alternatives are obtained as follows:
5.2. Analysis on the Effect of the Parameter of Regret Aversion
In this section, to show the robustness of the proposed method, we design a sensitivity analysis for our proposal. In a real decision-making situation, due to the different focuses of the decision makers, their regret aversion degrees are different. The degrees of regret aversion are embodied in different regret aversion parameters. Thus, different regret aversion parameters might be used by different decision makers.
We suppose that the parameter can be assigned different numbers: , , and . Different s yield different results, as shown in Table 7.
Thus, the ranking results under the different parameter are Table 7, in which the ranking results are similar but not identical. If or , the ranking result is . In the case of or , the ranking result is . Thus, the parameter reflects regret aversion degree of consumer, which directly leads to the different ranking results.
5.3. Comparison Analysis
In this subsection, to show the better feasibility of the proposed method, we take the example from Fan and coworkers’ study [6]. Furthermore, we compare the proposed method with the previously designed ones by Fan et al. [6] and Kang and Park [13]. The problem formulation and comparison process are shown as follows.
Example.
[6] A consumer wants to buy an SUV from the following five alternatives: : Jeep, Compass; : Mazda, CX5; : Subaru, Forester; : Toyota, Highlander; and : Chevolet, Kopacz. Based on the information provided by the e-commerce services platform (http://www.autohome.com.cn/), the following eight attributes associated with alternative SUVs are considered: Trunk space (), Power (), Control (), Fuel consumption (), Comfortability (), Appearance (), Cost performance () and Price (). First, the consumer provides the weight vector of attributes: . The corresponding online product ratings are extracted from the website of Autohome (http://www.autohome.com.cn/). Then, the evaluations of products are formulated as distribution information presented in Table 8.
The methods developed by Fan et al. [6] and Kang and Park [13] as well as our method presented in Section 4 are separately applied to rank these five alternative SUVs. Since first two methods only address the situation that consumer is entirely rational, to make the comparison worthwhile, we also suppose that the consumer is entirely rational. Consequently, we first assume that the regret–rejoice function is . Then, the different degrees of consumer’s regret behavior are considered subsequently. The ranking results are listed in Table 9.
As shown in Table 9, the trend of sorting results by using the mentioned methods are similar, except the first ranking result is quite different from others. With respect to the first method provided by Kang and Park [13], the assessments that are transformed from online reviews were slightly rough. Moreover, some information on different evaluation levels is partially ignored. Therefore, comparing the results, the method proposed in this study can avoid information loss when transforming the online reviews into crisp evaluations. Furthermore, by using our method, more accurate overall compromise values of alternative SUVs can be generated to obtain a more persuasive ranking result. With respect to the method based on stochastic dominance theory provided by Fan et al. [6], the ranking result is completely consistent with the one given by this study. However, by stochastic dominance theory, the dominance relationship between any two alternatives can be determined. According to the dominance relationship, the dominance degree of a product over another one can be calculated subsequently. The method to determine the dominance relationship and dominance degrees has a higher computational complexity than the proposed method. Additionally, in this study, the different degrees of consumer’s regret behavior are considered, which improves the feasibility of the decision results in dealing with the realistic problem.
6. Conclusions
The decision-making problem for products selection oriented on online evaluations has important theoretical significance and practical application value. To facilitate the selection of products for consumers, an effective decision-making support model needs to be investigated. In this paper, with respect to selection of products, a decision support model is proposed based on massive online ratings. In the proposed method, by crawling the massive online ratings for products provided by different reviewers, quantitative information is prepared for decision making process. Then, considering the regret aversion behavior of consumer, the perceived utility values of consumer for alternatives is proposed. It provides one more valid tool for uncertain decision-making problem with stochastic variables information.
Compared with existing studies, this research has the following contributions. On the one hand, from a realistic perspective, the product selection problem oriented on massive online ratings is investigated to propose a novel decision model to support selection and purchase. Then, the regret aversion behavior of consumer is considered, which is more realistic than other methods based on online evaluations. On the other hand, from a theoretical point of view, to preserve the integrity of the raw data as much as possible, we processed the massive ratings into stochastic evaluations. This avoids the information loss or distortion in the existing methods. Then, a more accurate method of comparison any two stochastic variables is constructed to calculate rejoice values and regret values of alternatives, subsequently.
For future studies, to make the decision result more comprehensive, it is worth noting that online reviews can be considered as well as online ratings [11,12]. Further, since the evaluation attribute is unknown, mining evaluation attributes from online reviews needs to be investigated. Additionally, evaluation on green supply chain, population resources and environment by public participation [26,27,28] can be incorporated into future investigations.
Author Contributions
X.L. and P.L. proposed the topic explored in this paper. X.L. and P.L. discussed and designed the decision support model. X.L. and Z.L. conducted the sensitivity analysis and comparison analysis in the case study. X.L. wrote the paper. In addition, Y.S. in Shandong University of Finance and Economics thoroughly reviewed and improved the paper. All authors have discussed and contributed to the manuscript. All authors have read and approved the final manuscript.
Acknowledgments
This work was jointly supported by the National Natural Science Foundation of China (NSFC, Project Nos. 71771140 and 71701111), the Humanities and Social Sciences Research Project of Ministry of Education of China (Nos. 17YJC630077 and 17YJA630065), the Shandong Province Social Science Planning Project (No. 16DGLJ06), the Project of Shandong Province Higher Educational Science and Technology Program (No. J17KA189) and Natural Science Planning Project of Shandong province (No. ZR2017MG007).
Conflicts of Interest
The authors declare no conflict of interest.
References
- Choshin, M.; Ghaffari, A. An investigation of the impact of effective factors on the success of e-commerce in small- and medium-sized companies. Comput. Hum. Behav. 2017, 66, 67–74. [Google Scholar] [CrossRef]
- Alsaad, A.; Mohamad, R.; Taamneh, A. What drives global B2B e-commerce usage: an analysis of the effect of the complexity of trading system and competition pressure. Technol. Anal. Strateg. 2018, 214, 1–13. [Google Scholar] [CrossRef]
- Guo, Y.; Wang, M.X.; Li, X. An interactive personalized recommendation system using the hybrid algorithm model. Symmetry 2017, 9, 216. [Google Scholar] [CrossRef]
- Sparks, B.A.; Browning, V. The impact of online reviews on hotel booking intentions and perception of trust. Tour. Manag. 2011, 32, 1310–1323. [Google Scholar] [CrossRef] [Green Version]
- Song, H. The structure of customer satisfaction with cruise-line services: An empirical investigation based on online word of mouth. Curr. Issues Tour. 2015, 18, 450–464. [Google Scholar]
- Fan, Z.P.; Xi, Y.; Liu, Y. Supporting consumer’s purchase decision: A method for ranking products based on online multi-attribute product ratings. Soft Comput. 2017, 6, 1–15. [Google Scholar] [CrossRef]
- Yang, X.; Yang, G.; Wu, J. Integrating rich and heterogeneous information to design a ranking system for multiple products. Decis. Support Syst. 2016, 84, 117–133. [Google Scholar] [CrossRef]
- Chen, K.; Kou, G.; Shang, J.; Chen, Y. Visualizing market structure through online product reviews. Electron. Commer. Res. Appl. 2015, 14, 58–74. [Google Scholar] [CrossRef]
- Najmi, E.; Hashmi, K.; Malik, Z.; Rezgui, A.; Khan, H.U. CAPRA: A comprehensive approach to product ranking using customer reviews. Computing 2015, 97, 843–867. [Google Scholar] [CrossRef]
- Wu, J.; Wu, Y.; Sun, J.; Yang, Z. User reviews and uncertainty assessment: A two stage model of consumers’ willingness-to-pay in online markets. Decis. Support Syst. 2013, 55, 175–185. [Google Scholar] [CrossRef]
- Liu, Y.; Bi, J.W.; Fan, Z.P. Ranking products through online reviews: A method based on sentiment analysis technique and intuitionistic fuzzy set theory. Inf. Fusion 2017, 36, 149–161. [Google Scholar] [CrossRef]
- Peng, Y.; Kou, G.; Li, J. A Fuzzy PROMETHEE Approach for Mining Customer Reviews in Chinese. Arabian J. Sci. Eng. 2014, 39, 5245–5252. [Google Scholar] [CrossRef]
- Kang, D.; Park, Y. Review-based measurement of customer satisfaction in mobile service: Sentiment analysis and VIKOR approach. Expert Syst. Appl. 2014, 41, 1041–1050. [Google Scholar] [CrossRef]
- Li, Y.M.; Lai, C.Y. A social appraisal mechanism for online purchase decision support in the micro-blogosphere. Decis. Support Syst. 2014, 59, 190–205. [Google Scholar] [CrossRef]
- Li, H.; Ye, Q.; Law, R. Determinants of Customer Satisfaction in the Hotel Industry: An Application of Online Review Analysis. Asia Pac. J. Tour. Res. 2013, 18, 784–802. [Google Scholar] [CrossRef]
- Li, G.; Law, R.; Vu, H.Q.; Rong, J. Discovering the hotel selection preferences of Hong Kong inbound travelers using the Choquet Integral. Tour. Manag. 2013, 36, 321–330. [Google Scholar] [CrossRef]
- Zhang, H.Y.; Ji, P.; Wang, J.Q.; Chen, X.H. A novel decision support model for satisfactory restaurants utilizing social information: A case study of TripAdvisor.com. Tour. Manag. 2017, 59, 281–297. [Google Scholar] [CrossRef]
- Sheng, Z.; Xie, S.Q.; Pan, C.Y. Probability and mathematical statistics; Higher Education Press: Beijing, China, 2001. [Google Scholar]
- Chen, Z.S.; Chin, K.S.; Li, Y.L.; Yang, Y. Proportional hesitant fuzzy linguistic term set for multiple criteria group decision making. Inf. Sci. 2016, 357, 61–87. [Google Scholar] [CrossRef]
- Jiang, Y.P.; Liang, H.M.; Sun, M.H. A method for discrete stochastic MADM problems based on the ideal and nadir solutions. Comput. Ind. Eng. 2015, 87, 114–125. [Google Scholar] [CrossRef]
- Bell, D.E. Regret in decision making under uncertainty. Oper. Res. 1982, 30, 961–981. [Google Scholar] [CrossRef]
- Loomes, G.; Sugden, R. Regret theory: An alternative theory of rational choice under uncertainty. Econ. J. 1982, 92, 805–824. [Google Scholar] [CrossRef]
- Zeelenberg, M.; Pieters, R. Beyond valence in customer dissatisfaction: A review and new finding on behavioral responses to regret and disappointment in fail services. J. Bus. Res. 2004, 57, 445–455. [Google Scholar] [CrossRef]
- Chorus, C.G. Regret theory-based route choices and traffic equilibrium. Transportmetrica 2010, 8, 291–305. [Google Scholar] [CrossRef]
- Laciana, C.E.; Weber, E.U. Correcting expected utility for comparisons between alternative outcomes: A unified parameterization of regret and disappointment. J. Risk Uncertain. 2008, 36, 1–17. [Google Scholar] [CrossRef]
- Zhang, X.L.; Xing, X.M. Probabilistic Linguistic VIKOR Method to Evaluate Green Supply Chain Initiatives. Sustainability 2017, 9, 1231. [Google Scholar] [CrossRef]
- Zhang, B.; He, M.Y.; Pan, H.R. A study on the design of a hybrid policy for carbon abatement. Chinese J. Popul. Resour. Env. 2017, 15, 50–57. [Google Scholar] [CrossRef]
- Zhang, R.L.; Shi, G.Q. Analysis of the relationship between environmental policies and air quality during major social events. Chinese J. Popul. Resour. Env. 2016, 14, 167–173. [Google Scholar] [CrossRef]
Figure 1.
A list of tablet computers in Zol.com.cn.

Figure 2.
The regret–rejoice function .

Figure 3.
The problem of ranking tablet computers through online ratings.

Figure 4.
The resolution procedure for the problem of ranking products through online ratings.

Figure 5.
An online rating and review for Apple iPad Air 2 from Zol.com.cn.

Figure 6.
The flowchart of the proposed method.


Table 1.
The probability distributions of and .
| 2 | 4 | 6 | 8 | 10 | |
|---|---|---|---|---|---|
| 0.3 | 0.2 | 0.25 | 0.35 | 0.2 | |
| 0.3 | 0.2 | 0 | 0.55 | 0.4 |
Table 2.
The stochastic evaluations on attribute .
| Alternatives | Evaluations in Format of Stochastic Variables | ||||
|---|---|---|---|---|---|
| 2 | 4 | 6 | 8 | 10 | |
| 0.204 | 0.184 | 0.263 | 0.118 | 0.23 | |
| 0.259 | 0.259 | 0.241 | 0.107 | 0.098 | |
| 0.455 | 0.210 | 0.210 | 0.042 | 0.084 | |
| 0.179 | 0.277 | 0.295 | 0.116 | 0.134 | |
| 0.184 | 0.170 | 0.220 | 0.135 | 0.291 | |
Table 3.
The stochastic evaluations on attribute .
| Alternatives | Evaluations in Format of Stochastic Variables | ||||
|---|---|---|---|---|---|
| 2 | 4 | 6 | 8 | 10 | |
| 0.204 | 0.184 | 0.263 | 0.118 | 0.23 | |
| 0.259 | 0.259 | 0.241 | 0.107 | 0.098 | |
| 0.455 | 0.210 | 0.210 | 0.042 | 0.084 | |
| 0.179 | 0.277 | 0.295 | 0.116 | 0.134 | |
| 0.184 | 0.170 | 0.220 | 0.135 | 0.291 | |
Table 4.
The stochastic evaluations on attribute .
| Alternatives | Evaluations in Format of Stochastic Variables | ||||
|---|---|---|---|---|---|
| 2 | 4 | 6 | 8 | 10 | |
| 0.204 | 0.184 | 0.263 | 0.118 | 0.23 | |
| 0.259 | 0.259 | 0.241 | 0.107 | 0.098 | |
| 0.455 | 0.210 | 0.210 | 0.042 | 0.084 | |
| 0.179 | 0.277 | 0.295 | 0.116 | 0.134 | |
| 0.184 | 0.170 | 0.220 | 0.135 | 0.291 | |
Table 5.
The stochastic evaluations on attribute .
| Alternatives | Evaluations in Format of Stochastic Variables | ||||
|---|---|---|---|---|---|
| 2 | 4 | 6 | 8 | 10 | |
| 0.204 | 0.184 | 0.263 | 0.118 | 0.23 | |
| 0.259 | 0.259 | 0.241 | 0.107 | 0.098 | |
| 0.455 | 0.210 | 0.210 | 0.042 | 0.084 | |
| 0.179 | 0.277 | 0.295 | 0.116 | 0.134 | |
| 0.184 | 0.170 | 0.220 | 0.135 | 0.291 | |
Table 6.
The stochastic evaluations on attribute .
| Alternatives | Evaluations in Format of Stochastic Variables | ||||
|---|---|---|---|---|---|
| 2 | 4 | 6 | 8 | 10 | |
| 0.204 | 0.184 | 0.263 | 0.118 | 0.23 | |
| 0.259 | 0.259 | 0.241 | 0.107 | 0.098 | |
| 0.455 | 0.210 | 0.210 | 0.042 | 0.084 | |
| 0.179 | 0.277 | 0.295 | 0.116 | 0.134 | |
| 0.184 | 0.170 | 0.220 | 0.135 | 0.291 | |
Table 7.
The different results with different parameter .
| Tablet Computer | ||||||||
|---|---|---|---|---|---|---|---|---|
| Perceived Utility Values | Ranking | Perceived Utility Values | Ranking | Perceived Utility Values | Ranking | Perceived Utility Values | Ranking | |
| 0.031 | 3 | −0.554 | 3 | −1.577 | 2 | −2.975 | 2 | |
| 0.114 | 2 | −0.522 | 2 | −1.742 | 3 | −3.511 | 3 | |
| −7.918 | 5 | −21.250 | 5 | −48.828 | 5 | −106.007 | 5 | |
| 0.974 | 1 | 1.142 | 1 | 1.078 | 1 | 0.836 | 1 | |
| −0.114 | 4 | −1.417 | 4 | −2.778 | 4 | −4.286 | 4 | |
Table 8.
The distribution evaluations of products.
| Alternative SUVs | Rating Scales | Attributes | |||||||
|---|---|---|---|---|---|---|---|---|---|
| 1 | 6 | 1 | 1 | 6 | 2 | 1 | 6 | 4 | |
| 2 | 21 | 14 | 3 | 53 | 25 | 1 | 58 | 12 | |
| 3 | 256 | 163 | 48 | 282 | 305 | 46 | 392 | 132 | |
| 4 | 790 | 652 | 382 | 572 | 632 | 208 | 655 | 573 | |
| 5 | 282 | 525 | 921 | 442 | 391 | 1099 | 244 | 634 | |
| 1 | 5 | 6 | 6 | 7 | 6 | 6 | 12 | 9 | |
| 2 | 5 | 13 | 2 | 3 | 13 | 2 | 30 | 3 | |
| 3 | 66 | 157 | 5 | 20 | 283 | 68 | 464 | 53 | |
| 4 | 981 | 908 | 106 | 198 | 979 | 378 | 975 | 480 | |
| 5 | 728 | 701 | 1666 | 1557 | 504 | 1331 | 304 | 1240 | |
| 1 | 0 | 0 | 1 | 3 | 2 | 0 | 10 | 2 | |
| 2 | 2 | 5 | 0 | 15 | 22 | 3 | 82 | 23 | |
| 3 | 46 | 75 | 12 | 139 | 358 | 122 | 478 | 210 | |
| 4 | 385 | 651 | 286 | 538 | 714 | 661 | 724 | 695 | |
| 5 | 1061 | 763 | 1195 | 799 | 389 | 708 | 200 | 564 | |
| 1 | 0 | 5 | 5 | 1 | 0 | 1 | 17 | 4 | |
| 2 | 0 | 7 | 20 | 27 | 4 | 0 | 98 | 7 | |
| 3 | 2 | 199 | 228 | 173 | 71 | 50 | 569 | 84 | |
| 4 | 29 | 770 | 689 | 564 | 493 | 424 | 530 | 521 | |
| 5 | 1394 | 444 | 483 | 660 | 857 | 950 | 211 | 809 | |
| 1 | 0 | 4 | 3 | 13 | 1 | 0 | 0 | 0 | |
| 2 | 1 | 19 | 4 | 88 | 8 | 5 | 13 | 4 | |
| 3 | 6 | 378 | 83 | 456 | 143 | 91 | 226 | 24 | |
| 4 | 121 | 720 | 560 | 582 | 659 | 581 | 734 | 233 | |
| 5 | 1135 | 142 | 613 | 124 | 452 | 586 | 290 | 1002 | |
Table 9.
Comparison of results obtained using the three methods.
| Methods | Ranking of Alternatives | |
|---|---|---|
| The method presented by Kang and Park (2014) | ||
| The method presented by Fan et al. (2017) | ||
| The proposed method in this study | Considering entire rationality | |
| Considering regret behavior () | ||
| Considering regret behavior () | ||
| Considering regret behavior () | ||
© 2018 by the authors. Licensee MDPI, Basel, Switzerland. This article is an open access article distributed under the terms and conditions of the Creative Commons Attribution (CC BY) license (http://creativecommons.org/licenses/by/4.0/).
Share and Cite
MDPI and ACS Style
Liang, X.; Liu, P.; Liu, Z. Selecting Products Considering the Regret Behavior of Consumer: A Decision Support Model Based on Online Ratings. Symmetry 2018, 10, 178. https://doi.org/10.3390/sym10050178
AMA Style
Liang X, Liu P, Liu Z. Selecting Products Considering the Regret Behavior of Consumer: A Decision Support Model Based on Online Ratings. Symmetry. 2018; 10(5):178. https://doi.org/10.3390/sym10050178
Chicago/Turabian StyleLiang, Xia, Peide Liu, and Zhengmin Liu. 2018. "Selecting Products Considering the Regret Behavior of Consumer: A Decision Support Model Based on Online Ratings" Symmetry 10, no. 5: 178. https://doi.org/10.3390/sym10050178
Note that from the first issue of 2016, this journal uses article numbers instead of page numbers. See further details here.