Fuzzy Association Rule Based Froth Surface Behavior Control in Zinc Froth Flotation


School of Information Science and Engineering, Central South University, Changsha 410083, China
*
Author to whom correspondence should be addressed.
Symmetry 2018, 10(6), 216; https://doi.org/10.3390/sym10060216
Submission received: 30 April 2018
/
Revised: 31 May 2018
/
Accepted: 7 June 2018
/
Published: 13 June 2018
(This article belongs to the Special Issue Novel Machine Learning Approaches for Intelligent Big Data)
Abstract
:Froth flotation is a vital mineral concentration process. Froth surface behavior is the knowledge about flotation working condition. However, in computer vision aided froth surface behavior control, there are still two challenges that need to be tackled seriously. Against the difficulty in the froth surface behavior representation, this paper proposes to combine the bubble size distribution (BSD) and froth velocity distribution. As far as we know, this is the first time that the froth velocity distribution is presented. Against the difficulty in the adaptive generation of the optimal froth surface behavior feature (optimal setpoint), this paper introduces the fuzzy apriori to mine the association rule between the current working condition and the optimal setpoint. Then, a fuzzy inference module is constructed to generate optimal setpoint for current working condition adaptively. Many validation experiments and comparison experiments demonstrate the superiority and robustness of the proposed methods.
1. Introduction
Froth flotation is a vital mineral concentration process. It takes advantage of the hydrophobicity of liberated minerals and makes these minerals separate from each other and the slurry they are in. In flotation process, air bubbles are generated and utilized as a medium to selectively pick up the hydrophobic particles dispersed in the slurry. Then, the aggregates of the air bubble and the hydrophobic particle will rise and enter the froth phase under the action of buoyancy [1]. It has been widely accepted that the structure of froth which develops on the surfaces of froth phase is a significant indicator of both the grade and recovery (flotation performance is characterized by concentrate grade and recovery). This indication relation is well utilized at the process operation level. For example, in industry, reagent dosages are usually changed by experienced plant operators based on their observing of froth surface [2]. Actually, the visual feature of froth surface is the knowledge about flotation working condition. There is a causal relation between working condition and reagent operation. Different operating strategies are adopted for different conditions. Since the initial work was done by Symonds et al. [3] and Moolman et al. [4], great efforts from both academic and industrial researchers have been devoted to the computer vision aided froth flotation control. In our previous work, an online working condition recognition system of bauxite flotation was developed based on the texture description of froth surface [5]. To predict the metallurgical performances of a batch flotation system, the static features (bubble size and froth color) and dynamic features (froth velocity and stability) were combined to construct a neural network predictive system in [6]. Realizing the importance of the causal relation model which links the operating variables (inlet air flow rate, reagent dosage, slurry pH, and interface level) to flotation performance, Zhang et al. [7] developed a wavelet-based Hammerstein–Wiener model in an actual lead zinc flotation plant. To evaluate the rationality of reagent dosage, Ai et al. developed a novel froth image feature named union distribution of bubble size and shape. This method can distinguish froth images which have similar bubble size but different froth grade [8].
There are two challenges in computer vision aided froth surface behavior control: The first one is the representation of froth surface behavior. The froth mobility and stability are closely related to the viscosity of the froth. There is significant difference for froth motion in the presence of mineral particles and in the absence of particles. Since the solid particles can significantly affect the viscosity of the froth, it is difficult to describe the froth surface behavior using Laplace equation as in two-phase foam systems (in the absence of solid particles) [9]. It has been claimed that the bubble size and froth velocity are the core requirement for bubble behavior description [2]. For the bubble size analysis, the first step is to segment froth image into individual bubbles. The watershed algorithm has been demonstrated to be an effective approach to accomplish this task, but it relies on reliable identification of the local minima (known as markers) [10]. H-minimal transform [11] and H-dome transform [12] are the two most used methods for bubble marker extraction. Both two approaches assume that there is a valued greyscale difference between the marker and its vicinity region. Actually, the distribution of contrast among different markers and their vicinity regions is extremely uneven. In our previous study, an illumination modeling-based marker extraction method was developed [7]. The experiment results demonstrated that our proposed approach can extract markers reliably. Although many studies have concentrated on the froth velocity extraction and analysis [13,14,15], the acceleration influence on froth horizontal velocity which caused by the rotating scraper fixed on the discharge lip of flotation bank has been ignored. For instance, based on the experiments in laboratory-scale mechanical flotation cell, Park et al. tried to study the bubble motion behavior at different locations by analyzing the process that the bubble entered the froth phase [1]. Realizing that froth velocity at different parts of flotation cell surface are different, Jahedsaravani et al. proposed using two parallel blocks to track froth block in consecutive video frames [15]. In bauxite flotation, Liu et al. argued that the froth velocity should be characterized as a velocity field of all individual bubbles [14]. However, according to the experience of operators, the froth velocity toward the direction of the discharge lip directly affects the performance of flotation. Froth velocities in other directions are mainly caused by the bubble coalescing and bursting. To improve the accuracy of froth velocity extraction and description, in this study, the whole column of video frame in a fixed width is chosen as block, and ORB-based (Oriented FAST and Rotated BRIEF) [16] key points registration method is introduced to find the matched block in the following frame. Considering the acceleration influence discussed above, froth velocities in a continuous period are extracted and analyzed by statistical method. We find that there is periodicity in the velocity sequence in a continuous period. Therefore, the velocity distribution is extracted and utilized to describe froth behavior.
The second challenge is that the optimal froth surface behavior (optimal setpoint) is unknown in each control cycle [17]. There are two causes for this phenomenon. Firstly, although the ultimate goal of bubble behavior control is to achieve designed concentrate grade and recovery, the bubble behavior does not correspond to the concentrate grade one by one. There are different kinds of bubble behaviors corresponding to the same concentrate grade [18]. Secondly, due to the difference of flotation working condition, the costs to control the current froth behavior to different statues are different. Thus far, little research has been done to find the optimal surface bubble behavior for reagent changing. Although this question has been realized for a long time, most computer vision-based controllers set the optimal surface bubble behavior based on operator’s experience. Xie et al. tried to link the optimal surface bubble behavior to feed grade using clustering method. In their method, the feed grade was classified into different clusters off-line, and the optimal surface bubble behavior for each cluster was set manually in advance [17]. Considering that abundant of operator’s experience is hidden in the historical bubble behavior control events, the association relationship between bubble behavior at reagent changing time and bubble behavior obtained by reagent control that corresponds to desired concentrate grade can be mined from these historical data using fuzzy apriori method [19]. In froth flotation, there are several works which have utilized data mining techniques. For instance, to model the metallurgical performance of a copper concentrator as a function of process variables, various data-mining approaches were introduced by Massinaei et al. [20]. To discuss the correlation between the visual properties of froth (in different classes) and the metallurgical parameters, Jahedsaravani et al. introduced an adaptive neuro-fuzzy inference system (ANFIS) [6]. In this paper, the fuzzy association rule mining and inference method will be introduced to estimate the optimal surface bubble behavior for current flotation working condition.
To realize surface bubble behavior control, the causal relationship between reagents and bubble behavior is modeled by a neural network. Based on the causal inference model, model predictive control (MPC) strategy is introduced to deduce optimal reagent dosages.
2. Process Description
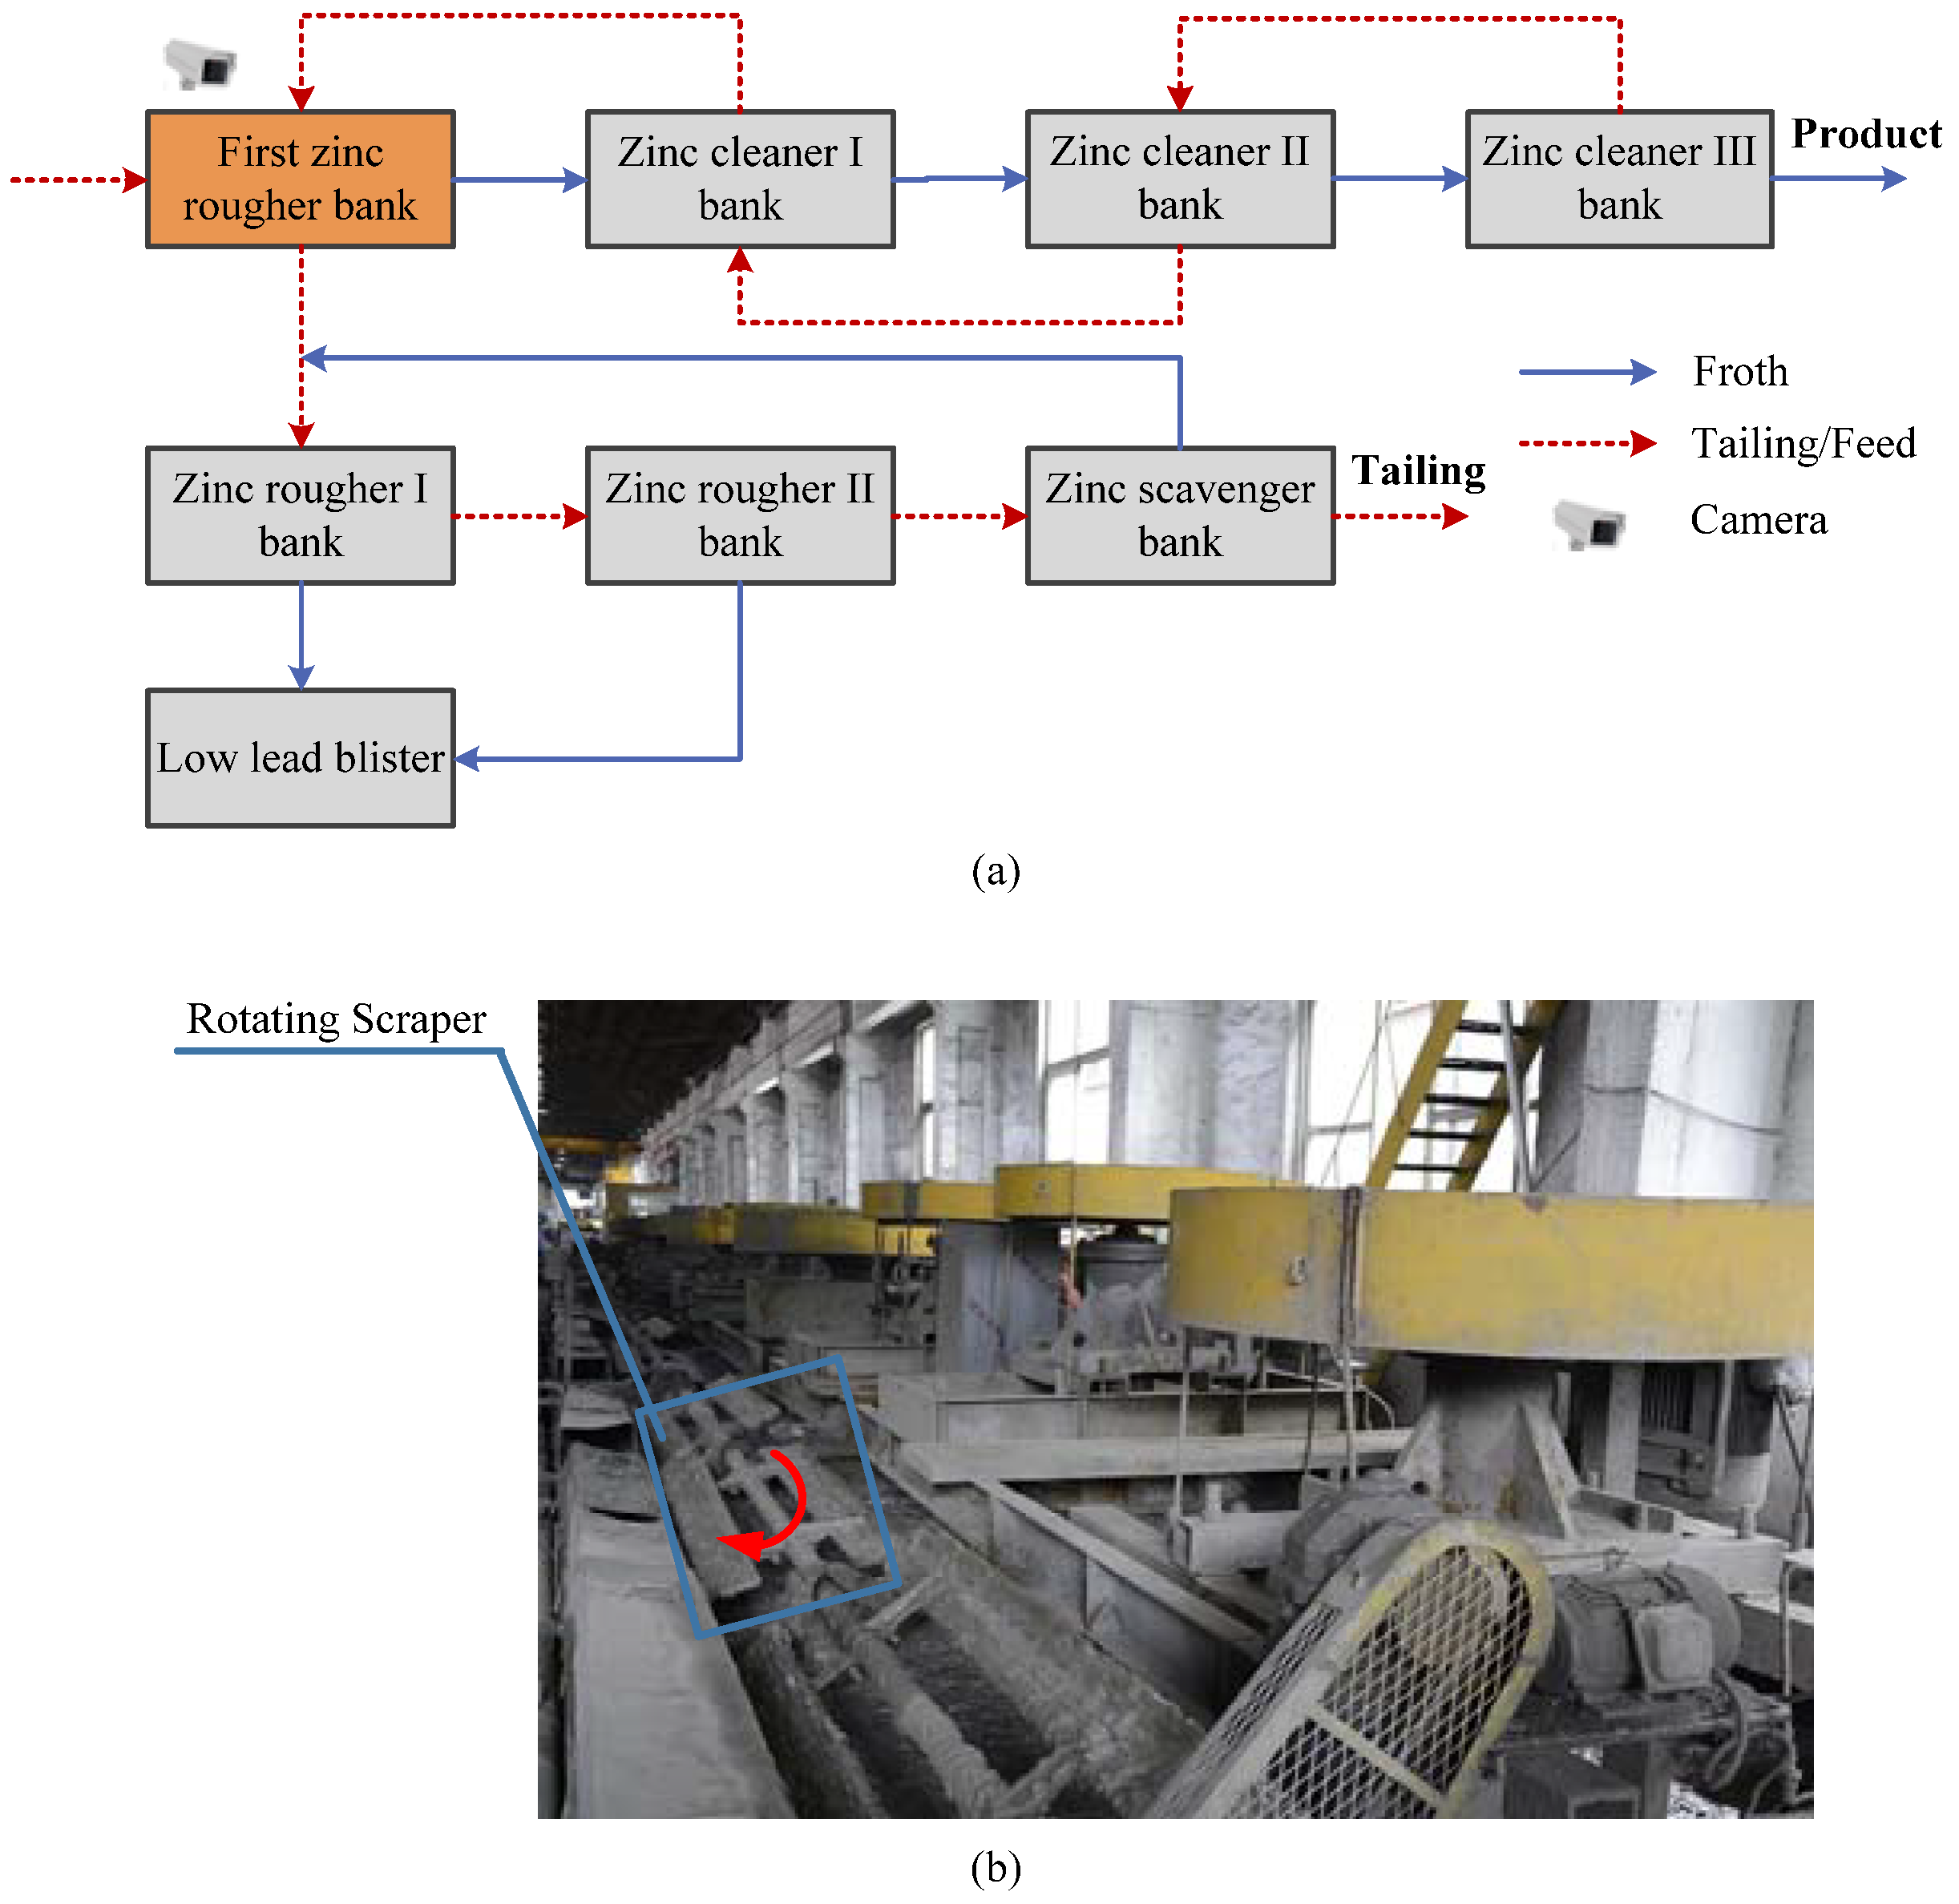
In direct froth flotation, valuable hydrophobic minerals are separated from hydrophilic minerals. Thus, it is essential to change flotation reagents to change the hydrophobicity of valuable particle surface. Lead zinc froth flotation is a typical differential flotation process. In the lead flotation process, zinc particles should be ensured to be nonfloatable. Then, in the zinc flotation process, zinc particles should be activated with copper sulfate (activator) to change their surface hydrophobicity. Figure 1 shows the schematic of the zinc flotation circuit in a lead-zinc flotation plant in China. The first zinc rougher bank directly affects the performance of the following cleaner I bank and rougher I bank. From the perspective of optimal control, it is crucial to control the first zinc rougher bank to be an optimal state so the corresponding concentrate grade is stable and achieves the designed value. Since froth flotation employs air bubbles to selectively pick up certain particles in the aqueous medium, the grade and recovery of valuable minerals in the concentrate are significantly affected by froth behaviors. Therefore, to control the first zinc rougher bank to be the optimal working condition can be realized by the precise control of the surface bubble behavior [2,21,22].
In industry, experienced plant operators change reagent dosages by observing froth surface, and different operating strategies are adopted for different froth surfaces. It is necessary for computer vision-based surface bubble behavior controller to perceive froth behavior, and mine the causal association knowledge between surface bubble behavior and concentrate grade. It has been widely accepted that a kinetic flotation causal model is hard to develop at the industry level [1,7,23,24]. Instead, data-driven models such as neural network, support vector machine and partial least square have have received great applications and successes. To construct a neural network-based flotation causal model, one year of flotation data containing froth video, XRF (X-ray fluorescence analyzer) analysis results and reagent dosages were collected in a lead-zinc flotation plant in China in 2017. For simplicity, the surface bubble behavior at time is represented as , the reagent dosage is denoted as , and the flotation causal model between reagents and surface bubble behavior can be described by the following equation:
where is a neural network. Future surface bubble behavior can be inferred by using the causal model after giving current bubble behavior and reagent dosage . Thus, to control the bubble behavior to optimal setpoint can be achieved by optimizing the following objective function:
However, the optimal froth surface behavior is unknown in each control cycle. In manual reagent control process, operators will categorize froth surface behavior mentally into several distinct types. For each type, an appropriate operating strategy is developed. Thus, it is necessary to deduce the optimal surface bubble behavior for each flotation working condition, which is one of the critical topics discussed in this paper.
3. Methods
3.1. Froth Surface Behavior Representation
Generally, the froth surface behavior can be described by image texture [5,25], froth velocity [1,15], froth color [26], and bubble size obtained through image segmentation [7,27]. It has been claimed that the bubble size and froth velocity are the core requirement for froth description [2]. In this paper, the bubble size distribution and froth velocity distribution are viewed as the representation of froth surface behavior.
3.1.1. Bubble Size Distribution
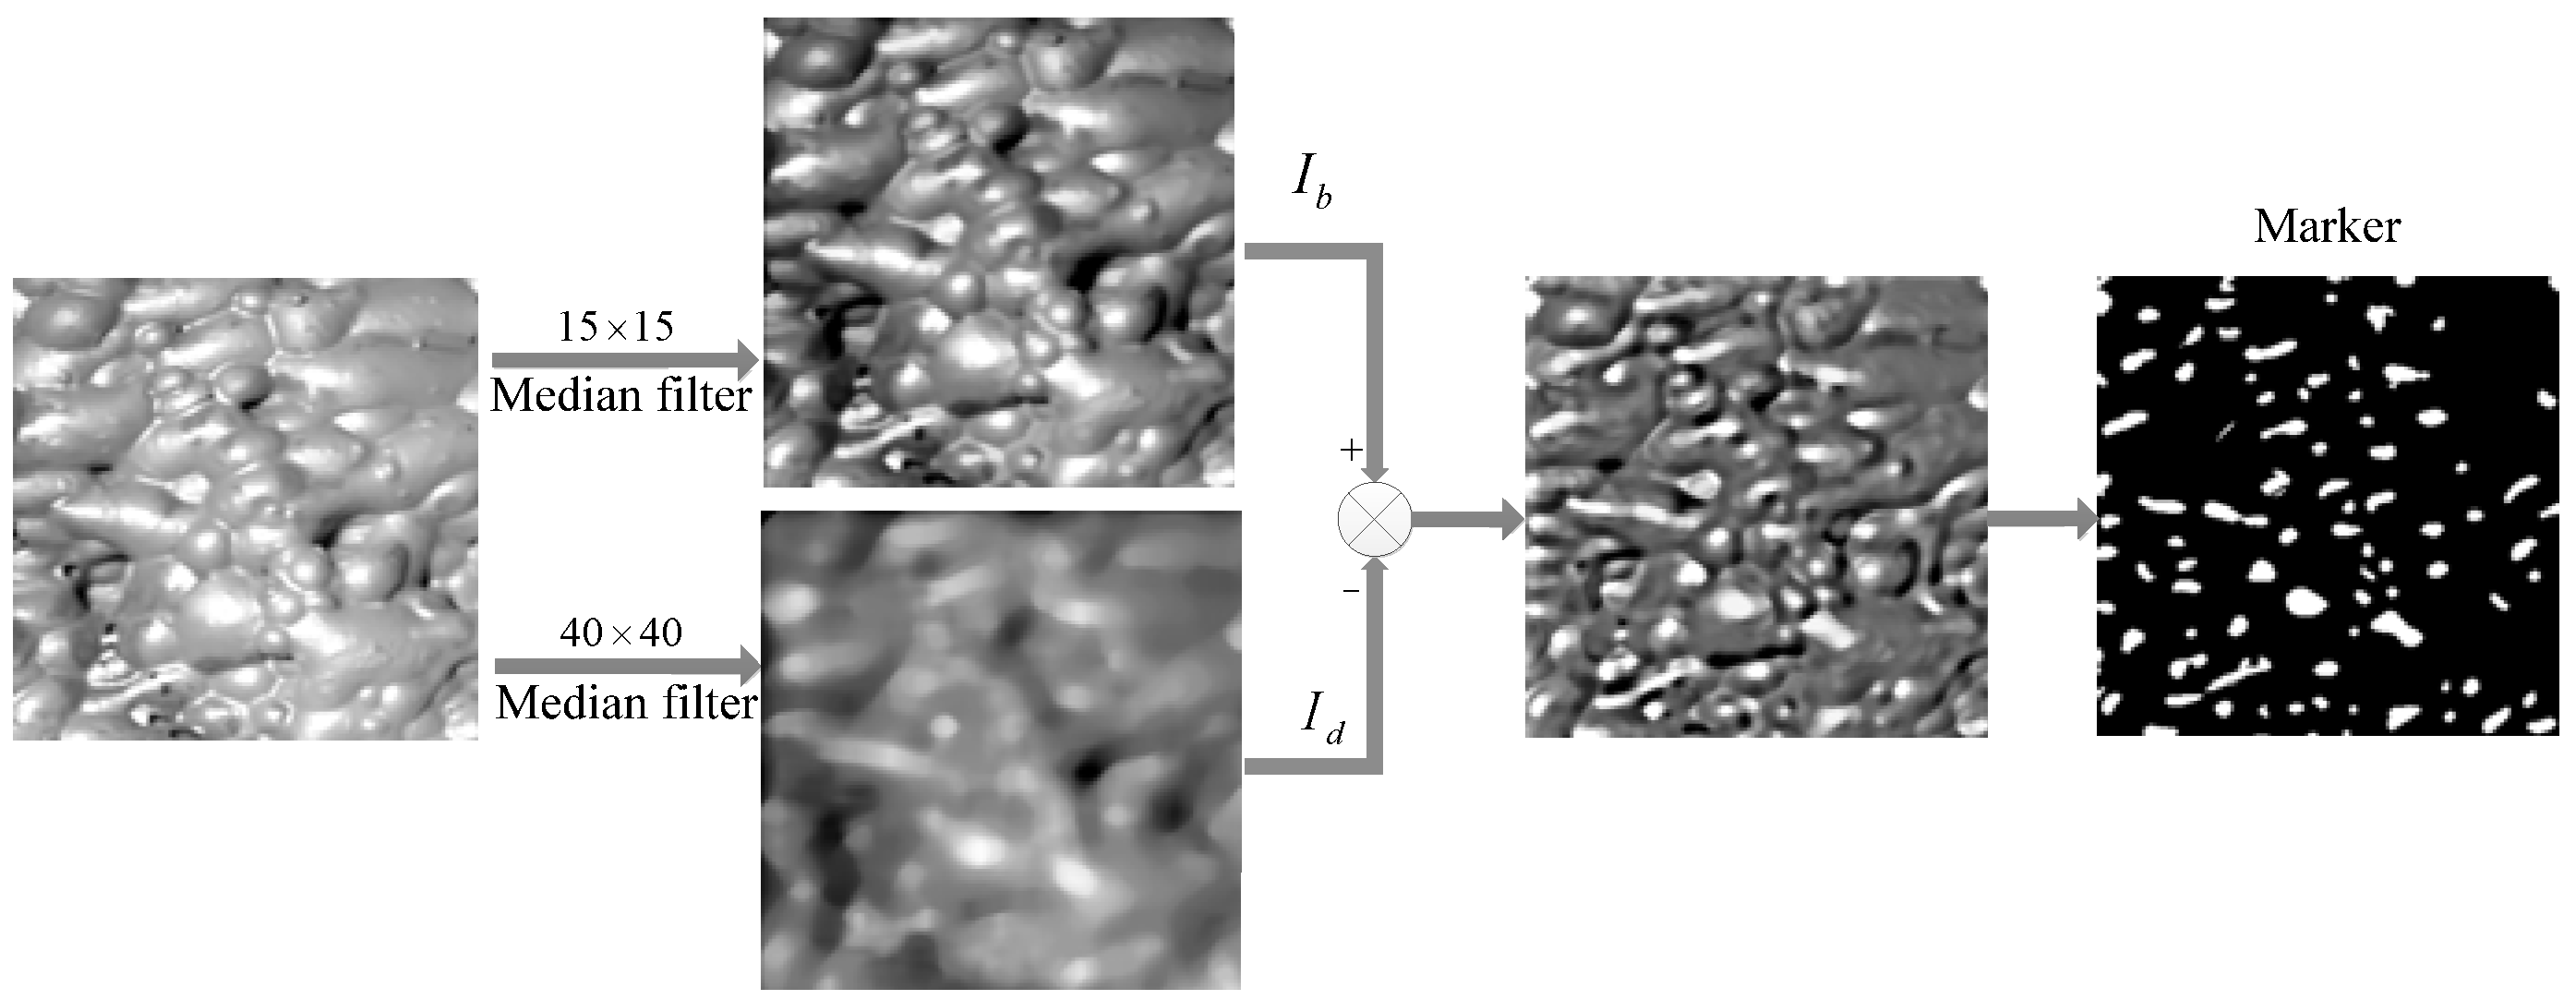
The prerequisite for watershed segmentation is to determine the local minimum for each individual bubble (maker) [10]. In froth image segmentation, the high light spot on the top of each bubble is used as a marker. In our previous work, an illumination modeling-based high light spot extraction method was proposed [7].
As shown in Figure 2, since the task is to find the high light spot on the top of each bubble surface, in the illumination modeling-based approach, a high light spot is viewed as foreground. On the contrary, its vicinity region is viewed as background. The distribution of contrast among different markers and its vicinity regions is uneven. A contrast enhancement between the foreground and the background will significantly facilitate the extraction of these spots. In experiments, we found that the difference between input froth image and its illumination distribution can largely enhance the contrast. To obtain the illumination distribution , a median filter was constructed and was used to run the whole froth image. Actually, the median filter size cannot be too large or too small. In experiments, we found that half of the average bubble size in a froth image was a good choice ( is half the average bubble size). In the filtering result, the illumination distribution of the image is less changed, but the bubble details are removed, and the high lights are depressed.
To further remove the disturbance of tiny bubbles attached on the surface of normal bubbles, a median filter was constructed, and the filtered result is denoted by . The filter size in this part is set as the average size of the high light spot ( is the measured value). Since the tiny bubbles are generally smaller than the high light spot, in the filtering result, the primary information of high light spots and normal bubbles will be preserved, but the tiny bubbles and other noise will be removed. Therefore, the high light spots are obtained by thresholding the difference between and . Based on the extracted high light spots, watershed transform can be performed to obtain the segmentation result.
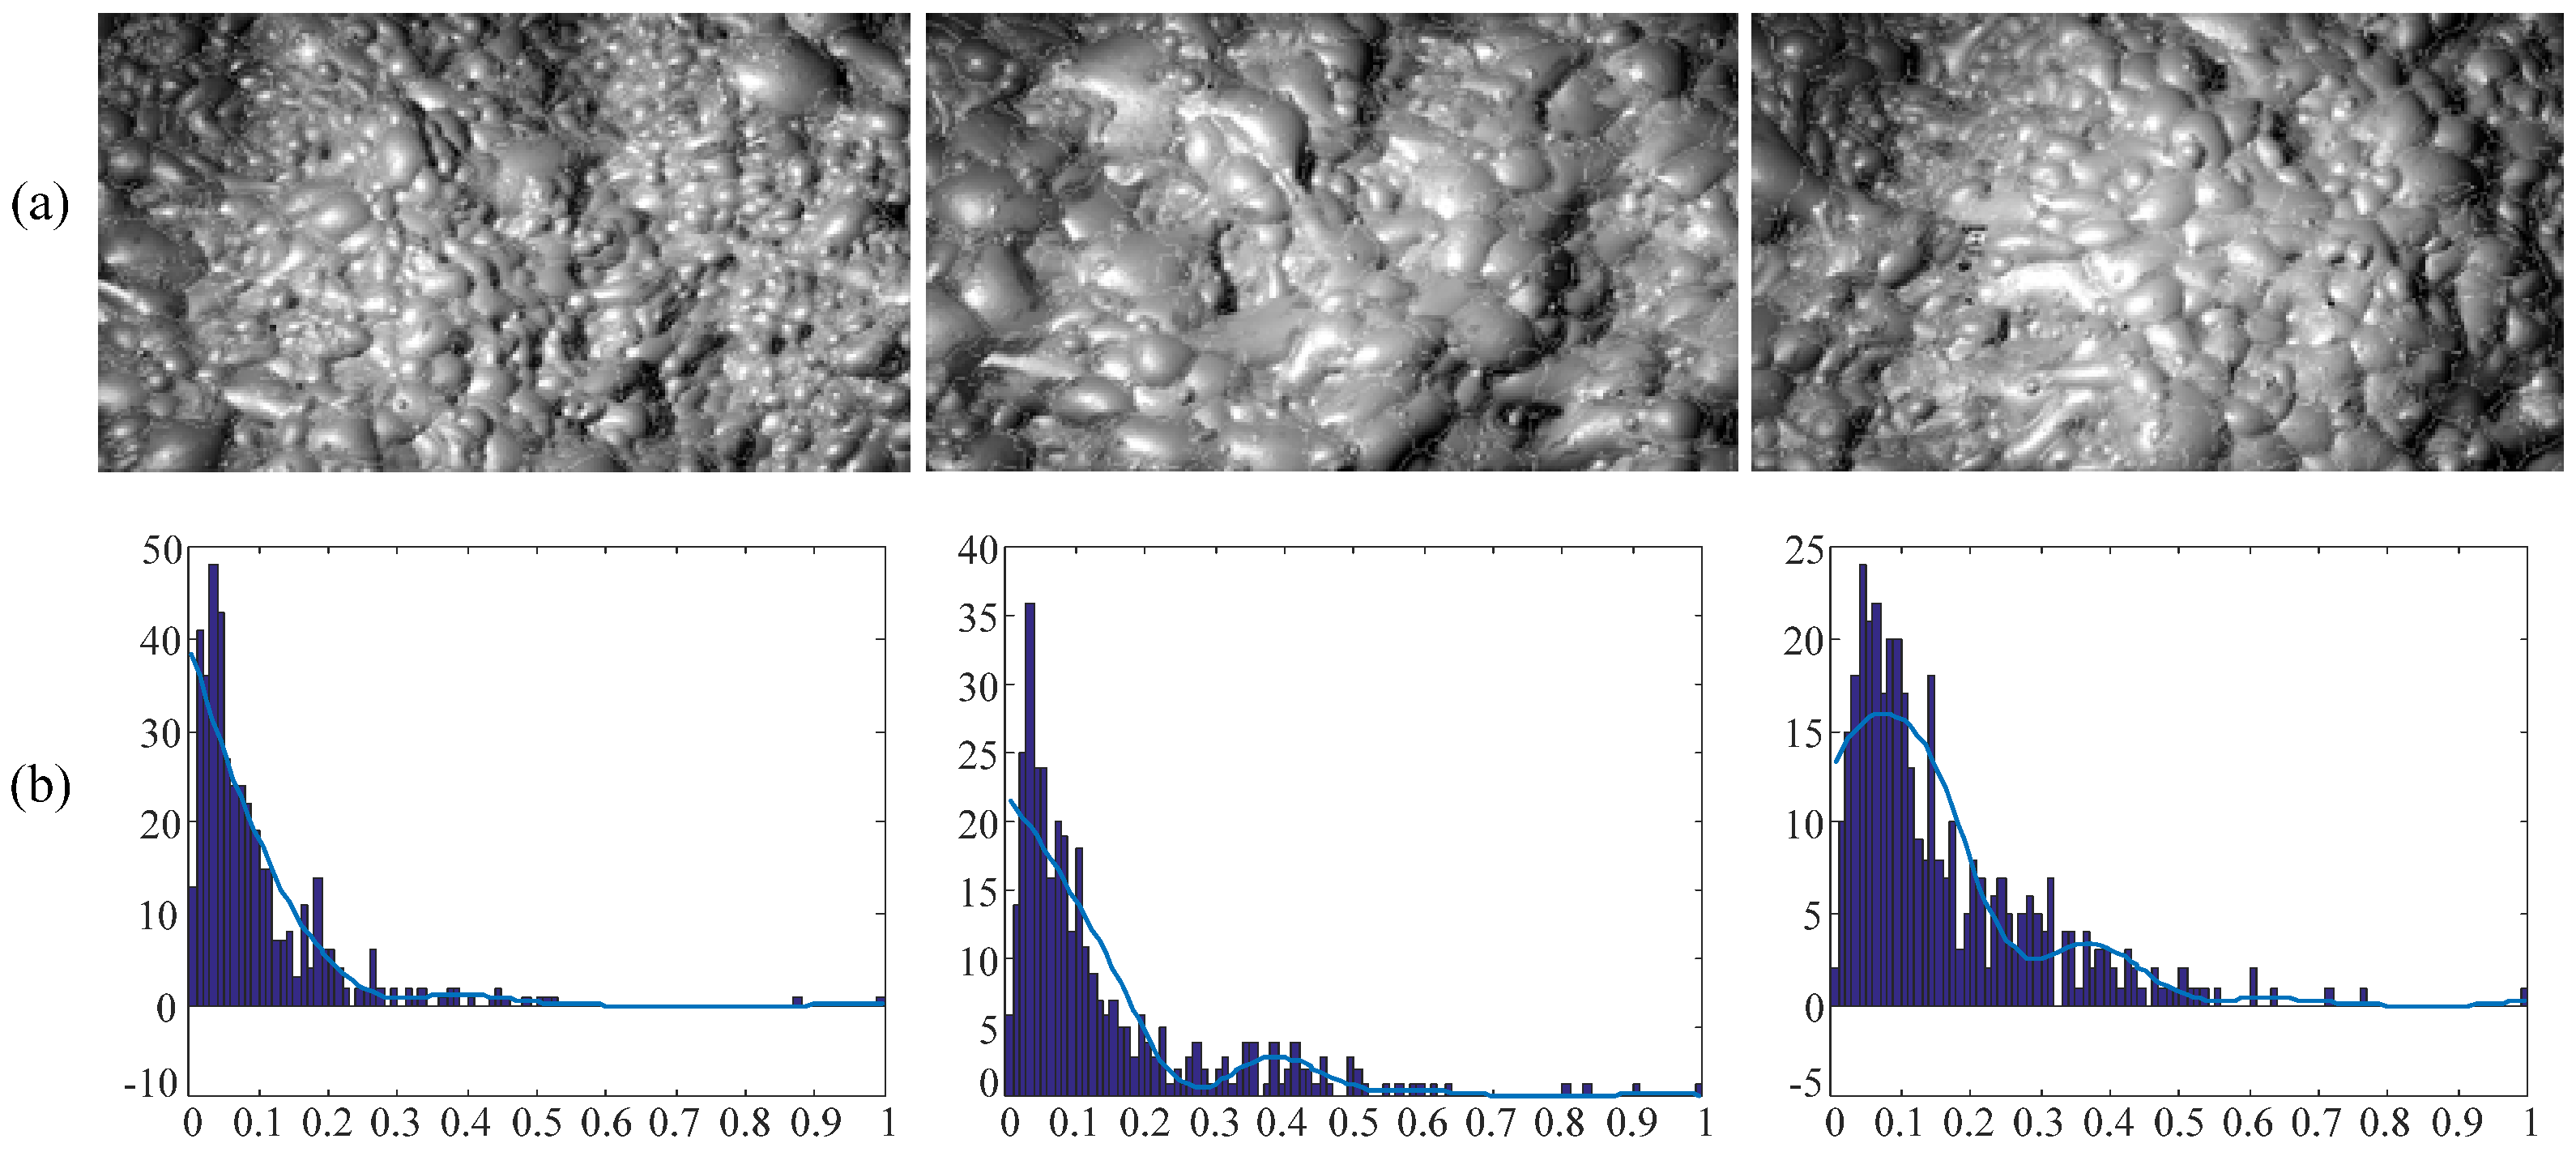
It has been demonstrated that bubble size distribution (BSD) can be reasonably well fitted with log-normal distributions [7,28]. The definition of log-normal distribution is
where is the standard deviation and is the mean. The maximum likelihood estimation (MLE) of these two parameters are
In froth surface behavior control, parameters and are calculated using the segmented froth image. In addition, they are used to describe bubble size distribution. Some experimental results are summarized in Figure 3.
3.1.2. Froth Velocity Distribution
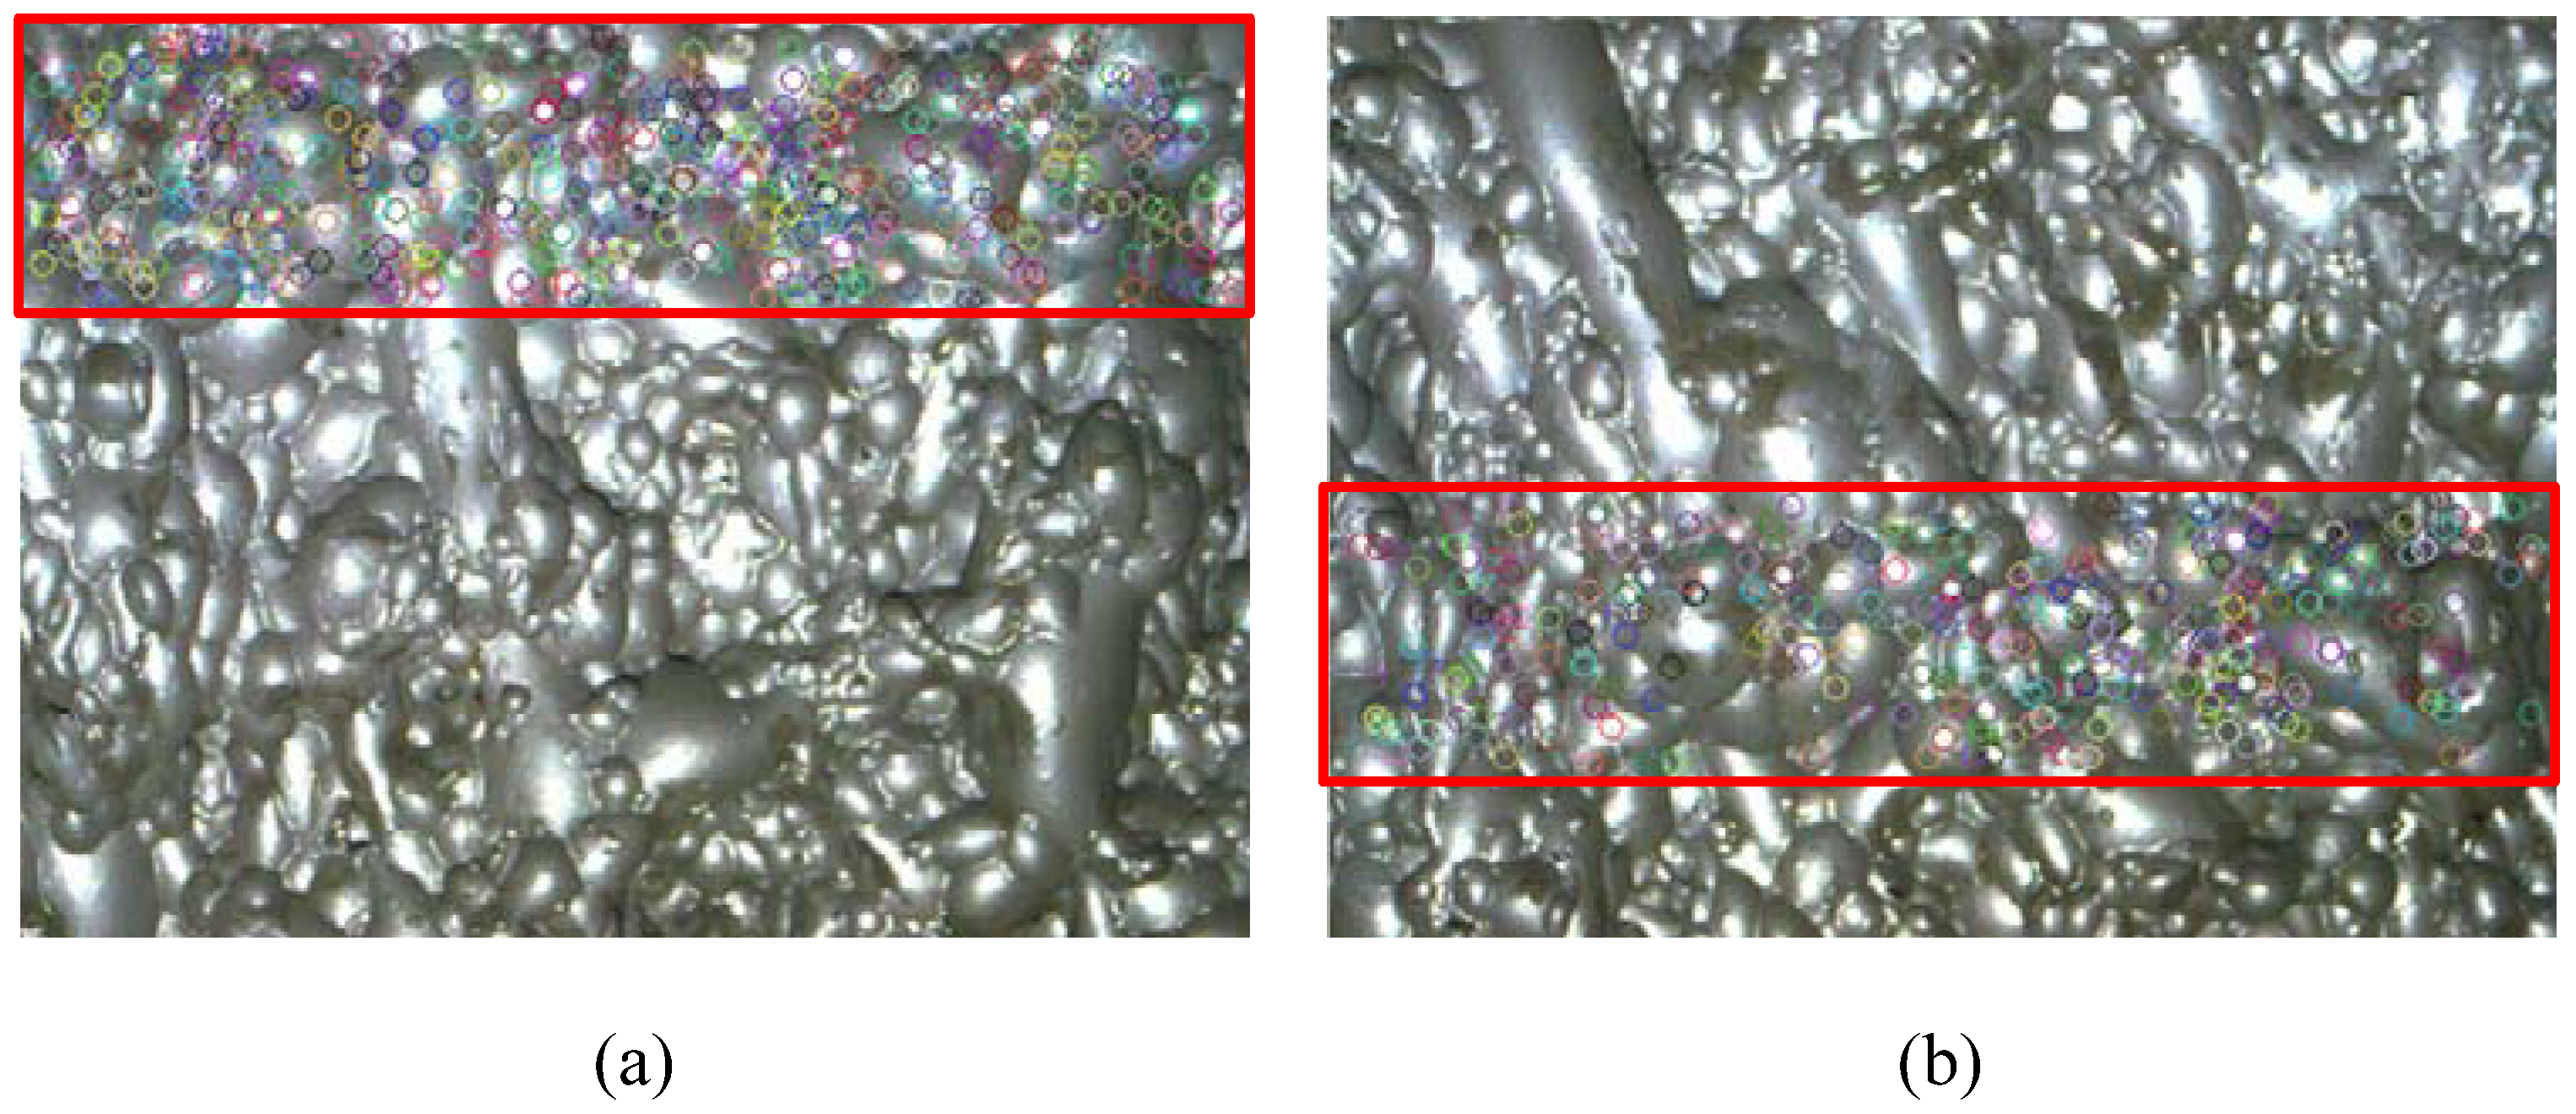
Froth velocity is designed to capture the dynamic behavior of the froth. It can be quantified by tracking the froth surface movement in two consecutive frames [15]. Block matching and key point matching are the two commonly used approaches. In general, the moving distance of two consecutive froth frames is measured as the froth velocity, as there are small distortions between consecutive frames of video. In bauxite flotation, Liu et al. argued that the froth velocity should be characterized as a velocity field which includes all individual motion of each bubble. They claimed that each individual bubble in the froth had its own special motion direction and speed [14]. Actually, in zinc flotation, the video camera is demanded to be set up in a place where the froth block is relatively stable. According to the experience of operators, the froth velocity toward the direction of the discharge lip directly affects the performance of flotation. Froth velocity in other directions is mainly caused by the bubble coalescing and bursting. The froth velocity should be extracted from two registered image blocks which can get off the negative affection of few disorder individual bubbles. In [15], two parallel blocks in the first frame were chosen as reference images, and another two matched parallel blocks in the next frame were searched using two-dimensional discrete cross correlation metric. In this method, the accuracy of velocity extraction heavily depends on the selection of two parallel reference blocks. If the two coalescing or bursting blocks are chosen as references, it is hard to find their matched image blocks, and thus we cannot precisely extract froth velocity. To improve the robustness of velocity extraction, this study proposes to register key points in a fixed size image block. Considering the existence of bubble coalescence, bursting and the output pulling force of flotation mixer, the whole column of video frame in a fixed width is chosen to do key points registration. As shown in Figure 4, firstly a block consisting rows in the top of the first frame is selected (denoted as ). Then, a series of continuous rows sized blocks in the next frame are extracted. In these blocks, the block () represents a block starts at row . Thus, the froth velocity extraction can be realized by finding a block that has maximum key points registered to points in . Since and are in two consecutive frames, the velocity is .
To do key points registration, ORB (Oriented FAST and Rotated BRIEF) is introduced [16]. ORB uses FAST (Features from Accelerated Segment Test) [29] as keypoint detector, and rBRIEF (Rotation-Aware Brief) as point descriptor. They are described in Table 1 and Table 2.
Due to the acceleration influence on froth horizontal velocity that is caused by the rotating scraper fixed on the discharge lip of flotation bank, the froth velocity is not a constant value in a short period, even in the steady state. To accurately describe the dynamic behavior of the froth movement, all the instantaneous velocities of froth in a working cycle of rotating scraper are extracted, as shown in Figure 5. The distribution of velocity in a cycle is approximated to a Gaussian function. Thus, the mean and variance of the velocity set in a working cycle of rotating scraper can be used to represent velocity distribution.
3.2. Rule Base Construction
3.2.1. Association Rule Mining
In most mineral concentrators, the flotation performance is usually monitored by the naked eye of plant operators, and the reagent dosages are changed based on their mental interpretation of the froth surface behavior. In this process, froth surface behavior is not only used as an indicator of flotation working condition but also as a control objective because the primary control objective of flotation circuit is to achieve designed recovery and concentrate grade [30]. Meanwhile, the concentrate grade or recovery in most flotation plant cannot be measured in real time. Thus, these metallurgical indexes are not directly controlled, but indirectly through controlling the froth appearance [31]. To achieve surface bubble behavior control, the ideal froth appearance used as optimal setpoint needs to be determined in advance. There are two requirements for the setpoint generation: (1) its corresponding concentrate grade should be the designed value (the zinc concentrate grade depicted in Figure 1 is 54%); and (2) since the costs to control the current froth behavior to different statues are different, the setpoint should be adaptable to the current working condition.
Data mining is used to discover important associations among items. In the mined associations, which can be written as the rule, the presence of some items in a transaction can imply the presence of some other items with a high probability [32]. In optimal setpoint generation, the setpoint need adapt to the flotation working condition. In other words, if the working condition is , then the optimal setpoint with a high probability is . Since, in computer vision-based methods, the working condition is described by the froth behavior, current bubble surface behavior can be viewed as antecedent, and the setpoint can be viewed as consequent. In the original association rule mining methods proposed by Agrawal et al., the concept of the large itemset is employed to find association rules in transaction data [32]. The mining process is divided into two phases. First, the transaction data are scanned to calculate the frequency of each itemset. If the frequency of an item in the transactions is larger than a pre-defined threshold value (called minimum support, ), it is considered as a large item. If large itemsets only contain single items, new itemsets containing two items would be generated by combining these single items. This process is repeated until all large itemsets are formed. In the next phase, association combinations (known as association rules) would be generated from these large itemsets, if their confidence values are larger than a predefined threshold (called minimum confidence, ).
The original association rule mining methods are used to deal with binary items; to deal with quantitative values, a fuzzy apriori which transforms each quantitative value into a fuzzy set in linguistic terms is proposed in [19]. By using membership function, each quantitative value can be transformed into a fuzzy set. Assume that to are elements in fuzzy set , and to are, respectively, their grades of membership in . Then can be described as follows:
Similar to original apriori, the large itemsets need to be found firstly. Then, the mining process based on fuzzy counts is employed to find fuzzy association rules [33,34]. The procedure for fuzzy apriori based setpoint association rule mining is summarized in Algorithm I.
| Algorithm I: Fuzzy Apriori-Based Setpoint Association Rule Mining. |
| Input: A collection of froth behavior data at reagent adjusting time, |
| their corresponding froth behavior data captured after reagent adjustment, |
| and XRF grade analysis result of collected froth after reagent adjustment |
| Output: |
|
3.2.2. Fuzzy Inference System
The mined fuzzy association rule will be transferred to a knowledge repository. To utilize this repository to generate optimal setpoint for the working condition at any reagent control cycle, a fuzzy inference system is constructed. For simplify, assume that rules as follows have been learned:
Now, if we have for fuzzy variables , then their truth values are represented by and . Assuming that a T-norm is used as the conjunction operator, and the strength for can be calculated as
The output of is calculated by applying the matching strength of its preconditions on its conclusions:
where represents the consequence in . Then, the crisp output is calculated using Tsukomoto’s defuzzification method:
where is the number of rules.
3.3. Reagent Control
3.3.1. Flotation Causal Inference Model Construction
It has been demonstrated that a three layer neural network with a sufficient number of hidden neurons can approximate any continuous function on a compact input domain to arbitrary precision [36]. In this work, a four-layer feed-forward perceptron neural network (NN) is employed to model the flotation causal relation described in Equation (1). Consider a input NN which is activated by input vector . For hidden unit , a weighted sum of the input units is calculated, and denoted as . will then be fed to a sigmoid activation function and yield the output of this hidden unit . Similarly, each unit in the next hidden layer will also calculate a weighted sum of , and then a sigmoid function is utilized. Since the output domain of sigmoid is , but the range of reagent dosage is largely wider than , a linear combination layer is added to the output of second hidden layer. Thus, the neural network causal model can be summarized as
where . To train , a cost function
is minimized. The key property of this causal model is that all functions are differentiable, which allows the model to be trained with gradient descent. In gradient descent, the derivative of the objective function with respect to each of the model weights is calculated. Then, these weights are adjusted in the direction of the negative slope. Partial derivatives of any model weight can be calculated using the chain rule.
3.3.2. Distance Metric
To employ image features (bubble size distribution and froth velocity distribution) to achieve surface bubble behavior control, it is important to define a metric or distance function that can measure a distance between two feature vectors. In mathematics, a metric on a set X should satisfy following conditions:
- (i)
- ;
- (ii)
- ;
- (iii)
- ; and
- (iv)
- .
Commonly used distance metrics for data point comparison include Euclidean distance, Mahalanobis distance, Minkowski distance, Cosine, etc. [37,38]. In this study, the Euclidean distance is selected to compute the distance between two feature vectors, which is defined as
However, contribution rate of each component in the code should be considered. Thus, following adaptation is made
where is the absolute value of the correlation coefficient between concentrate grade and the component of feature vector.
3.3.3. Reagent Control Based on Receding Horizon Optimization
Based on the flotation causal model , after given a control input , future surface bubble behavior can be predicted. Based on the receding horizontal optimization strategy, the following cost function is constructed [39]:
where and are the lower and upper bounds of , respectively; and is prediction horizon. To inhibit the oversized output fluctuation, the increment of control input is need to be inhibited. Equation (15) is modified to:
where is control horizon. The problem described above can be solved using sequential quadratic programming (SQP) [40].
4. Results and Discussion
For the evaluation of the proposed control strategy, industrial experiments are carried out at a lead-zinc flotation plant in China. One year of flotation data containing froth video, XRF (X-ray fluorescence analyzer) analysis results and reagent dosages were collected in 2017. There are about 20,000 data including feed grade, froth grade, reagent dosage, froth surface videos, etc. For the purpose of evaluation and validation, prediction quality was assessed using Root Mean Square Error (RMSE) evaluation metrics [8],
where is the predicted output value, and is the real output value.
4.1. Relationship between Visual Features and Process Variables
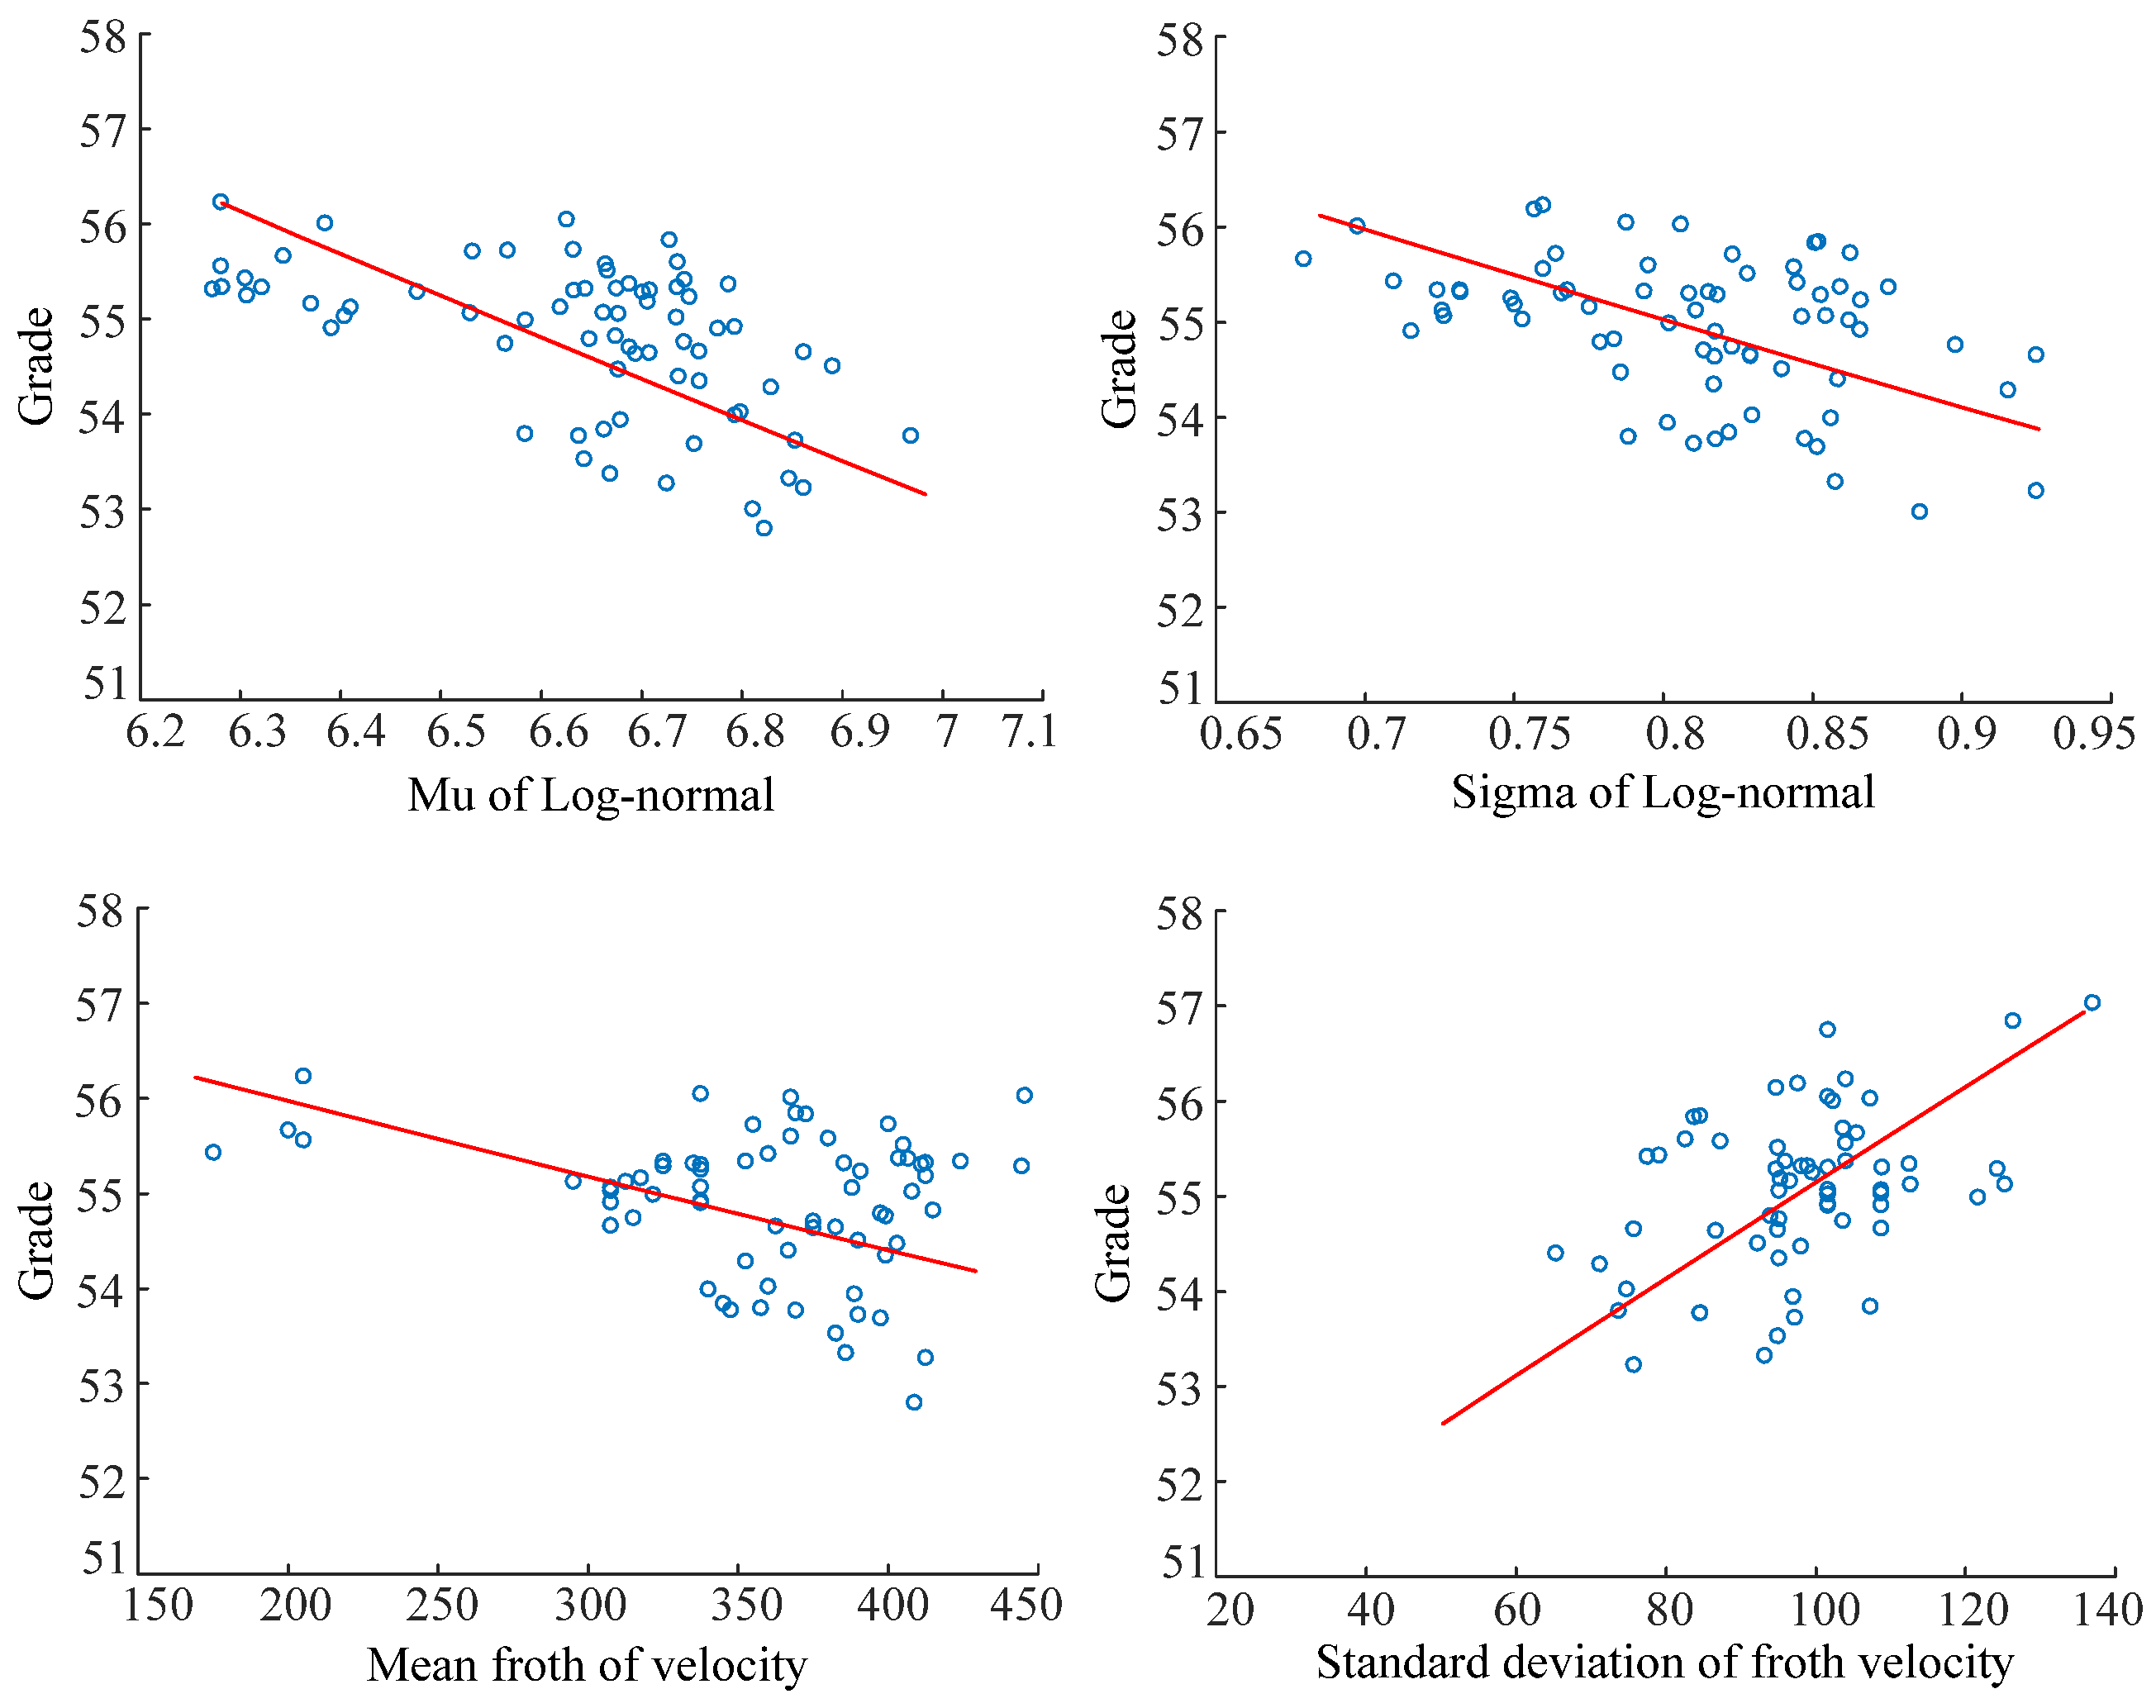
Froth surface behavior reflects important metallurgical characteristics and responds to changes in manipulated variables. Estimation of the metallurgical performances from the froth surface behavior plays a central role in flotation performance sensing and feedback control of the flotation process. The relationship between froth surface behavior (bubble size distribution and froth velocity distribution) and concentrate grade under different feed condition is analyzed. The correlations between concentrate grade and froth surface behavior are shown in Table 3 and Figure 6. The results indicate that the bubble size and froth velocity are firmly related to concentrate grade. They can be used to represent flotation working condition and flotation performance.
4.2. Validation of the Fuzzy A Priori Association Rule Mining
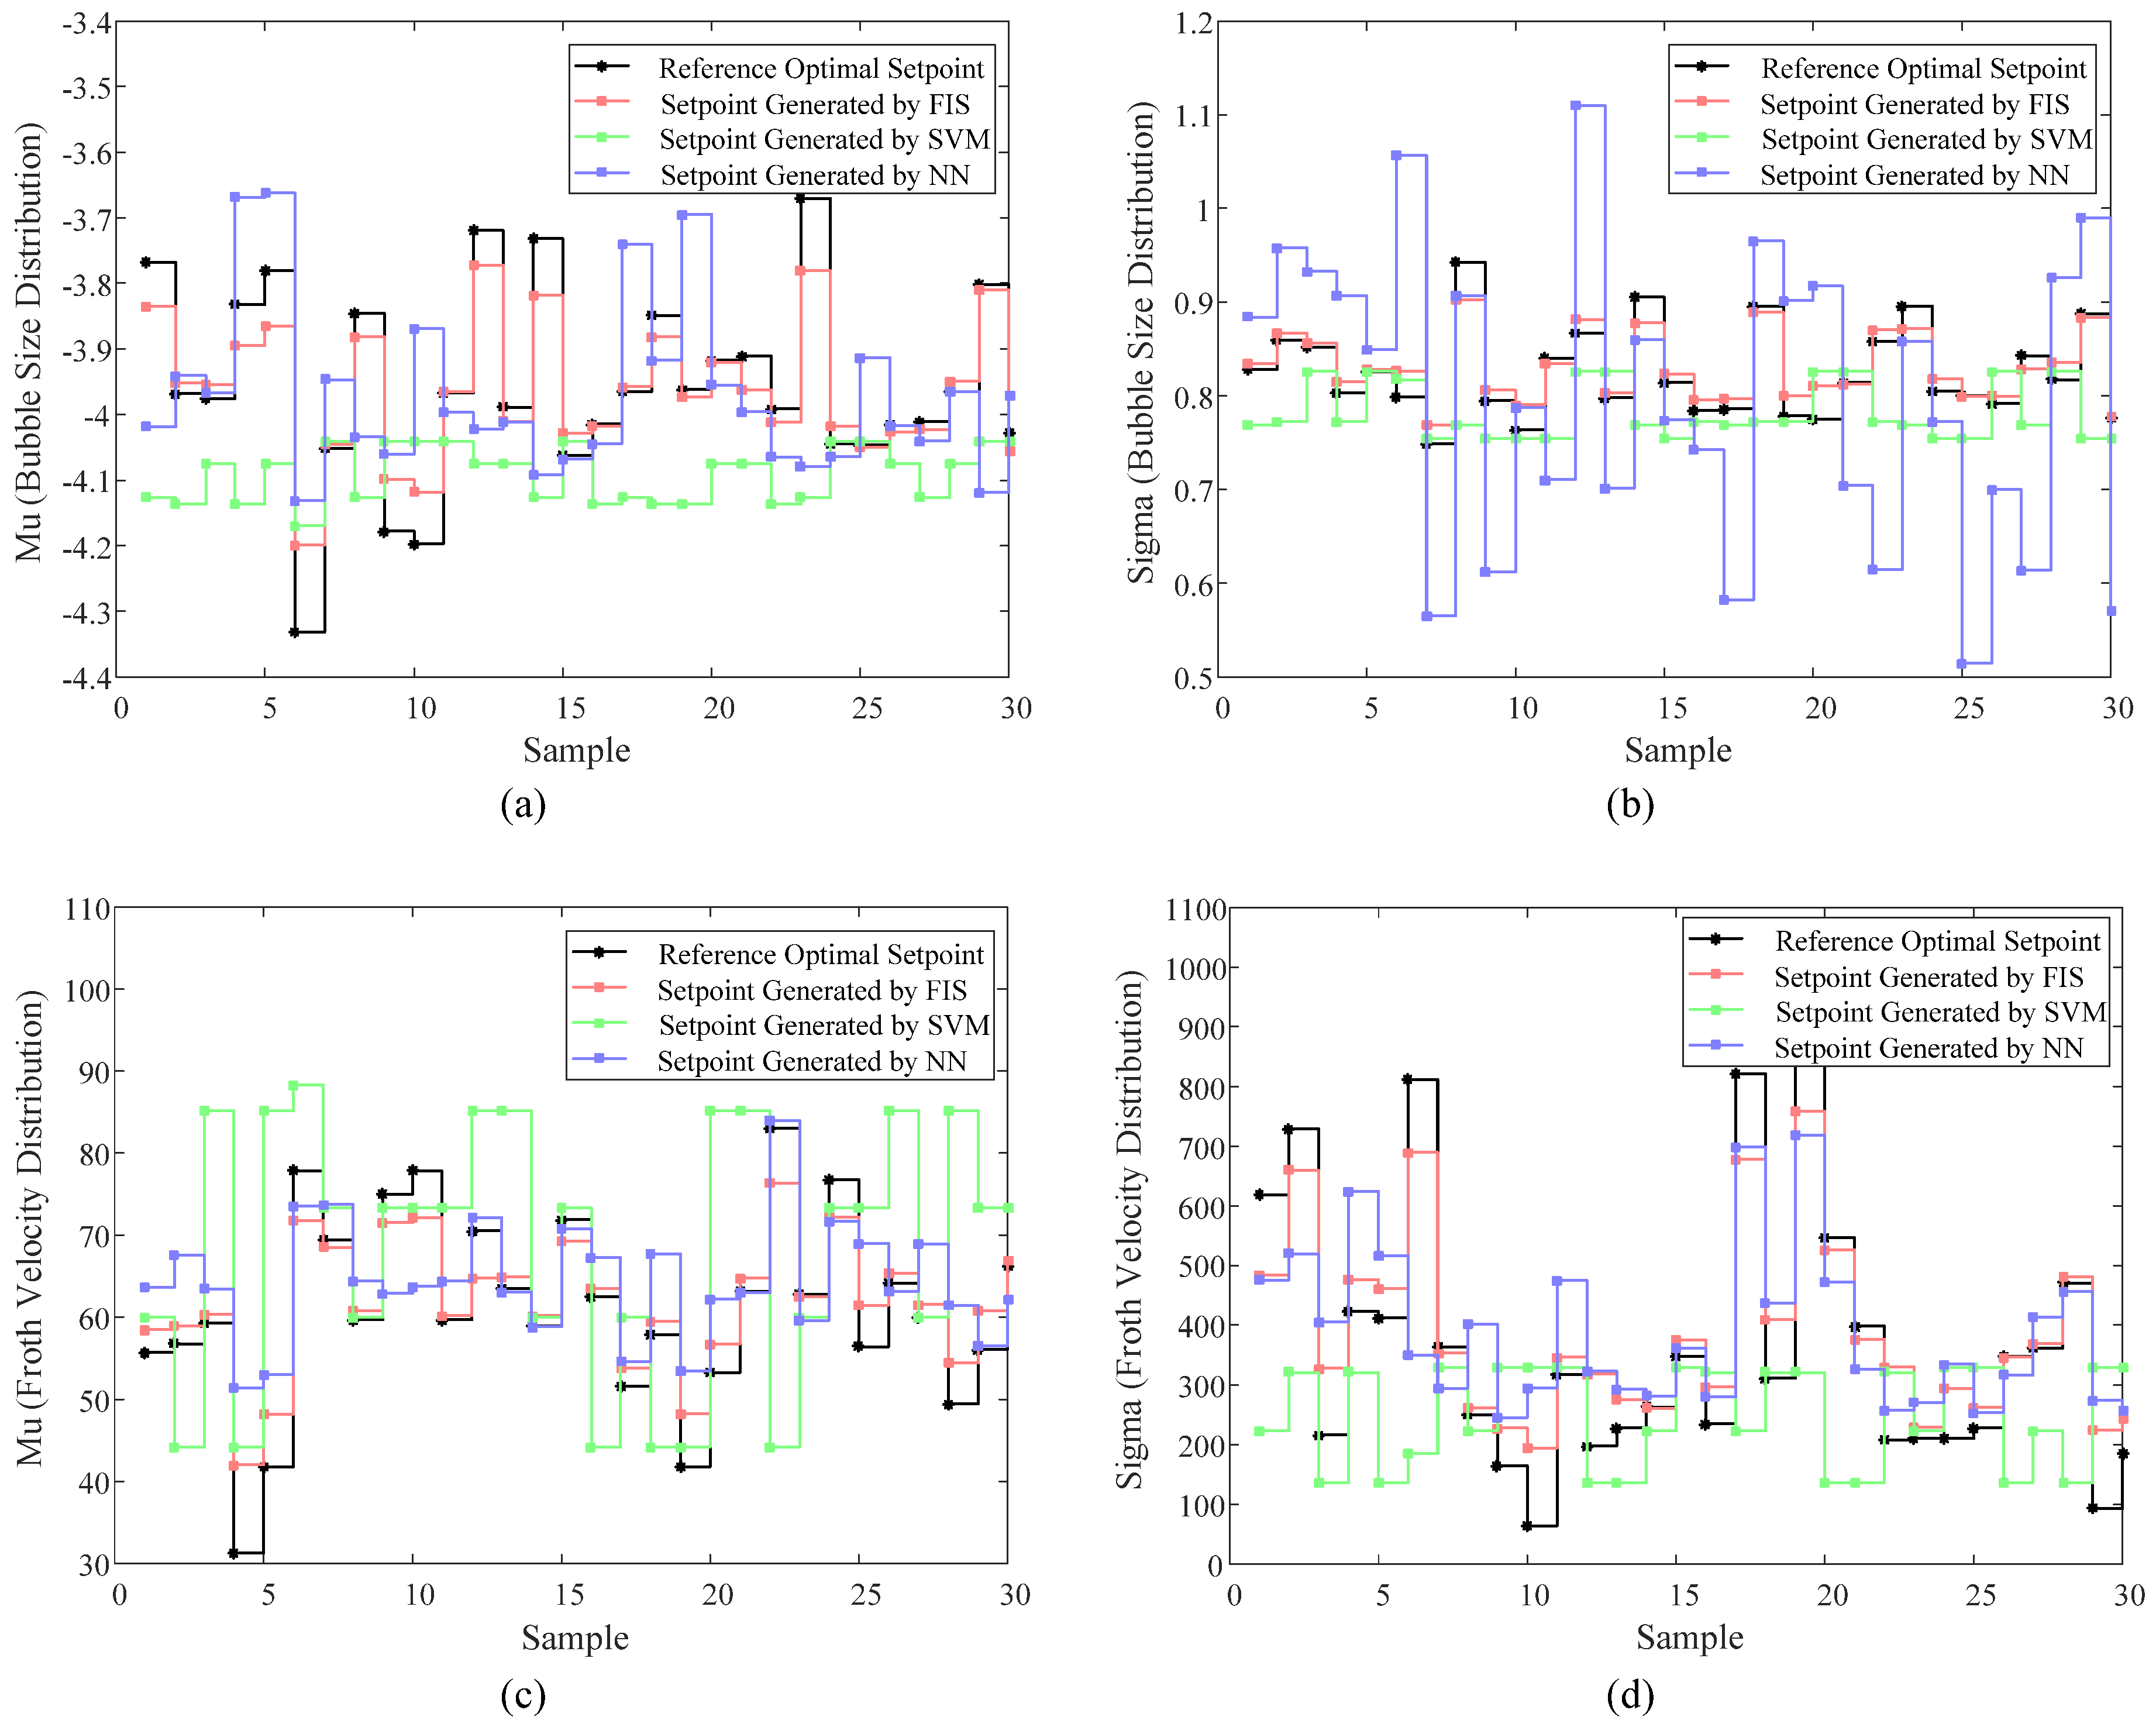
The goal of fuzzy association rule mining and inference is to generate optimal setpoint for froth surface behavior control. To validate the performance of the proposed method, an experiment based on collected historical data was conducted. Specifically, this experiment tried to verify whether the proposed method can generate setpoint which adapts to flotation working condition.
If the concentrate grade of a sample was the designed value 54%, this dataset could be viewed as the best expression of the experience of an operator. Thus, its froth surface behavior feature at control cycle, which is used to represent flotation working condition, can be viewed as the antecedent part of the association rule, and the generated froth surface behavior after reagent control can be used as consequent part of the association rule, which is also the optimal setpoint. To construct the knowledge repository of the association rule, 10,000 samples were screened out from the historical dataset whose concentrate grade was the designed value 54%. Five hundred samples were used as the test sample, and the others were used as the training sample. In this experiment, the froth surface behavior feature at control cycle was sent to the trained fuzzy inference system (FIS), and the predicted setpoint was compared to the collected froth surface behavior feature after reagent changing. The experimental results are summarized in Figure 7. For comparison, two setpoint generation modules based on clustering (a support vector machine was used here) and neural network were constructed, respectively. The clustering method supposes that the flotation working condition can be categorized into different clusters, and each cluster has one optimal setpoint [17]. Neural network assumes that there exists a linear or nonlinear relationship between flotation working condition and optimal setpoint.
It can be easily observed in Figure 7a that the SVM almost cannot predict the mean value (Mu) of bubble size distribution. It was hard for NN to predict the variance (Sigma) of bubble size distribution, as shown in Figure 7b. The RMSE evaluation of the proposed soft sensor is 0.0129, 0.0203, 0.0888, and 0.5151, whereas those of Clustering and NN are 0.0549, 0.0798, 0.3382, and 1.0230, and 0.0466, 0.1769, 0.1746, and 0.8322, respectively. It can be concluded that the proposed method was comparable to the manual operation of experienced operators. The operator may sometimes fail to estimate a reliable setpoint due to fatigue operation, but the FIS module can well handle this kind of problem. Compared to SVM and NN, the FIS is more robust.
4.3. Industrial Experiments
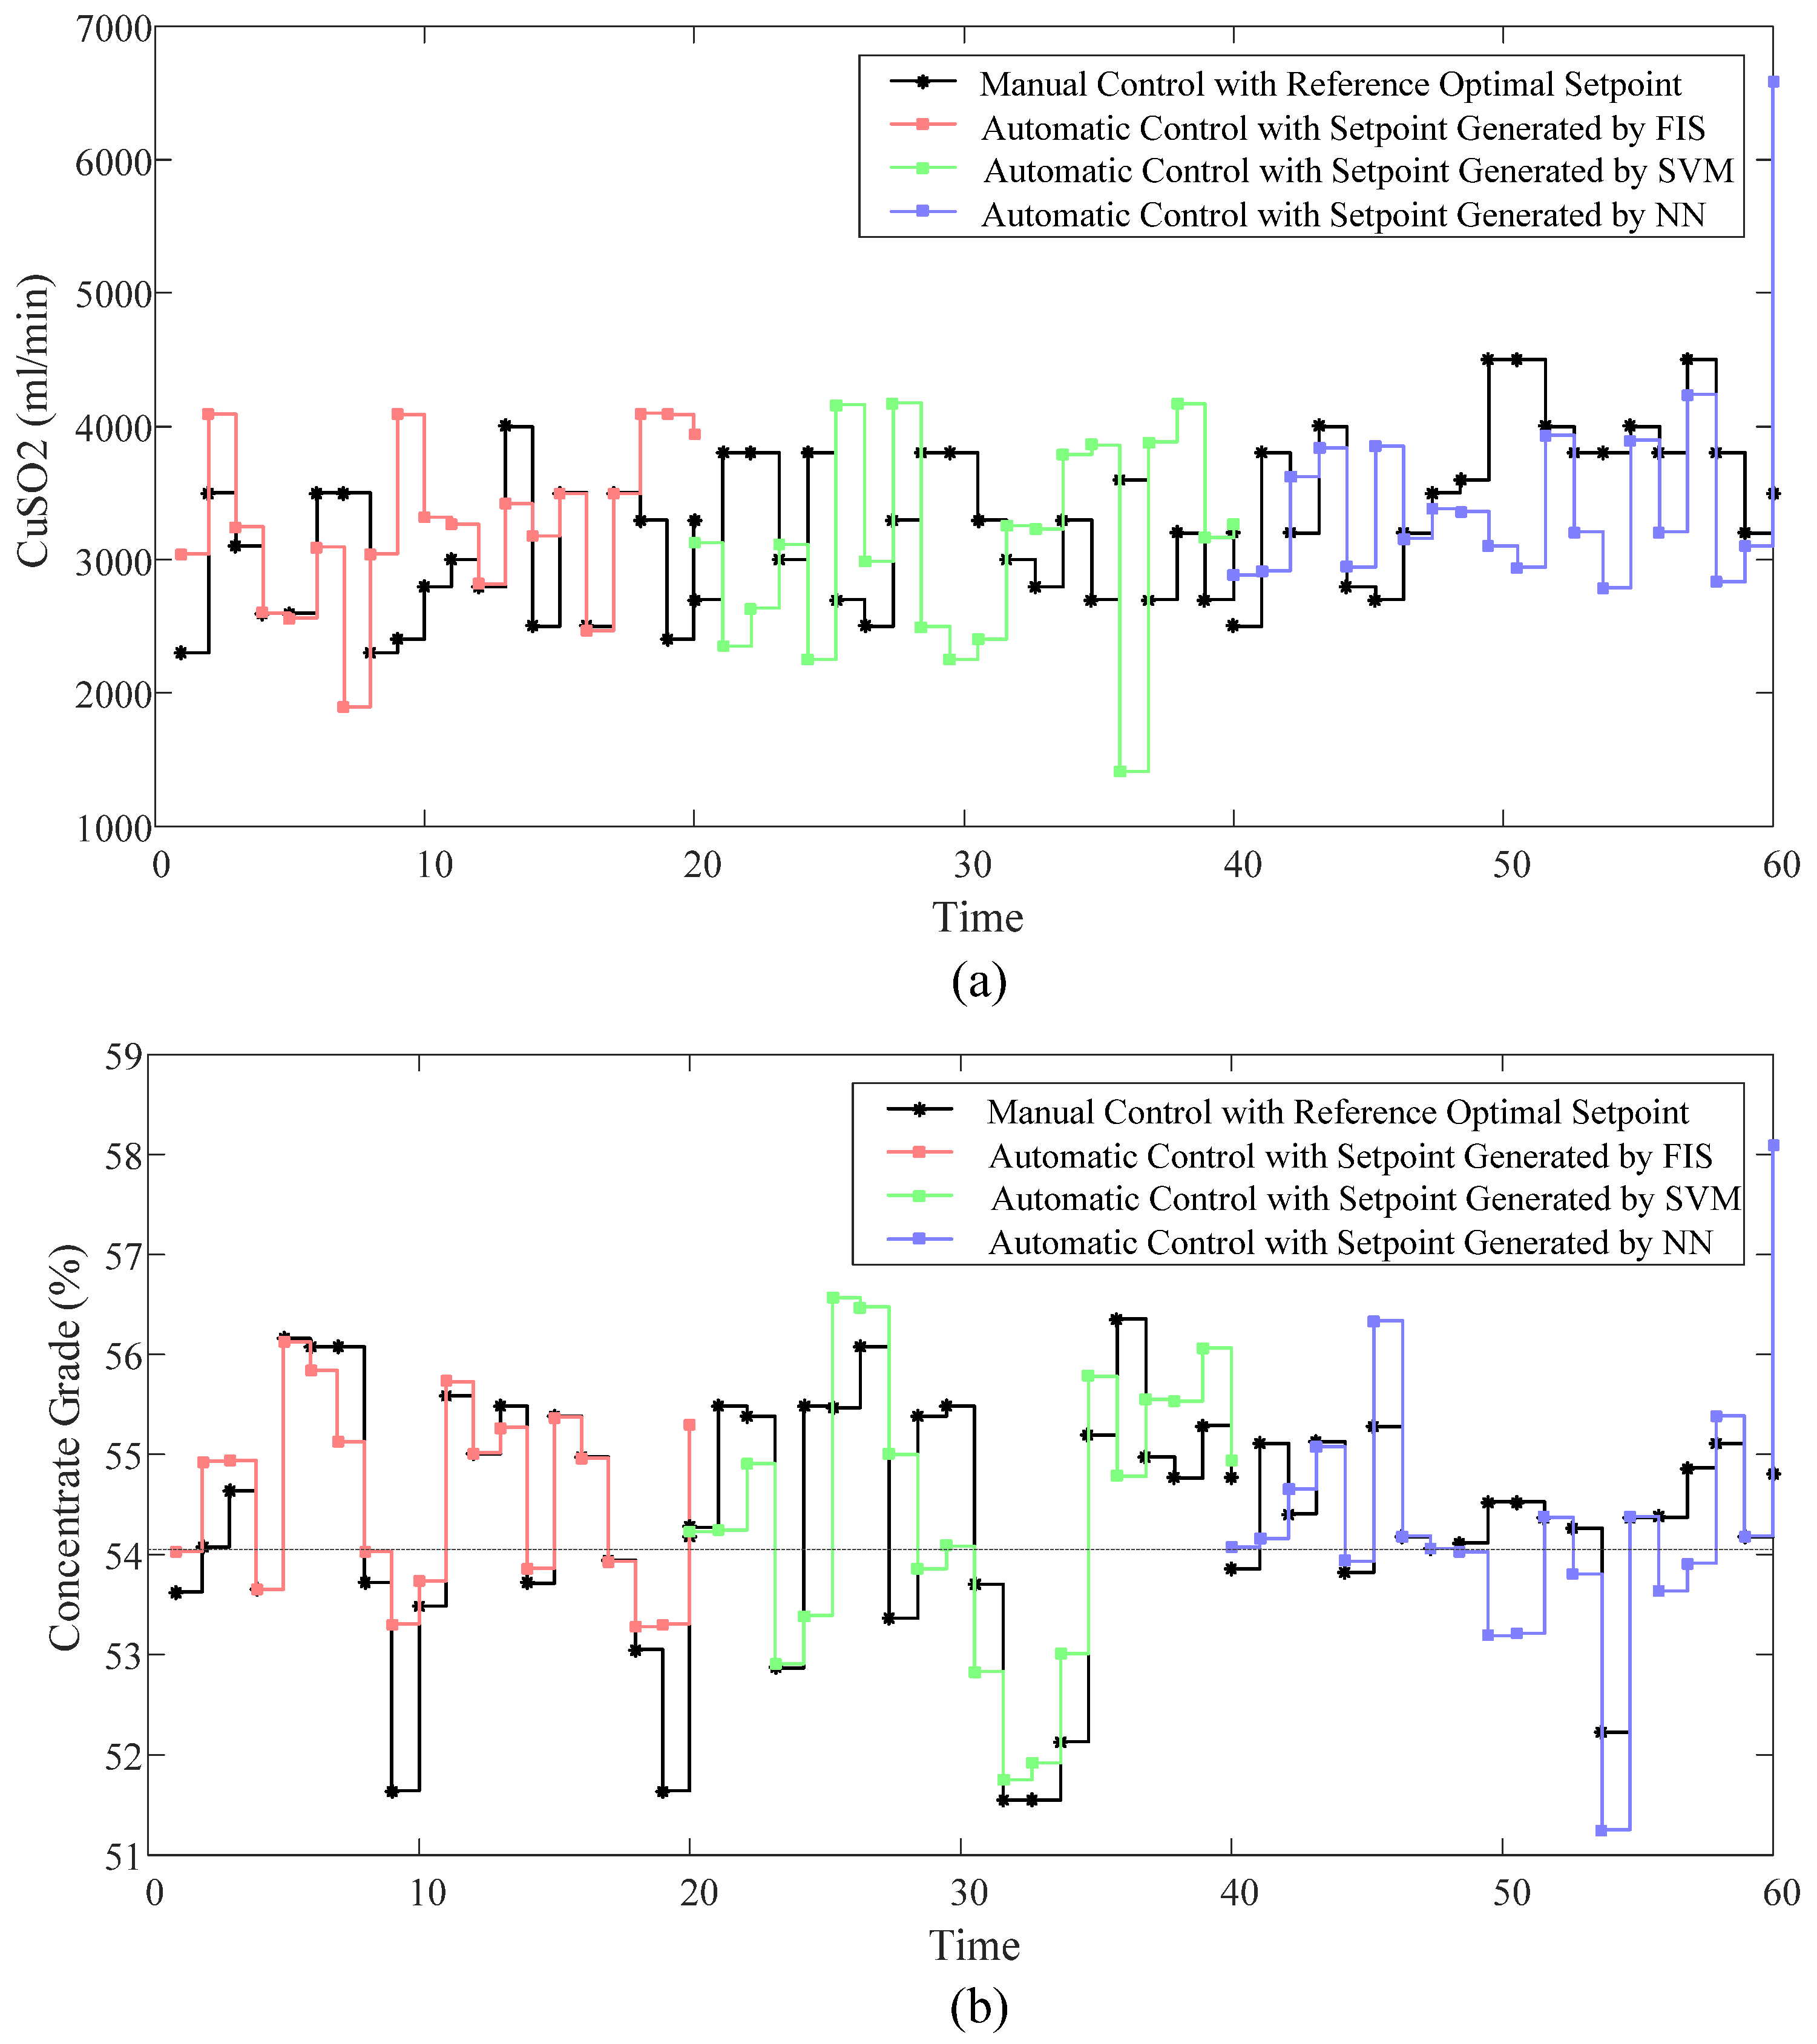
To further examine the performance of the proposed method, a neural network-based model predictive controller (NN-MPC) was constructed. Three setpoint generation modules, fuzzy inference system (FIS), clustering, and neural network predictor, were used to provide adaptive optimal setpoint for NN-MPC. There are two independent froth flotation systems in the plant depicted in Figure 1, the computer vision-based reagent automatic monitoring and controlling module was set up in system II. Therefore, in this experiment, manual operation provided a comparison for the automatic control. To fully compare the proposed FIS to clustering and neural network predictor, these three modules were switched every eight hours. Some experiment results are summarized in Figure 8.
In Figure 8b, the proposed FIS optimal setpoint generator was comparable to manual operation, since the obtained concentrate grade in system II was consistent with system I. Meanwhile, both the controlled results of SVM and NN produced fault conditions. Specifically, there were two samples in SVM whose concentrate grade was lower than 52%, and one sample in NN whose concentrate grade was also lower than 52%. A too low concentrate grade means that few mineral particles were covered on the bubble surface, which means it failed to separate valuable minerals. Furthermore, the concentrate grade of 60th sample in Figure 8b was higher than 57%, which was also a fault condition that means the froth was overloaded with mineral particles. It would cost a lot of reagents and reduce profits.
5. Conclusions
Against the two challenges in computer vision aided froth surface behavior control, this study proposed to combine the bubble size distribution and froth velocity distribution to describe the froth surface behavior, and a fuzzy association rule mining and inference-based optimal (optimal froth surface behavior for current working condition) setpoint generation method was proposed. The experiment results demonstrate the superiority and robustness of the proposed methods.
Author Contributions
J.Z. conceived and designed the experiments; J.Z. and Z.T. performed the experiments; J.Z., Z.T., M.A. and W.G. analyzed the data; and J.Z., M.A. and Z.T. wrote the paper.
Acknowledgments
This work is supported by NSFC—Guangdong joint fund of key projects (No. U1701261), National Natural Science Foundation of China (No. 61472134 and No. 61771492), and the Fundamental Research Funds for the Central Universities of Central South University (No. 502221804 and No. 502221803).
Conflicts of Interest
The authors declare no conflict of interest.
References
- Park, H.; Wang, L. Experimental studies and modeling of surface bubble behaviour in froth flotation. Chem. Eng. Res. Des. 2015, 101, 98–106. [Google Scholar] [CrossRef] [Green Version]
- Aldrich, C.; Marais, C.; Shean, B.; Cilliers, J. Online monitoring and control of froth flotation systems with machine vision: A review. Int. J. Miner. Process. 2010, 96, 1–13. [Google Scholar] [CrossRef]
- Symonds, P.J.; De Jager, G. A technique for automatically segmenting images of the surface froth structures that are prevalent in industrial flotation cells. In Proceedings of the 1992 South African Symposium on Communications and Signal Processing. COMSIG ‘92, Cape Town, South Africa, 11 September 1992. [Google Scholar]
- Moolman, D.W.; Aldrich, C.; Deventer, J.S.J.V.; Stange, W.W. Digital image processing as a tool for on-line monitoring of froth in flotation plants. Miner. Eng. 1994, 7, 1149–1164. [Google Scholar] [CrossRef]
- Zhang, J.; Tang, Z.; Liu, J.; Tan, Z.; Xu, P. Recognition of flotation working conditions through froth image statistical modeling for performance monitoring. Miner. Eng. 2016, 86, 116–129. [Google Scholar] [CrossRef]
- Jahedsaravani, A.; Massinaei, M.; Marhaban, M. Application of image processing and adaptive neuro-fuzzy system for estimation of the metallurgical parameters of a flotation process. Chem. Eng. Commun. 2016, 203, 1395–1402. [Google Scholar] [CrossRef]
- Zhang, J.; Tang, Z.; Ai, M.; Gui, G. Nonlinear modeling of the relationship between reagent dosage and flotation froth surface image by hammerstein-wiener model. Miner. Eng. 2018, 120, 19–28. [Google Scholar] [CrossRef]
- Ai, M.; Xie, Y.; Xu, D.; Gui, W.; Yang, C. Data-driven flotation reagent changing evaluation via union distribution analysis of bubble size and shape. Can. J. Chem. Eng. 2018. [Google Scholar] [CrossRef]
- Contreras, F.; Yianatos, J.; Vinnett, L. On the froth transport modelling in industrial flotation cells. Miner. Eng. 2013, 41, 17–24. [Google Scholar] [CrossRef]
- Vincent, L.; Soille, P. Watersheds in digital spaces: An efficient algorithm based on immersion simulations. IEEE Trans. Pattern Anal. Mach. Intell. 1991, 13, 583–598. [Google Scholar] [CrossRef]
- Soille, P. Morphological image analysis: Principles and applications. Sens. Rev. 2003, 28, 800–801. [Google Scholar]
- Vincent, L. Morphological grayscale reconstruction in image analysis: Applications and efficient algorithms. IEEE Trans. Image Process. 1993, 2, 176–201. [Google Scholar] [CrossRef] [PubMed]
- Núñez, F.; Cipriano, A. Visual information model based predictor for froth speed control in flotation process. Miner. Eng. 2009, 22, 366–371. [Google Scholar] [CrossRef]
- Jinping, L.; Weihua, G.; Zhaohui, T. Flow velocity measurement and analysis based on froth image SIFT features and Kalman filter for froth flotation. Turk. J. Electr. Eng. Comput. Sci. 2013, 21, 2378–2396. [Google Scholar] [Green Version]
- Jahedsaravani, A.; Marhaban, M.H.; Massinaei, M. Prediction of the metallurgical performances of a batch flotation system by image analysis and neural networks. Miner. Eng. 2014, 69, 137–145. [Google Scholar] [CrossRef]
- Rublee, E.; Rabaud, V.; Konolige, K.; Bradski, G. ORB: An efficient alternative to SIFT or SURF. In Proceedings of the 2011 IEEE International Conference on Computer Vision (ICCV), Barcelona, Spain, 6–13 November 2011. [Google Scholar]
- Xie, Y.; Wu, J.; Xu, D.; Yang, C.; Gui, W. Reagent addition control for stibium rougher flotation based on Sensitive Froth Image Features. IEEE Trans. Ind. Electron. 2016, 64, 4199–4206. [Google Scholar] [CrossRef]
- Bergh, L.; Yianatos, J. The long way toward multivariate predictive control of flotation processes. J. Process Control 2011, 21, 226–234. [Google Scholar] [CrossRef]
- Hong, T.-P.; Kuo, C.-S.; Chi, S.-C. Trade-off between computation time and number of rules for fuzzy mining from quantitative data. Int. J. Uncertain. Fuzziness Knowl. Based Syst. 2001, 9, 587–604. [Google Scholar] [CrossRef]
- Massinaei, M.; Sedaghati, M.R.; Rezvani, R.; Mohammadzadeh, A.A. Using data mining to assess and model the metallurgical efficiency of a copper concentrator. Chem. Eng. Commun. 2014, 201, 1314–1326. [Google Scholar] [CrossRef]
- Mohanty, S. Artificial neural network based system identification and model predictive control of a flotation column. J. Process Control. 2009, 19, 991–999. [Google Scholar] [CrossRef]
- Shean, B.; Cilliers, J. A review of froth flotation control. Int. J. Miner. Process. 2011, 100, 57–71. [Google Scholar] [CrossRef]
- Maldonado, M.; Desbiens, A.; Poulin, É.; del Villar, R.; Riquelme, A. Automatic control of bubble size in a laboratory flotation column. Int. J. Miner. Process. 2015, 141, 27–33. [Google Scholar] [CrossRef]
- Yoon, R.-H.; Soni, G.; Huang, K.; Park, S.; Pan, L. Development of a turbulent flotation model from first principles and its validation. Int. J. Miner. Process. 2016, 156, 43–51. [Google Scholar] [CrossRef]
- Kistner, M.; Jemwa, G.T.; Aldrich, C. Monitoring of mineral processing systems by using textural image analysis. Miner. Eng. 2013, 52, 169–177. [Google Scholar] [CrossRef]
- Morar, S.H.; Forbes, G.; Heinrich, G.S.; Bradshaw, D.J. The use of a colour parameter in a machine vision system, Smartfroth, to evaluate copper flotation performance At Rio Tinto’s Kennecott Utah copper concentrator. In Proceedings of the Centenary of Flotation Symposium, Brisbane, Australia, 6–9 June 2005; pp. 147–151. [Google Scholar]
- Wu, Y.; Peng, X.; Ruan, K.; Hu, Z. Improved image segmentation method based on morphological reconstruction. Multimedia Tools Appl. 2016, 76, 19781–19793. [Google Scholar] [CrossRef]
- Riquelme, A.; Desbiens, A.; del Villar, R.; Maldonado, M. Predictive control of the bubble size distribution in a two-phase pilot flotation column. Miner. Eng. 2016, 89, 71–76. [Google Scholar] [CrossRef]
- Rosten, E.; Drummond, T. Machine learning for high-speed corner detection. In Proceedings of the 9th European Conference on Computer Vision, Graz, Austria, May 7–13 2006; pp. 430–443. [Google Scholar]
- Kaartinen, J.; Hätönen, J.; Hyötyniemi, H.; Miettunen, J. Machine-vision-based control of zinc flotation—A case study. Control Eng. Pract. 2006, 14, 1455–1466. [Google Scholar] [CrossRef]
- Liu, J.J.; MacGregor, J.F. Froth-based modeling and control of flotation processes. Miner. Eng. 2008, 21, 642–651. [Google Scholar] [CrossRef]
- Agrawal, R.; Imielinski, T.; Swami, A.N. Mining Association Rules Between Sets of Items in Large Databases. In Proceedings of the SIGMOD Conference, Washington, DC, USA, 25–28 May 1993; pp. 207–216. [Google Scholar]
- Kalia, H.; Dehuri, S.; Ghosh, A.; Taniar, D. A survey on fuzzy association rule mining. Int. J. Data Warehous. Min. 2013, 9, 1–27. [Google Scholar] [CrossRef]
- Hong, T.P.; Lin, K.Y.; Chien, B.C. Mining fuzzy multiple-level association rules from quantitative data. Appl. Intell. 2003, 18, 79–90. [Google Scholar] [CrossRef]
- Frey, B.J.; Dueck, D. Clustering by passing messages between data points. Science 2007, 315, 972–976. [Google Scholar] [CrossRef] [PubMed]
- Wang, J.S.; Chen, Y.C. A Hammerstein-Wiener recurrent neural network with universal approximation capability. In Proceedings of the IEEE International Conference on Systems, Man and Cybernetics, San Antonio, TX, USA, 11–14 October 2009; pp. 1832–1837. [Google Scholar]
- Tohkura, Y. A weighted cepstral distance measure for speech recognition. IEEE Trans. Acoust. Speech Signal Process. 1987, 35, 1414–1422. [Google Scholar] [CrossRef]
- Belattar, K.; Mostefai, S. Similarity measures for Content-Based Dermoscopic Image Retrieval: A comparative study. In Proceedings of the First International Conference on New Technologies of Information and Communication, Ahmedabad, India, 28–29 November 2015. [Google Scholar]
- Maldonado, M.; Desbiens, A.; Del Villar, R. Potential use of model predictive control for optimizing the column flotation process. Int. J. Miner. Process. 2009, 93, 26–33. [Google Scholar] [CrossRef]
- Grne, L.; Pannek, J. Nonlinear Model Predictive Control: Theory and Algorithms; Springer: Berlin/Heidelberg, Germany, 2009. [Google Scholar]
Figure 1.
Illustration of lead-zinc froth flotation: (a) the flowchart of zinc flotation; and (b) an industrial scale flotation bank fixed with rotating scraper.
Figure 1.
Illustration of lead-zinc froth flotation: (a) the flowchart of zinc flotation; and (b) an industrial scale flotation bank fixed with rotating scraper.

Figure 2.
Illustration of the illumination modeling-based marker extraction.

Figure 3.
Log-normal-based bubble size distribution: (a) segmented froth image; and (b) bubble size distribution fitting using log-normal function.
Figure 3.
Log-normal-based bubble size distribution: (a) segmented froth image; and (b) bubble size distribution fitting using log-normal function.

Figure 4.
Illustration of velocity extraction by combining SURF key point matching and block locating: (a) the start frame of froth moving, where the red block denotes the rows block , and the small circles in are SURF key points; and (b) the following frame of the start frame at left, where the red block denotes the rows block , which is extracted to do SURF register with .

Figure 5.
Two typical froth velocity distributions extracted in collected historical data of a rougher bank in froth flotation plant. The plot distribution of continuous velocity distribution in a working cycle of rotating scraper approximates to Gaussian distribution, and the bias between two continuous velocity distribution is small: (a) two extracted continuous velocity distributions which have smallest bias; and (b) two extracted continuous velocity distributions which have largest bias.

Figure 6.
Correlation between concentrate grade and knowledge codes.

Figure 7.
Setpoint generation experiment: (a,b) the experimental results of mean value and variance of bubble size distribution, respectively; and (c,d) the experiment results of mean value and variance of froth velocity distribution, respectively.
Figure 7.
Setpoint generation experiment: (a,b) the experimental results of mean value and variance of bubble size distribution, respectively; and (c,d) the experiment results of mean value and variance of froth velocity distribution, respectively.

Figure 8.
Froth surface behavior control experiment results: (a) the plot of activator reagent; and (b) the plot of produced concentrate grade.
Figure 8.
Froth surface behavior control experiment results: (a) the plot of activator reagent; and (b) the plot of produced concentrate grade.


Table 1.
Keypoint Detector.
| Procedures for Keypoint Detector |
|---|
|
Table 2.
Keypoint Description.
| Procedures for Keypoint Description |
|---|
| 1. Define a binary test of image patch |
| Define the feature as a vector of binary tests |
| 2. For any feature set of , define the matrix |
| 3. Use the patch orientation and the corresponding rotation matrix to construct a “steered” version of as , thus |
Table 3.
Correlation Analysis between Concentrate Grade and Image Feature.
| Feature | Bubble size Distribution | Froth Velocity Distribution | ||
|---|---|---|---|---|
| Mu | Sigma | Mu | Sigma | |
| Grade | −0.47 | −0.42 | −0.32 | 0.51 |
© 2018 by the authors. Licensee MDPI, Basel, Switzerland. This article is an open access article distributed under the terms and conditions of the Creative Commons Attribution (CC BY) license (http://creativecommons.org/licenses/by/4.0/).
Share and Cite
MDPI and ACS Style
Zhang, J.; Tang, Z.; Ai, M.; Gui, W. Fuzzy Association Rule Based Froth Surface Behavior Control in Zinc Froth Flotation. Symmetry 2018, 10, 216. https://doi.org/10.3390/sym10060216
AMA Style
Zhang J, Tang Z, Ai M, Gui W. Fuzzy Association Rule Based Froth Surface Behavior Control in Zinc Froth Flotation. Symmetry. 2018; 10(6):216. https://doi.org/10.3390/sym10060216
Chicago/Turabian StyleZhang, Jin, Zhaohui Tang, Mingxi Ai, and Weihua Gui. 2018. "Fuzzy Association Rule Based Froth Surface Behavior Control in Zinc Froth Flotation" Symmetry 10, no. 6: 216. https://doi.org/10.3390/sym10060216
Note that from the first issue of 2016, this journal uses article numbers instead of page numbers. See further details here.