A Quick Gbest Guided Artificial Bee Colony Algorithm for Stock Market Prices Prediction


1
College of Computer Science, King Khalid University, Abha 62529, Saudi Arabia
2
School of Mathematics, Thapar Institute of Engineering & Technology (Deemed University), Patiala 147004, Punjab, India
3
Faculty of Computer Science and Information Technology, Universiti Tun Hussein Onn Malaysia, Batu Pahat Johor 86400, Malaysia
*
Author to whom correspondence should be addressed.
Symmetry 2018, 10(7), 292; https://doi.org/10.3390/sym10070292
Submission received: 21 June 2018
/
Revised: 6 July 2018
/
Accepted: 10 July 2018
/
Published: 20 July 2018
(This article belongs to the Special Issue Emerging Approaches and Advances in Big Data)
Abstract
:The objective of this work is to present a Quick Gbest Guided artificial bee colony (ABC) learning algorithm to train the feedforward neural network (QGGABC-FFNN) model for the prediction of the trends in the stock markets. As it is quite important to know that nowadays, stock market prediction of trends is a significant financial global issue. The scientists, finance administration, companies, and leadership of a given country struggle towards developing a strong financial position. Several technical, industrial, fundamental, scientific, and statistical tools have been proposed and used with varying results. Still, predicting an exact or near-to-exact trend of the Stock Market values behavior is an open problem. In this respect, in the present manuscript, we propose an algorithm based on ABC to minimize the error in the trend and actual values by using the hybrid technique based on neural network and artificial intelligence. The presented approach has been verified and tested to predict the accurate trend of Saudi Stock Market (SSM) values. The proposed QGGABC-ANN based on bio-inspired learning algorithm with its high degree of accuracy could be used as an investment advisor for the investors and traders in the future of SSM. The proposed approach is based mainly on SSM historical data covering a large span of time. From the simulation findings, the proposed QGGABC-FFNN outperformed compared with other typical computational algorithms for prediction of SSM values.
1. Introduction
In the new global world, it has been a universal goal to make one’s life stress-free and to prepare oneself for upcoming challenges without any pressure. A fundamental concept in society is that wealth brings comfort and luxury, so it is not surprising that there has been so much research done on ways to predict the stock market values. It is due to the global issues such as increasing of population, transportation, water problems, and business [1]. Furthermore, the absence of suitable predicting tools makes it more attractive to researchers. A stock market is a community market for trading the company’s shares daily at the approved stock price, which depends upon the demand and supply gap, quality, region, and global environment as well. Therefore, stock market prediction trend is a significant issue in finance for all developed countries. SSM has a key role for the economic development of many countries such as Egypt, India, Bangladesh, Pakistan, Philippines, China, Japan, America, United States, Afghanistan, and Indonesia.
The scientists and economic and computer science researchers have struggled to develop powerful finance position tools. Several approaches including mathematical, statistical, economic, and computational approaches have been proposed and used for forecasting of the economic position of different countries. Unfortunately, generally, these approaches are not perfect to predict the SSM values efficiently. There has been no specific research for prediction of SSM values.
Traditionally, different statistical prediction methods [2,3] such as linear regression, time series analysis, and chaos theory were used to predict the behavior of the stock price trends. However, these methods were partially successful due to their non-reliability. As an alternative to these approaches, soft computing techniques such as artificial neural network [4,5] and evolutionary algorithm [6] are widely used to capture the non-linearity trend of the stock market price. In these approaches, Artificial Neural network (ANN) has the ability to adjust itself according to the given information while the evolutionary algorithm is captured to find the global or near-to-global solution of the problem. By keeping the advantages of its self-adjusting ability, researchers were paying more attention to ANN and evolutionary algorithms and presented several algorithms to solve the problems. In ANN, the performance depends upon learning algorithm, dataset nature, and suitable topology. The most commonly used training algorithm is the back-propagation (BP) algorithm [7] which is at risk of sticking in local minima, so BP may lead to failure in finding the global optimal solution. On the other hand, the use of the evolutionary algorithms (EAs) is a successful method to find the global solution. The major advantages of the EAs are that finding the derivative of the functions is not required, and they use probabilistic transition rules instead of deterministic rules to update the solutions. Until now, several researchers have presented a variety of algorithms such as differential evolution (DE) [8], harmony search (HS) [9], genetic algorithm (GA) [10], particle swarm optimization (PSO) [11], artificial bee colony (ABC) [12,13], and some hybrid algorithms [14,15,16]. Under these algorithms, Abdual-Salam et al. [17] compared the DE and PSO algorithm for training the feed-forward neural network for stock price prediction. Garg [15] presented a hybrid PSO-GA algorithm for solving the various constraint optimization problems. In this approach, PSO is used to explore the solution while GA is being used for updating the solution. In [18], authors have presented a quick ABC algorithm for solving the optimization problems. Garg [16] presented a penalty-guided ABC algorithm for solving structural engineering design problems. In [19,20], authors have presented a hybrid ABC algorithm for training neutral networks as well as predicting the time series data. In the field of time-series predictions, authors [21,22,23] have presented an approach based on EAs for solving the stock time problems.
Thus, by keeping the advantages of both the artificial neural network and EAs, the goal of this paper is to find out a prediction system for Saudi Stock Market (SSM) values based mainly on SSM historical data covering a large span of time that can predict closing stock price precisely. For it, we propose an algorithm based on ABC to minimize the error in the trend and actual values by using the hybrid technique based on neural network and artificial intelligence. To increase the exploration and exploitation procedures of EAs, we presented a Quick Gbest Guided artificial bee colony (ABC) learning algorithm to train the feed-forward neural network (QGGABC-FFNN) model. In it, the effective amount of exploitation and exploration strategies are increased through global best (gbest) guided bee and quick bee strategy [24]. The presented approach has been verified and tested to predict the accurate trend of SSM values.
The rest of the manuscript is organized as follows: In Section 2, we present the concept of the feed-forward neural networks. In Section 3, we present the concepts of ABC algorithm to solve the optimization problem. In Section 4, we present a QGGABC algorithm to solve the time series data prediction problem. Section 5 illustrates the presented approach, tests it on the SSM values, and discusses results. Finally, a conclusion and future work are stated in Section 6.
2. Neural Networks and Saudi Stock Market
A stock market is a public market for the trading of company stock and derivatives at an agreed price, volume, and quality; these are securities listed on a stock exchange as well as those only traded privately [1]. It is also called secondary market, as it involves trading between two investors, the public regulatory body and private investors [25]. SSM is the economic hub of different countries especially for Asian and Gulf regions [26]. Therefore, the prediction is an essential part of the economy in the KSA for shareholders and investors to estimate the stock values price and select the best trading opportunity accurately among different profitable organizations in advance.
Neural networks (NNs) are powerful soft-computing forecasting tools that predict different stock market values [27]. It is the non-linear mathematical model used to map past and future values of time series datasets for the purpose of analysis of upcoming trends. The originality of the ANNs lies in their ability to determine nonlinear relationships in the input data set without a prior assumption of the knowledge of mapping between the input and the output patterns in different areas of knowledge like computer science, social studies research, engineering, biology, and mathematical sciences [23,25]. ANN tools are very famous for classification and prediction tasks of financial time series datasets, especially of stock exchange market values due to their unpredictable behaviors [22].
For KSA stock exchange prediction, none of the traditional time series methods has proved to be consistently correct prediction tools investors would like to have. However, machine learning methods have been successfully used for Saudi stock exchange values prediction. For example, genetic fuzzy systems (GFS) and ANN used to construct a stock price forecasting expert system have obtained high accuracy for Airlines and IT centers [21]. The three well-known feature selection methods, which are Principal Component Analysis, GA, and decision trees with BP algorithm, were used for better prediction the stock price for investors. Neuro-Fuzzy Inference System was used for stock exchange analysis. GA with feed-forward neural network (FFNN) was used to predict stock market prices [28]. BPNN and GA were used for SSM to predict the direction of daily price changes, however, due to slow convergence speed and trapping in local minima [22].
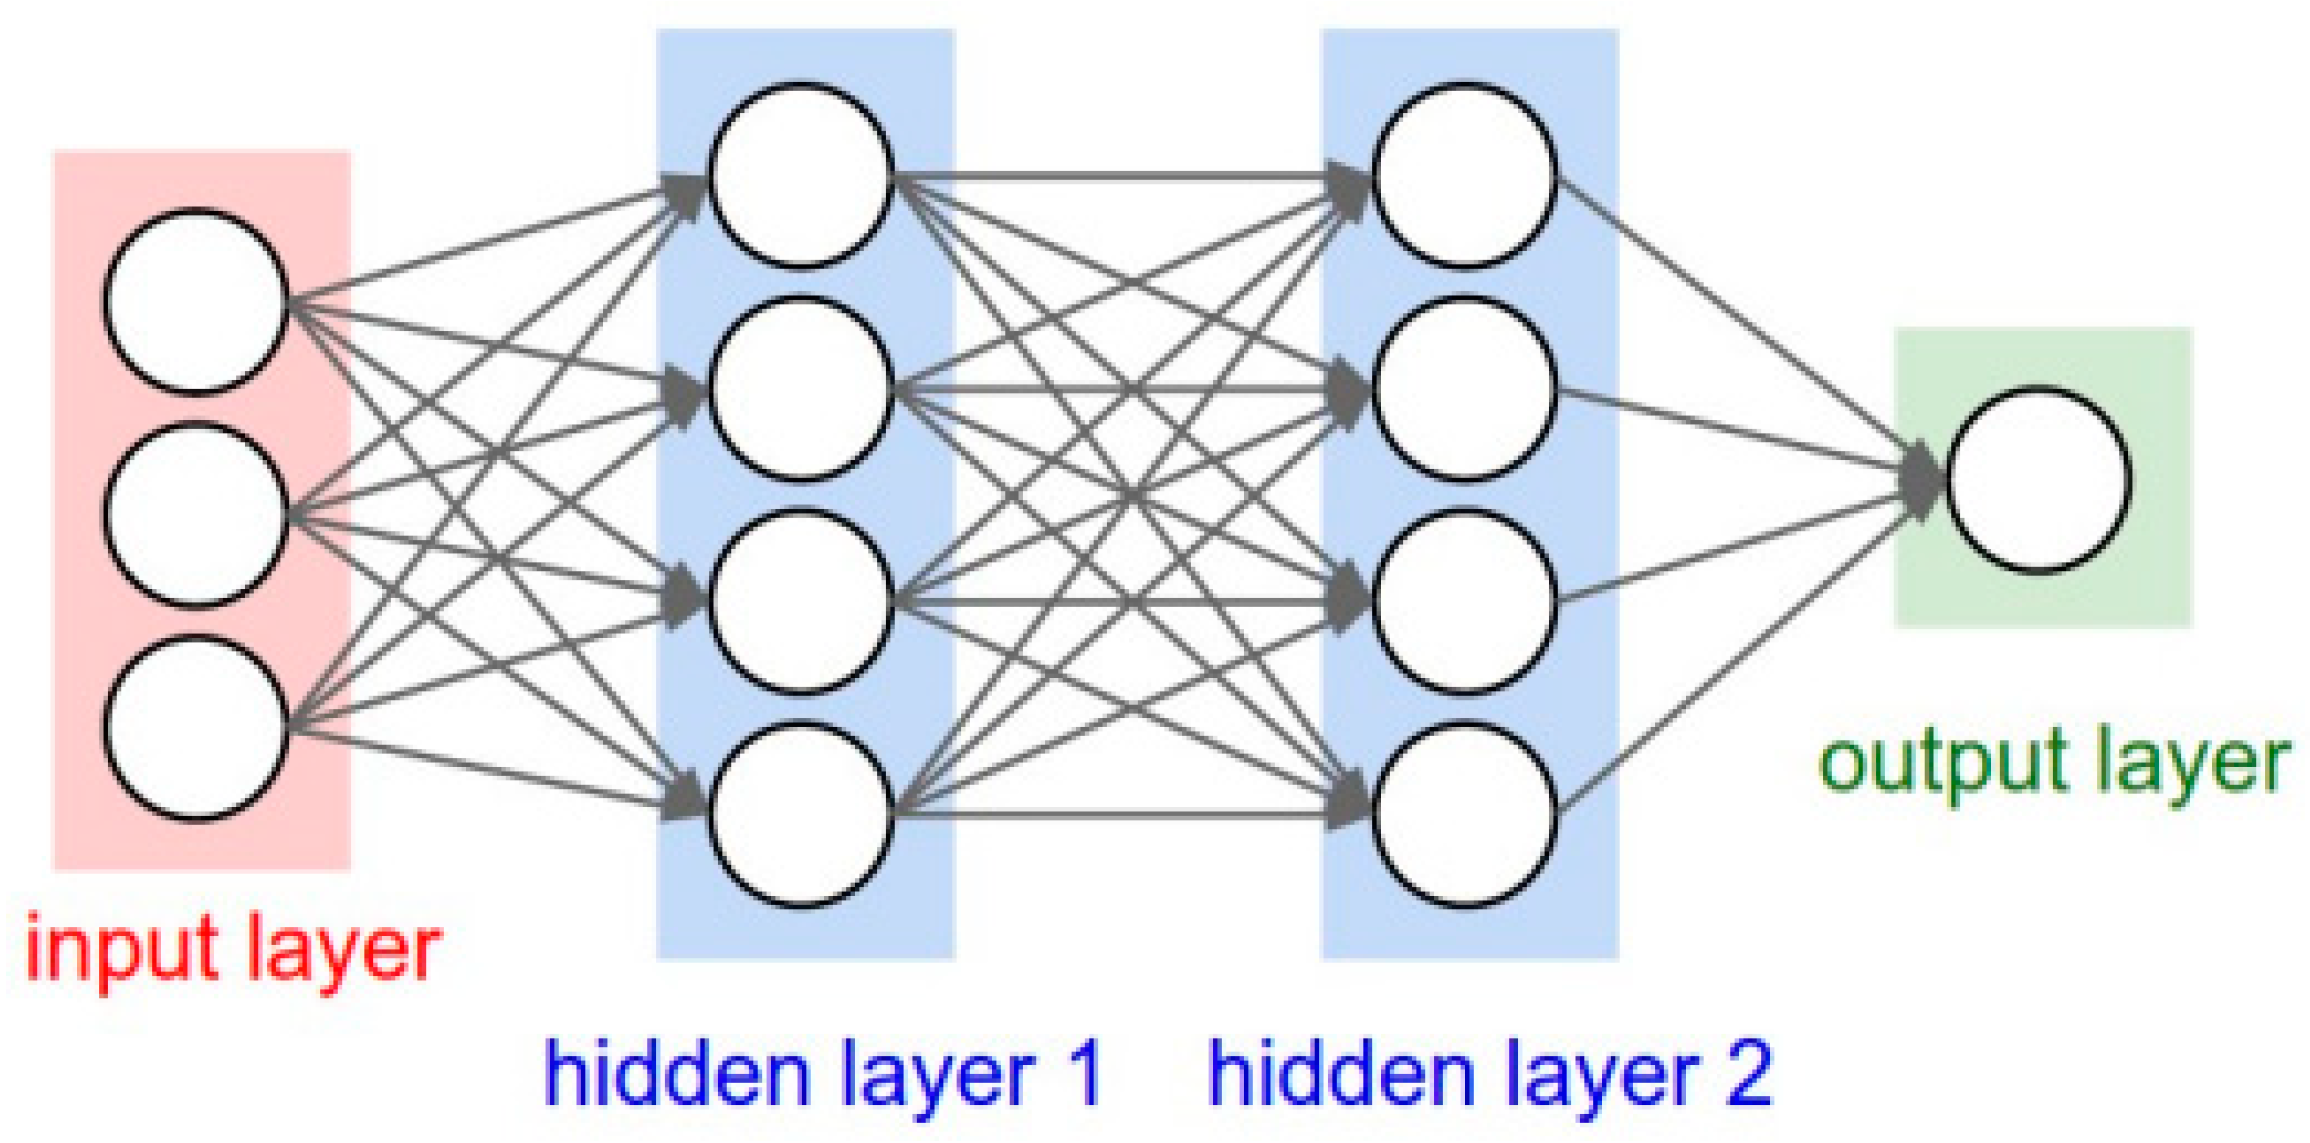
Multilayer Perceptron (MLP), which is also known as an FFNN, was introduced by F. Rosenblatt for solving non-linear XOR classification problems and was then successfully applied to different science and engineering problems [29]. MLP is highly used and tested with financial problems such as in stock exchange market prediction. It consists of physical components called neurons, and the connection between them [30]. The basic architecture of MLP with one input, two hidden and one output layers is shown in Figure 1.
If we assume weights vector to be w, x is the vector of inputs, b is the bias, and f is the activation function then the output through MLP neurons is computed, mathematically, as
Here, the most commonly-used hidden neuron activation function is the sigmoid function which is given by Equation (2).
During the process, sometimes the supervised learning problem of the MLP failed to train the ANN effectively and cannot solve the given complex problems in an efficient way. Furthermore, the conventional algorithms methods trapped in local minima due to suboptimal weight values, wrong number of parameters selection, unsuitable network structure, and the fully random method of training as well. In order to overcome it, bio-inspired learning algorithms have been proposed for MLP such as ABC, ACO, and CS. Here, in these approaches, Artificial Neural network (ANN) has the ability to adjust itself according to the given information while the evolutionary algorithm is captured to find the global or near to global solution to the problem. Thus, we have incorporated the idea of the EAs into the present study and proposed a new updated efficient method based on honeybees’ intelligent behaviors, which are used to guide the ANN with enough suitable control parameters. The presented algorithm was used here to train and test MLP for SSM prices prediction of different business organizations.
3. Bees-Inspired Learning Algorithms
A rich source of inspiration is nature, which has motivated many researchers to develop a nature-inspired approach for solving complex problems. Therefore, from the last decade, bio-inspired algorithms have become famous due to natural behaviors and efficient results. Hybridization of these algorithms, either with typical computational or bio-inspired approaches, have become more popular. These are DE [8], HS [9], GA [10], PSO [11], ABC [12,13,24], and some hybrid algorithms [14,15,31,32]. These algorithms, also called general swarm intelligence, work based on some successful characteristics of a biological system such as bees, birds, fishes, animals, etc. ABC algorithm is developed by Dervish Karaboga based on honey bees’ behavior [33]. Details of ABC and its different variants are given in the following sections.
3.1. Artificial Bee Colony (ABC) Algorithm
ABC is one of the most attractive bio-inspired algorithms developed for solving complex science and engineering problems [13] which simulate the foraging behavior of honey bees. It is characterized in the group of meta-heuristic algorithms. In this algorithm, the characteristics of bees are divided into three aspects namely employed, onlooker, and scout bees. During the process, exploitation process is carried out by the employed and onlooker bees while scout bees are used for the exploration process through the following strategy, as given in Equation (3).
where Vij represents the number of new solutions in the neighbourhood of xij for the employed bees, k is a solution in the neighbourhood of i, and is a random number in the range [−1, 1].
Although the ABC algorithm is famous due to its robustness and high efficiency for clustering, classification, and numerical function optimization problems, due to the exploitation of the same approach, finding the optimal solution is not guaranteed; as well, sometimes it is trapped in local minima. The researchers improved the typical ABC algorithm by using different strategies such as gbest-guided and quick-within employed, onlookers, and scout bees.
3.2. Gbest Guided Artificial Bee Colony (GGABC) Algorithm
The sufficient and balanced amount of exploration and exploitation process can increase the performance of the bio-inspired algorithms, especially of the ABC approach is used. The optimal global solution can be easily archived through the strong exploration and exploitation process in a given region. GGABC algorithm is the improved version of typical ABC, which uses the PSO global best process to increase the exploitation amount similar to exploration [24]. Therefore, Zhu and Kwong [24] had merged the global best approach of PSO in the typical ABC algorithm for finding and selecting the best solution in the defined population. In GGABC algorithm, Equation (3) has been modified as,
where yj is the gbest solution of the population, ψij is a uniform random number in [0, C], C > 0. The value of C can balance the exploitation ability. For more details, we refer to Ref. [24].
3.3. Quick Artificial Bee Colony (QABC) Algorithm
QABC algorithm [18] is an extension of the standard ABC which simulates the gbest intelligent foraging behavior of honey bees. In standard ABC algorithm, the employed and the onlooker bees both updates with the same Equation (3) to determine the new solutions. However, in [18] authors have updated it by modifying the onlooker bees’ phase with Equation (6),
where represents the best solution among the neighbors of and itself (). For more details, we refer to Ref. [18].
4. The Proposed: Quick Gbest Guided Artificial Bee Colony Algorithm
The typical ABC is an efficient bio-inspired algorithm for solving the wide range of complex science and engineering problems [12,13,24]. Although it is easy to understand and implement, sometimes it is trapped in local minima due to poor exploration and exploitation process. The ABC employed bee phase has been improved through the gbest guided approach called GGABC, as mentioned in Section 3.2; it has successfully improved the performance of employed and onlooker bees with the same exploiting strategy. However, the scout bees section still used the same ABC random selected method. Later on, Karaboga modified the typical ABC onlooker bees’ selection phase though Equation (6); however, the employed bees section did not modify for strong exploitation process [18]. Furthermore, sometimes the typically employed bee section was unable to reach global optima. Here, taking the advantages of a quick onlooker section with guided employed bees combined for strength and balance in exploration and exploitation processes. Therefore, Equation (3) will replace guided employed bees for increasing the exploitation process as:
In this guided approach, the guided employed bees section refers to the exploration of the best food sources in the various unknown regions in the solution space to reach to the global optimum. This method will no longer use random ways to find new suboptimal candidate solutions, but it will use the PSO global best (gbest) solution to guide the search for best candidate solutions. Therefore, the exploitation amount will be increased through the gbest term for the new candidate solution towards the best food sources, where the amount of exploration and exploitation can be balanced through the best value of parameter C. Equation (3) of the typical ABC algorithm is also used by the onlooker bees section, which gets a candidate solution through employed bees’ dancing behaviors. Onlooker bees do not have their own strategy to explore best food sources to reach global optima. Therefore, the typical onlooker bees will use the quick search strategy instead of following employed bees blindly. Equation (3) for the onlooker section will be modified as,
On the other hand, the new solution is generated using Equation (9).
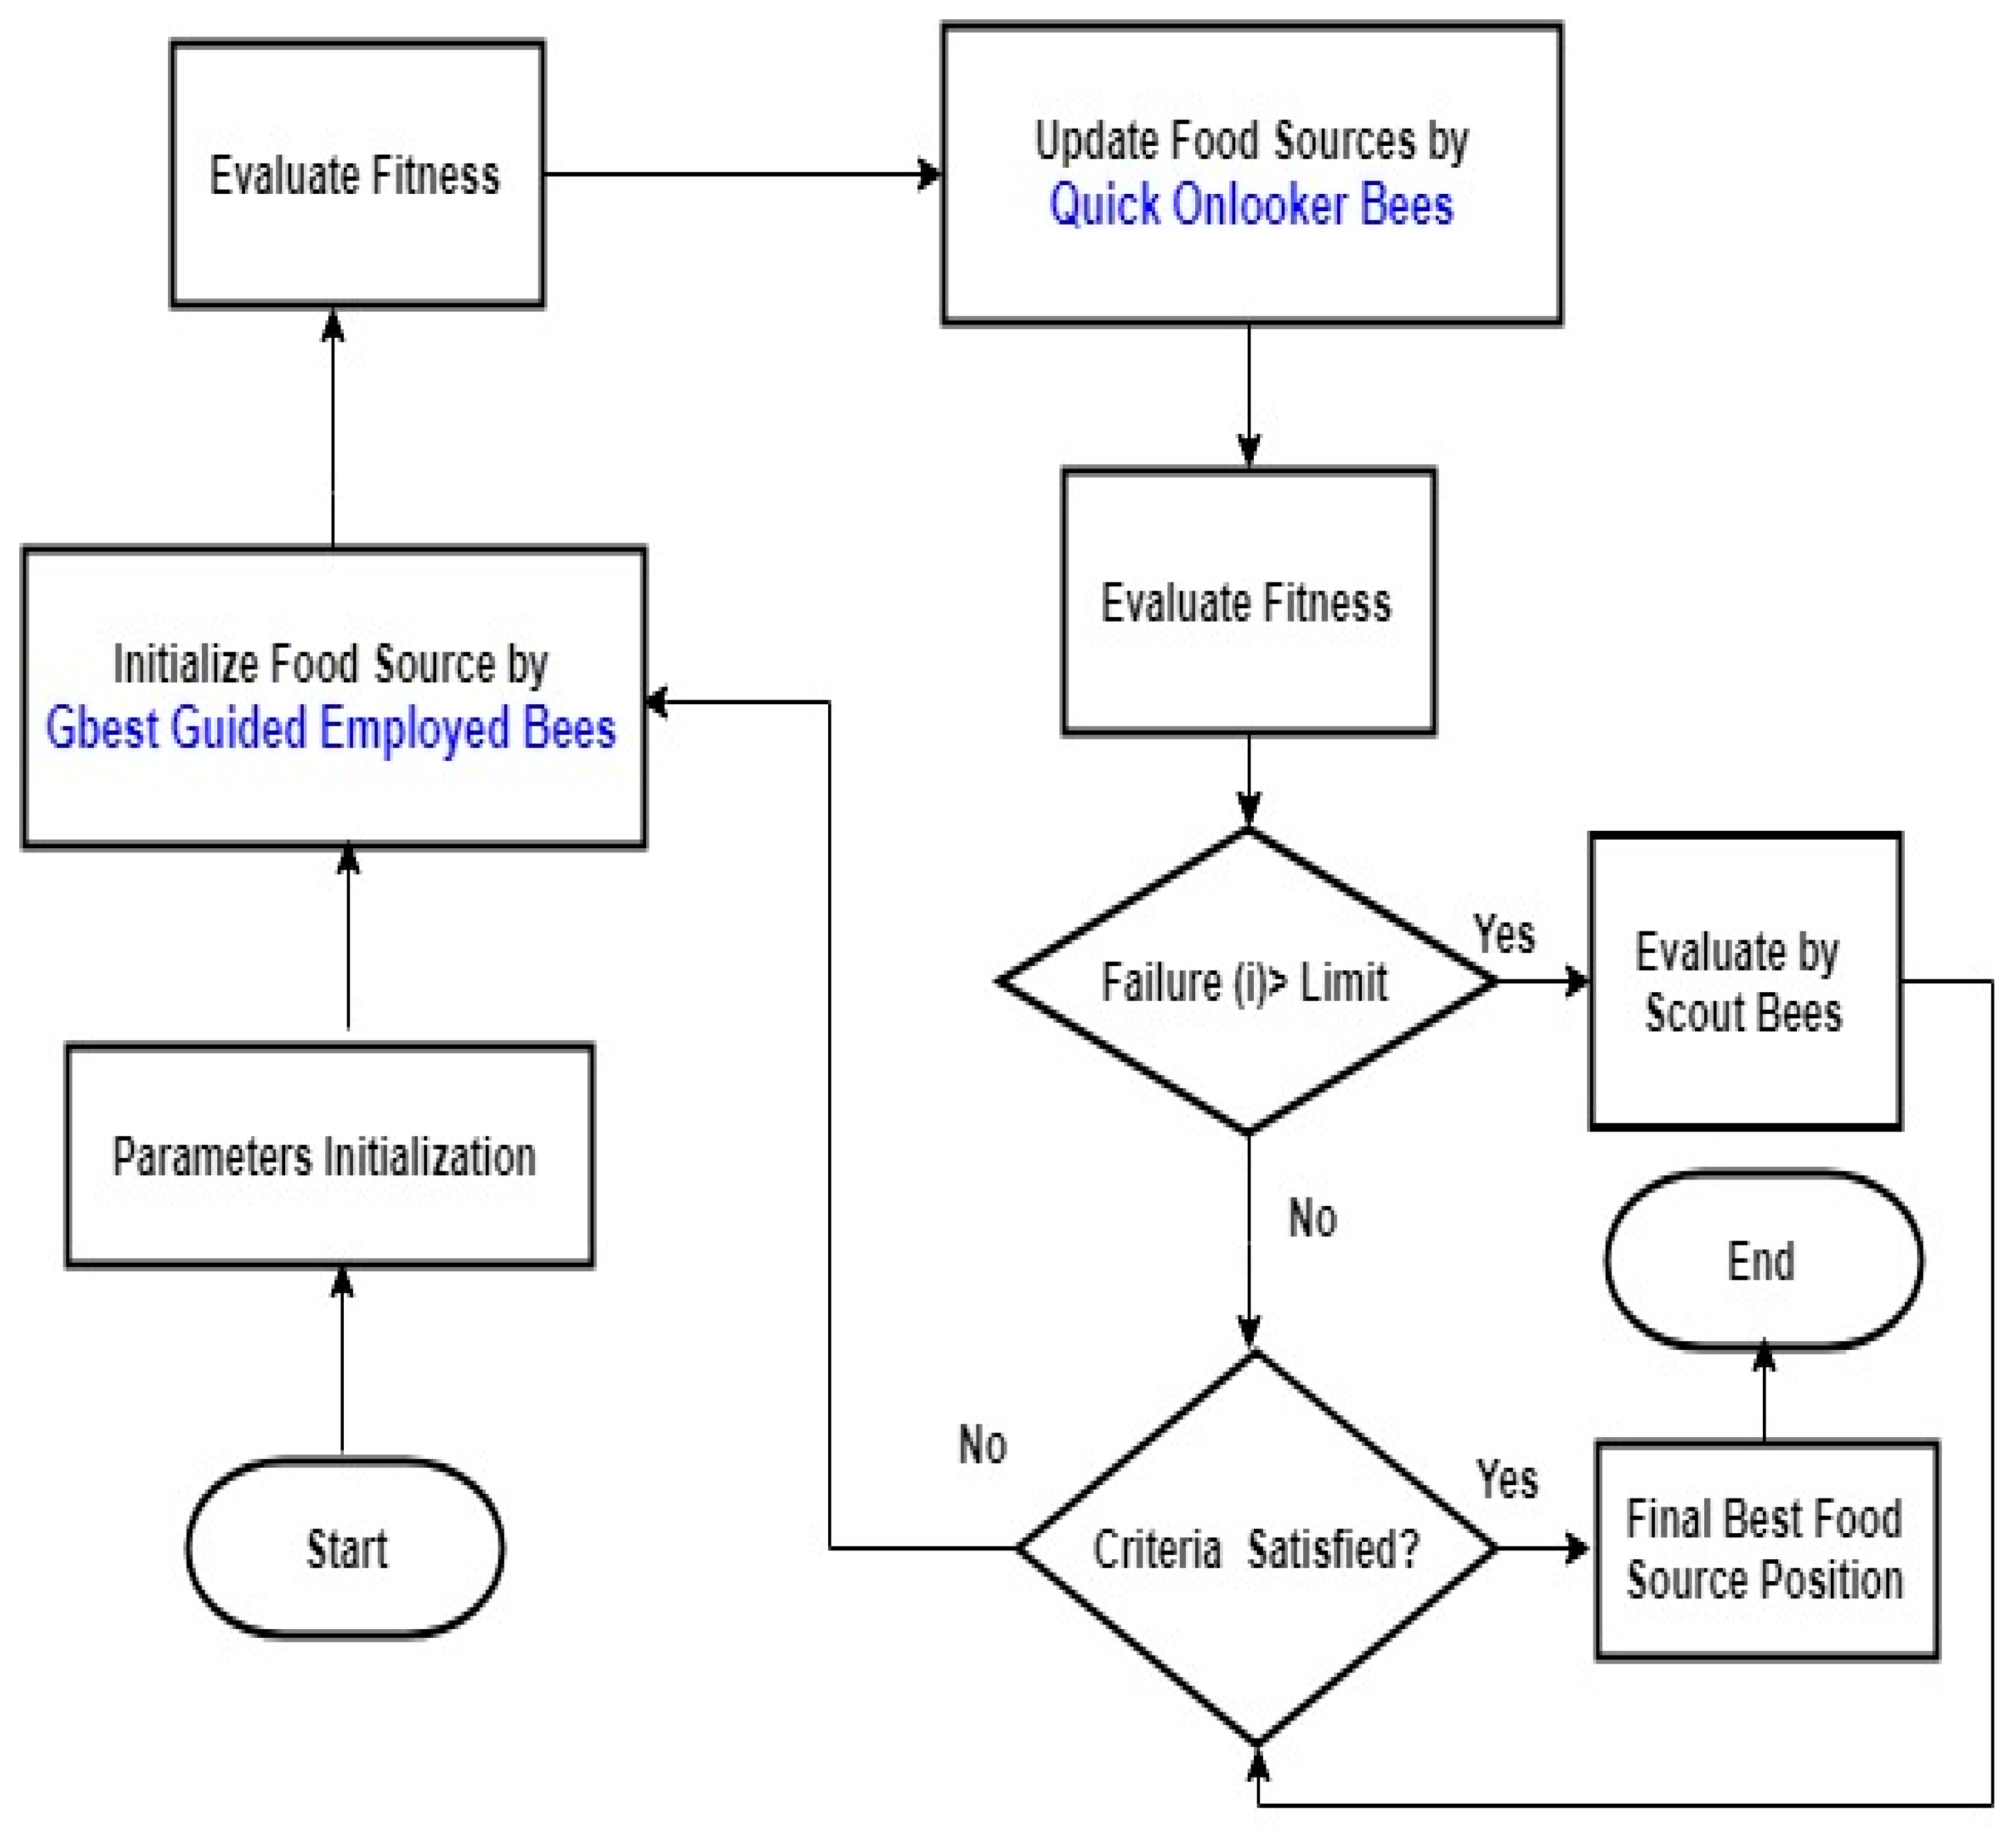
The flowchart (Figure 2) and pseudo code of the proposed QGGABC algorithm are given below:
- Step 1:
- Initialize the population xi, where .
- Step 2:
- Compute the fitness values.
- Step 3:
- Cycle = 1.
- Step 4:
- Repeat from step 2 to step 14.
- Step 5:
- Produce new solutions in the neighbourhood of using Equation (7).
- Step 6:
- Apply the Greedy Selection process.
- Step 7:
- Calculate the probability values pi for the solutions xi using Equation (10).where is defined as,
- Step 8:
- Apply greedy selection.
- Step 9:
- Select the solution xi based on pi and generate the new solutions for the quick onlookers by Equation (8).
- Step 10:
- For an abandoned source, if it exists, and replaces it with a new solution using Equation (9).
- Step 11:
- Memorize the best solution achieved so far.
- Step 12:
- Cycle = cycle + 1
- Step 13:
- Until cycle = Maximum Cycle Number (MCN)
Therefore, the way to get the best generalization results for financial time series datasets set on prediction task is to apply the proposed QGGABC algorithm with enough of a number of cycles, input, and hidden nodes that can achieve the best food source position or solutions (i.e., network weights) corresponding to the best testing set performances. Also, discovering and selecting the best area and solution within the suitable size of colony can have a big effect on the simulation results. The proper selection of these parameters values can increase the effectiveness of the proposed method during training and testing phases as well.
5. Experimental Evaluation and Analysis
In this research, financial time series dataset of SSM was used for one-step-ahead prediction of the year 2015 and 2016. The financial time series are stationary which can be used in the original form for prediction tasks. Here, the SMM parameter named price, which is the average of open, low, high and closing price, will be used for prediction of the next value versus time. The financial time series datasets chosen for prediction purposes are Saudi Telecom Company (STC), Al Rajhi Bank, Zain mobile communication company, Saudi Arabian Projects Company (SAPCO), and Almarai Company. The details of the dataset are given in Table 1 as:
FFNN used with different hidden and input nodes with single output node of SSM price. The network setting for all data types of different bio-inspired learning algorithms are detailed in Table 2.
To evaluate the performance of the proposed QGGABC algorithm, results compare ABC, Gbest Guided ABC (GGABC), and QABC algorithms by Mean Square Error (MSE), Standard Deviation of MSE, Normalized Mean Square Error (NMSE), success rate, and accuracy.
The stopping criterion for the above-mentioned algorithm is 2000 MCN. The best average simulation results using all learning algorithms for SSM price prediction are given from Table 3, Table 4, Table 5, Table 6 and Table 7 and Figure 3, Figure 4, Figure 5, Figure 6, Figure 7 and Figure 8, respectively. In Table 3, the MSEs for training data set are presented by using proposed QGGABC and typical GGABC, ABC, and QABC algorithms. From the simulation results on all SSM price dataset, the QGGABC obtained minimum MSE during training phase except on Al Rajhi price. The QABC had less error than all above-mentioned algorithms. The typical algorithm QABC outperformed ABC and GGABC algorithms on all datasets in terms of MSE training as it is given in Table 3.
In terms of MSE testing, the ABC reached 1.10 × 10⁻⁴, 2.01 × 10⁻⁴, 1.99 × 10⁻⁴, 1.90 × 10⁻⁵, and 7.99 × 10⁻⁵ for STC, Zain, Almarai, SAPCO, and Al Rajhi prices, respectively. The improved GGABC-FFNN, QABC-FFNN MSE testing reached 9.89 × 10⁻⁵, 1.52 × 10⁻⁵, 1.11 × 10⁻⁴, 9.30 × 10⁻⁵, 1.12 × 10⁻⁶ and 9.00 × 10⁻⁵, 9.99 × 10⁻⁶, 9.20 × 10⁻⁶, 1.00 × 10⁻⁷, 9.99 × 10⁻⁷, respectively. Thus, we conclude that the proposed QGGABC-FFNN obtained the minimum MSE for STC, Zain, Almarai, SAPCO stock prices. On the other hand, the average SNR, NMSE, accuracy, and success rates are given in Table 5, Table 6, Table 7 and Table 8, respectively. From this table, it is seen that in terms of SNR and NMSE, the best values were obtained by the proposed QGGABC for STC, Zain, Almarai, SAPCO dataset, while QABC outperformed better for Al Rajhi dataset. The GGABC and ABC obtained enough SNR and NMSE values for all dataset prices predictions. However, in term of accuracy, the proposed QGGABC got higher accuracy than other algorithms except on Al Rajhi dataset where QABC reached a high accuracy of 98.81. Through the quick and gbest guided exploitation and exploration strategies, the proposed method achieved the highest accuracy compared to QABC and GGABC algorithms. Furthermore, the average success rate of 10 runs, ABC, QABC, and QGGABC got 100% success rate for STC dataset, while QGGABC and QABC got 100% on Almarai prices prediction as given in Table 8.
Finally, it has been observed from the Table 5, Table 6, Table 7 and Table 8 that the proposed QGGABC offered better results than the conventional learning method for most of the financial time series signals using the MSE, NMSE, Accuracy, success rate, and the SNR measures. This clearly indicates that the FFNN structure trained by the QGGABC algorithm have provided the network with memory and hence better prediction with improvement in terms of the SNR, Accuracy, and Error.
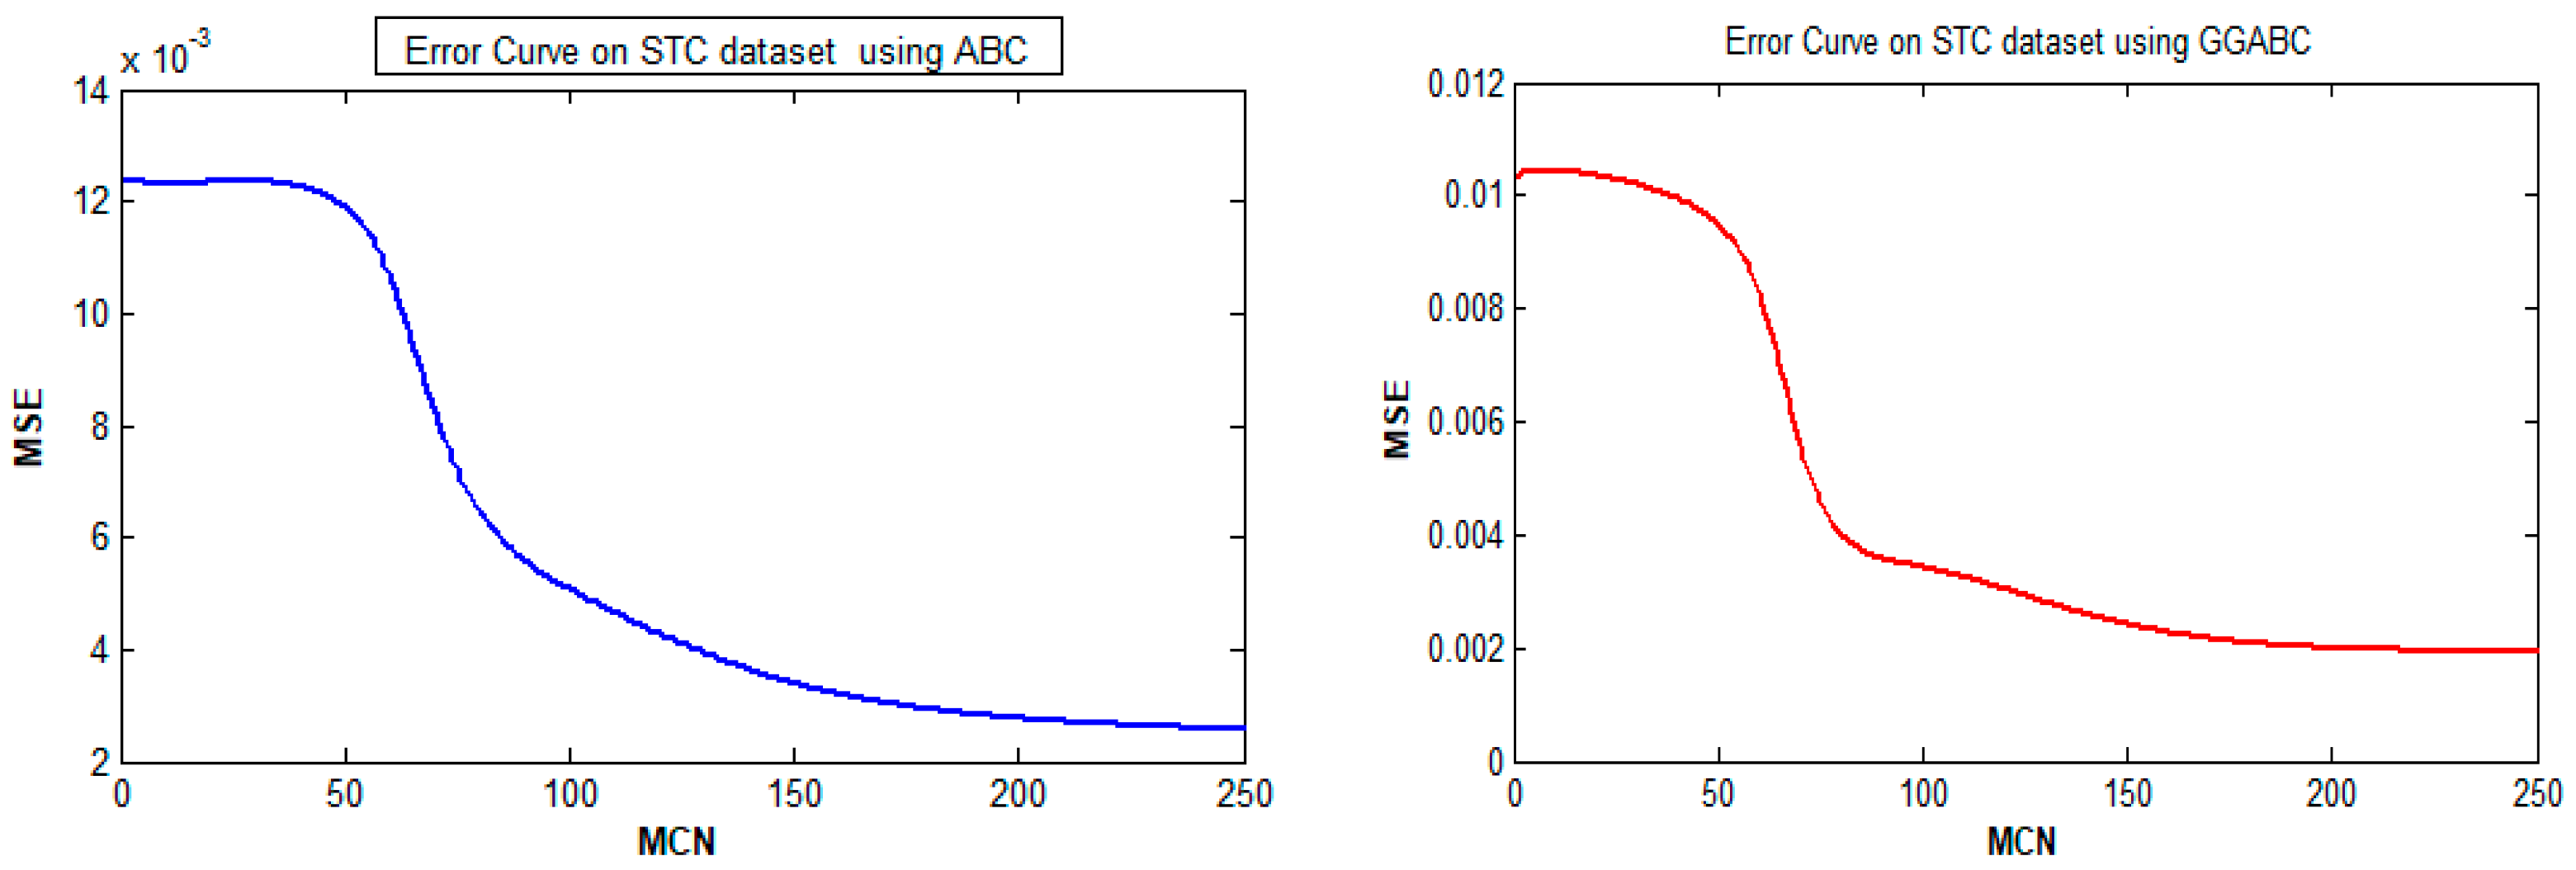
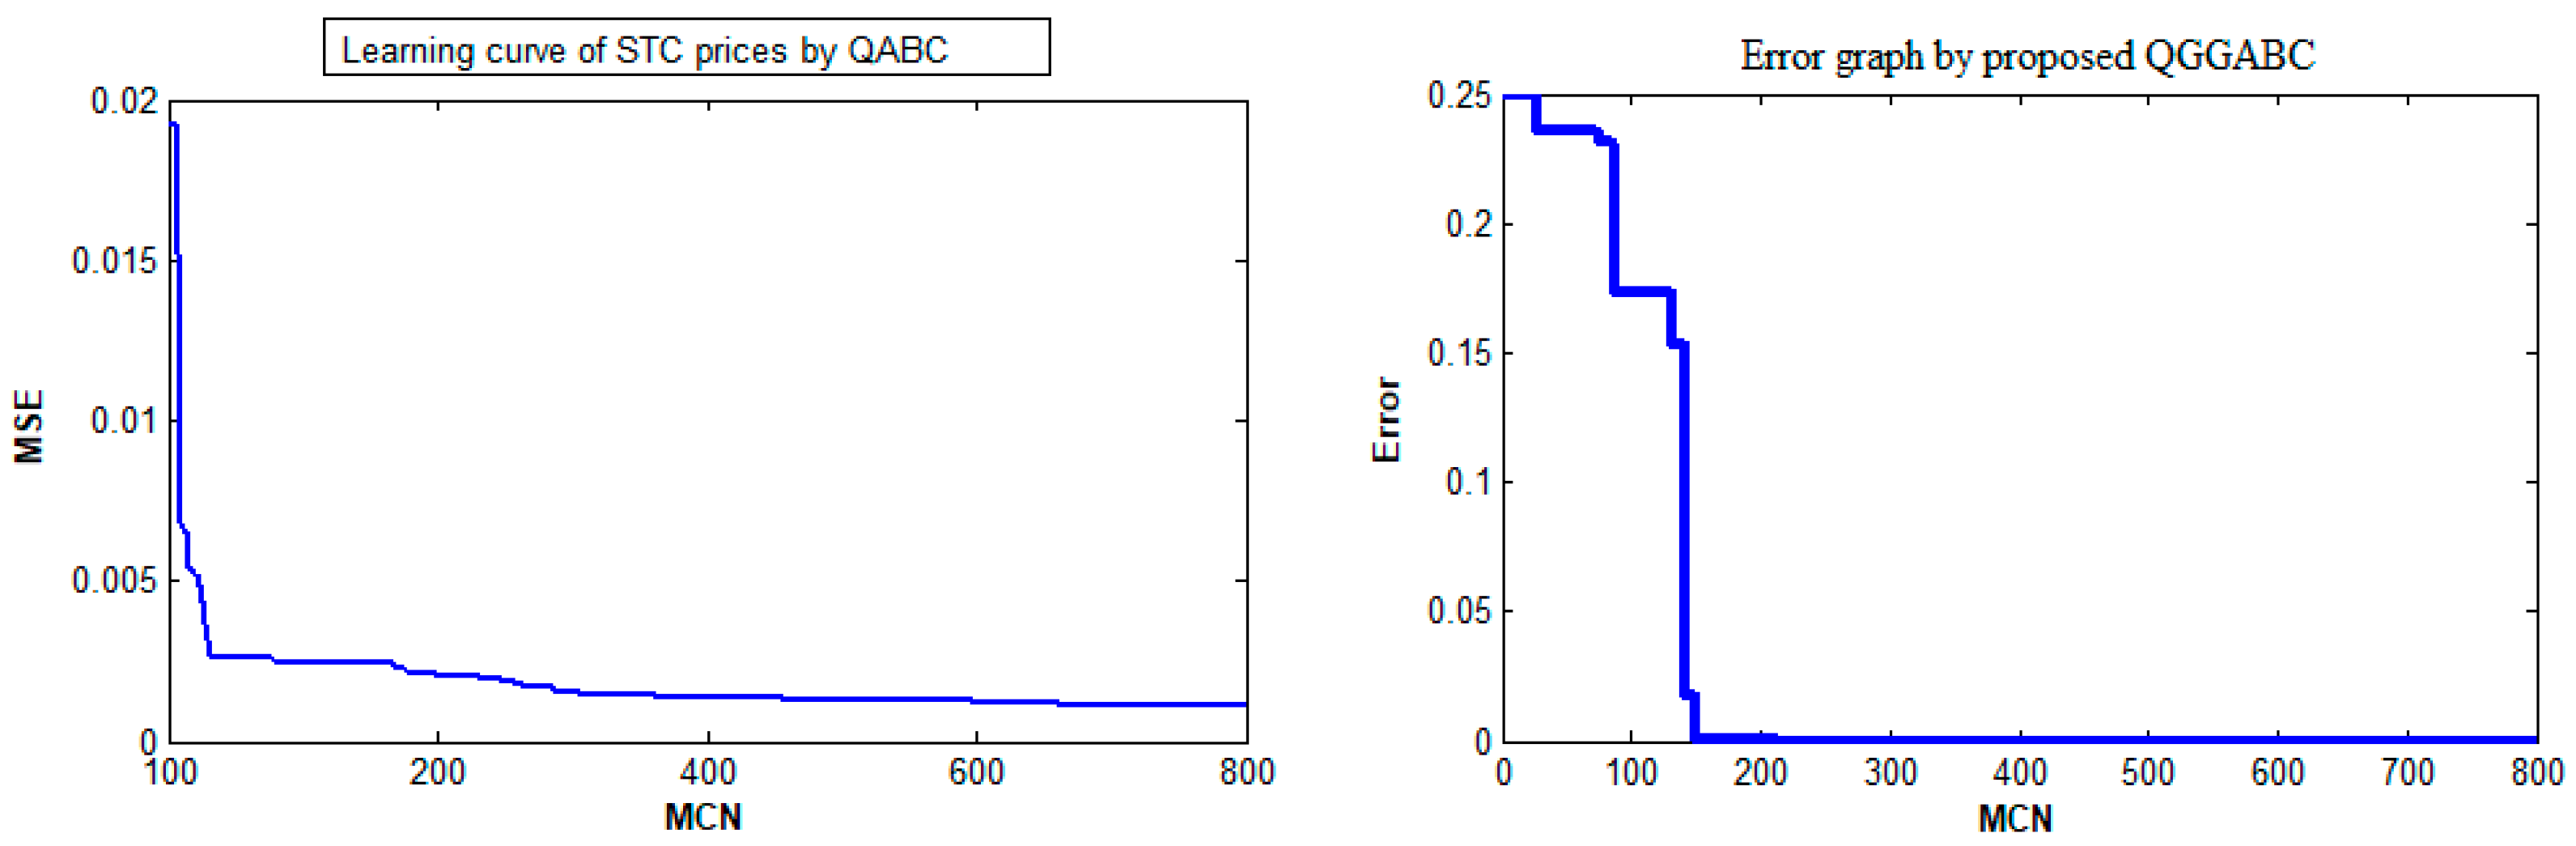
Using the above learning techniques adjusts the weights of each connection in order to reduce the training error for the SSM prediction task. After repeating this process for a sufficiently large number of training cycles, the network will usually converge to some state where the error of the calculations is small with high prediction performance. In this case, one says that the network has learned a particular target function. The QGGABC converged faster than others during the training phase for STC price prediction as shown in Figure 4. The ABC, GGABC, and QABC did not converge quickly on STC price datasets for the prediction task.
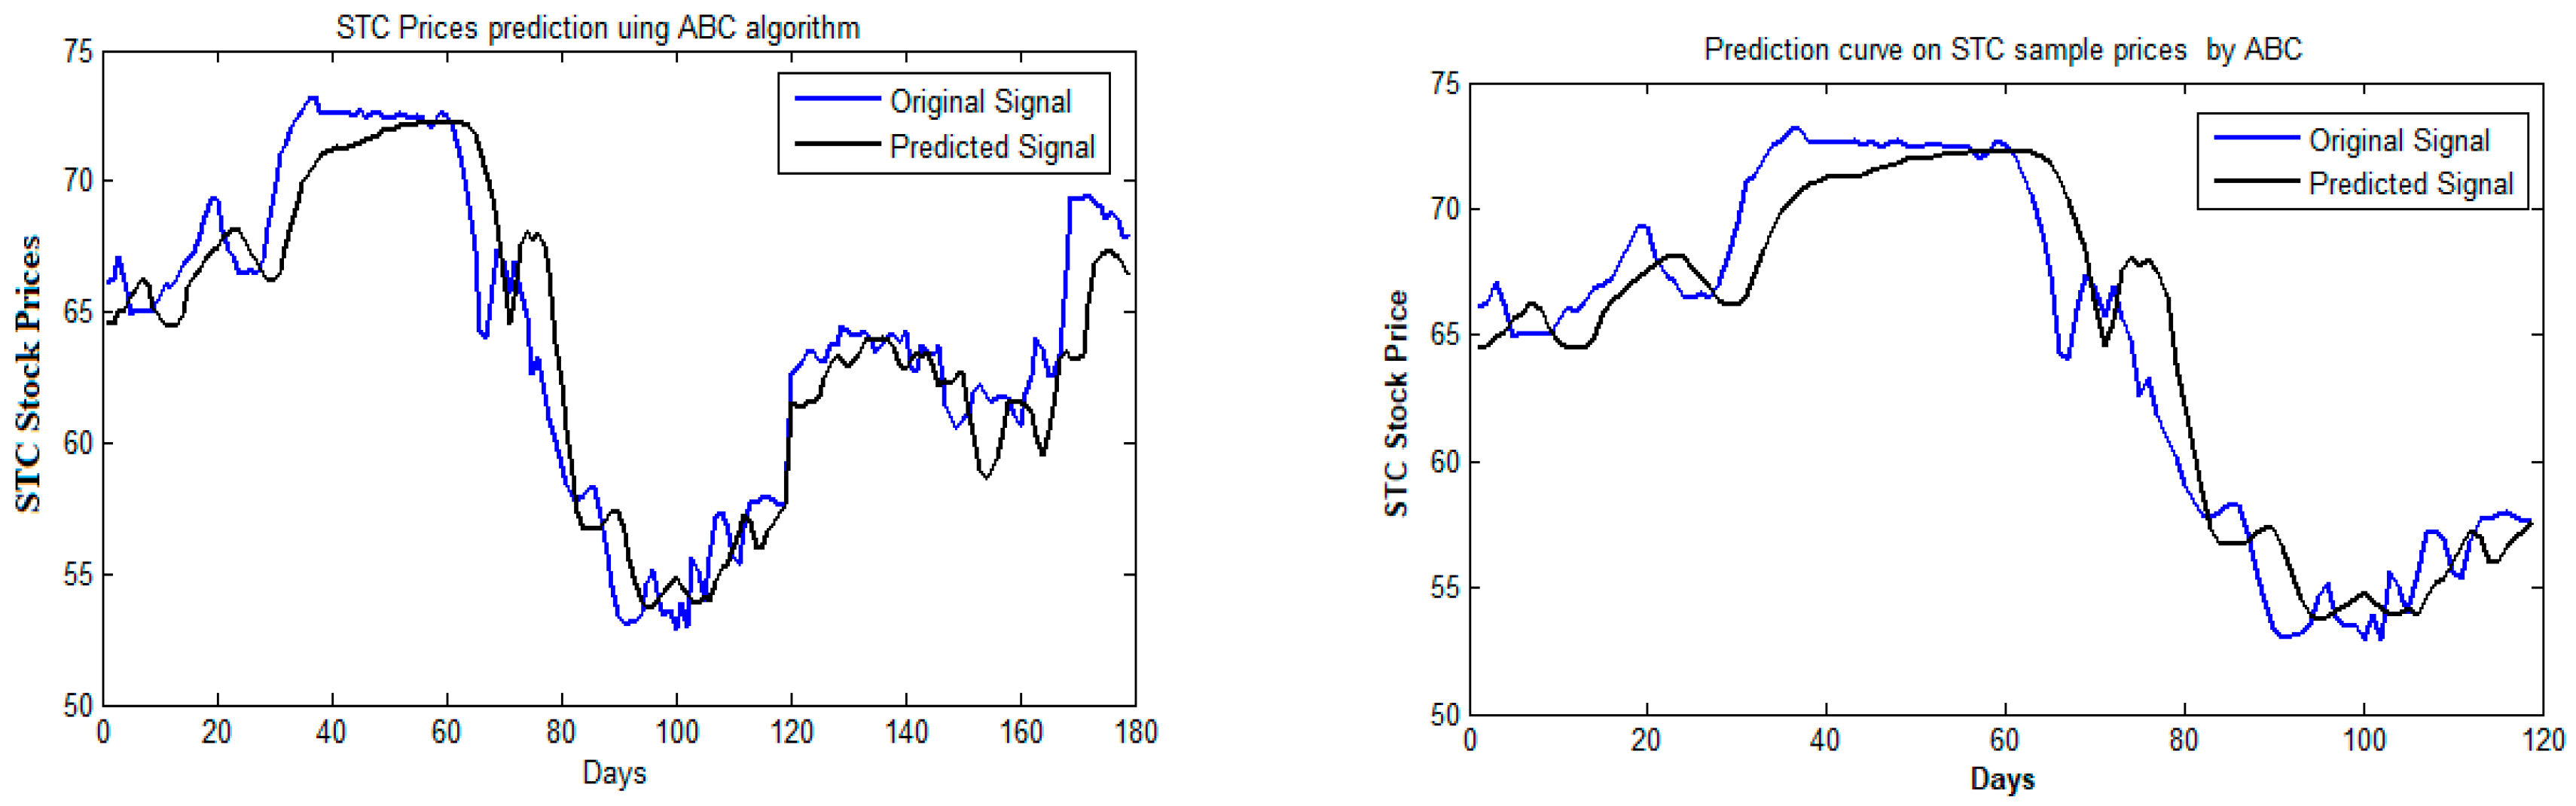
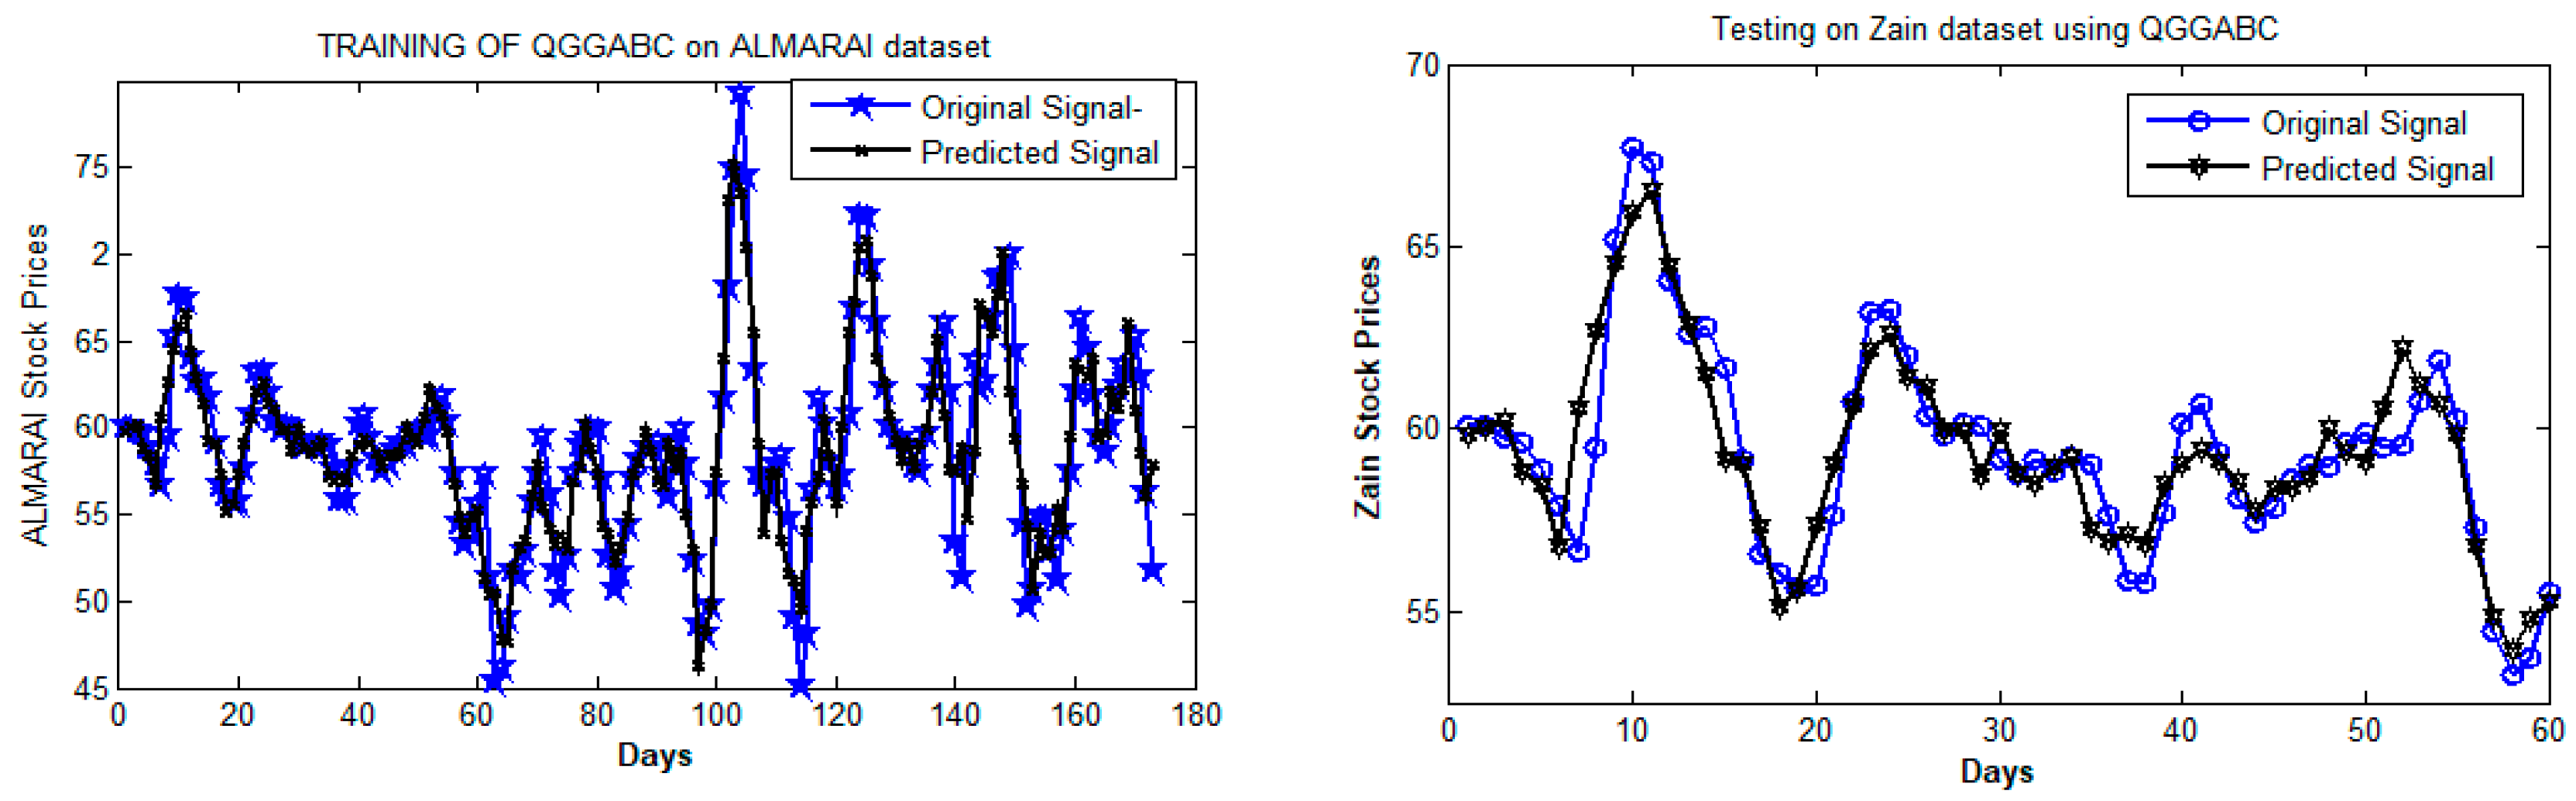
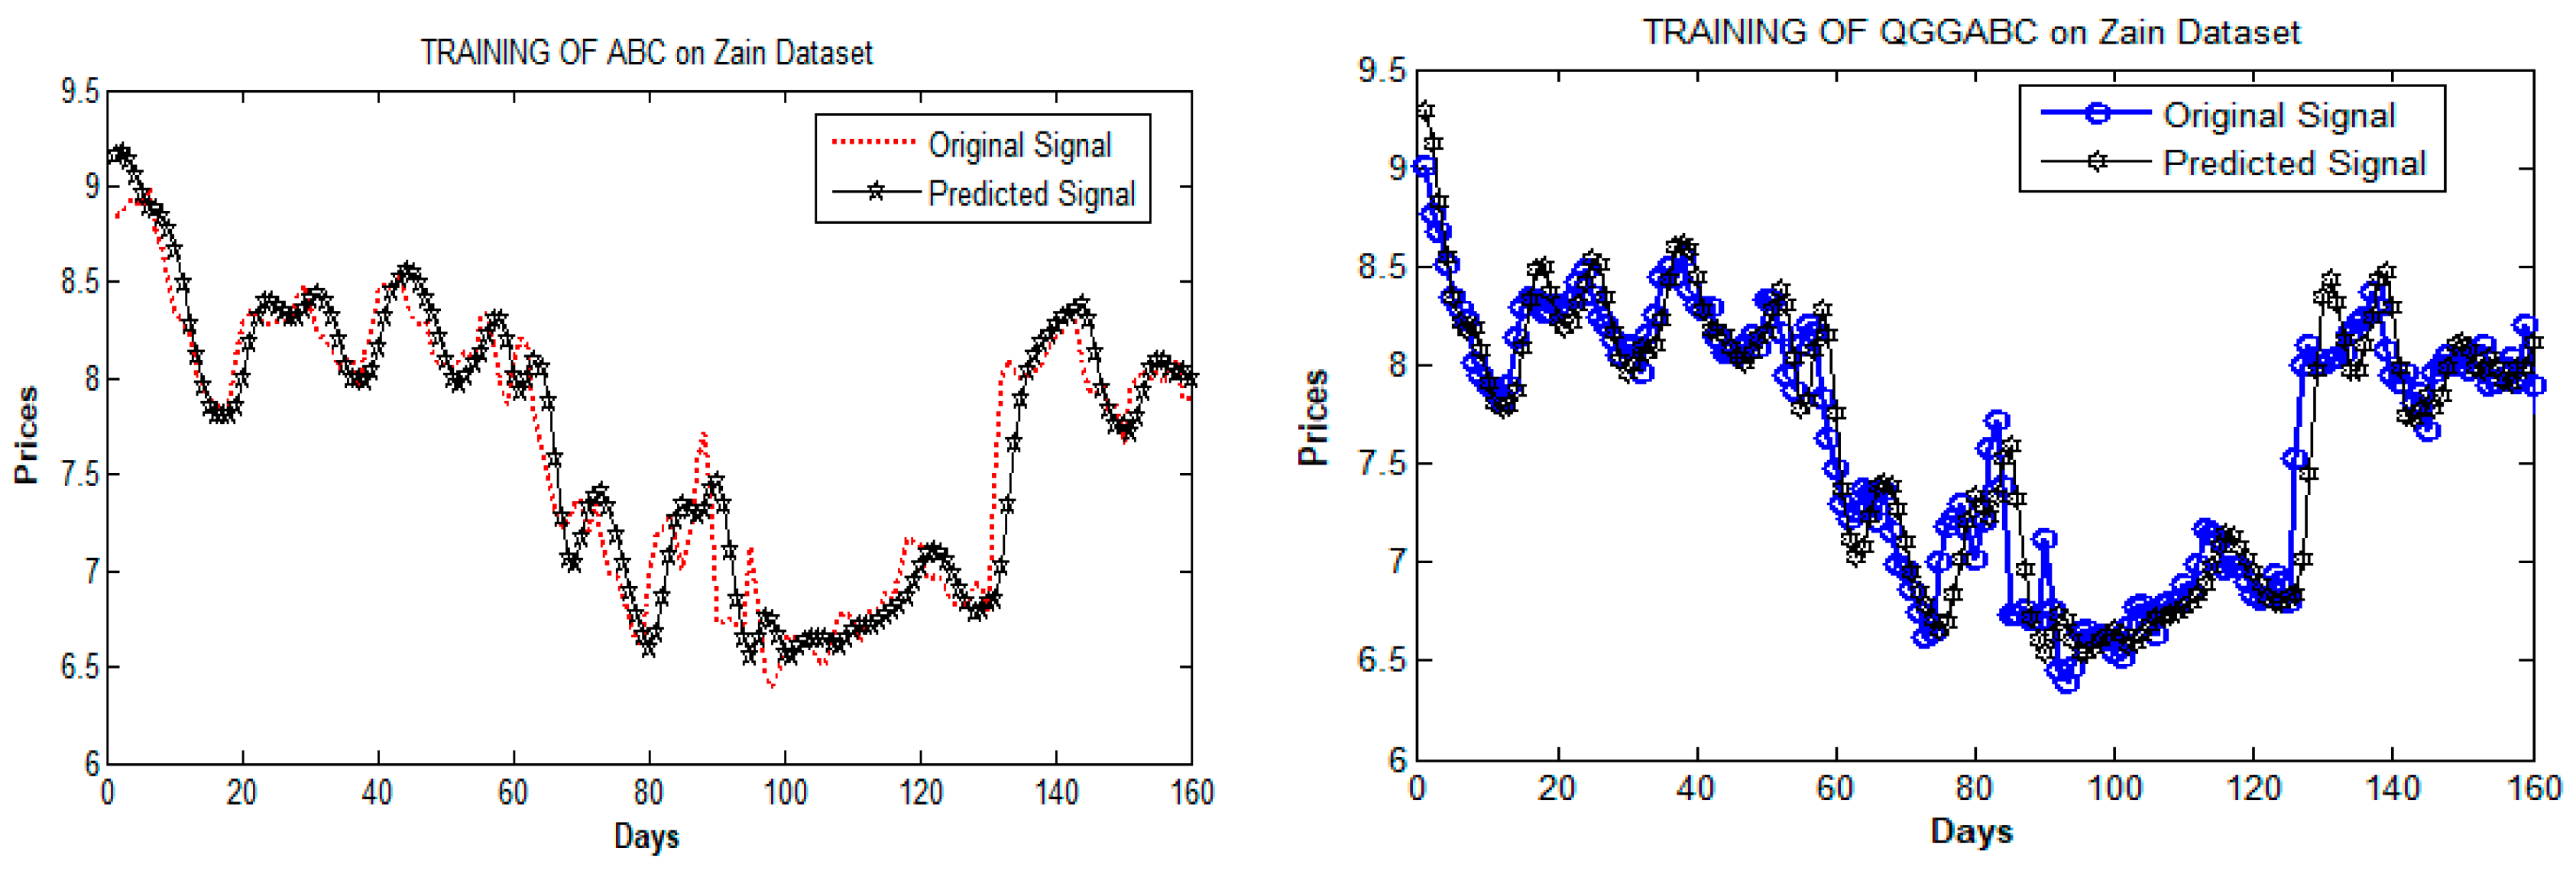
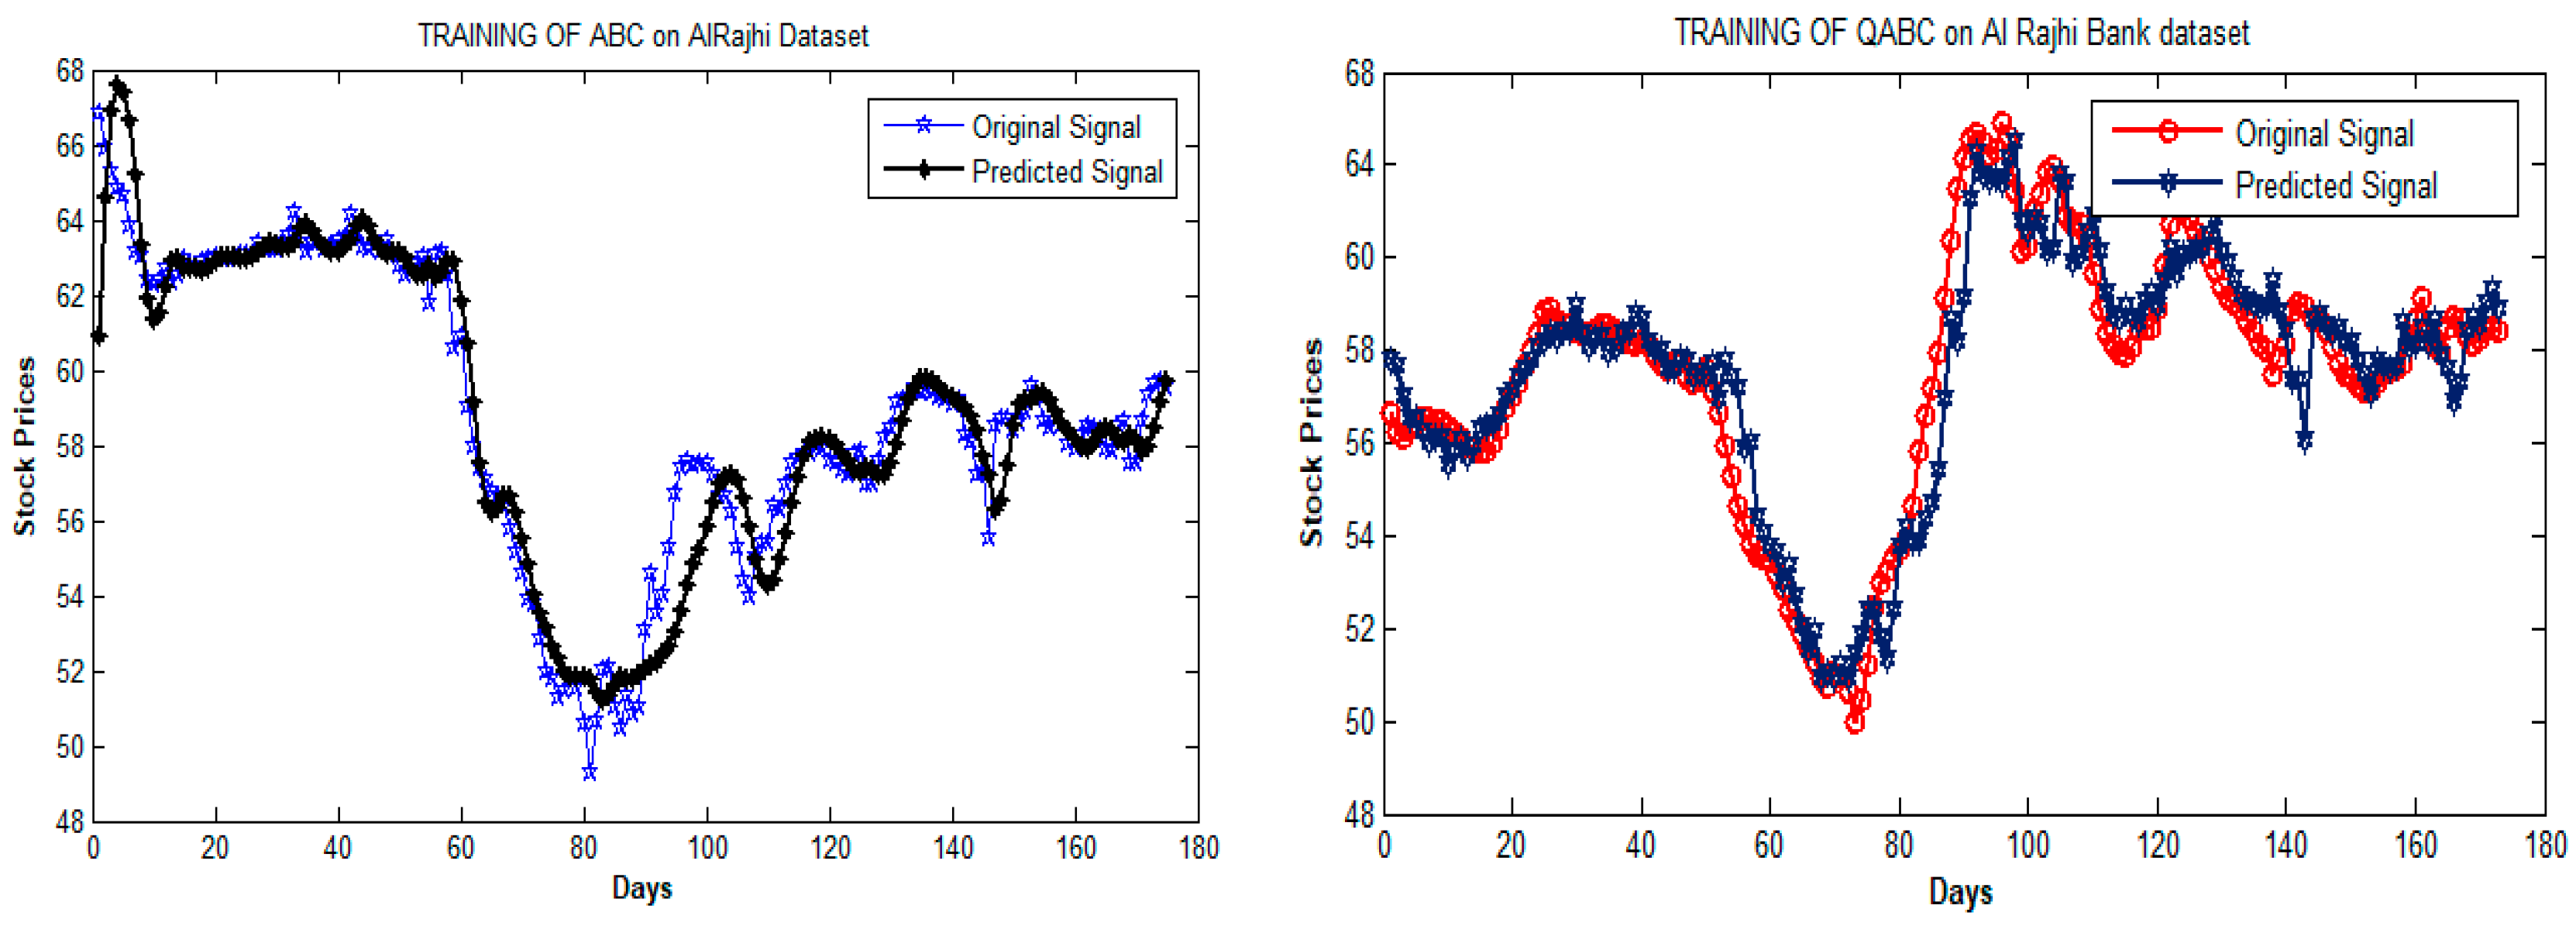
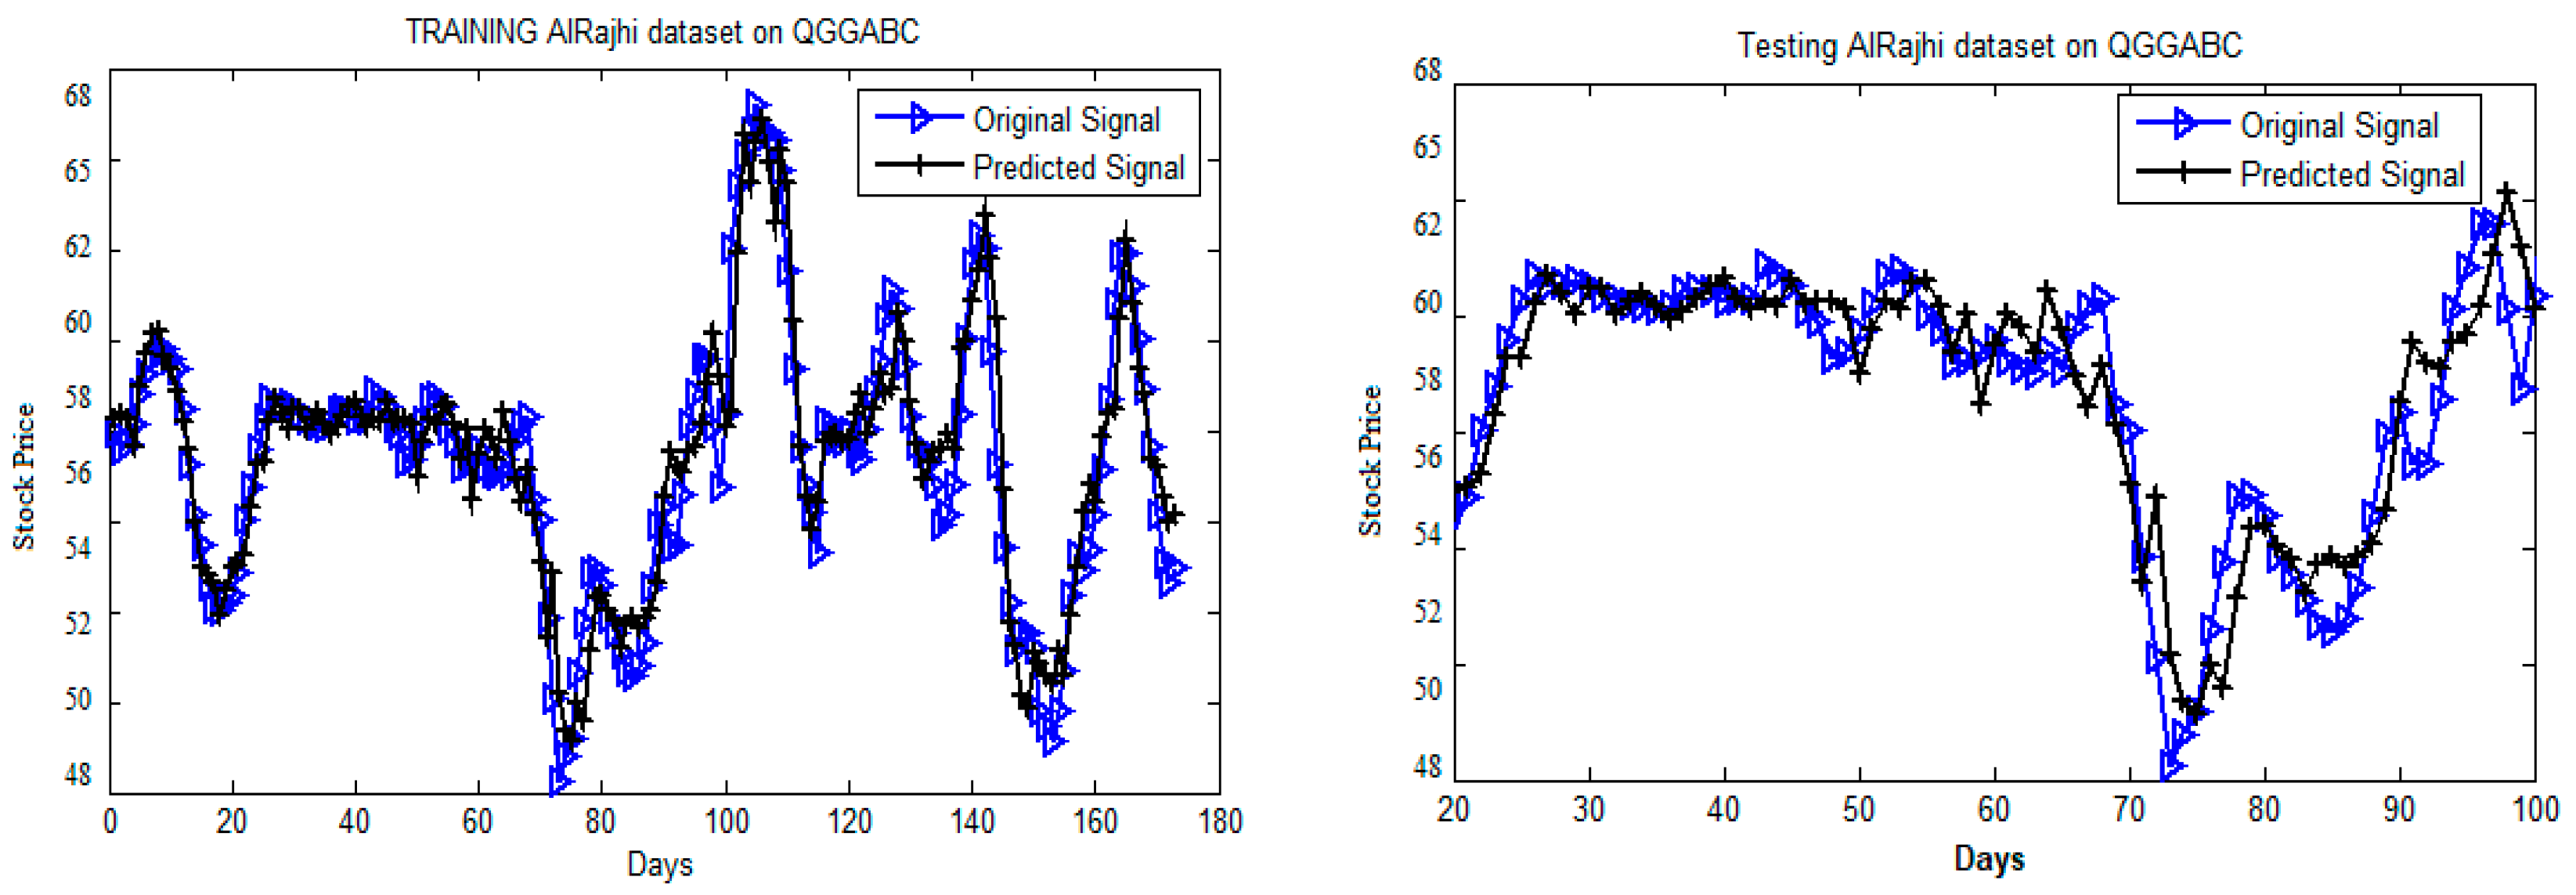
To ensure the capability of the proposed and standard learning algorithms, the predicted data and actual data were compared to see the performance of the algorithms. Figure 4, Figure 5, Figure 6, Figure 7 and Figure 8 show the prediction for STC, Almarai, Zain, and Al Rajhi prices time series. The ABC, GGABC, and QABC did not succeed to predict the future prices of STC, Almarai, Zain, and Al Rajhi accurately, while the proposed QGGABC obtained the efficient and close prediction level for all these datasets through different ANN structures, as shown in Figure 6, Figure 7 and Figure 9.
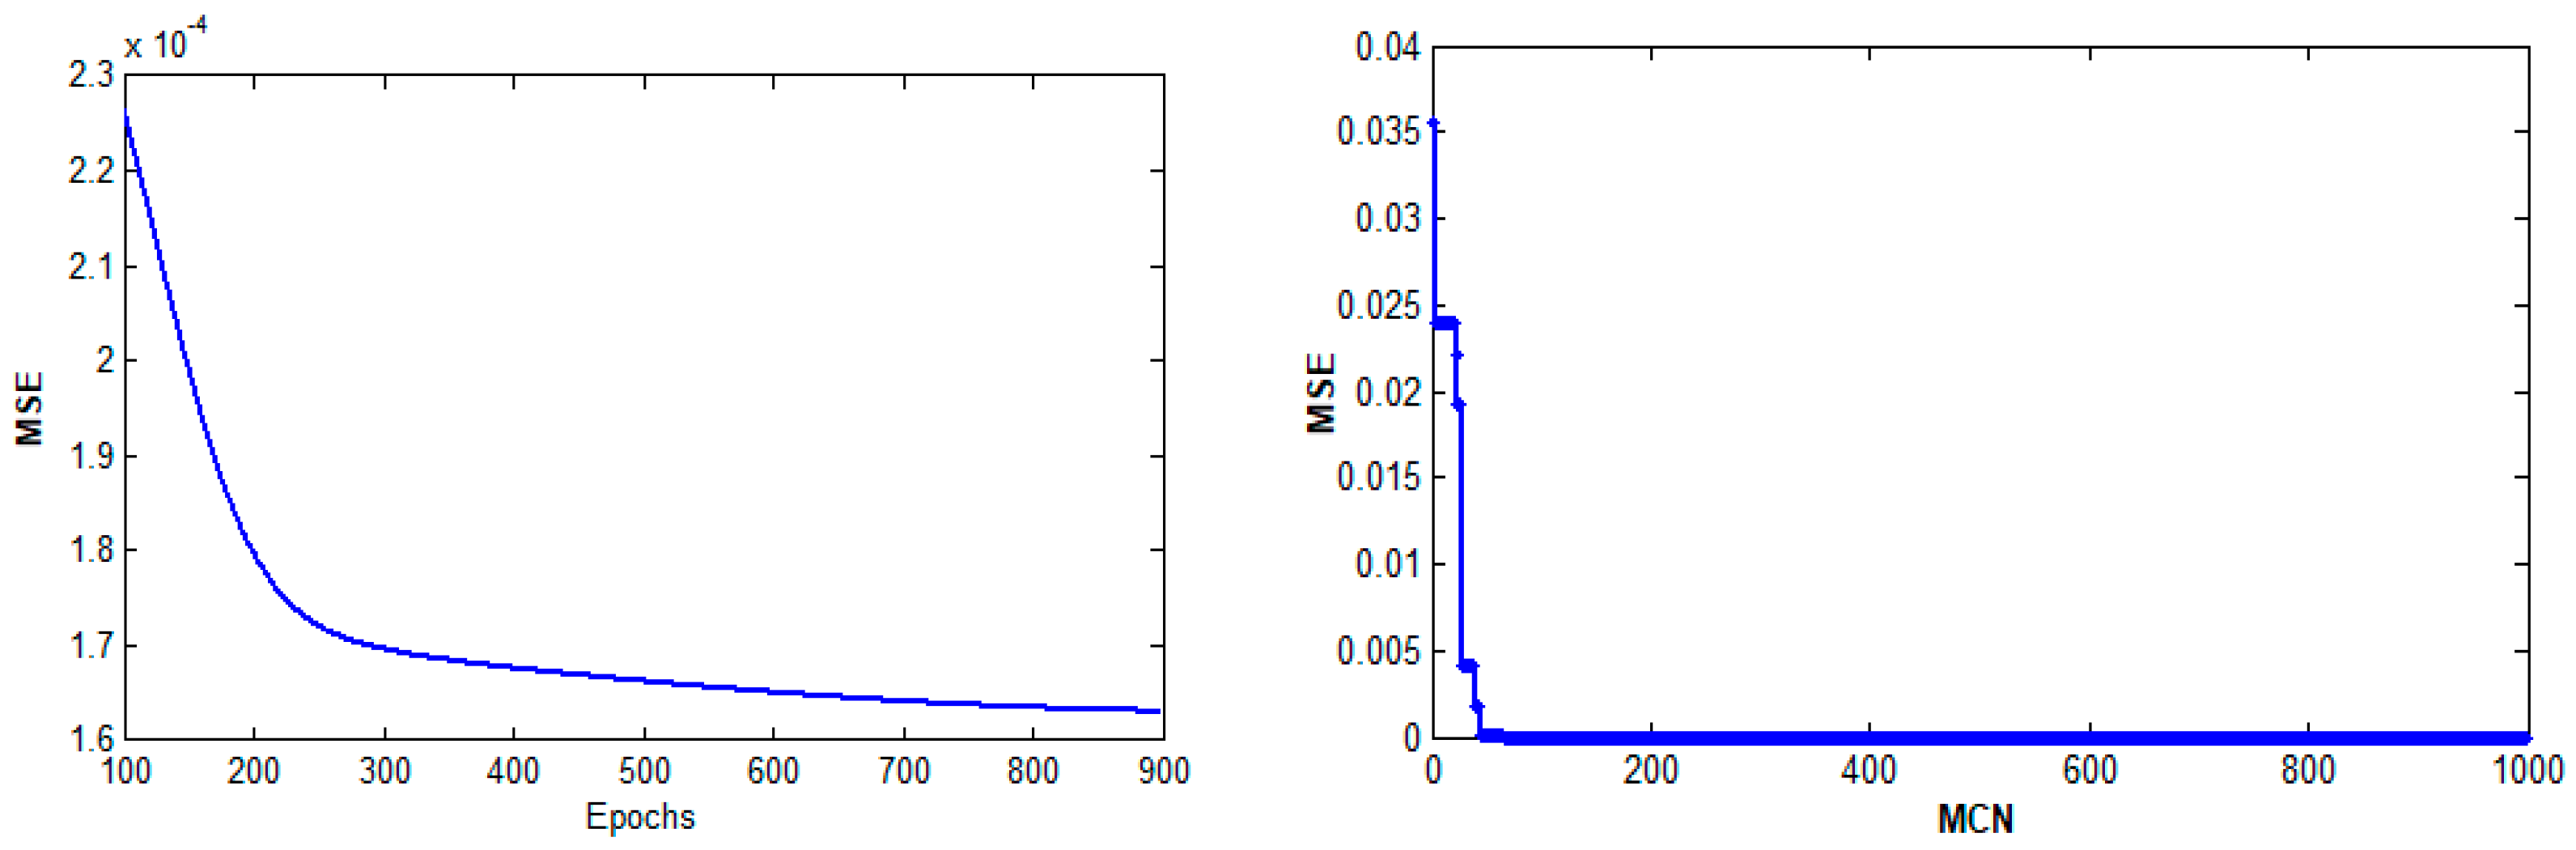
Figure 3 and Figure 4 shows the learning curves where the network trained for STC prices prediction by a conventional and proposed method with the various numbers of control and learning parameters. In terms of convergence, the QGGABC quickly converged based on the optimal weight values of FFNN when compared with other algorithms on STC dataset as shown in Figure 4 and Figure 11. Figure 5, Figure 6, Figure 7, Figure 8 and Figure 9 show the original and predicted signals for STC, Almarai, Zain, and Al Rajhi using the FFNN for stationary data using one-step-ahead prediction.
Figure 7, Figure 8 and Figure 10 present the effect of the parameters quick and gbest-guided on Zain and Al Rajhi future values prediction, respectively. From the above tables values and figures, the performance of the proposed QGGABC algorithm successfully reached minimum training and testing prediction error, fast convergence, high success rate, high accuracy and maximum SNR values on STC, Zain, SAPCO, and Almarai stock prices. Based on the above simulation results (Figure 7, Figure 8, Figure 10 and Figure 11), the proposed QGGABC algorithm has the capability to predict accurate future SSM prices.
On learning phase of QGGABC algorithm converged quickly (around 70 cycles), while QABC failed to converge quickly on Al Rajhi prices, as shown in Figure 11 below.
The proposed method has successfully reached the global optima in the quickest best manner and sufficient exploring and exploiting processes. The trained network obtained the best food sources/weight values for the prediction task. Overall, the performance of the QGGABC algorithm is higher than conventional bio-inspired methods such as ABC, QABC, and QGGABC in time series dataset prediction.
6. Conclusions
The objective of this paper is to present a new hybrid algorithm to train and test the ANN for stock exchange market values prediction by using the ABC technique. Under it, we develop a Quick Gbest Guided ABC learning algorithm to train a feedforward neural network (QGGABC-FFNN) model for the prediction of the trends in the stock markets. The presented approach has been verified and tested to predict the accurate trend of Saudi Stock Market (SSM) values. In the proposed process, the effective amount of exploitation and exploration strategies are increased through gbest guided bee and quick bee strategy. From the presented study, it is observed that the performance of the proposed success is high with fast convergence, high success rate, high accuracy, and maximum SNR values as compared to the other existing algorithms. Based on these computed results and analysis, the investors or analyst can easily understand how the market would behave if the SSM price varied at different times and in different environments as well. Thus, by observing their behavior, system analysts may choose future prediction well in time with high accuracy in order to save money, risk, and time. In the future, the proposed algorithm can be extended to the different applications with the different datasets for various tasks [34,35,36]. Also, some multi-objective optimization problems may be solved in the future with the presented algorithm or its variants [37,38,39].
Author Contributions
Conceptualization, H.S., N.T. and R.G.; Methodology, H.S., N.T. and H.G.; Validation and Investigation, H.S. and N.T.; Writing-Original Draft Preparation, H.S., N.T. and R.G.; Writing-Review & Editing, H.G.; Funding Acquisition, H.S., N.T. and R.G.
Funding
The authors would like to thank King Khalid University of Saudi Arabia for supporting this research under the grant number R.G.P.2/7/38
Conflicts of Interest
The authors declare no conflict of interest.
References
- Krahnen, J.P.; Rieck, C.; Theissen, E. Designing an experimental stock market. In Empirical Research on the German Capital Market; Springer: Heidelberg, Germany, 1999; pp. 27–54. [Google Scholar]
- Bollen, J.; Mao, H.; Zeng, X. Twitter mood predicts the stock market. J. Comput. Sci. 2011, 2, 1–8. [Google Scholar] [CrossRef] [Green Version]
- Pesaran, M.H.; Timmermann, A. Predictability of stock returns: Robustness and economic significance. J. Financ. 1995, 50, 1201–1228. [Google Scholar] [CrossRef]
- Chauhan, B.; Bidave, U.; Gangathade, A.; Kale, S. Stock market prediction using artificial neural networks. Int. J. Innov. Res. Sci. Eng. Technol. 2014, 3, 13755–13762. [Google Scholar]
- Hagan, M.T.; Demuth, H.B.; Beale, M.H.; De Jesús, O. Neural Network Design; PWS Publisher: Boston, UK, 1996; Volume 20. [Google Scholar]
- Deb, K. Multi-Objective Optimization Using Evolutionary Algorithms; John Wiley and Sons: Hoboken, NJ, USA, 2005. [Google Scholar]
- Rajasekaran, S.; Pai, G.V. Neural Networks, Fuzzy Logic and Genetic Algorithms: Synthesis and Applications; Prentice-Hall of India Pvt. Ltd.: Delhi, India, 2004. [Google Scholar]
- Mezura-Montes, E.; Coello Coello, C.A.; Velázquez-Reyes, J.; Muñoz-Dávila, L. Multiple trial vectors in differential evolution for engineering design. Eng. Optim. 2007, 39, 567–589. [Google Scholar] [CrossRef]
- Mahdavi, M.; Fesanghary, M.; Damangir, E. An improved harmony search algorithm for solving optimization problems. Appl. Math. Comput. 2007, 188, 1567–1579. [Google Scholar] [CrossRef]
- Homaifar, A.; Qi, C.X.; Lai, S.H. Constrained optimization via genetic algorithms. Simulation 1994, 62, 242–254. [Google Scholar] [CrossRef]
- Kennedy, J.; Eberhart, R.C. Particle swarm optimization. In Proceedings of the IEEE International Conference on Neural Network, Perth, Australia, 27 November–1 December 1995; Volume IV, pp. 1942–1948. [Google Scholar]
- Karaboga, D.; Akay, B. Artificial bee colony (ABC) algorithm on training artificial neural networks. In Proceedings of the 2007 IEEE 15th Signal Processing and Communications Applications (SIU 2007), Eskisehir, Turkey, 11–13 June 2007; pp. 1–4. [Google Scholar]
- Karaboga, D.; Basturk, B. Artificial bee colony (ABC) optimization algorithm for solving constrained optimization problems. In Proceedings of the 12th International Fuzzy Systems Association World Congress on Foundations of Fuzzy Logic and Soft Computing (IFSA ’07), Cancun, Mexico, 18–21 June 2007; Springer: Berlin, Germany, 2007; pp. 789–798. [Google Scholar]
- Garg, H. A Hybrid GA-GSA Algorithm for Optimizing the Performance of an Industrial System by Utilizing Uncertain Data. In Handbook of Research on Artificial Intelligence Techniques and Algorithms; IGI Global: Hershey, PA, USA, 2015; pp. 620–654. [Google Scholar]
- Garg, H. A hybrid PSO-GA algorithm for constrained optimization problems. App. Math. Comput. 2016, 274, 292–305. [Google Scholar] [CrossRef]
- Garg, H. Solving structural engineering design optimization problems using an artificial bee colony algorithm. J. Ind. Manag. Optim. 2014, 10, 777–794. [Google Scholar] [CrossRef]
- Abdual-Salam, M.E.; Abdul-Kader, H.M.; Abdel-Wahed, W.F. Comparative study between differential evolution and particle swarm optimization algorithms in training of feed-forward neural network for stock price prediction. In Proceedings of the 2010 7th International Conference on the Informatics and Systems (INFOS), Cairo, Egypt, 28–30 March 2010; pp. 1–8. [Google Scholar]
- Karaboga, D.; Gorkemli, B. A quick artificial bee colony (QABC) algorithm and its performance on optimization problems. Appl. Soft Comput. 2014, 23, 227–238. [Google Scholar] [CrossRef]
- Shah, H.; Ghazali, R.; Herawan, T.; Khan, N.; Khan, M.S. Hybrid guided artificial bee colony algorithm for earthquake time series data prediction. In International Multi Topic Conference; Springer: Cham, Switzerland, 2013; pp. 204–215. [Google Scholar]
- Shah, H.; Ghazali, R.; Nawi, N.M.; Deris, M.M. Global hybrid ant bee colony algorithm for training artificial neural networks. In International Conference on Computational Science and Its Applications; Springer: Berlin, Germany, 2012; pp. 87–100. [Google Scholar]
- Hadavandi, E.; Shavandi, H.H.; Ghanbari, A. Integration of genetic fuzzy systems and artificial neural networks for stock price forecasting. Knowl.-Based Syst. 2010, 23, 800–808. [Google Scholar] [CrossRef]
- Olatunji, S.O.; Al-Ahmadi, M.S.; Elshafei, M.; Fallatah, Y.A. Saudi Arabia stock prices forecasting using artificial neural networks. In Proceedings of the Fourth 2011 International Conference on the Applications of Digital Information and Web Technologies (ICADIWT), Stevens Point, WI, USA, 4–6 August 2011; pp. 81–86. [Google Scholar]
- Qian, B.; Rasheed, K. Stock market prediction with multiple classifiers. Appl. Intell. 2007, 26, 25–33. [Google Scholar] [CrossRef]
- Zhu, G.; Kwong, S. Gbest-guided artificial bee colony algorithm for numerical function optimization. Appl. Math. Comput. 2010, 217, 3166–3173. [Google Scholar] [CrossRef]
- Cheng, C.H.; Su, C.H.; Chen, T.L.; Chiang, H.H. Forecasting stock market based on price trend and variation pattern. In Asian Conference on Intelligent Information and Database Systems; Springer: Berlin, Germany, 2010; pp. 455–464. [Google Scholar]
- Canepa, A.; Ibnrubbian, A. Does faith move stock markets? Evidence from Saudi Arabia. Q. Rev. Econ. Financ. 2014, 54, 538–550. [Google Scholar] [CrossRef] [Green Version]
- Fadlalla, A.; Amani, F. Predicting next trading day closing price of qatar exchange index using technical indicators and artificial neural networks. Intell. Syst. Account. Financ. Manag. 2014, 21, 209–223. [Google Scholar] [CrossRef]
- Tsai, C.F.; Hsiao, Y.C. Combining multiple feature selection methods for stock prediction: Union, intersection, and multi-intersection approaches. Decis. Support Syst. 2010, 50, 258–269. [Google Scholar] [CrossRef]
- Rosenblatt, F. The perceptron: A probabilistic model for information storage and organization in the brain. Psychol. Rev. 1958, 65, 386. [Google Scholar] [CrossRef] [PubMed]
- Specht, D.F. Probabilistic neural networks. Neural Netw. 1990, 3, 109–118. [Google Scholar] [CrossRef]
- Freisleben, B. Stock Market Prediction with Backpropagation Networks; Springer: Berlin, Germany, 1992; pp. 451–460. [Google Scholar]
- Shah, H.; Ghazali, R.; Herawan, T.; Rahman, S.U.; Khan, N. Swarm based-artificial neural system for human health data classification. In Applied Computing in Medicine and Health; Elsevier: Amsterdam, The Netherlands, 2016; pp. 287–309. [Google Scholar]
- Karaboga, D. An Idea Based on Honey Bee Swarm for Numerical Optimization; Technical report, TR06; Computer Engineering Department, Engineering Faculty, Erciyes University: Melikgazi, Kayseri, Turkey, 2005. [Google Scholar]
- Garg, H. An efficient biogeography based optimization algorithm for solving reliability optimization problems. Swarm Evol. Comput. 2015, 24, 1–10. [Google Scholar] [CrossRef]
- Garg, H. Performance analysis of an industrial systems using soft computing based hybridized technique. J. Braz. Soc. Mech. Sci. Eng. 2017, 39, 1441–1451. [Google Scholar] [CrossRef]
- Garg, H.; Rani, M.; Sharma, S.P. An approach for analyzing the reliability of industrial systems using soft computing based technique. Expert Syst. Appl. 2014, 41, 489–501. [Google Scholar] [CrossRef]
- Garg, H.; Sharma, S.P. Multi-objective reliability-redundancy allocation problem using particle swarm optimization. Comput. Ind. Eng. 2013, 64, 247–255. [Google Scholar] [CrossRef]
- Rani, D.; Gulati, T.R.; Garg, H. Multi-objective non-linear programming problem in intuitionistic fuzzy environment: Optimistic and pessimistic view point. Expert Syst. Appl. 2016, 64, 228–238. [Google Scholar] [CrossRef]
- Garg, H. Multi-Objective optimization problem of system reliability under Intuitionistic fuzzy set environment using Cuckoo search algorithm. J. Intell. Fuzzy Syst. 2015, 29, 1653–1669. [Google Scholar] [CrossRef]
Figure 1.
Multilayer perceptron.

Figure 2.
Flowchart of the proposed QGGABC algorithm.

Figure 3.
Learning Curves of ABC and GGABC algorithms on STC dataset during training phase.

Figure 4.
Learning Curves of QABC and QGGABC algorithms on STC dataset during training phases.

Figure 5.
Best Prediction Curves (training and testing) of ABC algorithm on STC prices.

Figure 6.
Prediction Curves (training and testing) of ABC and GGABC algorithms on Almarai prices.

Figure 7.
Best Prediction Curves (training and testing) by QGGABC algorithm for Zain stock prices.

Figure 8.
Prediction Curves (training and testing) of ABC and QGGABC algorithms on Zain dataset.

Figure 9.
Prediction Curves of ABC and QABC algorithms on Al Rajhi prices.

Figure 10.
Prediction Curves (training and testing) of proposed QGGABC on Al Rajhi prices.

Figure 11.
Learning Curves of QABC and QGGABC algorithms on Al Rajhi prices during training.


Table 1.
SSM preprocessing time series dataset for prediction.
| SSM Dataset | Year | Total Days | Training 75% | Testing 25% |
|---|---|---|---|---|
| STC | 2015–2016 | 250 | 175 | 75 |
| Zain | 2015–2016 | 250 | 175 | 75 |
| Almarai | 2015–2016 | 250 | 175 | 75 |
| SAPCO | 2015–2016 | 250 | 175 | 75 |
| Al Rajhi | 2015–2016 | 250 | 175 | 75 |
Table 2.
Setting of FFNN topologies, algorithm parameters, and SSM parameter.
| Dataset | No of Inputs | Hidden Nodes | CS | Upper Bound | Lower Bound | MCN |
|---|---|---|---|---|---|---|
| STC | 5 | 2–7 | 40 | 5 | −5 | 2000 |
| Zain | 5 | 3–7 | 40 | 10 | −10 | 2000 |
| Almarai | 5 | 3–9 | 40 | 20 | −20 | 2000 |
| SAPCO | 5 | 3–9 | 40 | 15 | −15 | 2000 |
| Al Rajhi | 5 | 3–7 | 40 | 20 | −20 | 2000 |
Table 3.
Average MSE training for SSM price prediction.
| Data Set | NN Structure | ABC | GGABC | QABC | QGGABC |
|---|---|---|---|---|---|
| STC | 5-2-1 | 1.20 × 10⁻³ | 8.27 × 10⁻⁴ | 7.88 × 10⁻⁵ | 9.28373 × 10⁻⁷ |
| 5-3-1 | 1.10 × 10⁻³ | 8.29 × 10⁻⁴ | 2.96 × 10⁻⁵ | 8.24877 × 10⁻⁷ | |
| 5-5-1 | 1.10 × 10⁻³ | 8.50 × 10⁻⁴ | 1.06 × 10⁻⁵ | 7.10192 × 10⁻⁷ | |
| 5-7-1 | 1.07 × 10⁻³ | 7.09 × 10⁻⁴ | 1.91 × 10⁻⁶ | 1.01188 × 10⁻⁸ | |
| Zain | 5-3-1 | 1.09 × 10⁻³ | 7.00 × 10⁻³ | 1.01 × 10⁻⁵ | 1.29192 × 10⁻⁸ |
| 5-4-1 | 2.28 × 10⁻³ | 1.09 × 10⁻³ | 1.93 × 10⁻⁵ | 1.21211 × 10⁻⁸ | |
| 5-6-1 | 3.98 × 10⁻³ | 9.21 × 10⁻³ | 1.33 × 10⁻⁵ | 1.20927 × 10⁻⁸ | |
| 5-7-1 | 2.21 × 10⁻³ | 4.19 × 10⁻³ | 1.01 × 10⁻⁵ | 1.27644 × 10⁻⁸ | |
| Almarai | 5-3-1 | 1.90 × 10⁻³ | 5.95 × 10⁻³ | 1.01 × 10⁻⁶ | 1.20544 × 10⁻⁸ |
| 5-6-1 | 1.20 × 10⁻³ | 5.12 × 10⁻³ | 1.10 × 10⁻⁵ | 1.28948 × 10⁻⁸ | |
| 5-8-1 | 1.10 × 10⁻³ | 4.02 × 10⁻³ | 1.02 × 10⁻⁵ | 1.20992 × 10⁻⁸ | |
| 5-9-1 | 1.10 × 10⁻³ | 1.08 × 10⁻³ | 1.91 × 10⁻⁵ | 1.28974 × 10⁻⁹ | |
| SAPCO | 5-3-1 | 9.20 × 10⁻⁵ | 9.29 × 10⁻⁴ | 2.01 × 10⁻⁵ | 1.0924 × 10⁻⁸ |
| 5-5-1 | 8.93 × 10⁻⁵ | 1.92 × 10⁻⁴ | 1.31 × 10⁻⁵ | 1.01101 × 10⁻⁸ | |
| 5-6-1 | 1.09 × 10⁻⁴ | 9.22 × 10⁻⁴ | 1.11 × 10⁻⁵ | 1.23323 × 10⁻⁸ | |
| 5-7-1 | 9.21 × 10⁻⁴ | 2.07 × 10⁻⁵ | 2.01 × 10⁻⁵ | 1.0092 × 10⁻⁸ | |
| 5-9-1 | 2.92 × 10⁻⁵ | 5.52 × 10⁻⁴ | 1.01 × 10⁻⁸ | 1.0009 × 10⁻⁹ | |
| Al Rajhi | 5-2-1 | 6.00 × 10⁻⁴ | 5.24 × 10⁻⁴ | 2.01 × 10⁻⁵ | 9.28687 × 10⁻⁵ |
| 5-3-1 | 5.20 × 10⁻³ | 1.07 × 10⁻⁴ | 1.09 × 10⁻⁵ | 8.21217 × 10⁻⁵ | |
| 5-5-1 | 4.02 × 10⁻³ | 1.86 × 10⁻⁴ | 1.82 × 10⁻⁵ | 5.8793 × 10⁻⁵ | |
| 5-6-1 | 1.20 × 10⁻³ | 1.77 × 10⁻⁴ | 1.91 × 10⁻⁶ | 2.90333 × 10⁻⁵ | |
| 5-7-1 | 9.13 × 10⁻⁴ | 1.71 × 10⁻⁵ | 1.01 × 10⁻⁷ | 2.29997 × 10⁻⁵ |
Table 4.
Average MSE out of samples for SSM price prediction.
| Data Set | ABC | GGABC | QABC | QGGABC |
|---|---|---|---|---|
| STC | 3.20 × 10⁻⁴ | 1.83 × 10⁻⁵ | 9.99 × 10⁻⁵ | 9.99 × 10⁻⁷ |
| 3.10 × 10⁻⁴ | 9.98 × 10⁻⁴ | 9.43 × 10⁻⁵ | 8.25 × 10⁻⁷ | |
| 2.01 × 10⁻⁴ | 8.50 × 10⁻⁴ | 1.99 × 10⁻⁵ | 8.00 × 10⁻⁷ | |
| 1.10 × 10⁻⁴ | 9.89 × 10⁻⁵ | 9.99 × 10⁻⁶ | 1.00 × 10⁻⁷ | |
| Zain | 1.09 × 10⁻⁴ | 9.12 × 10⁻⁴ | 9.78 × 10⁻⁵ | 2.00 × 10⁻⁸ |
| 2.76 × 10⁻⁴ | 1.91 × 10⁻⁴ | 1.91 × 10⁻⁶ | 1.99 × 10⁻⁸ | |
| 3.12 × 10⁻⁴ | 2.92 × 10⁻⁴ | 7.99 × 10⁻⁵ | 9.01 × 10⁻⁸ | |
| 2.01 × 10⁻⁴ | 1.52 × 10⁻⁵ | 9.00 × 10⁻⁵ | 1.92 × 10⁻⁸ | |
| Almarai | 2.00 × 10⁻⁴ | 2.36 × 10⁻⁴ | 9.99 × 10⁻⁶ | 7.12 × 10⁻⁹ |
| 1.90 × 10⁻⁴ | 1.51 × 10⁻⁵ | 9.90 × 10⁻⁵ | 9.93 × 10⁻⁸ | |
| 1.99 × 10⁻⁴ | 4.02 × 10⁻³ | 1.21 × 10⁻⁶ | 9.90 × 10⁻⁸ | |
| 1.99 × 10⁻⁴ | 1.11 × 10⁻⁴ | 9.20 × 10⁻⁶ | 1.29 × 10⁻¹⁰ | |
| SAPCO | 9.22 × 10⁻⁵ | 9.29 × 10⁻⁴ | 2.99 × 10⁻⁵ | 1.45 × 10⁻⁸ |
| 8.10 × 10⁻⁶ | 2.00 × 10⁻⁴ | 7.30 × 10⁻⁵ | 1.90 × 10⁻⁸ | |
| 1.01 × 10⁻⁵ | 9.22 × 10⁻⁴ | 7.98 × 10⁻⁵ | 1.99 × 10⁻⁸ | |
| 9.22 × 10⁻⁵ | 7.21 × 10⁻⁶ | 8.90 × 10⁻⁵ | 6.79 × 10⁻⁸ | |
| 1.90 × 10⁻⁵ | 9.30 × 10⁻⁵ | 1.00 × 10⁻⁷ | 2.00 × 10⁻¹⁰ | |
| Al Rajhi | 7.01 × 10⁻⁵ | 3.45 × 10⁻⁵ | 3.00 × 10⁻⁶ | 2.00 × 10⁻⁵ |
| 8.00 × 10⁻⁵ | 9.56 × 10⁻⁵ | 1.99 × 10⁻⁶ | 9.99 × 10⁻⁵ | |
| 9.14 × 10⁻⁴ | 3.42 × 10⁻⁵ | 2.00 × 10⁻⁶ | 9.43 × 10⁻⁵ | |
| 3.99 × 10⁻⁴ | 8.97 × 10⁻⁵ | 9.12 × 10⁻⁶ | 7.90 × 10⁻⁵ | |
| 7.99 × 10⁻⁵ | 1.12 × 10⁻⁶ | 9.99 × 10⁻⁷ | 9.00 × 10⁻⁵ |
Table 5.
Average SNR on out of sample data for SSM price prediction.
| Dataset | ABC | GGABC | QABC | QGGABC |
|---|---|---|---|---|
| STC | 33.23 | 36.56 | 35.11 | 38.12 |
| Zain | 36.34 | 37.24 | 36.08 | 39.35 |
| Almarai | 36.56 | 37.28 | 38.61 | 40.14 |
| SAPCO | 35.93 | 37.19 | 38.04 | 39.93 |
| Al Rajhi | 37.34 | 37.45 | 39.11 | 37.41 |
Table 6.
Average NMSE out of samples for SSM price prediction.
| Dataset | ABC | GGABC | QABC | QGGABC |
|---|---|---|---|---|
| STC | 3.09 × 10⁻⁴ | 6.83 × 10⁻⁵ | 9.19 × 10⁻⁵ | 9.99 × 10⁻⁷ |
| 4.00 × 10⁻⁴ | 9.99 × 10⁻⁴ | 9.94 × 10⁻⁵ | 8.87 × 10⁻⁷ | |
| 6.07 × 10⁻⁴ | 9.00 × 10⁻⁴ | 7.99 × 10⁻⁵ | 8.00 × 10⁻⁷ | |
| 1.90 × 10⁻⁴ | 2.99 × 10⁻⁶ | 9.98 × 10⁻⁶ | 6.54 × 10⁻⁷ | |
| Zain | 1.59 × 10⁻⁴ | 9.20 × 10⁻⁴ | 9.89 × 10⁻⁵ | 2.00 × 10⁻⁸ |
| 2.76 × 10⁻⁴ | 9.91 × 10⁻⁴ | 7.69 × 10⁻⁶ | 1.99 × 10⁻⁸ | |
| 3.90 × 10⁻⁴ | 2.92 × 10⁻⁴ | 7.99 × 10⁻⁵ | 9.88 × 10⁻⁸ | |
| 1.20 × 10⁻⁵ | 1.98 × 10⁻⁵ | 9.89 × 10⁻⁵ | 1.98 × 10⁻⁸ | |
| Almarai | 3.00 × 10⁻⁴ | 2.98 × 10⁻⁴ | 9.21 × 10⁻⁶ | 7.12 × 10⁻⁹ |
| 1.92 × 10⁻⁴ | 1.92 × 10⁻⁵ | 1.02 × 10⁻⁶ | 9.93 × 10⁻⁸ | |
| 1.99 × 10⁻⁴ | 2.98 × 10⁻⁴ | 1.21 × 10⁻⁶ | 9.99 × 10⁻⁸ | |
| 8.00 × 10⁻⁴ | 6.11 × 10⁻⁵ | 1.23 × 10⁻⁷ | 9.98 × 10⁻¹⁰ | |
| SAPCO | 9.81 × 10⁻⁵ | 1.00 × 10⁻³ | 2.99 × 10⁻⁵ | 1.98 × 10⁻⁸ |
| 9.99 × 10⁻⁶ | 9.98 × 10⁻⁴ | 7.30 × 10⁻⁵ | 6.88 × 10⁻⁸ | |
| 8.00 × 10⁻⁵ | 9.99 × 10⁻⁴ | 7.98 × 10⁻⁵ | 1.99 × 10⁻⁸ | |
| 7.92 × 10⁻⁶ | 7.22 × 10⁻⁶ | 8.90 × 10⁻⁵ | 8.79 × 10⁻⁸ | |
| 7.99 × 10⁻⁵ | 1.93 × 10⁻⁶ | 7.83 × 10⁻⁷ | 8.98 × 10⁻¹⁰ | |
| Al Rajhi | 7.99 × 10⁻⁵ | 3.90 × 10⁻⁵ | 3.00 × 10⁻⁶ | 2.00 × 10⁻⁵ |
| 9.83 × 10⁻⁵ | 1.00 × 10⁻⁶ | 1.99 × 10⁻⁶ | 9.99 × 10⁻⁵ | |
| 9.90 × 10⁻⁴ | 3.95 × 10⁻⁵ | 2.00 × 10⁻⁶ | 9.74 × 10⁻⁵ | |
| 8.99 × 10⁻⁴ | 1.83 × 10⁻⁶ | 9.12 × 10⁻⁶ | 8.30 × 10⁻⁵ | |
| 9.10 × 10⁻⁵ | 1.80 × 10⁻⁶ | 1.10 × 10⁻⁸ | 9.00 × 10⁻⁶ |
Table 7.
Average accuracy for SSM price prediction.
| Data Set | ABC | GGABC | QABC | QGGABC |
|---|---|---|---|---|
| STC | 91.31 | 92.72 | 95.18 | 98.77 |
| Zain | 92.10 | 92.24 | 97.08 | 99.51 |
| Almarai | 91.83 | 93.81 | 96.71 | 99.01 |
| SAPCO | 93.36 | 95.78 | 96.04 | 99.78 |
| Al Rajhi | 93.21 | 94.31 | 98.81 | 97.41 |
Table 8.
Success rate of all learning algorithms for SSM price prediction.
| Data Set | ABC | GGABC | QABC | QGGABC |
|---|---|---|---|---|
| STC | 100% | 65% | 100% | 100% |
| Zain | 95% | 60% | 98% | 100% |
| Almarai | 89% | 85% | 100% | 100% |
| SAPCO | 85% | 87% | 80% | 98% |
| Al Rajhi | 80% | 69% | 100% | 100% |
© 2018 by the authors. Licensee MDPI, Basel, Switzerland. This article is an open access article distributed under the terms and conditions of the Creative Commons Attribution (CC BY) license (http://creativecommons.org/licenses/by/4.0/).
Share and Cite
MDPI and ACS Style
Shah, H.; Tairan, N.; Garg, H.; Ghazali, R. A Quick Gbest Guided Artificial Bee Colony Algorithm for Stock Market Prices Prediction. Symmetry 2018, 10, 292. https://doi.org/10.3390/sym10070292
AMA Style
Shah H, Tairan N, Garg H, Ghazali R. A Quick Gbest Guided Artificial Bee Colony Algorithm for Stock Market Prices Prediction. Symmetry. 2018; 10(7):292. https://doi.org/10.3390/sym10070292
Chicago/Turabian StyleShah, Habib, Nasser Tairan, Harish Garg, and Rozaida Ghazali. 2018. "A Quick Gbest Guided Artificial Bee Colony Algorithm for Stock Market Prices Prediction" Symmetry 10, no. 7: 292. https://doi.org/10.3390/sym10070292
Note that from the first issue of 2016, this journal uses article numbers instead of page numbers. See further details here.